Diamond Foods — Investor Presentation (February 2013)
20 slides from Diamond Foods's investor presentation, Feb 26, 2013

Slide 1: Diamond Foods: Building Sustainable Premium Brands
February 2013 Diamond Foods Building Sustainable Premium Brands Exhibit 99.1
Slide 2: Who we Are
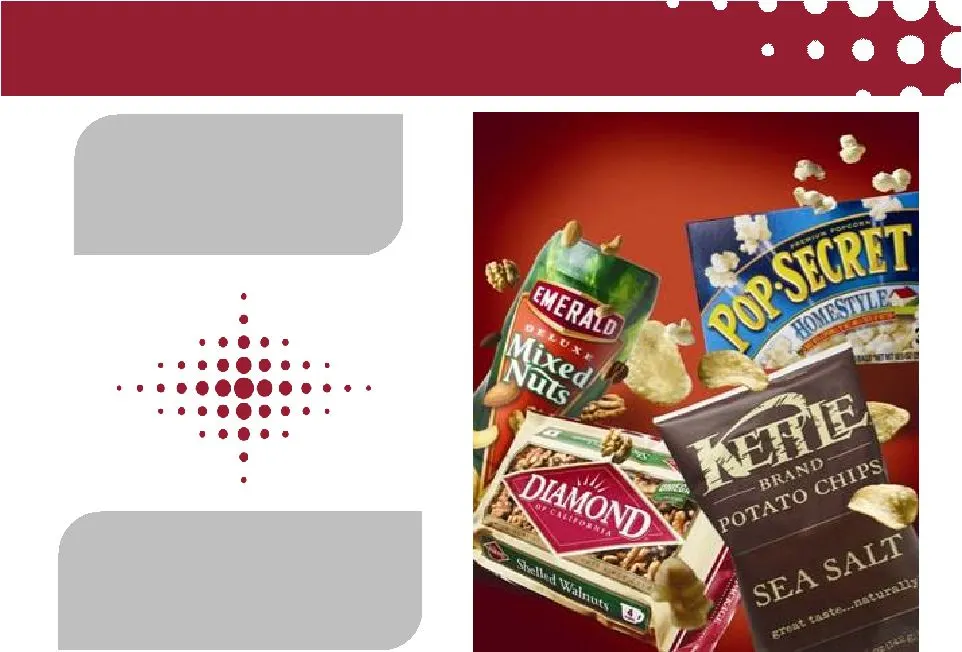
Who we Are Building a company focused on sustainable, profitable growth Diamond is an innovative packaged food company focused on building and energizing brands
Slide 3: Branded Culinary and Snack Food Company
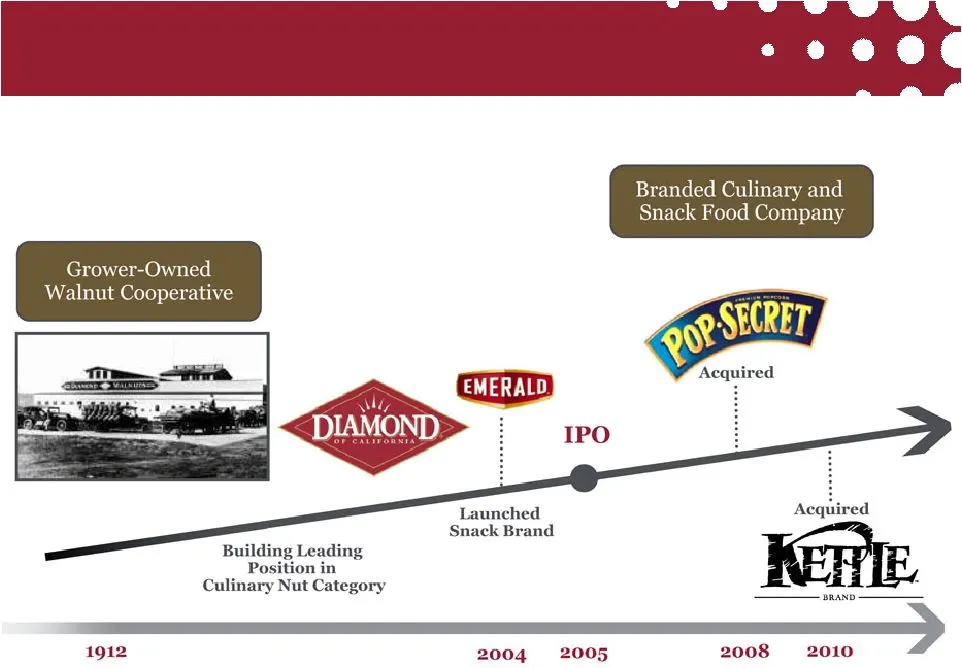
Branded Culinary and Snack Food Company Grower-Owned Walnut Cooperative Launched Snack Brand Building Leading Position in Culinary Nut Category 1912 2008 2010 5
Slide 4: Revenue Mix Has Changed Significantly Over Time
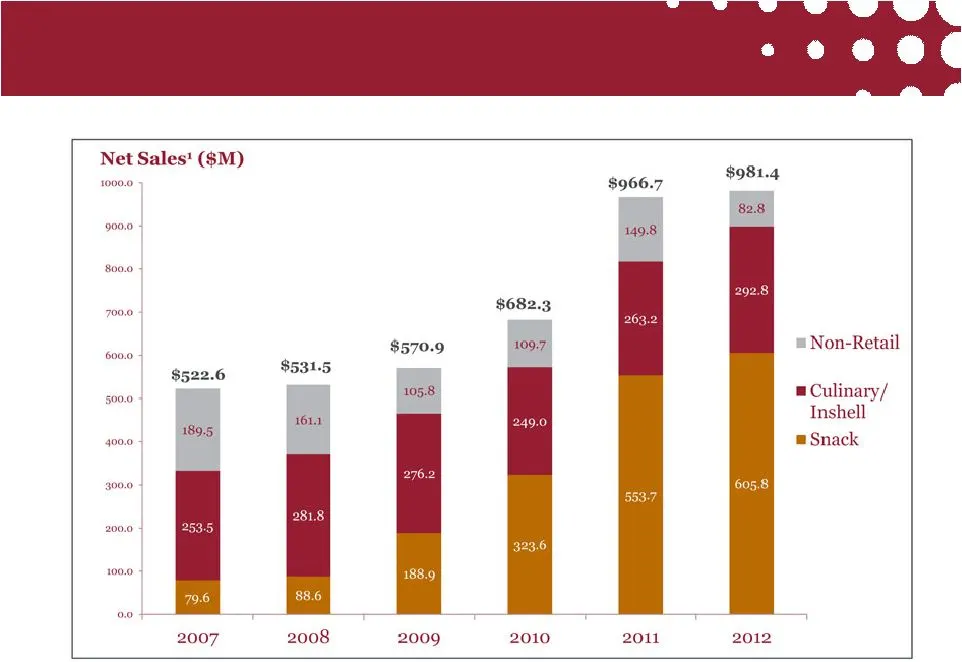
Revenue Mix Has Changed Significantly Over Time Numbers rounded
Slide 5: Brand market positions (Nielsen data)
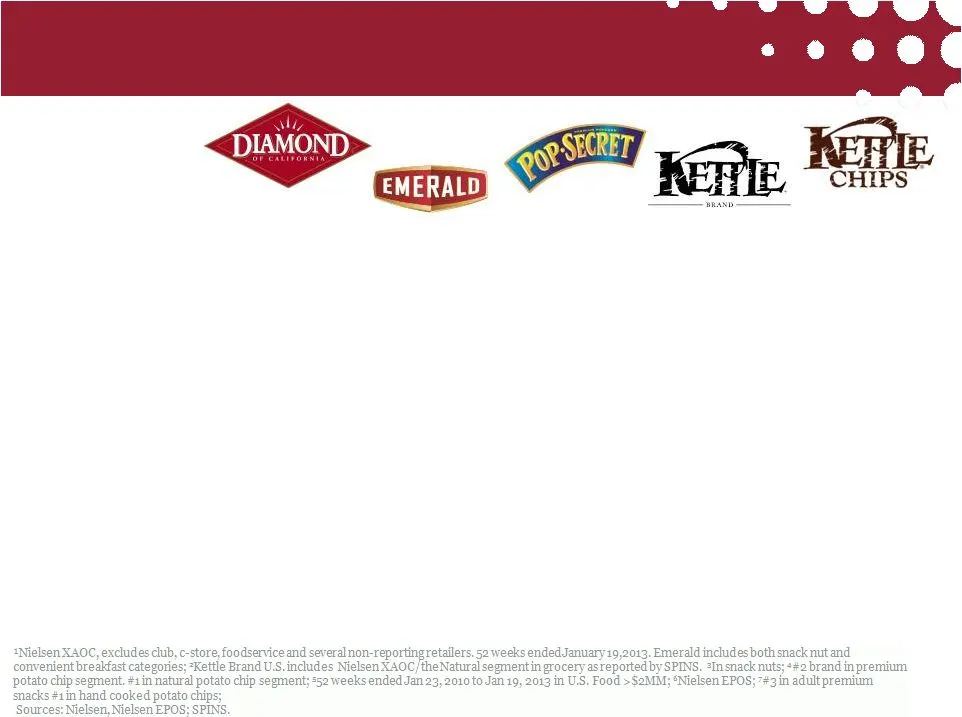
sNielsen XAOC, excludes club, c-store, foodservice and several non-reportingretailers, 52 weeks ended January 19,2013. Emerald includes both snack nut and convenient breakfast categories; Kettle Brand U.S. includes Nielsen XAOC /theNatural segment in grocery as reported by SPINS. *In snack nuts; +#2
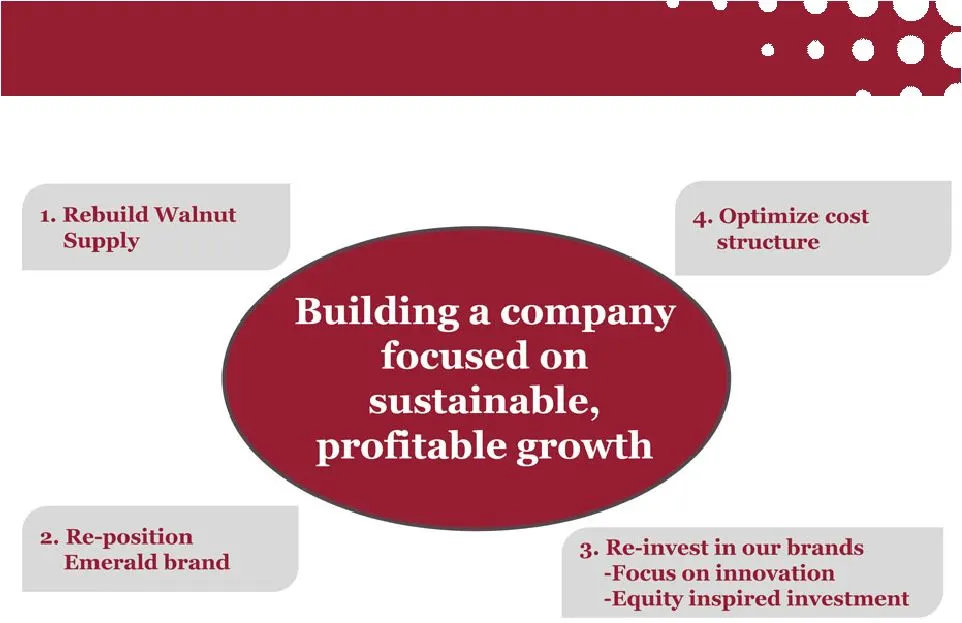
Slide 6: Diamond is Focused on Four Key Initiatives
Diamond is Focused on Four Key Initiatives
Slide 7: 1. Rebuild Walnut Supply
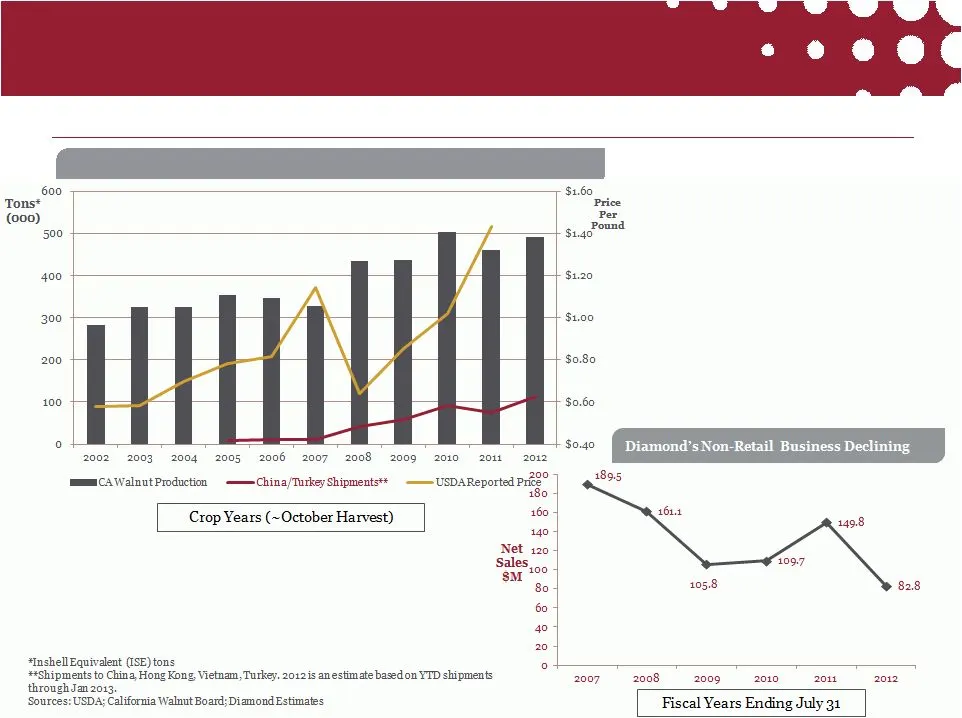
1. Rebuild Walnut Supply California Walnut Production , China/Turkey Demand and Reported Price Both Price and Supply of Walnuts Have Grown Rapidly
Slide 8: 2. Re-Position the Emerald brand
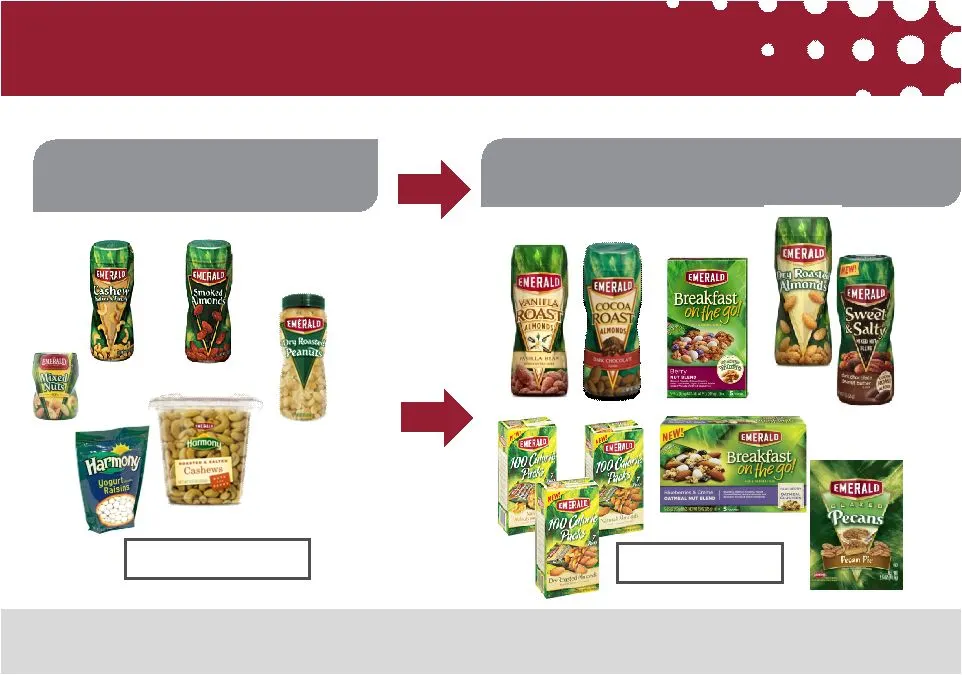
2. Re-Position the Emerald brand From: Top Line Focus To: Sustainable Growth Focus Focusing the portfolio on “insulated” items < 90 SKUs > 250 SKUs
Slide 9: Diamond: Marketing, Promotional, Innovation Spend
Md, DIAMOND DF CALIFORNIA Marketing BRAND Promotional Innovation Spend
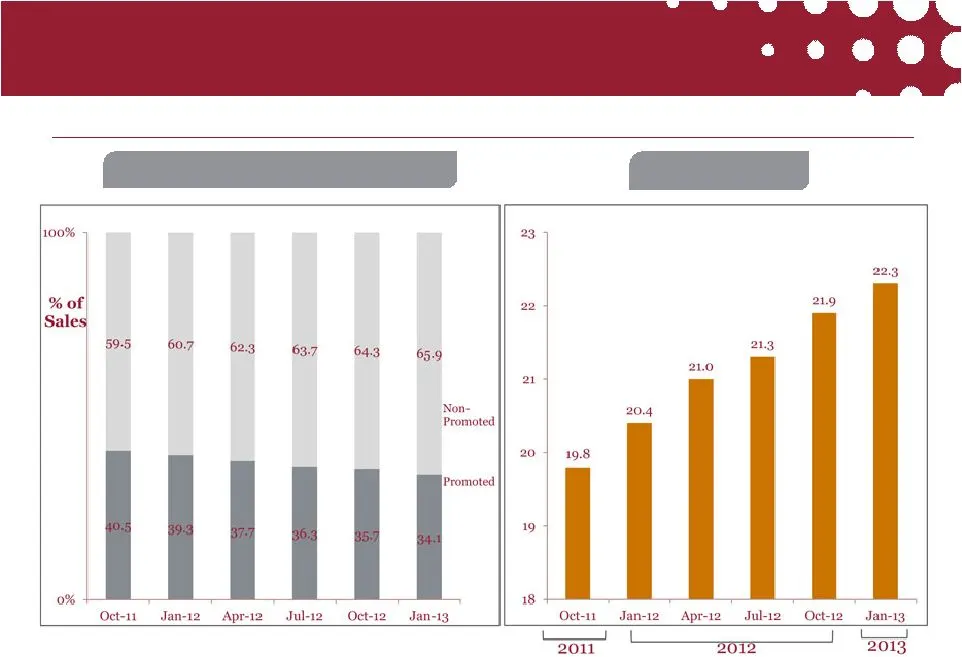
Slide 10: 3. Re-invest in our Brands: Pop Secret (I)
3. Re-invest in our Brands: Pop Secret (I) Promoted/Non-Promoted Sales* Market Share * Pop-Secret Reducing Reliance on Promotional Spend while Improving Market Share *52 Week Periods in U.S. xAOC Source: Nielsen
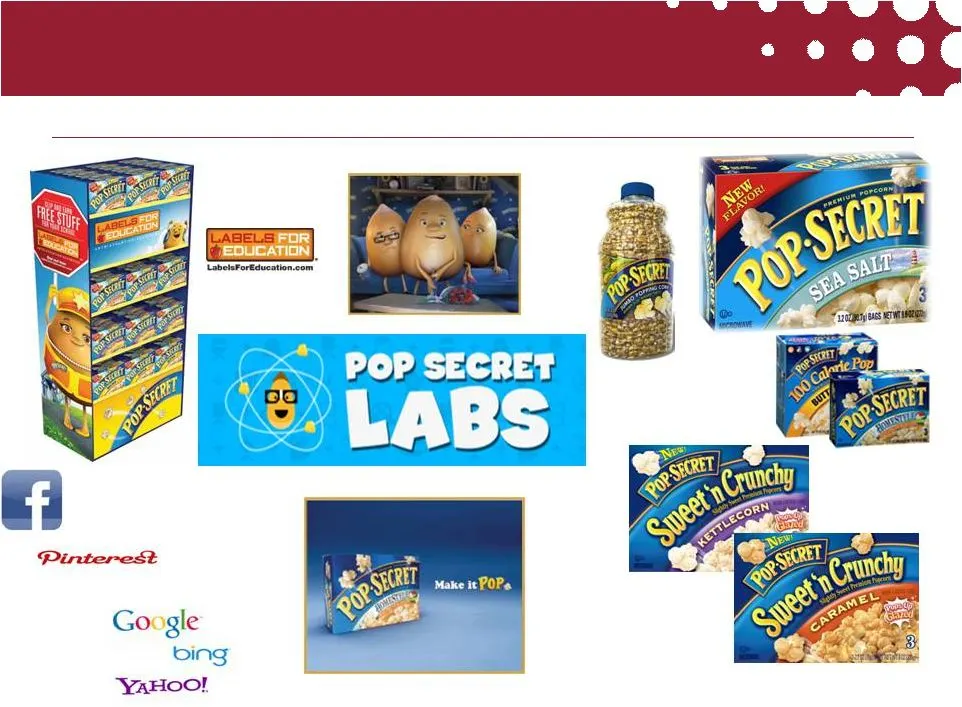
Slide 11: 3. Re-invest in our Brands: Pop Secret (II)
3. Re-invest in our Brands: Pop Secret (II) Pop-Secret Investing in Consumer Support and Innovation Search Social Digital Media
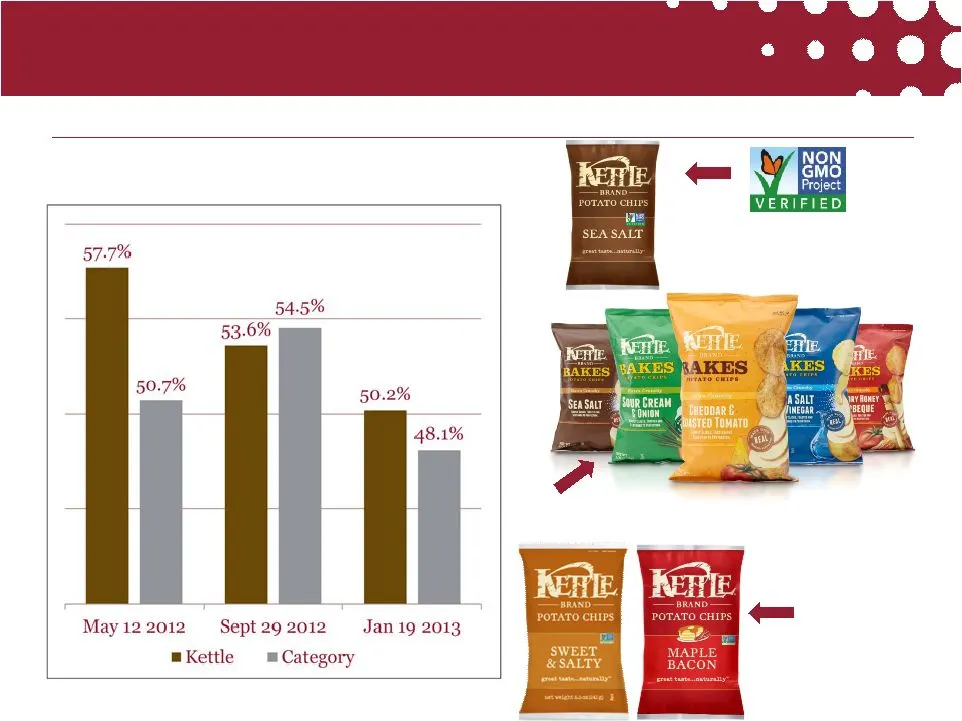
Slide 12: 3. Re-invest in our Brands: Kettle Brand
Percent of Sales Sold on Promotion* 3. Re-invest in our Brands: Kettle Brand Kettle focus more balanced between innovation and promotional spending *Premium Kettle style segment of potato chip category Source: Nielsen U.S. >$2MM, 12 week periods First Potato Chip with Non- GMO Project Verification O
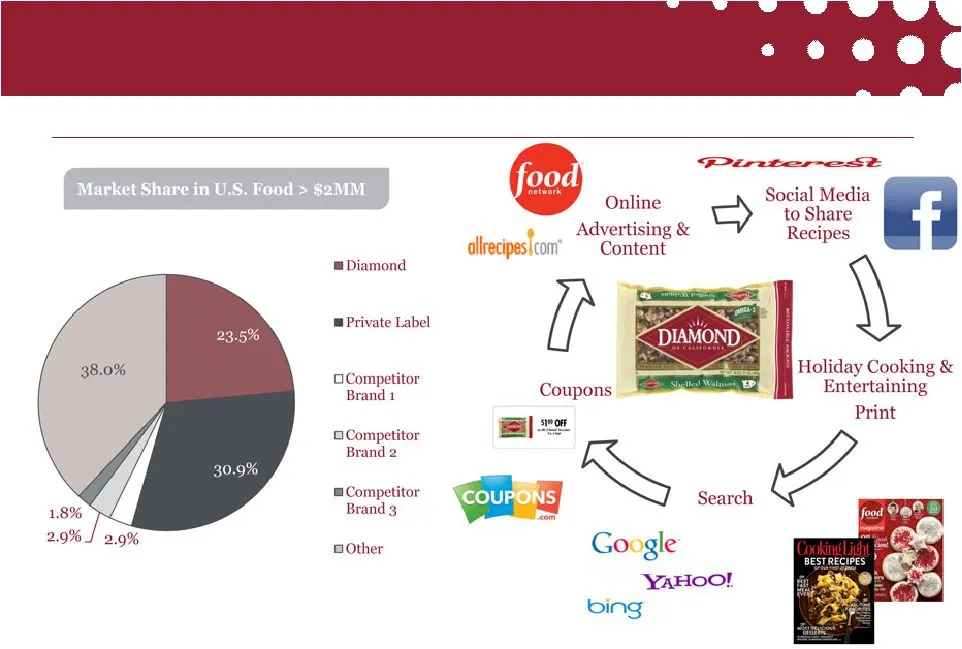
Slide 13: 3. Re-invest in our Brands: Diamond of California
3. Re-invest in our Brands: Diamond of California Source: Nielsen U.S. Food, 52 weeks ended Jan 19, 2013 Diamond, the branded leader in Culinary Nuts supported by marketing focused on foodies, bakers and cooks who value quality

Slide 14: 4. Optimize Cost Structure
4. Optimize Cost Structure Operations • Capacity rationalization • Productivity • Transportation and Warehousing • Supplier Contracts • Formulation and Packaging Optimization Sourcing SG& A Cost savings estimated to be in the range of $20-40M
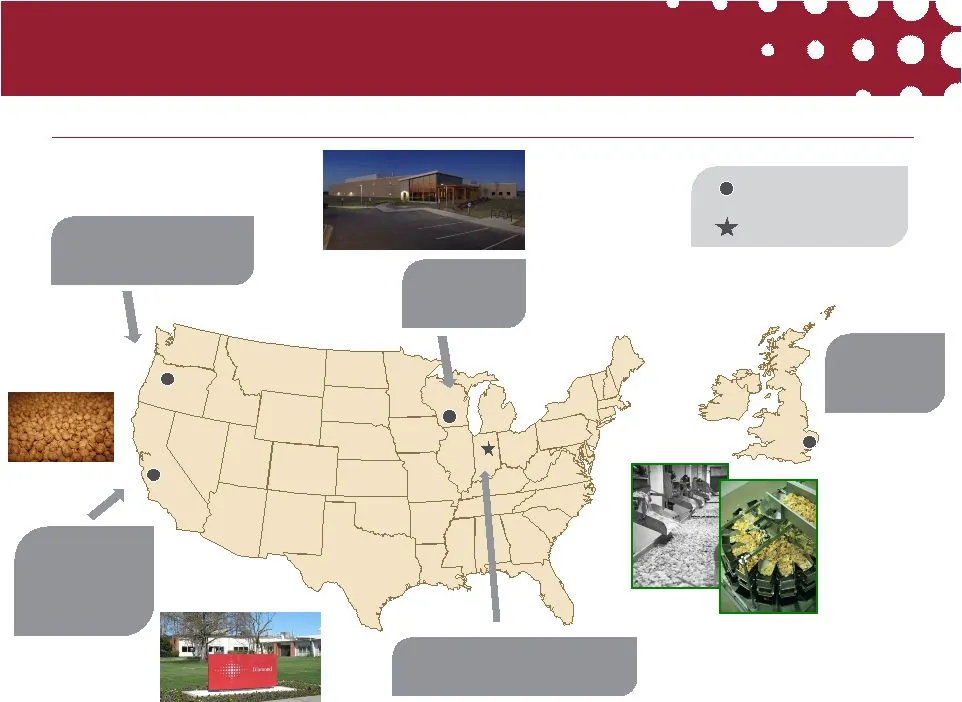
Slide 15: 4. Optimize Cost Structure: Manufacturing Footprint
4. Optimize Cost Structure Doubled capacity in 2012 Added additional 25% capacity in 2011 Consolidating all Emerald production Added packaging capacity in 2011/2012 Recently closed Fishers, IN Emerald production facility Manufacturing Footprint Beloit, WI Salem, OR Norwich, England Stockton, CA Van
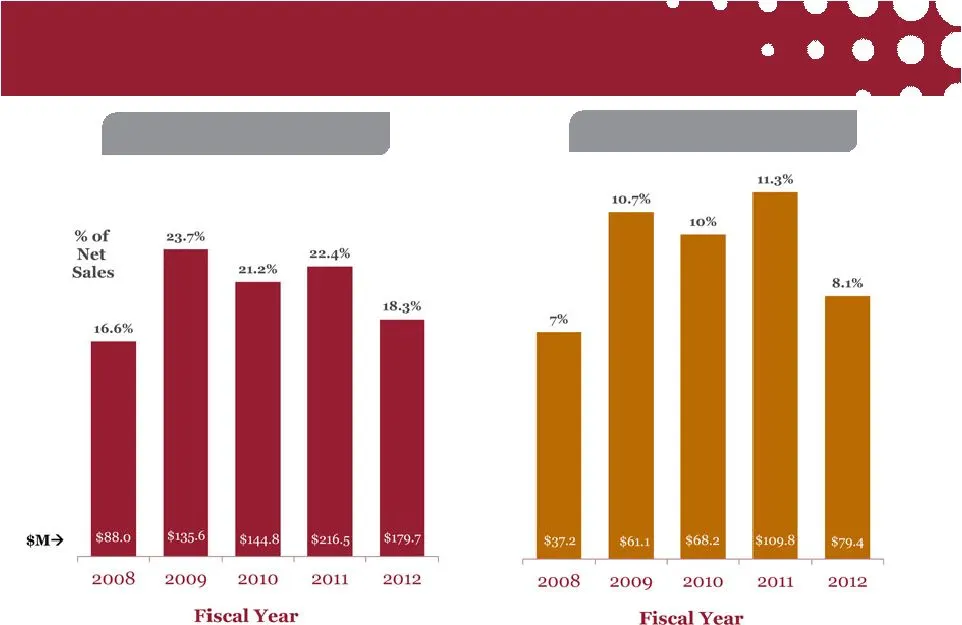
Slide 16: Financial Performance: Gross Margin, Adjusted EBITDA Margin
Financial Performance Gross Margin Adjusted EBITDA* Margin * Calculated as Earnings before Interest and Taxes, excluding costs associated with acquisitions and integration , warrant liability expense, certain SG&A costs related to Audit Committee investigation, re-statement related expenses., consul
Slide 17: Q1 Performance Over Past Three Years
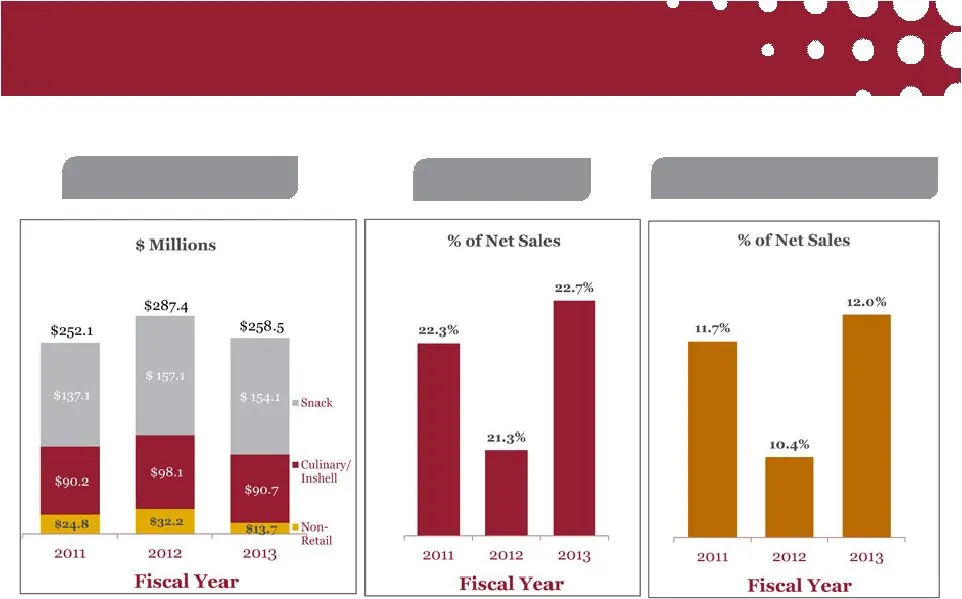
Q1 Performance Over Past Three Years Gross Margin Revenue – Net Sales Adjusted EBITDA* Margin * Calculated as Earnings before Interest and Taxes, excluding costs associated with acquisitions and integration , warranty liability expense, certain SG&A costs related to Audit Committee investigation, re
Slide 18: Overview of Selected Elements of the Balance Sheet
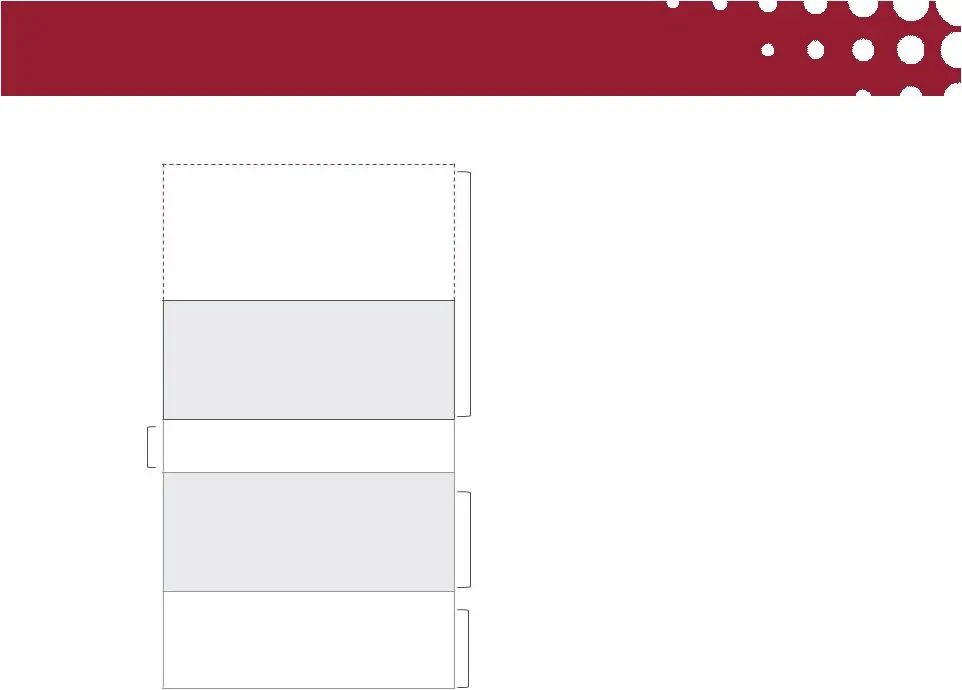
Overview of Selected Elements of the Balance Sheet Bank Revolving Credit Facility Bank Term Loan facility Kettle Guaranteed Loan Oaktree Senior Notes Oaktree Warrants • Libor + 550 basis points, with 1.25% floor • Maturity: Feb 25, 2015 • Approximately $133M outstanding on the $255M revolving facili
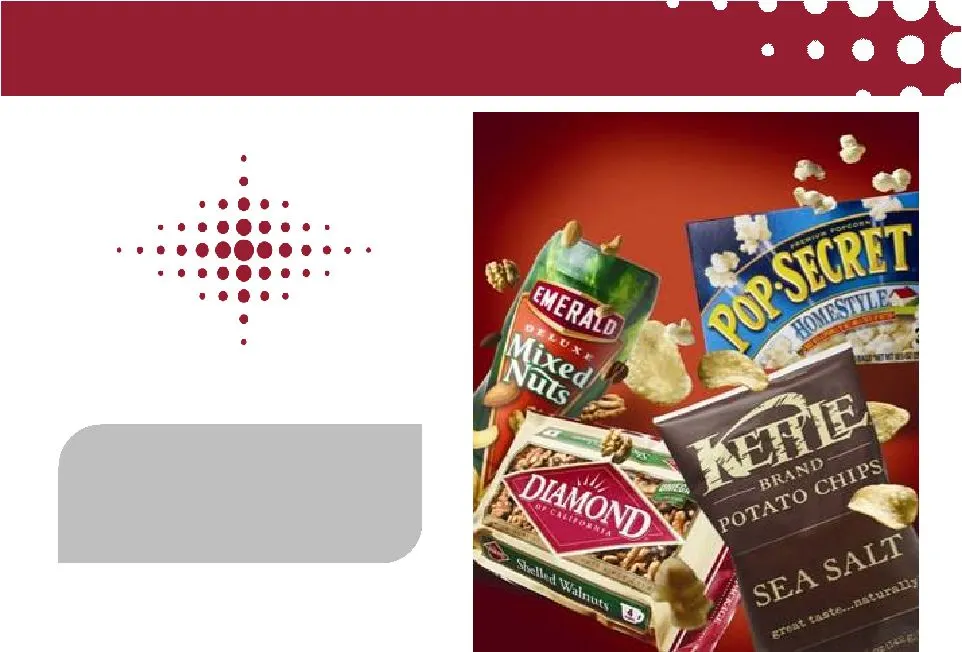
Slide 19: Diamond Foods
Diamond Foods Building a company focused on sustainable, profitable growth
Slide 20: Non-GAAP Reconciliation
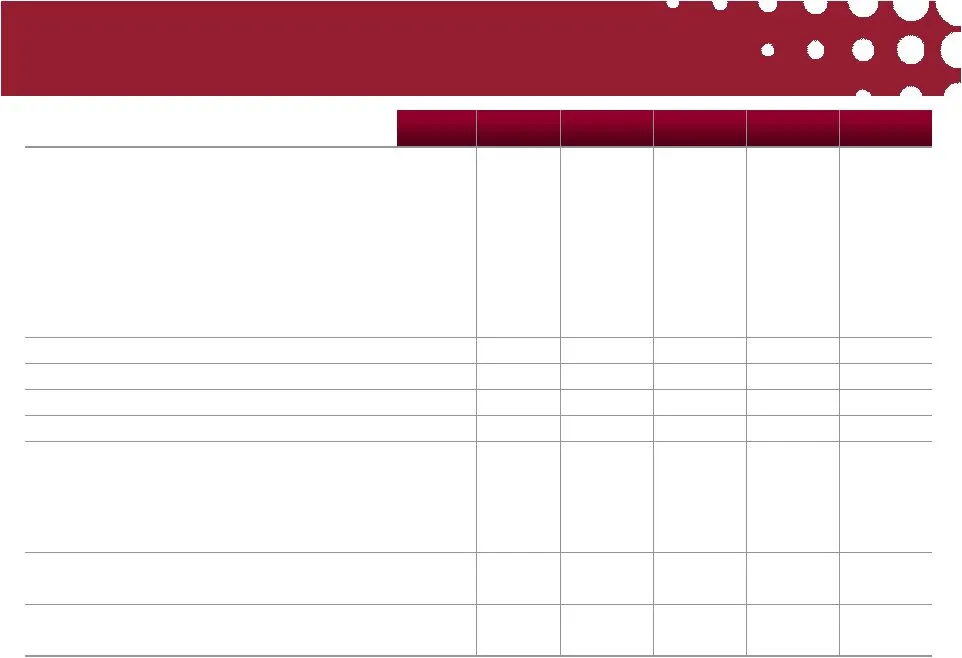
Non-GAAP Reconciliation Q1’13 2012 2011 2010 2009 2008 ($Millions, except per share amounts) GAAP Net Sales $258.5 $981.4 $966.7 $682.3 $570.9 $531.5 GAAP Cost of Sales $199.9 $801.7 $750.2 $537.5 $435.3 $443.5 GAAP Operating Expense $54.7 $230.4 $162.9 $109.6 $89.8 $64.1 Adjustment for acquisition
Source: SEC EDGAR · 8-K filed Feb 26, 2013
More decks from Diamond Foods Inc
 Investor Presentation (June 2013)21 slides · Jun 17, 2013
 Investor Presentation (April 2013)21 slides · Apr 29, 2013
 Q3 2012 Earnings Presentation18 slides · Nov 14, 2012
 Debt Investor Presentation (May 2012)18 slides · May 23, 2012
 Barclays Capital Back-to-School Consumer Conference 201141 slides · Sep 7, 2011
 Merger or Acquisition (June 2011)23 slides · Jun 21, 2011