SKF AB Class A · OMXSTO:SKF_A
SKF AB Class A — Q3 2010 Earnings Presentation
58 slides from SKF AB Class A's earnings presentation, Oct 19, 2010
Slide 1: 19 October 2010
1 19 October 2010
Slide 2: The SKF Group
The SKF Group Tom Johnstone, President and CEO
Slide 3: Agenda
3 Agenda • Nine-months report and outlook • New financial targets • Acquisition of Lincoln Industrial 19 October 2010
Slide 4: Agenda
4 Agenda • Nine-months report and outlook • New financial targets • Acquisition of Lincoln Industrial 19 October 2010
Slide 5: Key points, Q3 report
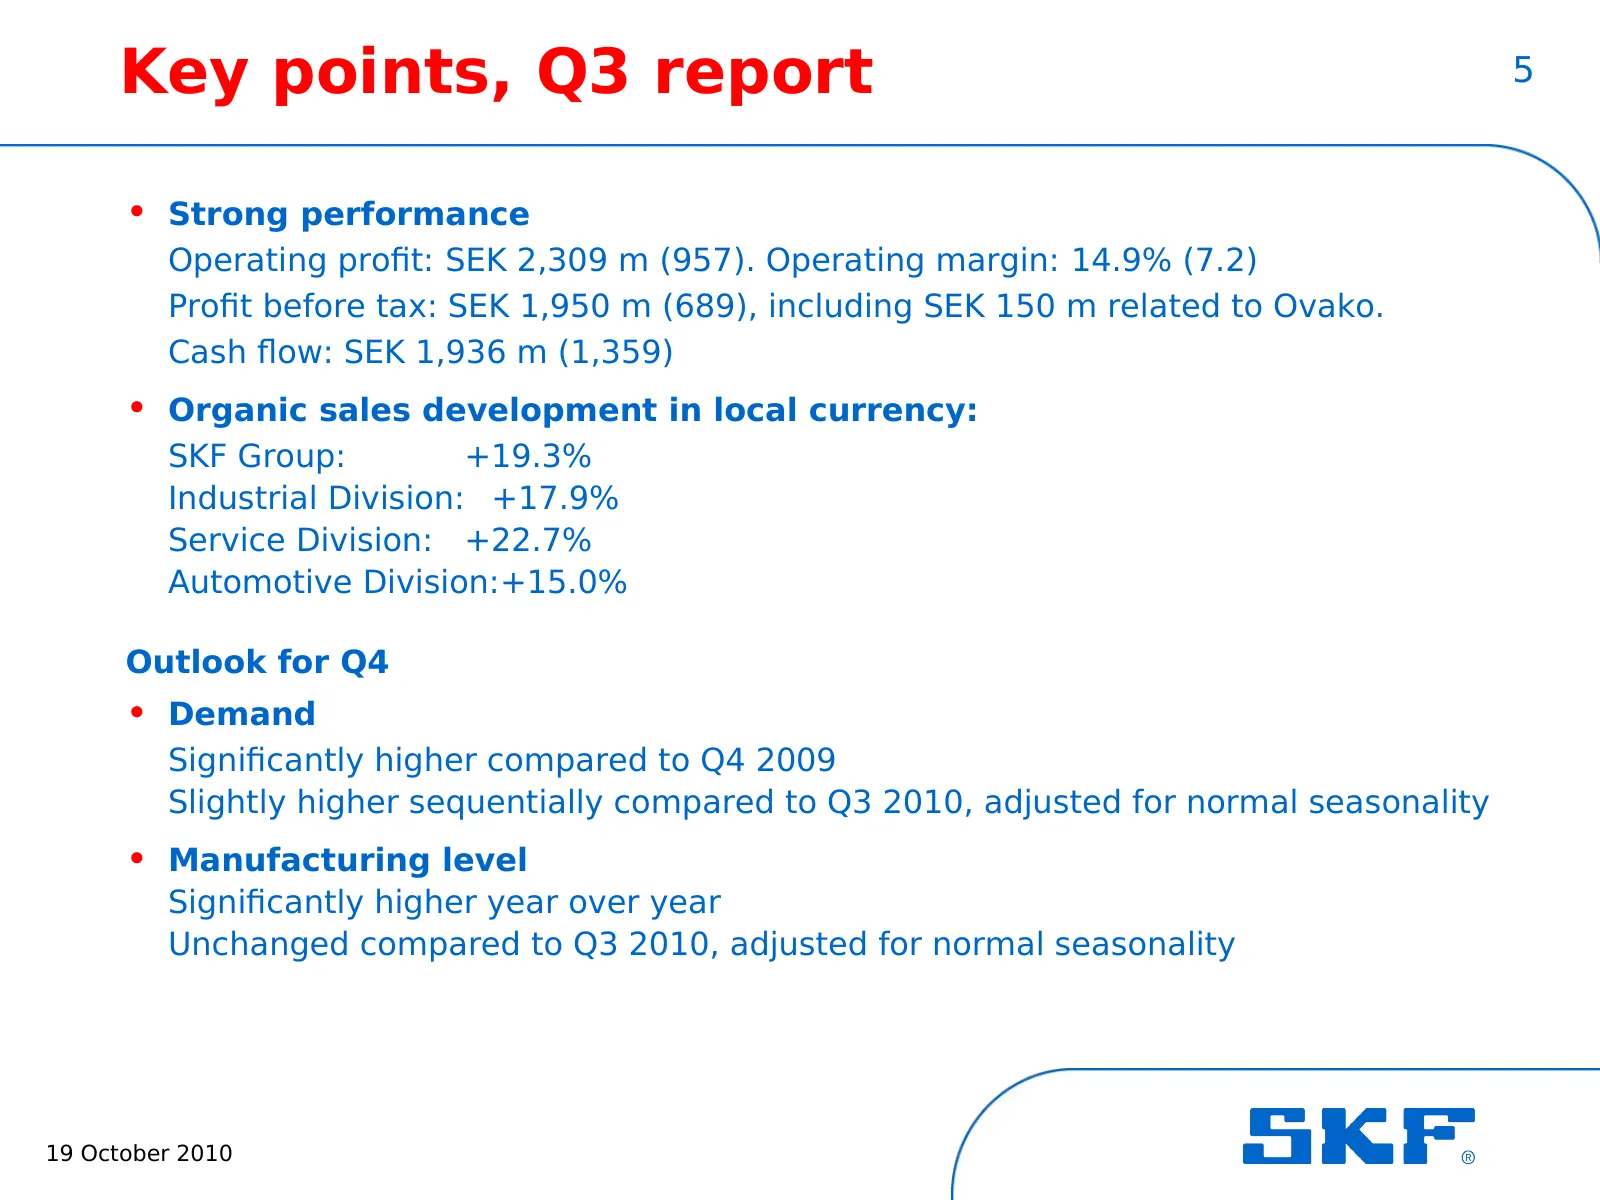
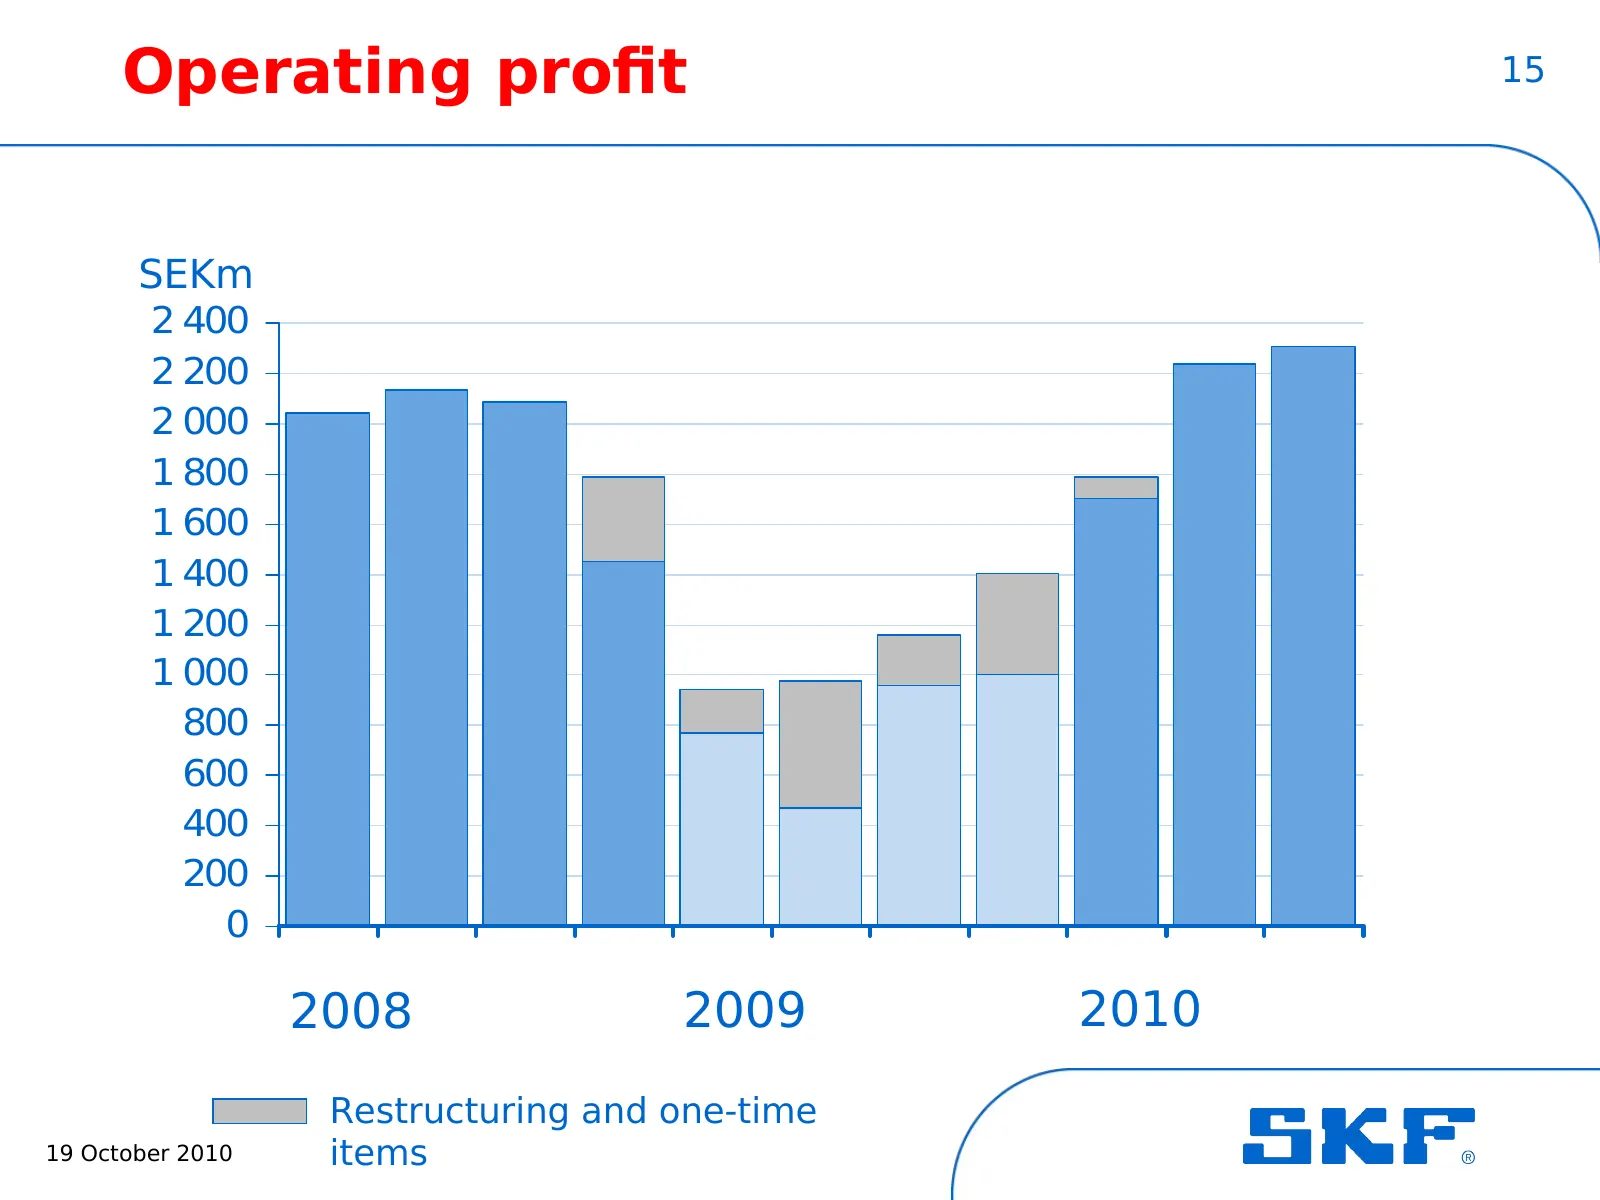
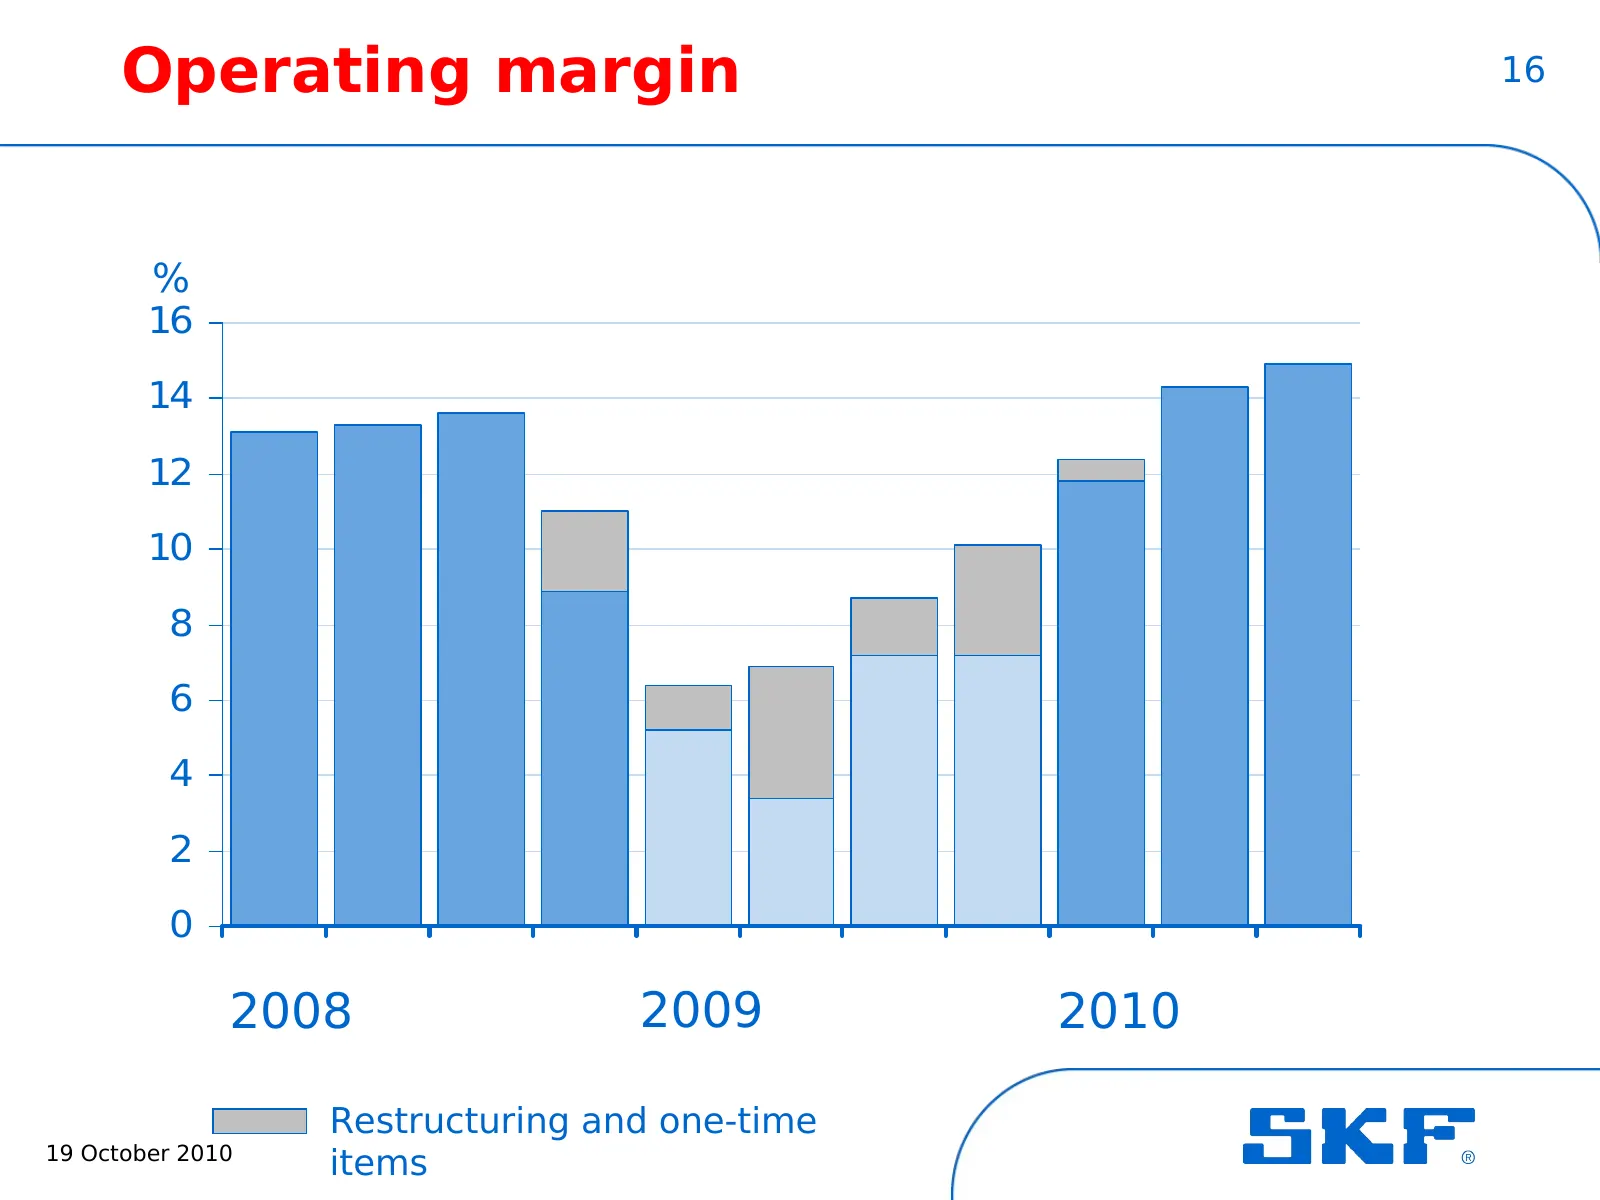
Key points, Q3 report 5 • Strong performance Operating profit: SEK 2,309 m (957). Operating margin: 14.9% (7.2) Profit before tax: SEK 1,950 m (689), including SEK 150 m related to Ovako. Cash flow: SEK 1,936 m (1,359) • Organic sales development in local currency: SKF Group: +19.3% Industrial Divis
Slide 6: Highlights Q3 2010 – investing for the future
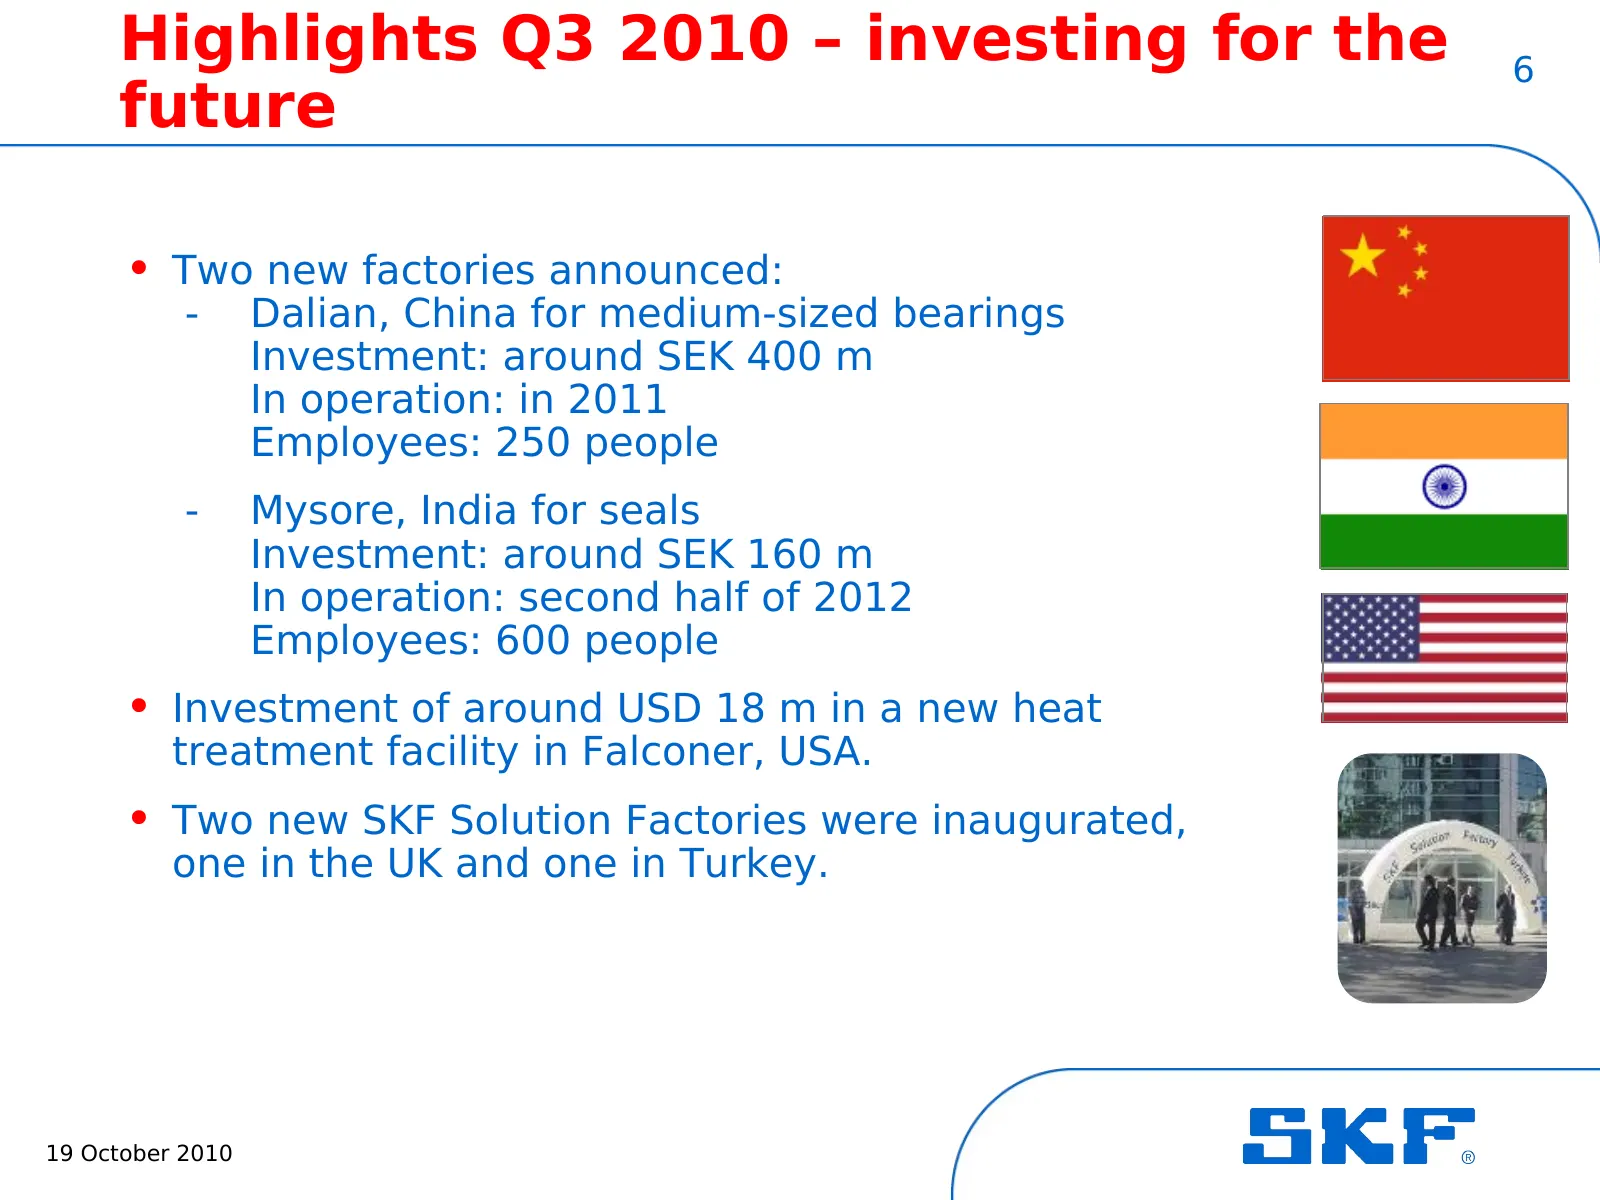
Highlights Q3 2010 – investing for the 6 future • Two new factories announced: - Dalian, China for medium-sized bearings Investment: around SEK 400 m In operation: in 2011 Employees: 250 people - Mysore, India for seals Investment: around SEK 160 m In operation: second half of 2012 Employees: 600 pe
Slide 7: Highlights Q3 2010 – customers and sustainability
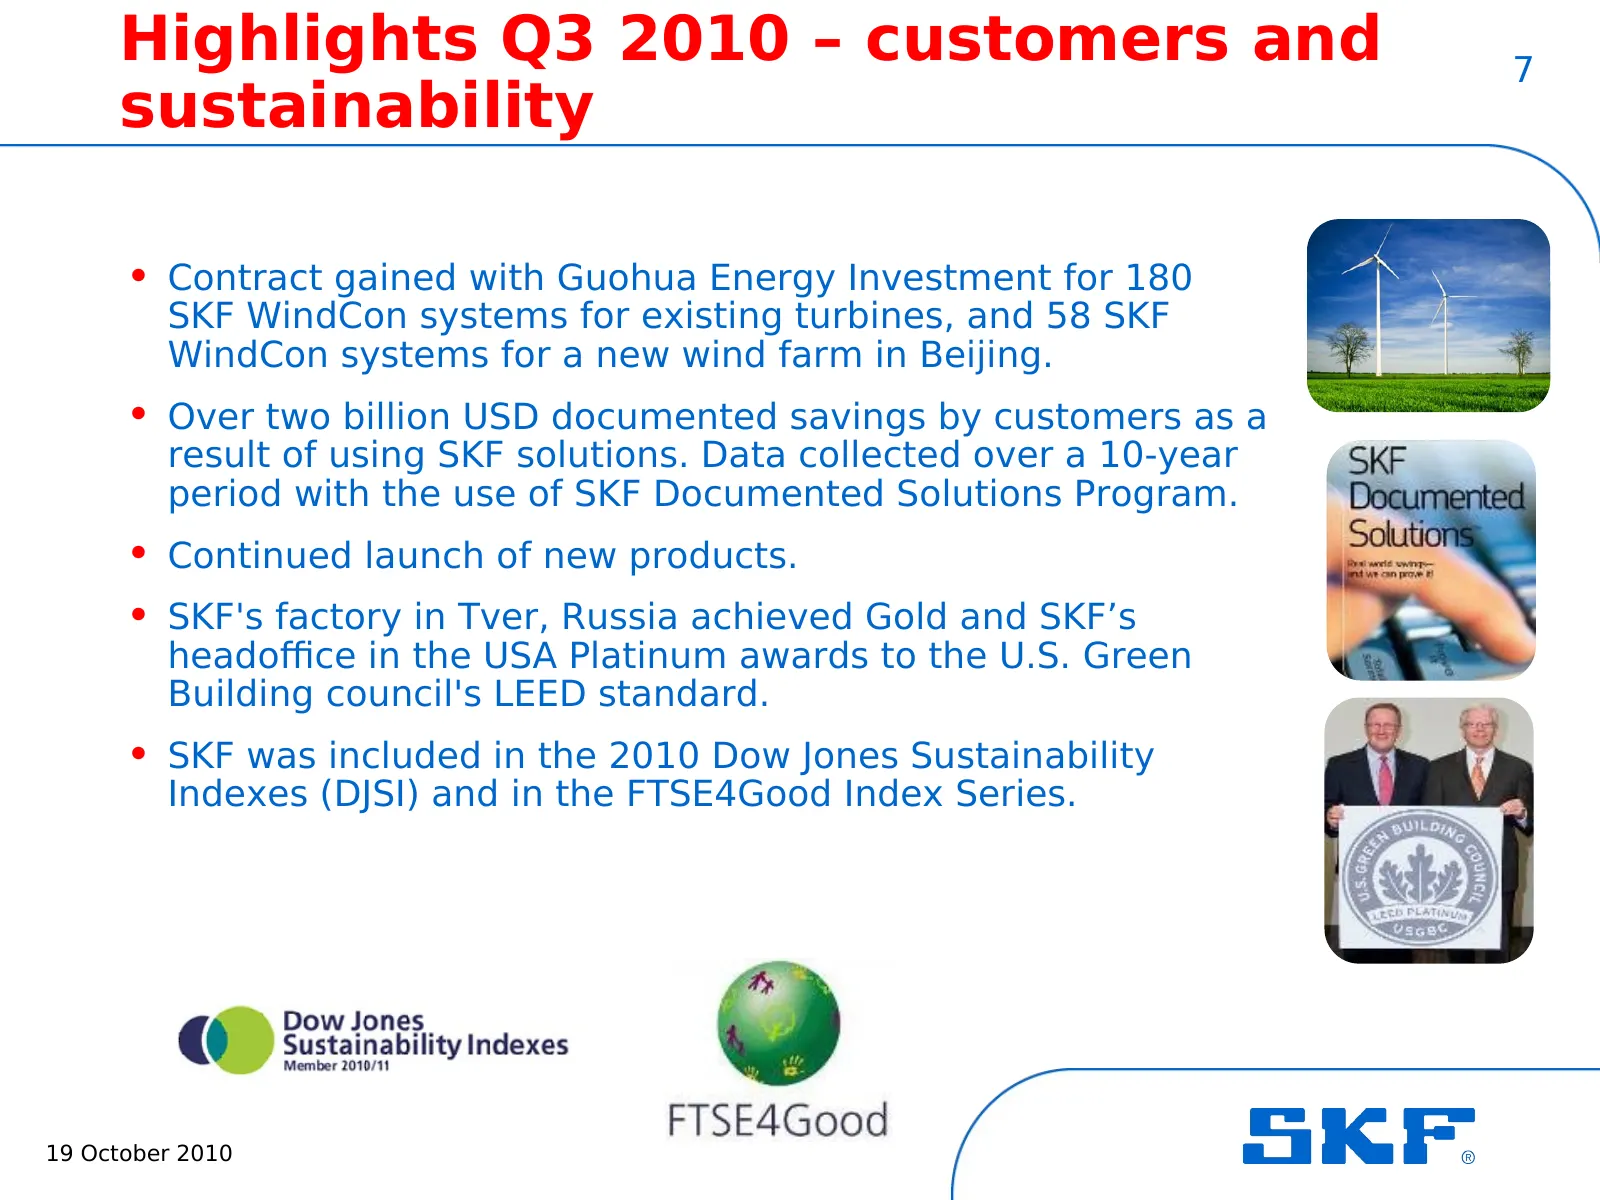
Highlights Q3 2010 – customers and 7 sustainability • Contract gained with Guohua Energy Investment for 180 SKF WindCon systems for existing turbines, and 58 SKF WindCon systems for a new wind farm in Beijing. • Over two billion USD documented savings by customers as a result of using SKF solutions.
Slide 8: Examples of new product launches
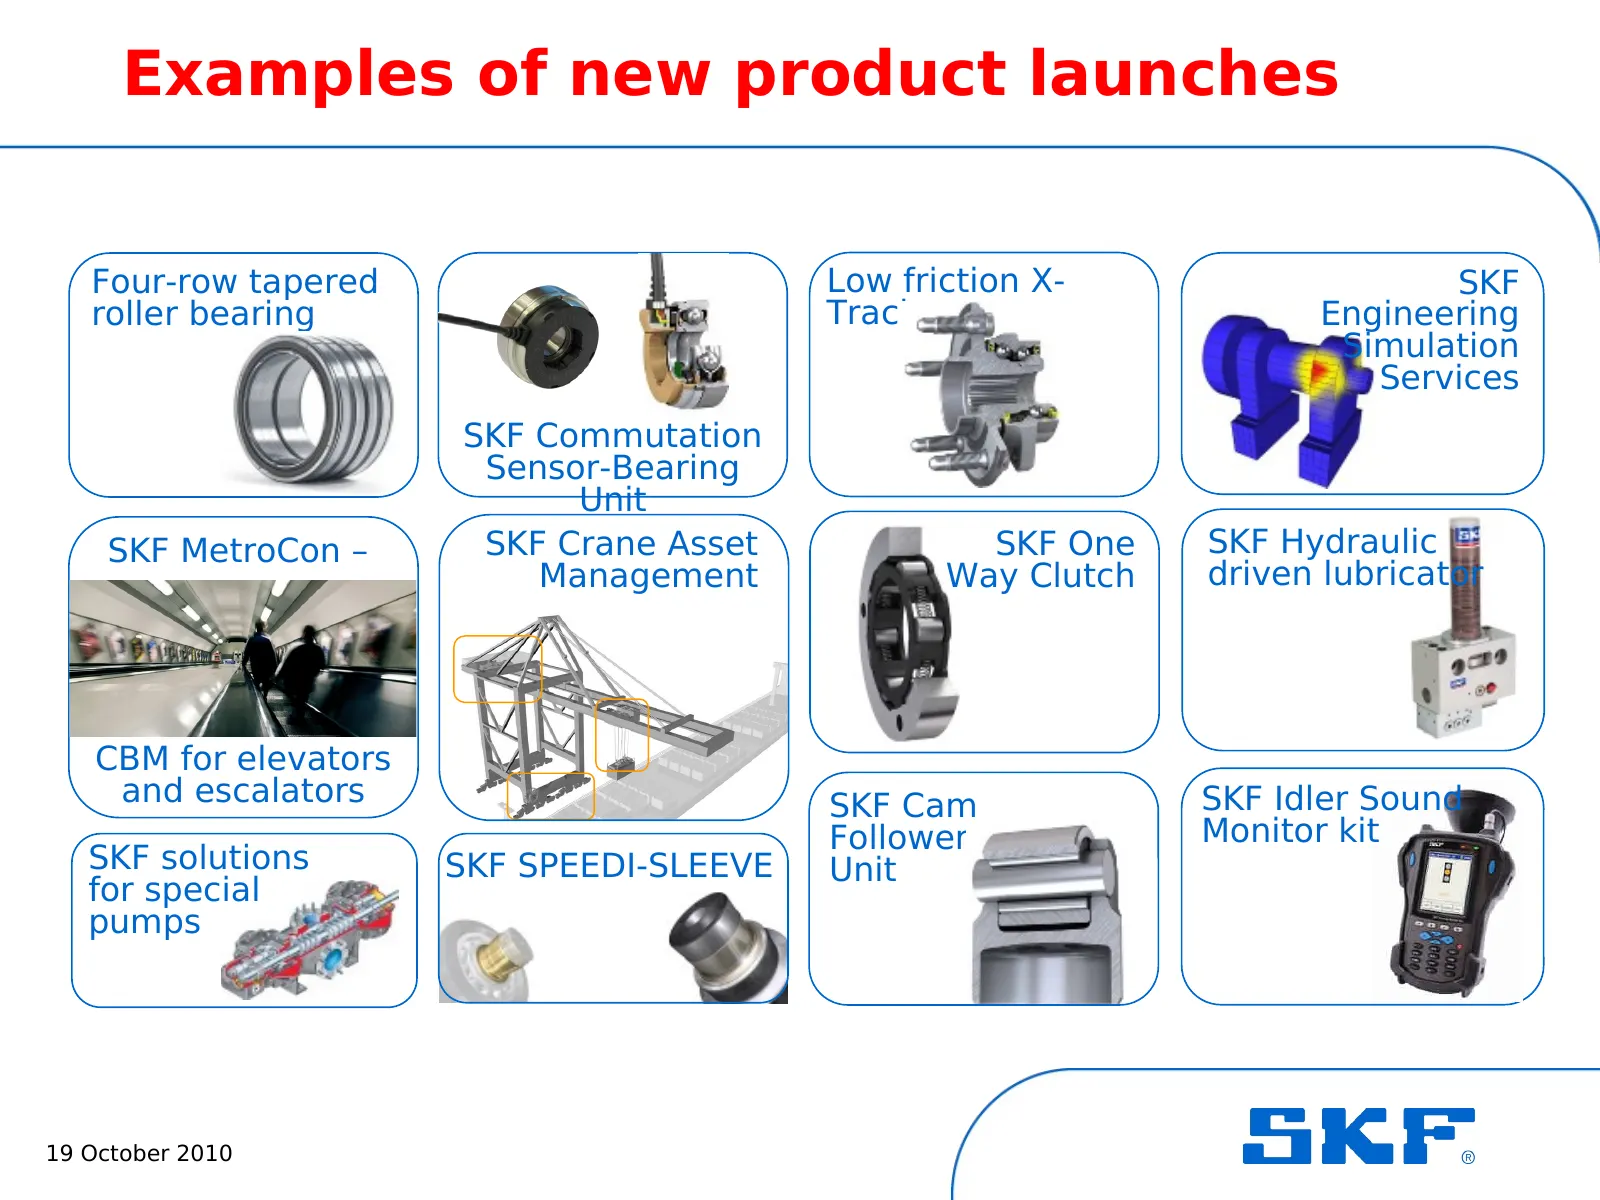
Examples of new product launches 8 Four-row tapered Low friction X- SKF roller bearing Tracker Engineering Simulation Services SKF Commutation Sensor-Bearing Unit SKF MetroCon – SKF Crane Asset SKF One SKF Hydraulic Management Way Clutch driven lubricator CBM for elevators and escalators SKF Cam SKF
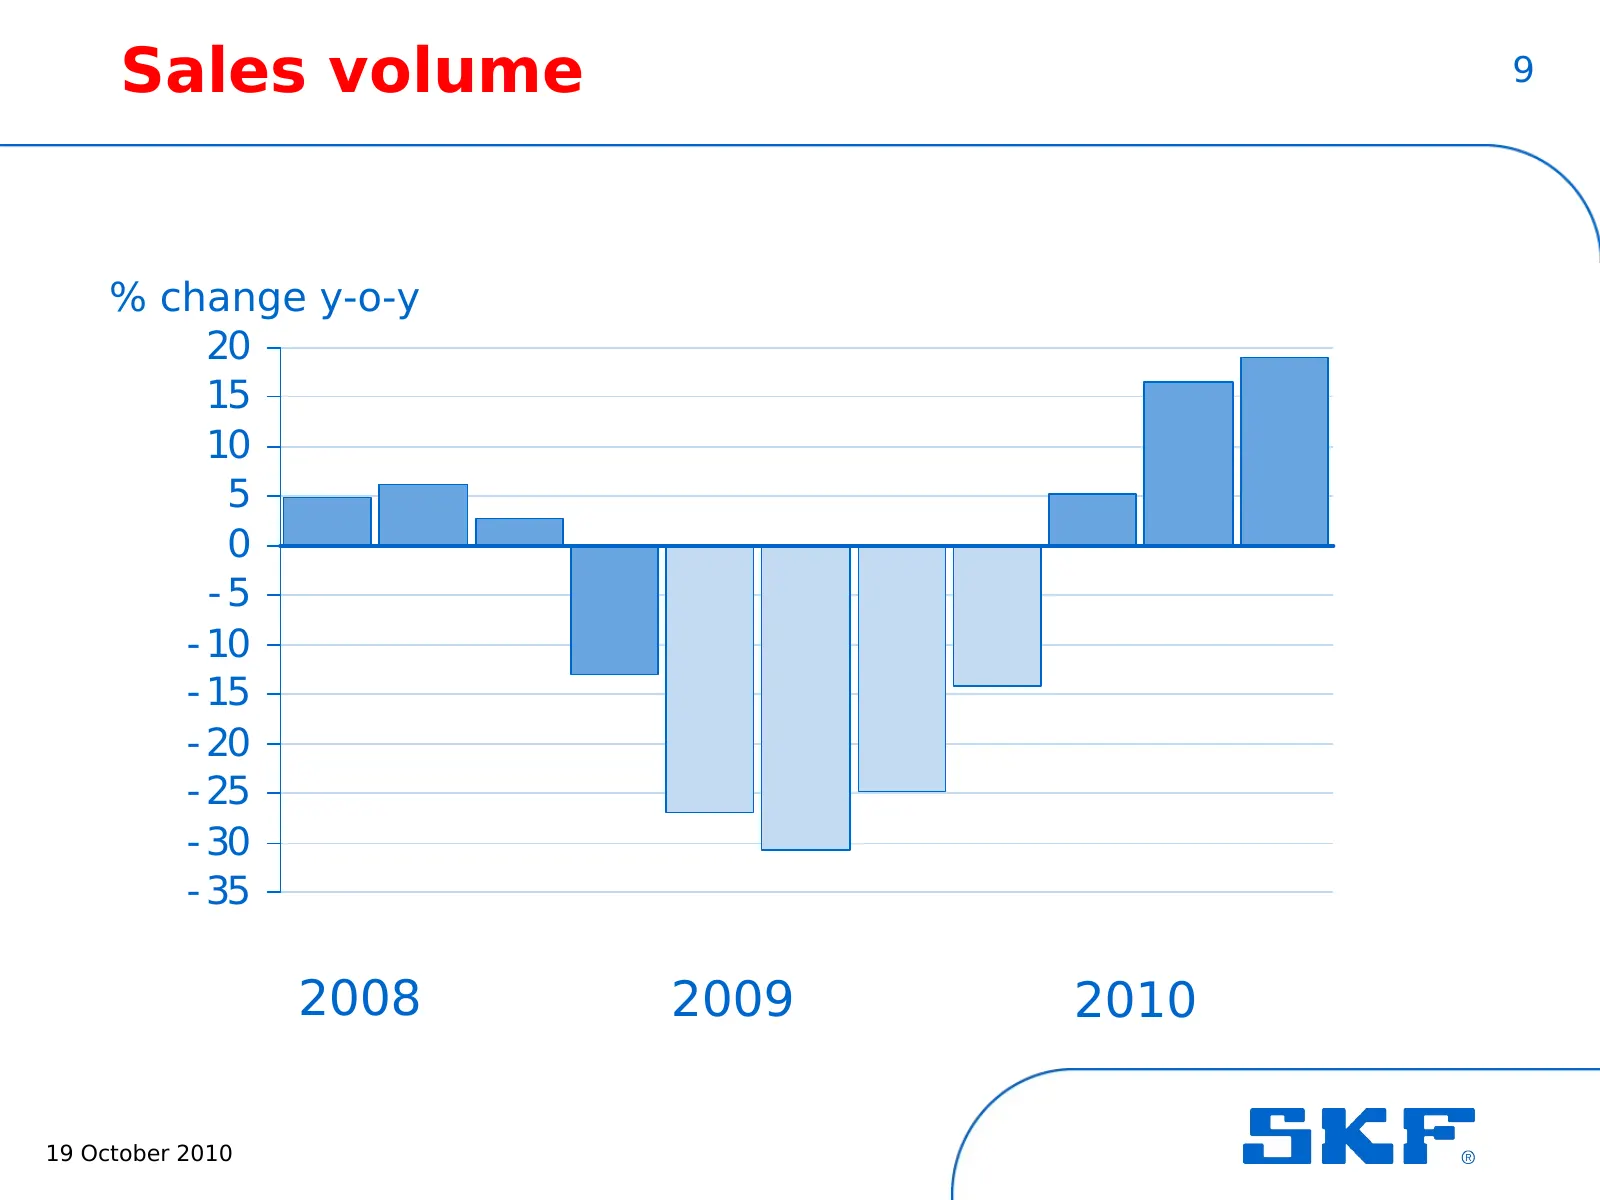
Slide 9: Sales volume
Sales volume 9 % change y-o-y 20 15 10 5 0 -5 - 10 - 15 - 20 - 25 - 30 - 35 2008 2009 2010 19 October 2010
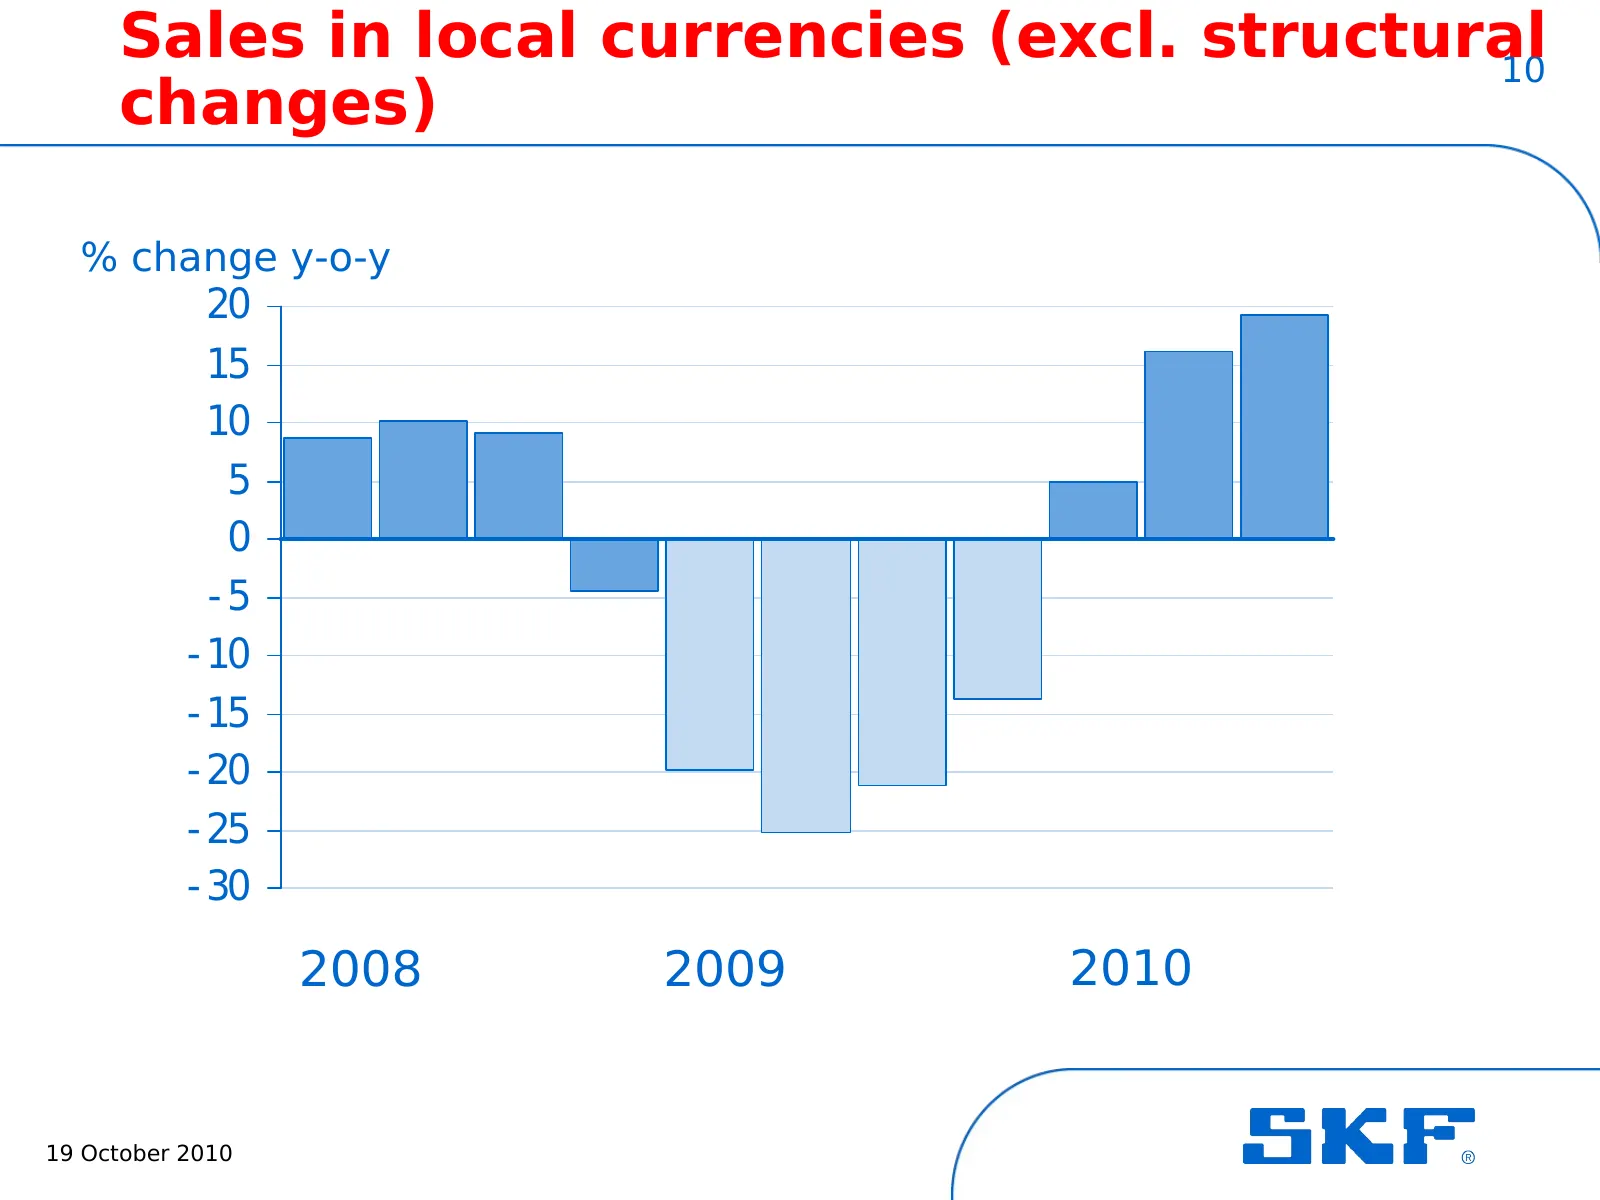
Slide 10: Sales in local currencies (excl. structural changes)
Sales in local currencies (excl. structural 10 changes) % change y-o-y 20 15 10 5 0 -5 - 10 - 15 - 20 - 25 - 30 2008 2009 2010 19 October 2010
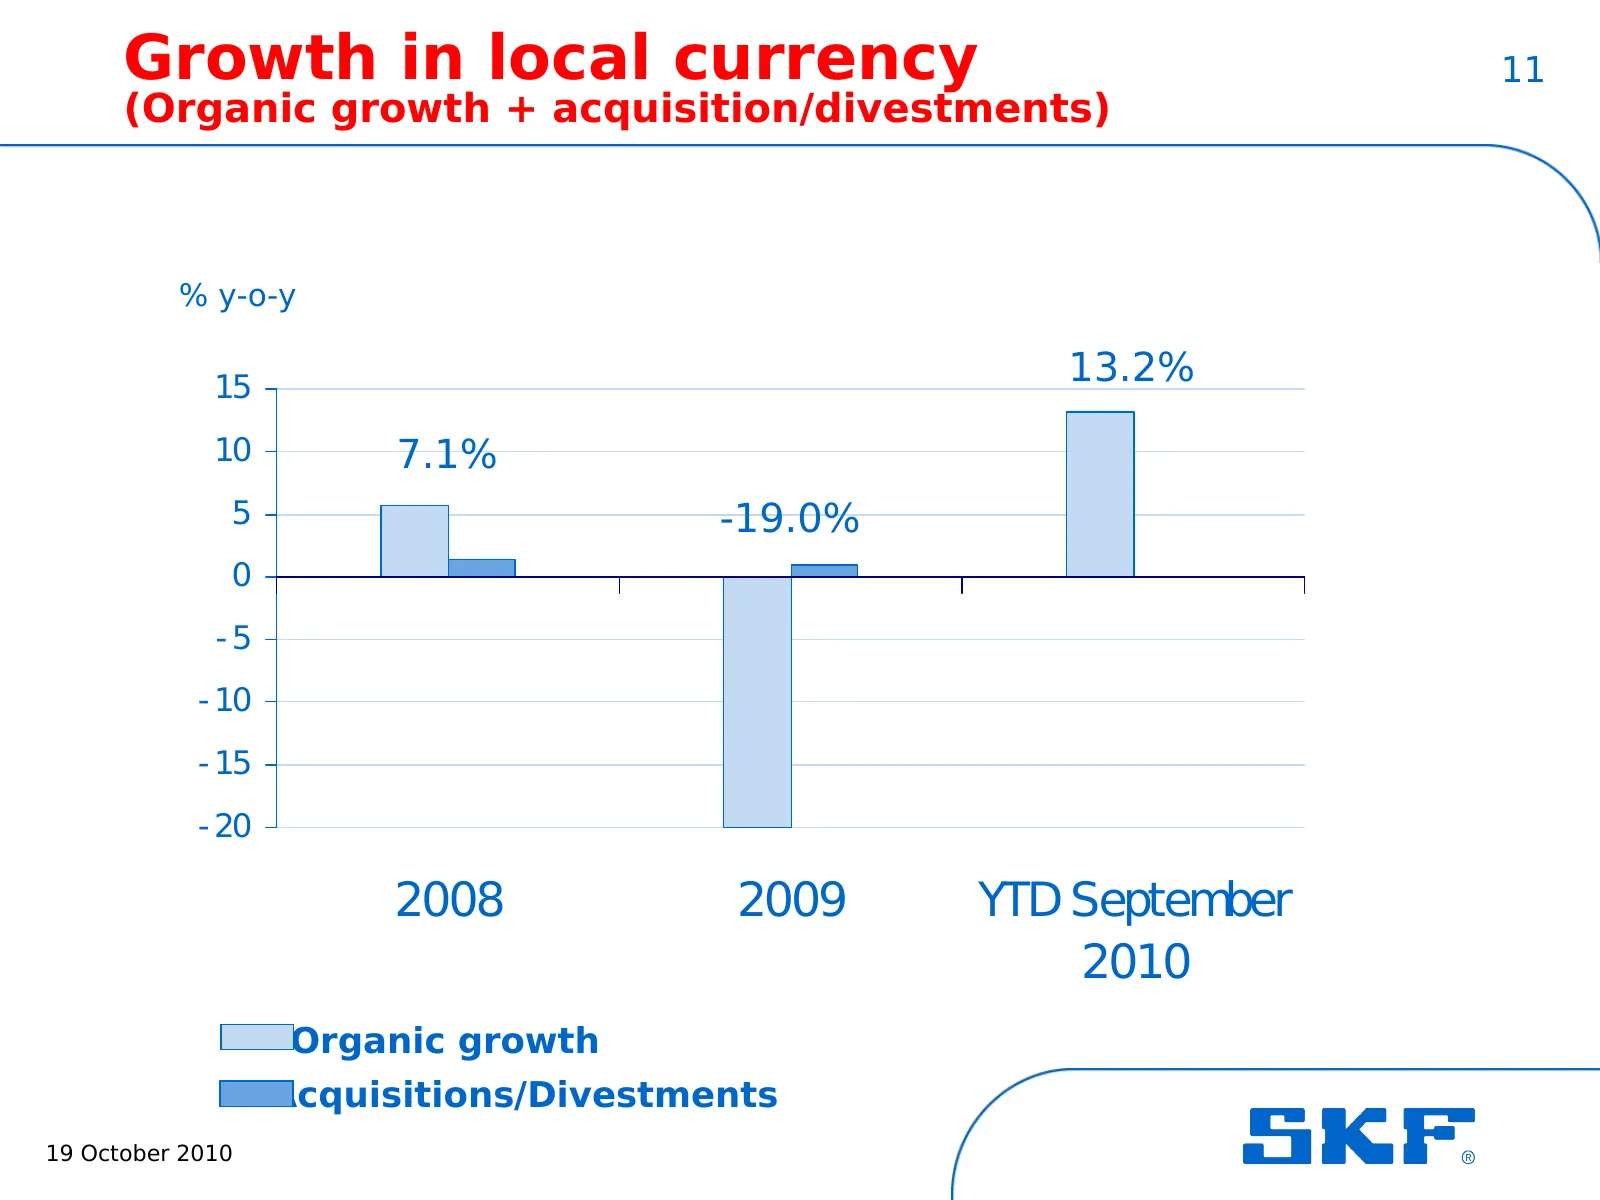
Slide 11: Growth in local currency
Growth in local currency 11 (Organic growth + acquisition/divestments) % y-o-y 15 13.2% 10 7.1% 5 -19.0% 0 -5 - 10 - 15 - 20 2008 2009 YTD September 2010 Organic growth Acquisitions/Divestments 19 October 2010
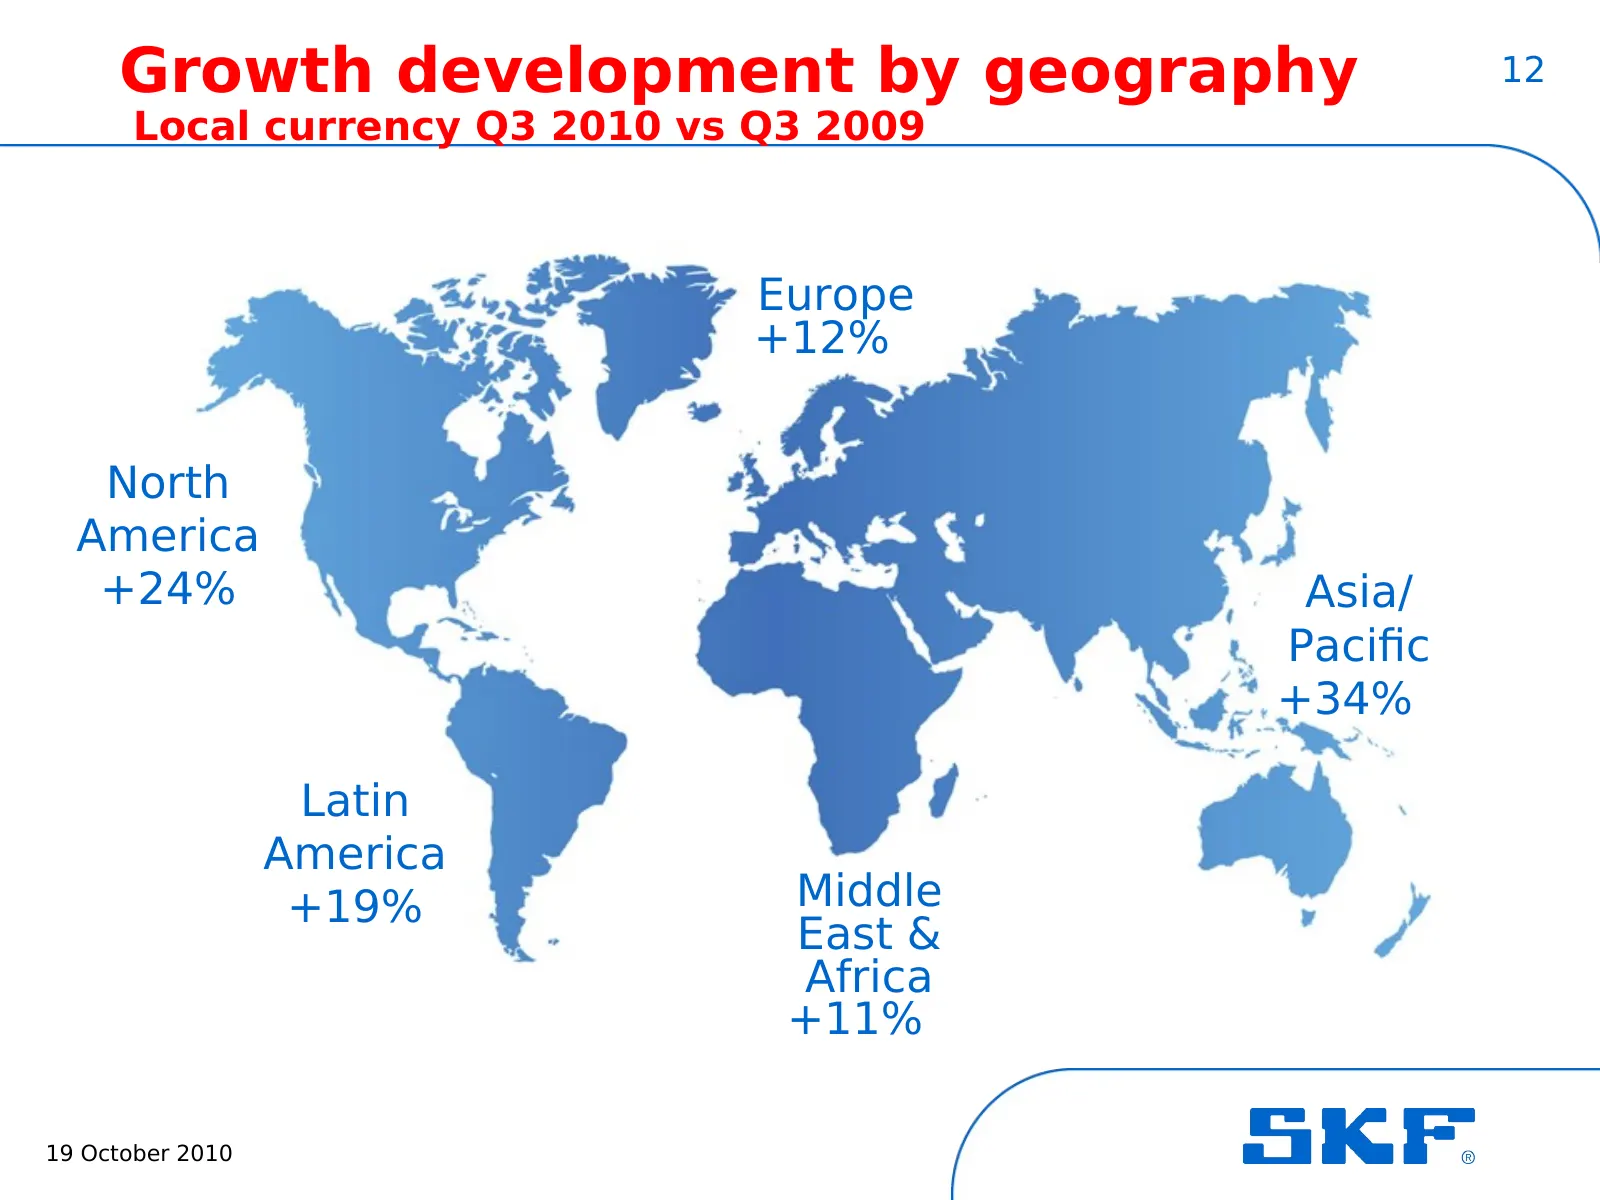
Slide 12: Growth development by geography
Growth development by geography 12 Local currency Q3 2010 vs Q3 2009 Europe +12% North America +24% Asia/ Pacific +34% Latin America +19% Middle East & Africa +11% 19 October 2010
Slide 13: Growth development by geography
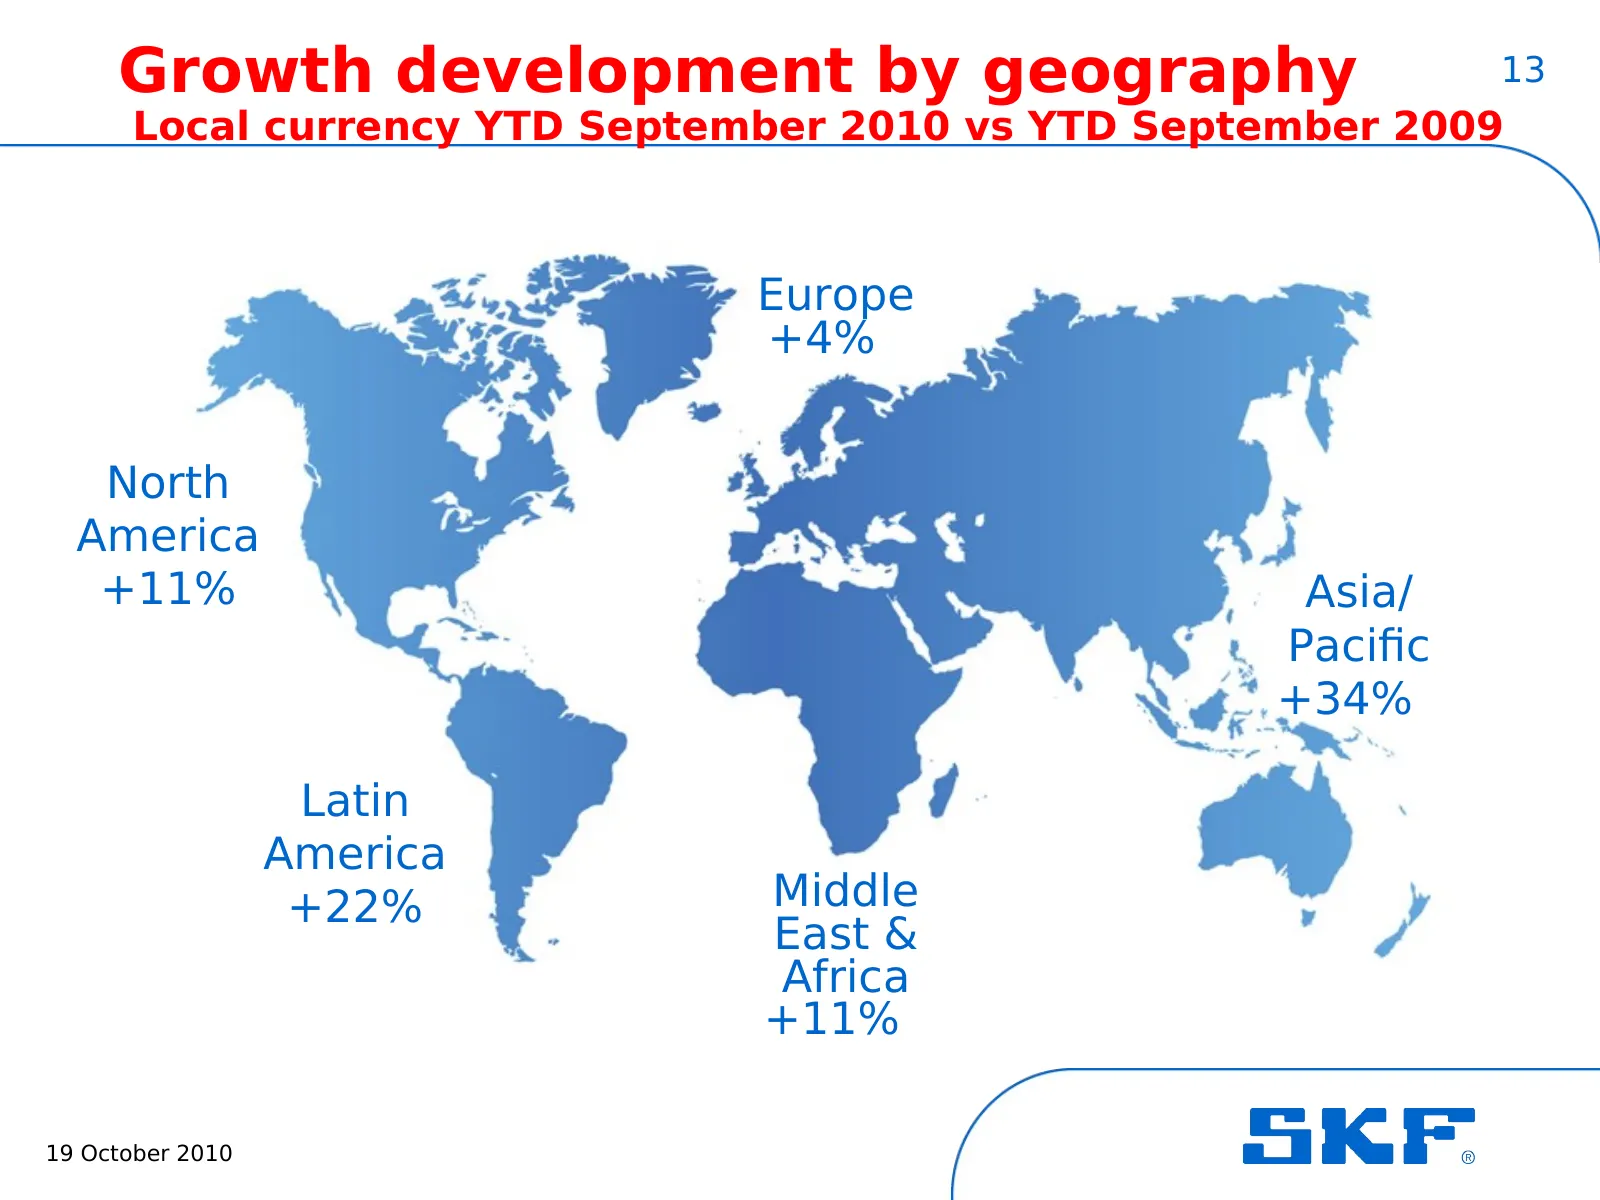
Growth development by geography 13 Local currency YTD September 2010 vs YTD September 2009 Europe +4% North America +11% Asia/ Pacific +34% Latin America +22% Middle East & Africa +11% 19 October 2010
Slide 14: Components in net sales
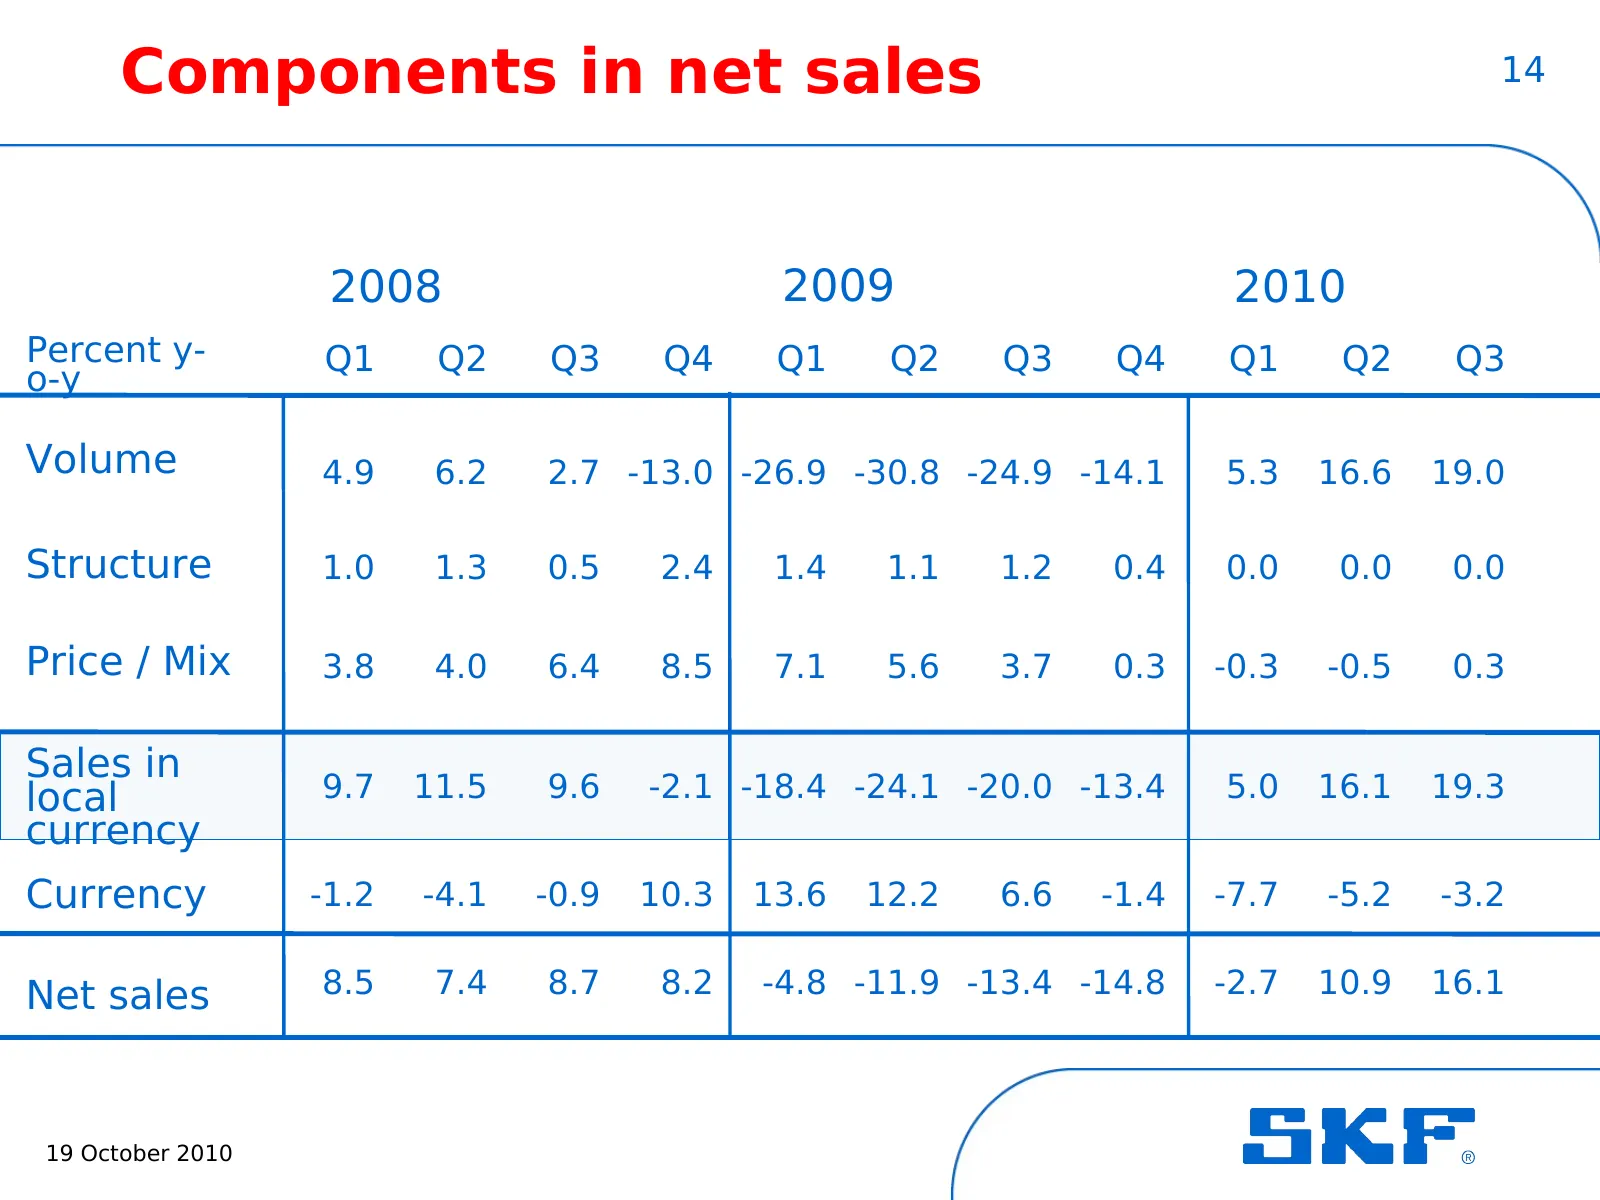
Components in net sales 14 2008 2009 2010 Percent y- Q1 Q2 Q3 Q4 Q1 Q2 Q3 Q4 Q1 Q2 Q3 o-y Volume 4.9 6.2 2.7 -13.0 -26.9 -30.8 -24.9 -14.1 5.3 16.6 19.0 Structure 1.0 1.3 0.5 2.4 1.4 1.1 1.2 0.4 0.0 0.0 0.0 Price / Mix 3.8 4.0 6.4 8.5 7.1 5.6 3.7 0.3 -0.3 -0.5 0.3 Sales in local 9.7 11.5 9.6 -2.1 -1
Slide 15: Operating profit
Operating profit 15 SEKm 2 400 2 200 2 000 1 800 1 600 1 400 1 200 1 000 800 600 400 200 0 2008 2009 2010 Restructuring and one-time 19 October 2010 items
Slide 16: Operating margin
Operating margin 16 % 16 14 12 10 8 6 4 2 0 2008 2009 2010 Restructuring and one-time 19 October 2010 items
Slide 17: Operating margin
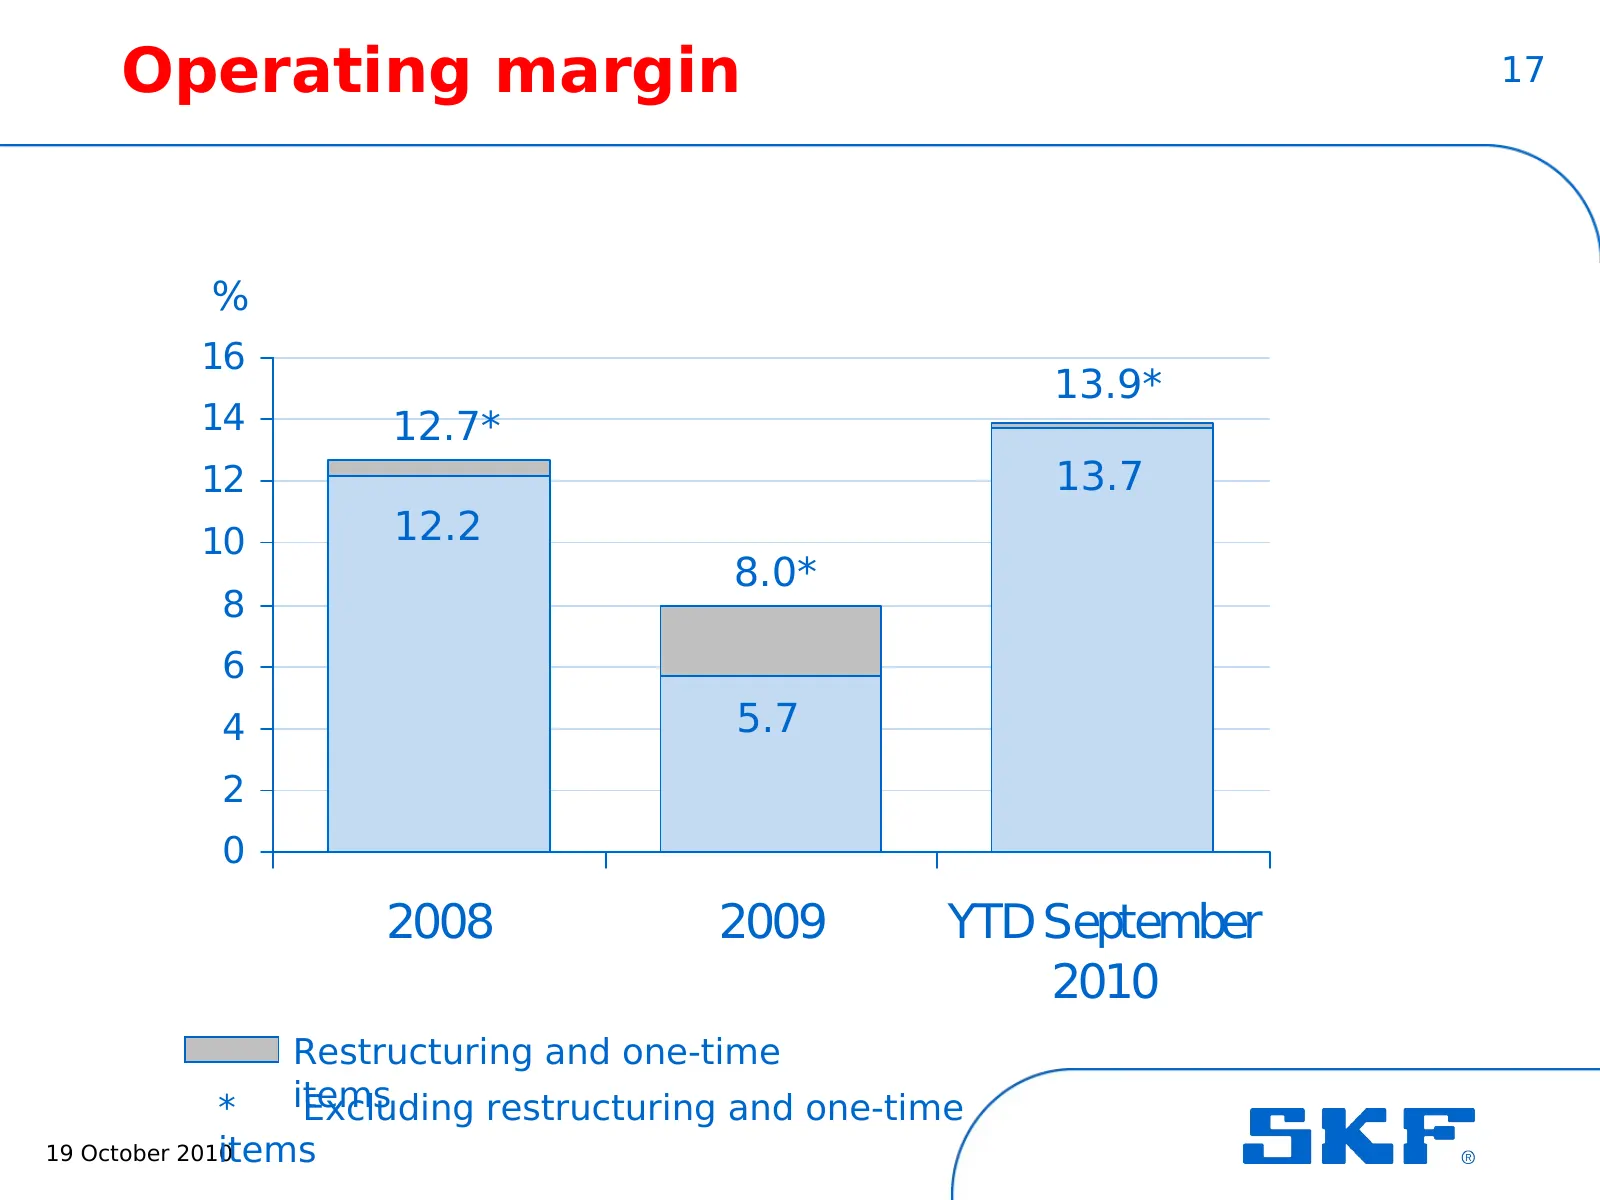
Operating margin 17 % 16 13.9* 14 12.7* 12 13.7 10 12.2 8.0* 8 6 4 5.7 2 0 2008 2009 YTD September 2010 Restructuring and one-time * items Excluding restructuring and one-time items 19 October 2010
Slide 18: Operating margin per division
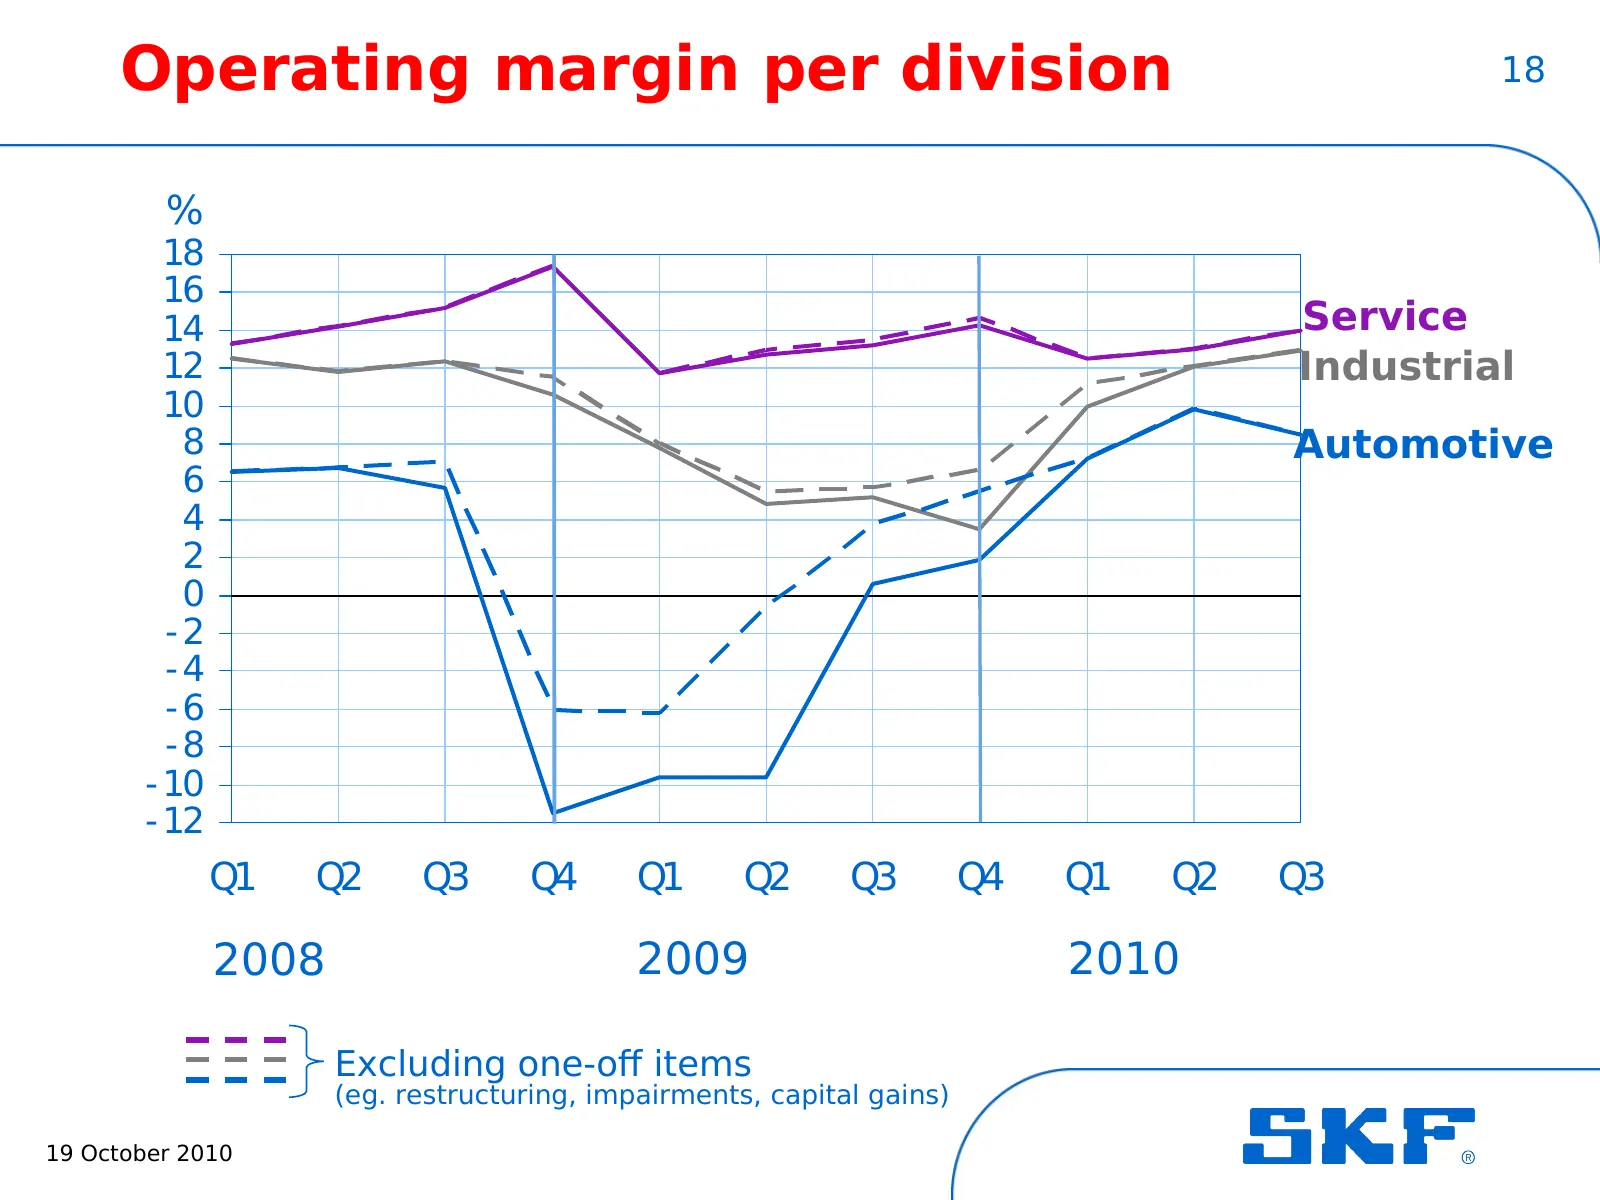
Operating margin per division 18 % 18 16 14 Service 12 Industrial 10 8 Automotive 6 4 2 0 -2 -4 -6 -8 - 10 - 12 Q1 Q2 Q3 Q4 Q1 Q2 Q3 Q4 Q1 Q2 Q3 2008 2009 2010 Excluding one-off items (eg. restructuring, impairments, capital gains) 19 October 2010
Slide 19: Third quarter 2010
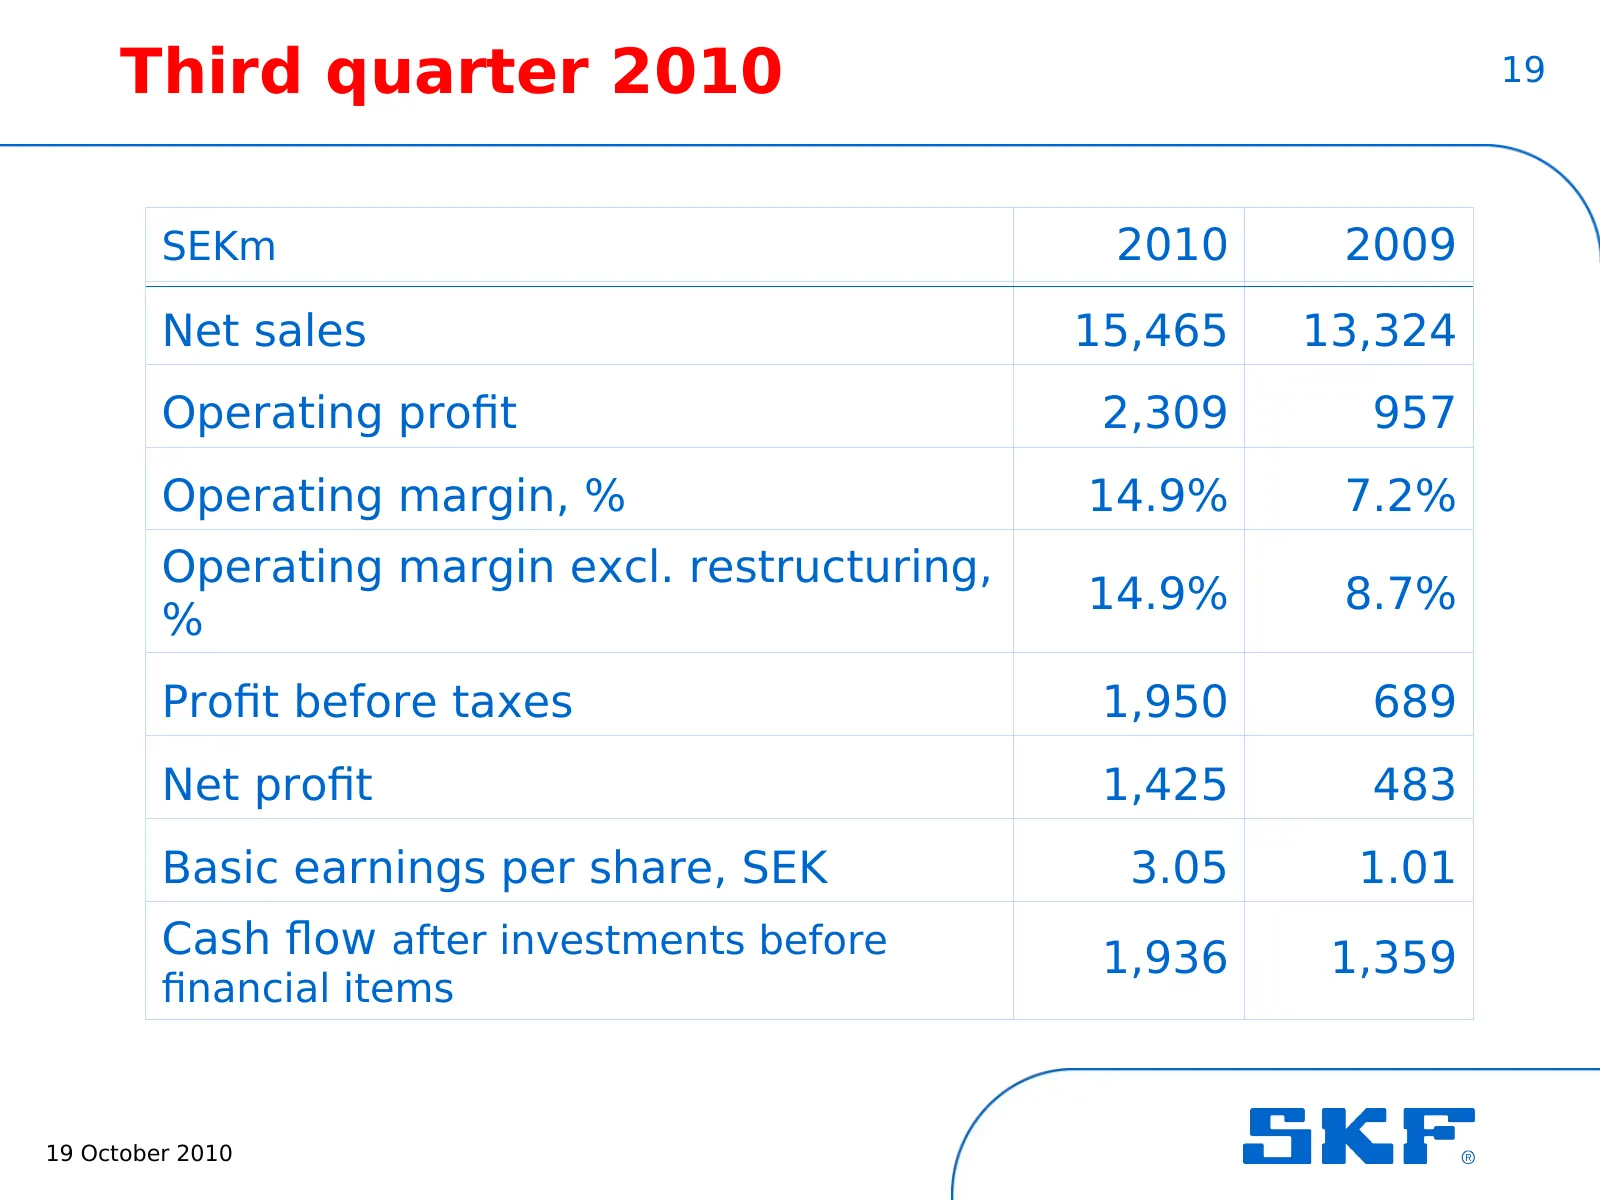
Third quarter 2010 19 SEKm 2010 2009 Net sales 15,465 13,324 Operating profit 2,309 957 Operating margin, % 14.9% 7.2% Operating margin excl. restructuring, 14.9% 8.7% % Profit before taxes 1,950 689 Net profit 1,425 483 Basic earnings per share, SEK 3.05 1.01 Cash flow after investments before 1,93
Slide 20: First nine months 2010
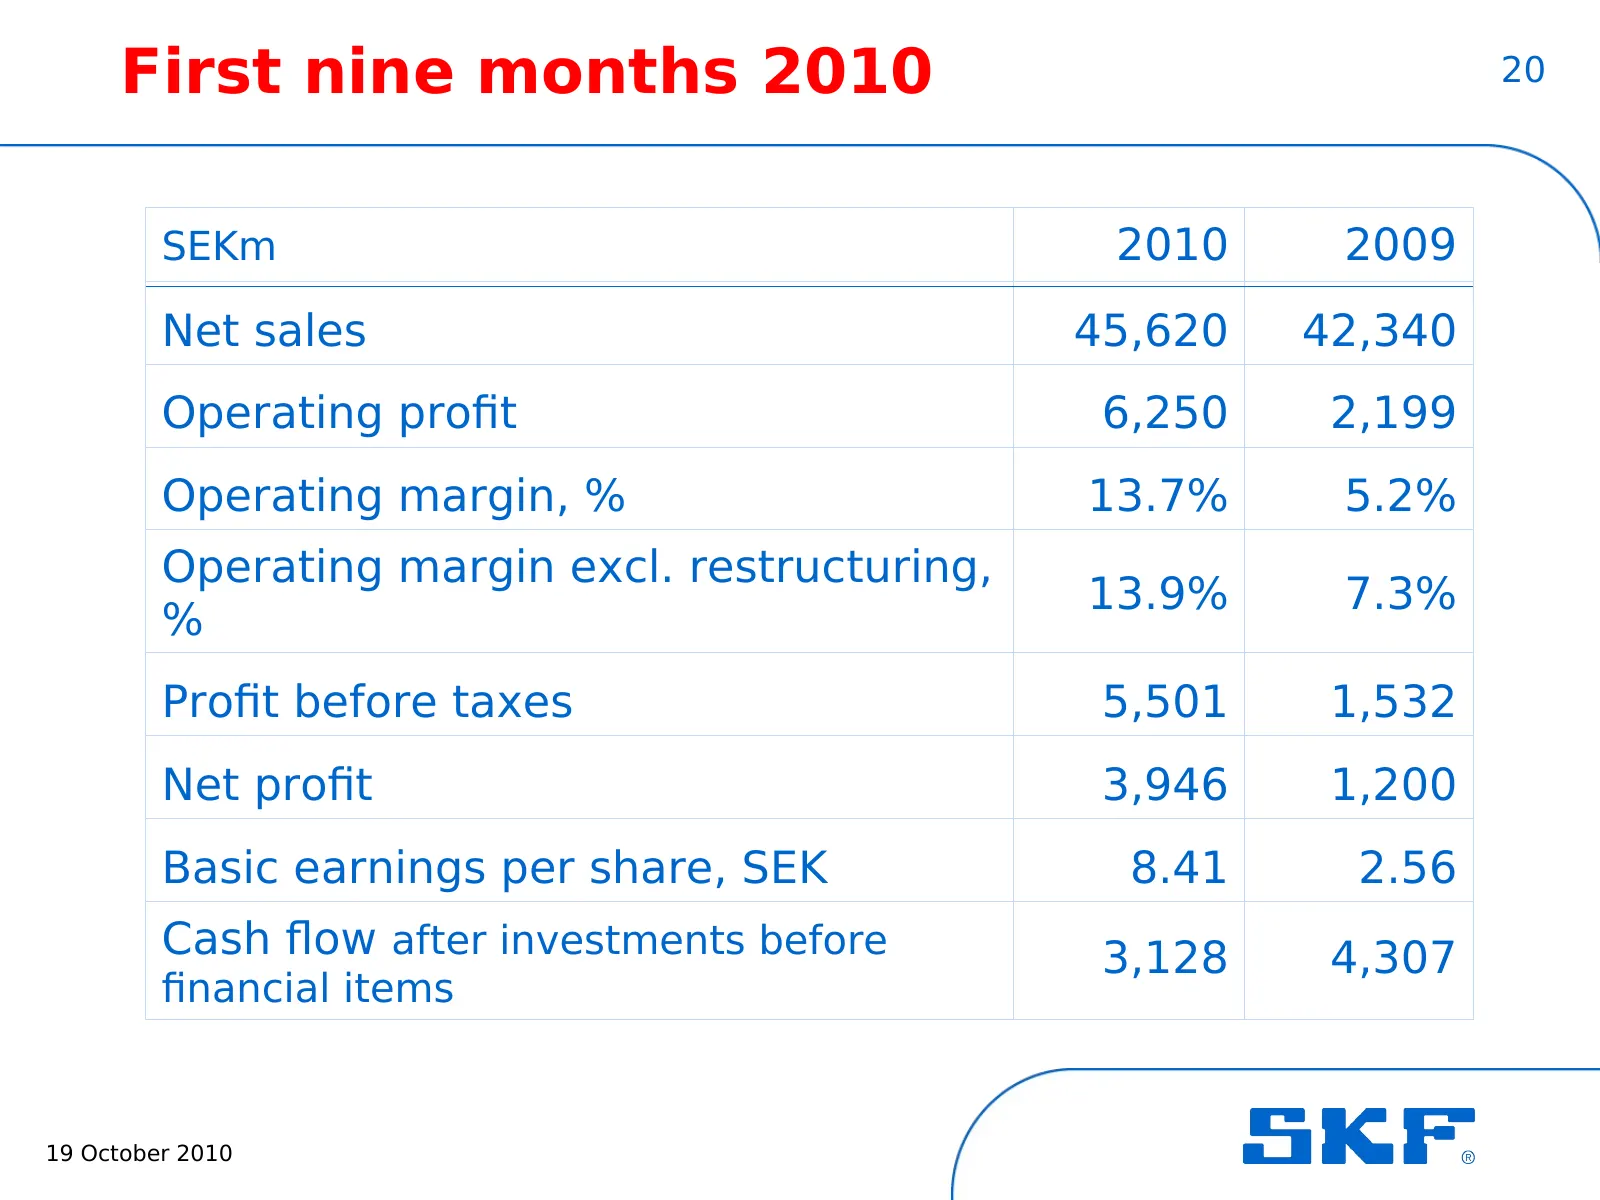
First nine months 2010 20 SEKm 2010 2009 Net sales 45,620 42,340 Operating profit 6,250 2,199 Operating margin, % 13.7% 5.2% Operating margin excl. restructuring, 13.9% 7.3% % Profit before taxes 5,501 1,532 Net profit 3,946 1,200 Basic earnings per share, SEK 8.41 2.56 Cash flow after investments b
Slide 21: Inventories as % of annual sales
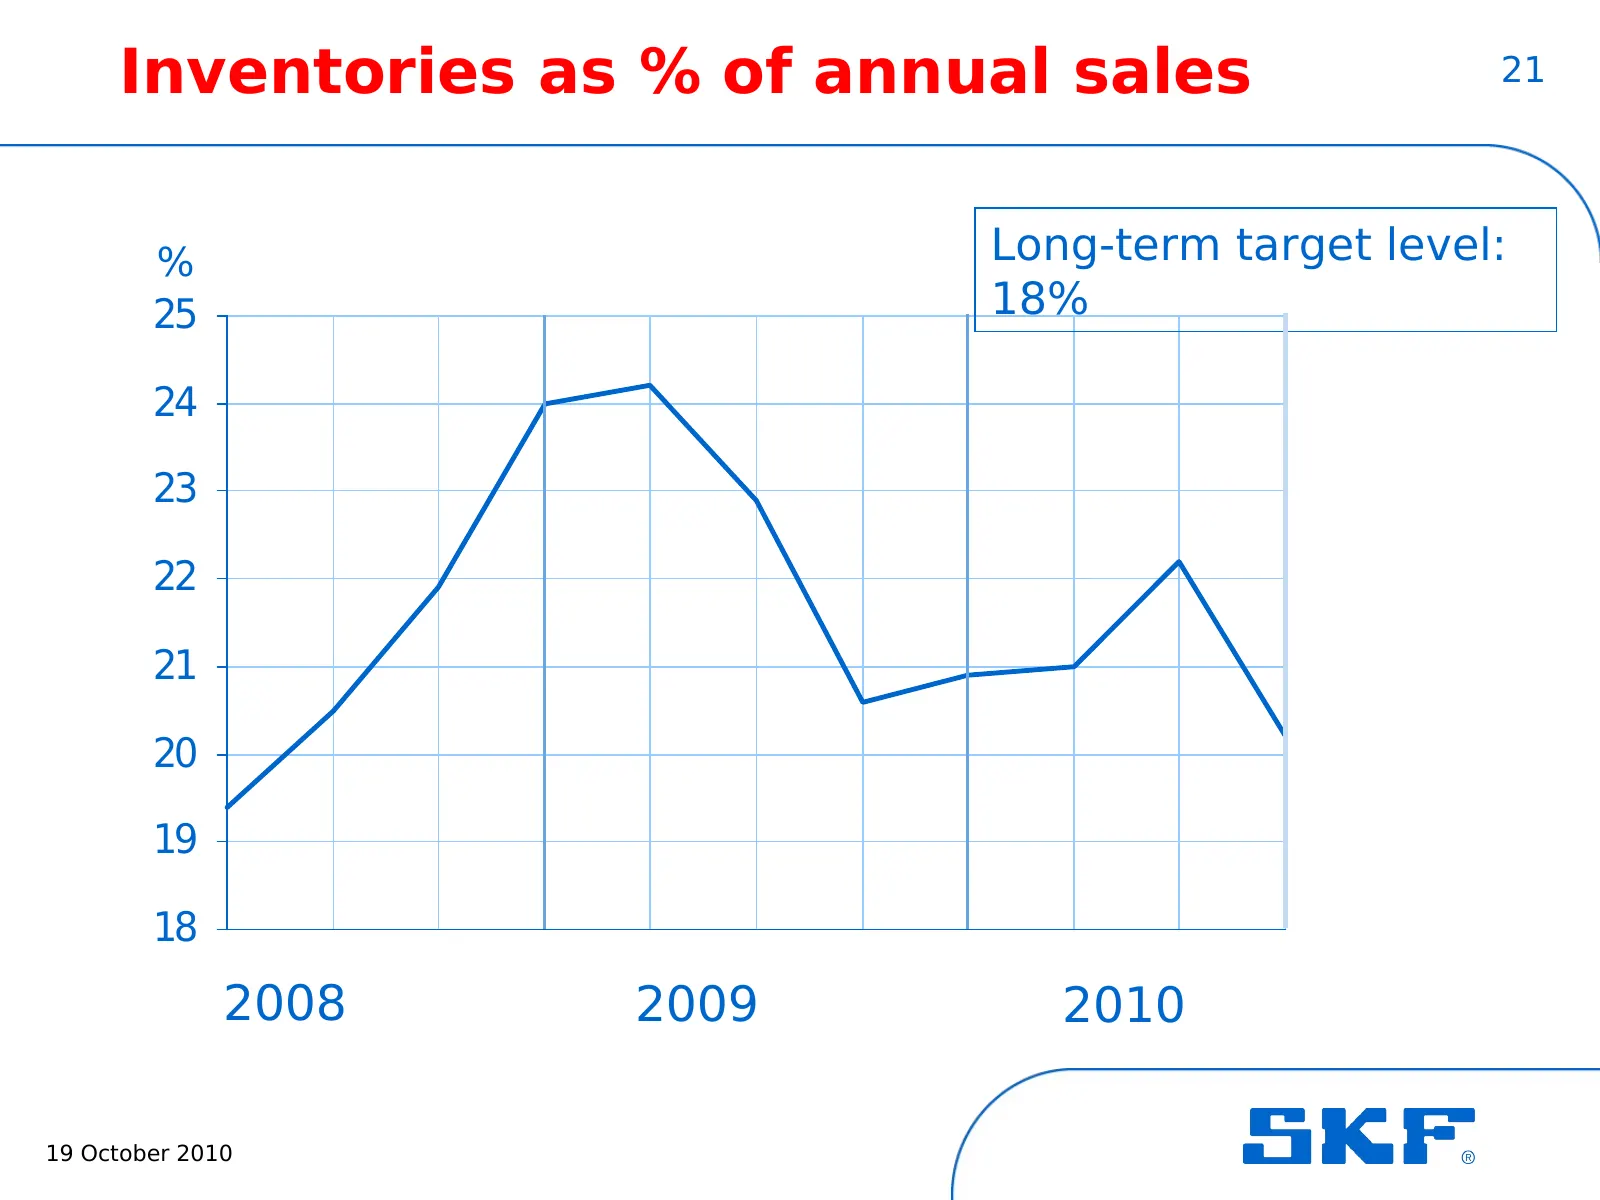
Inventories as % of annual sales 21 % Long-term target level: 25 18% 24 23 22 21 20 19 18 2008 2009 2010 19 October 2010
Slide 22: Cash flow, after investments before financial items
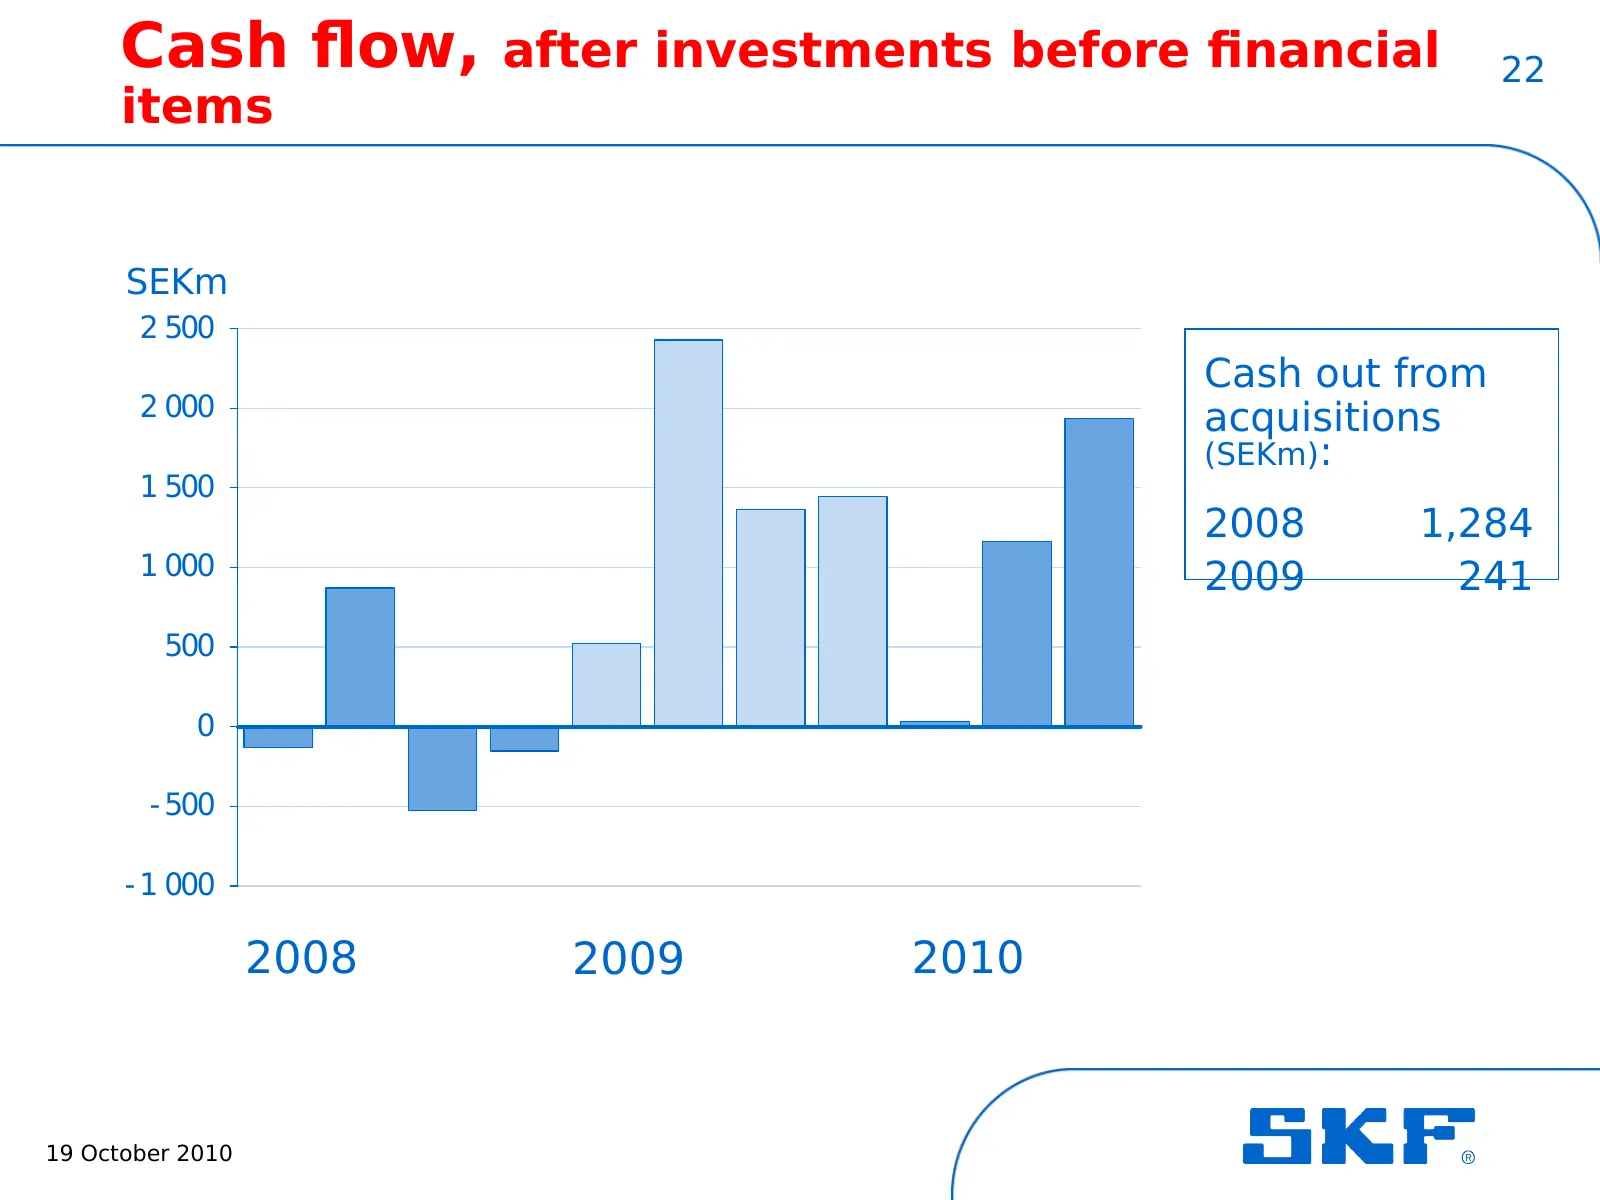
Cash flow, after investments before financial 22 items SEKm 2 500 Cash out from 2 000 acquisitions (SEKm): 1 500 2008 1,284 1 000 2009 241 500 0 - 500 - 1 000 2008 2009 2010 19 October 2010
Slide 23: Return on capital employed
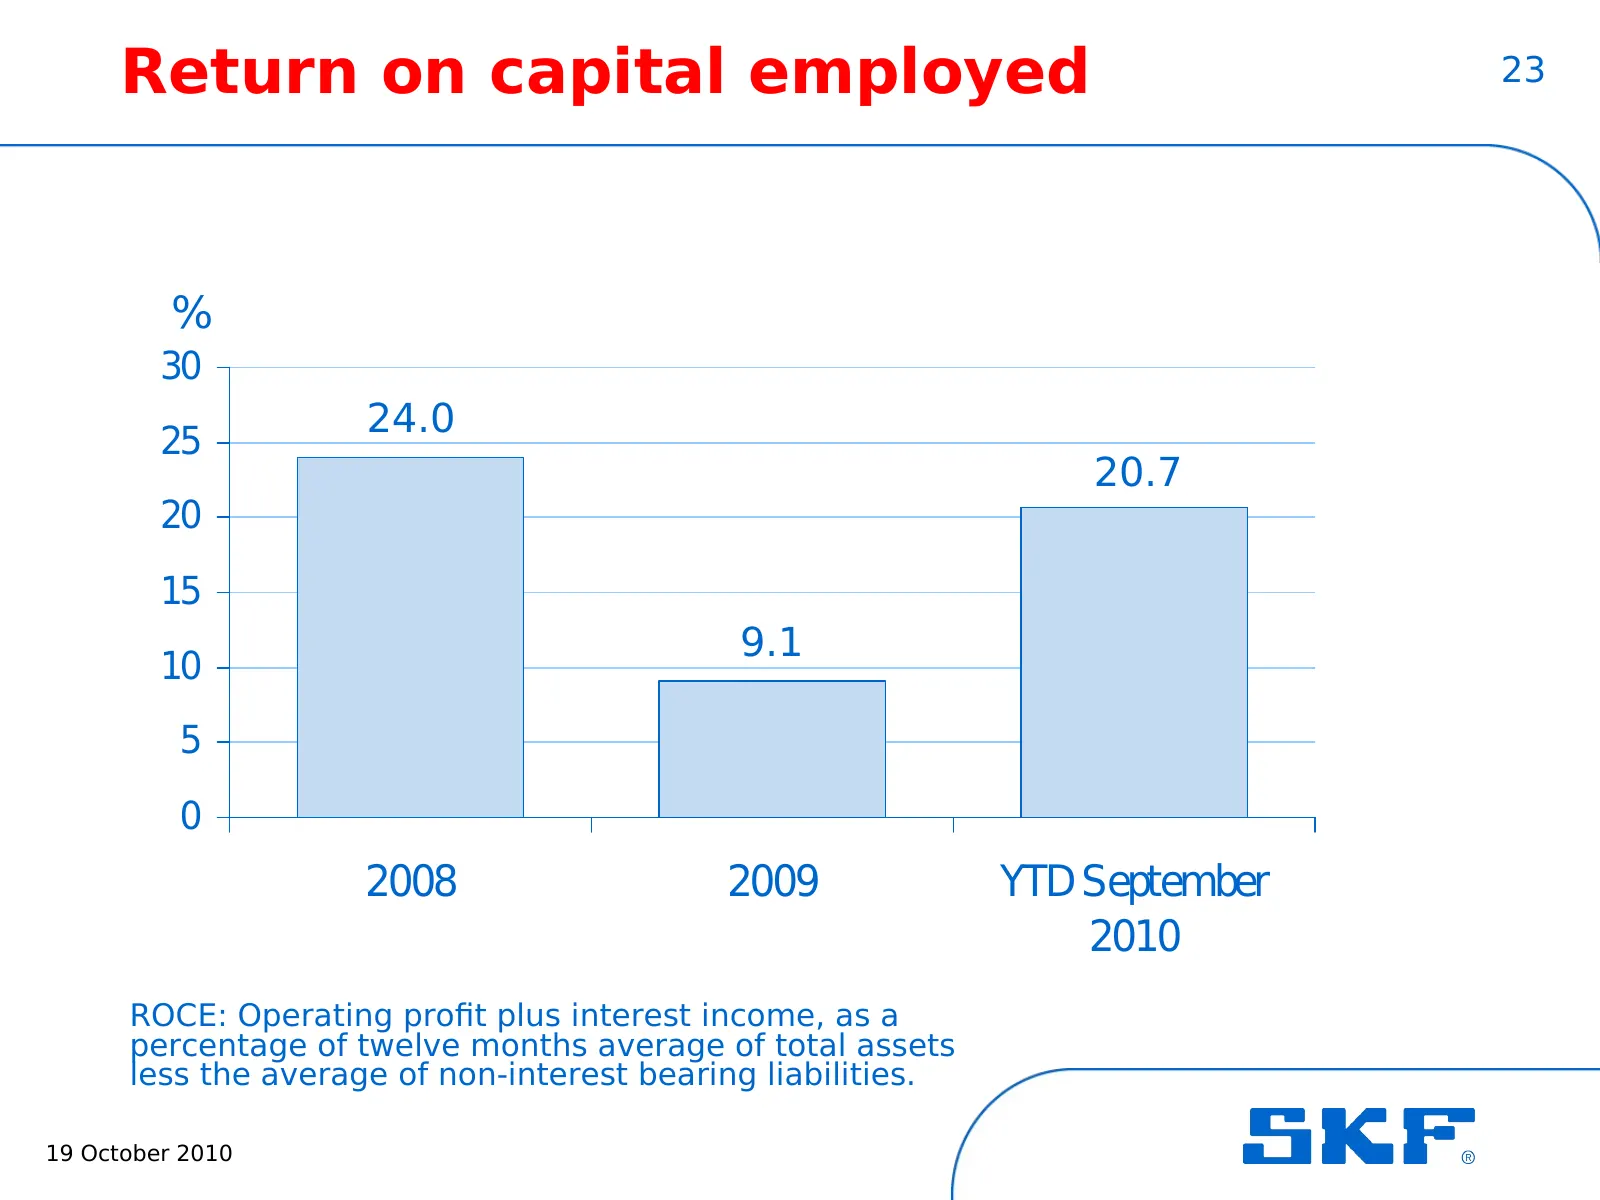
Return on capital employed 23 % 30 24.0 25 20.7 20 15 9.1 10 5 0 2008 2009 YTD September 2010 ROCE: Operating profit plus interest income, as a percentage of twelve months average of total assets less the average of non-interest bearing liabilities. 19 October 2010
Slide 24: Net debt
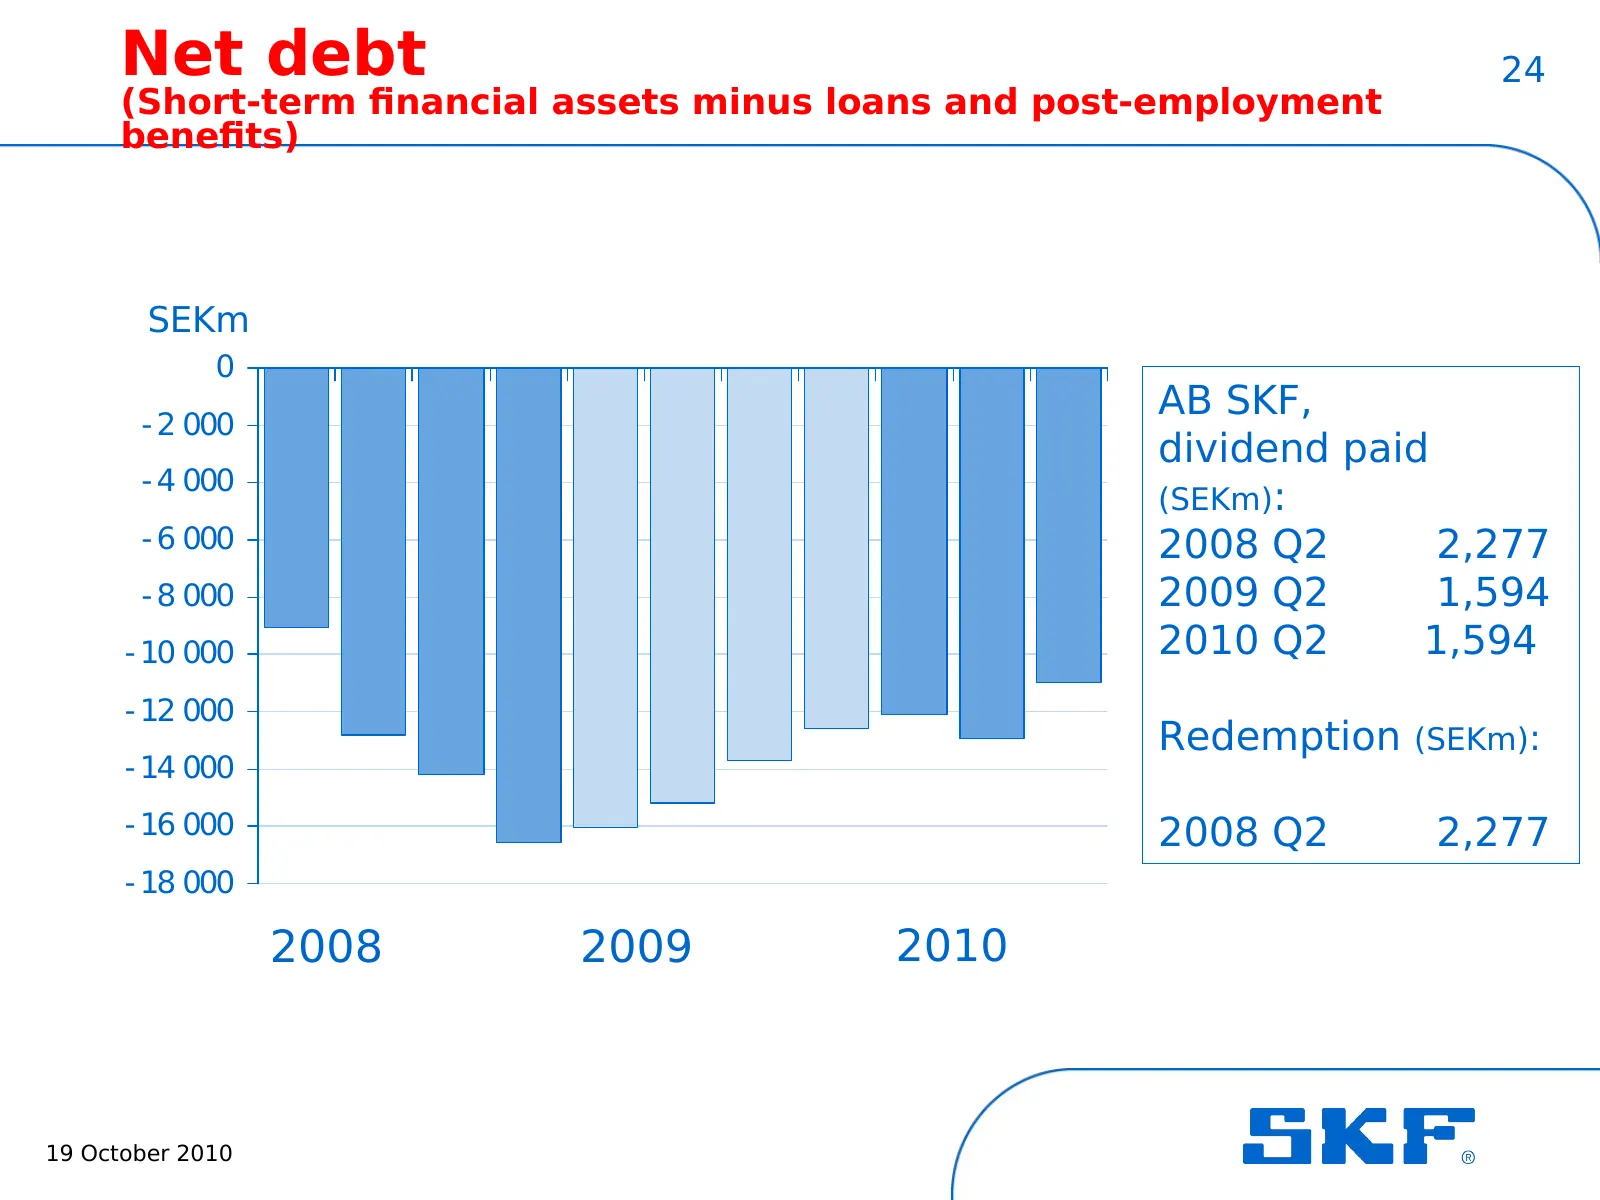
Net debt 24 (Short-term financial assets minus loans and post-employment benefits) SEKm 0 AB SKF, - 2 000 dividend paid - 4 000 (SEKm): - 6 000 2008 Q2 2,277 - 8 000 2009 Q2 1,594 - 10 000 2010 Q2 1,594 - 12 000 Redemption (SEKm): - 14 000 - 16 000 2008 Q2 2,277 - 18 000 2008 2009 2010 19 October 20
Slide 25: Debt structure
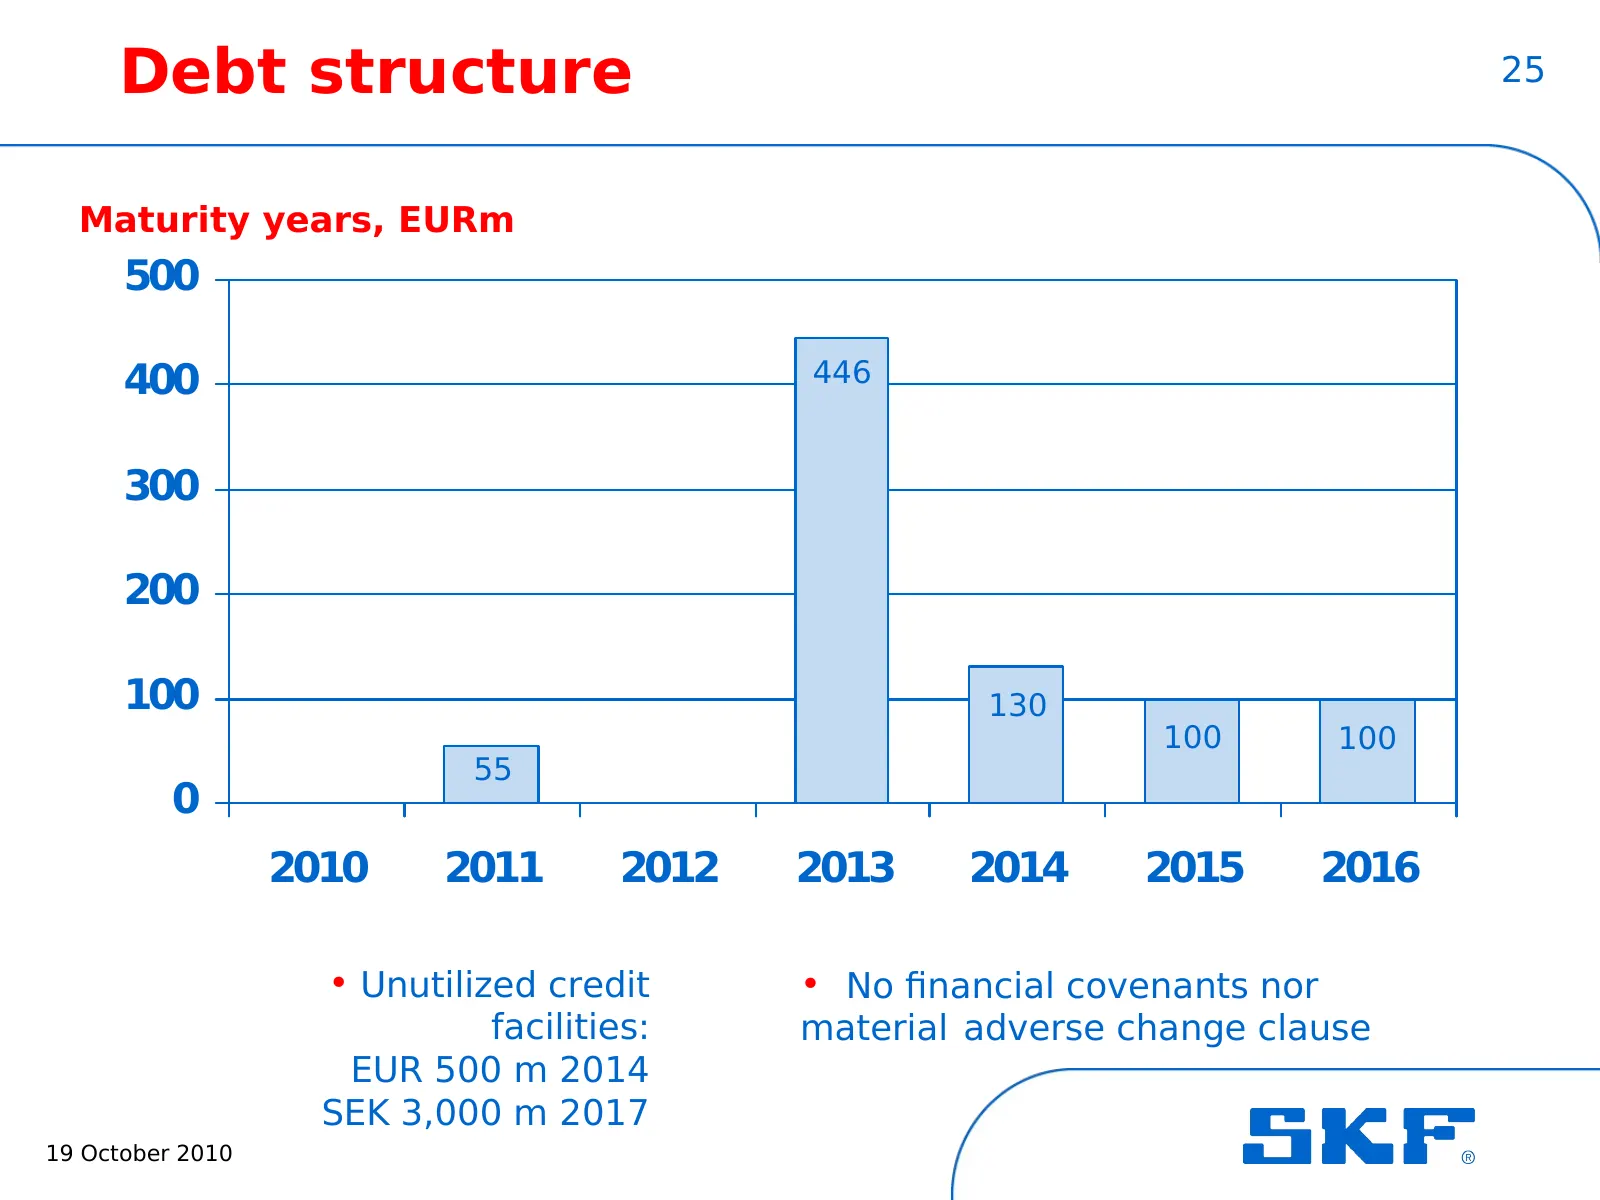
Debt structure 25 Maturity years, EURm 500 400 446 300 200 100 130 100 100 55 0 2010 2011 2012 2013 2014 2015 2016 • Unutilized credit • No financial covenants nor facilities: material adverse change clause EUR 500 m 2014 SEK 3,000 m 2017 19 October 2010
Slide 26: Outlook for the fourth quarter 2010
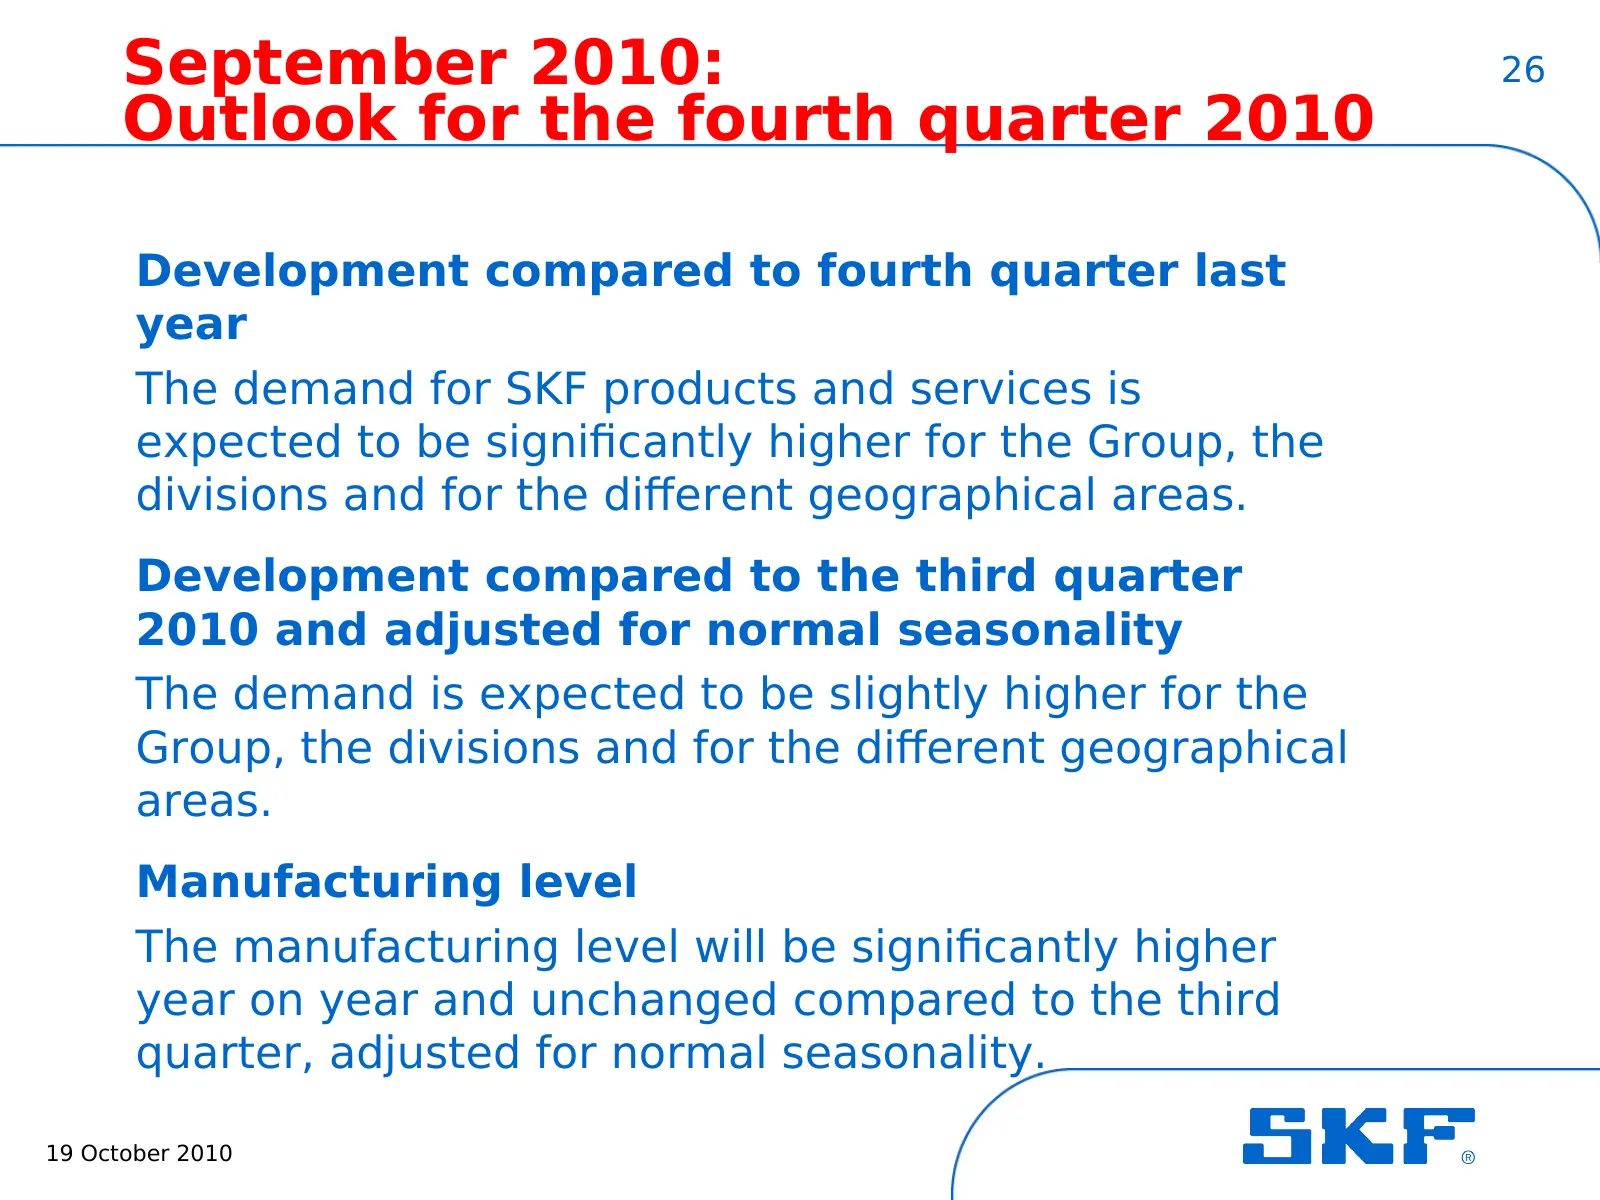
September 2010: 26 Outlook for the fourth quarter 2010 Development compared to fourth quarter last year The demand for SKF products and services is expected to be significantly higher for the Group, the divisions and for the different geographical areas. Development compared to the third quarter 201
Slide 27: Volume trends, regions
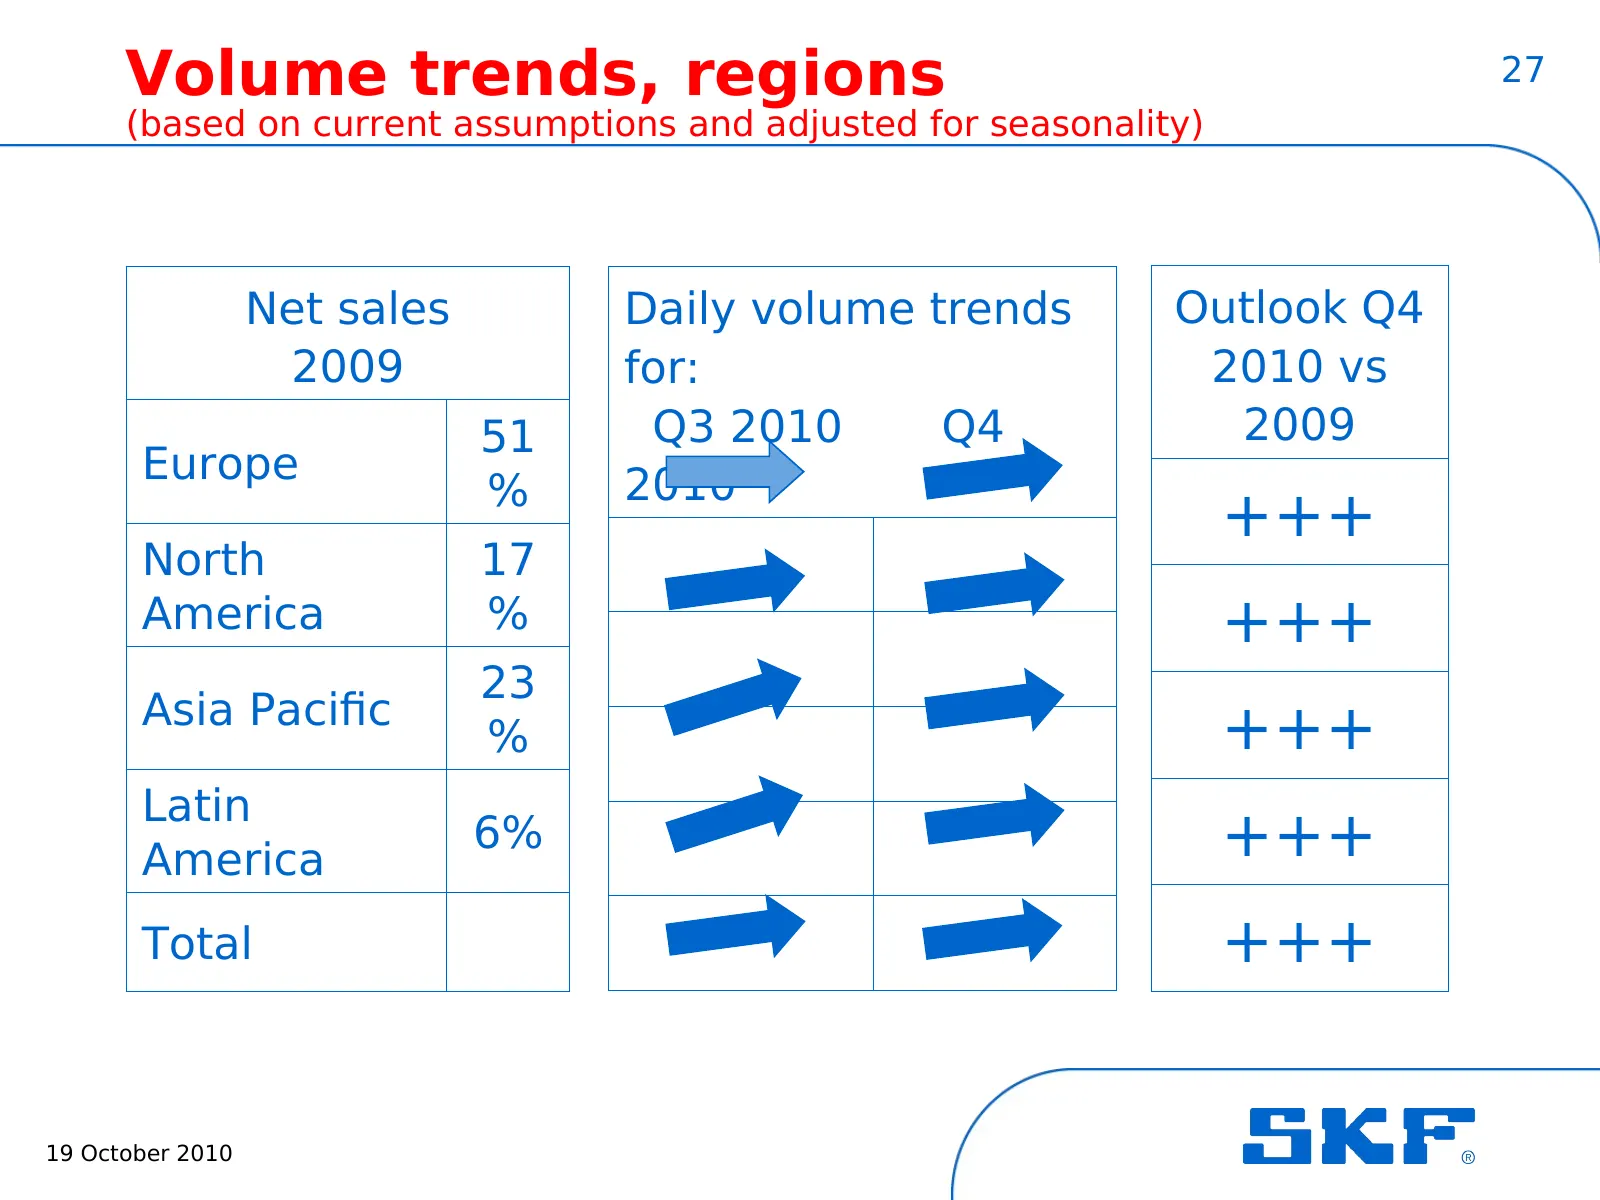
Volume trends, regions 27 (based on current assumptions and adjusted for seasonality) Net sales Daily volume trends Outlook Q4 2009 for: 2010 vs 51 Q3 2010 Q4 2009 Europe 2010 % +++ North 17 America % +++ 23 Asia Pacific % +++ Latin America 6% +++ Total +++ 19 October 2010
Slide 28: Volume trends, divisions
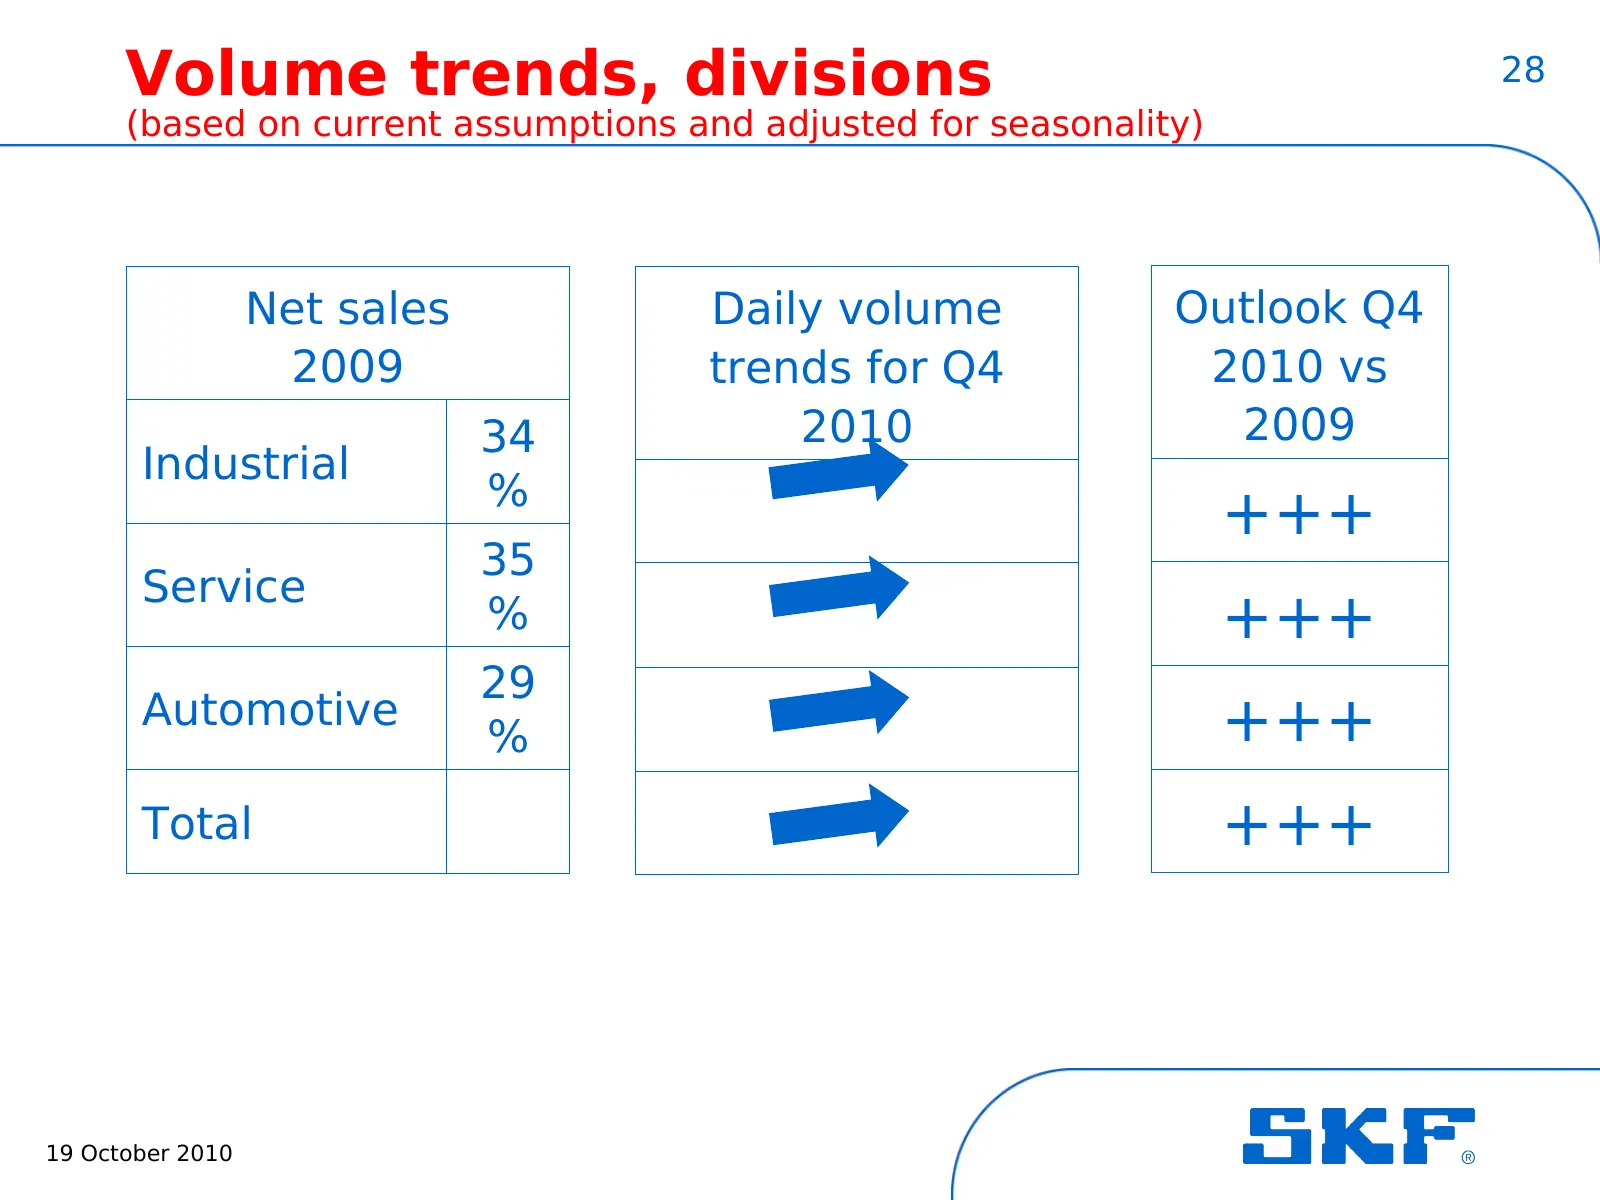
Volume trends, divisions 28 (based on current assumptions and adjusted for seasonality) Net sales Daily volume Outlook Q4 2009 trends for Q4 2010 vs 34 2010 2009 Industrial % +++ 35 Service % +++ 29 Automotive % +++ Total +++ 19 October 2010
Slide 29: Sequential volume trend main segments Q4 2010
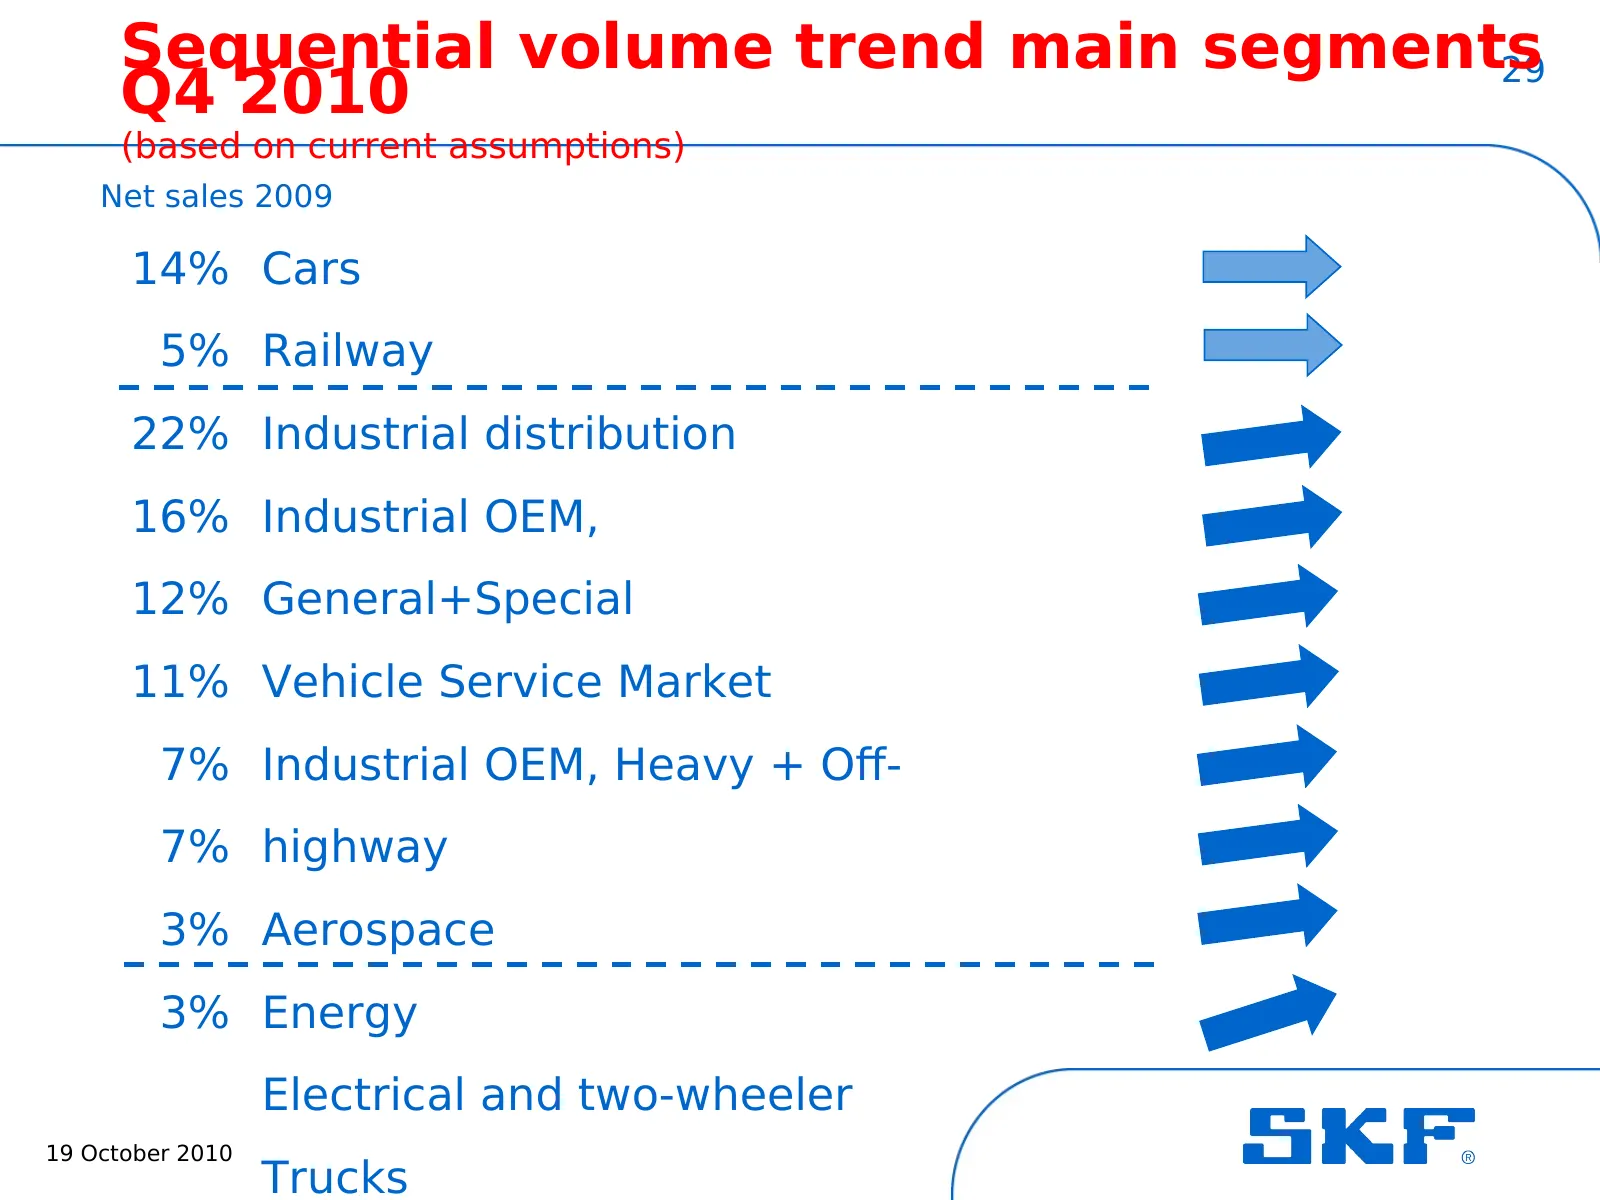
Sequential volume trend main segments 29 Q4 2010 (based on current assumptions) Net sales 2009 14% Cars 5% Railway 22% Industrial distribution 16% Industrial OEM, 12% General+Special 11% Vehicle Service Market 7% Industrial OEM, Heavy + Off- 7% highway 3% Aerospace 3% Energy Electrical and two-wheel
Slide 30: Guidance for the fourth quarter 2010
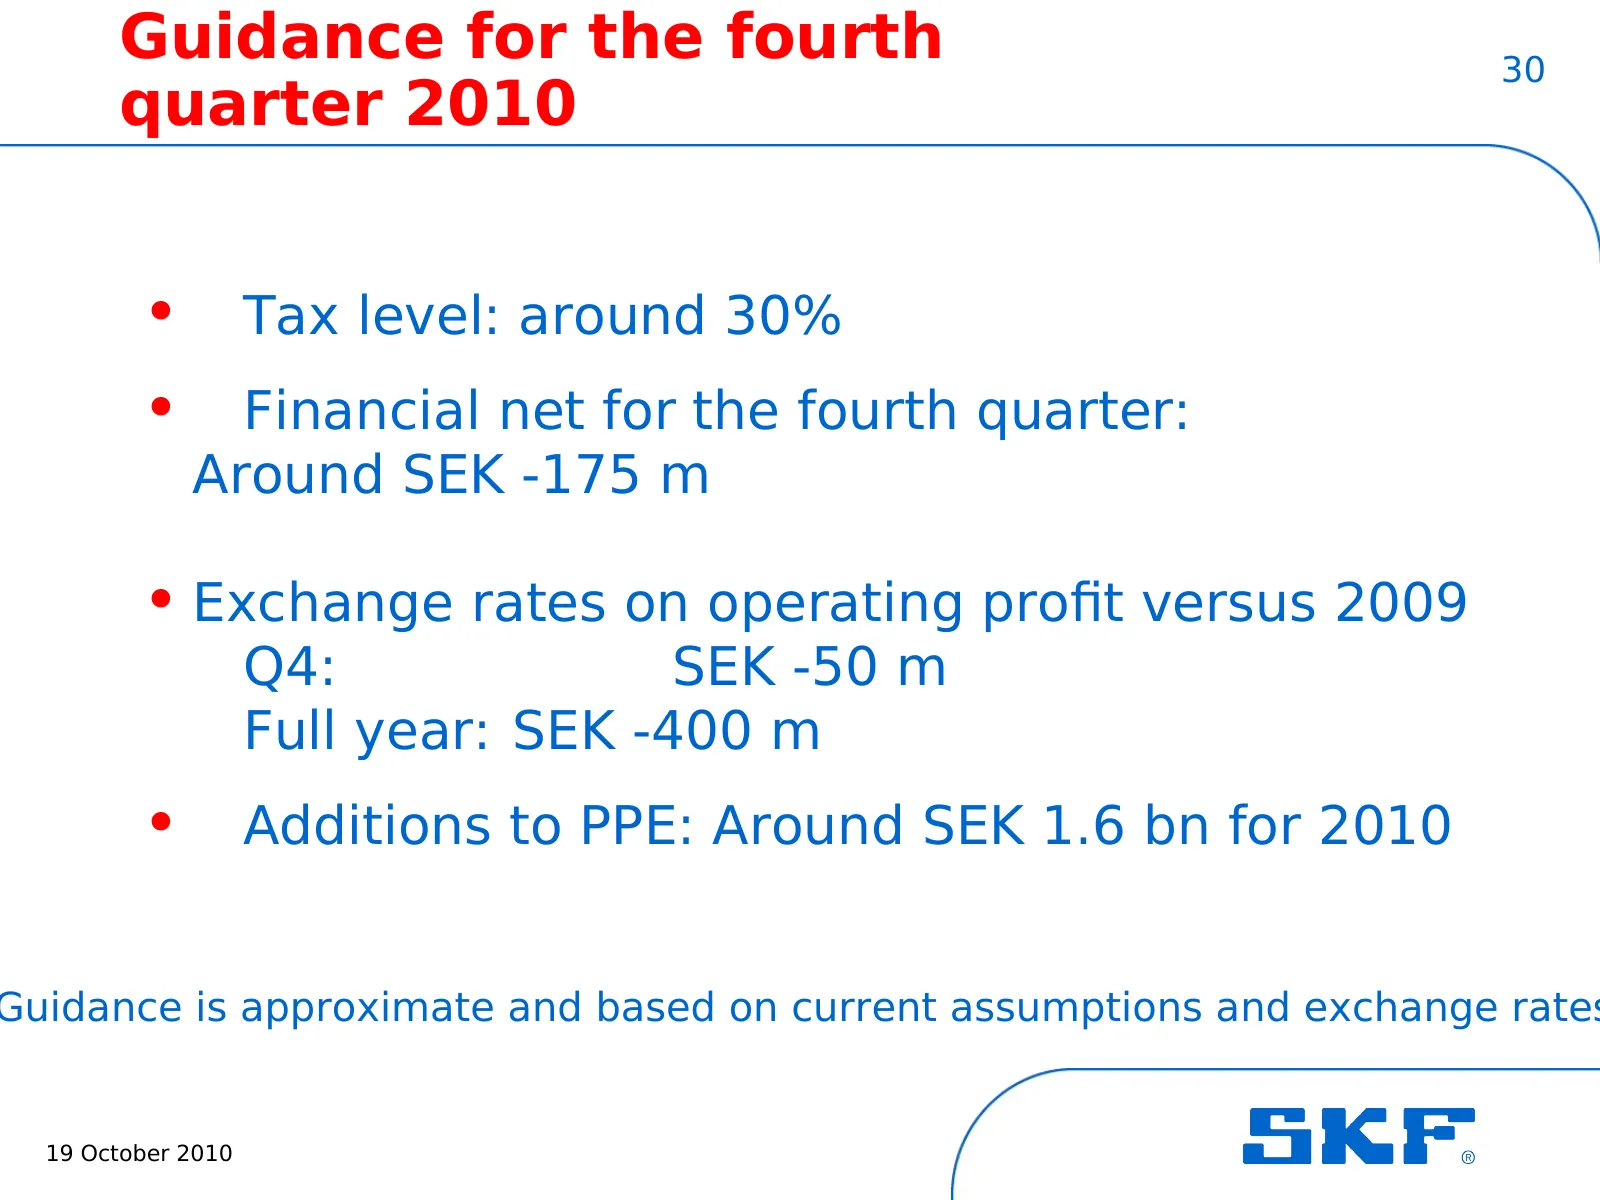
Guidance for the fourth 30 quarter 2010 • Tax level: around 30% • Financial net for the fourth quarter: Around SEK -175 m • Exchange rates on operating profit versus 2009 Q4: SEK -50 m Full year: SEK -400 m • Additions to PPE: Around SEK 1.6 bn for 2010 Guidance is approximate and based on current a
Slide 31: Agenda
31 Agenda • Nine-months report and outlook • New financial targets • Acquisition of Lincoln Industrial 19 October 2010
Slide 32: SKF Group performance
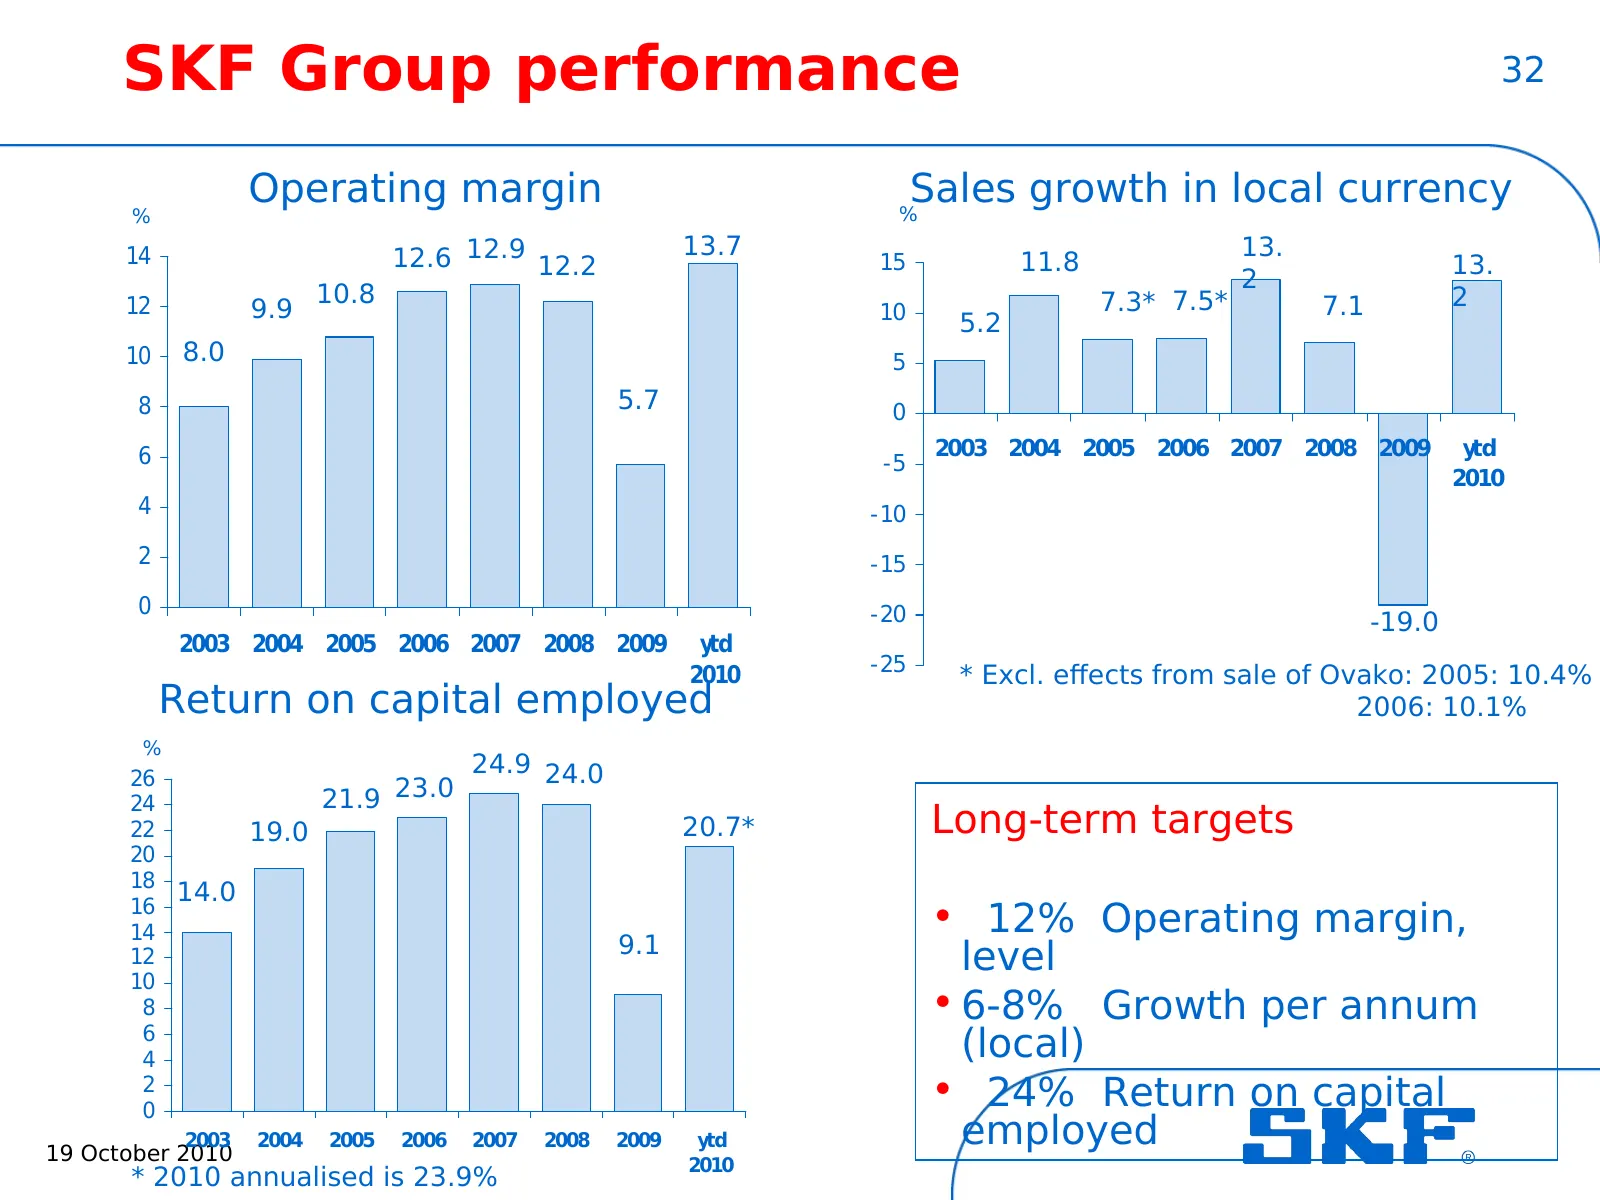
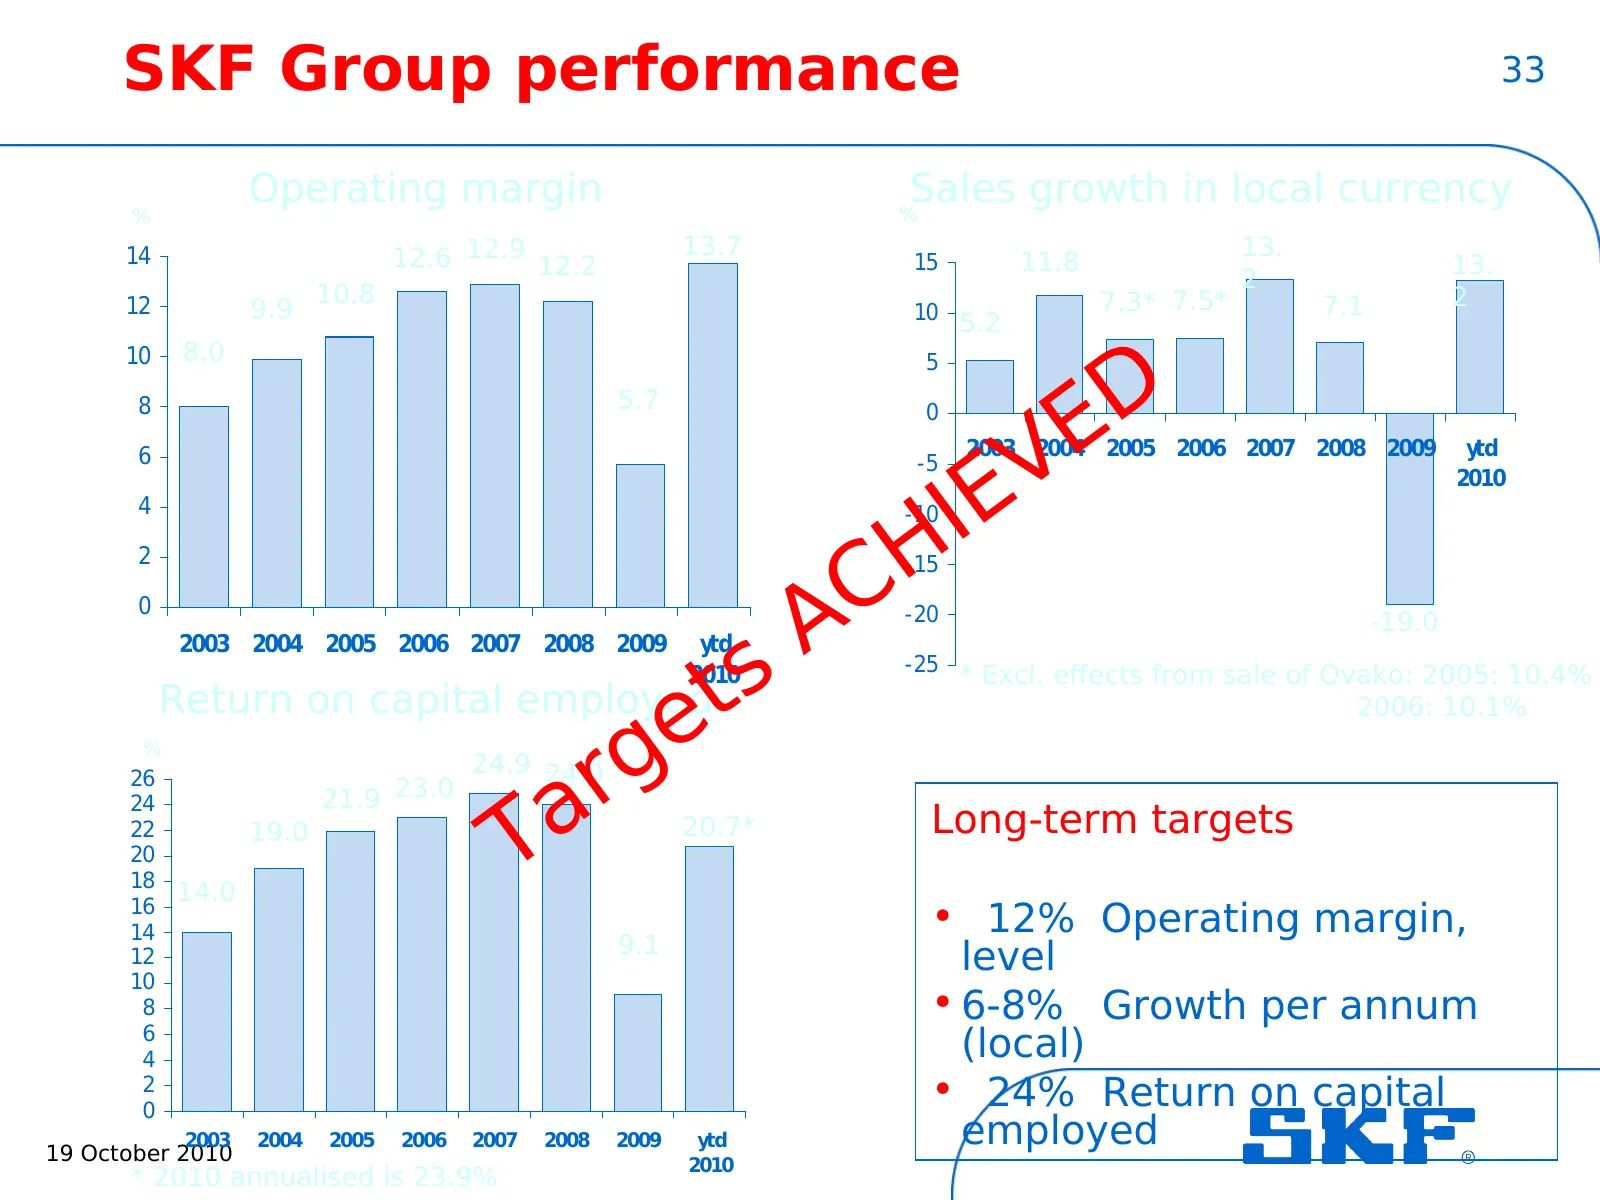
SKF Group performance 32 Operating margin % Sales growth in local currency % 14 12.6 12.9 12.2 13.7 13. 15 11.8 13. 2 12 10.8 7.3* 7.5* 7.1 2 9.9 10 5.2 10 8.0 5 8 5.7 0 6 2003 2004 2005 2006 2007 2008 2009 ytd -5 2010 4 -10 2 -15 0 -20 -19.0 2003 2004 2005 2006 2007 2008 2009 ytd 2010 -25 * Excl. e
Slide 33: SKF Group performance
SKF Group performance 33 Operating margin Sales growth in local currency % % 14 12.6 12.9 12.2 13.7 13. 15 11.8 13. 2 12 10.8 7.3* 7.5* 7.1 2 9.9 10 5.2 10 8.0 D 5 E 8 5.7 0 6 -5 EV 2003 2004 2005 2006 2007 2008 2009 ytd I 2010 4 H -10 C 2 -15 0 A -20 -19.0 Return on capital employed ts 2003 2004 20
Slide 34: New financial targets
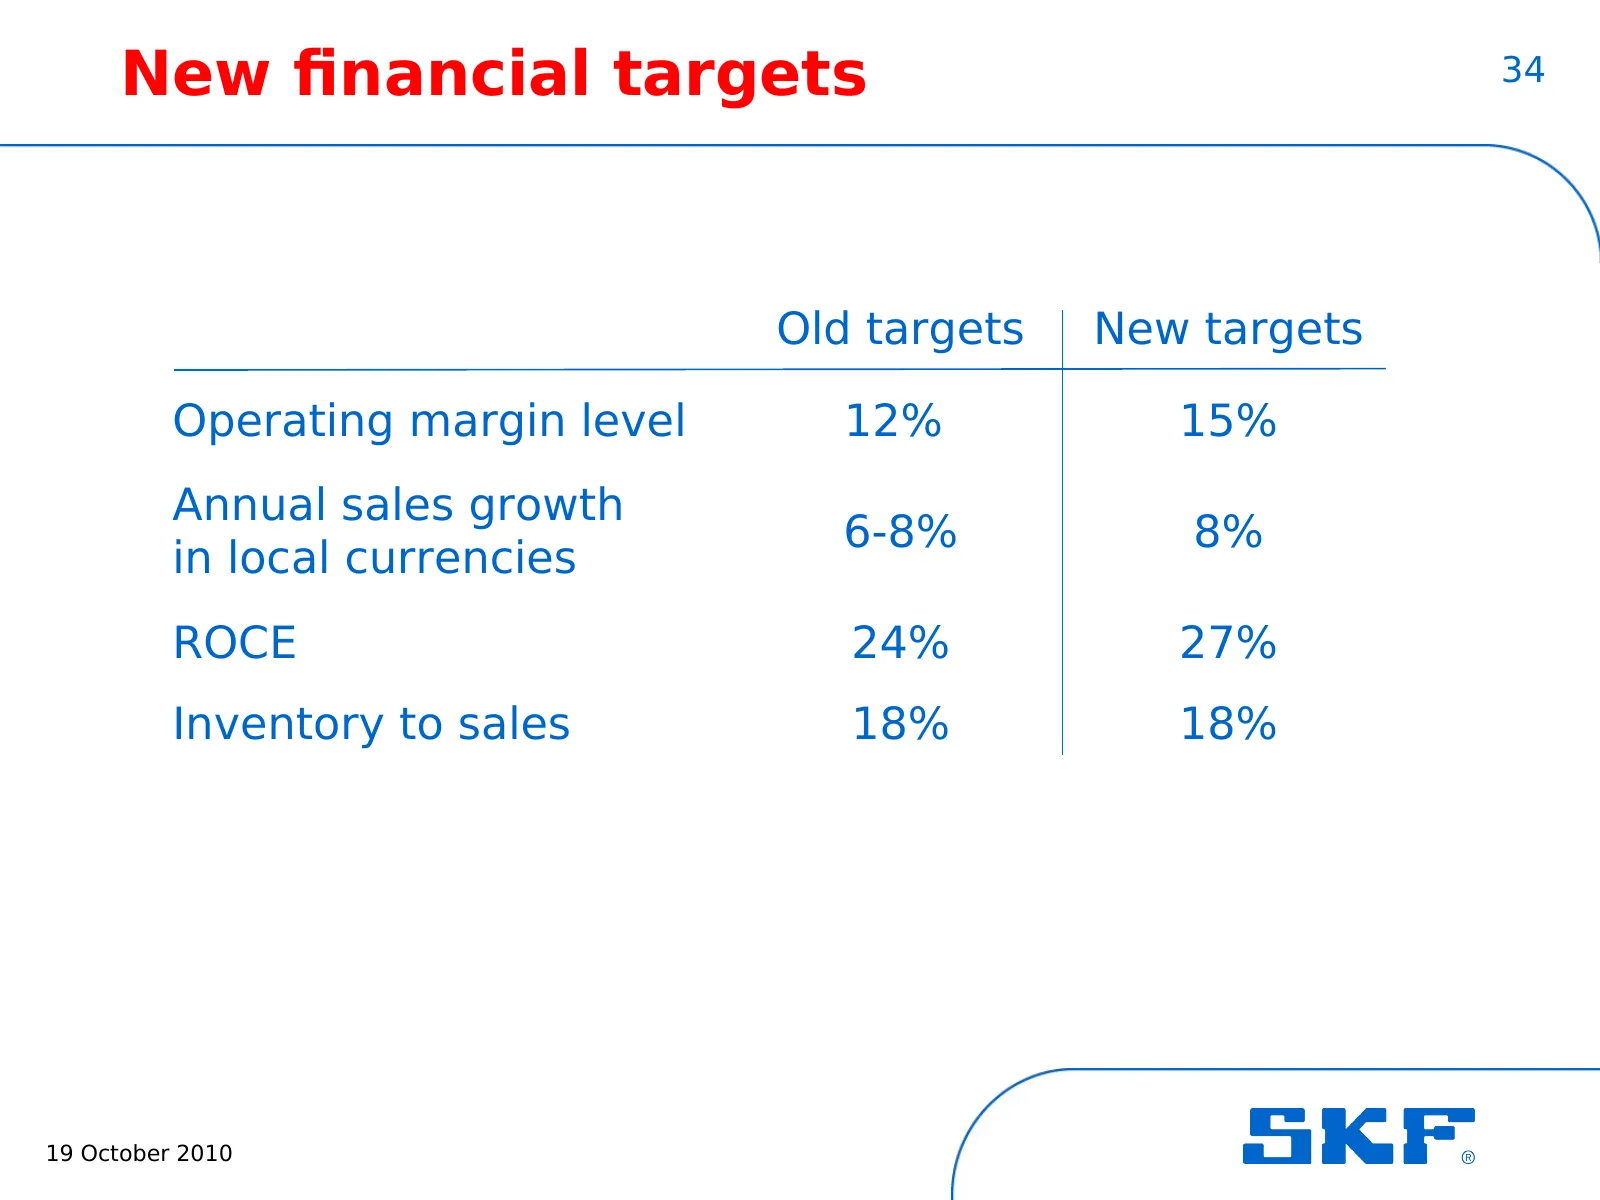
New financial targets 34 Old targets New targets Operating margin level 12% 15% Annual sales growth 6-8% 8% in local currencies ROCE 24% 27% Inventory to sales 18% 18% 19 October 2010
Slide 35: SKF Group, long-term view
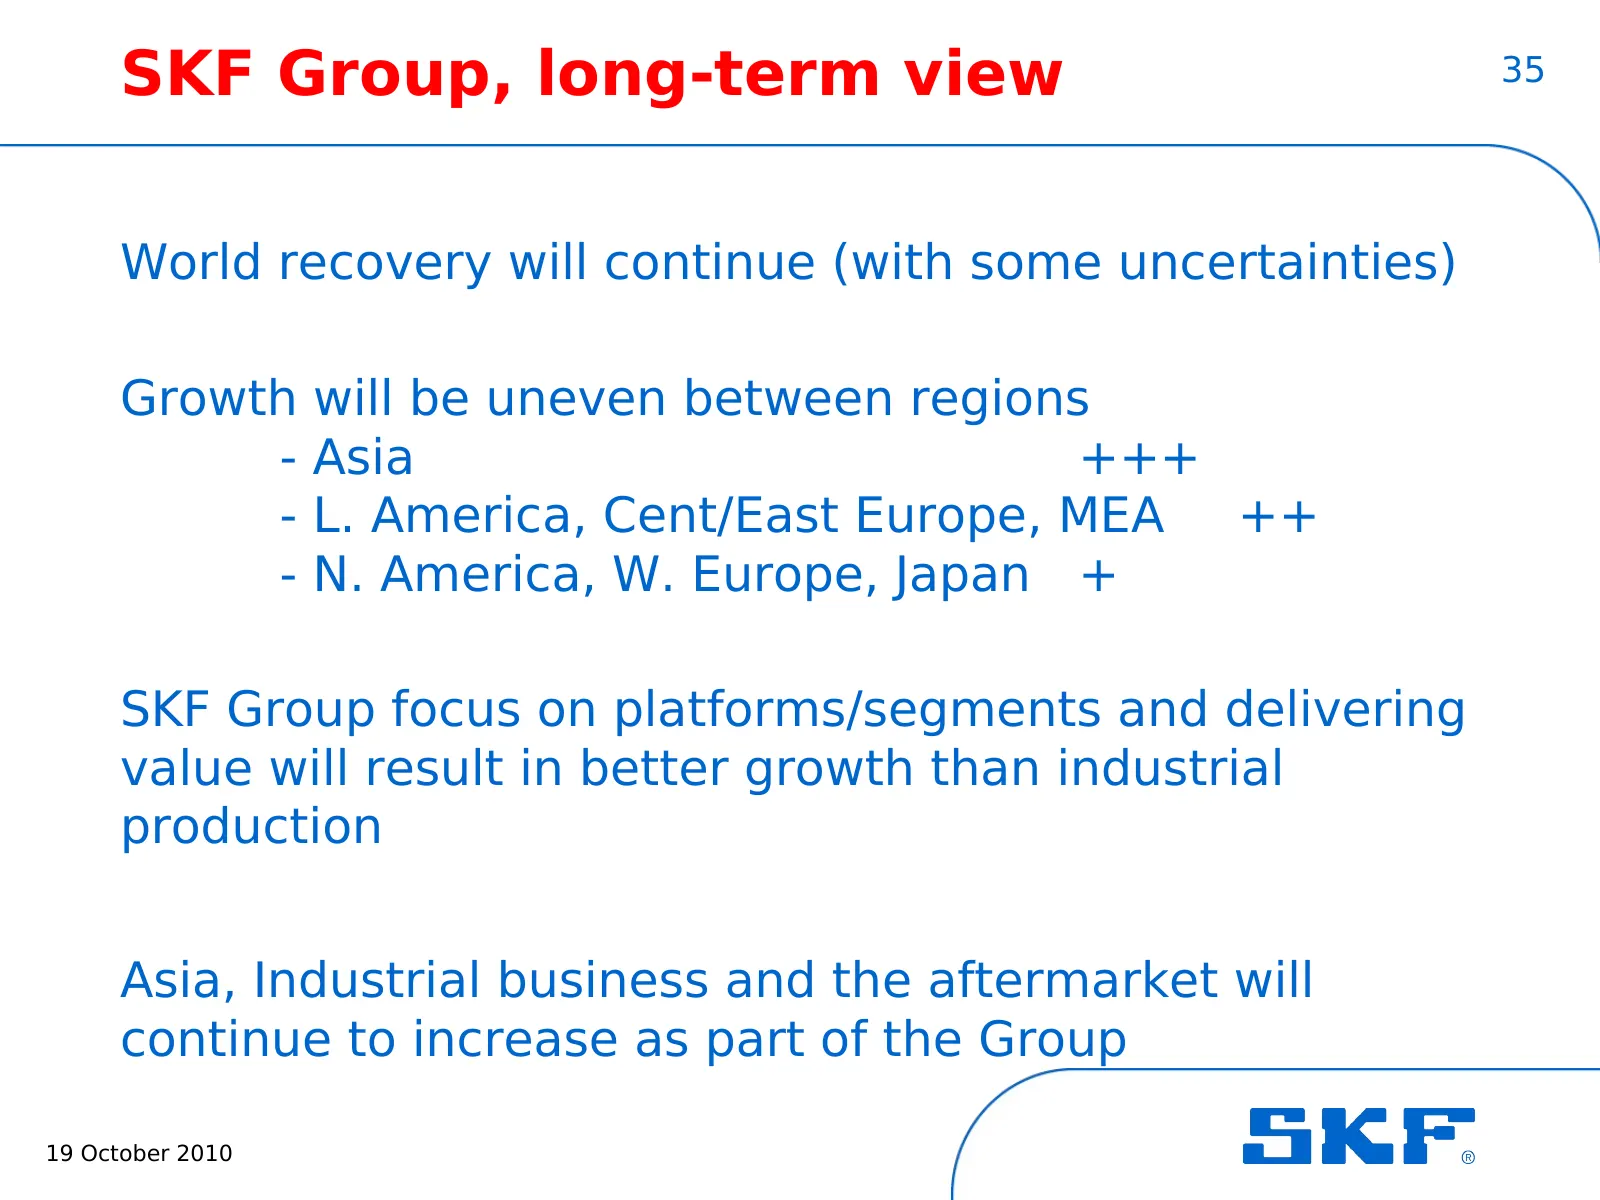
SKF Group, long-term view 35 World recovery will continue (with some uncertainties) Growth will be uneven between regions - Asia +++ - L. America, Cent/East Europe, MEA ++ - N. America, W. Europe, Japan + SKF Group focus on platforms/segments and delivering value will result in better growth than in
Slide 36: SKF's business strategy for long-term profitable growth
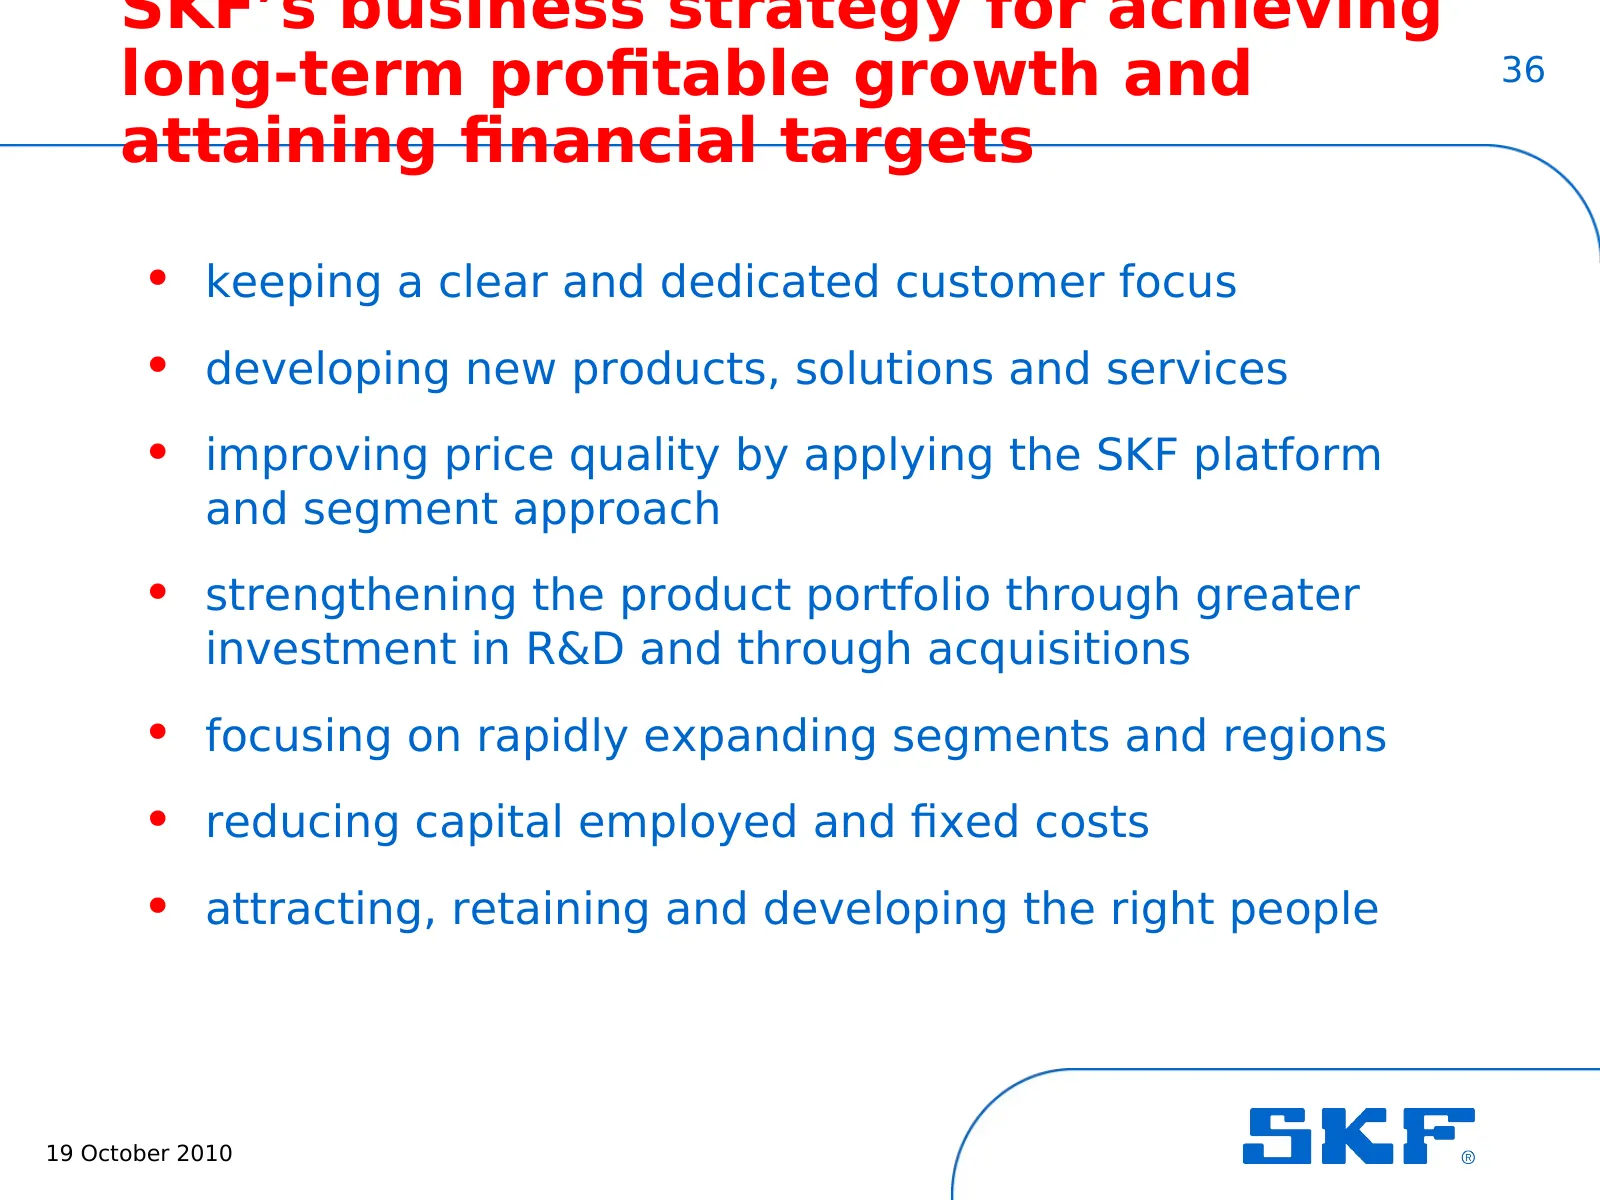
SKF’s business strategy for achieving long-term profitable growth and 36 attaining financial targets • keeping a clear and dedicated customer focus • developing new products, solutions and services • improving price quality by applying the SKF platform and segment approach • strengthening the produc
Slide 37: Main initiatives going forward
Main initiatives going forward 37 • Accelerate profitable growth • Reduce cost and eliminate waste • Invest for growth One SKF and SKF Care as guiding lights 19 October 2010
Slide 38: Main actions going forward
Main actions going forward 38 Accelerate profitable growth • Continue to strengthen the platform/segment approach • Increase the development, launch and commercialisation of new offerings (green) • Value based selling – using Documented Solutions Programme • Strengthen our service business • Acquisi
Slide 39: Main actions going forward
Main actions going forward 39 Reduce cost and eliminate waste • Build on Manufacturing Excellence into other areas - Business Excellence • Increased manufacturing and sourcing in Best Cost Countries • Reduce product cost through ICR* activities * ICR means Integrated Cost Reduction 19 October 2010
Slide 40: Main actions going forward
Main actions going forward 40 Invest for growth • Increase sales and engineering resources • Additional factories in growth markets • Additional SKF Solution Factories • Increase spending in R&D and improve global network - accelerate plans for India and China 19 October 2010
Slide 41: Main initiatives going forward
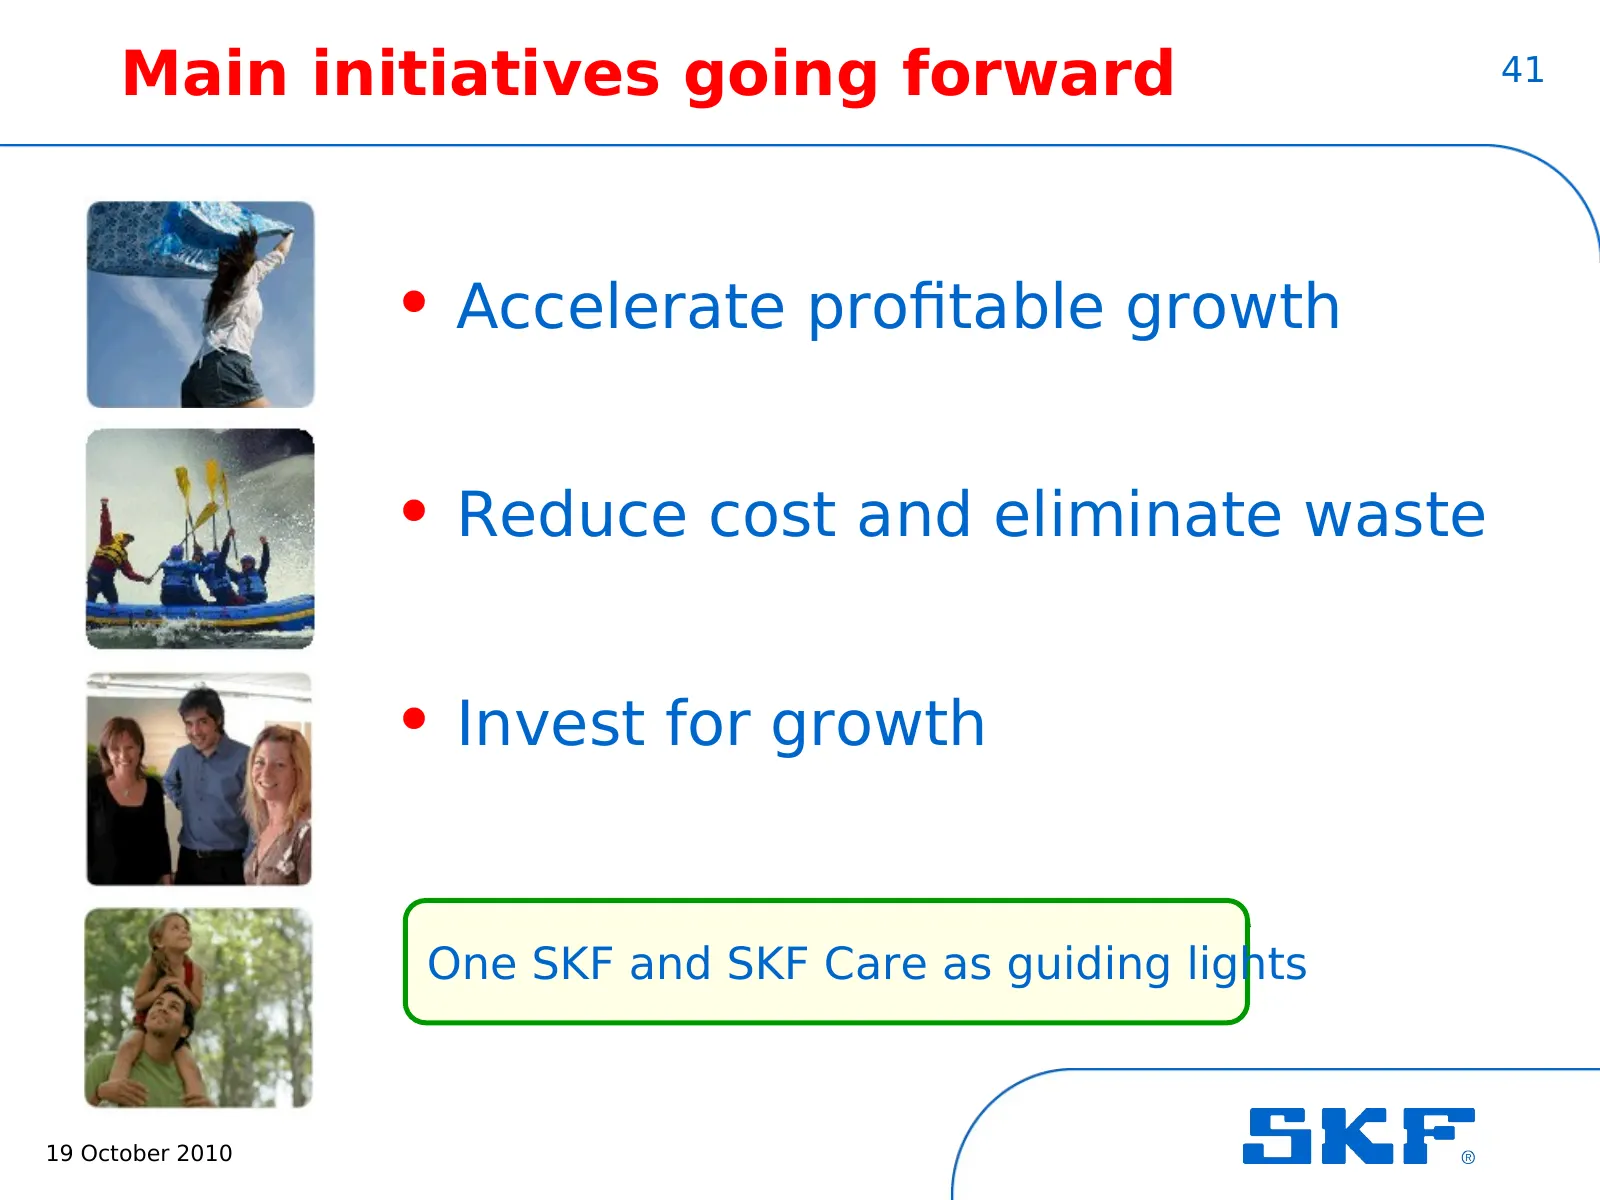
Main initiatives going forward 41 • Accelerate profitable growth • Reduce cost and eliminate waste • Invest for growth One SKF and SKF Care as guiding lights 19 October 2010
Slide 42: SKF Group – operating margin development
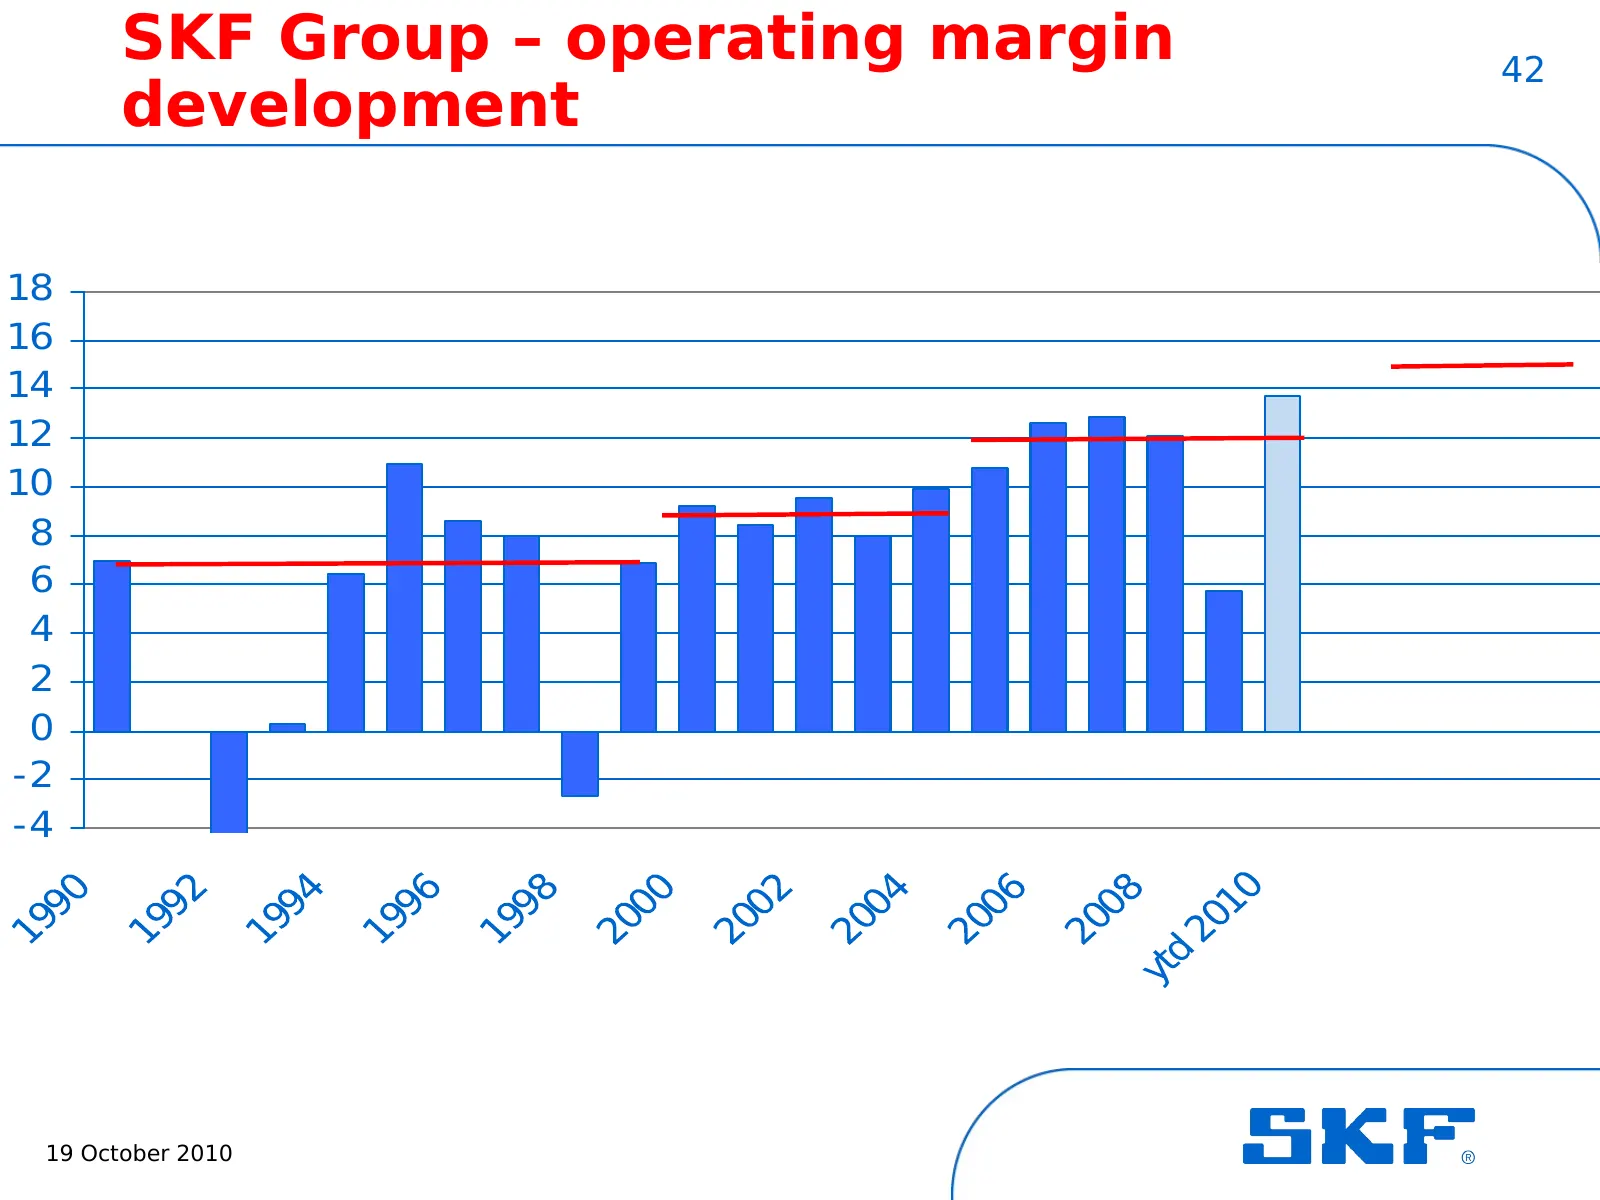
SKF Group – operating margin 42 development 18 16 14 12 10 8 6 4 2 0 -2 -4 19 October 2010
Slide 43: SKF Group – sales development (in local currencies)
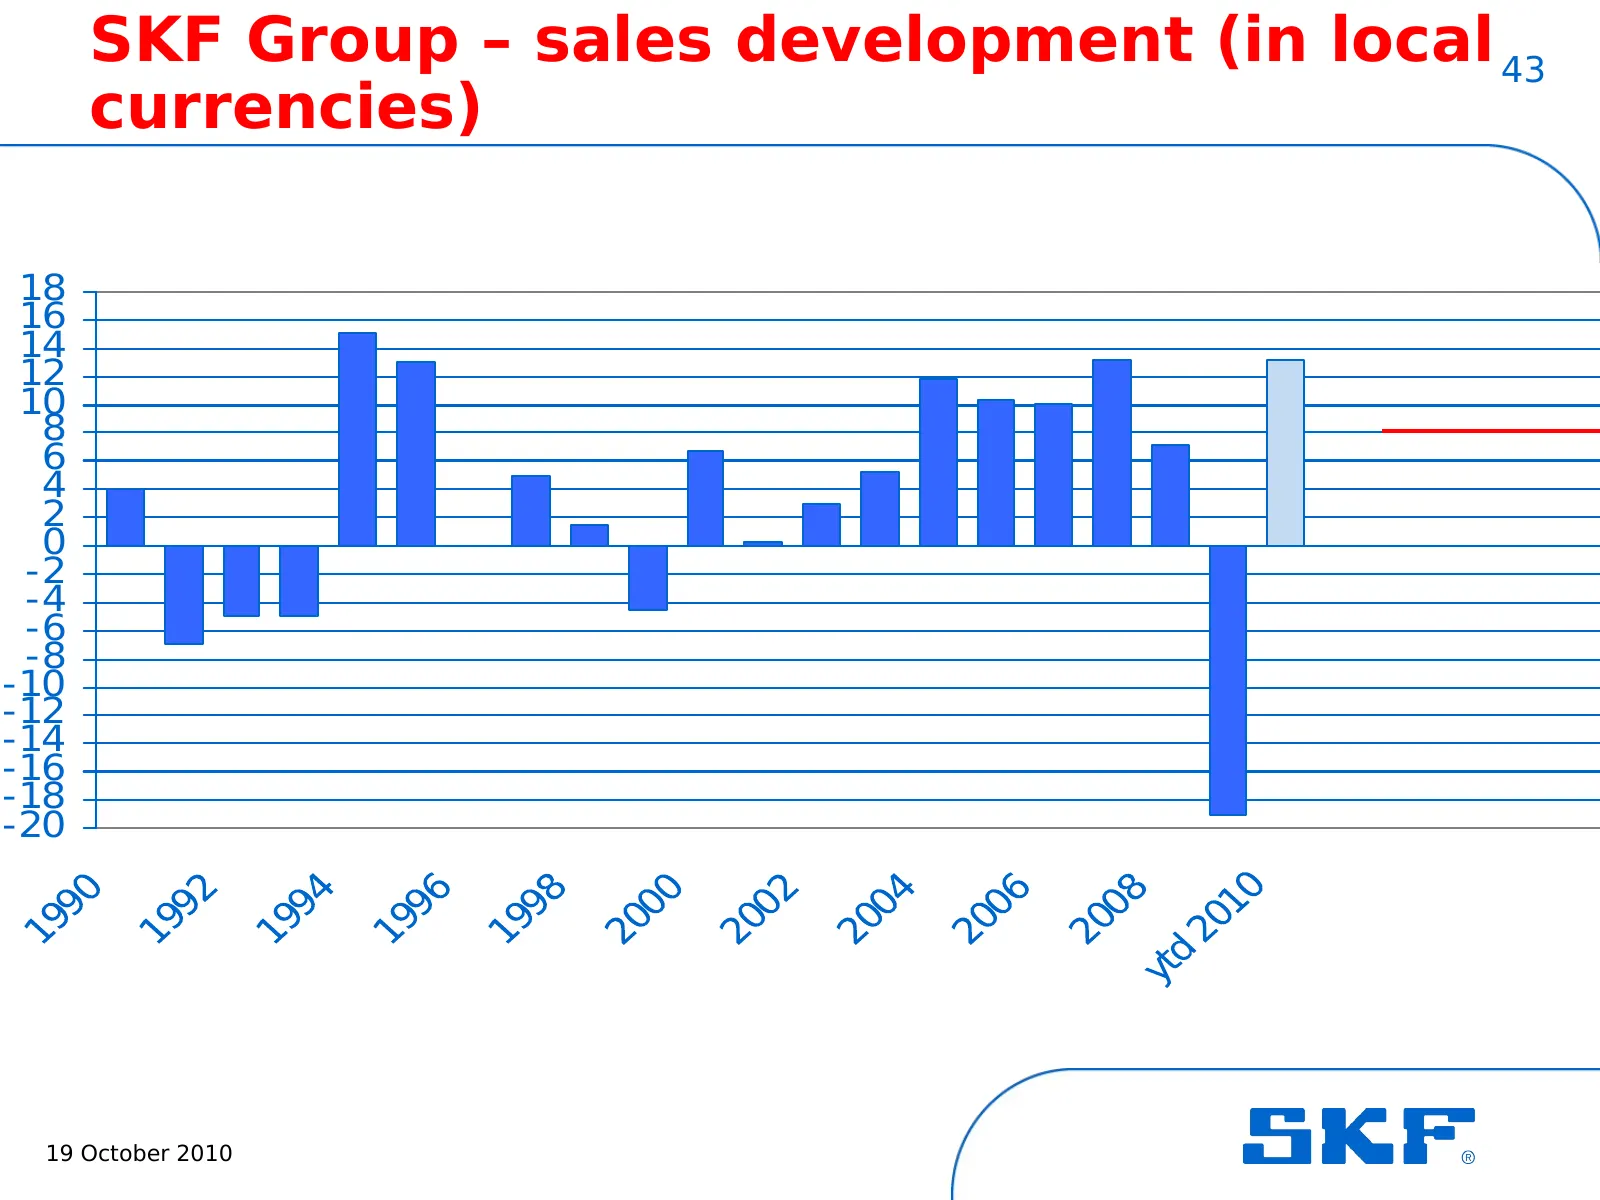
SKF Group – sales development (in local 43 currencies) 18 16 14 12 10 8 6 4 2 0 -2 -4 -6 -8 -10 -12 -14 -16 -18 -20 19 October 2010
Slide 44: New SKF long-term financial targets
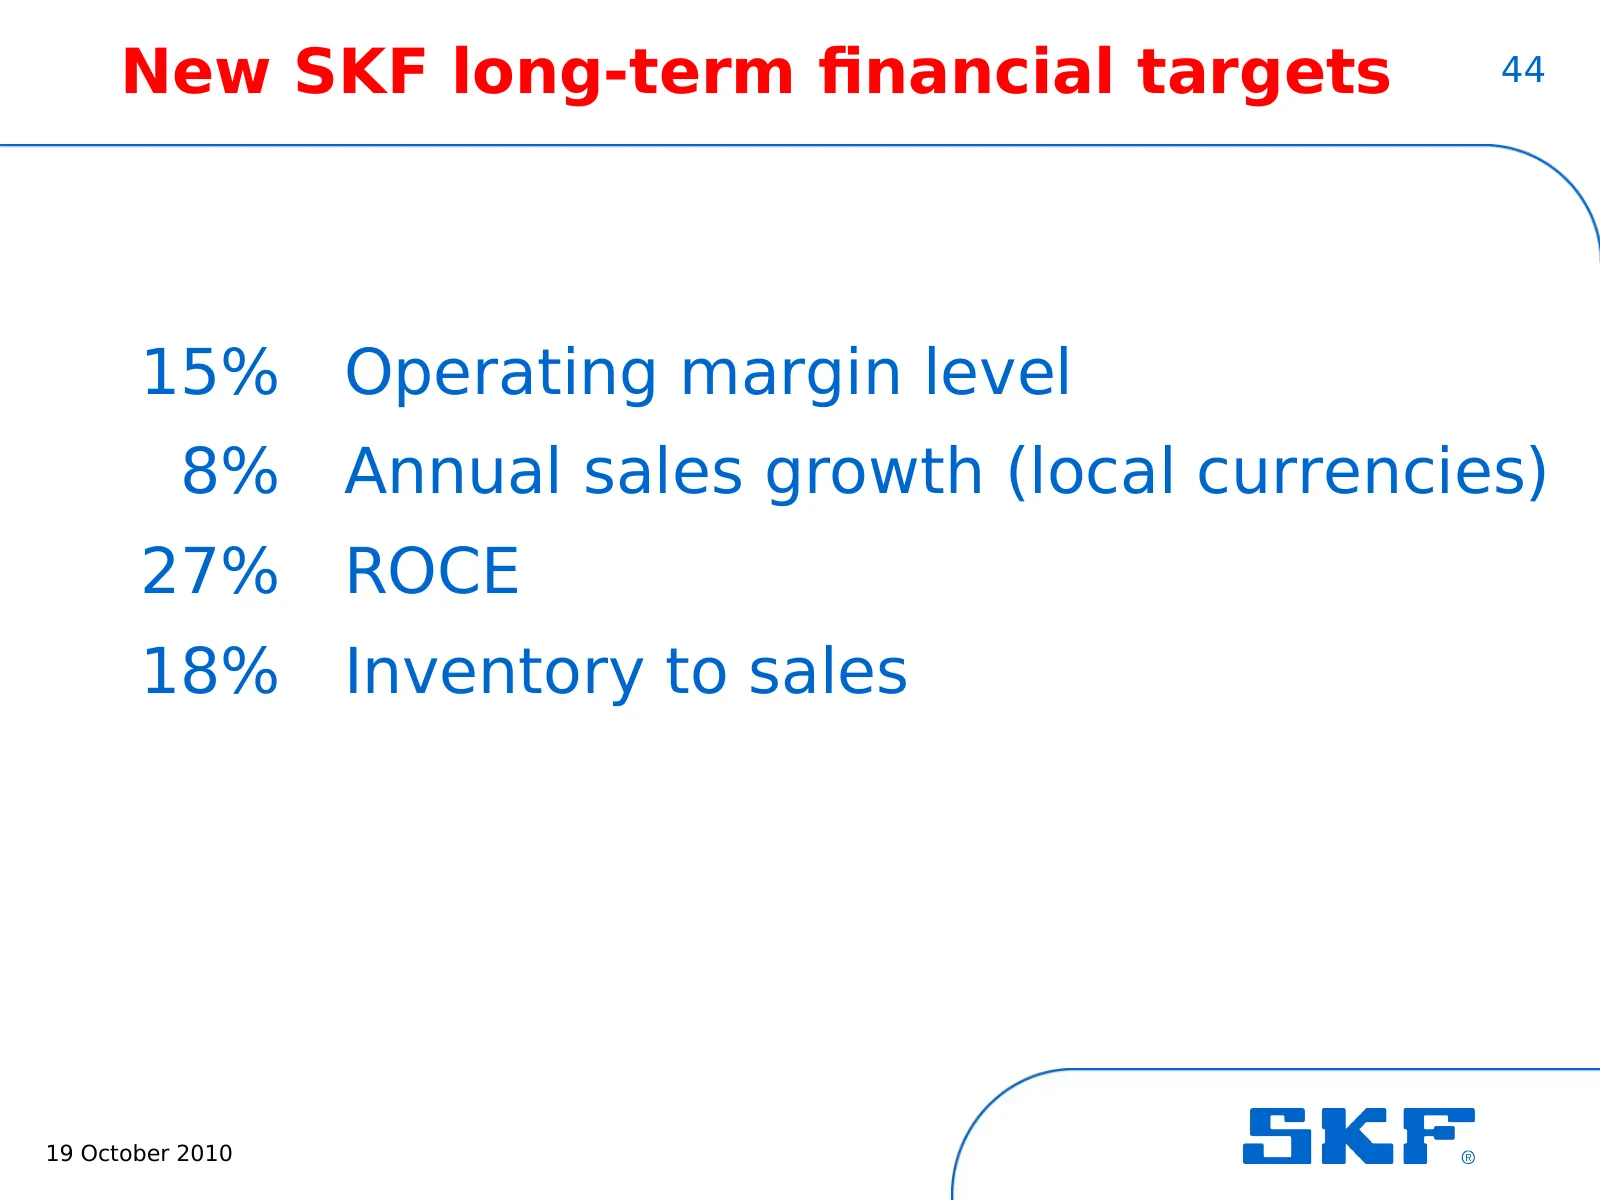
New SKF long-term financial targets 44 15% Operating margin level 8% Annual sales growth (local currencies) 27% ROCE 18% Inventory to sales 19 October 2010
Slide 45: Agenda
45 Agenda • Nine-months report and outlook • New financial targets • Acquisition of Lincoln Industrial 19 October 2010
Slide 46: SKF Group Vision
SKF Group Vision 46 To equip the world with SKF knowledge 19 October 2010
Slide 47: What is SKF knowledge?
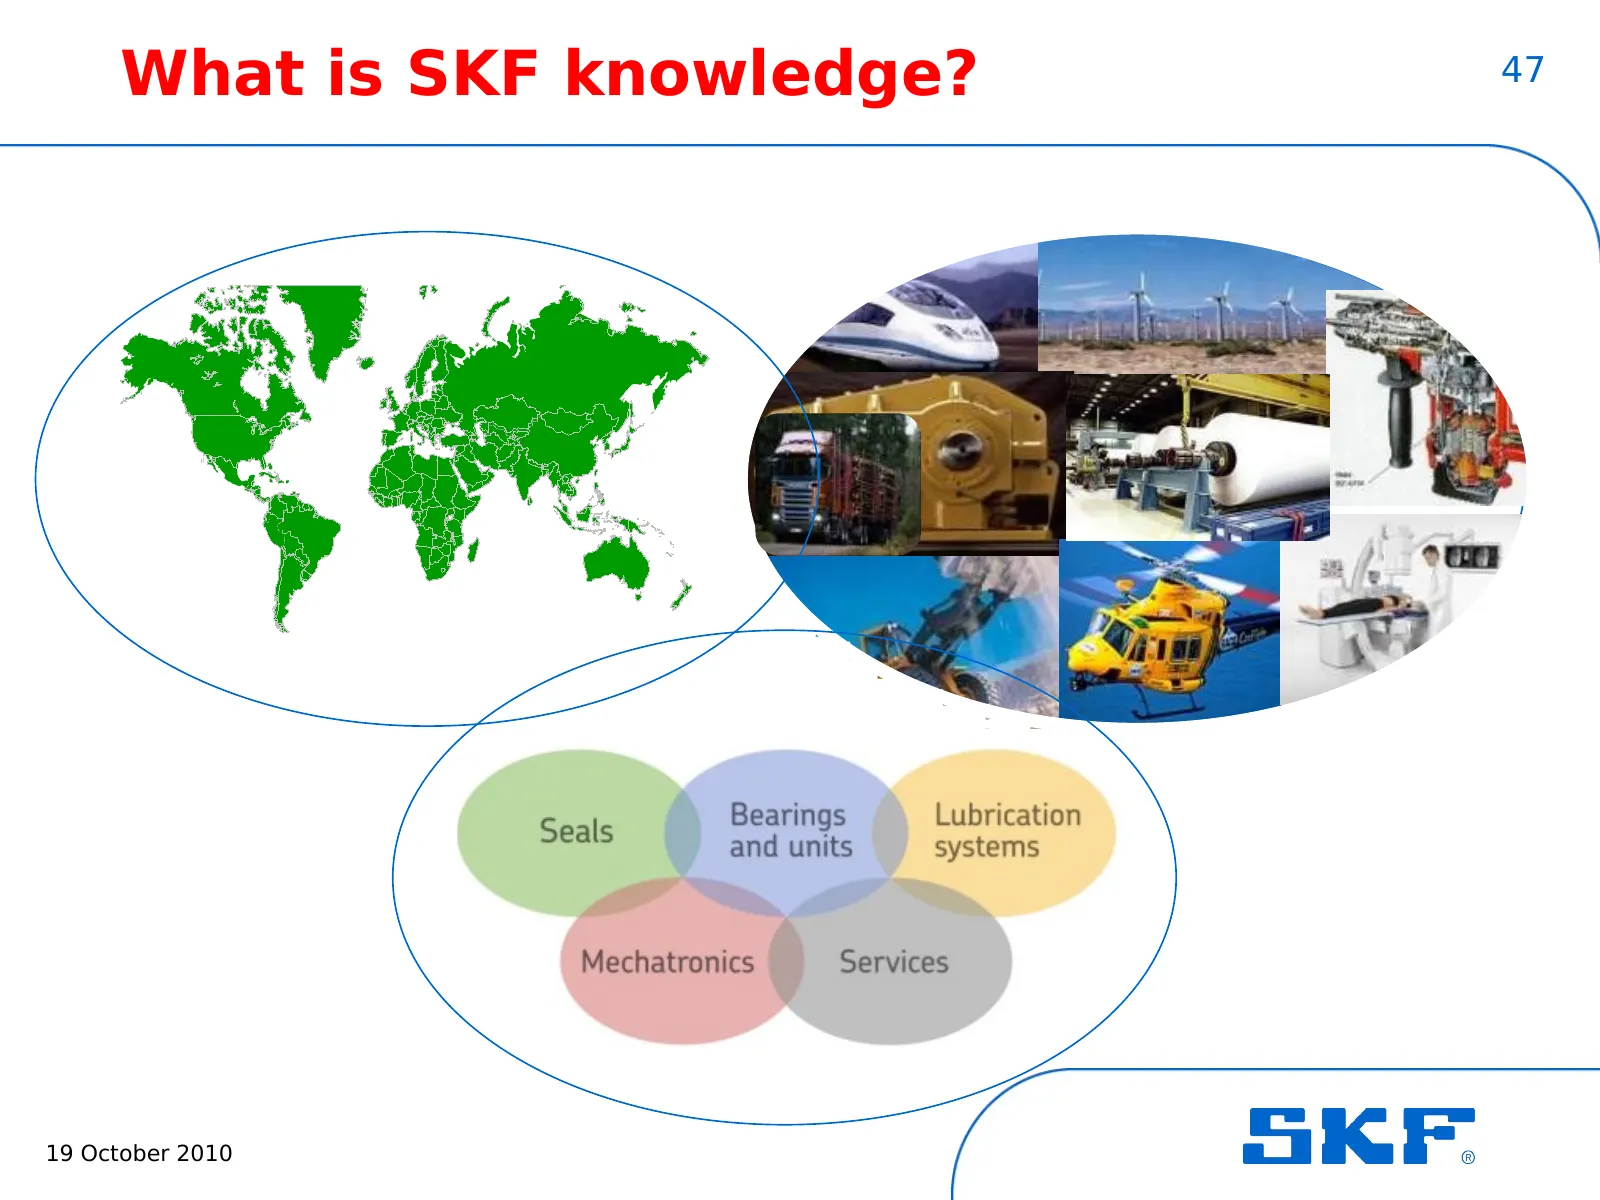
What is SKF knowledge? 47 19 October 2010
Slide 48: SKF's platforms: Managing and reducing friction
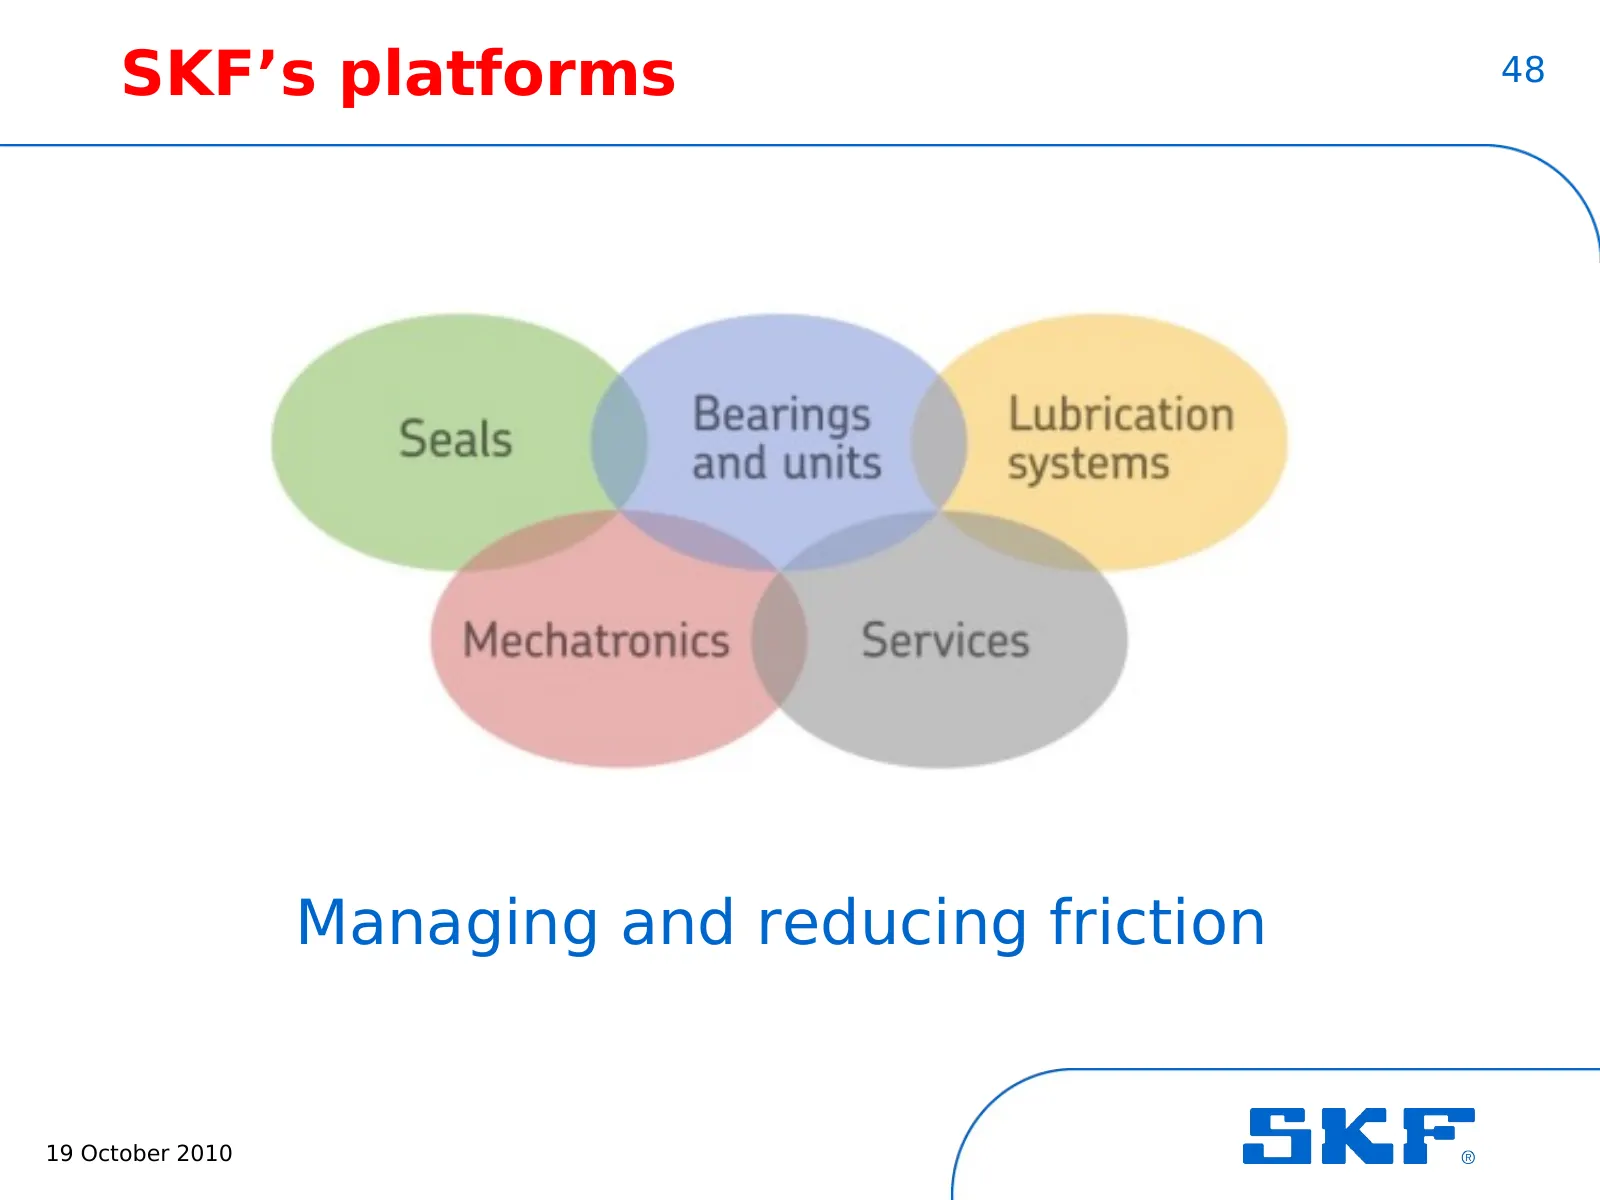
SKF’s platforms 48 Managing and reducing friction 19 October 2010
Slide 49: Increasing need for lubrication systems
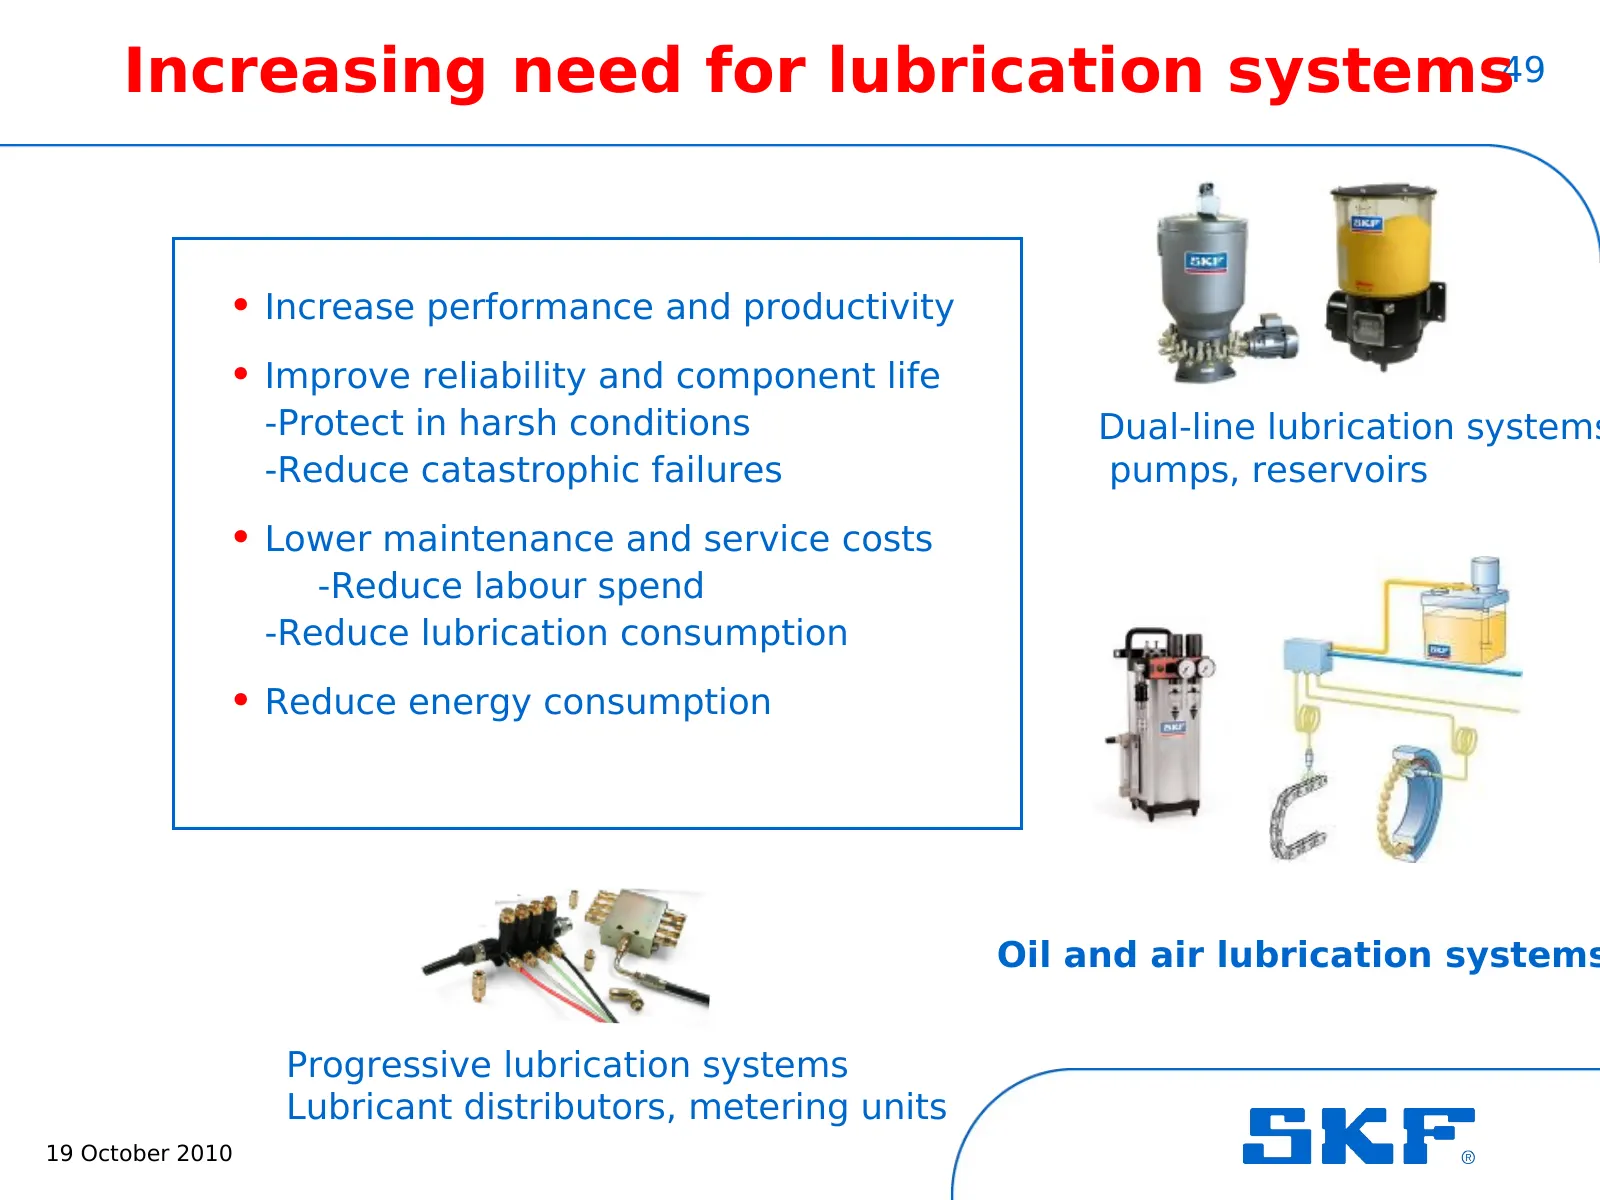
Increasing need for lubrication systems49 • Increase performance and productivity • Improve reliability and component life -Protect in harsh conditions Dual-line lubrication systems -Reduce catastrophic failures pumps, reservoirs • Lower maintenance and service costs -Reduce labour spend -Reduce lub
Slide 50: Lubrication systems market
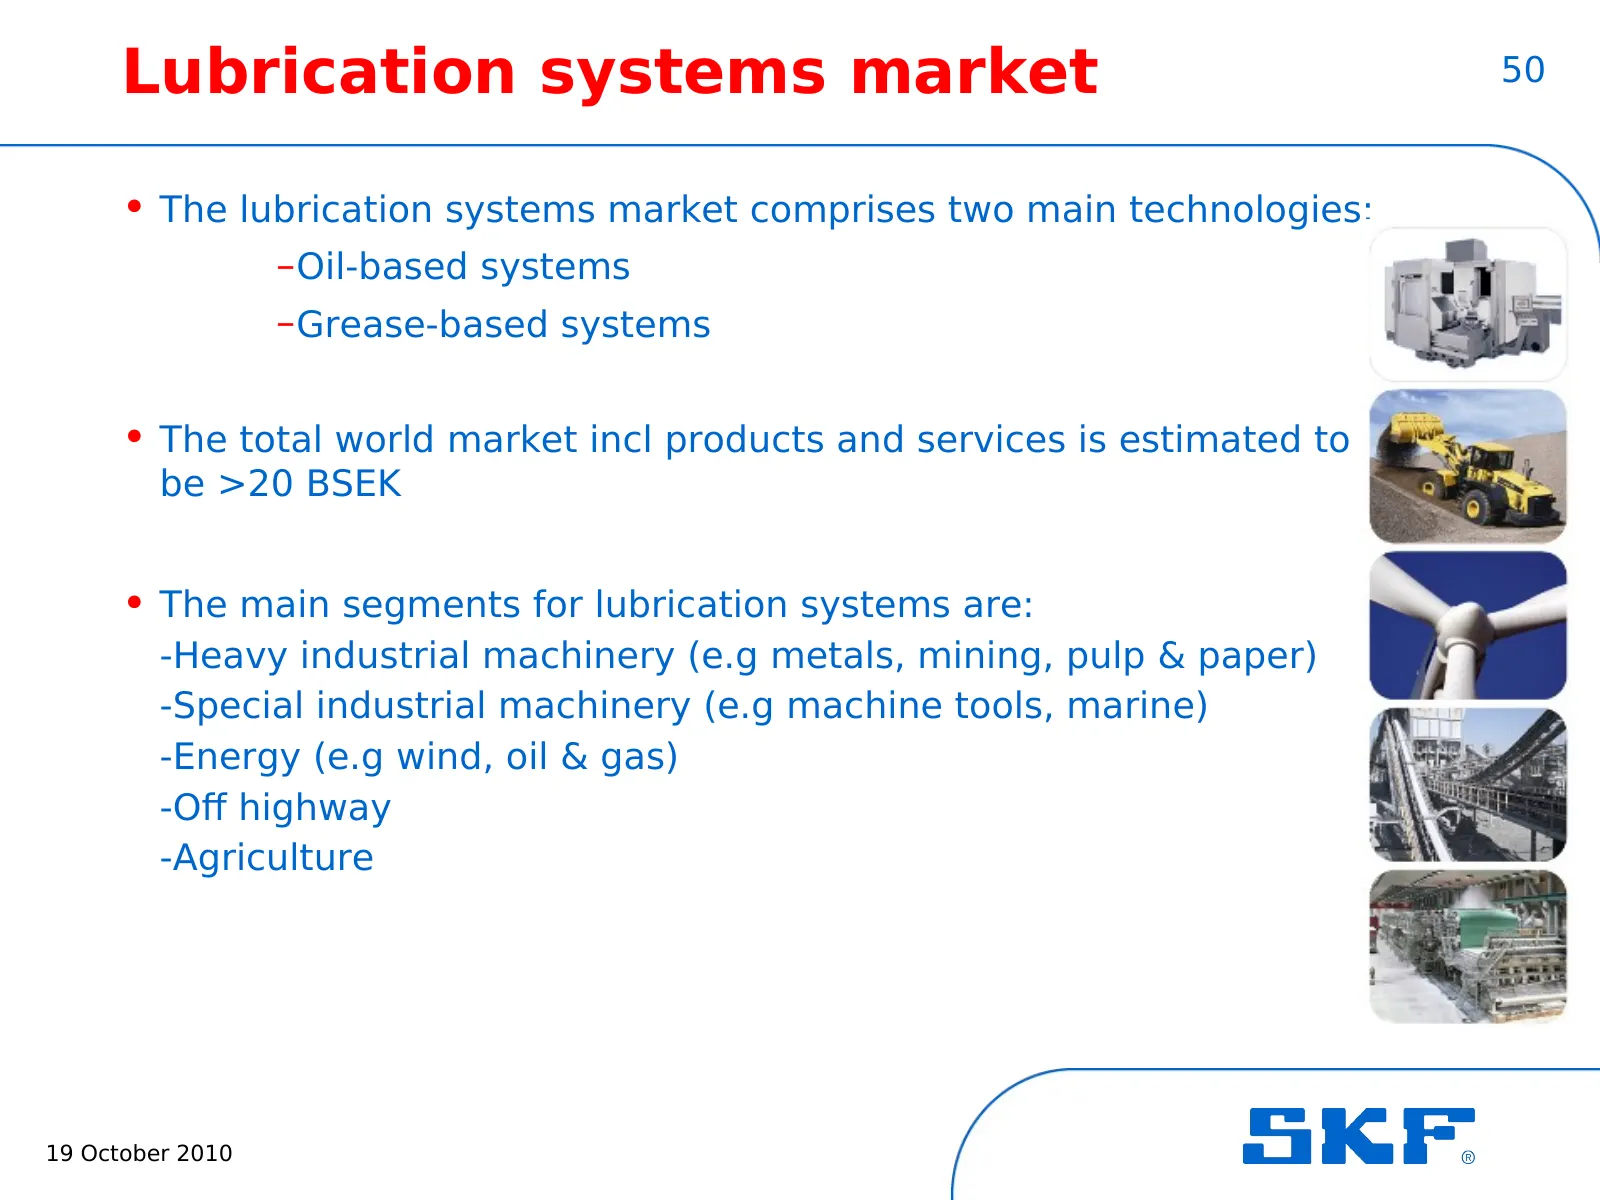
Lubrication systems market 50 • The lubrication systems market comprises two main technologies: –Oil-based systems –Grease-based systems • The total world market incl products and services is estimated to be >20 BSEK • The main segments for lubrication systems are: -Heavy industrial machinery (e.g m
Slide 51: SKF Lubrication Systems
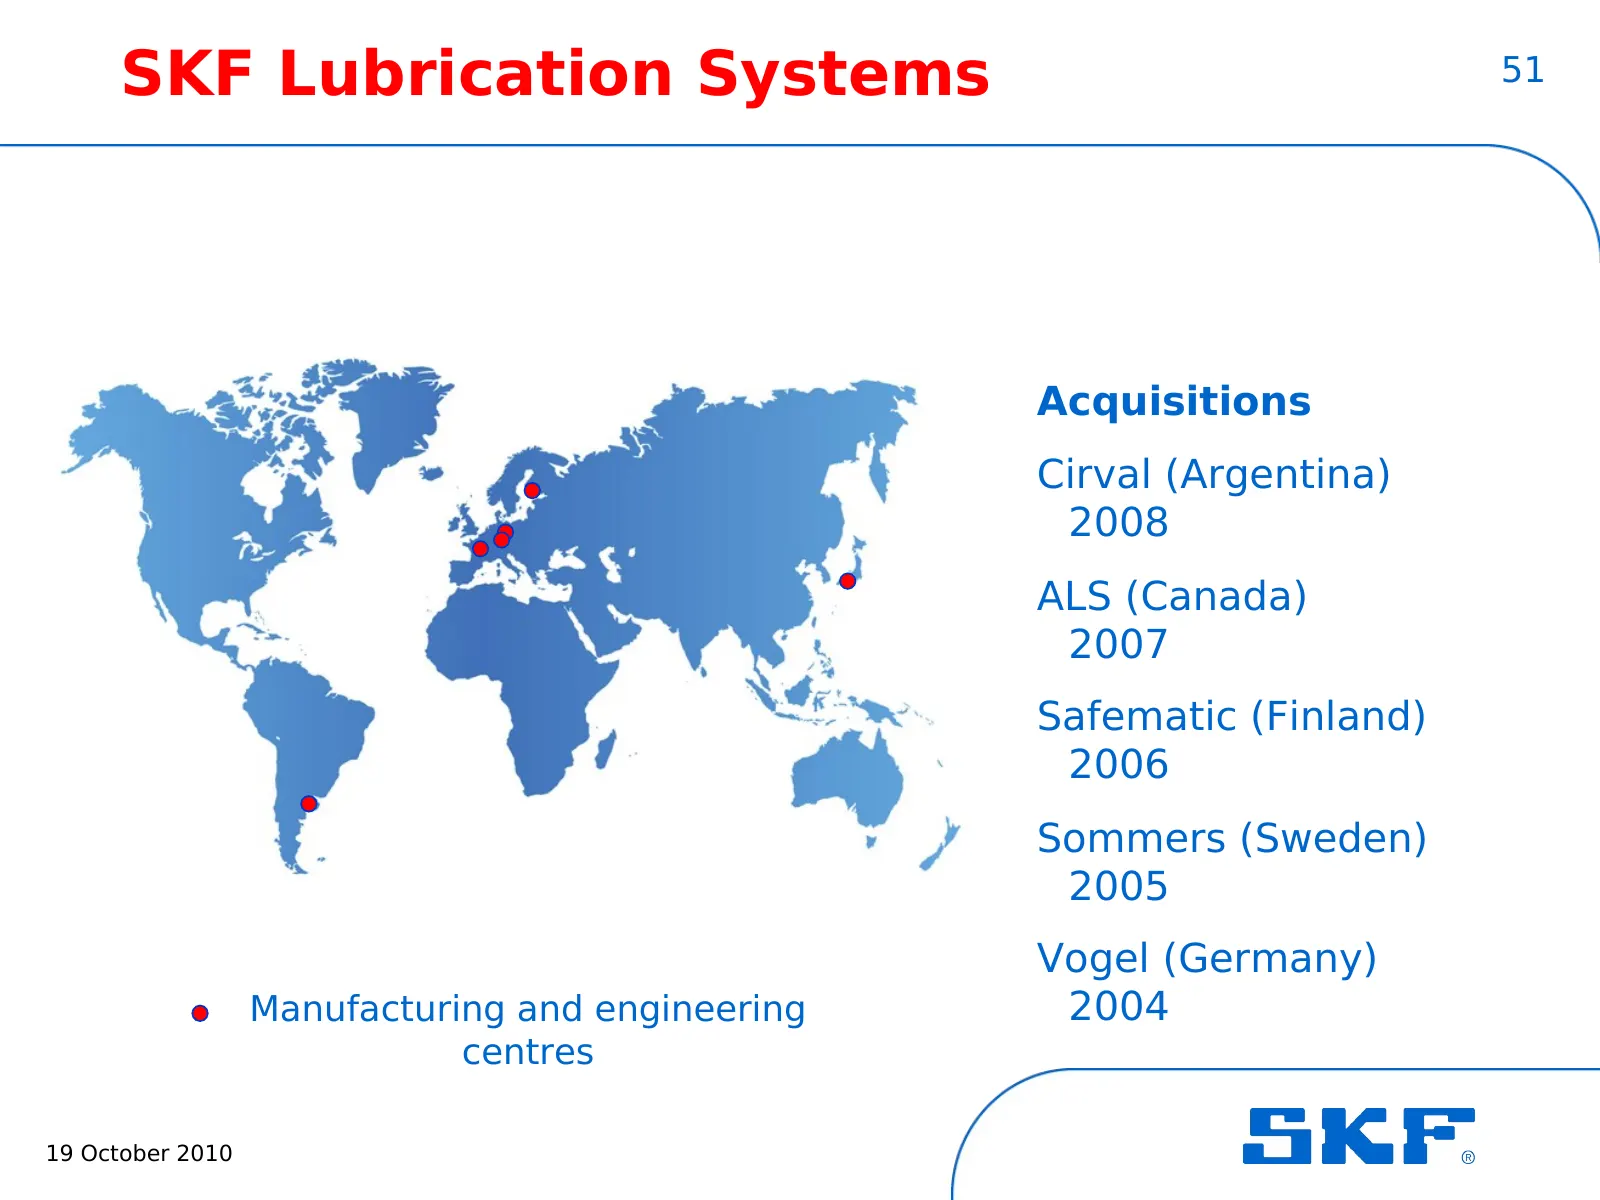
SKF Lubrication Systems 51 Acquisitions Cirval (Argentina) 2008 ALS (Canada) 2007 Safematic (Finland) 2006 Sommers (Sweden) 2005 Vogel (Germany) Manufacturing and engineering 2004 centres 19 October 2010
Slide 52: Acquisition of Lincoln Industrial
Acquisition of Lincoln Industrial 52 •Lubrication systems is one of SKF’s technology platforms and SKF has improved its offerings in this area in recent years. It is a vital part of SKF’s core competence in the management of friction. • Lincoln Industrial is highly complementary to SKF Lubrication S
Slide 53: Lincoln Industrial
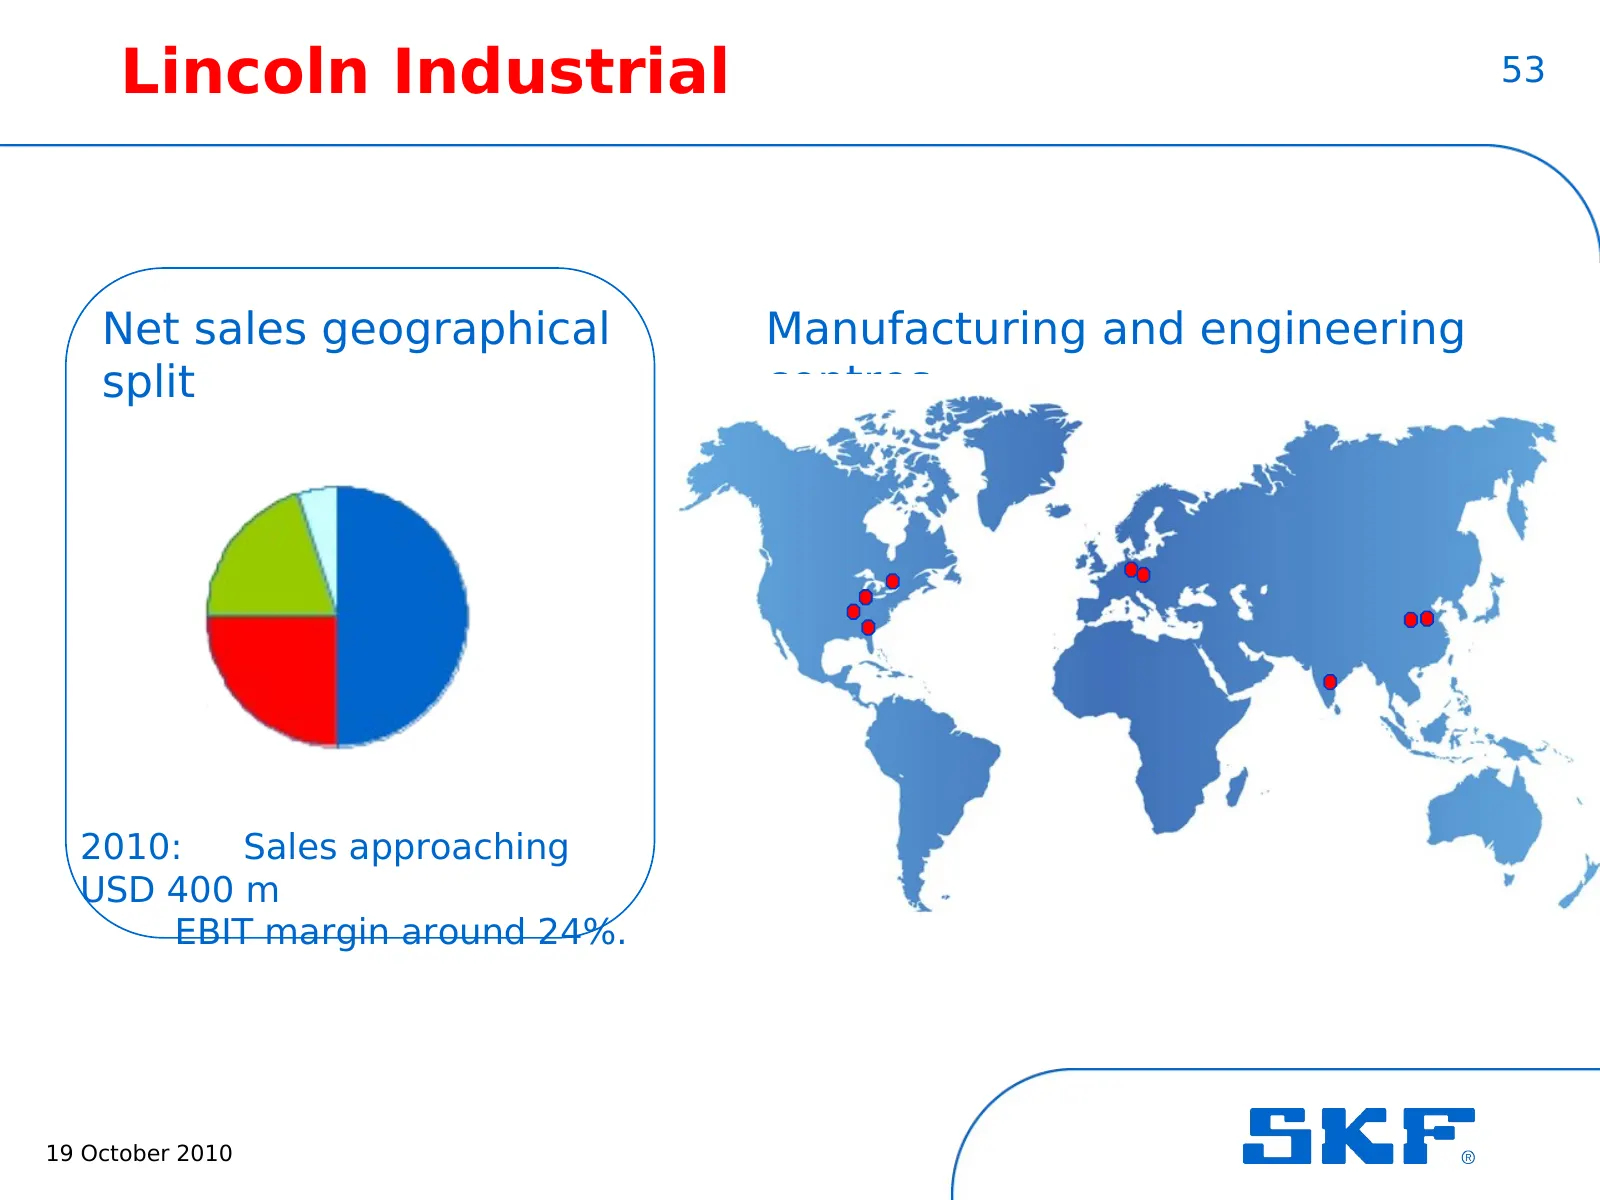
Lincoln Industrial 53 Net sales geographical Manufacturing and engineering split centres 2010: Sales approaching USD 400 m EBIT margin around 24%. 19 October 2010
Slide 54: Lincoln Industrial's offer portfolio and selected applications
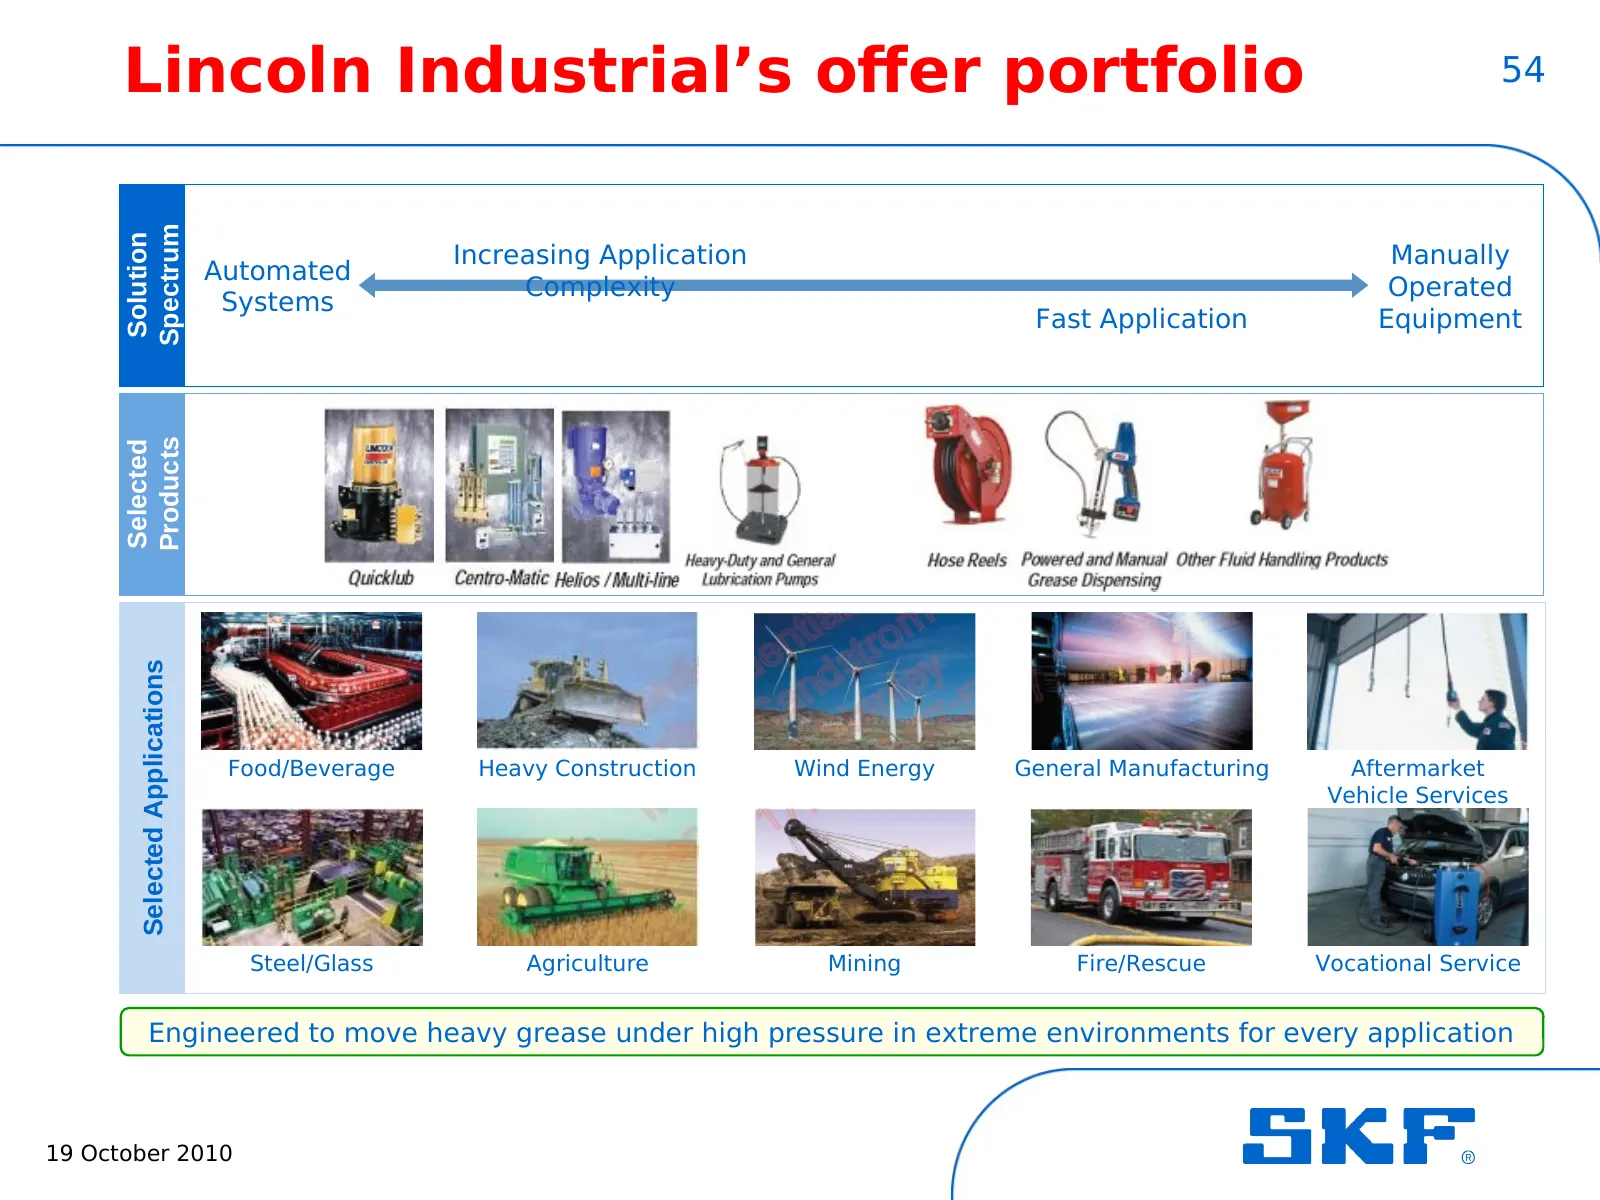
Lincoln Industrial’s offer portfolio 54 Spectrum Solution Increasing Application Manually Automated Complexity Operated Systems Fast Application Equipment Products Selected Selected Applications Food/Beverage Heavy Construction Wind Energy General Manufacturing Aftermarket Vehicle Services Steel/Gla
Slide 55: The acquisition is in line with SKF's strategy
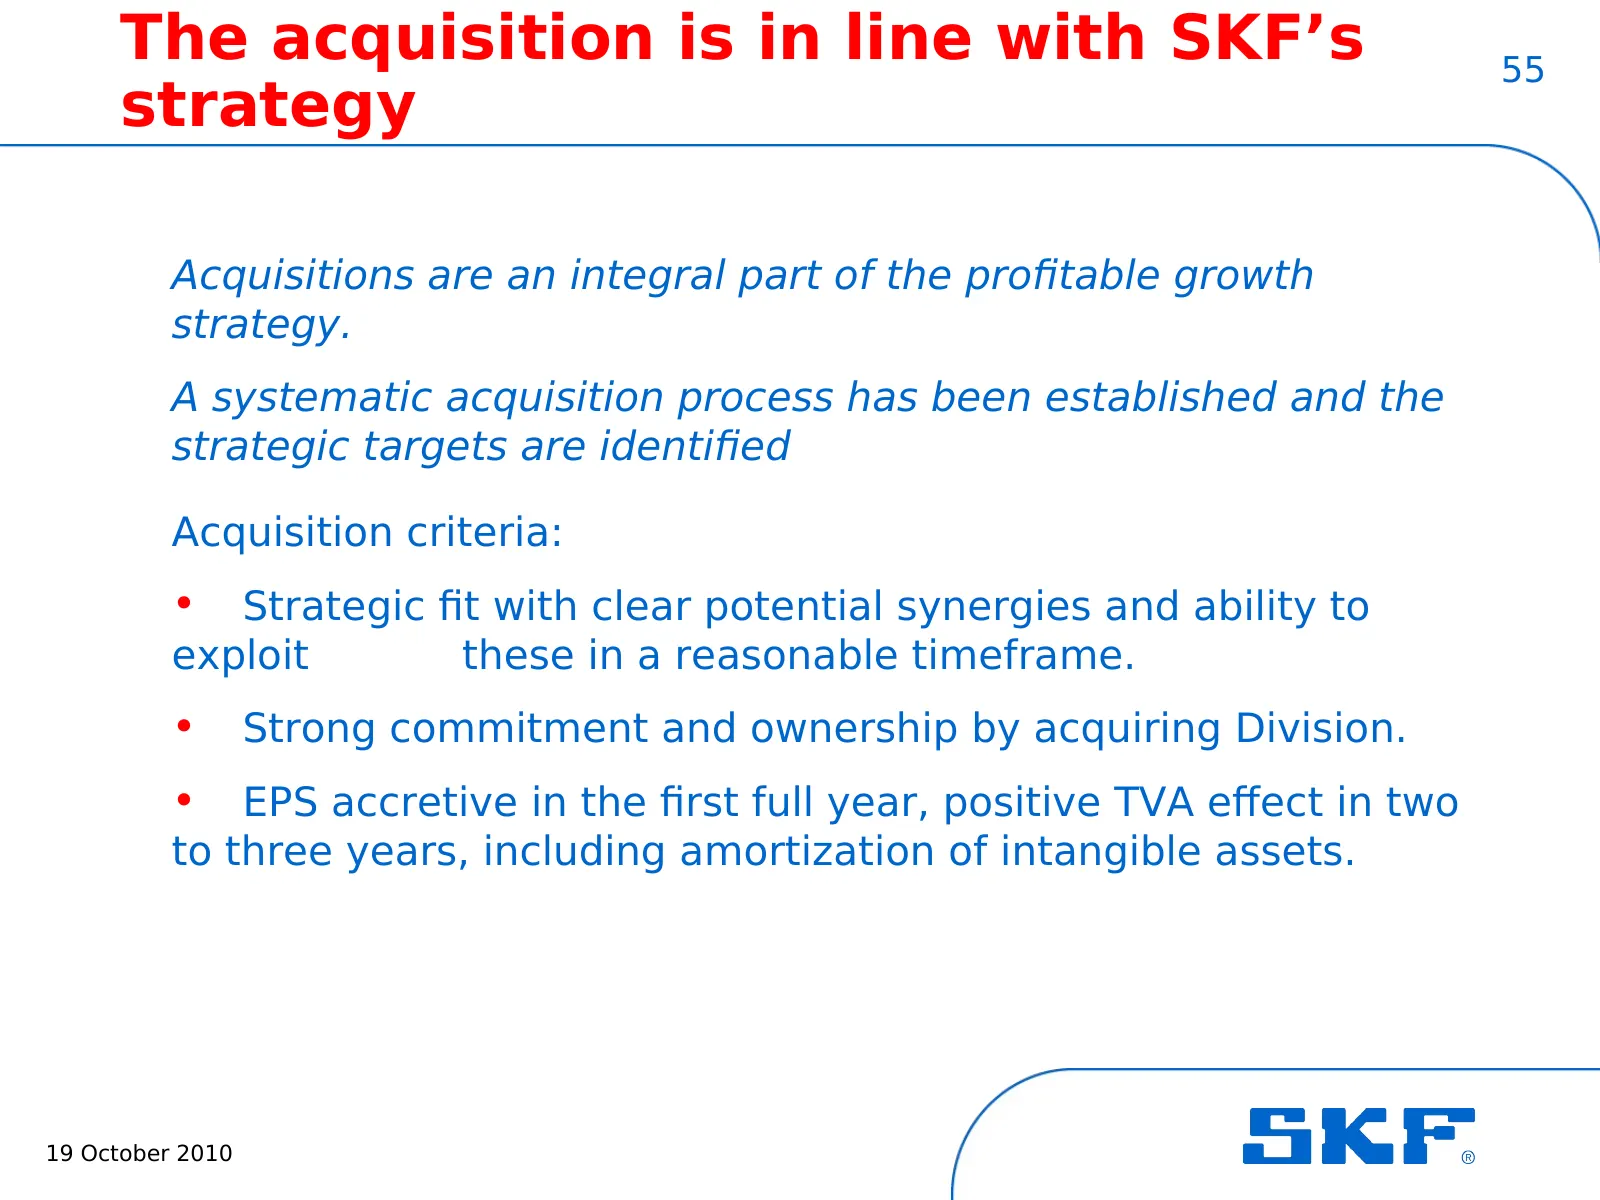
The acquisition is in line with SKF’s 55 strategy Acquisitions are an integral part of the profitable growth strategy. A systematic acquisition process has been established and the strategic targets are identified Acquisition criteria: • Strategic fit with clear potential synergies and ability to ex
Slide 56: Summary of the third quarter
Summary of the third quarter 56 • Very strong quarter • Positive outlook • New financial targets • Significant acquisition in lubrication systems area 19 October 2010
Slide 57: Cautionary statement
Cautionary statement 57 This presentation contains forward-looking statements that are based on the current expectations of the management of SKF. Although management believes that the expectations reflected in such forward-looking statements are reasonable, no assurance can be given that such expec
Slide 58: 19 October 2010
58 19 October 2010
Source: Internet Archive copy of investors.skf.com
More decks from SKF AB Class A
 Q3 2026 Earnings Presentation20 slides · Oct 21, 2026
 SKF India — Q1 FY2026-27 Earnings Presentation20 slides · Aug 17, 2026
 Q2 2026 Earnings Presentation21 slides · Jul 17, 2026
 SKF India (Industrial) — Q4 FY2026 Earnings Presentation20 slides · May 13, 2026
 Q1 2026 Earnings Presentation22 slides · Apr 21, 2026
 Q4 2025 Earnings Presentation19 slides · Jan 30, 2026