Uniphar PLC · EURONEXT:UPR
Uniphar — H1 2021 Earnings Presentation
38 slides from Uniphar's earnings presentation, Sep 1, 2021

Slide 1: Delivering Growth: H1 2021 Interim Results Presentation
Delivering Growth Serving over 160 Countries worldwide H1 2021 Interim Results Presentation 1 September 2021
Slide 2: Important Notice
Important Notice This presentation has been prepared solely in connection with the financial results of Uniphar plc (the "Company") for the six months ended 30 June 2021 and should be read in conjunction with the announcement of the interim results of the Company for the period ended 30 June 2021, r
Slide 3: Agenda
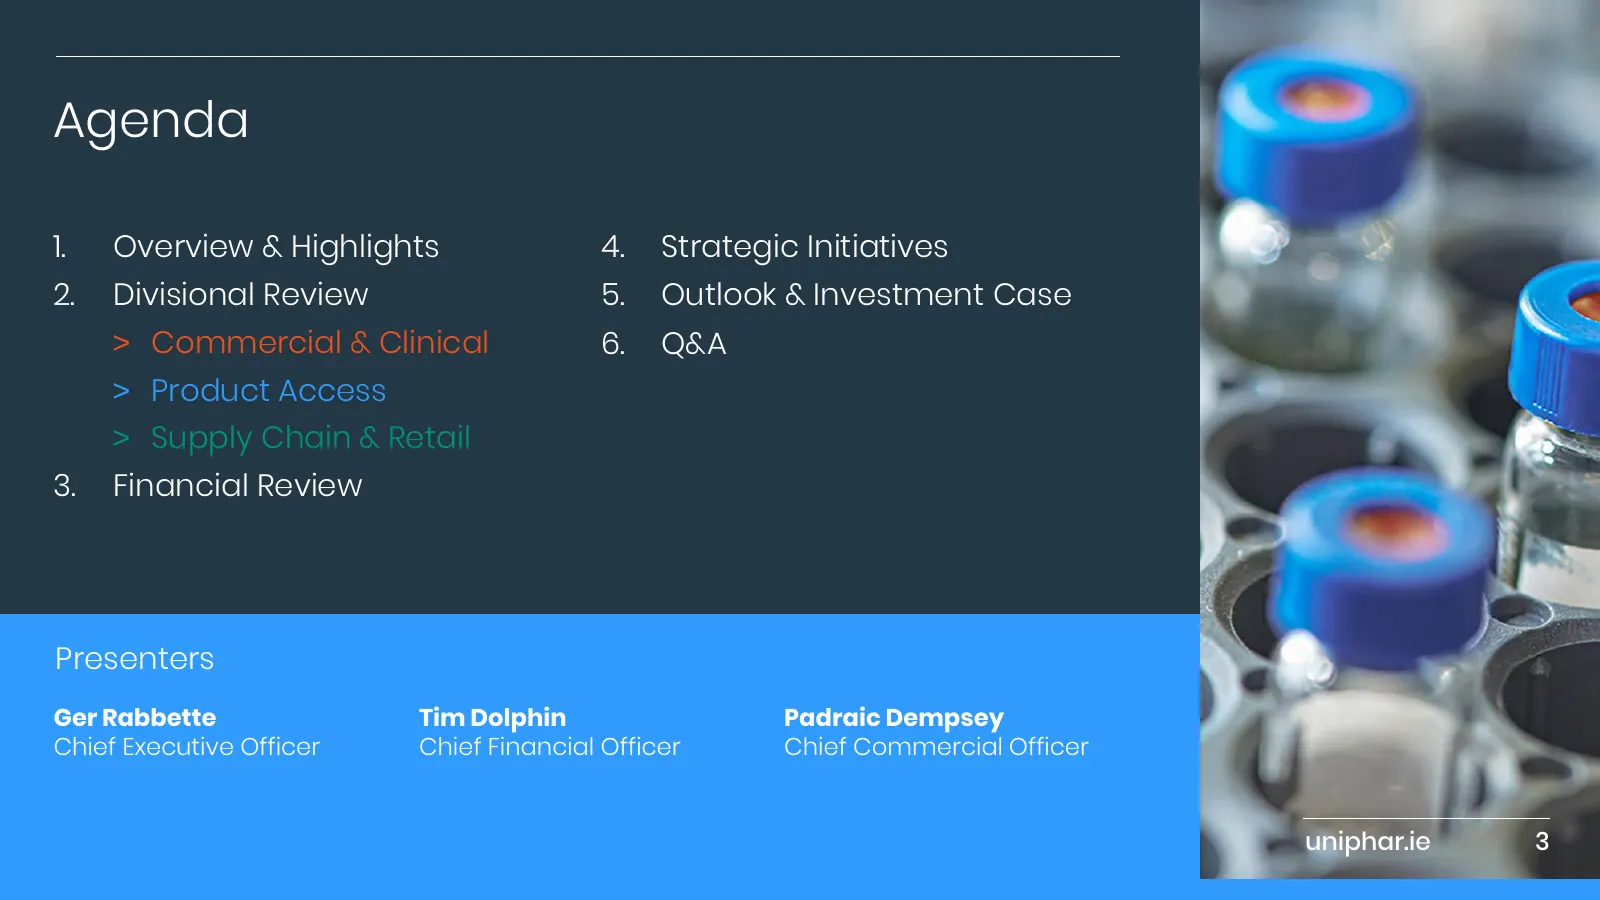
Agenda 1. Overview & Highlights 4. Strategic Initiatives 2. Divisional Review 5. Outlook & Investment Case > Commercial & Clinical 6. Q&A > Product Access > Supply Chain & Retail 3. Financial Review Presenters Ger Rabbette Tim Dolphin Padraic Dempsey Chief Executive Officer Chief Financial Officer C
Slide 4: Uniphar at a Glance
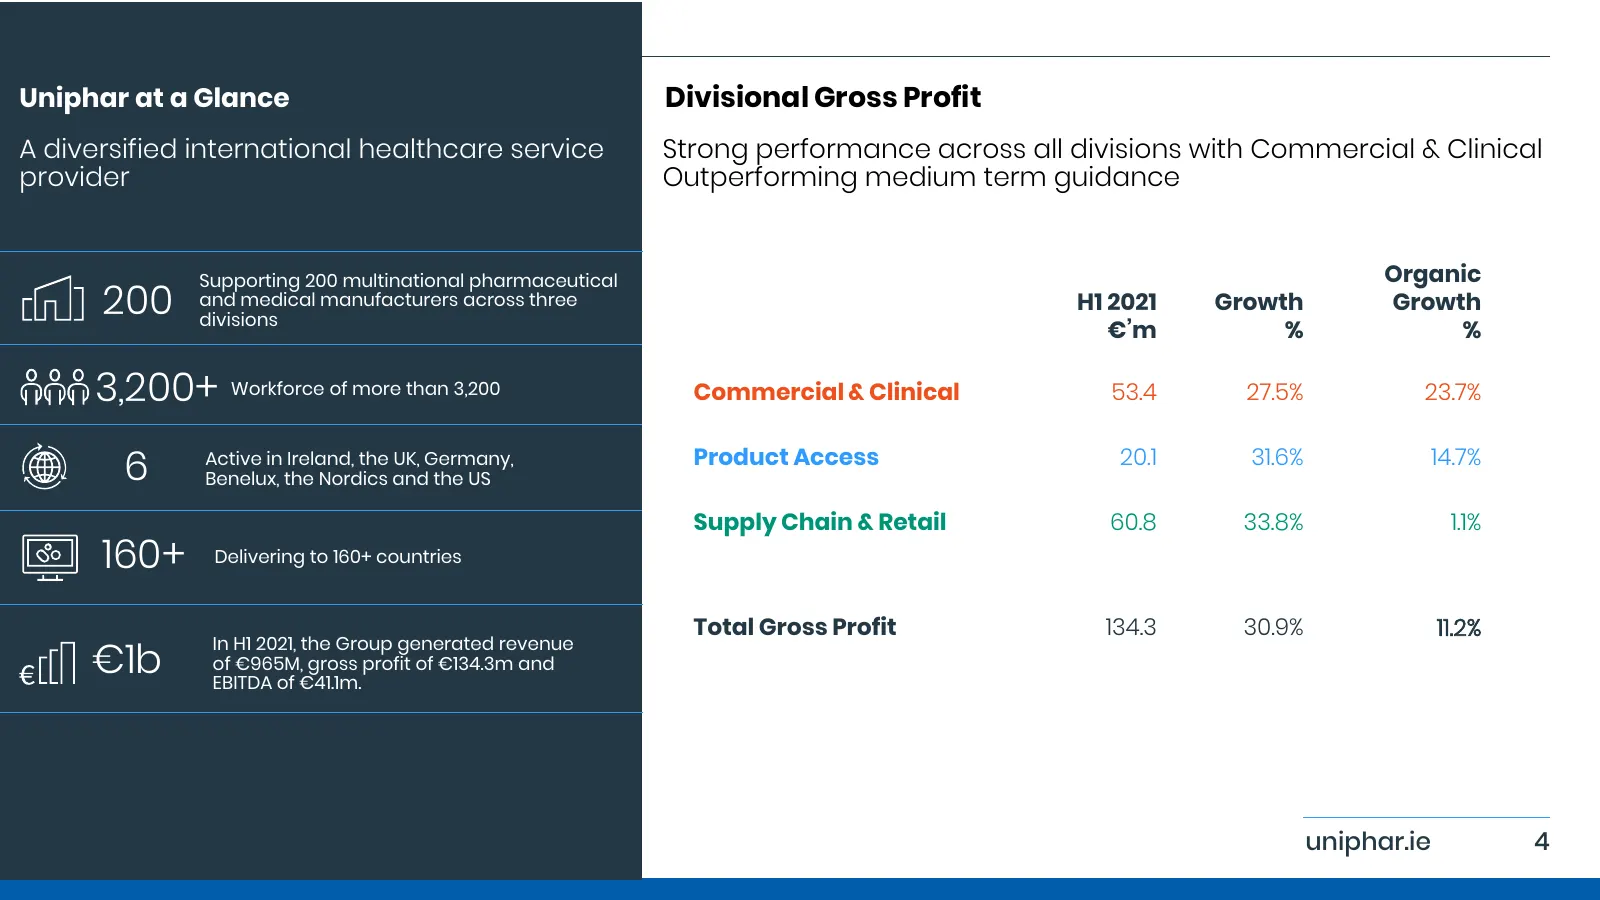
Uniphar at a Glance Divisional Gross Profit A diversified international healthcare service Strong performance across all divisions with Commercial & Clinical provider Outperforming medium term guidance Supporting 200 multinational pharmaceutical Organic 200 and medical manufacturers across three div
Slide 5: Highlights – H121
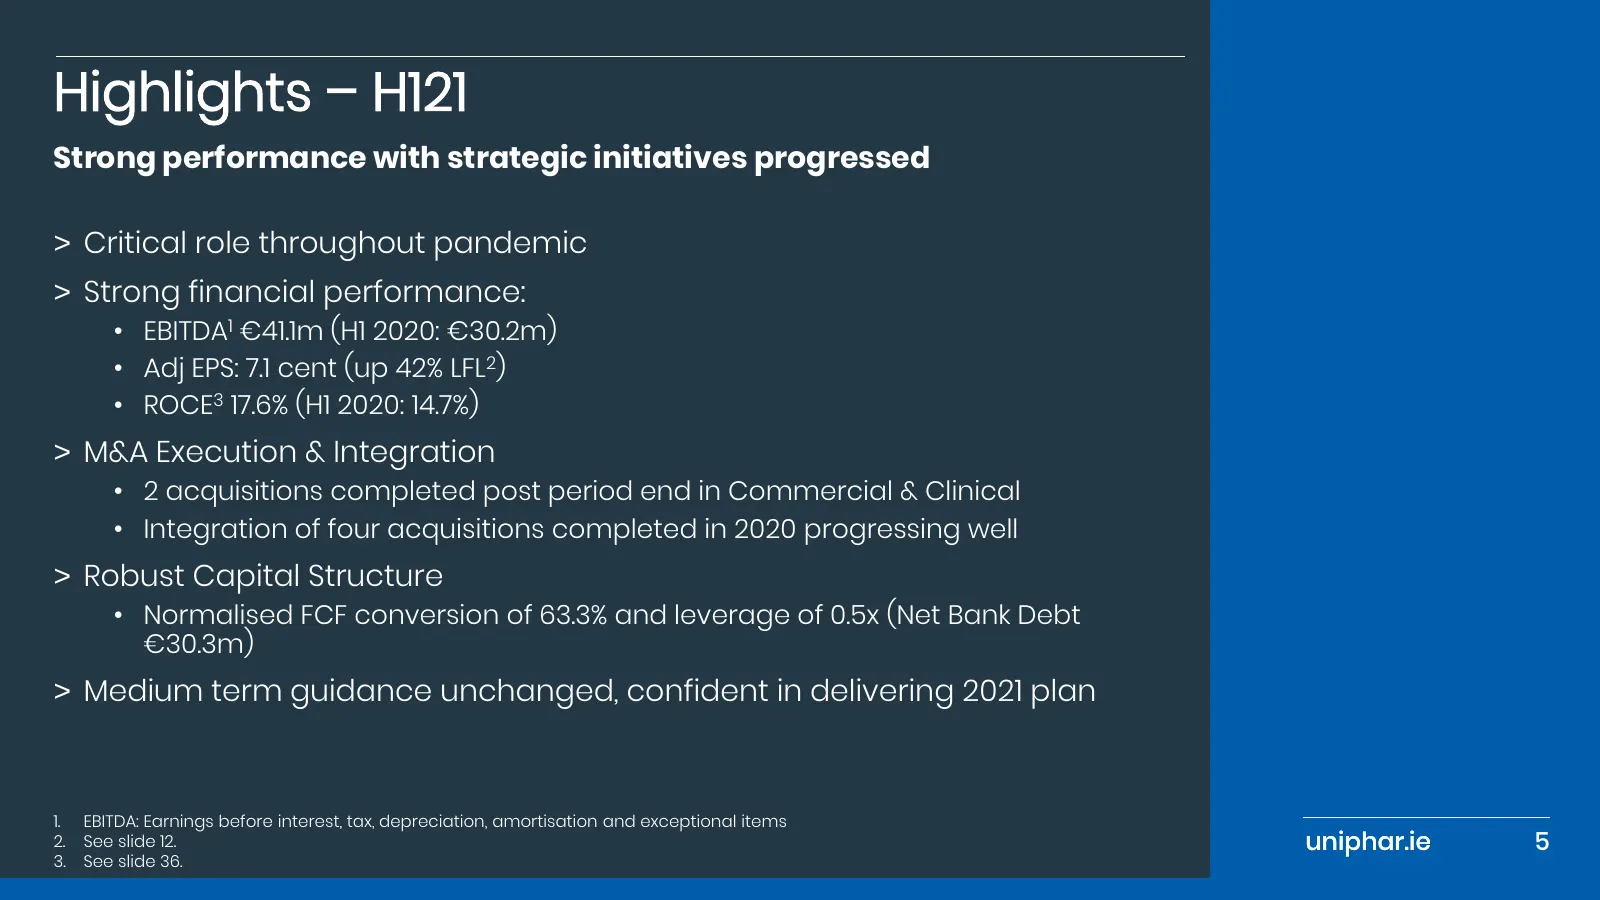
Highlights – H121 Strong performance with strategic initiatives progressed > Critical role throughout pandemic > Strong financial performance: • EBITDA1 €41.1m (H1 2020: €30.2m) • Adj EPS: 7.1 cent (up 42% LFL2) • ROCE3 17.6% (H1 2020: 14.7%) > M&A Execution & Integration • 2 acquisitions completed
Slide 6: Sustainability Highlights
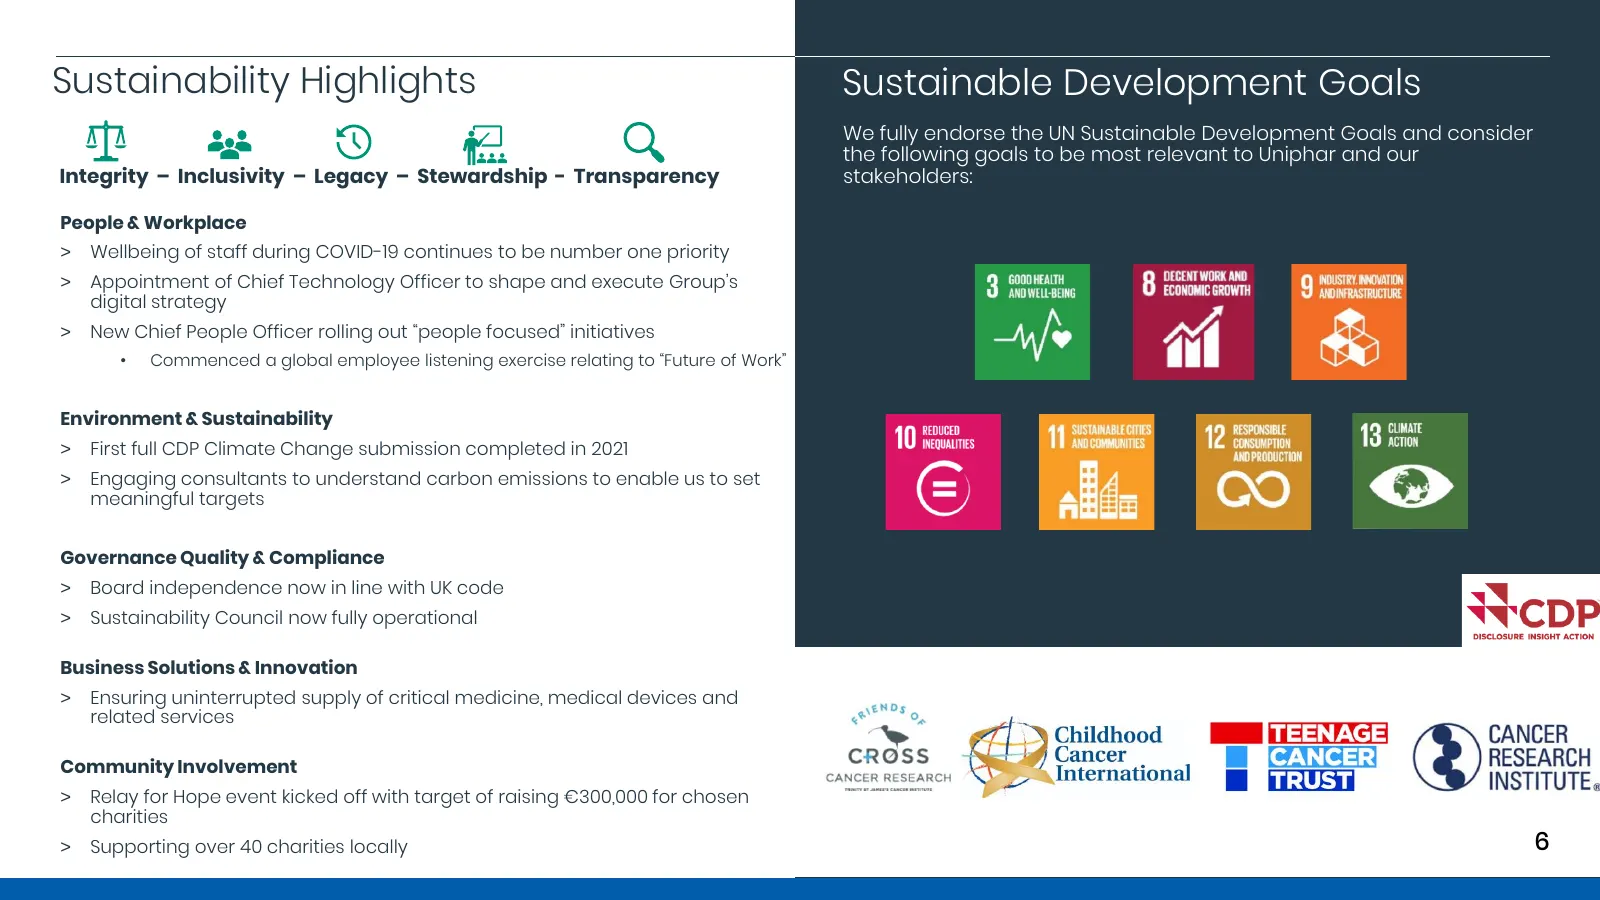
Sustainability Highlights Sustainable Development Goals We fully endorse the UN Sustainable Development Goals and consider the following goals to be most relevant to Uniphar and our Integrity – Inclusivity – Legacy – Stewardship - Transparency stakeholders: People & Workplace > Wellbeing of staff du
Slide 7: Divisional Review
Divisional Review uniphar.ie 7
Slide 8: Commercial & Clinical
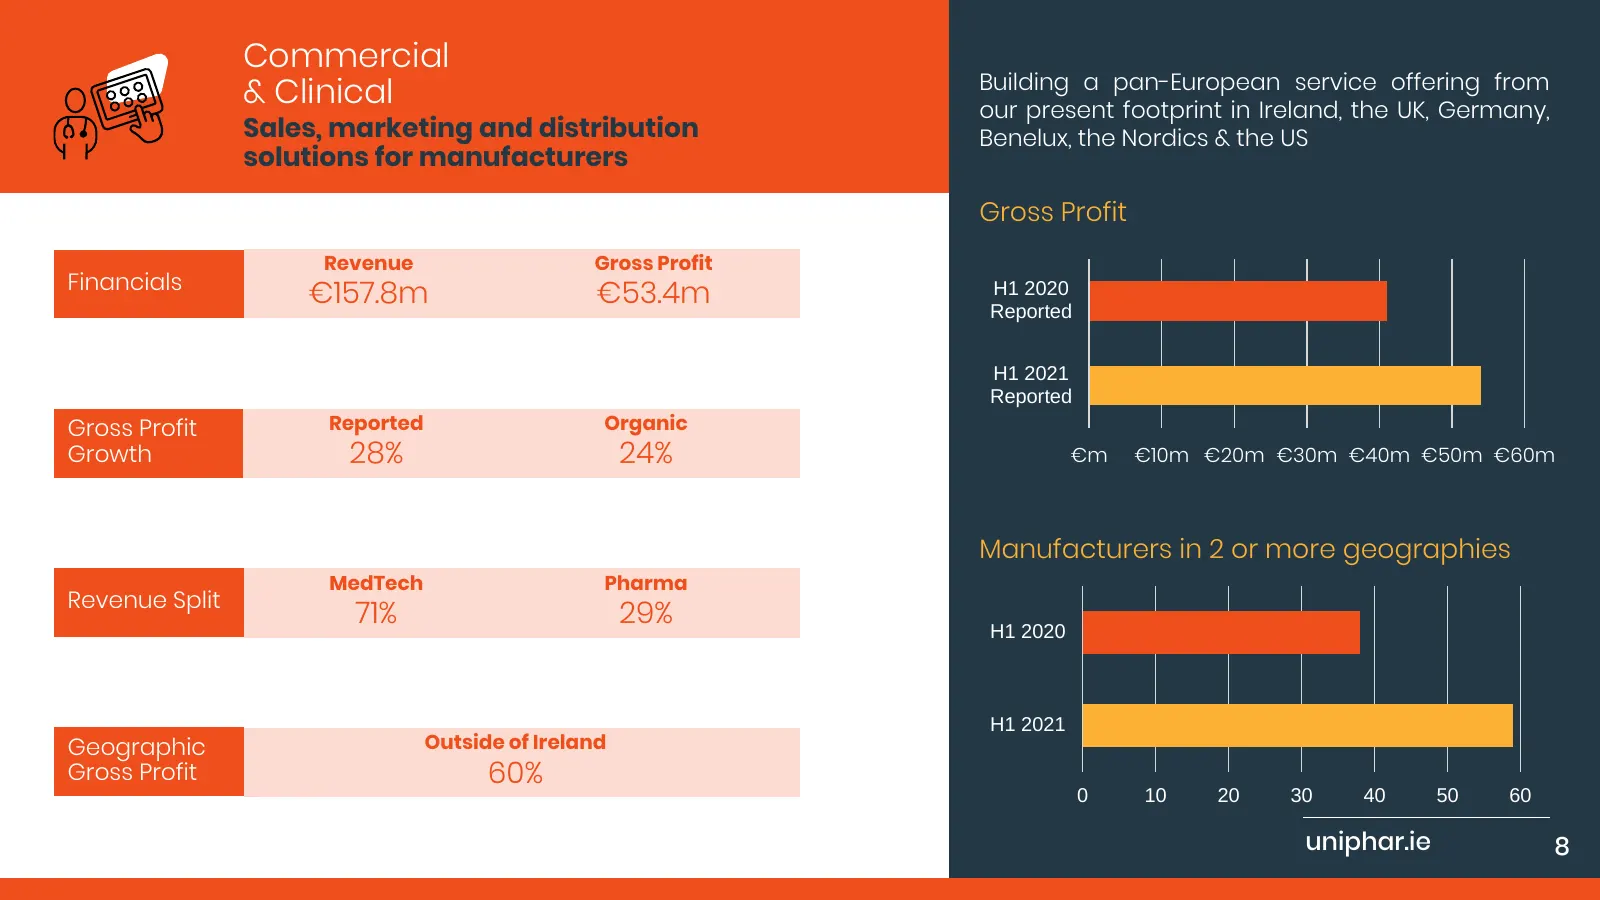
Commercial Building a pan-European service offering from & Clinical our present footprint in Ireland, the UK, Germany, Sales, marketing and distribution Benelux, the Nordics & the US solutions for manufacturers Gross Profit Revenue Gross Profit Financials €157.8m €53.4m H1 2020 Reported H1 2021 Repo
Slide 9: Product Access
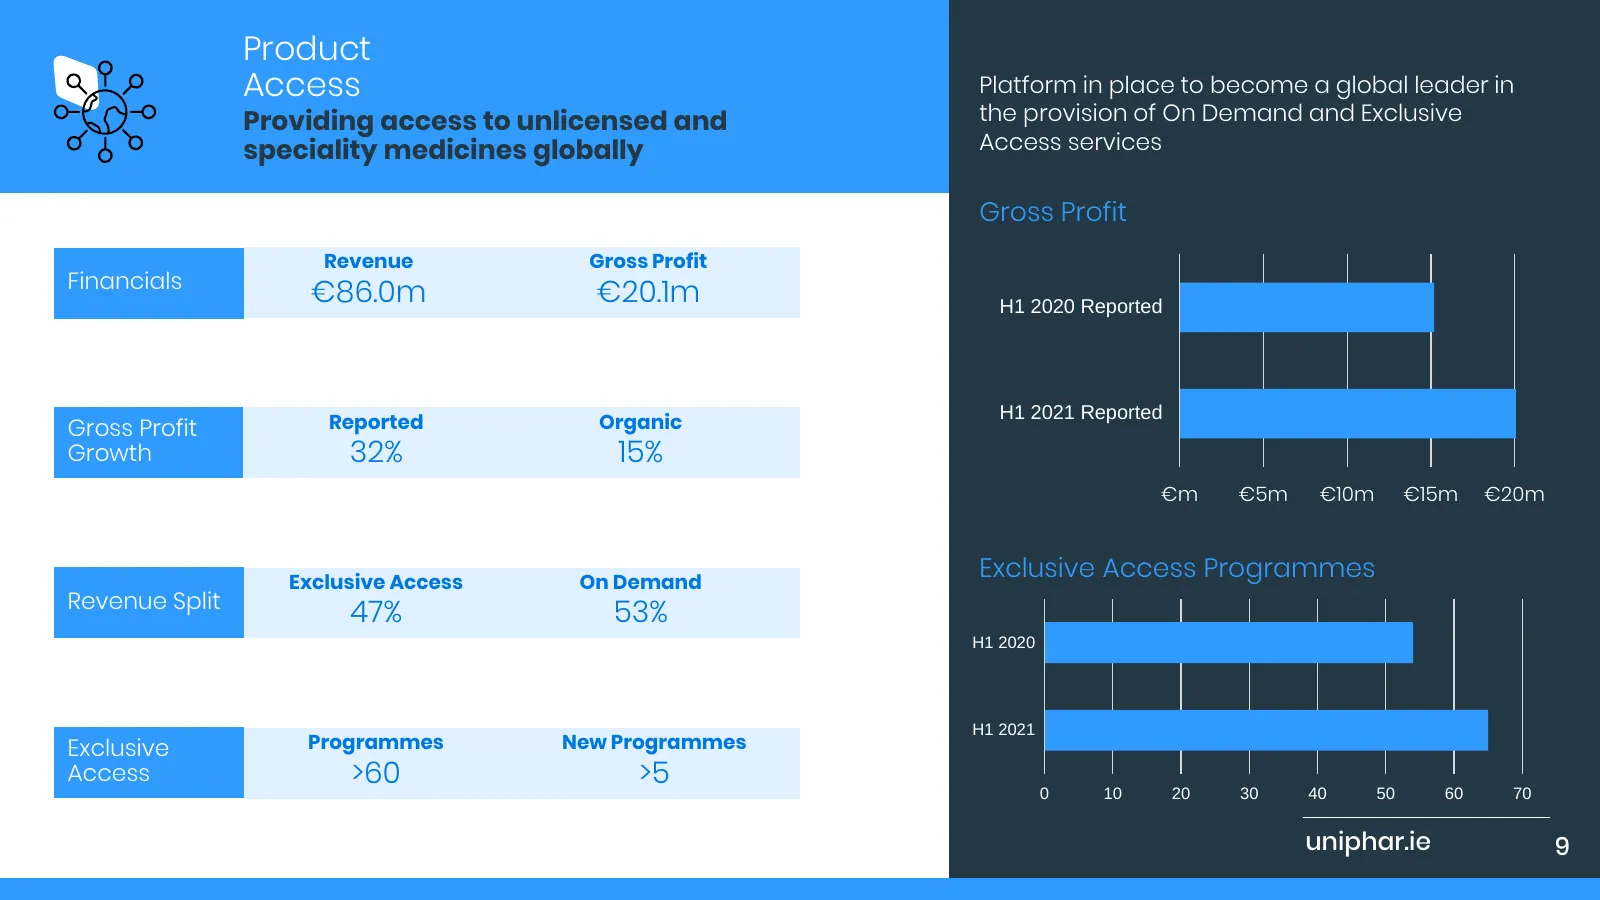
Product Access Platform in place to become a global leader in Providing access to unlicensed and the provision of On Demand and Exclusive speciality medicines globally Access services Gross Profit Revenue Gross Profit Financials €86.0m €20.1m H1 2020 Reported Reported Organic H1 2021 Reported Gross
Slide 10: Supply Chain & Retail
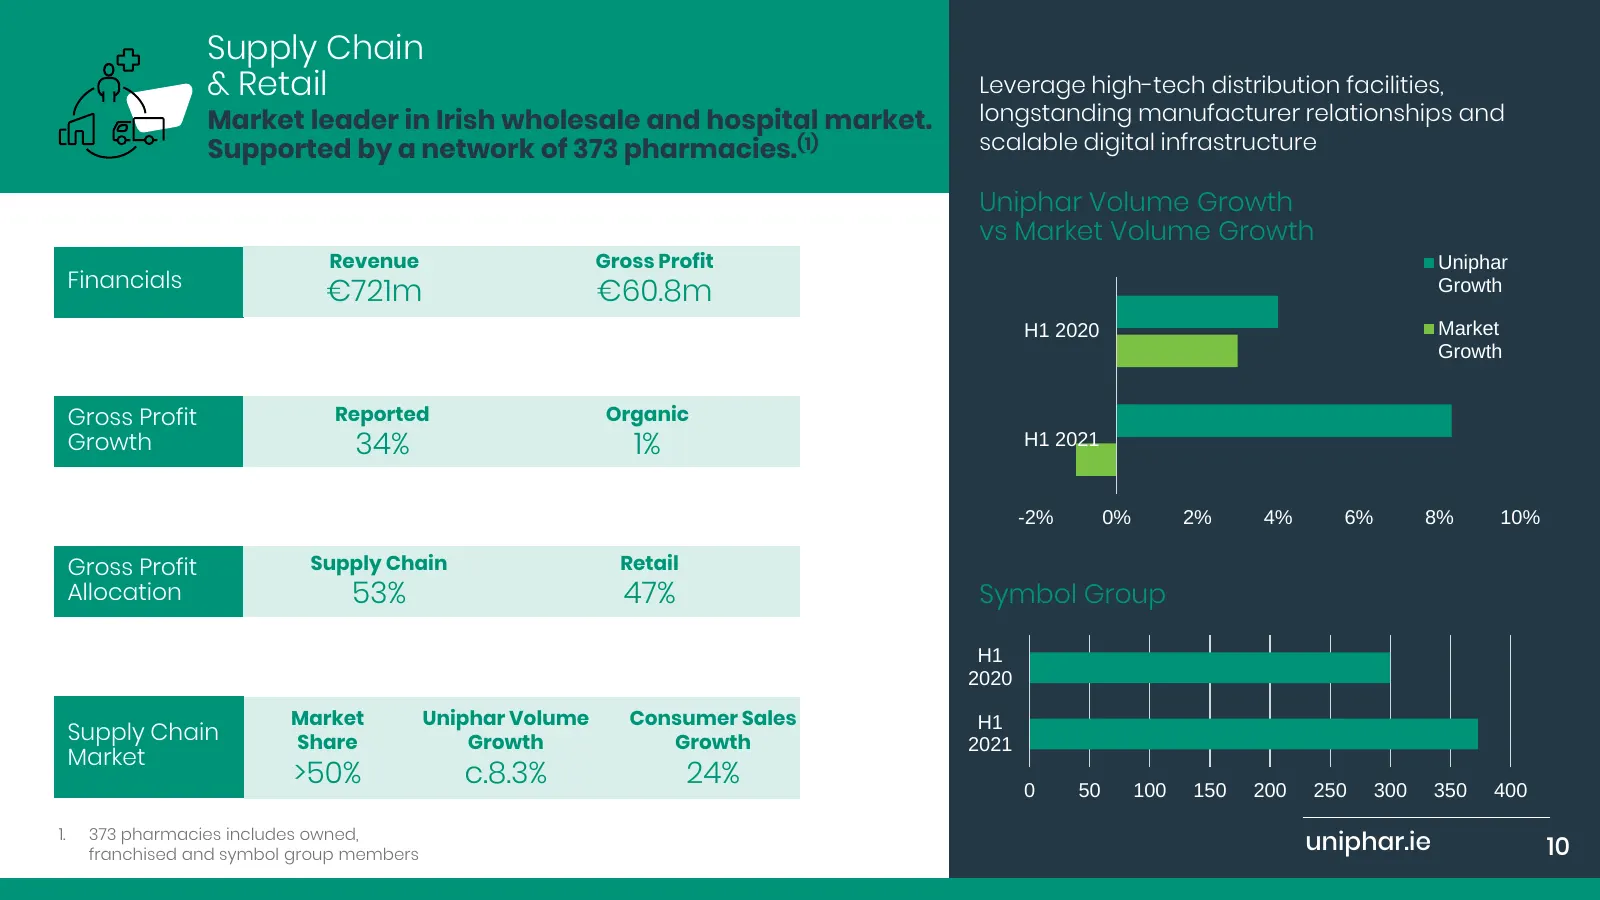
Supply Chain & Retail Leverage high-tech distribution facilities, Market leader in Irish wholesale and hospital market. longstanding manufacturer relationships and Supported by a network of 373 pharmacies.(1) scalable digital infrastructure Uniphar Volume Growth vs Market Volume Growth Revenue Gross

Slide 11: Financial Review
Financial Review uniphar.ie 11
Slide 12: Financial Highlights
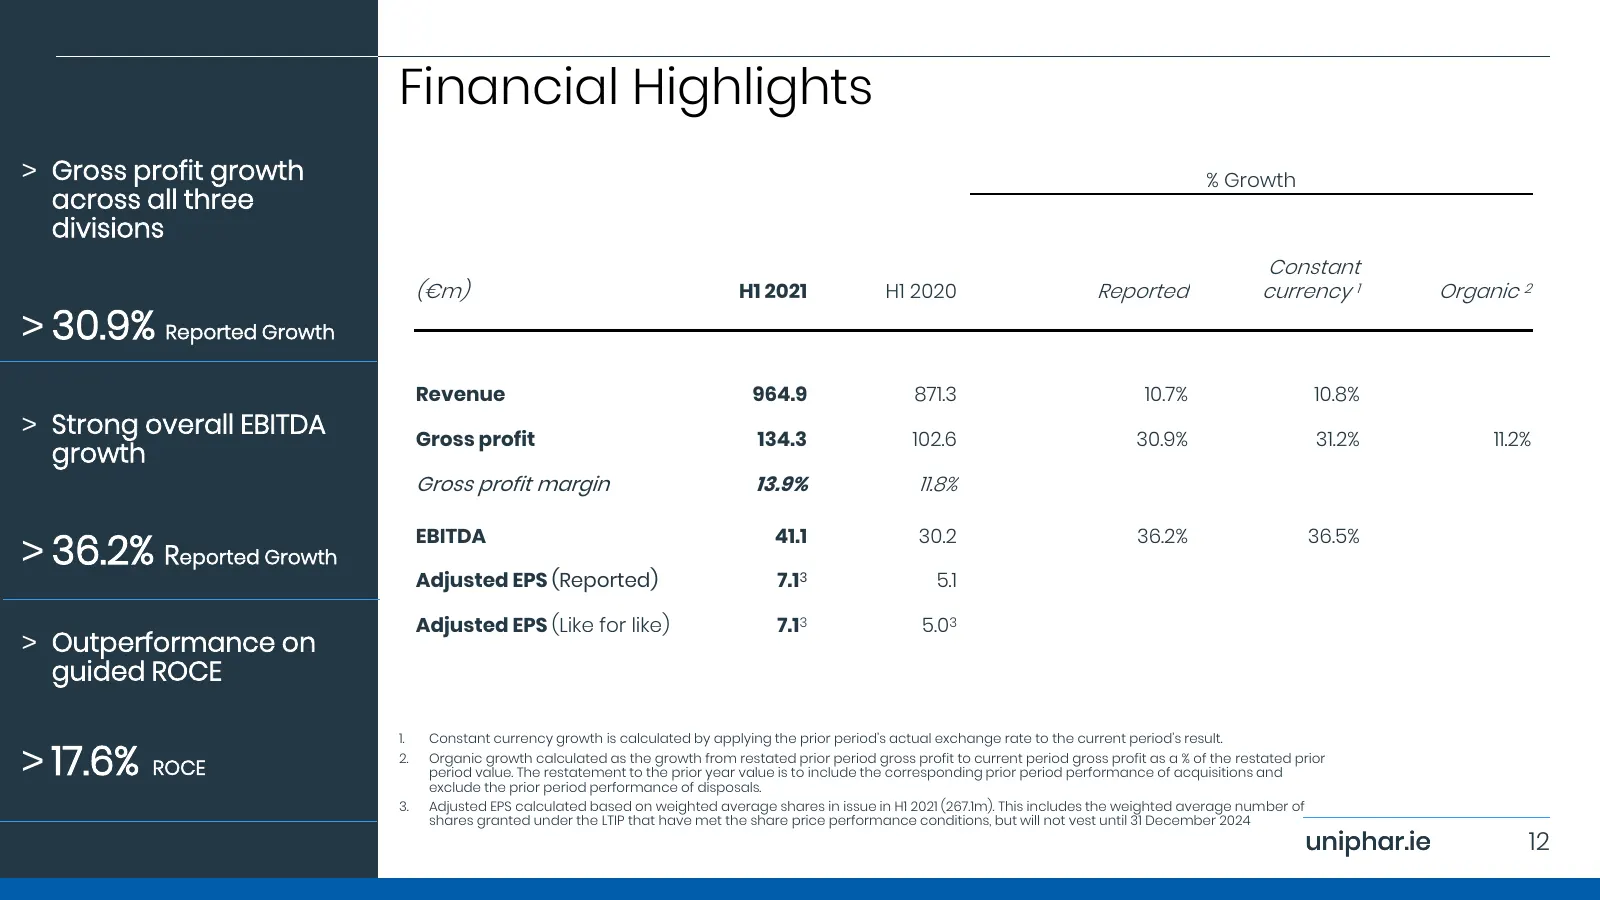
Financial Highlights > Gross profit growth % Growth across all three divisions Constant (€m) H1 2021 H1 2020 Reported currency 1 Organic 2 > 30.9% Reported Growth Revenue 964.9 871.3 10.7% 10.8% > Strong overall EBITDA Gross profit 134.3 102.6 30.9% 31.2% 11.2% growth Gross profit margin 13.9% 11.8%
Slide 13: Divisional Gross Profit
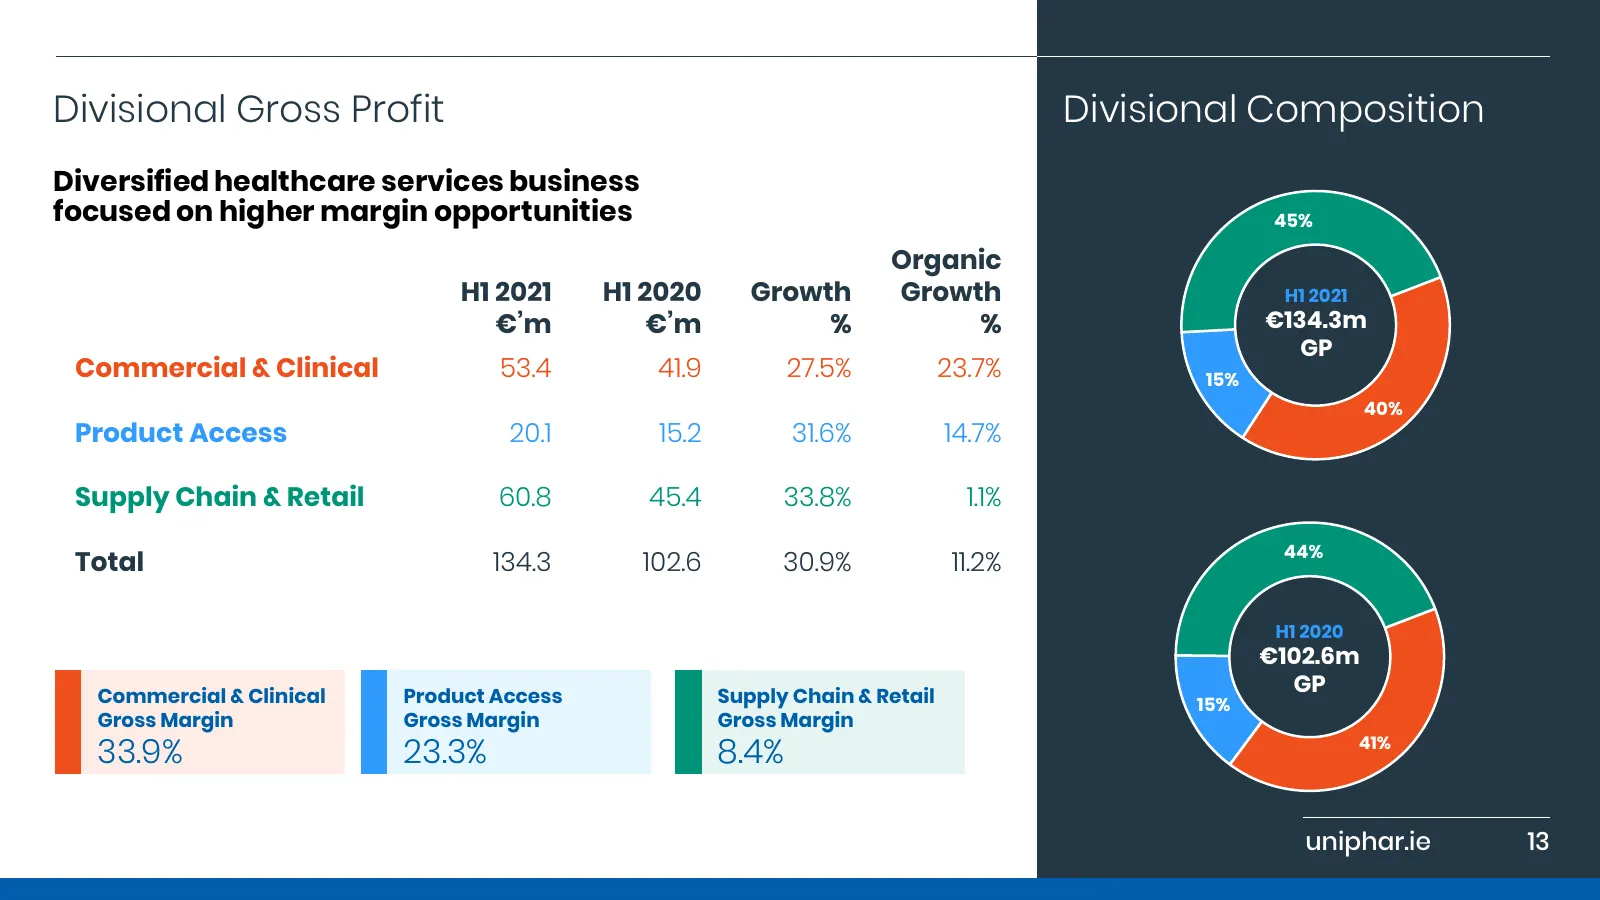
Divisional Gross Profit Divisional Composition Diversified healthcare services business focused on higher margin opportunities 45% Organic H1 2021 H1 2020 Growth Growth H1 2021 €’m €’m % % €134.3m GP Commercial & Clinical 53.4 41.9 27.5% 23.7% 15% 40% Product Access 20.1 15.2 31.6% 14.7% Supply Chai
Slide 14: Net Bank Debt Analysis
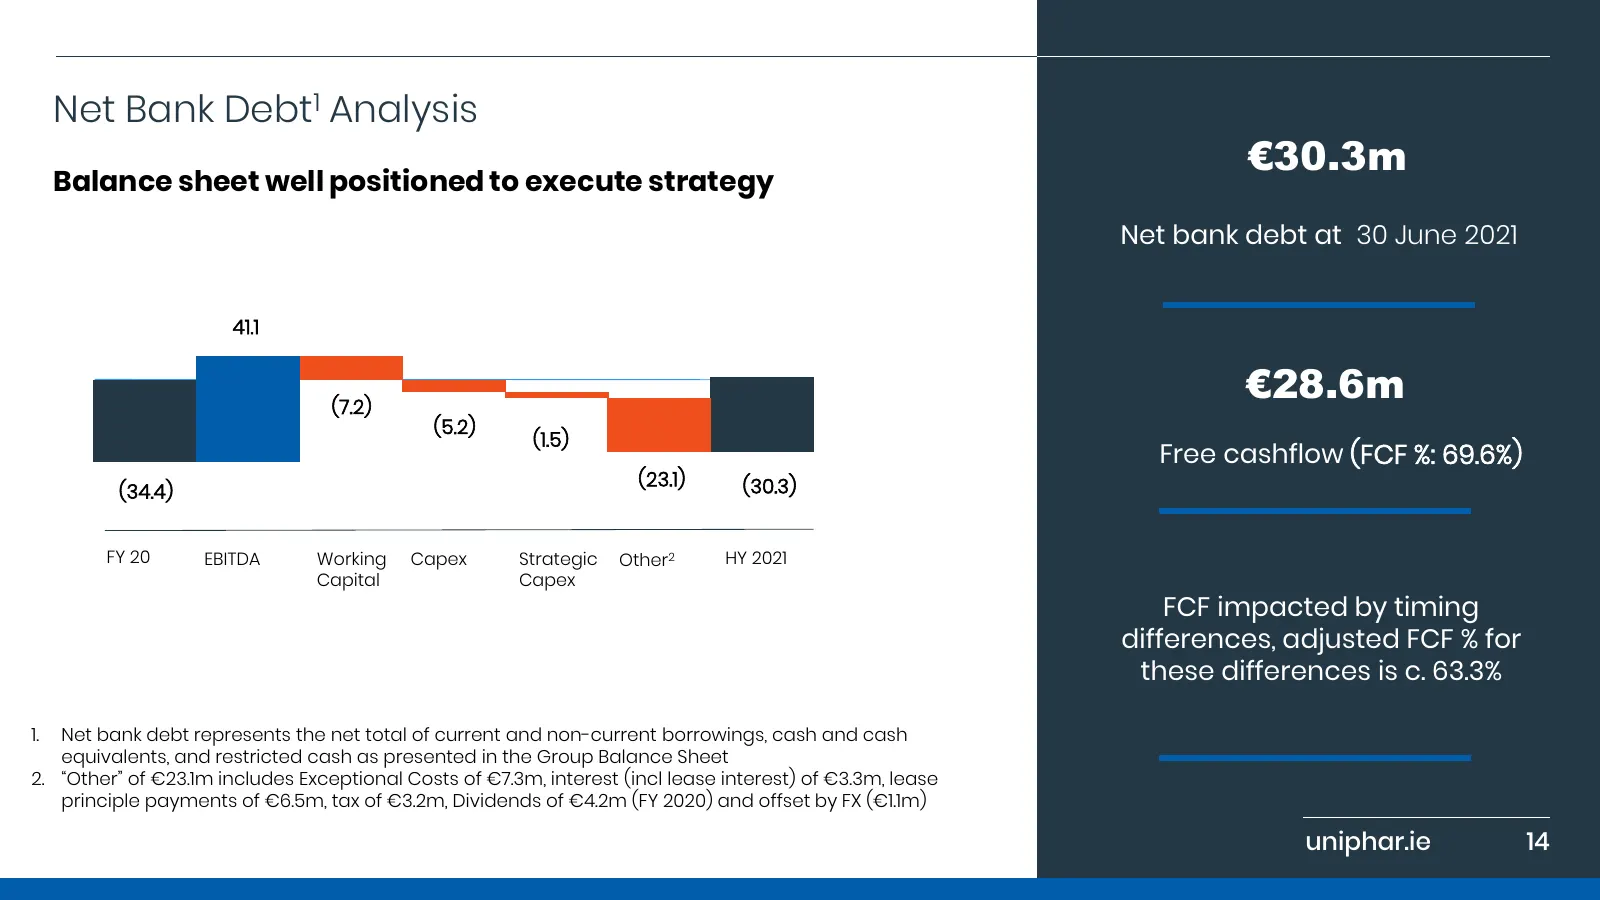
Net Bank Debt1 Analysis €30.3m Balance sheet well positioned to execute strategy Net bank debt at 30 June 2021 41.1 (7.2) €28.6m (5.2) (1.5) Free cashflow (FCF %: 69.6%) (23.1) (30.3) (34.4) FY 20 EBITDA Working Capex Strategic Other2 HY 2021 Capital Capex FCF impacted by timing differences, adjuste
Slide 15: Normalised FCF and FCF Conversion
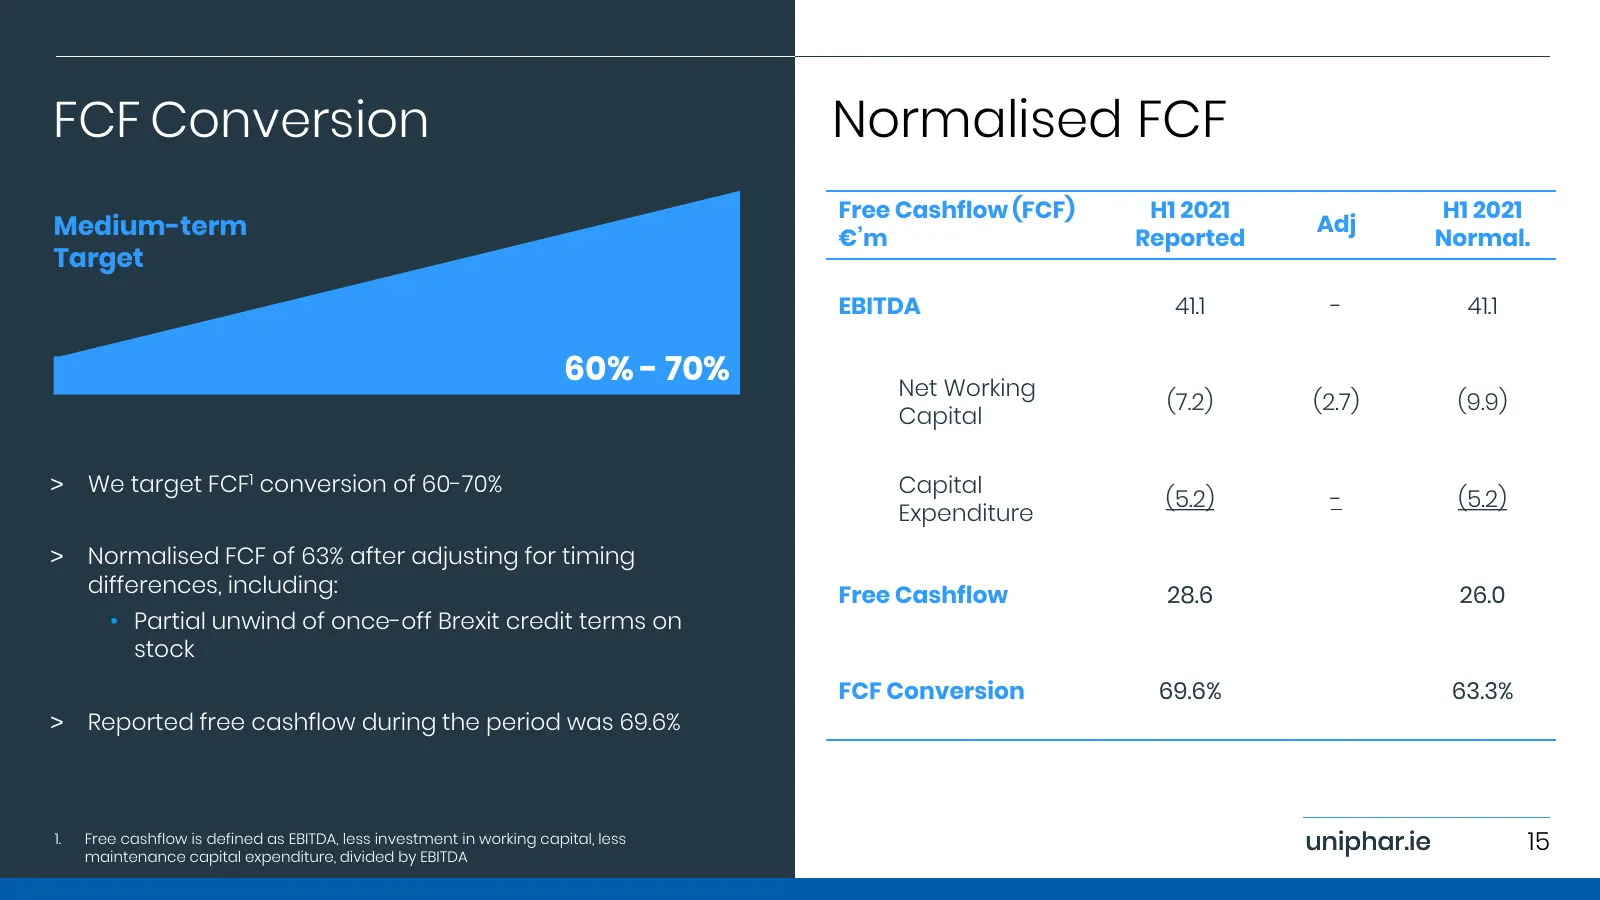
FCF Conversion Normalised FCF Free Cashflow (FCF) H1 2021 H1 2021 Medium-term €’m Reported Adj Normal. Target EBITDA 41.1 - 41.1 60% - 70% Net Working (7.2) (2.7) (9.9) Capital > We target FCF1 conversion of 60-70% Capital (5.2) - (5.2) Expenditure > Normalised FCF of 63% after adjusting for timing
Slide 16: Liquidity and Banking Facilities
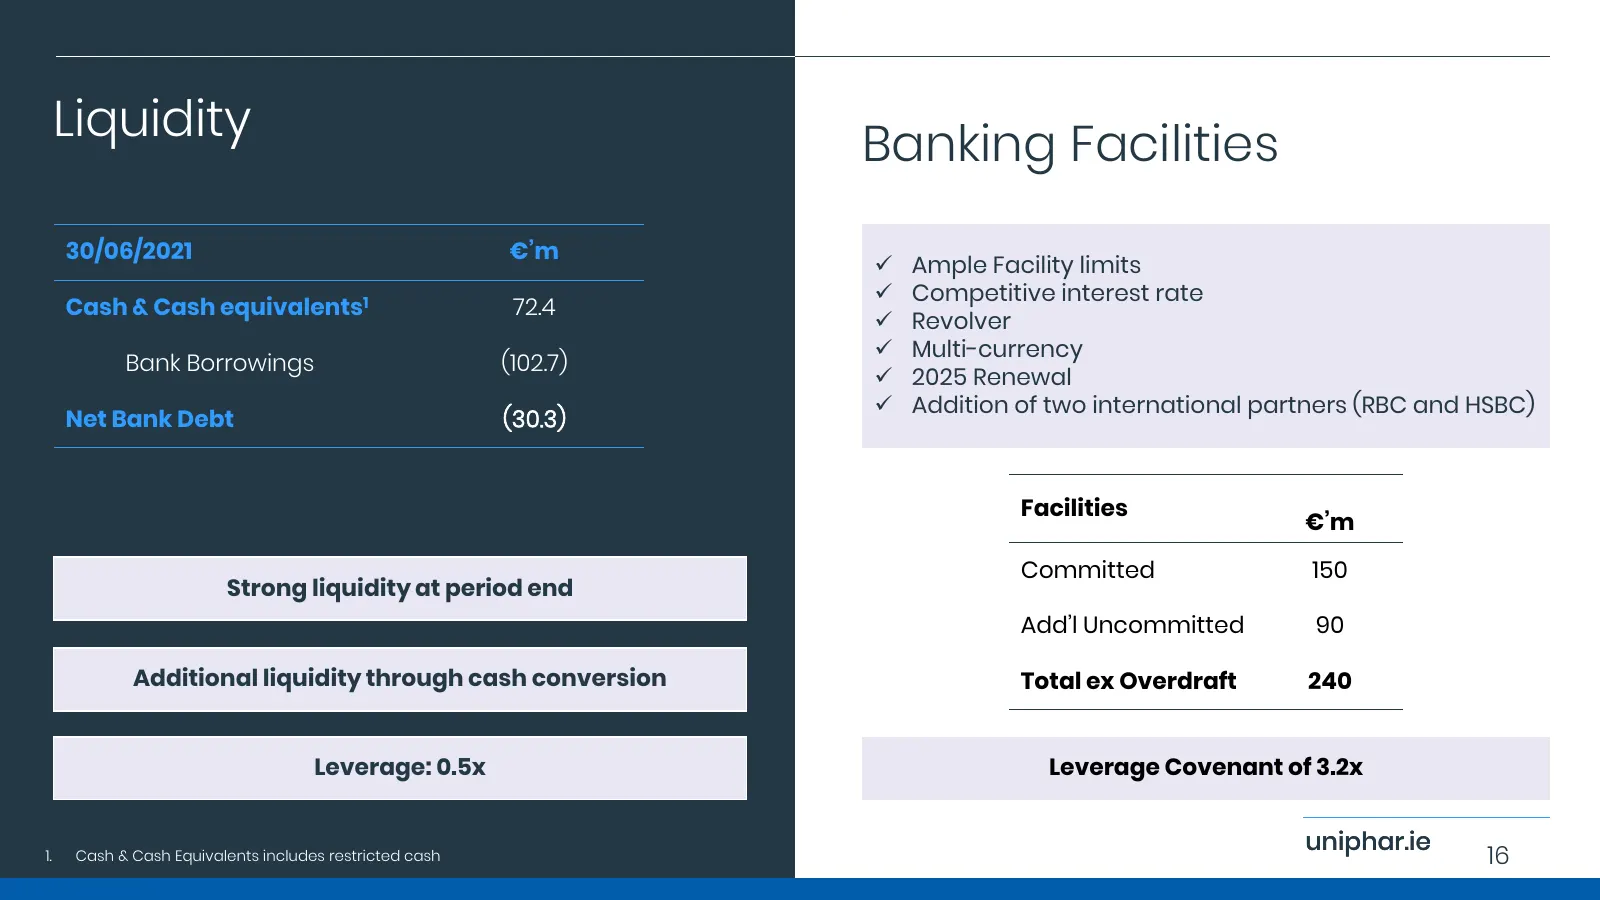
Liquidity Banking Facilities 30/06/2021 €’m ✓ Ample Facility limits ✓ Competitive interest rate Cash & Cash equivalents1 72.4 ✓ Revolver ✓ Multi-currency Bank Borrowings (102.7) ✓ 2025 Renewal ✓ Addition of two international partners (RBC and HSBC) Net Bank Debt (30.3) Facilities €’m Committed 150 S
Slide 17: Strategic Initiatives
Strategic Initiatives uniphar.ie 17
Slide 18: Divisional Objectives
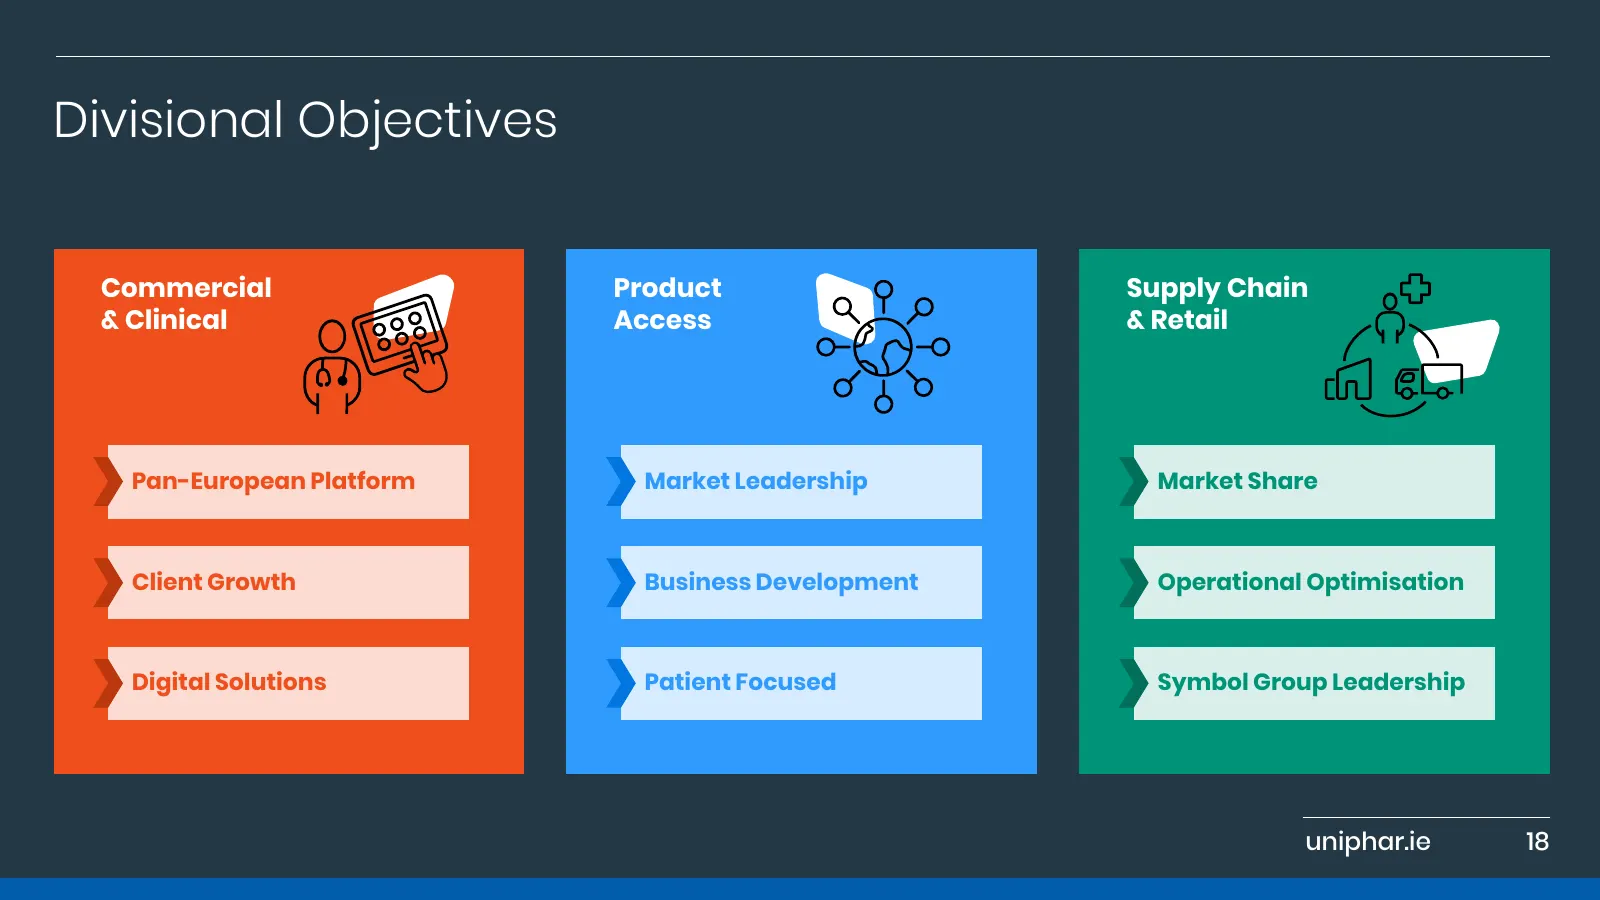
Divisional Objectives Commercial Product Supply Chain & Clinical Access & Retail Pan-European Platform Market Leadership Market Share Client Growth Business Development Operational Optimisation Digital Solutions Patient Focused Symbol Group Leadership uniphar.ie 18
Slide 19: M&A: Continued Execution and Integration
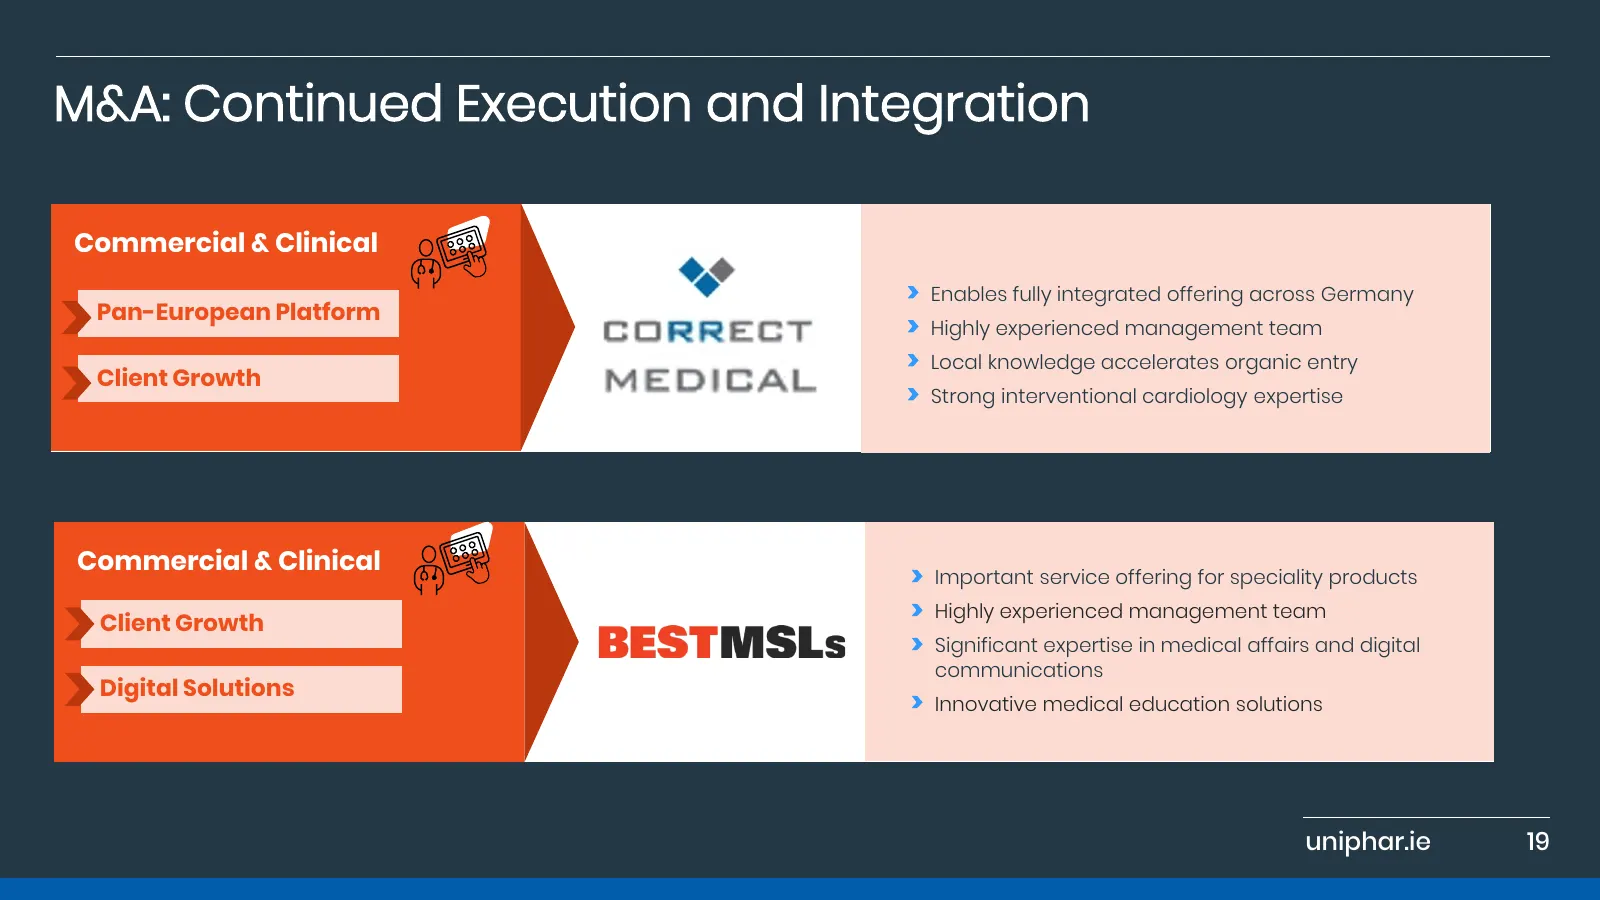
M&A: Continued Execution and Integration Commercial & Clinical Enables fully integrated offering across Germany Pan-European Platform Highly experienced management team Local knowledge accelerates organic entry Client Growth Strong interventional cardiology expertise Commercial & Clinical Important
Slide 20: Commercial & Clinical: Scaling in Europe
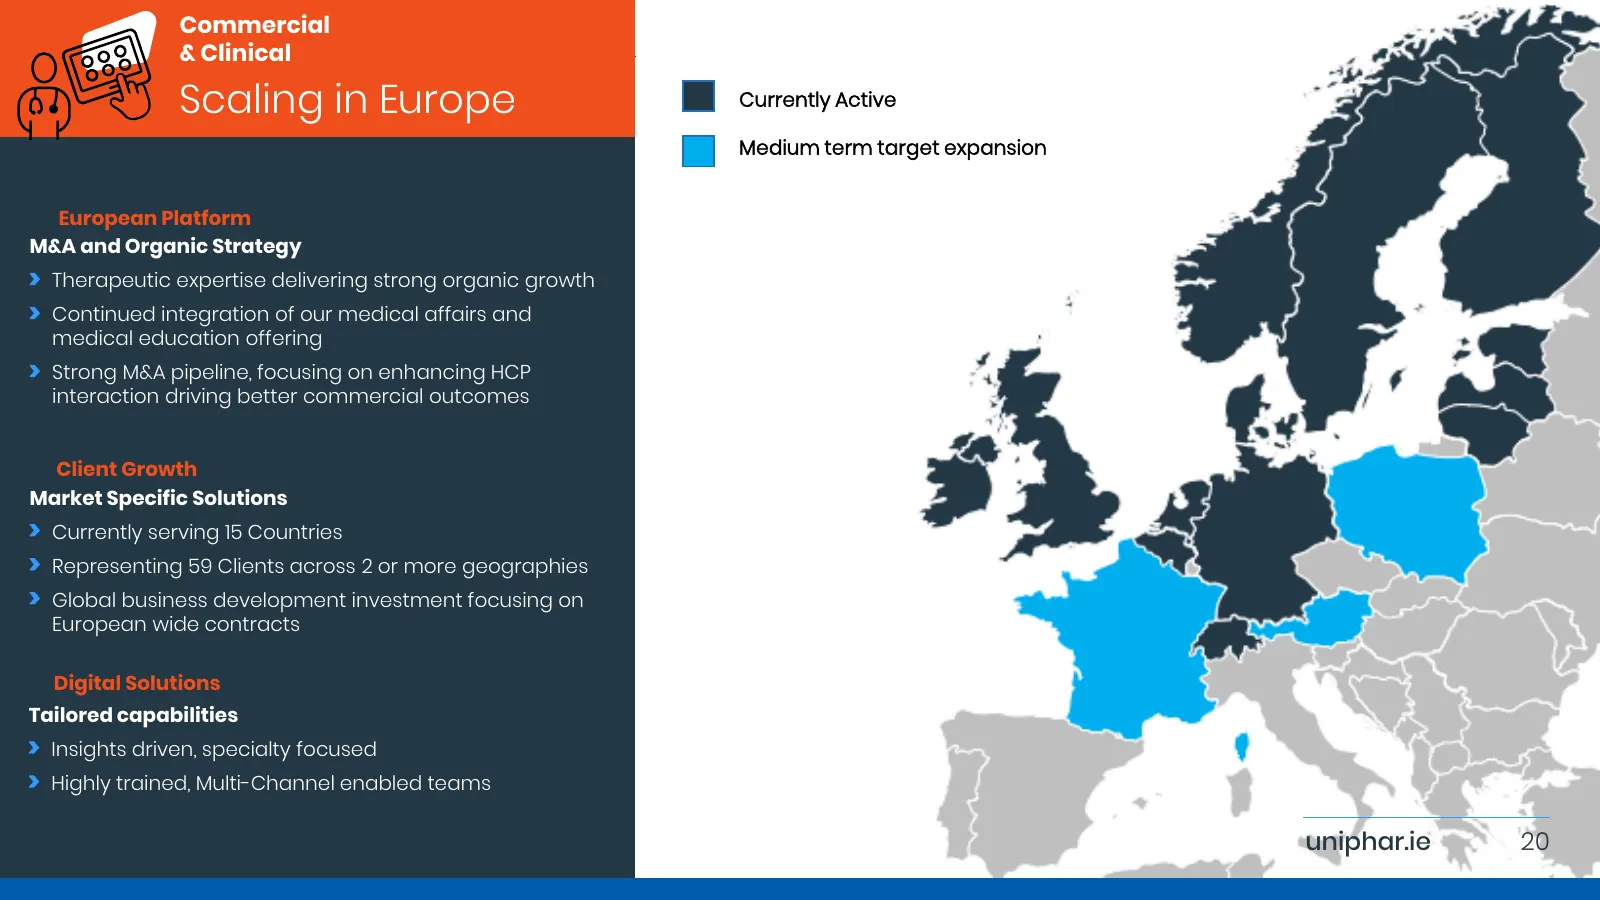
Commercial & Clinical Scaling in Europe Currently Active 10% Medium term target expansion European Platform M&A and Organic Strategy Therapeutic expertise delivering strong organic growth Continued integration of our medical affairs and medical education offering Strong M&A pipeline, focusing on enh
Slide 21: Product Access: Global Capabilities
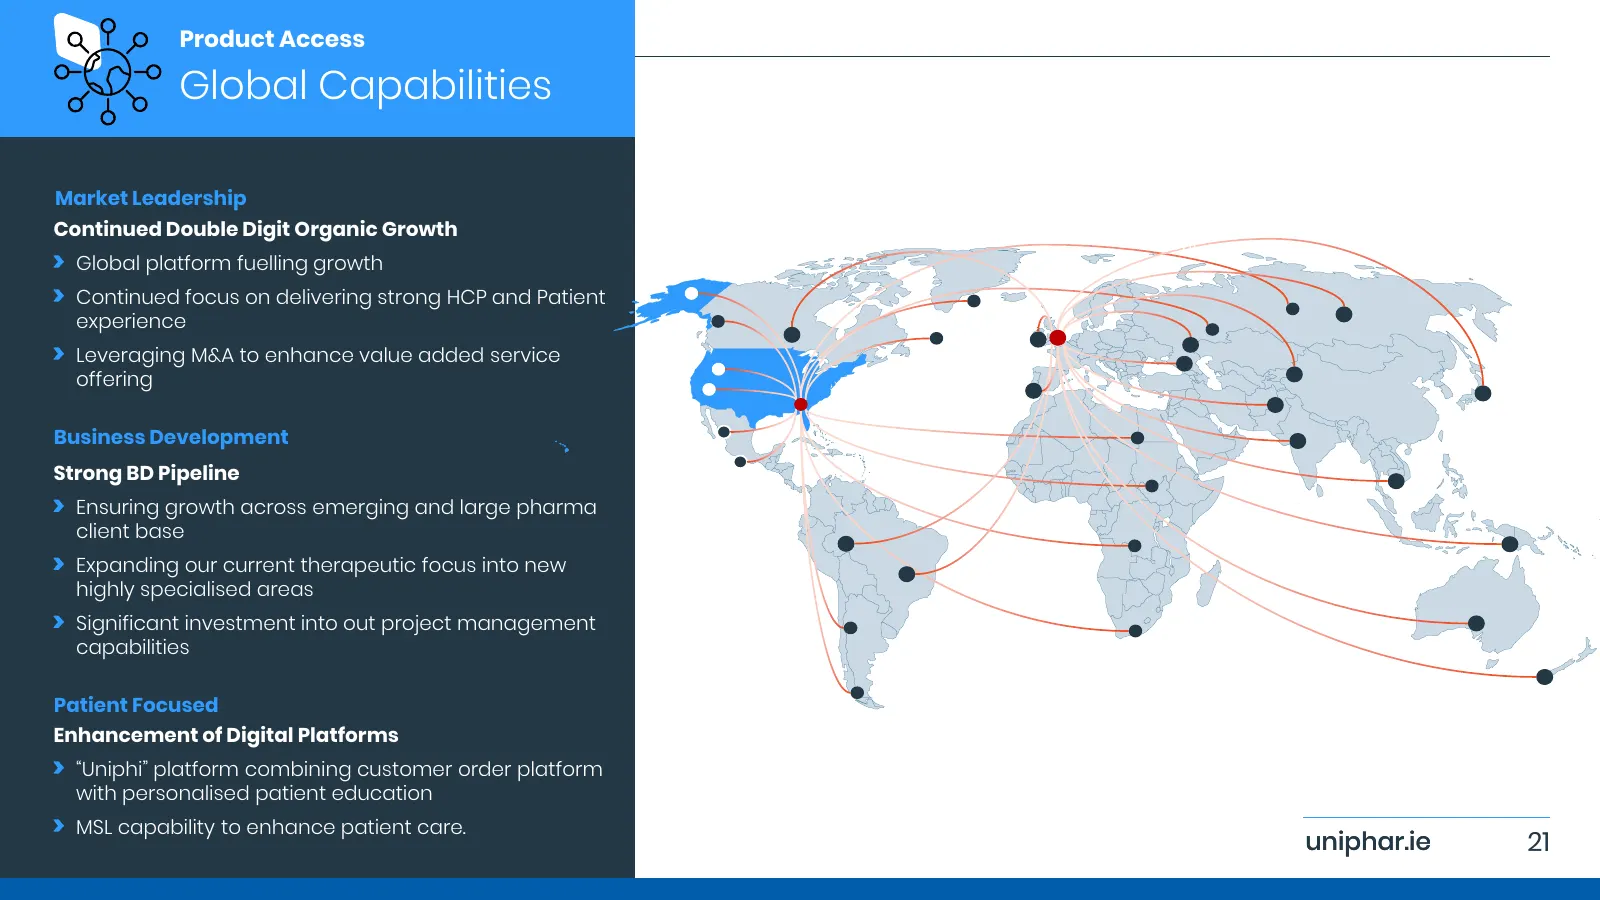
Product Access Global Capabilities 10% Market Leadership Continued Double Digit Organic Growth 42% Global platform fuelling growth Continued focus on delivering strong HCP and Patient experience Leveraging M&A to enhance value added service offering Business Development Strong BD Pipeline Ensuring g
Slide 22: Supply Chain & Retail: Market Leadership
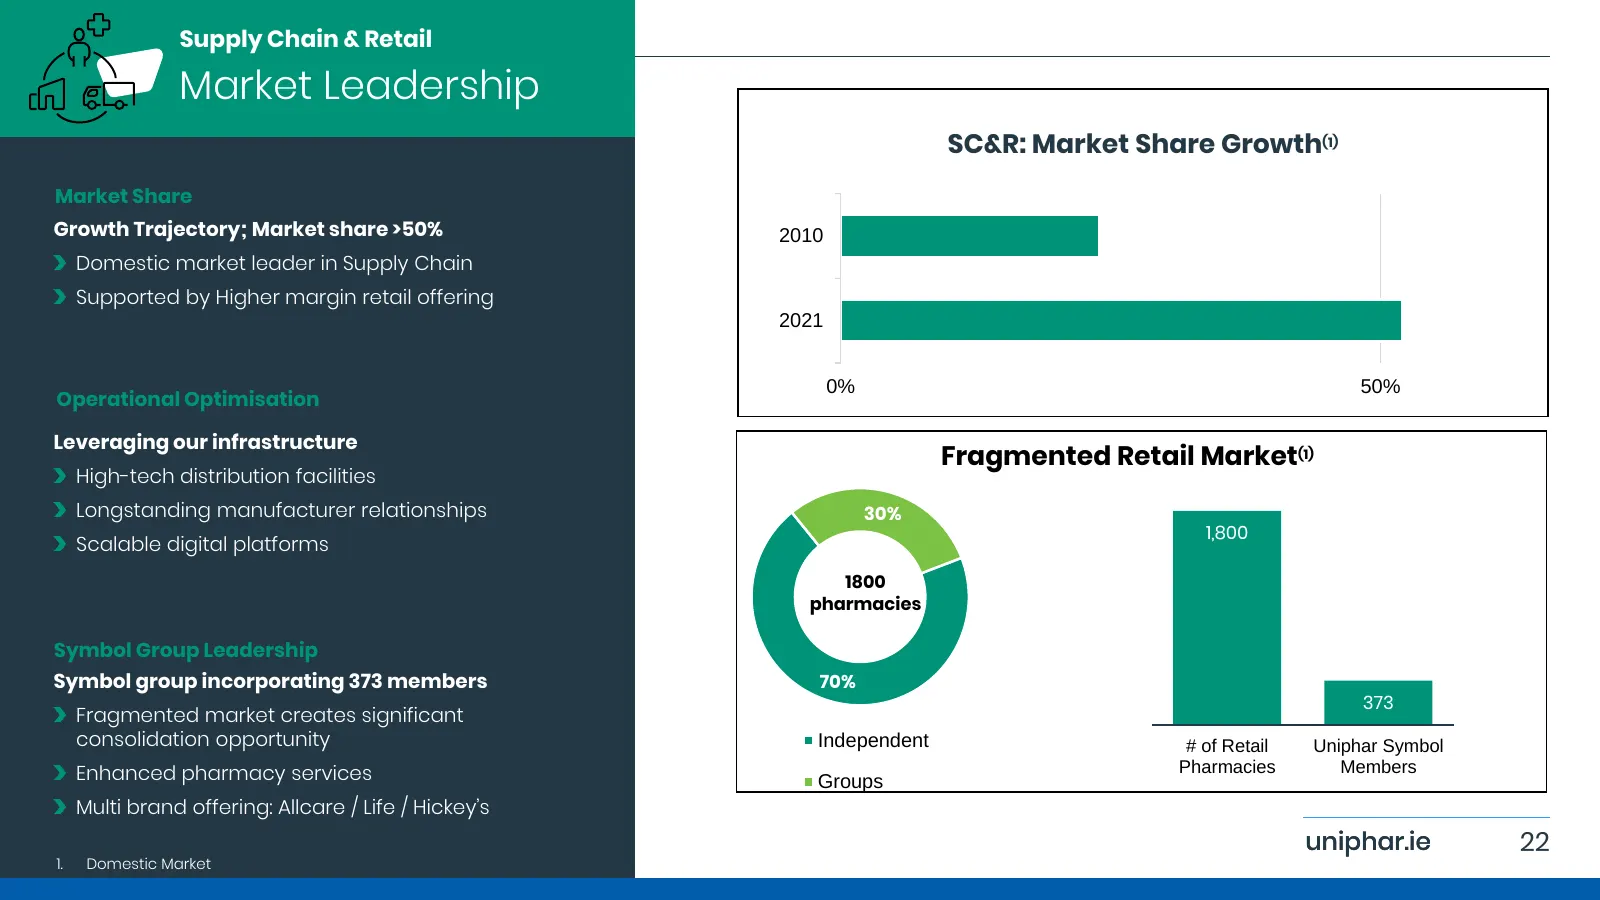
Supply Chain & Retail Market Leadership 10% SC&R: Market Share Growth(1) Market Share Growth Trajectory; Market share >50% 2010 42% Domestic market leader in Supply Chain Supported by Higher margin retail offering 2021 0% 50% Operational Optimisation Leveraging our infrastructure Fragmented Retail M
Slide 23: Capital Allocation, Outlook & Investment Case
Capital Allocation, Outlook & Investment Case uniphar.ie 23
Slide 24: Capital Allocation
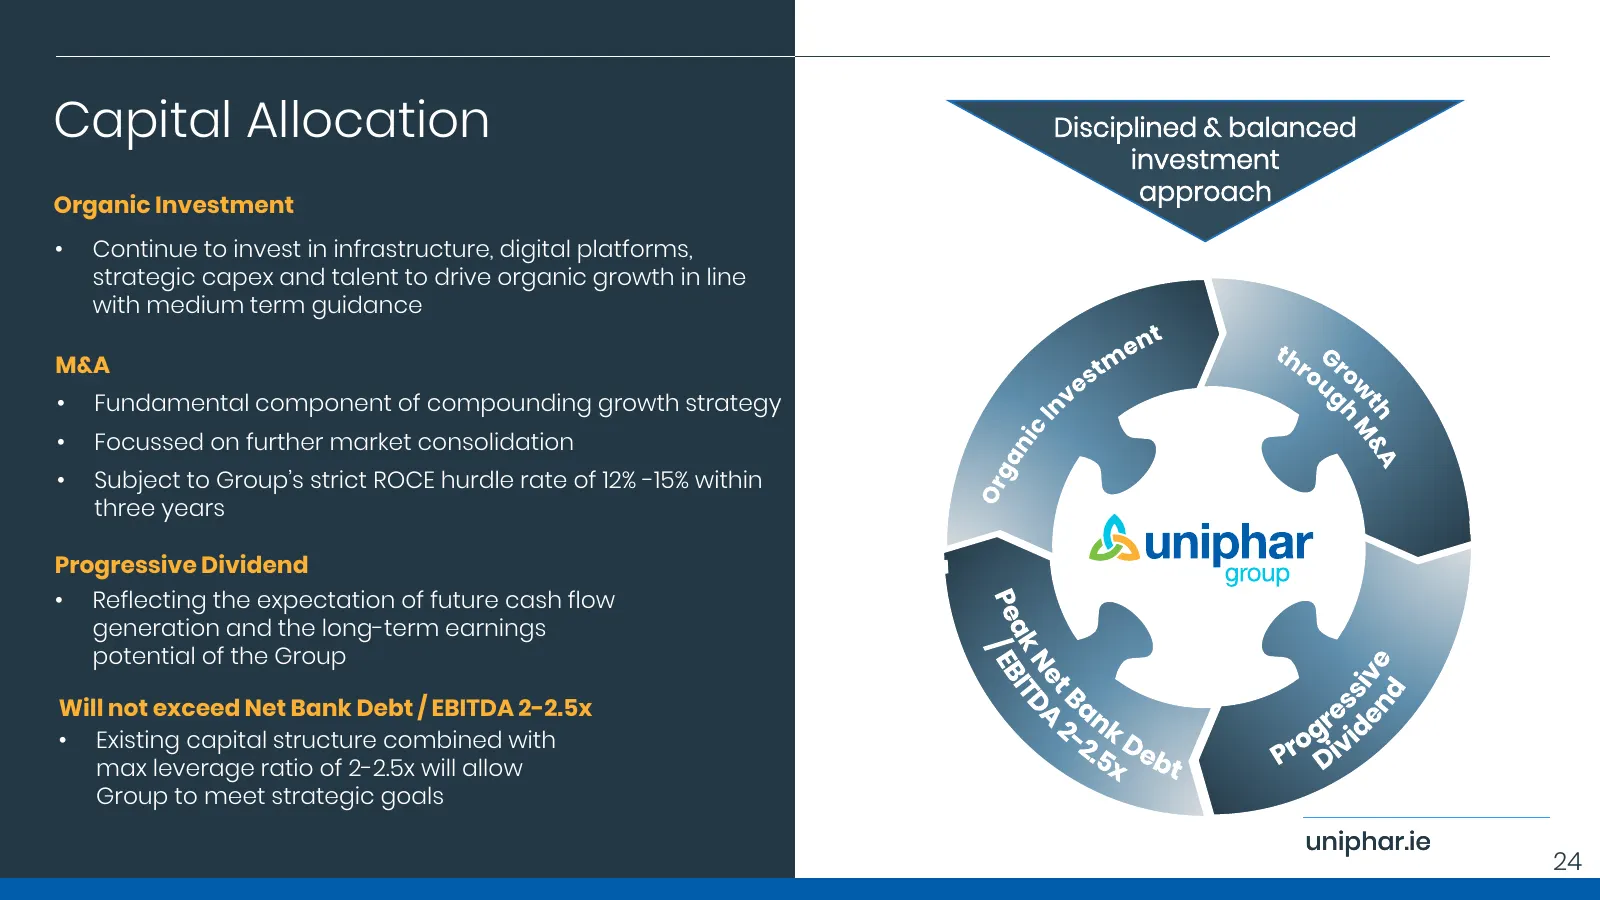
Capital Allocation Disciplined & balanced investment Organic Investment approach • Continue to invest in infrastructure, digital platforms, strategic capex and talent to drive organic growth in line with medium term guidance O M&A • Fundamental component of compounding growth strategy • Focussed on
Slide 25: Medium term outlook unchanged & 2021 expected to deliver on plan
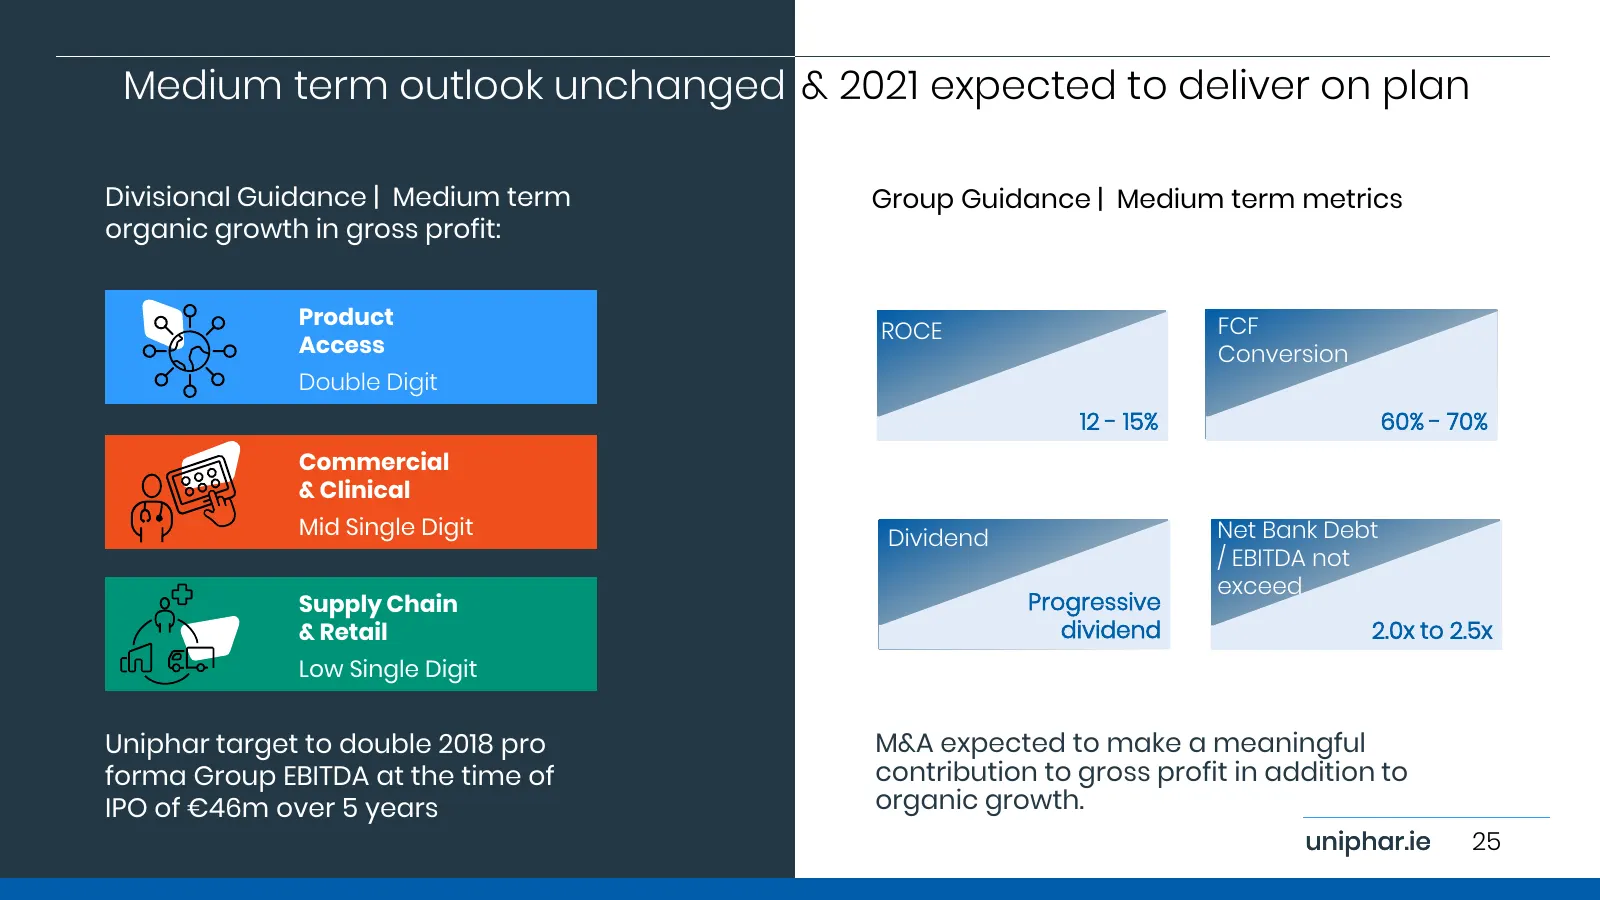
Medium term outlook unchanged & 2021 expected to deliver on plan Divisional Guidance | Medium term Group Guidance | Medium term metrics organic growth in gross profit: Product FCF ROCE Access Conversion Double Digit 12 - 15% 60% - 70% Commercial & Clinical Mid Single Digit Dividend Net Bank Debt / E
Slide 26: Investment Case
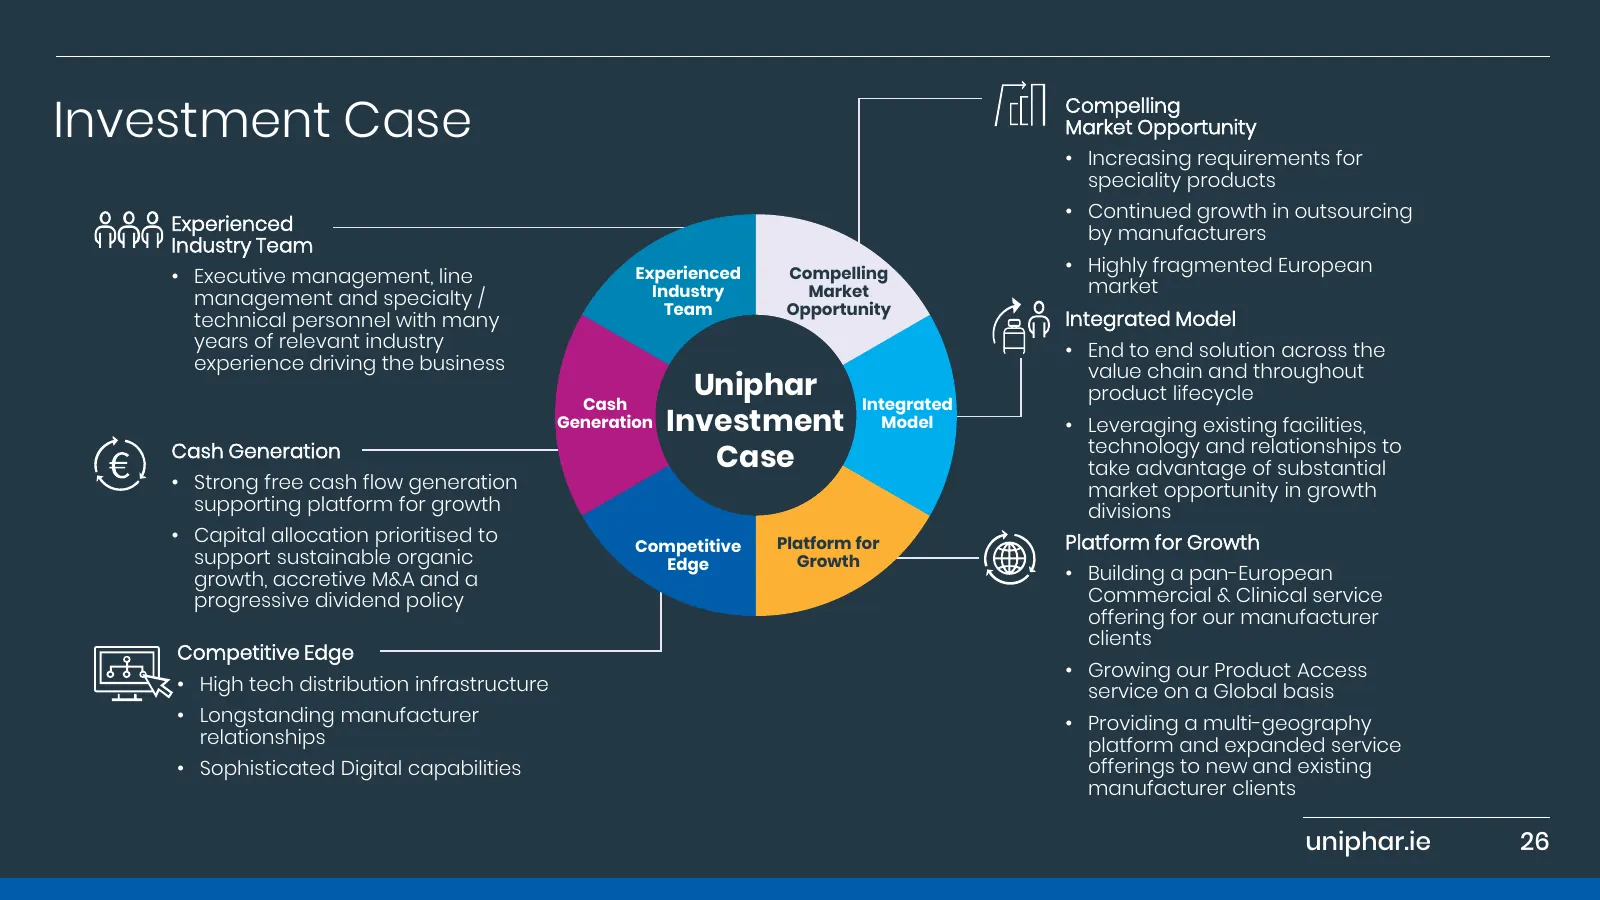
Investment Case Compelling Market Opportunity • Increasing requirements for speciality products • Continued growth in outsourcing Experienced by manufacturers Industry Team Experienced Compelling • Highly fragmented European • Executive management, line market management and specialty / Industry Mar

Slide 27: Q&A
Q&A 27

Slide 28: Contact Details
Uniphar.ie Contact Details Brian O’Shaughnessy Group Director of Corporate Development +353 (0)1 428 7777 investor.relations@Uniphar.ie Q4 PR Public Relations Adviser to Uniphar Iarla Mongey +353 (0)1 475 1444; or +353 (0)87 235 6461 28

Slide 29: Thank You
Uniphar.ie Thank You 29
Slide 30: Appendices
Appendices uniphar.ie 30
Slide 31: Uniphar History
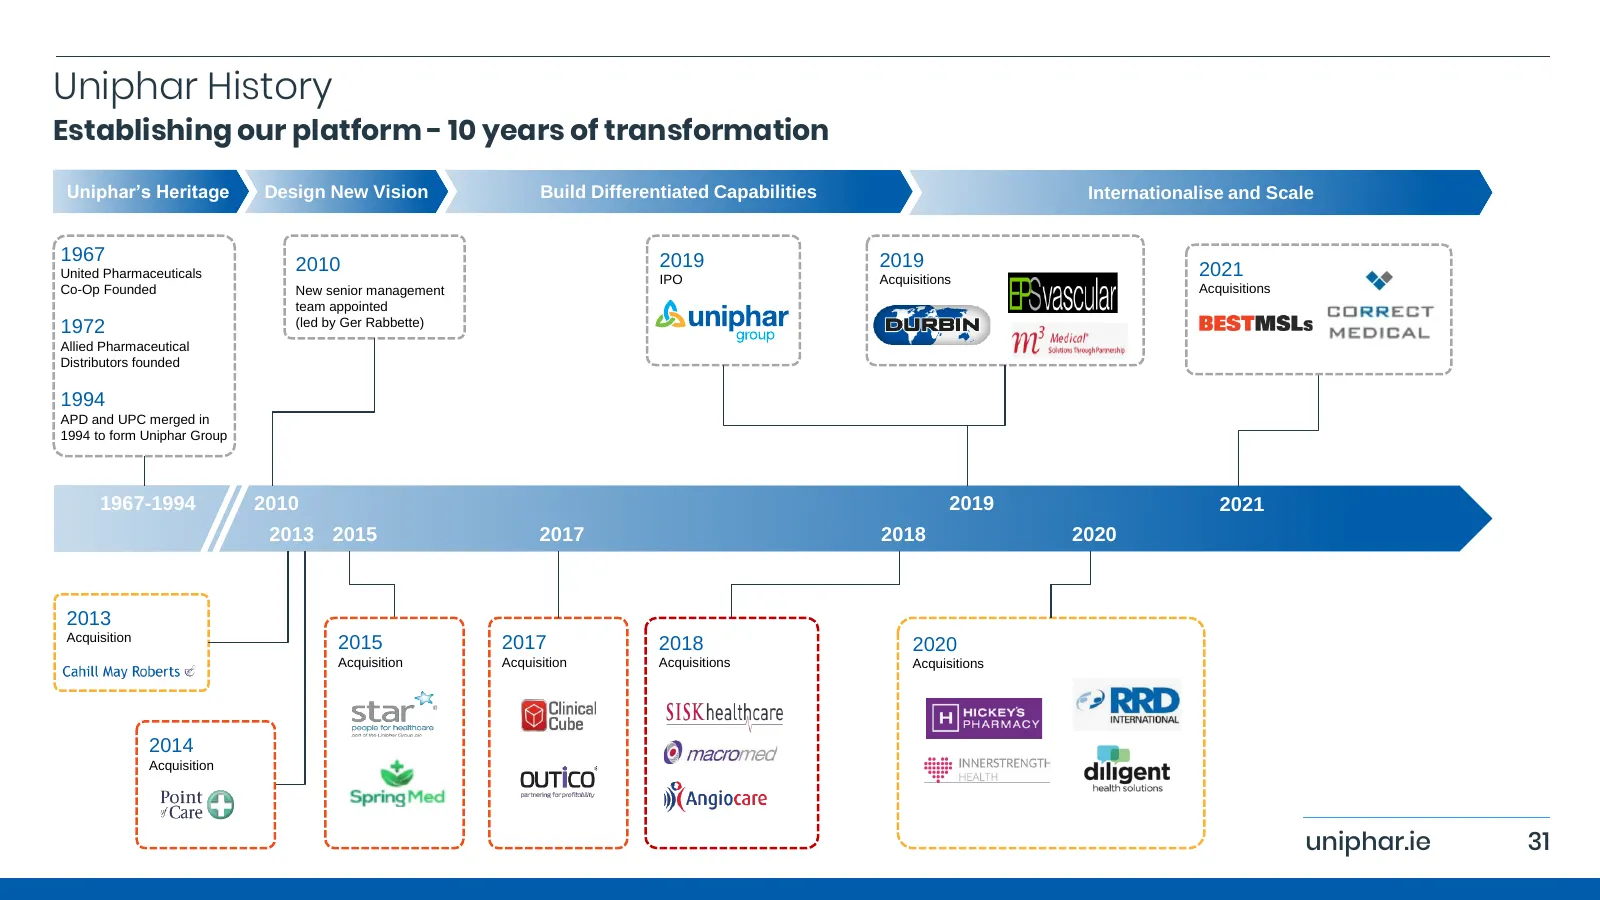
Uniphar History Establishing our platform - 10 years of transformation Uniphar’s Heritage Design New Vision Build Differentiated Capabilities Internationalise and Scale 1967 2019 2019 United Pharmaceuticals 2010 2021 IPO Acquisitions Co-Op Founded New senior management Acquisitions team appointed 19
Slide 32: Peer Landscape
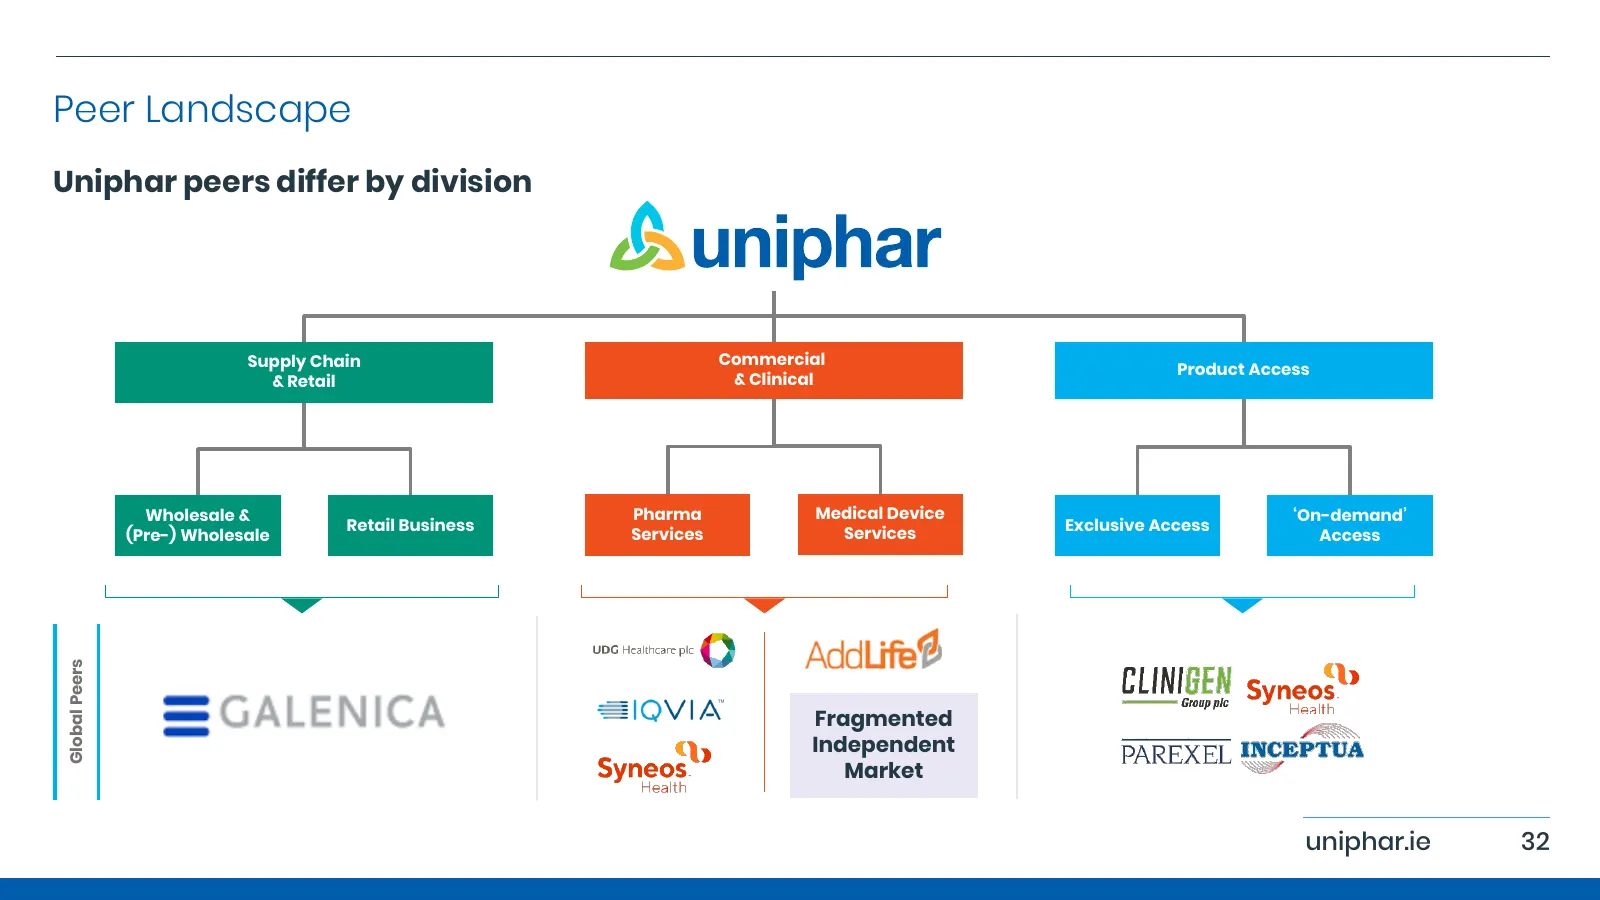
Peer Landscape Uniphar peers differ by division Supply Chain Commercial Product Access & Retail & Clinical Wholesale & Pharma Medical Device ‘On-demand’ Retail Business Exclusive Access (Pre-) Wholesale Services Services Access Global Peers Fragmented Independent Market uniphar.ie 32
Slide 33: Product Lifecycle Focus: Regulatory Approval
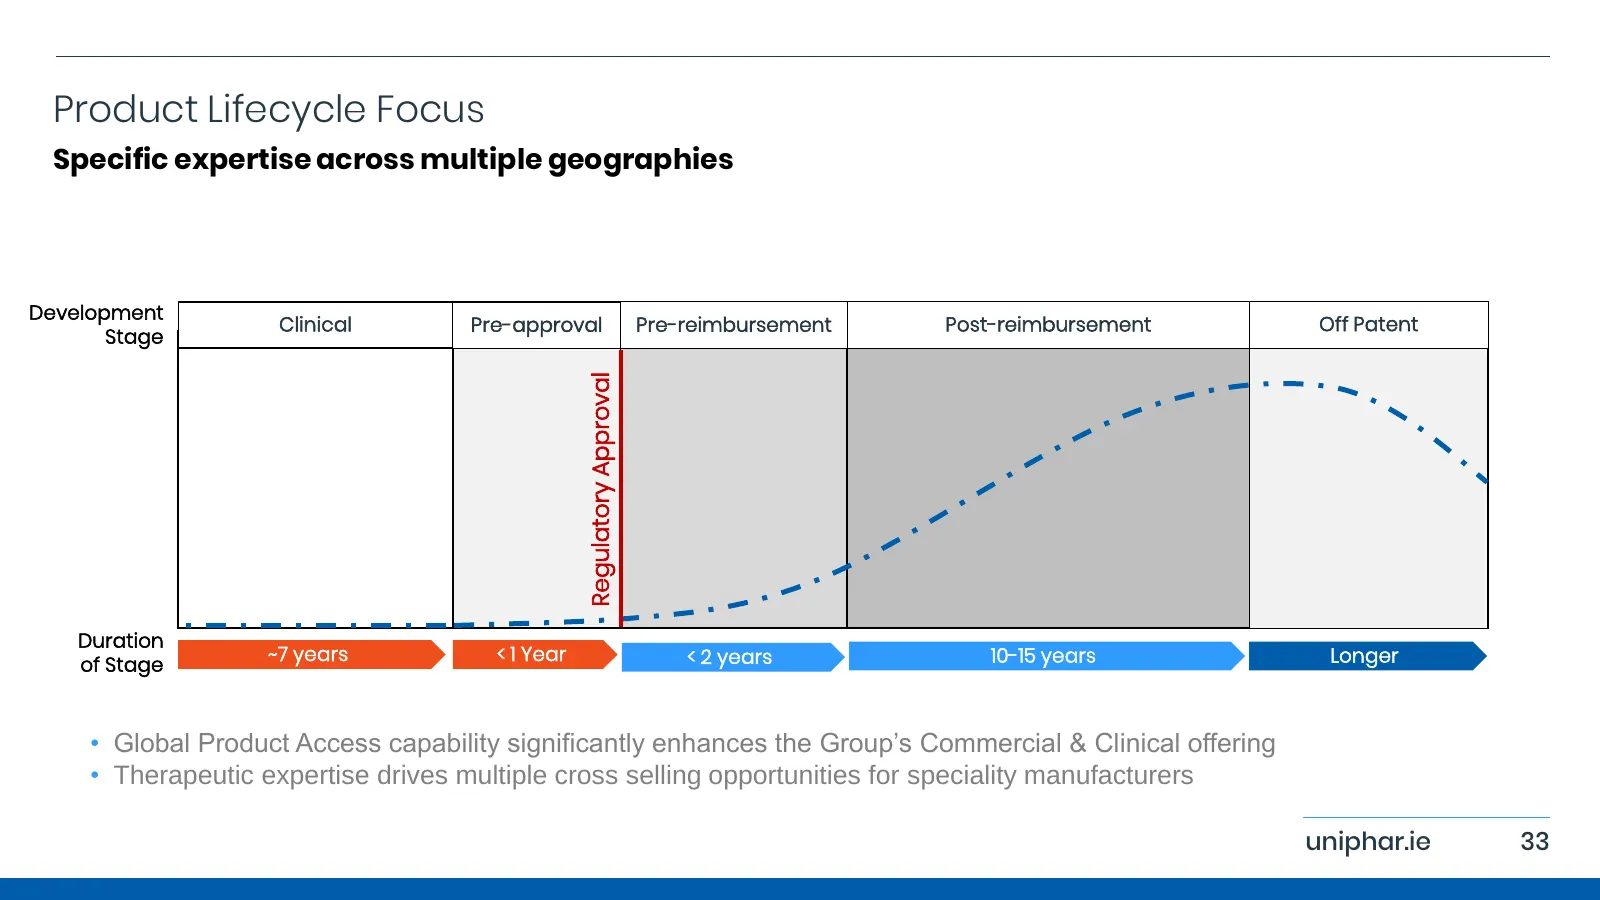
Product Lifecycle Focus Specific expertise across multiple geographies Development Clinical Pre-approval Pre-reimbursement Post-reimbursement Off Patent Stage Regulatory Approval Duration ~7 years < 1 Year < 2 years 10-15 years Longer of Stage • Global Product Access capability significantly enhance
Slide 34: Service Impact Case Studies
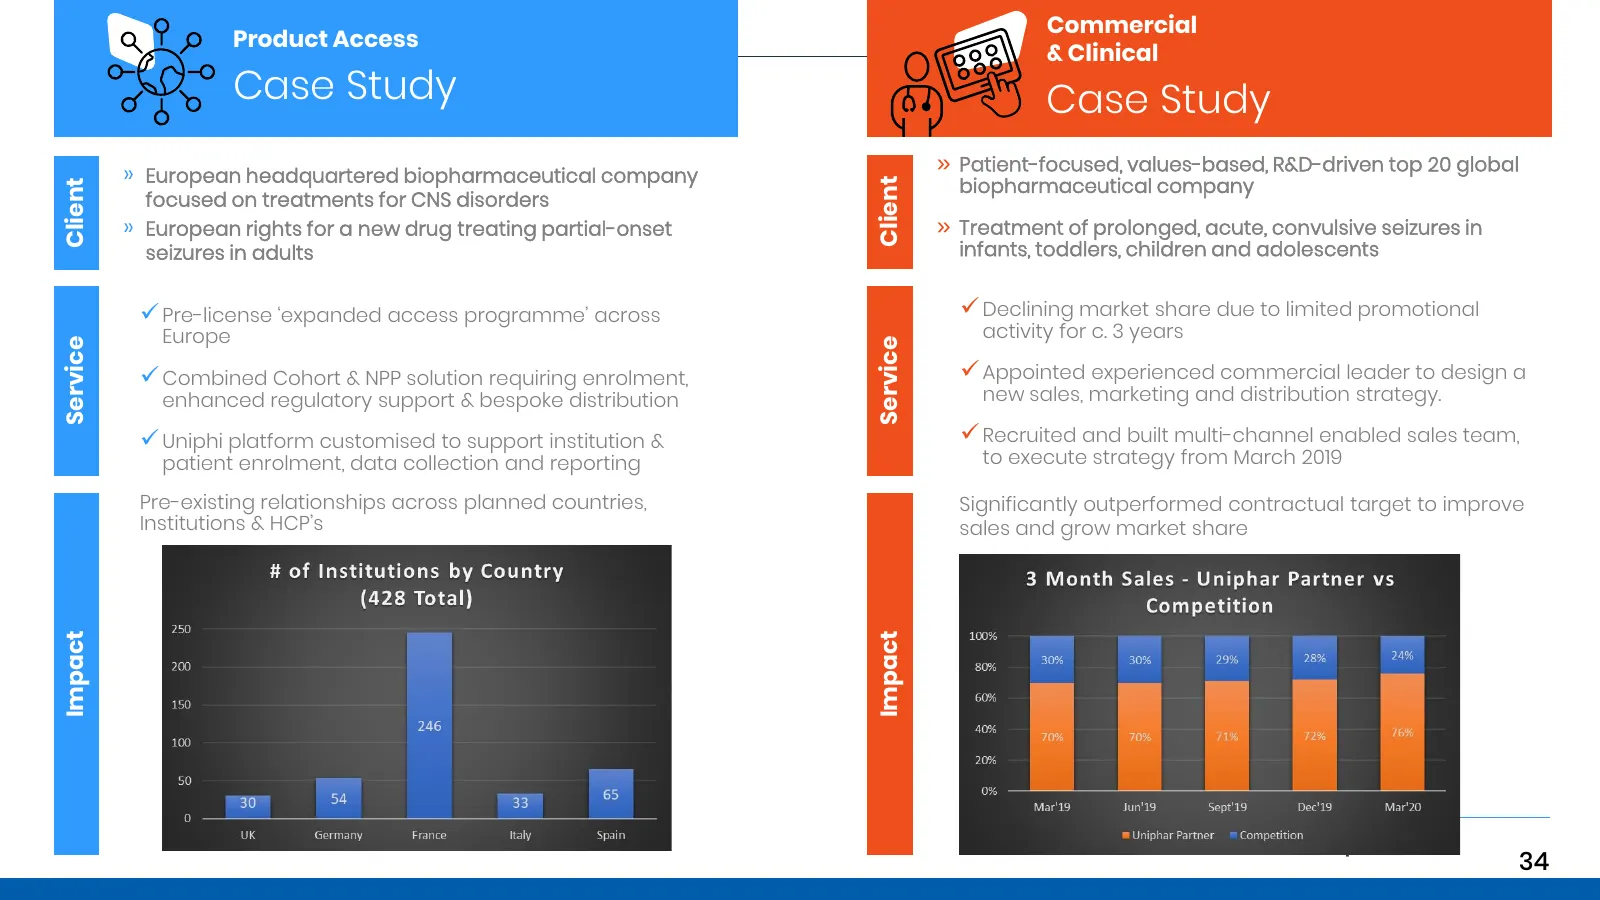
Commercial Product Access & Clinical Case Study Case Study » European headquartered biopharmaceutical company » Patient-focused, values-based, R&D-driven top 20 global biopharmaceutical company Client Client focused on treatments for CNS disorders » European rights for a new drug treating partial-on
Slide 35: Summary Management Balance Sheet
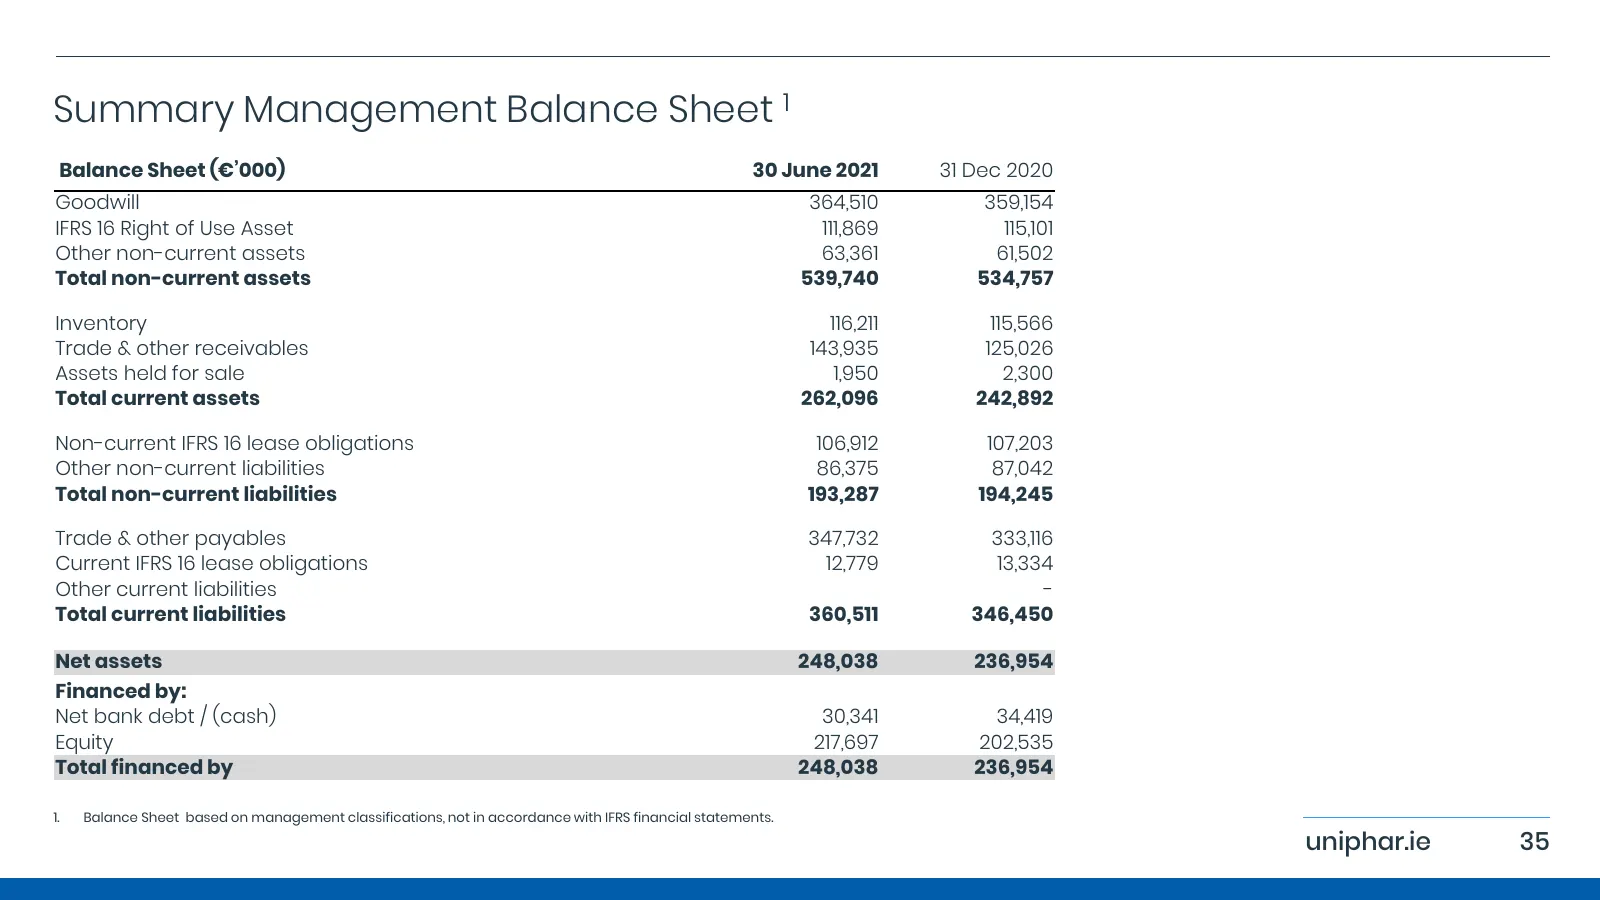
Summary Management Balance Sheet 1 Balance Sheet (€’000) 30 June 2021 31 Dec 2020 Goodwill 364,510 359,154 IFRS 16 Right of Use Asset 111,869 115,101 Other non-current assets 63,361 61,502 Total non-current assets 539,740 534,757 Inventory 116,211 115,566 Trade & other receivables 143,935 125,026 As
Slide 36: Return on Capital Employed
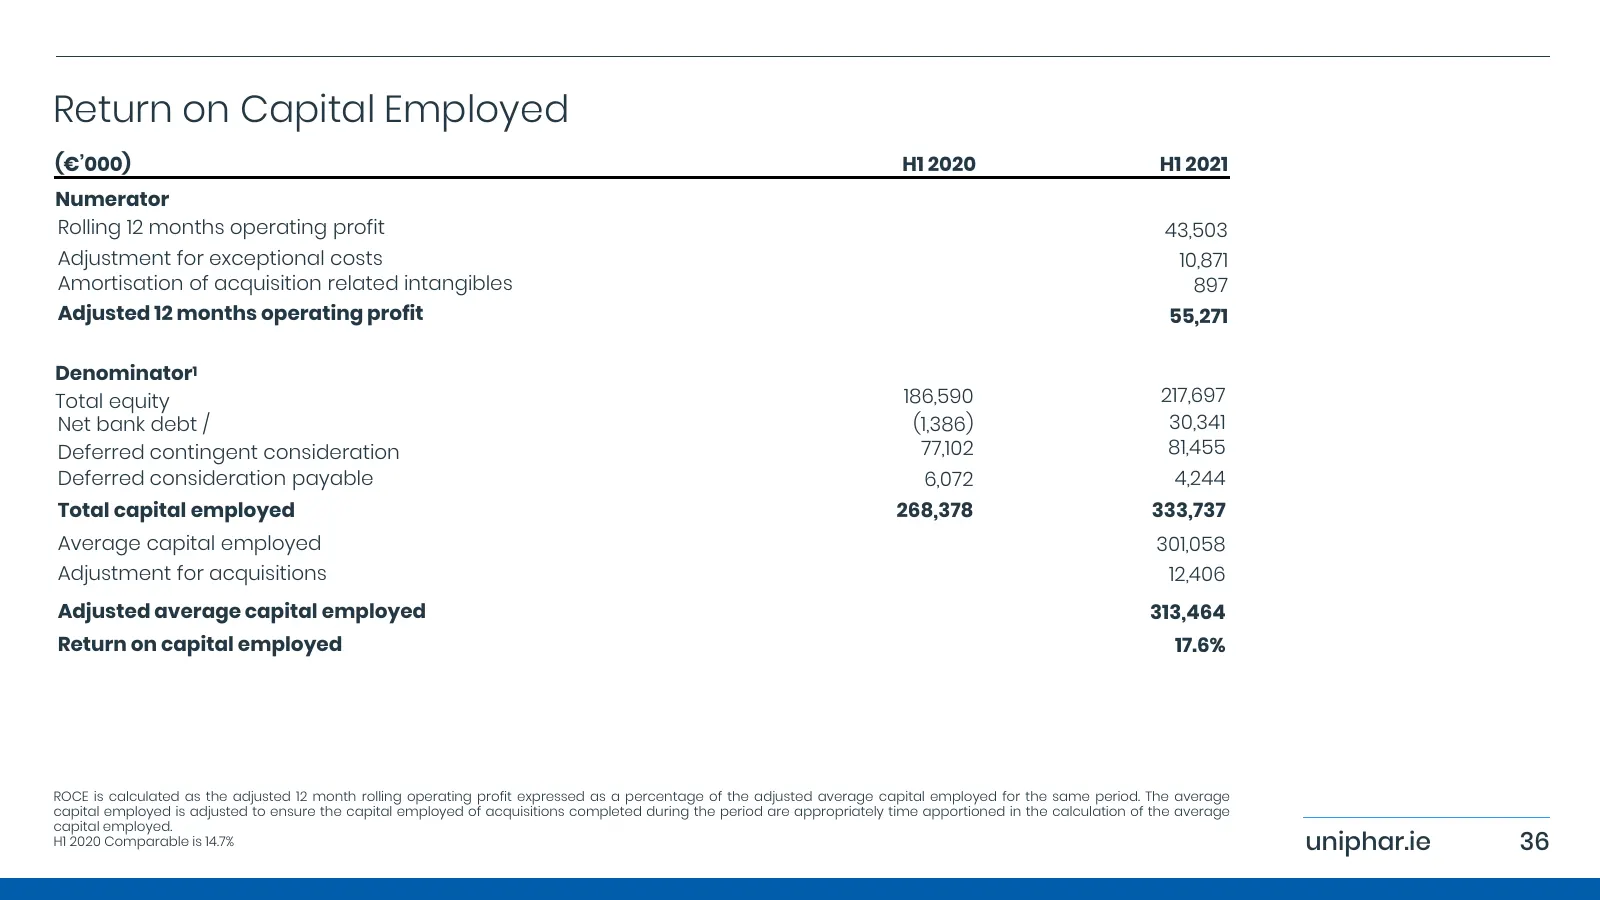
Return on Capital Employed (€’000) H1 2020 H1 2021 Numerator Rolling 12 months operating profit 43,503 Adjustment for exceptional costs 10,871 Amortisation of acquisition related intangibles 897 Adjusted 12 months operating profit 55,271 Denominator1 Total equity 186,590 217,697 Net bank debt / (1,3
Slide 37: Summary Group Financial Information
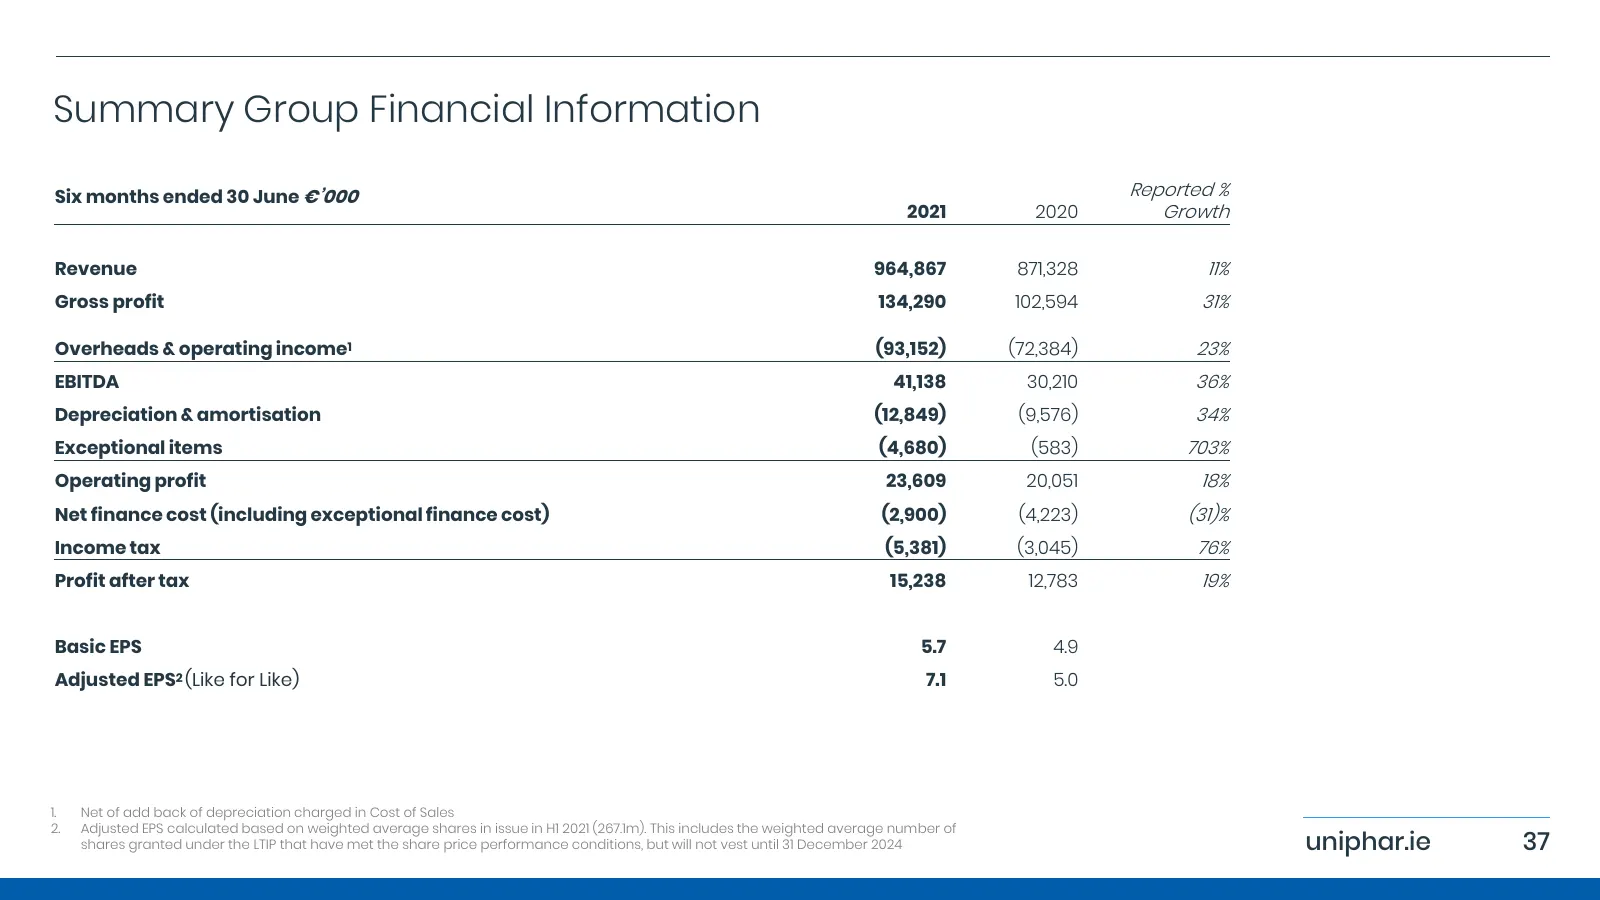
Summary Group Financial Information Six months ended 30 June €’000 Reported % 2021 2020 Growth Revenue 964,867 871,328 11% Gross profit 134,290 102,594 31% Overheads & operating income1 (93,152) (72,384) 23% EBITDA 41,138 30,210 36% Depreciation & amortisation (12,849) (9,576) 34% Exceptional items
Slide 38: EBITDA Reconciliation
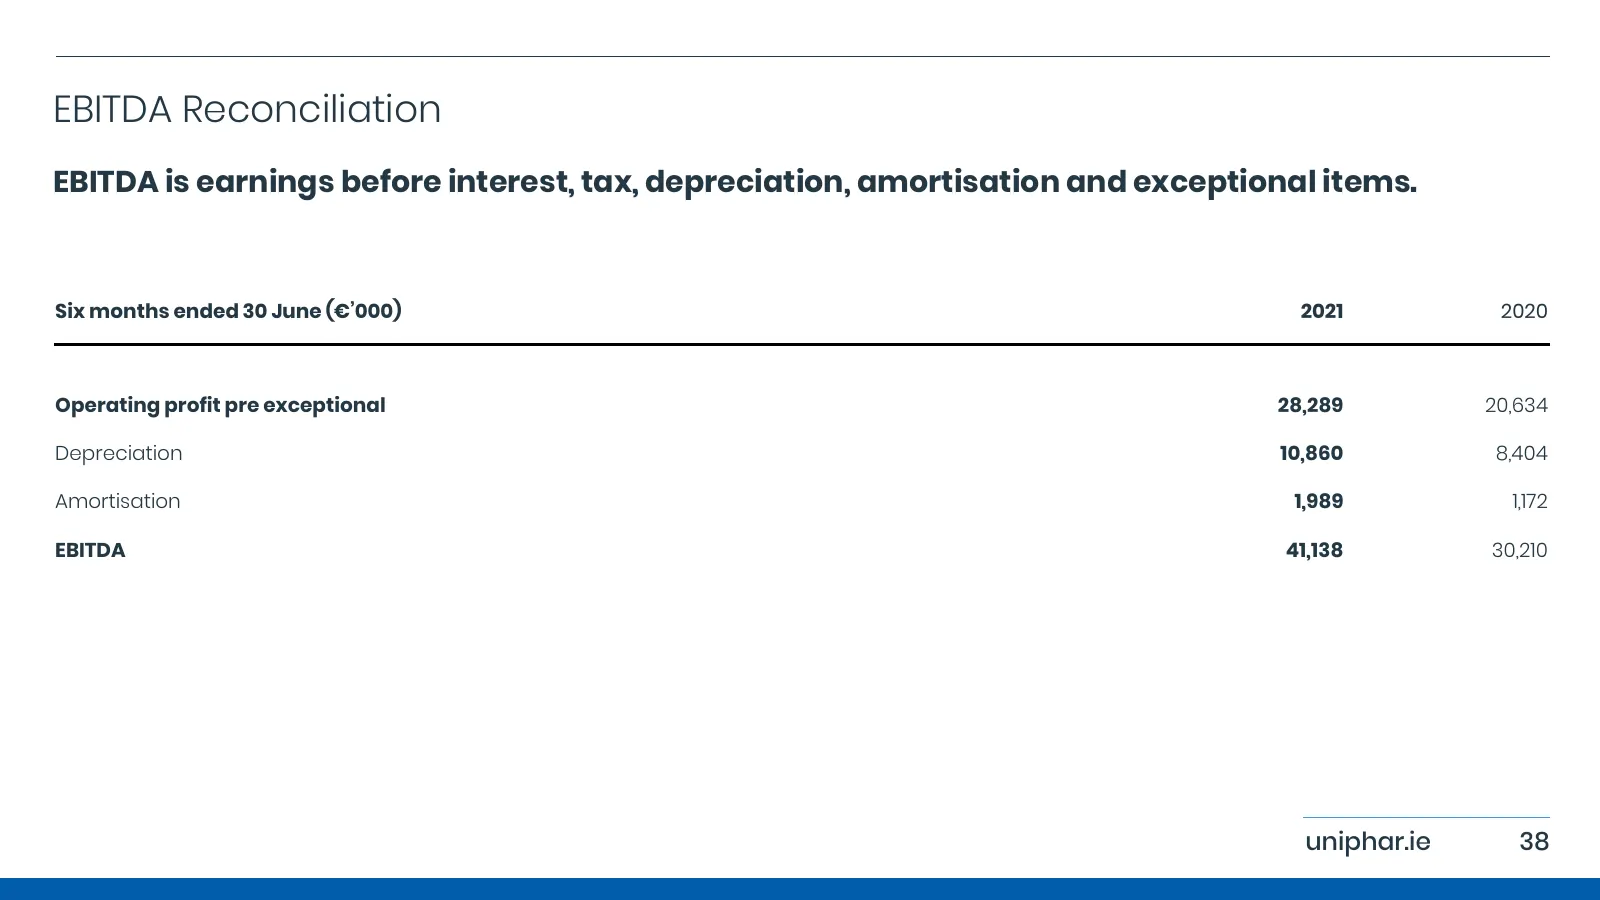
EBITDA Reconciliation EBITDA is earnings before interest, tax, depreciation, amortisation and exceptional items. Six months ended 30 June (€’000) 2021 2020 Operating profit pre exceptional 28,289 20,634 Depreciation 10,860 8,404 Amortisation 1,989 1,172 EBITDA 41,138 30,210 uniphar.ie 38
Source: Internet Archive copy of uniphar.ie
More decks from Uniphar PLC
 H1 2026 Earnings Presentation39 slides · Sep 8, 2026
 FY2025 Earnings Presentation39 slides · Feb 24, 2026
 FY2024 Earnings Presentation38 slides · Feb 25, 2025
 H1 2024 Earnings Presentation37 slides · Sep 3, 2024
 FY2023 Earnings Presentation39 slides · Feb 27, 2024
 H1 2023 Earnings Presentation41 slides · Sep 14, 2023