Noranda Aluminum — Q4 2010 Earnings Presentation
18 slides from Noranda Aluminum's earnings presentation, Feb 16, 2011
Slide 1: Fourth Quarter Results Conference Call
TM FOURTH QUARTER RESULTS CONFERENCE CALL Noranda Aluminum Holding Corp February 16, 2011 10:00 AM Eastern / 9:00 AM Central
Slide 2: Forward Looking Statements
The following information contains, or may be deemed to contain, "forward-looking statements" (as defined in the U.S. Private Securities Litigation Reform Act of 1995). By their nature, forward-looking statements involve risks and uncertainties because they relate to events and depend on circumstanc
Slide 3: Fourth Quarter Results
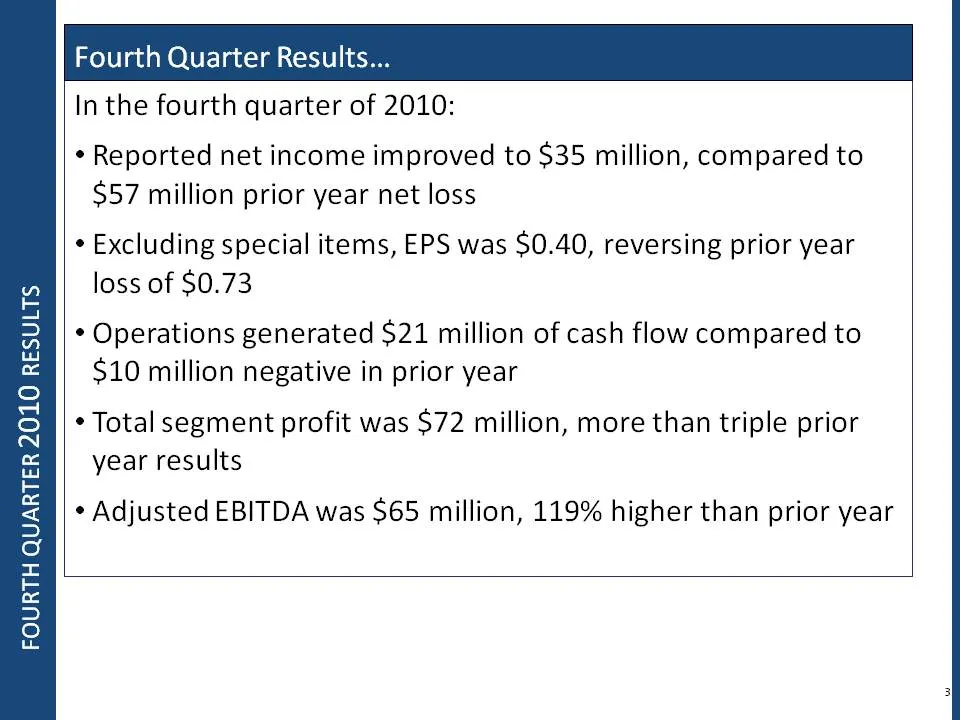
In the fourth quarter of 2010: Reported net income improved to $35 million, compared to $57 million prior year net loss Excluding special items, EPS was $0.40, reversing prior year loss of $0.73 Operations generated $21 million of cash flow compared to $ 10 million negative in prior year Fourth Quar
Slide 4: Fourth Quarter 2010 Results: Driven by Cost Discipline and Productivity
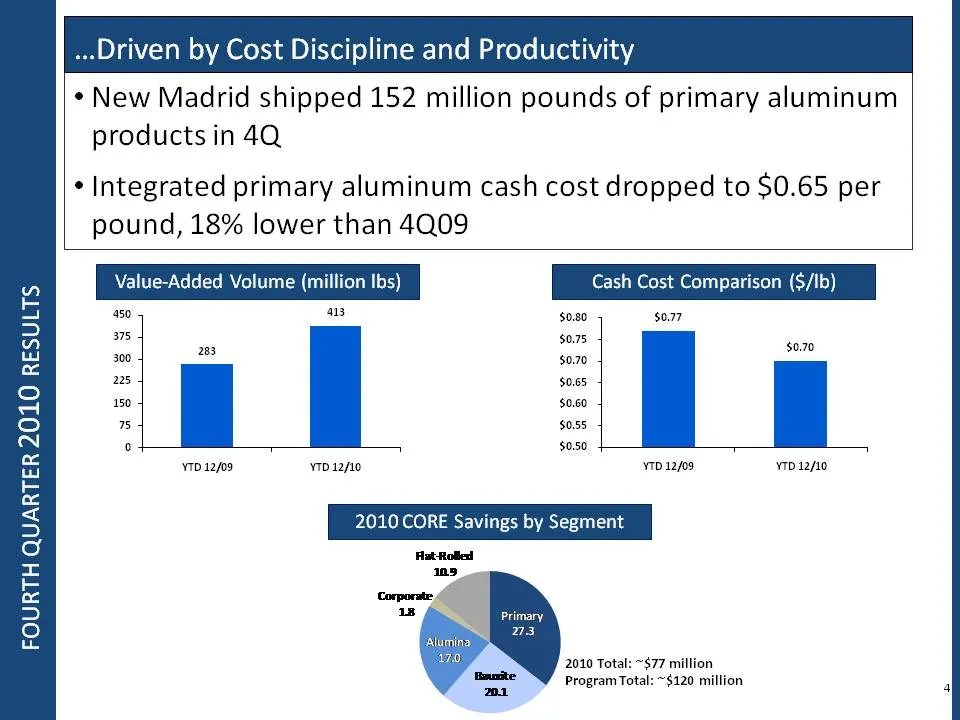
FOURTH QUARTER 2010 RESULTS …Driven by Cost Discipline and Productivity New Madrid shipped 152 million pounds of primary aluminum products in 4Q Integrated primary aluminum cash cost dropped to $0.65 per pound, 18% lower than 4Q09 Value-Added Volume (million lbs) 0 75 150 225 300 375 450 YTD 12/09 Y
Slide 5: Favorable Industry Demand Dynamics
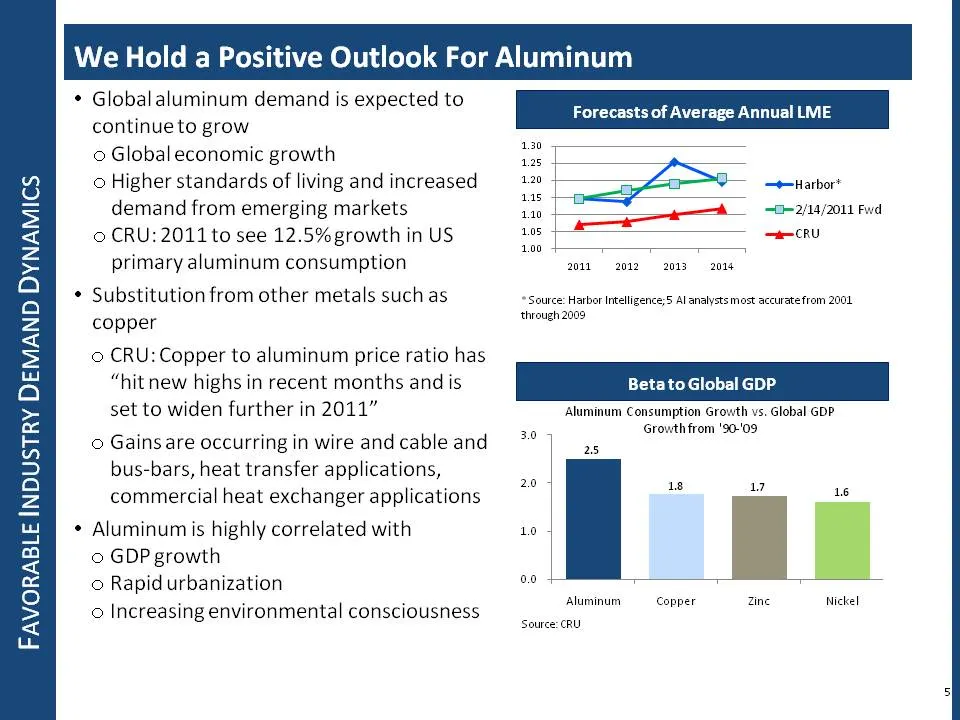
FAVORABLE INDUSTRY DEMAND DYNAMICS We Hold a Positive Outlook For Aluminum Global aluminum demand is expected to continue to grow o Global economic growth o Higher standards of living and increased demand from emerging markets o CRU: 2011 to see 12.5% growth in US primary aluminum consumption o Subs
Slide 6: Fourth Quarter Segment Results: Upstream Overview
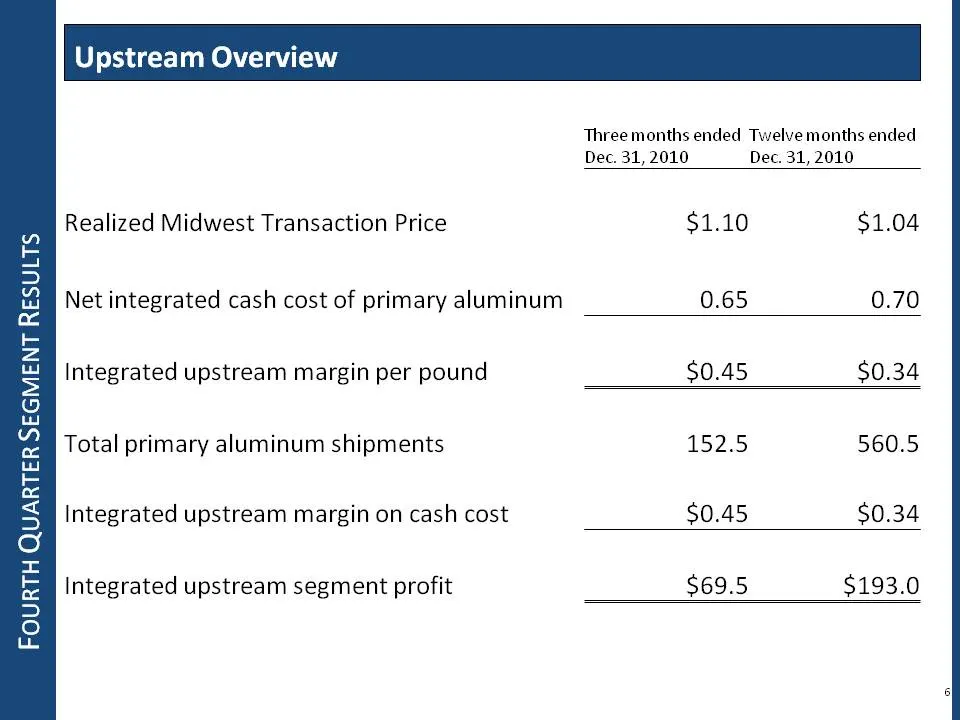
FOURTH QUARTER SEGMENT RESULTS Upstream Overview Three months ended Dec. 31, 2010 Twelve months ended Dec. 31, 2010 Realized Midwest Transaction Price $1.10 $1.04 Net integrated cash cost of primary aluminum 0.65 0.70 Integrated upstream margin per pound $0.45 $0.34 Total primary aluminum shipments
Slide 7: Fourth Quarter Segment Results: Cash Cost Bridge 3Q10 to 4Q10
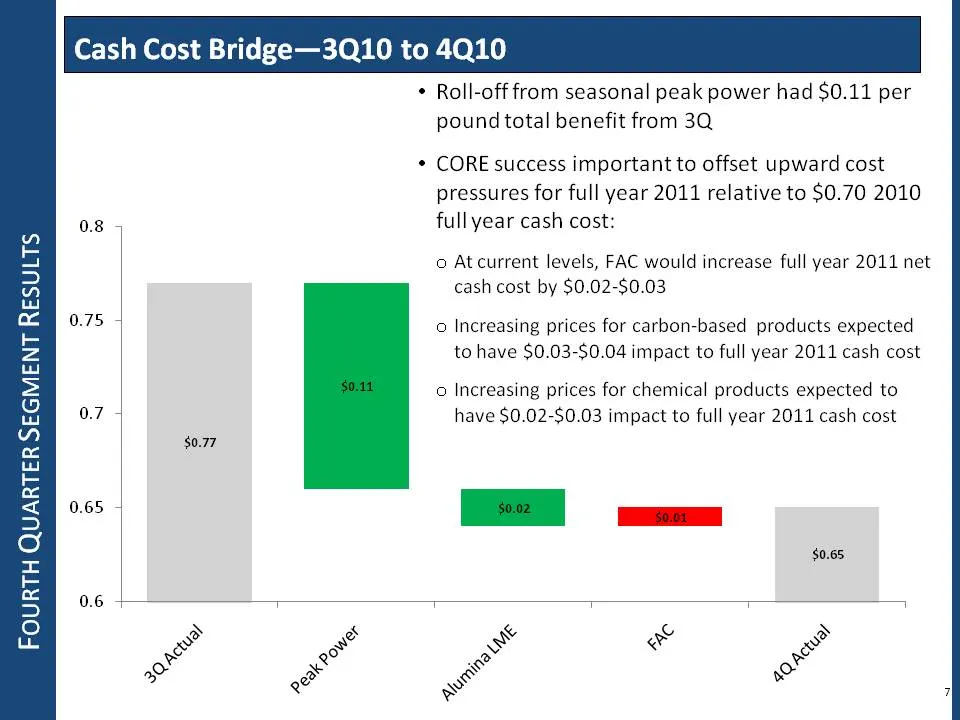
FOURTH QUARTER SEGMENT RESULTS Cash Cost Bridge—3Q10 to 4Q10 o Roll-off from seasonal peak power had $0.11 per pound total benefit from 3Q o CORE success important to offset upward cost pressures for full year 2011 relative to $0.70 2010 full year cash cost: o At current levels, FAC would increase f
Slide 8: Fourth Quarter Segment Results: Flat Rolled Products
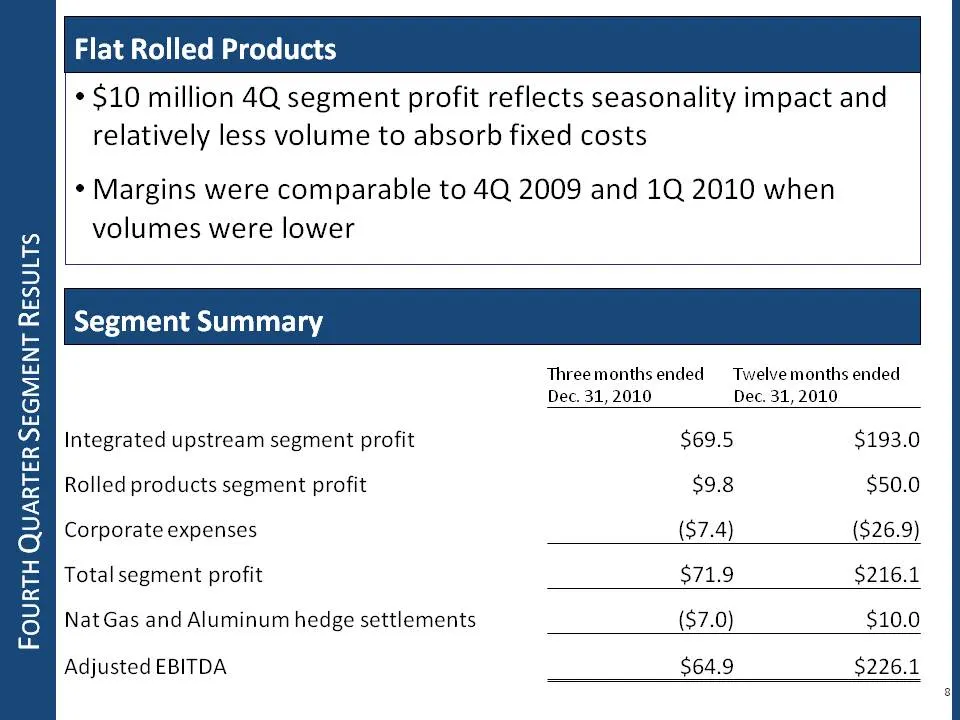
FOURTH QUARTER SEGMEN NT RESULTS Flat Rolled Products o $10 million 4Q segment profit reflects seasonality impact and relatively less volume to absorb fixed costs o Margins were comparable to 4Q 2009 and 1Q 2010 when volumes were lower Segment Summary Three months ended Dec. 31, 2010 Twelve months e
Slide 9: Review of Liquidity and Financial Management
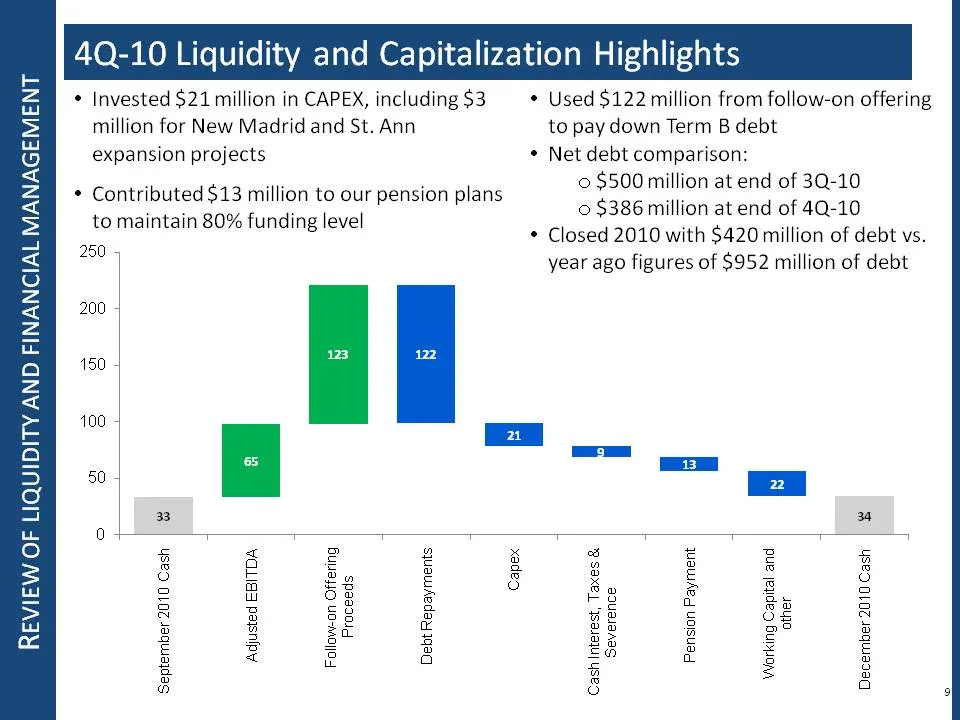
REVIEW OF LIQUIDITY AND FINANCIAL MANAGEMENT 4Q-10 Liquidity and Capitalization Highlights o Invested $21 million in CAPEX, including $3 million for New Madrid and St. Ann expansion projects o Contributed $13 million to our pension plans to maintain 80% funding level o Used $122 million from follow-
Slide 10: Key Fourth Quarter and Year-to-Date Takeaways
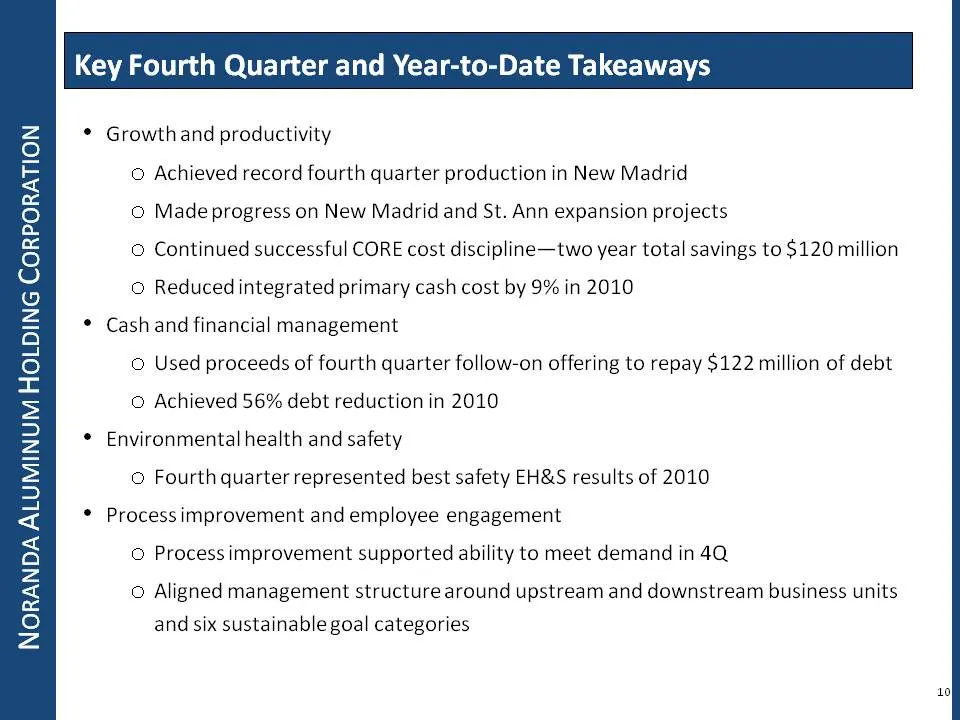
NORANDA ALUMINUM HOLDING CORPORATION Key Fourth Quarter and Year-to-Date Takeaways o Growth and productivity o Achieved record fourth quarter production in New Madrid o Made progress on New Madrid and St. Ann expansion projects o Continued successful CORE cost discipline—two year total savings to $1
Slide 11: Disclaimer: Non-GAAP Financial Measures
DISCLAIMER Non-GAAP Financial Measures This presentation contains non-GAAP financial measures as defined by SEC rules. We think that these measures are helpful to investors in measuring our financial performance and comparing our performance to our peers. However, our non-GAAP financial measures may
Slide 12: Non-GAAP Measure: Adjusted EBITDA
APPENDICES Non-GAAP Measure: Adjusted EBITDA As used herein, “Adjusted EBITDA” (which is defined as “EBITDA” in the debt agreements) means net income before income taxes, net interest expense and depreciation and amortization, adjusted to eliminate related party management fees, business optimizatio
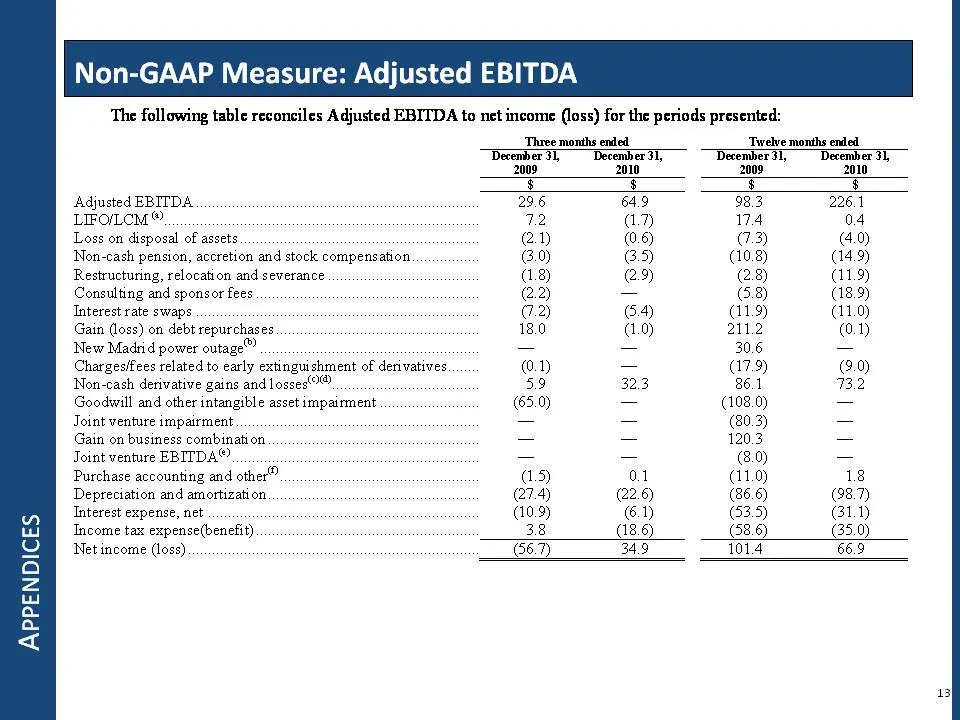
Slide 13: Non-GAAP Measure: Adjusted EBITDA reconciliation to net income
APPENDICES Non-GAAP Measure: Adjusted EBITDA The following table reconciles Adjusted EBITDA to net income (loss) for the periods presented: Three months ended Twelve months ended December 31, 2009 December 31, 2010 December 31, 2009 December 31, 2010 $ $ $ $ Adjusted EBITDA 29.6 64.9 98.3 226.1 LIFO
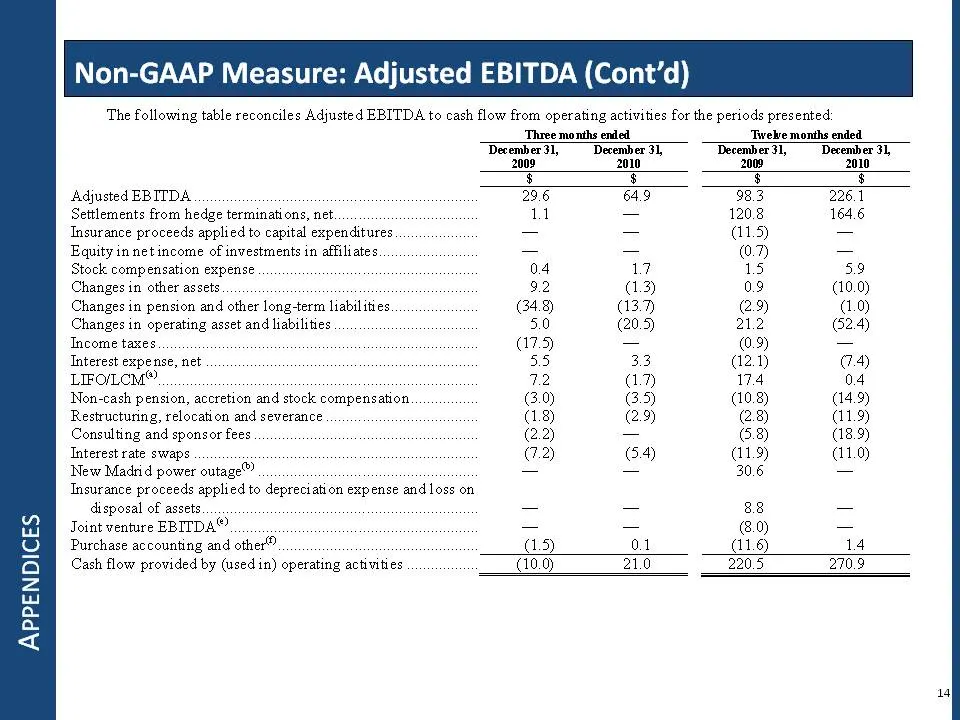
Slide 14: Non-GAAP Measure: Adjusted EBITDA reconciliation to cash flow (Cont'd)
APPENDICES Non-GAAP Measure: Adjusted EBITDA (Cont’d) The following table reconciles Adjusted EBITDA to cash flow from operating activities for the periods presented: Three months ended Twelve months ended December 31, 2009 December 31, 2010 December 31, 2009 December 31, 2010 $ $ $ $ Adjusted EBITD
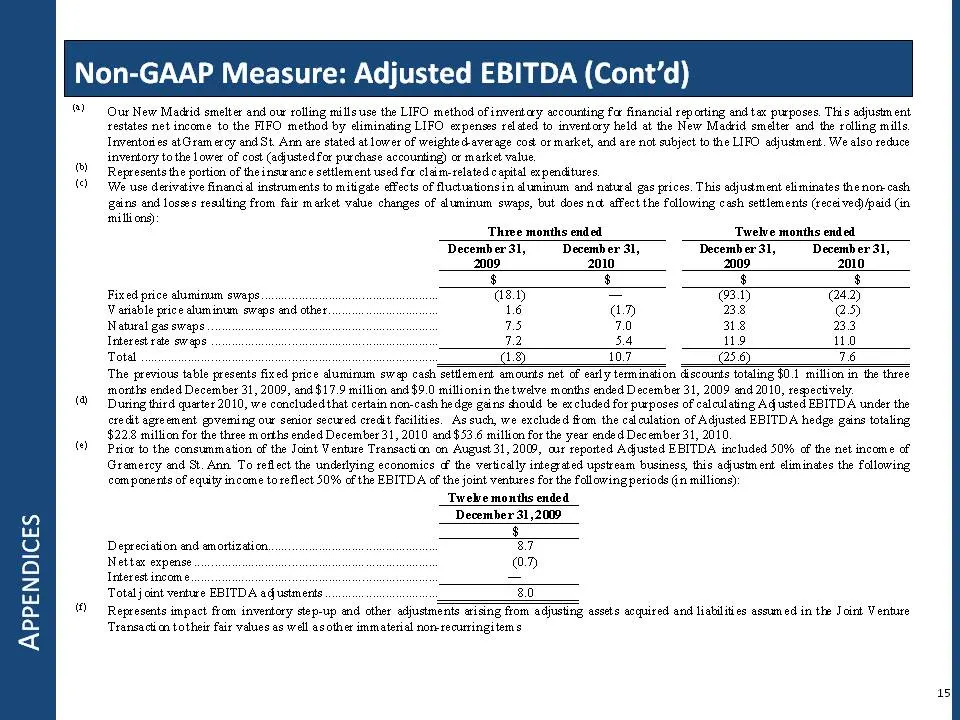
Slide 15: Non-GAAP Measure: Adjusted EBITDA footnotes (Cont'd)
APPENDICES Non-GAAP Measure: Adjusted EBITDA (Cont’d) (a) Our New Madrid smelter and our rolling mills use the LIFO method of inventory accounting for financial reporting and tax purposes. This adjustment restates net income to the FIFO method by eliminating LIFO expenses related to inventory held a
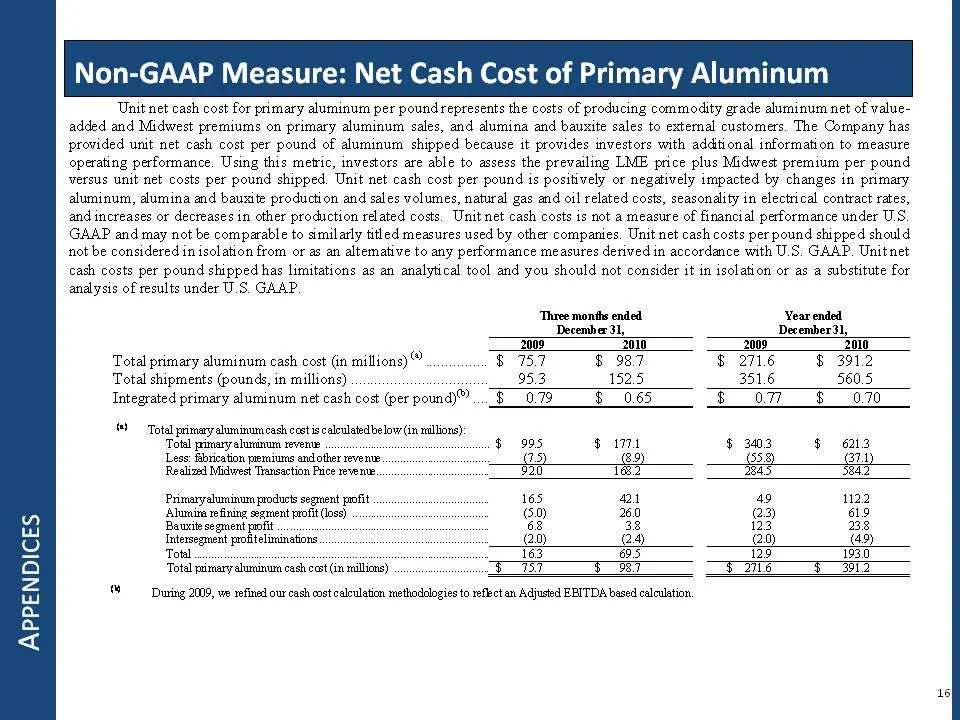
Slide 16: Non-GAAP Measure: Net Cash Cost of Primary Aluminum
APPENDICES Non-GAAP Measure: Net Cash Cost of Primary Aluminum Unit net cash cost for primary aluminum per pound represents the costs of producing commodity grade aluminum net of value added and Midwest premiums on primary aluminum sales, and alumina and bauxite sales to external customers. The Comp
Slide 17: Non-GAAP Measure: Diluted EPS, Excluding Special Items
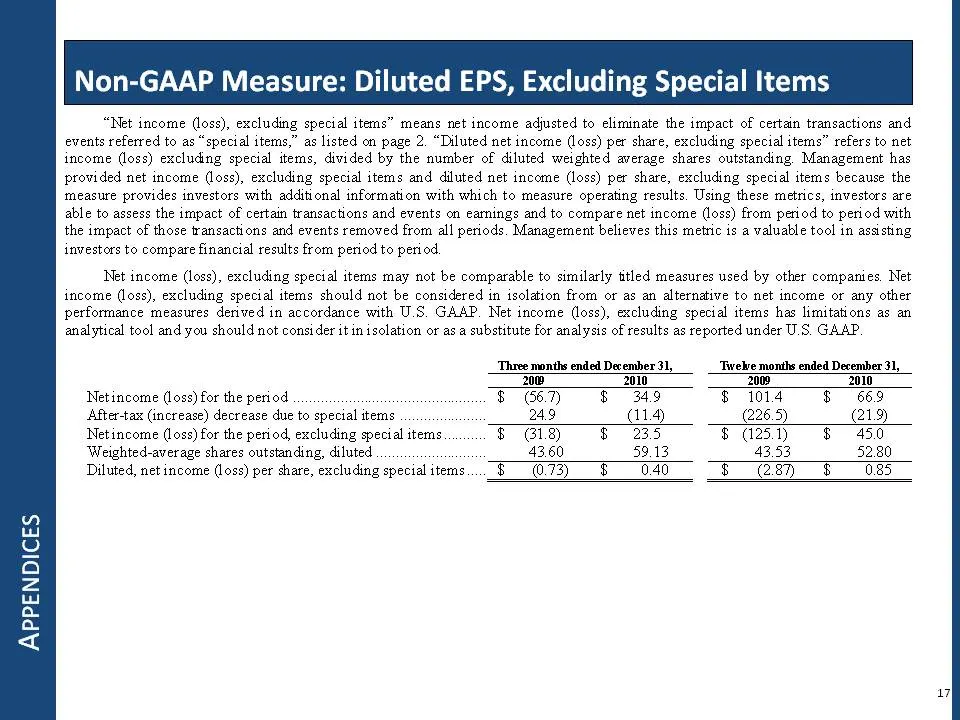
APPENDICES Non-GAAP Measure: Diluted EPS, Excluding Special Items “Net income (loss), excluding special items” means net income adjusted to eliminate the impact of certain transactions and events referred to as “special items,” as listed on page 2. “Diluted net income (loss) per share, excluding spe
Slide 18: Noranda Aluminum Holding Corporation
NORANDA ALUMINUM HOLDING CORPORATION NORNADA ™
Source: SEC EDGAR · 8-K filed Feb 16, 2011
More decks from Noranda Aluminum Holding Corp
 Q3 2015 Earnings Presentation10 slides · Nov 9, 2015
 Q2 2015 Earnings Presentation11 slides · Jul 22, 2015
 Q1 2015 Earnings Presentation15 slides · May 6, 2015
 Q4 2014 Earnings Presentation15 slides · Feb 18, 2015
 Q3 2014 Earnings Presentation15 slides · Nov 3, 2014
 Q2 2014 Earnings Presentation16 slides · Aug 11, 2014