Holly Energy Partners LP — Investor Day (September 2015)
77 slides from Holly Energy Partners LP's investor day presentation, Sep 3, 2015
Slide 1: HollyFrontier Corporation 2015 Analyst Day
HOLLYFRONTIER CORPORATION 2015 Analyst Day September 2015
Slide 2: Welcome
WELCOME Julia Heidenreich – Vice President, Investor Relations
Slide 3: Disclosure Statement
HollyFrontier Corporation (NYSE: HFC) Statements made during the course of this presentation that are not historical facts are “forward looking statements” within the meaning of the U.S. Private Securities Litigation Reform Act of 1995. Forward-looking statements are inherently uncertain and necessa
Slide 4: Our Mission and Values
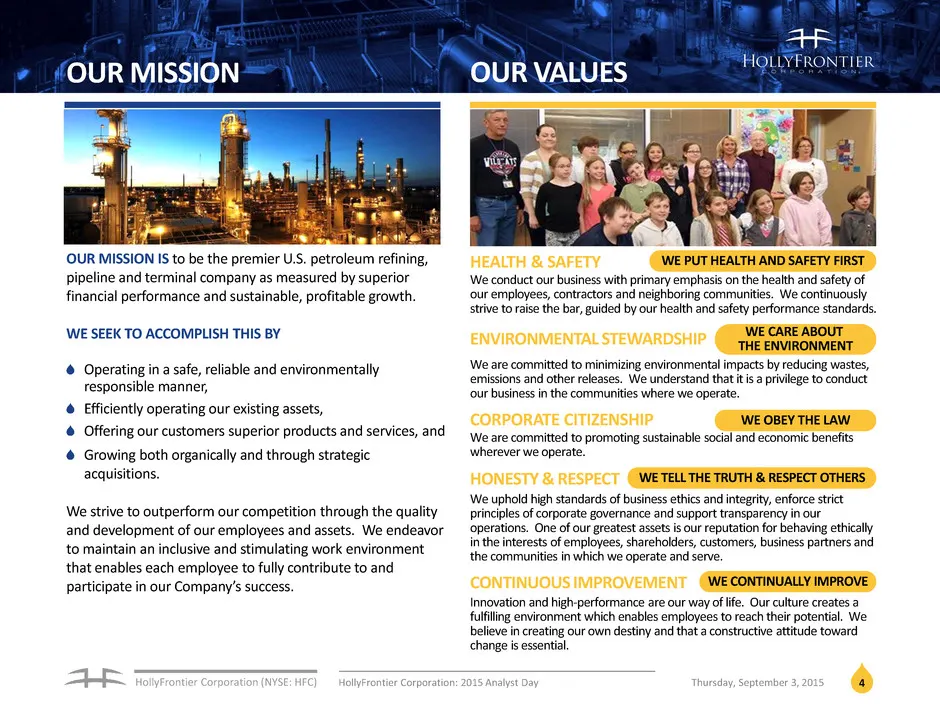
HollyFrontier Corporation (NYSE: HFC) 4 OUR MISSION OUR VALUES OUR MISSION IS to be the premier U.S. petroleum refining, pipeline and terminal company as measured by superior financial performance and sustainable, profitable growth. WE SEEK TO ACCOMPLISH THIS BY Operating in a safe, reliable and env
Slide 5: Agenda
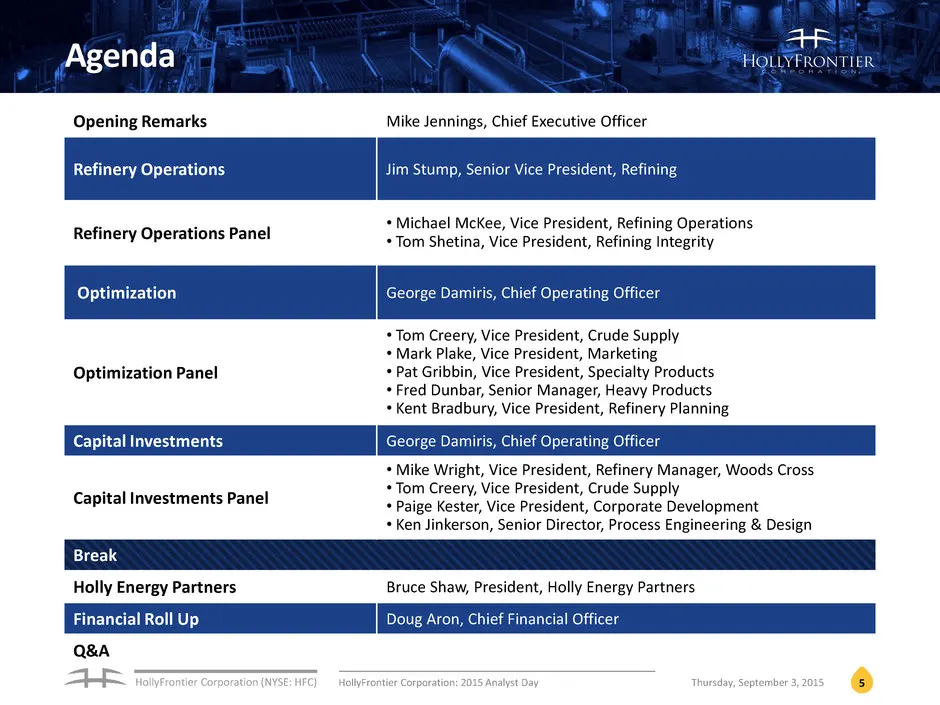
HollyFrontier Corporation (NYSE: HFC) Agenda Opening Remarks Mike Jennings, Chief Executive Officer Refinery Operations Jim Stump, Senior Vice President, Refining Refinery Operations Panel •Michael McKee, Vice President, Refining Operations • Tom Shetina, Vice President, Refining Integrity Optimizat
Slide 6: Opening Remarks
OPENING REMARKS Mike Jennings – Chief Executive Officer
Slide 7: Positioned for Success and Value Creation
HollyFrontier Corporation (NYSE: HFC) Focused manufacturer of transportation fuels and specialty products serving markets with strong and growing demand Industry leading long-term shareholder returns Differentiated business generates exceptional long-term returns on invested capital 7 HollyFrontier
Slide 8: Unique Geographic Footprint Provides Distinct Competitive Advantage
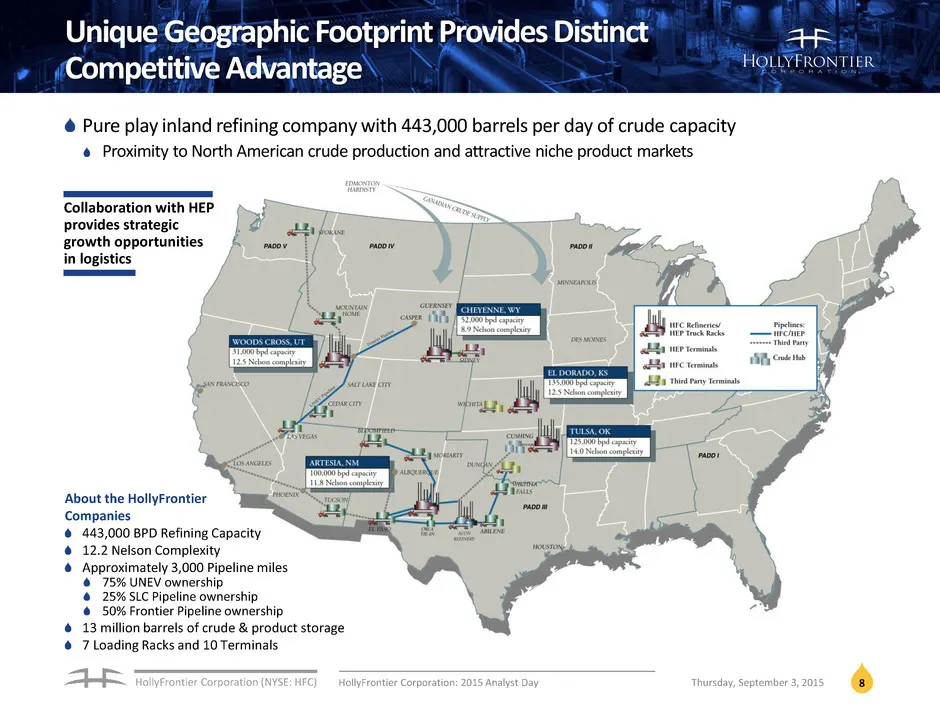
HollyFrontier Corporation (NYSE: HFC) 8 Unique Geographic Footprint Provides Distinct Competitive Advantage Pure play inland refining company with 443,000 barrels per day of crude capacity Proximity to North American crude production and attractive niche product markets Collaboration with HEP provid
Slide 9: The Foundation
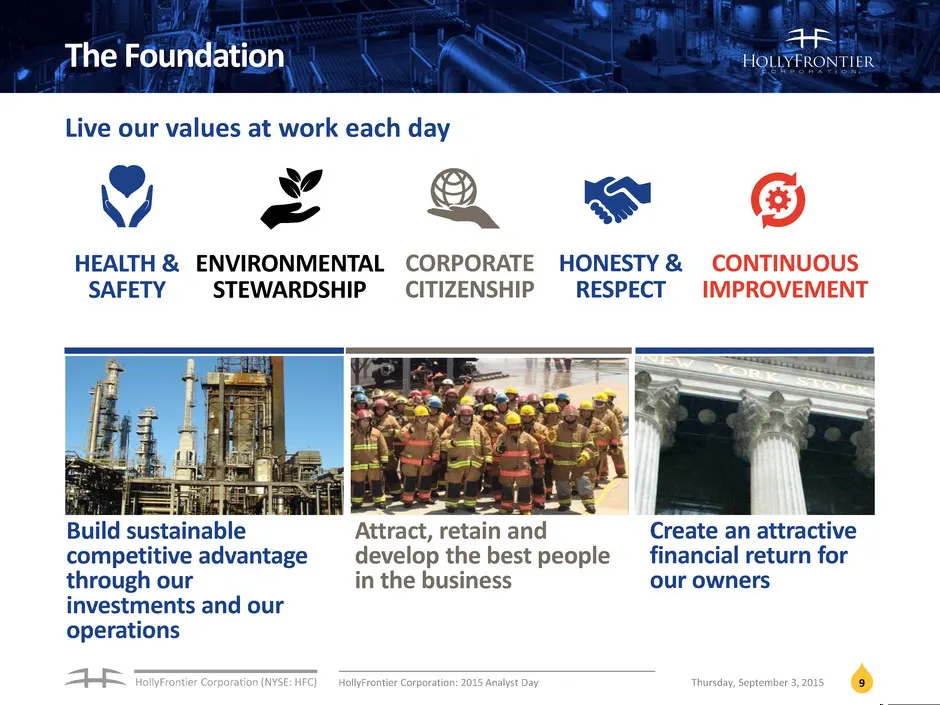
HollyFrontier Corporation (NYSE: HFC) 9 The Foundation Live our values at work each day HEALTH & SAFETY ENVIRONMENTAL STEWARDSHIP CORPORATE CITIZENSHIP HONESTY & RESPECT CONTINUOUS IMPROVEMENT Build sustainable competitive advantage through our investments and our operations Attract, retain and deve
Slide 10: Differentiated Financial Performance
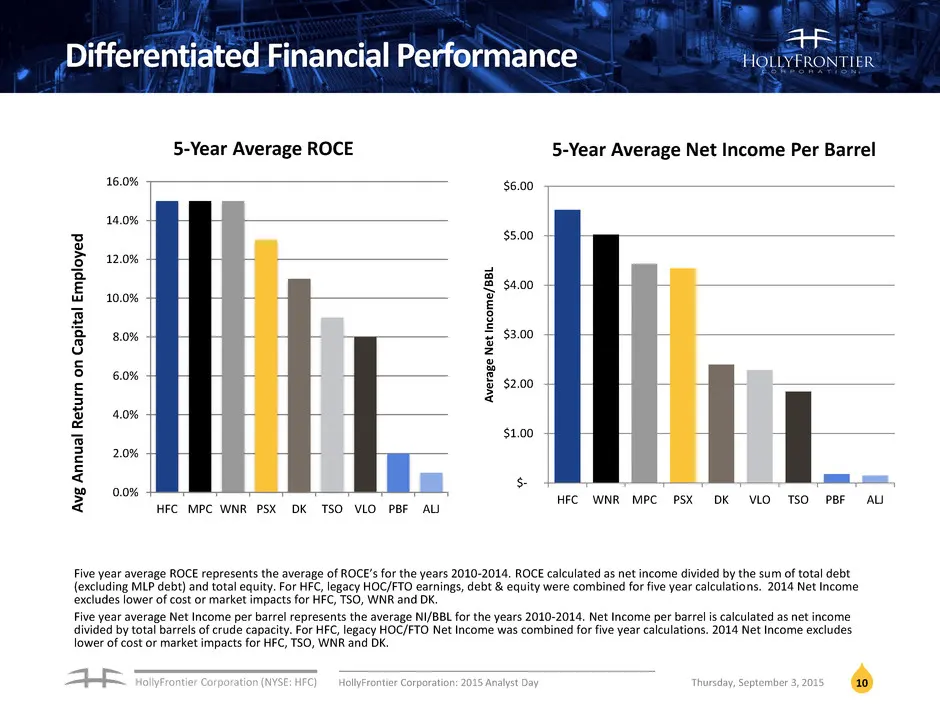
HollyFrontier Corporation (NYSE: HFC) 10 Differentiated Financial Performance 0.0% 2.0% 4.0% 6.0% 8.0% 10.0% 12.0% 14.0% 16.0% HFC MPC WNR PSX DK TSO VLO PBF ALJA vg A nnu al R et u rn on C ap it al E m p lo ye d 5-Year Average ROCE Five year average ROCE represents the average of ROCE’s for the yea
Slide 11: Differentiated Financial Performance: 15-Year Shareholder Returns
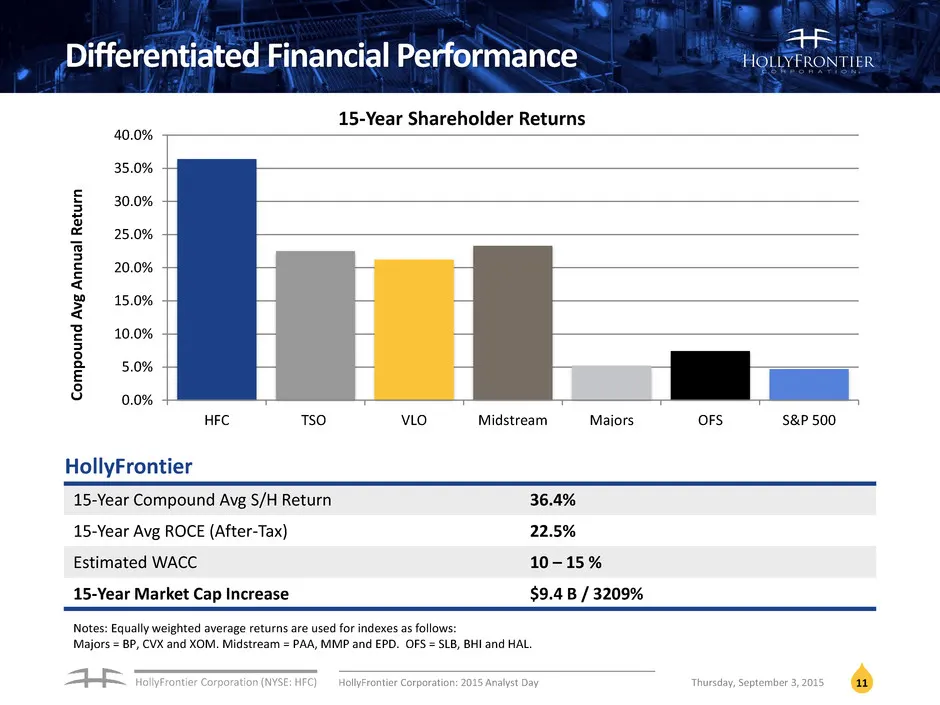
HollyFrontier Corporation (NYSE: HFC) 11 Differentiated Financial Performance Notes: Equally weighted average returns are used for indexes as follows: Majors = BP, CVX and XOM. Midstream = PAA, MMP and EPD. OFS = SLB, BHI and HAL. 0.0% 5.0% 10.0% 15.0% 20.0% 25.0% 30.0% 35.0% 40.0% HFC TSO VLO Midst
Slide 12: Our Business Plan: Summary Impact
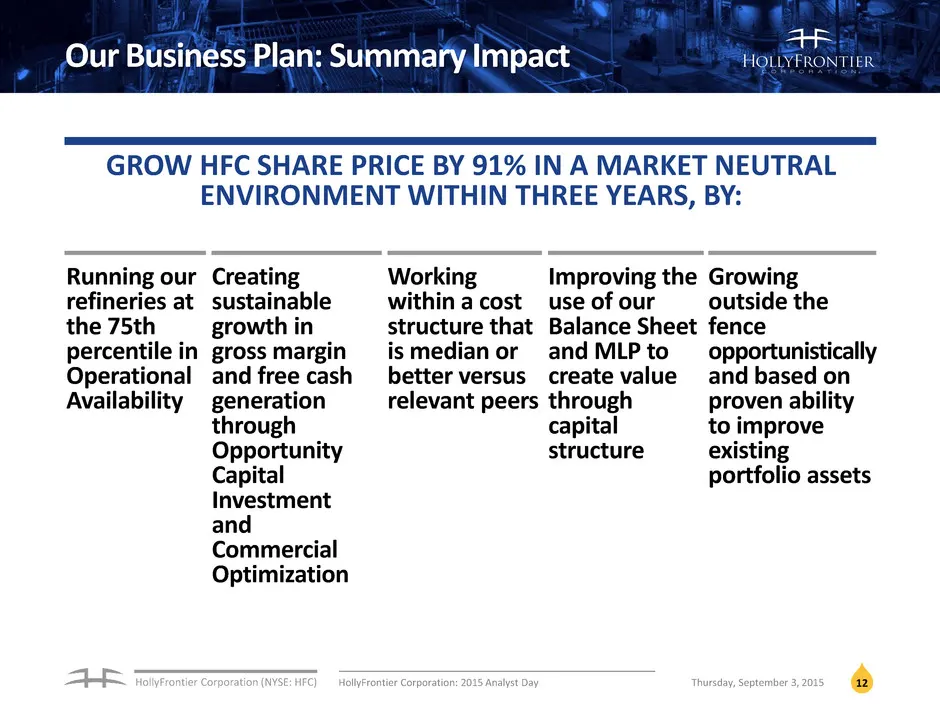
HollyFrontier Corporation (NYSE: HFC) 12 Our Business Plan: Summary Impact GROW HFC SHARE PRICE BY 91% IN A MARKET NEUTRAL ENVIRONMENT WITHIN THREE YEARS, BY: Running our refineries at the 75th percentile in Operational Availability Creating sustainable growth in gross margin and free cash generatio
Slide 13: Our Business Plan
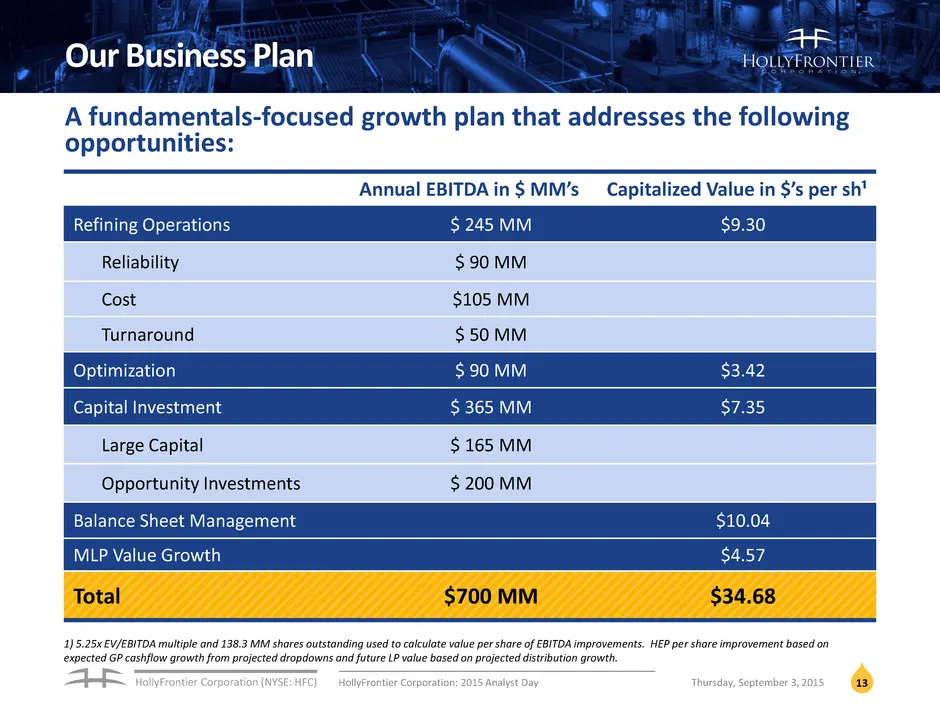
HollyFrontier Corporation (NYSE: HFC) 13 Our Business Plan Annual EBITDA in $ MM’s Capitalized Value in $’s per sh¹ Refining Operations $ 245 MM $9.30 Reliability $ 90 MM Cost $105 MM Turnaround $ 50 MM Optimization $ 90 MM $3.42 Capital Investment $ 365 MM $7.35 Large Capital $ 165 MM Opportunity I
Slide 14: Refinery Operations
REFINERY OPERATIONS Jim Stump – Senior Vice President, Refining
Slide 15: Refinery Operations
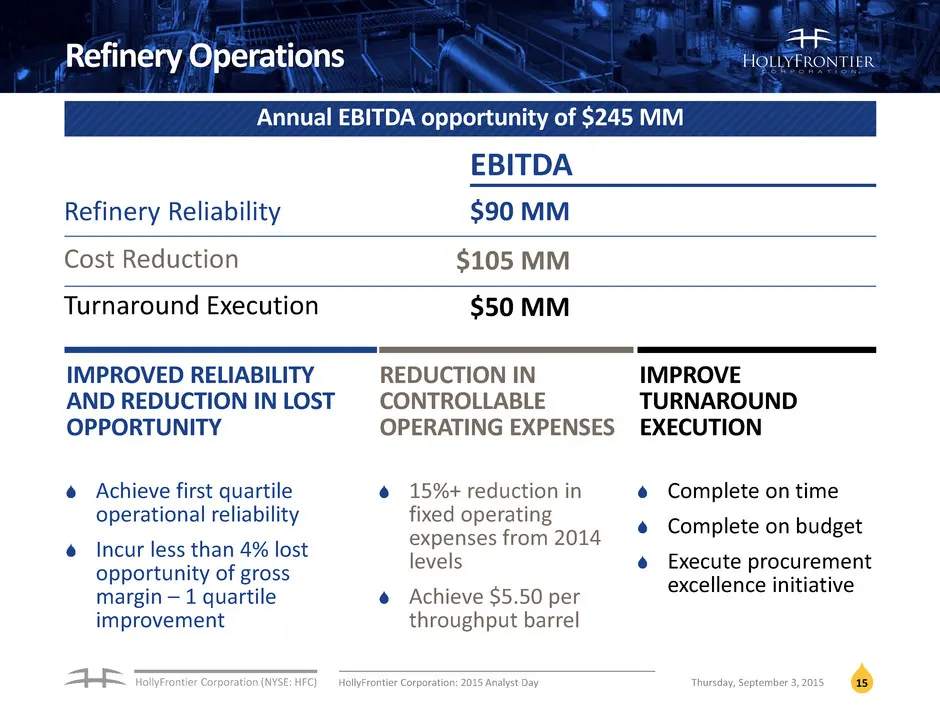
HollyFrontier Corporation (NYSE: HFC) Refinery Operations Annual EBITDA opportunity of $245 MM Refinery Reliability $90 MM Cost Reduction Turnaround Execution $105 MM $50 MM EBITDA 15 IMPROVED RELIABILITY AND REDUCTION IN LOST OPPORTUNITY Achieve first quartile operational reliability Incur less tha
Slide 16: Safe Production
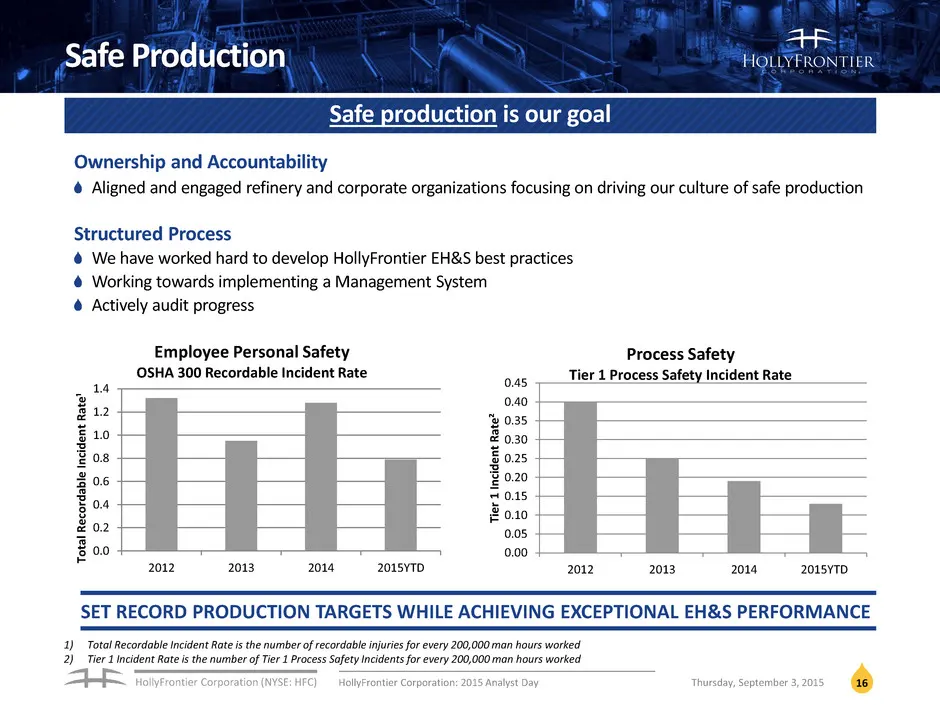
HollyFrontier Corporation (NYSE: HFC) Safe Production Safe production is our goal 16 SET RECORD PRODUCTION TARGETS WHILE ACHIEVING EXCEPTIONAL EH&S PERFORMANCE Ownership and Accountability Aligned and engaged refinery and corporate organizations focusing on driving our culture of safe production Str
Slide 17: Refinery Operations: Reliability
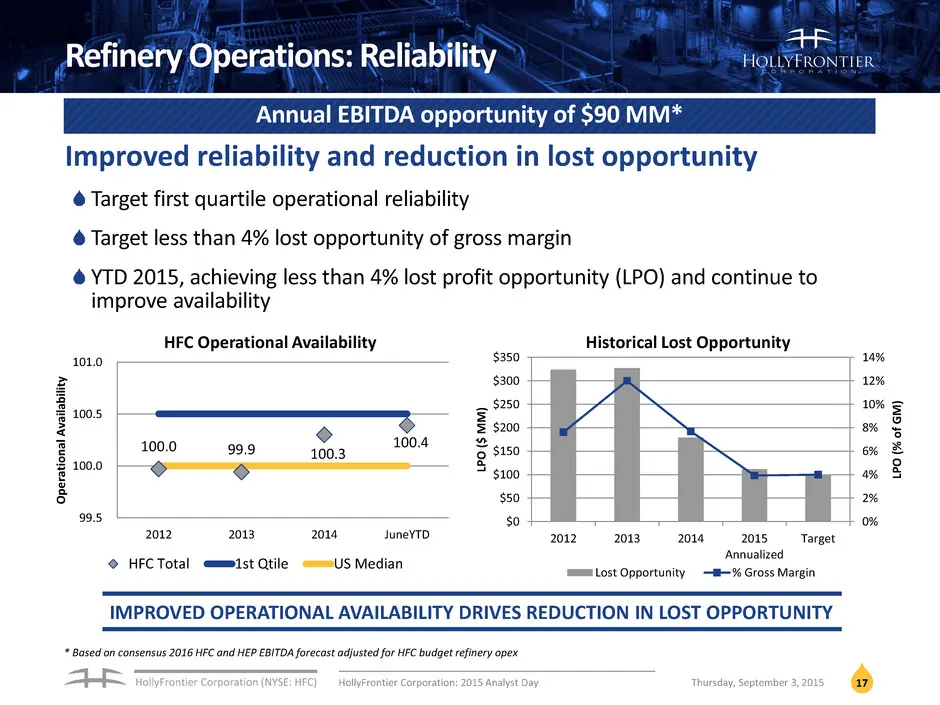
HollyFrontier Corporation (NYSE: HFC) 17 Refinery Operations: Reliability * Based on consensus 2016 HFC and HEP EBITDA forecast adjusted for HFC budget refinery opex Annual EBITDA opportunity of $90 MM* Improved reliability and reduction in lost opportunity Target first quartile operational reliabil
Slide 18: Refinery Operations: Operating Cost
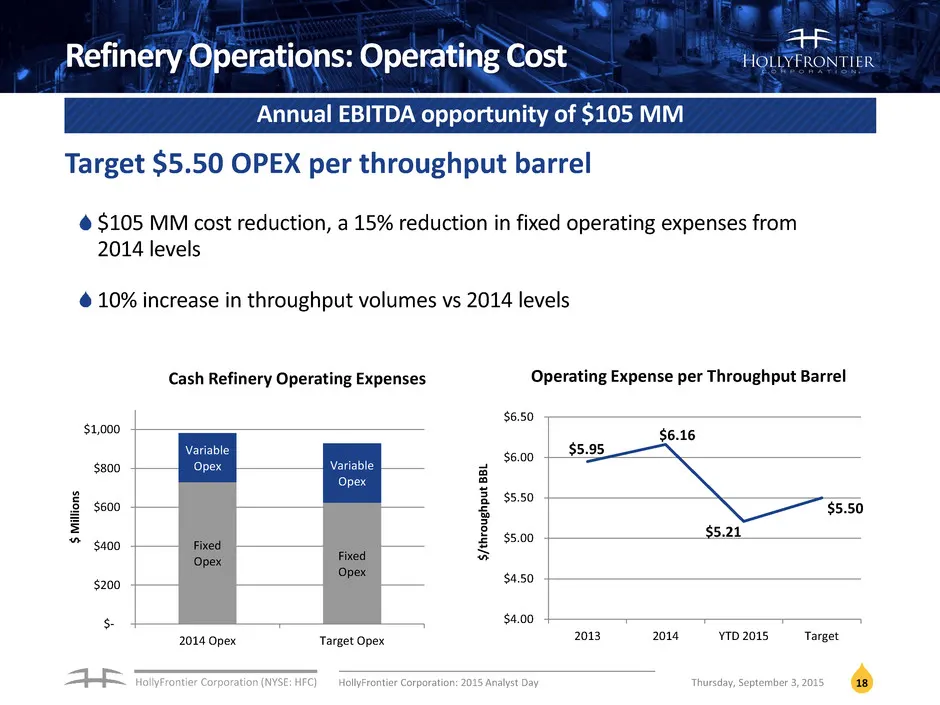
HollyFrontier Corporation (NYSE: HFC) 18 Refinery Operations: Operating Cost Annual EBITDA opportunity of $105 MM $5.95 $6.16 $5.21 $5.50 $4.00 $4.50 $5.00 $5.50 $6.00 $6.50 2013 2014 YTD 2015 Target $/ th ro u gh p u t B B L Operating Expense per Throughput Barrel $105 MM cost reduction, a 15% redu
Slide 19: Refinery Operations: Turnaround Execution
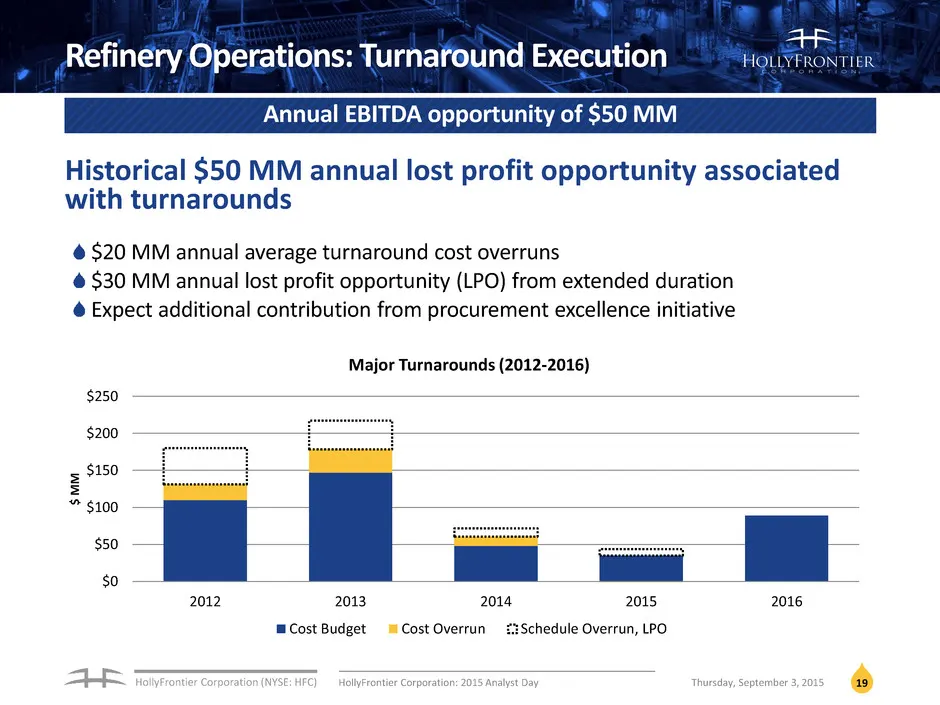
HollyFrontier Corporation (NYSE: HFC) Refinery Operations: Turnaround Execution Annual EBITDA opportunity of $50 MM Historical $50 MM annual lost profit opportunity associated with turnarounds $20 MM annual average turnaround cost overruns $30 MM annual lost profit opportunity (LPO) from extended du
Slide 20: Refinery Operations Panel
REFINERY OPERATIONS PANEL Jim Stump – Senior Vice President, Refining Michael McKee – Vice President, Refining Operations Tom Shetina – Vice President, Refining Integrity
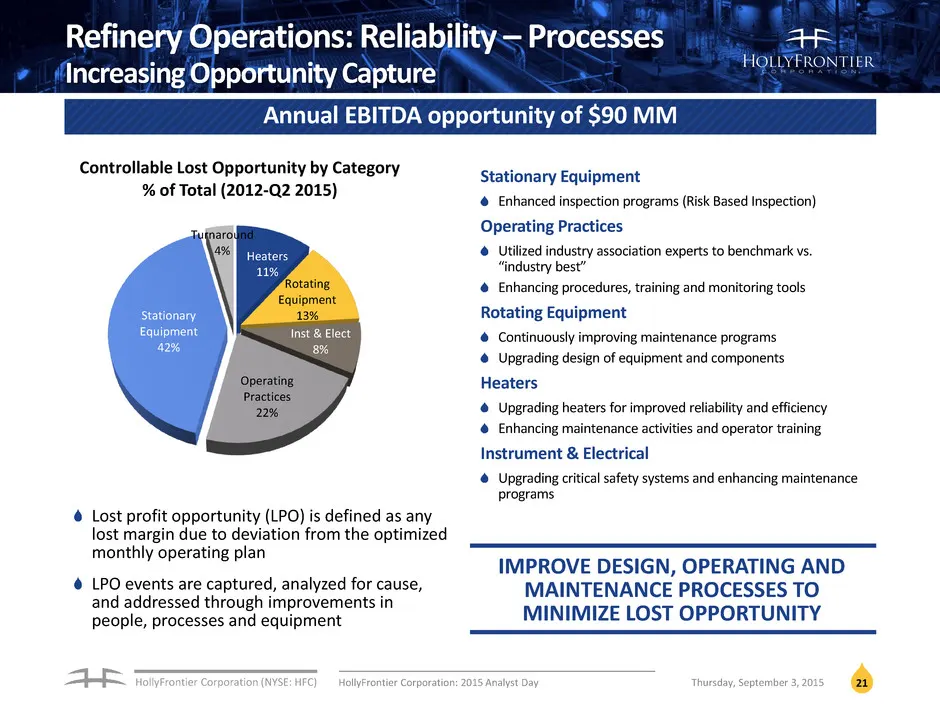
Slide 21: Refinery Operations: Reliability – Processes
HollyFrontier Corporation (NYSE: HFC) 21 Refinery Operations: Reliability – Processes Increasing Opportunity Capture Lost profit opportunity (LPO) is defined as any lost margin due to deviation from the optimized monthly operating plan LPO events are captured, analyzed for cause, and addressed throu
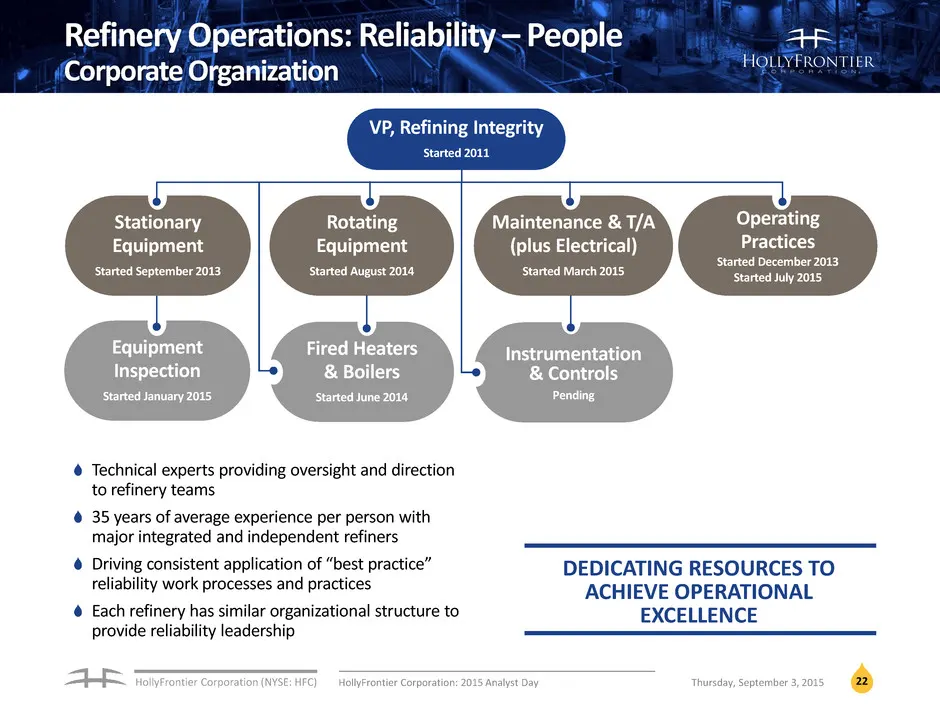
Slide 22: Refinery Operations: Reliability – People
HollyFrontier Corporation (NYSE: HFC) Instrumentation & Controls Pending Fired Heaters & Boilers Started June 2014 Equipment Inspection Started January 2015 Stationary Equipment Started September 2013 Rotating Equipment Started August 2014 Maintenance & T/A (plus Electrical) Started March 2015 Opera
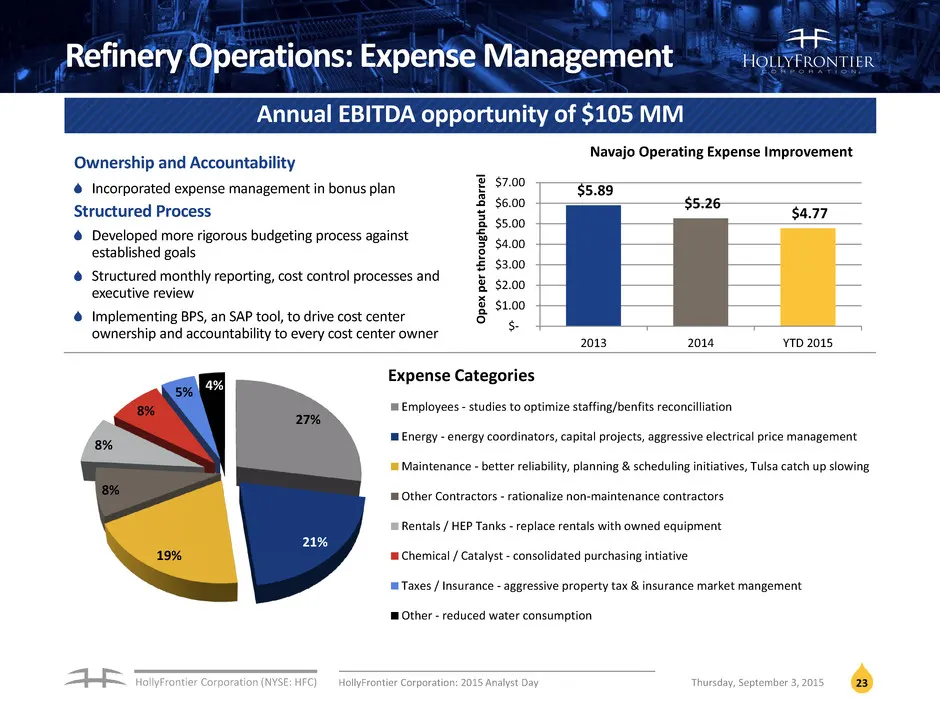
Slide 23: Refinery Operations: Expense Management
HollyFrontier Corporation (NYSE: HFC) 23 Refinery Operations: Expense Management Ownership and Accountability Incorporated expense management in bonus plan Structured Process Developed more rigorous budgeting process against established goals Structured monthly reporting, cost control processes and
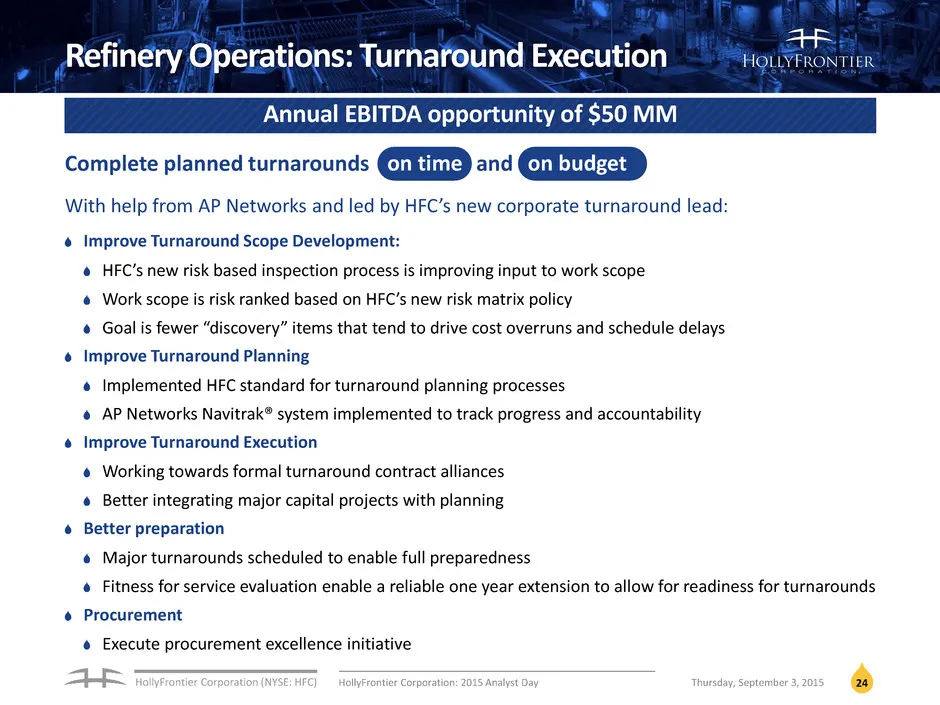
Slide 24: Refinery Operations: Turnaround Execution
HollyFrontier Corporation (NYSE: HFC) With help from AP Networks and led by HFC’s new corporate turnaround lead: Improve Turnaround Scope Development: HFC’s new risk based inspection process is improving input to work scope Work scope is risk ranked based on HFC’s new risk matrix policy Goal is fewe
Slide 25: Optimization
OPTIMIZATION George Damiris – Chief Operating Officer
Slide 26: Optimization
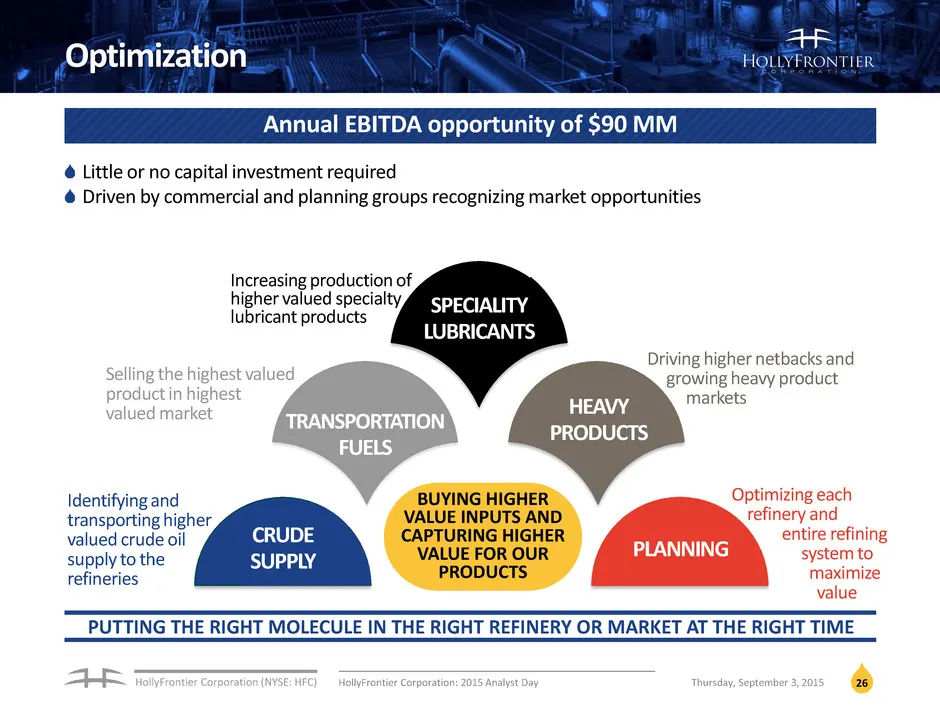
HollyFrontier Corporation (NYSE: HFC) Optimization Annual EBITDA opportunity of $90 MM 26 Identifying and transporting higher valued crude oil supply to the refineries CRUDE SUPPLY TRANSPORTATION FUELS Selling the highest valued product in highest valued market Increasing production of higher valued
Slide 27: Optimization Panel
OPTIMIZATION PANEL Tom Creery – Vice President, Crude Supply Mark Plake –Vice President, Marketing Pat Gribbin – Vice President, Specialty Products Fred Dunbar – Senior Manager, Heavy Products Kent Bradbury – Vice President, Refinery Planning
Slide 28: Optimization: Permian Crude Supply
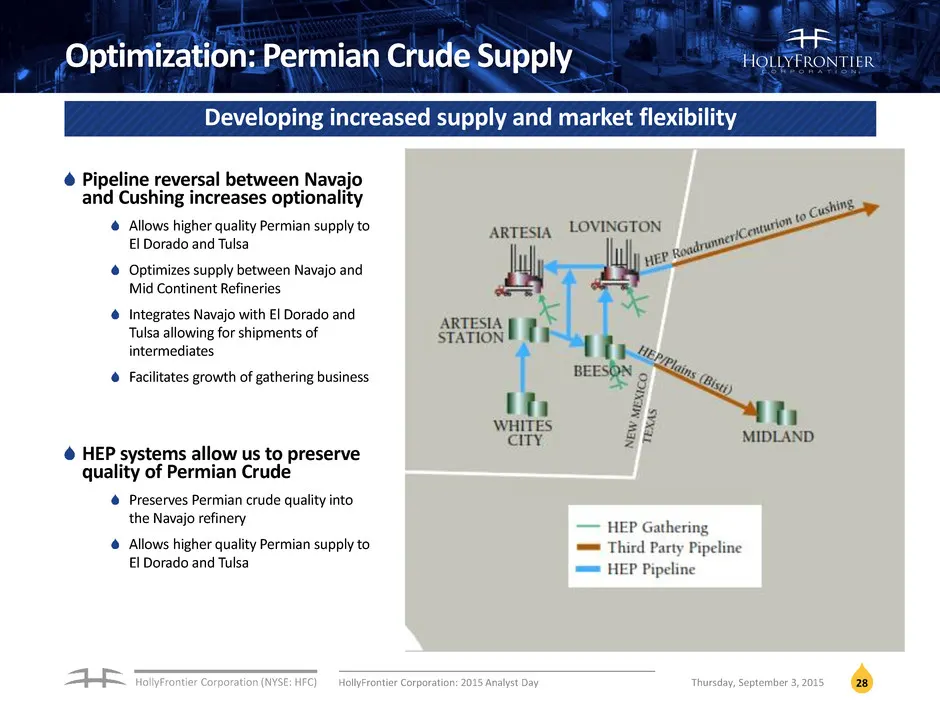
HollyFrontier Corporation (NYSE: HFC) 28 Optimization: Permian Crude Supply Pipeline reversal between Navajo and Cushing increases optionality Allows higher quality Permian supply to El Dorado and Tulsa Optimizes supply between Navajo and Mid Continent Refineries Integrates Navajo with El Dorado and
Slide 29: Optimization: Transportation Fuels
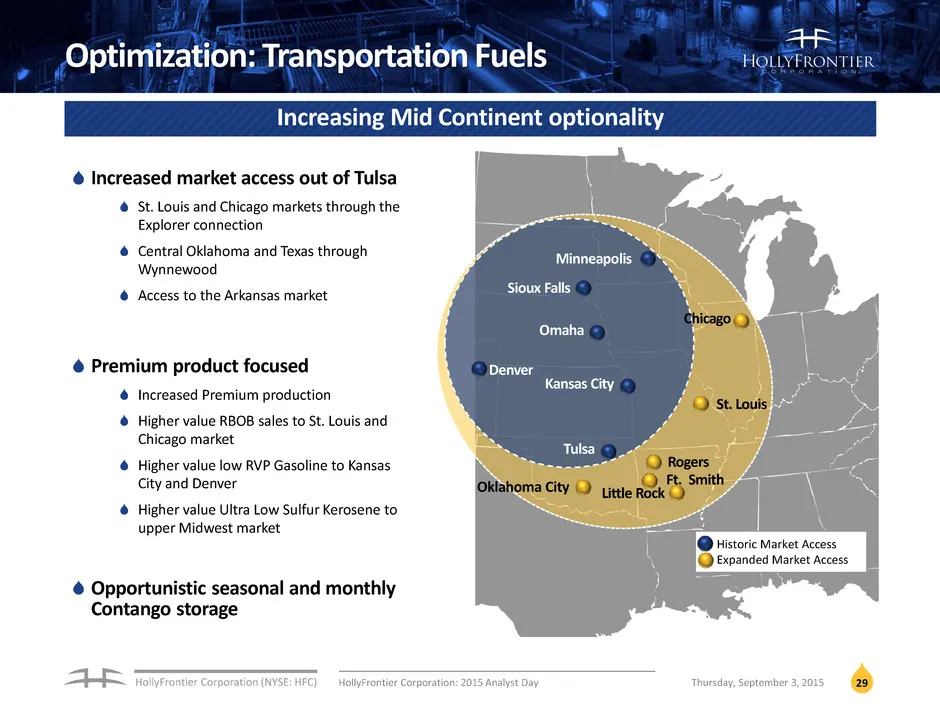
HollyFrontier Corporation (NYSE: HFC) 29 Optimization: Transportation Fuels Increased market access out of Tulsa St. Louis and Chicago markets through the Explorer connection Central Oklahoma and Texas through Wynnewood Access to the Arkansas market Premium product focused Increased Premium producti
Slide 30: Optimization: What are Specialty Lubricant Products?
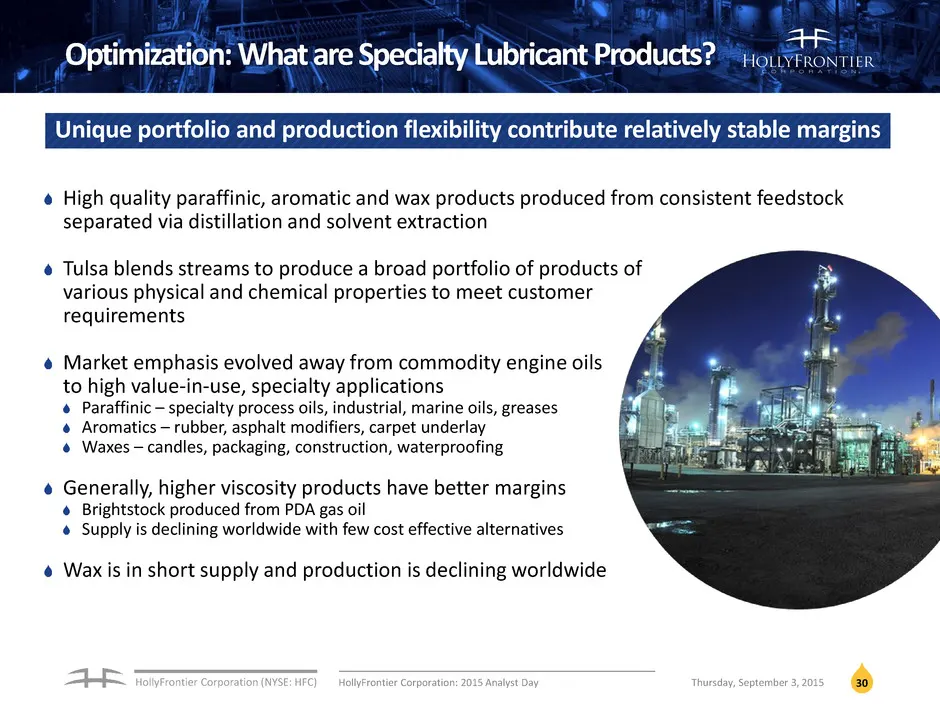
HollyFrontier Corporation (NYSE: HFC) High quality paraffinic, aromatic and wax products produced from consistent feedstock separated via distillation and solvent extraction Tulsa blends streams to produce a broad portfolio of products of various physical and chemical properties to meet customer req
Slide 31: Optimization: Lubes Opportunity
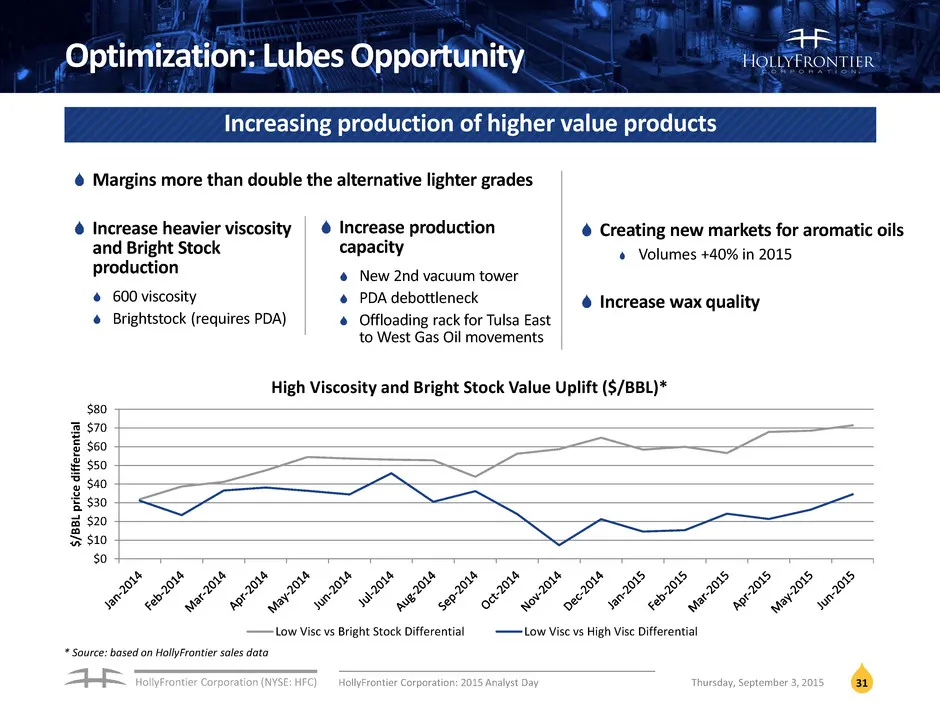
HollyFrontier Corporation (NYSE: HFC) 31 Optimization: Lubes Opportunity Increase production capacity New 2nd vacuum tower PDA debottleneck Offloading rack for Tulsa East to West Gas Oil movements Increase heavier viscosity and Bright Stock production 600 viscosity Brightstock (requires PDA) Margins
Slide 32: Optimization: Heavy Products
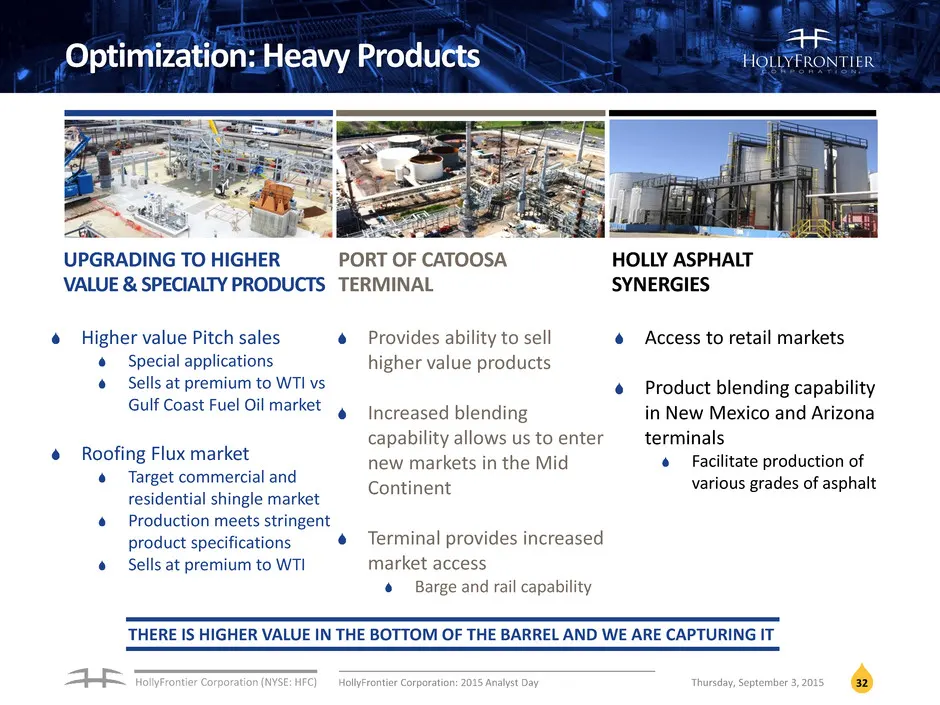
HollyFrontier Corporation (NYSE: HFC) 32 Optimization: Heavy Products UPGRADING TO HIGHER VALUE & SPECIALTY PRODUCTS PORT OF CATOOSA TERMINAL HOLLY ASPHALT SYNERGIES Higher value Pitch sales Special applications Sells at premium to WTI vs Gulf Coast Fuel Oil market Roofing Flux market Target commerc
Slide 33: Optimization: Planning
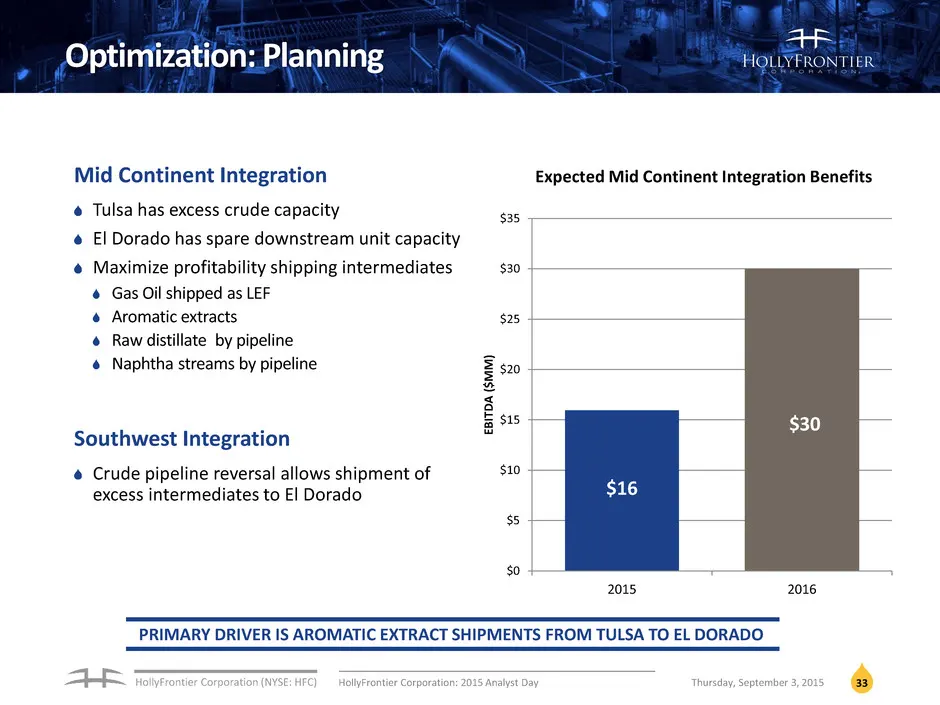
HollyFrontier Corporation (NYSE: HFC) 33 Optimization: Planning Mid Continent Integration Tulsa has excess crude capacity El Dorado has spare downstream unit capacity Maximize profitability shipping intermediates Gas Oil shipped as LEF Aromatic extracts Raw distillate by pipeline Naphtha streams by
Slide 34: Capital Investments
CAPITAL INVESTMENTS George Damiris – Chief Operating Officer
Slide 35: Capital Investments
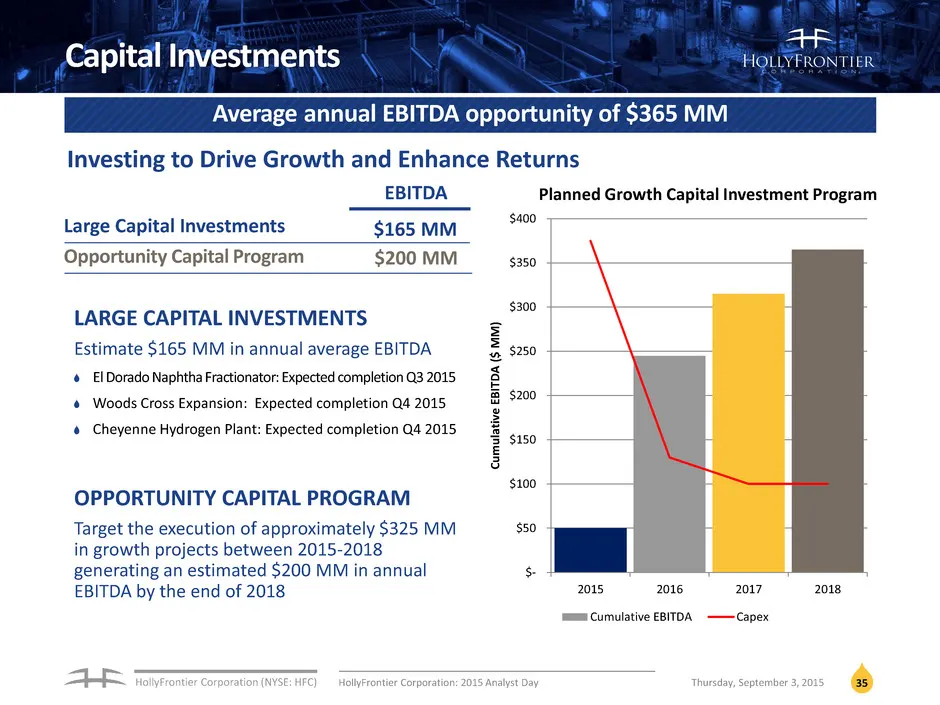
HollyFrontier Corporation (NYSE: HFC) 35 Capital Investments Average annual EBITDA opportunity of $365 MM LARGE CAPITAL INVESTMENTS Estimate $165 MM in annual average EBITDA El Dorado Naphtha Fractionator: Expected completion Q3 2015 Woods Cross Expansion: Expected completion Q4 2015 Cheyenne Hydrog
Slide 36: Capital Investments Panel
CAPITAL INVESTMENTS PANEL George Damiris – Chief Operating Officer Mike Wright – Vice President, Woods Cross Refinery Manager Tom Creery – Vice President, Crude Supply Paige Kester – Vice President, Corporate Development Ken Jinkerson – Senior Director, Process Engineering
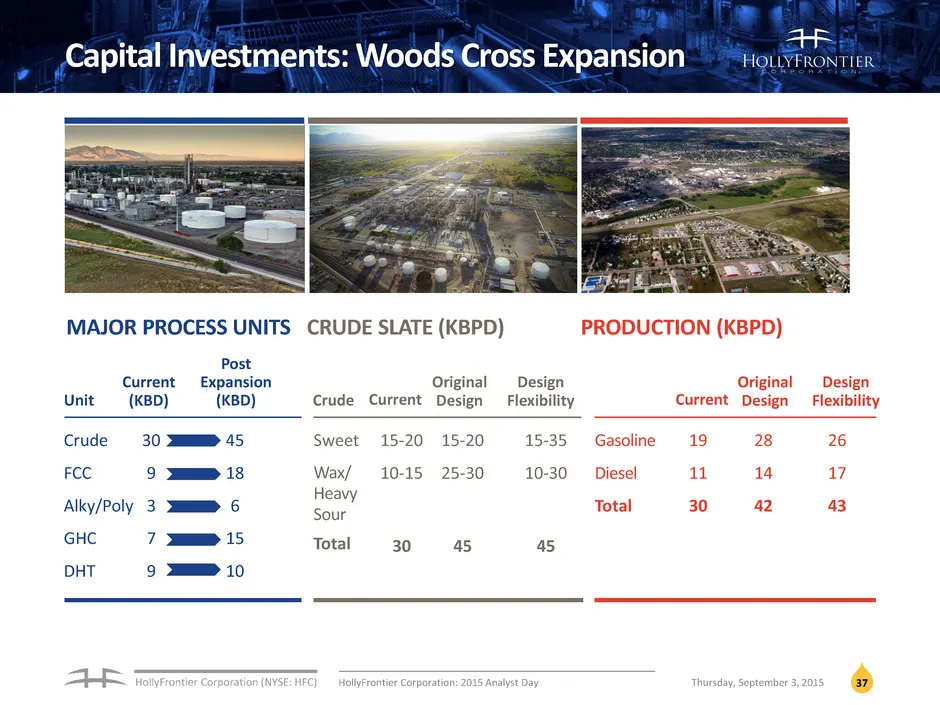
Slide 37: Capital Investments: Woods Cross Expansion
HollyFrontier Corporation (NYSE: HFC) 37 Capital Investments: Woods Cross Expansion MAJOR PROCESS UNITS CRUDE SLATE (KBPD) PRODUCTION (KBPD) Unit Current (KBD) Post Expansion (KBD) Crude FCC Alky/Poly GHC DHT 30 9 3 7 9 45 18 6 15 10 Crude Current Design Flexibility Original Design 15-20 10-15 30 Sw
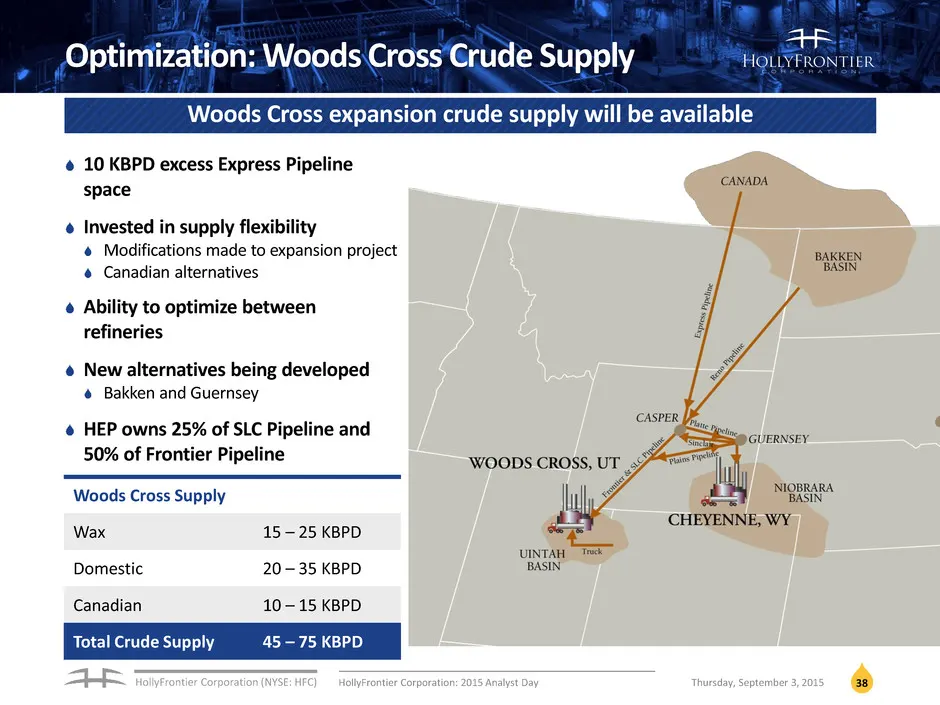
Slide 38: Optimization: Woods Cross Crude Supply
HollyFrontier Corporation (NYSE: HFC) Optimization: Woods Cross Crude Supply 10 KBPD excess Express Pipeline space Invested in supply flexibility Modifications made to expansion project Canadian alternatives Ability to optimize between refineries New alternatives being developed Bakken and Guernsey
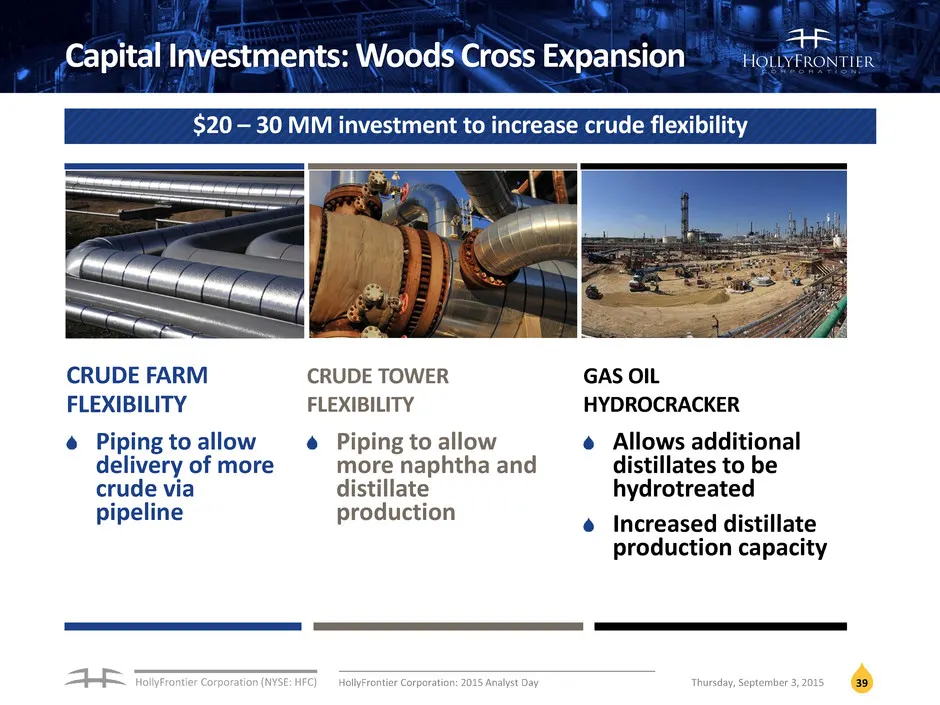
Slide 39: Capital Investments: Woods Cross Expansion
HollyFrontier Corporation (NYSE: HFC) 39 Capital Investments: Woods Cross Expansion CRUDE FARM FLEXIBILITY CRUDE TOWER FLEXIBILITY GAS OIL HYDROCRACKER Piping to allow delivery of more crude via pipeline Piping to allow more naphtha and distillate production Allows additional distillates to be hydro
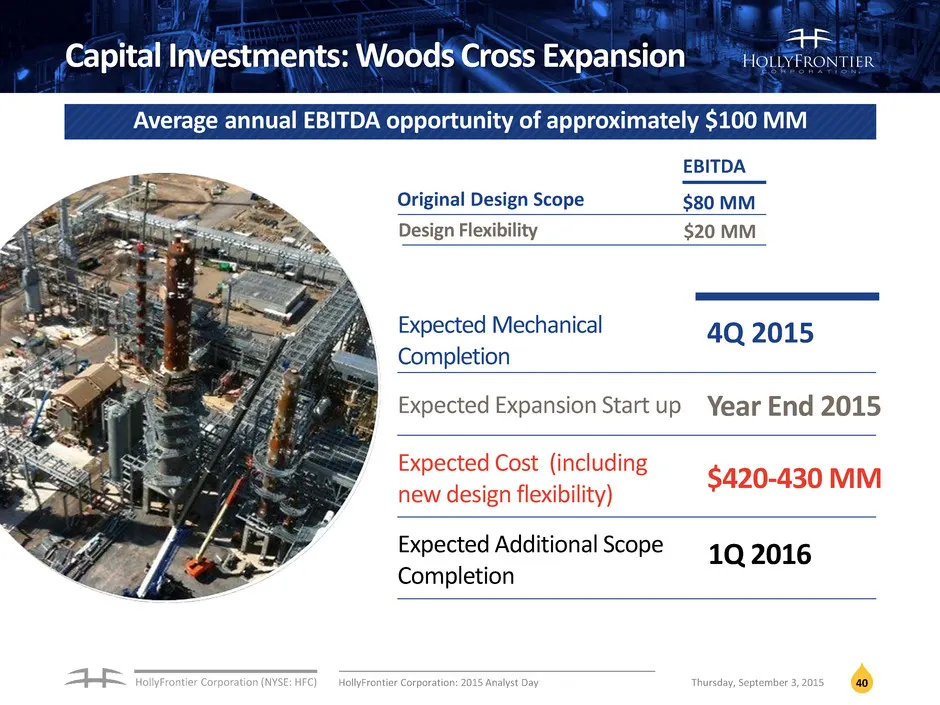
Slide 40: Capital Investments: Woods Cross Expansion
HollyFrontier Corporation (NYSE: HFC) 40 Capital Investments: Woods Cross Expansion Average annual EBITDA opportunity of approximately $100 MM Original Design Scope $80 MM $20 MM EBITDA Design Flexibility Expected Mechanical Completion 4Q 2015 Expected Expansion Start up Year End 2015 Expected Cost
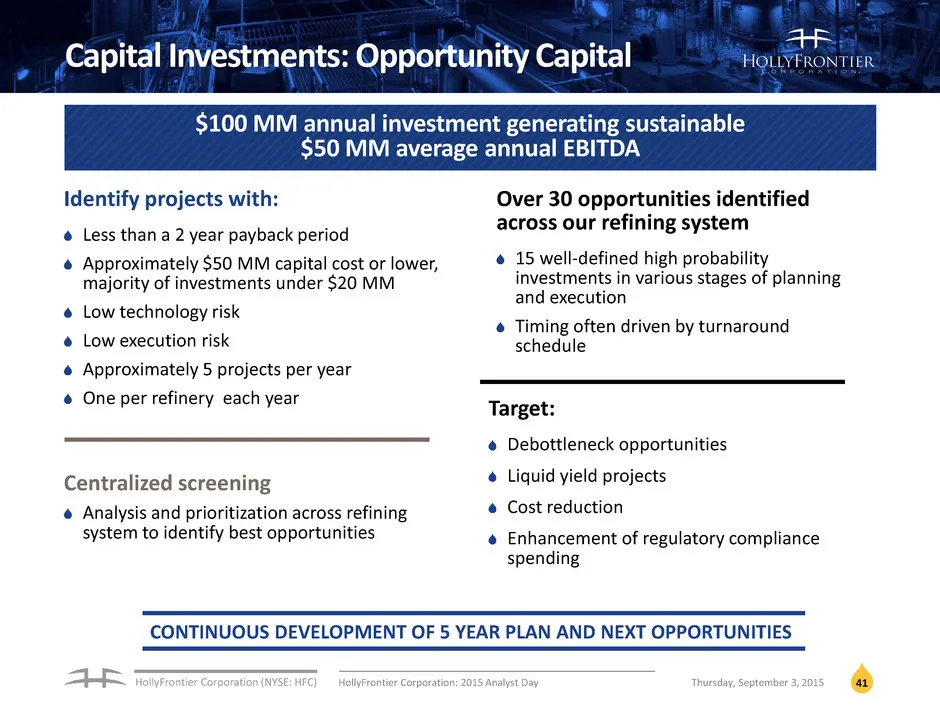
Slide 41: Capital Investments: Opportunity Capital
HollyFrontier Corporation (NYSE: HFC) Identify projects with: Less than a 2 year payback period Approximately $50 MM capital cost or lower, majority of investments under $20 MM Low technology risk Low execution risk Approximately 5 projects per year One per refinery each year Centralized screening A
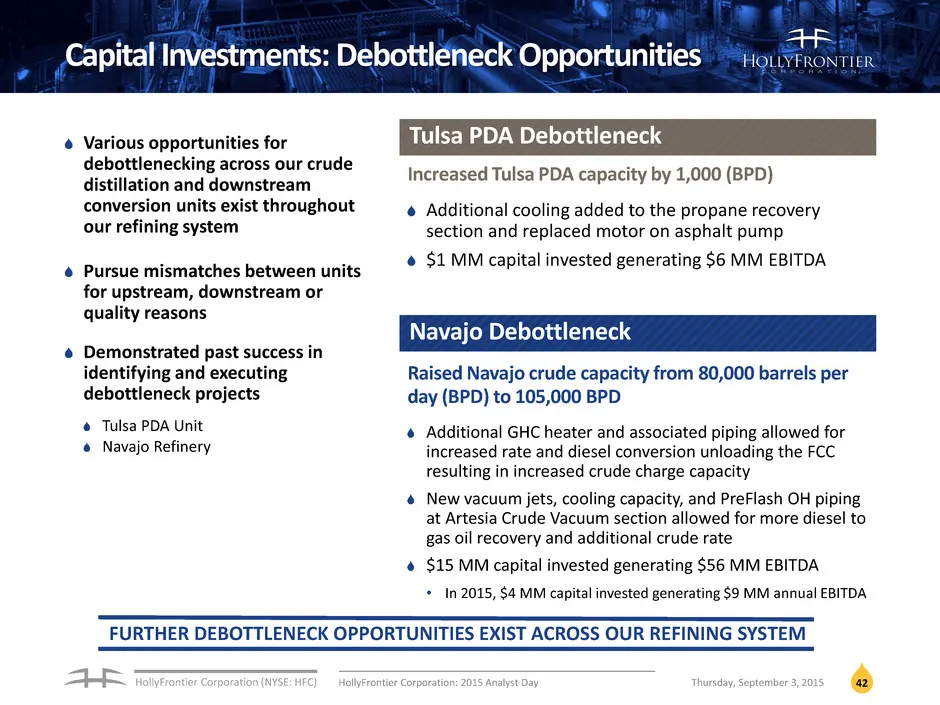
Slide 42: Capital Investments: Debottleneck Opportunities
HollyFrontier Corporation (NYSE: HFC) 42 Capital Investments: Debottleneck Opportunities Various opportunities for debottlenecking across our crude distillation and downstream conversion units exist throughout our refining system Pursue mismatches between units for upstream, downstream or quality re
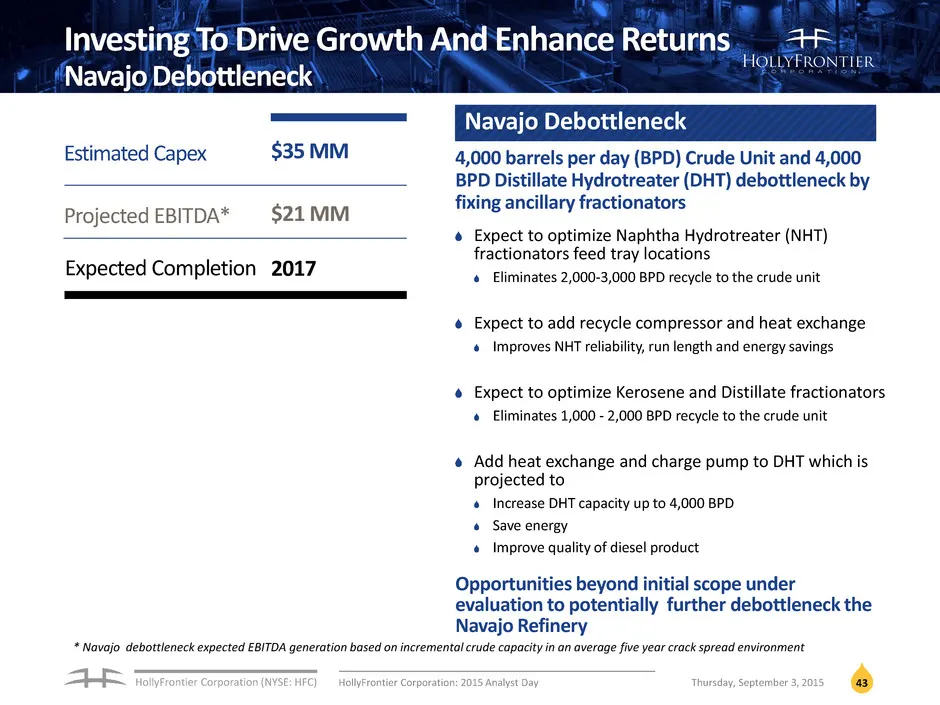
Slide 43: Navajo Debottleneck
HollyFrontier Corporation (NYSE: HFC) 43 4,000 barrels per day (BPD) Crude Unit and 4,000 BPD Distillate Hydrotreater (DHT) debottleneck by fixing ancillary fractionators Expect to optimize Naphtha Hydrotreater (NHT) fractionators feed tray locations Eliminates 2,000-3,000 BPD recycle to the crude u
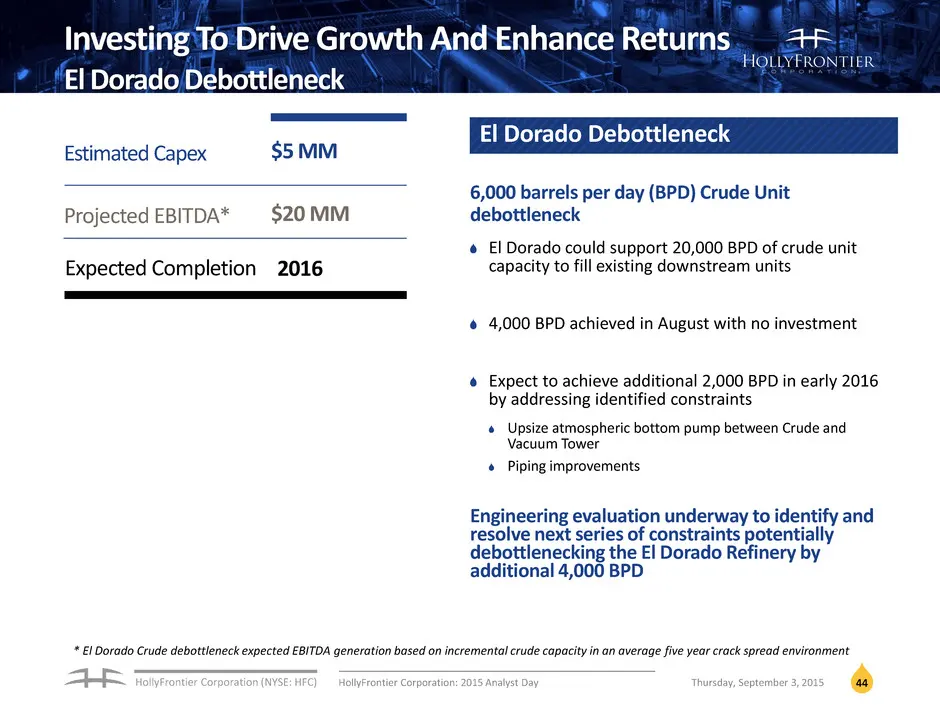
Slide 44: El Dorado Debottleneck
HollyFrontier Corporation (NYSE: HFC) 44 6,000 barrels per day (BPD) Crude Unit debottleneck El Dorado could support 20,000 BPD of crude unit capacity to fill existing downstream units 4,000 BPD achieved in August with no investment Expect to achieve additional 2,000 BPD in early 2016 by addressing
Slide 45: Capital Investments: Liquid Yield Opportunities
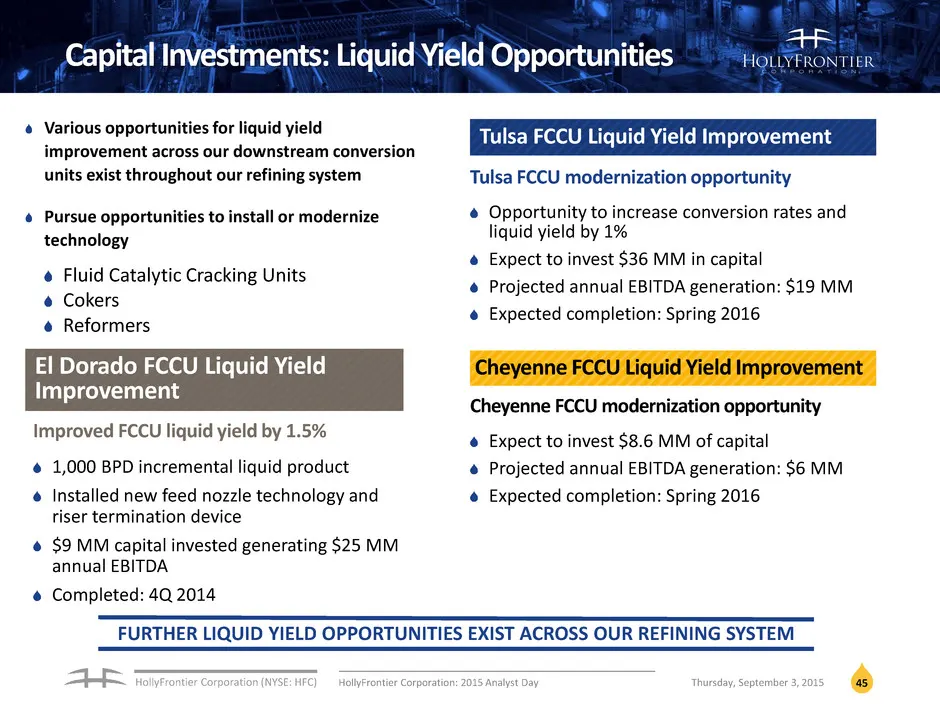
HollyFrontier Corporation (NYSE: HFC) 45 Capital Investments: Liquid Yield Opportunities • Raised Navajo crude capacity from 80,000 barrels per day (BPD) to 105,000 BPD since 2012 Tulsa FCCU modernization opportunity Opportunity to increase conversion rates and liquid yield by 1% Expect to invest $3
Slide 46: Tulsa Naphtha Splitter
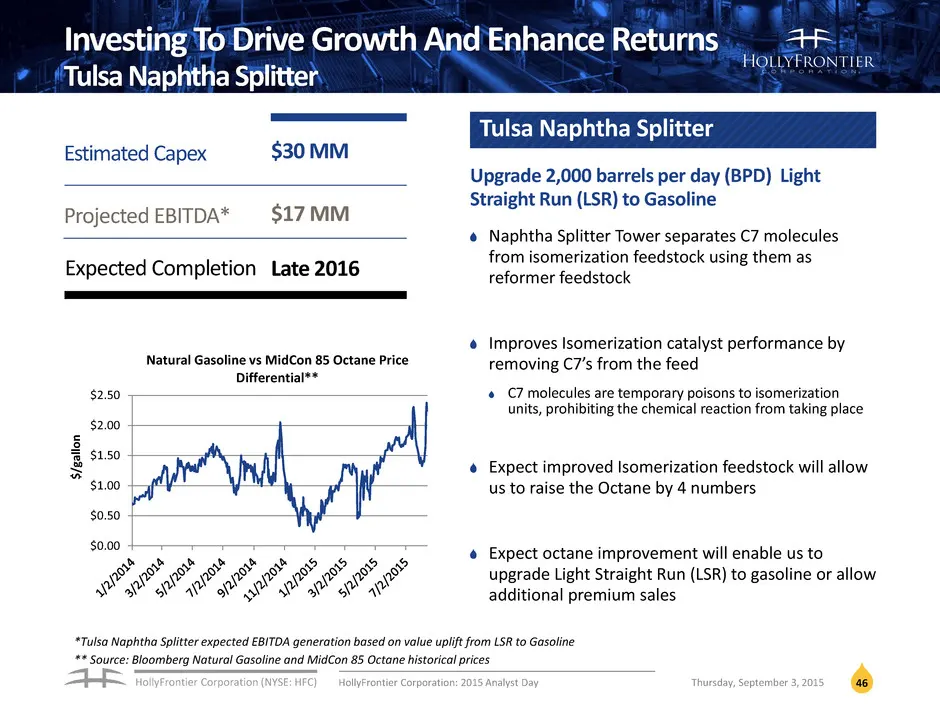
HollyFrontier Corporation (NYSE: HFC) 46 Upgrade 2,000 barrels per day (BPD) Light Straight Run (LSR) to Gasoline Naphtha Splitter Tower separates C7 molecules from isomerization feedstock using them as reformer feedstock Improves Isomerization catalyst performance by removing C7’s from the feed C7
Slide 47: El Dorado Coker Yield Improvement
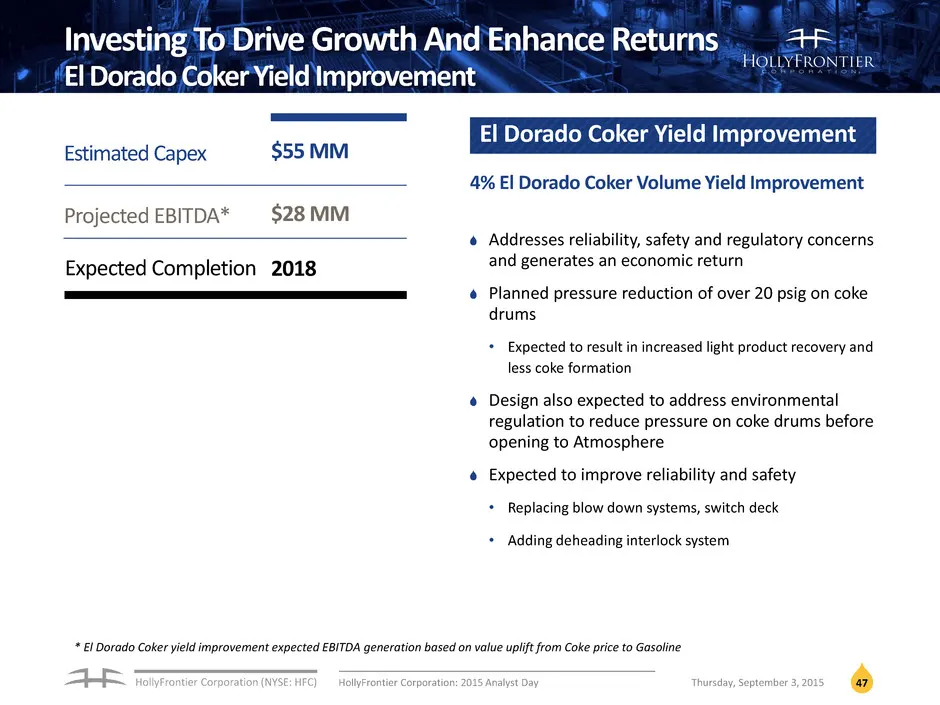
HollyFrontier Corporation (NYSE: HFC) 47 4% El Dorado Coker Volume Yield Improvement Addresses reliability, safety and regulatory concerns and generates an economic return Planned pressure reduction of over 20 psig on coke drums • Expected to result in increased light product recovery and less coke
Slide 48: Our Business Plan
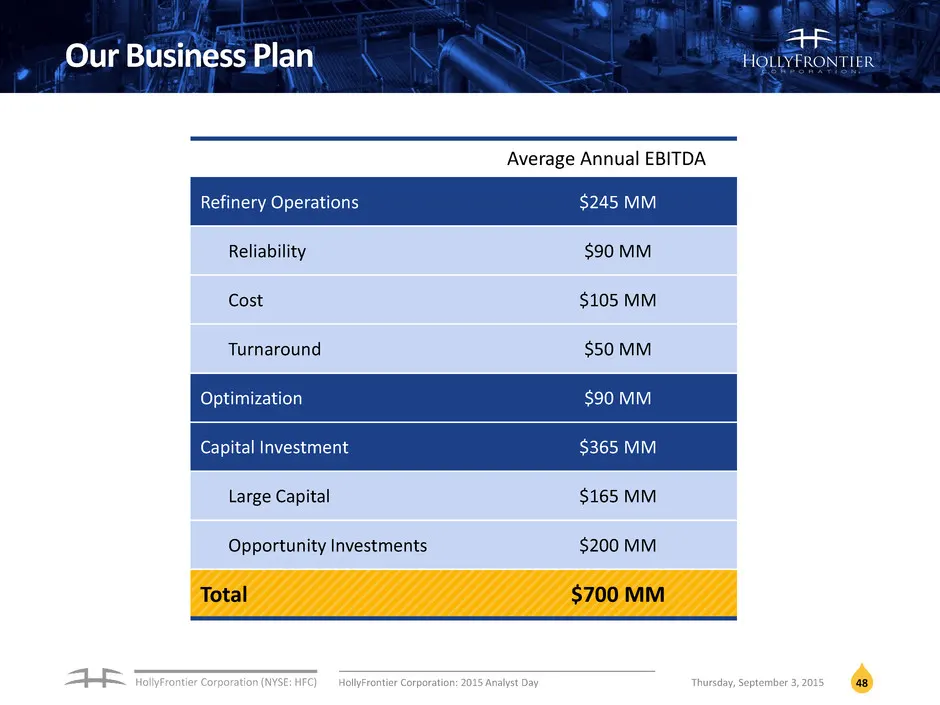
HollyFrontier Corporation (NYSE: HFC) 48 Our Business Plan Average Annual EBITDA Refinery Operations $245 MM Reliability $90 MM Cost $105 MM Turnaround $50 MM Optimization $90 MM Capital Investment $365 MM Large Capital $165 MM Opportunity Investments $200 MM Total $700 MM HollyFrontier Corporation:
Slide 49: Break
BREAK
Slide 50: Holly Energy Partners
HOLLY ENERGY PARTNERS Bruce Shaw - President
Slide 51: Holly Energy Partners
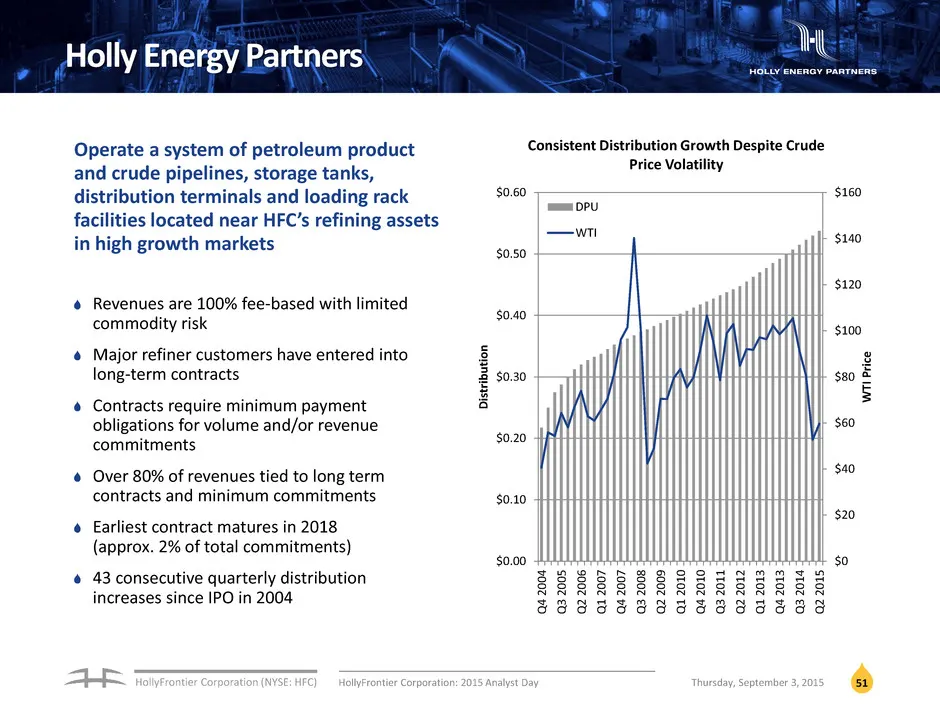
HollyFrontier Corporation (NYSE: HFC) 51 Holly Energy Partners Operate a system of petroleum product and crude pipelines, storage tanks, distribution terminals and loading rack facilities located near HFC’s refining assets in high growth markets Revenues are 100% fee-based with limited commodity ris
Slide 52: HEP Growth Drivers
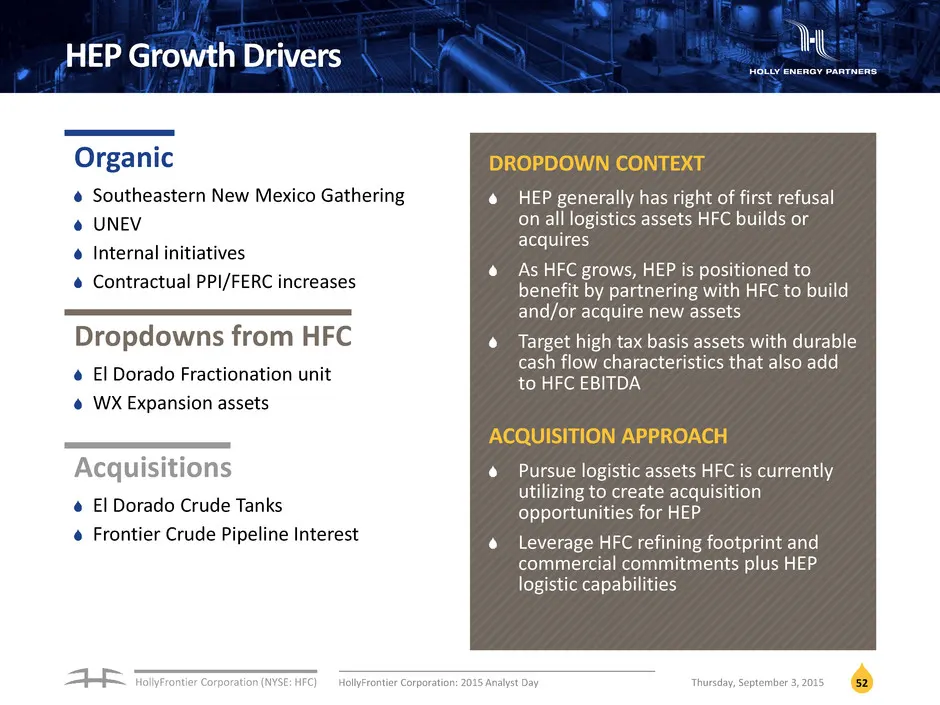
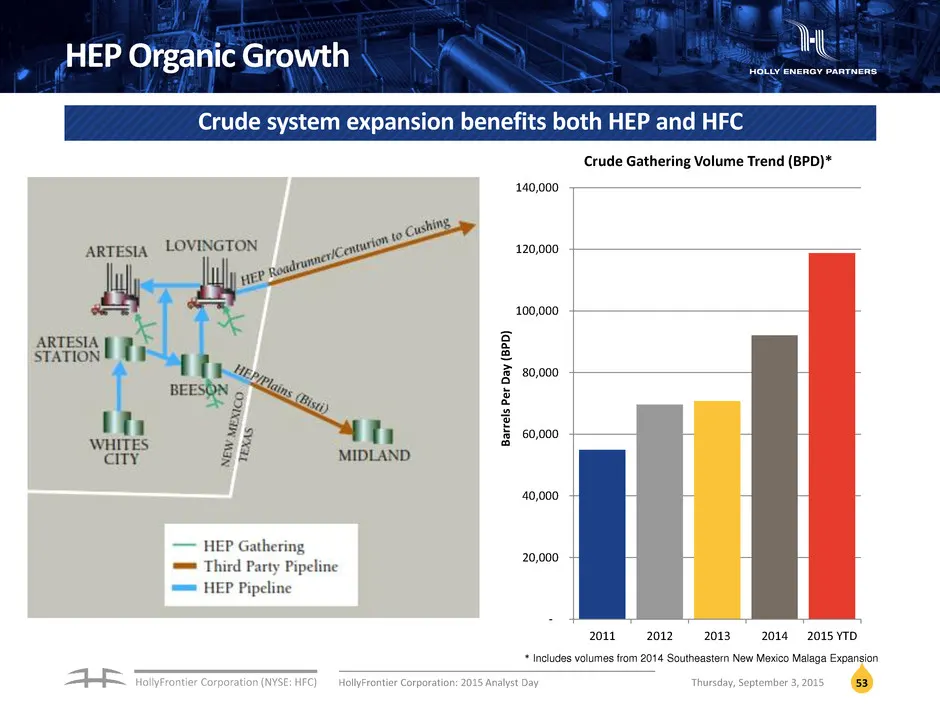
HollyFrontier Corporation (NYSE: HFC) 52 HEP Growth Drivers Organic Southeastern New Mexico Gathering UNEV Internal initiatives Contractual PPI/FERC increases Dropdowns from HFC El Dorado Fractionation unit WX Expansion assets Acquisitions El Dorado Crude Tanks Frontier Crude Pipeline Interest DROPD
Slide 53: HEP Organic Growth
HollyFrontier Corporation (NYSE: HFC) 53 HEP Organic Growth * Includes volumes from 2014 Southeastern New Mexico Malaga Expansion - 20,000 40,000 60,000 80,000 100,000 120,000 140,000 2011 2012 2013 2014 2015 YTD B ar re ls Pe r D ay ( B P D ) Crude Gathering Volume Trend (BPD)* Crude system expansi
Slide 54: HEP Operational Improvements
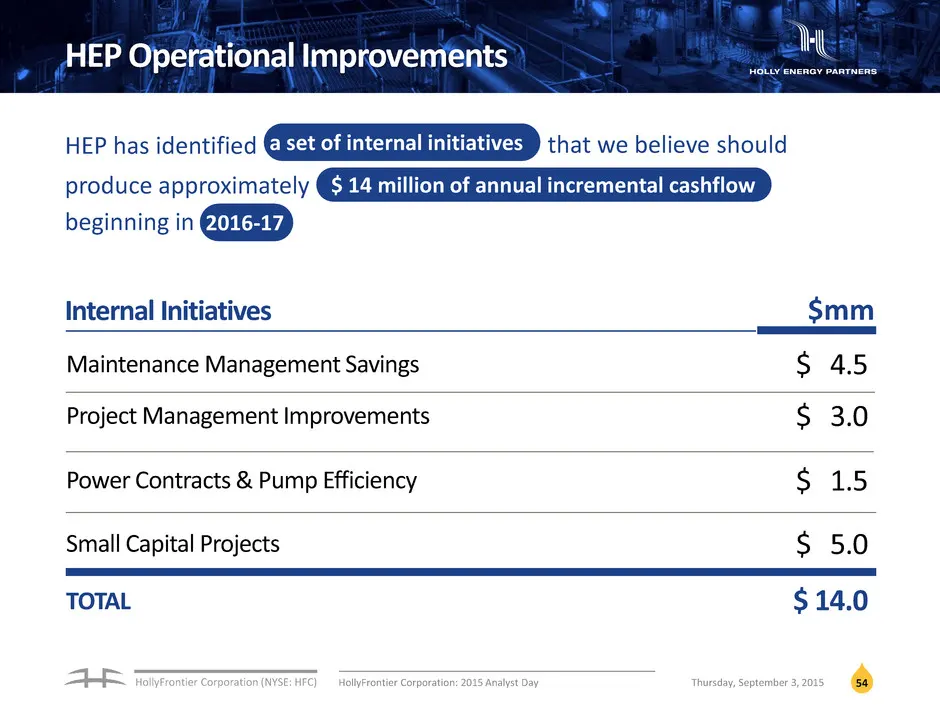
HollyFrontier Corporation (NYSE: HFC) 54 HEP Operational Improvements Internal Initiatives $mm Maintenance Management Savings $ 4.5 HEP has identified a set of internal initiatives that we believe should produce approximately $ 14 million of annual incremental cashflow beginning in Project Managemen
Slide 55: El Dorado Naphtha Fractionation Dropdown
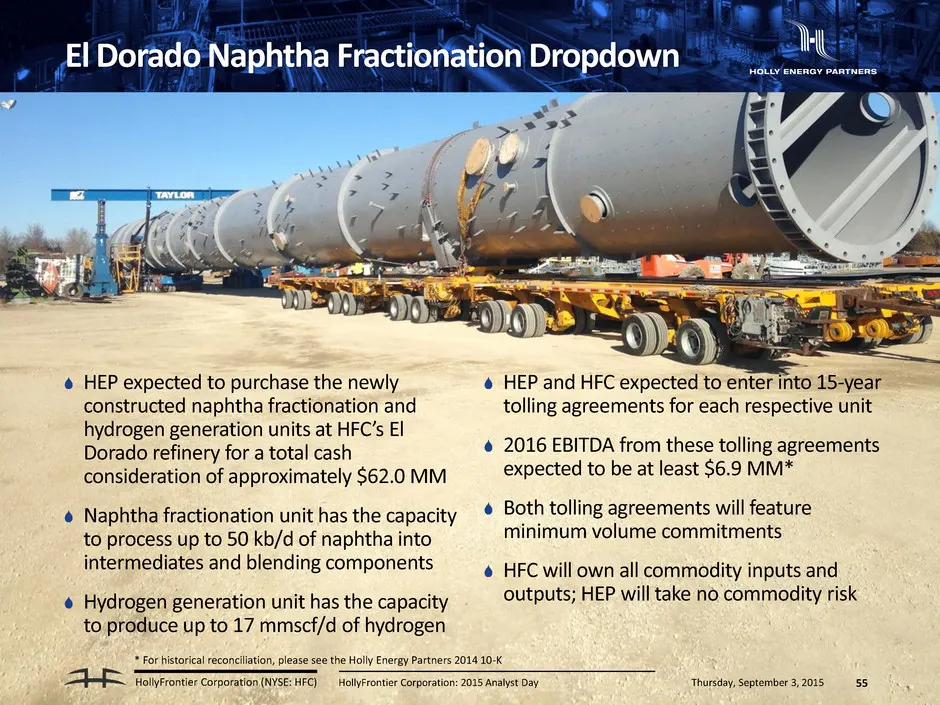
WEDNESDAY, SEPTEMBER 02, 2015 HollyFrontier Corporation (NYSE: HFC) HEP expected to purchase the newly constructed naphtha fractionation and hydrogen generation units at HFC’s El Dorado refinery for a total cash consideration of approximately $62.0 MM Naphtha fractionation unit has the capacity to p
Slide 56: Frontier Pipeline Interest Acquisition
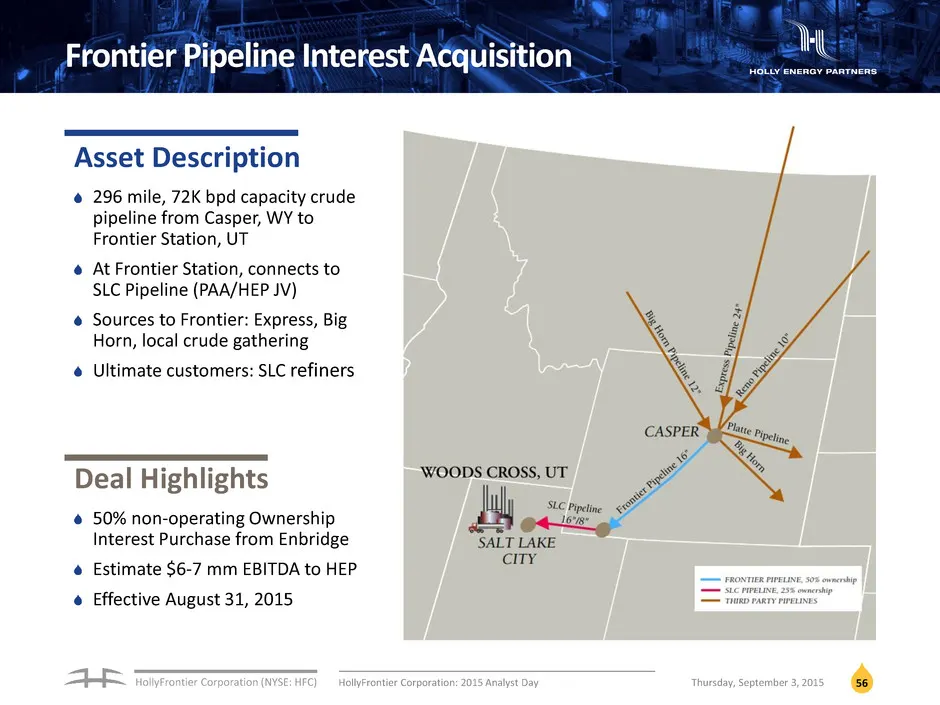
HollyFrontier Corporation (NYSE: HFC) 56 Frontier Pipeline Interest Acquisition Asset Description 296 mile, 72K bpd capacity crude pipeline from Casper, WY to Frontier Station, UT At Frontier Station, connects to SLC Pipeline (PAA/HEP JV) Sources to Frontier: Express, Big Horn, local crude gathering
Slide 57: HEP Growth: Financial Impact
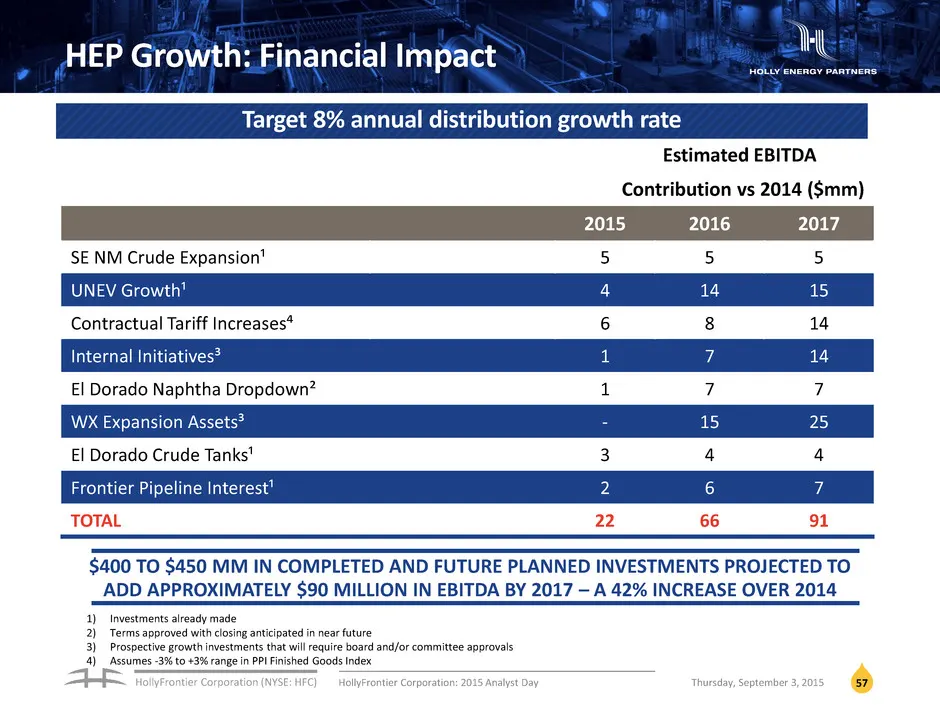
HollyFrontier Corporation (NYSE: HFC) HEP Growth: Financial Impact 57 Estimated EBITDA Contribution vs 2014 ($mm) 2015 2016 2017 SE NM Crude Expansion¹ 5 5 5 UNEV Growth¹ 4 14 15 Contractual Tariff Increases⁴ 6 8 14 Internal Initiatives³ 1 7 14 El Dorado Naphtha Dropdown² 1 7 7 WX Expansion Assets³
Slide 58: HFC GP Cash Flows
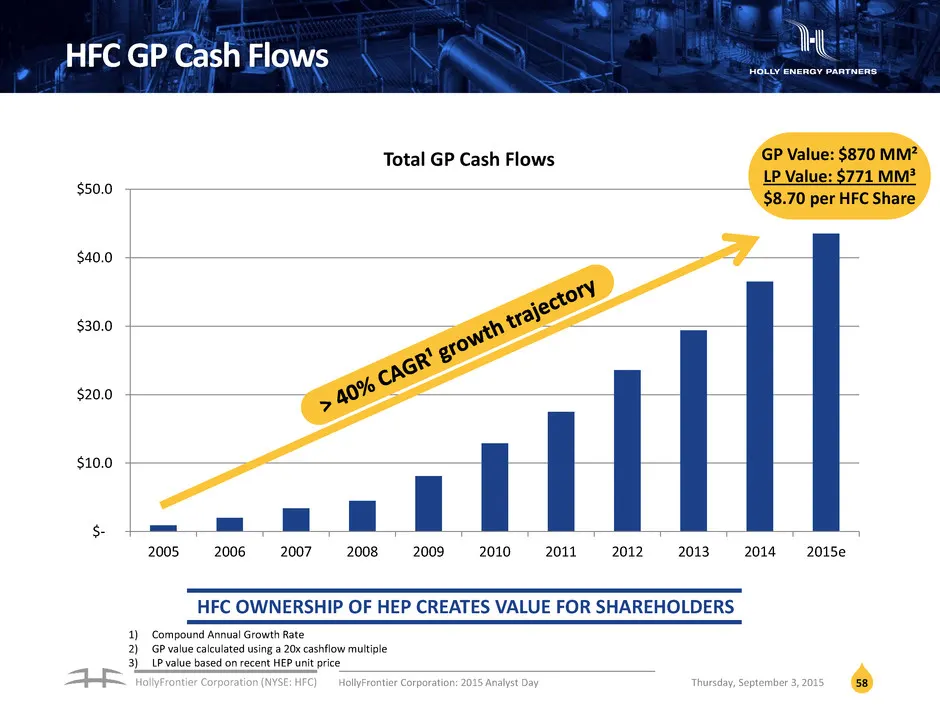
HollyFrontier Corporation (NYSE: HFC) 58 HFC GP Cash Flows $- $10.0 $20.0 $30.0 $40.0 $50.0 2005 2006 2007 2008 2009 2010 2011 2012 2013 2014 2015e Total GP Cash Flows HFC OWNERSHIP OF HEP CREATES VALUE FOR SHAREHOLDERS GP Value: $870 MM² LP Value: $771 MM³ $8.70 per HFC Share 1) Compound Annual Gro
Slide 59: Financial Roll Up
FINANCIAL ROLL UP Doug Aron - CFO
Slide 60: Strong Track Record of Cash Returns
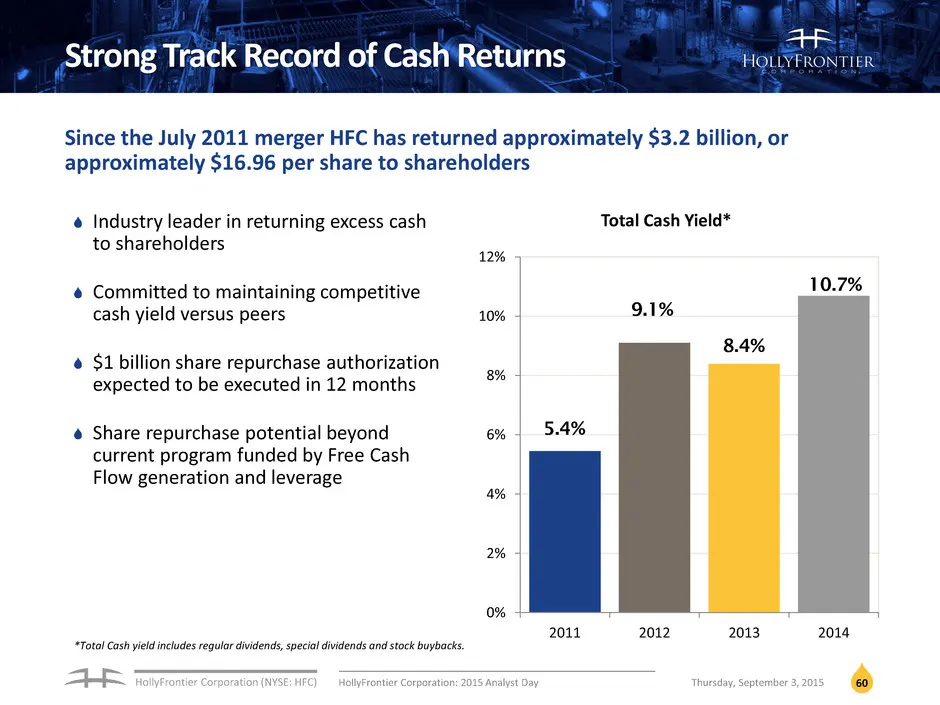
HollyFrontier Corporation (NYSE: HFC) 60 Strong Track Record of Cash Returns Industry leader in returning excess cash to shareholders Committed to maintaining competitive cash yield versus peers $1 billion share repurchase authorization expected to be executed in 12 months Share repurchase potential
Slide 61: Disciplined Approach to Capital Allocation
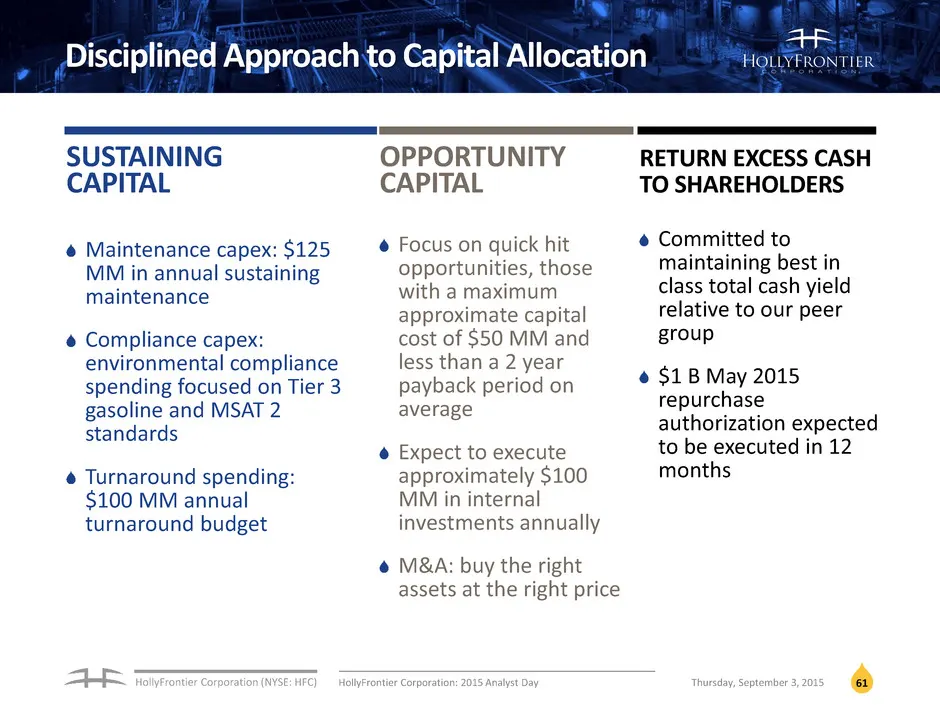
HollyFrontier Corporation (NYSE: HFC) 61 Disciplined Approach to Capital Allocation SUSTAINING CAPITAL Maintenance capex: $125 MM in annual sustaining maintenance Compliance capex: environmental compliance spending focused on Tier 3 gasoline and MSAT 2 standards Turnaround spending: $100 MM annual t
Slide 62: Optimize Capital Structure
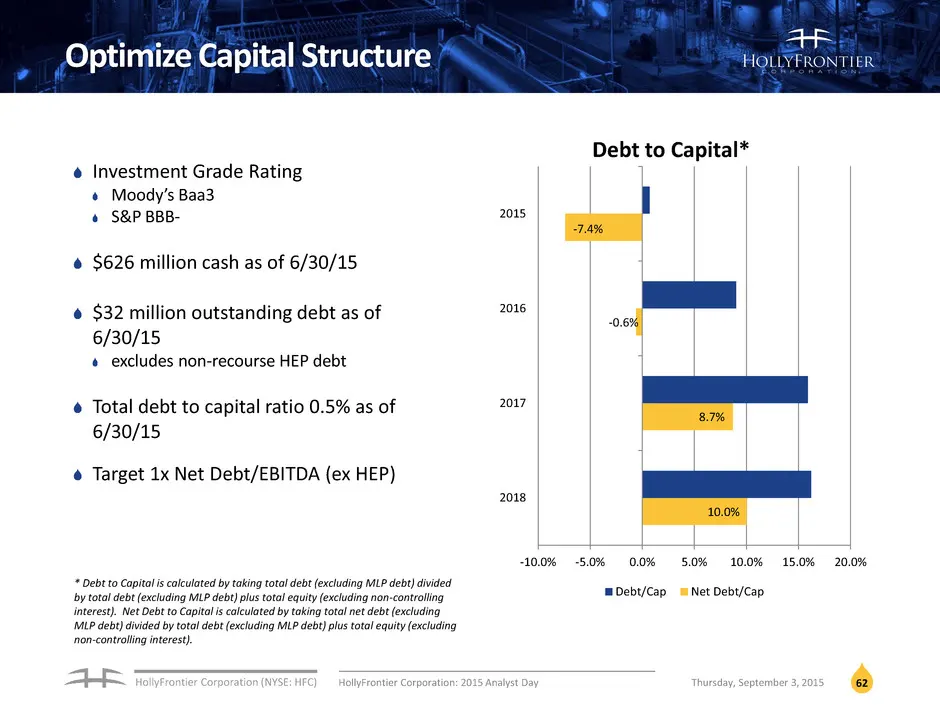
HollyFrontier Corporation (NYSE: HFC) 62 Optimize Capital Structure Investment Grade Rating Moody’s Baa3 S&P BBB- $626 million cash as of 6/30/15 $32 million outstanding debt as of 6/30/15 excludes non-recourse HEP debt Total debt to capital ratio 0.5% as of 6/30/15 Target 1x Net Debt/EBITDA (ex HEP
Slide 63: Our Business Plan
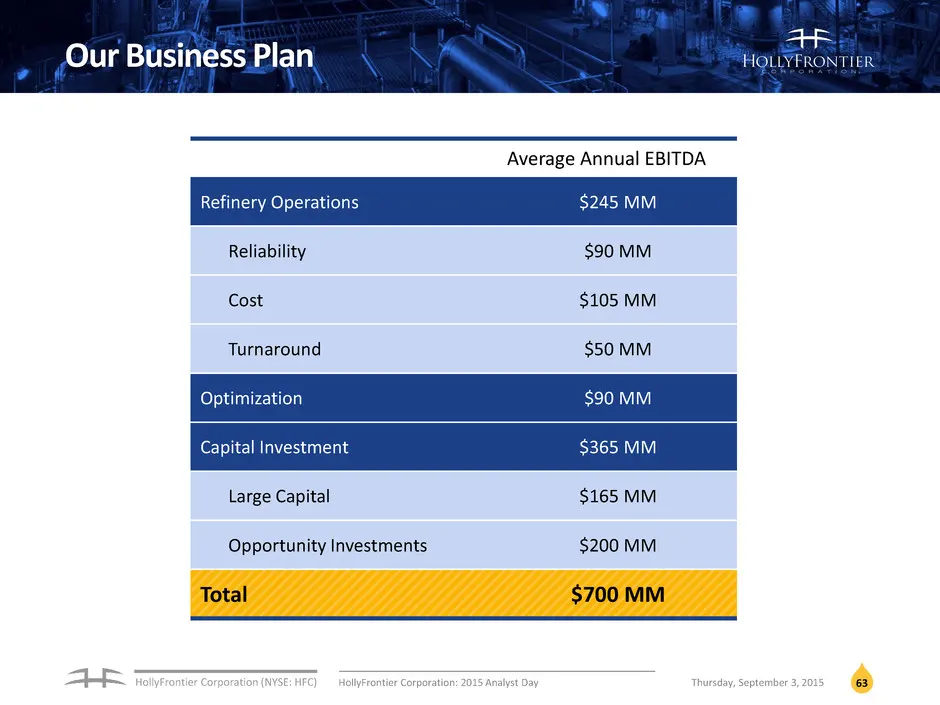
HollyFrontier Corporation (NYSE: HFC) 63 Our Business Plan Average Annual EBITDA Refinery Operations $245 MM Reliability $90 MM Cost $105 MM Turnaround $50 MM Optimization $90 MM Capital Investment $365 MM Large Capital $165 MM Opportunity Investments $200 MM Total $700 MM HollyFrontier Corporation:
Slide 64: Projected Consolidated Income Statement
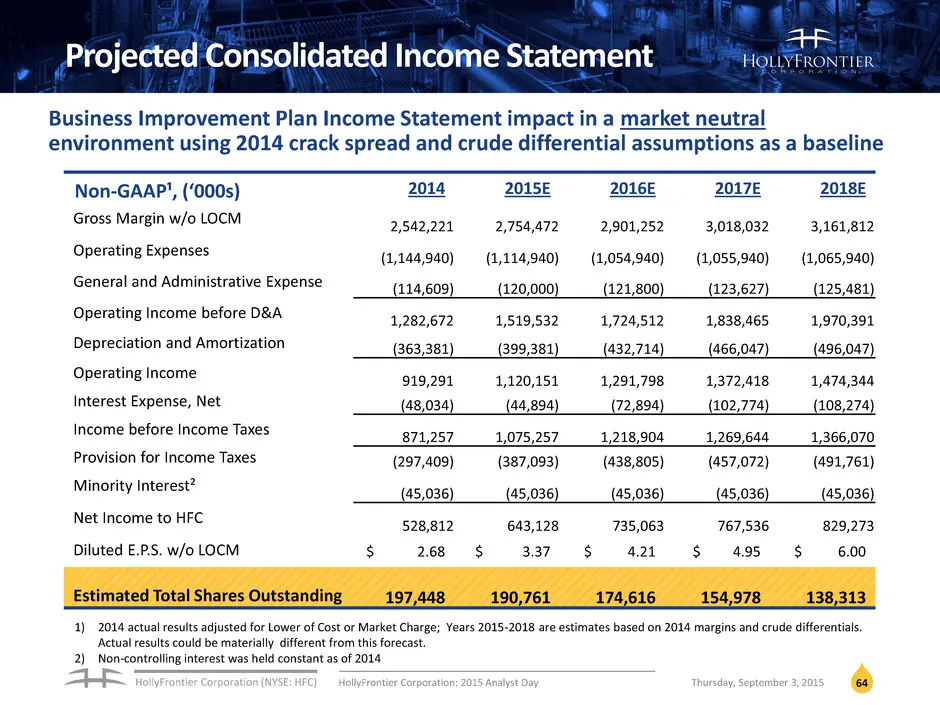
HollyFrontier Corporation (NYSE: HFC) 64 Projected Consolidated Income Statement 2014 2015E 2016E 2017E 2018E Gross Margin w/o LOCM 2,542,221 2,754,472 2,901,252 3,018,032 3,161,812 Operating Expenses (1,144,940) (1,114,940) (1,054,940) (1,055,940) (1,065,940) General and Administrative Expense (114
Slide 65: Projected Cash Flow Statement
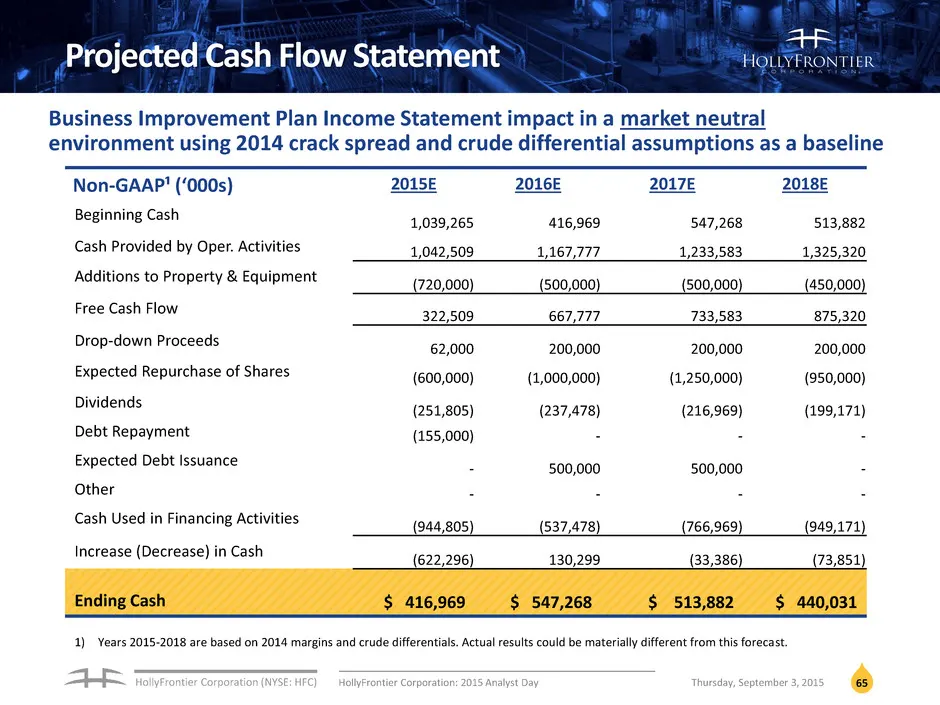
HollyFrontier Corporation (NYSE: HFC) 65 Projected Cash Flow Statement 2015E 2016E 2017E 2018E Beginning Cash 1,039,265 416,969 547,268 513,882 Cash Provided by Oper. Activities 1,042,509 1,167,777 1,233,583 1,325,320 Additions to Property & Equipment (720,000) (500,000) (500,000) (450,000) Free Cas
Slide 66: Summary
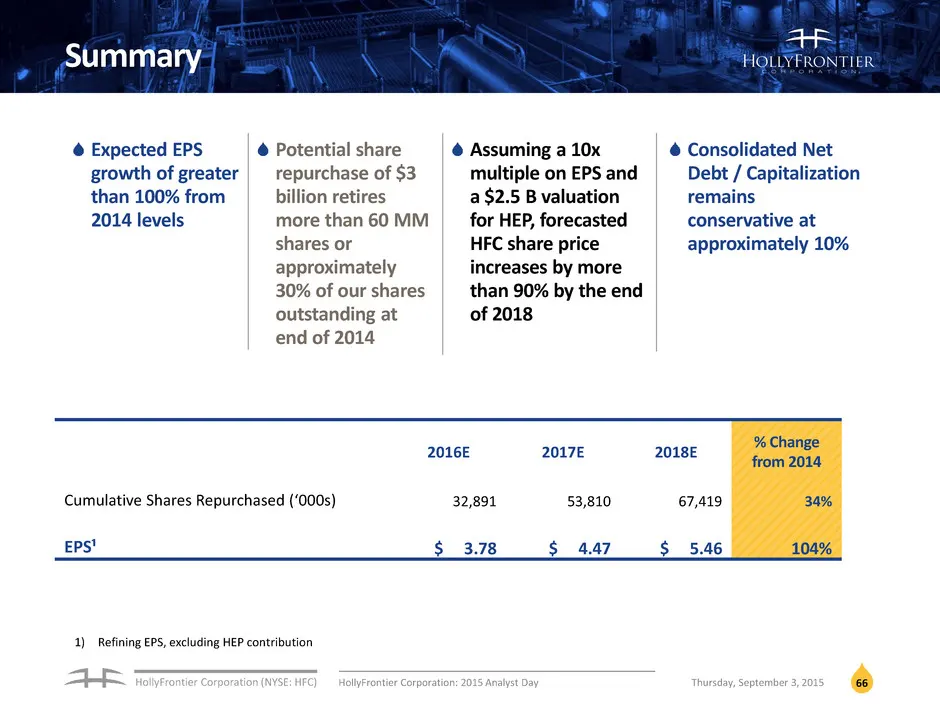
HollyFrontier Corporation (NYSE: HFC) 66 Summary Expected EPS growth of greater than 100% from 2014 levels Potential share repurchase of $3 billion retires more than 60 MM shares or approximately 30% of our shares outstanding at end of 2014 Assuming a 10x multiple on EPS and a $2.5 B valuation for H
Slide 67: Expected Share Value Growth
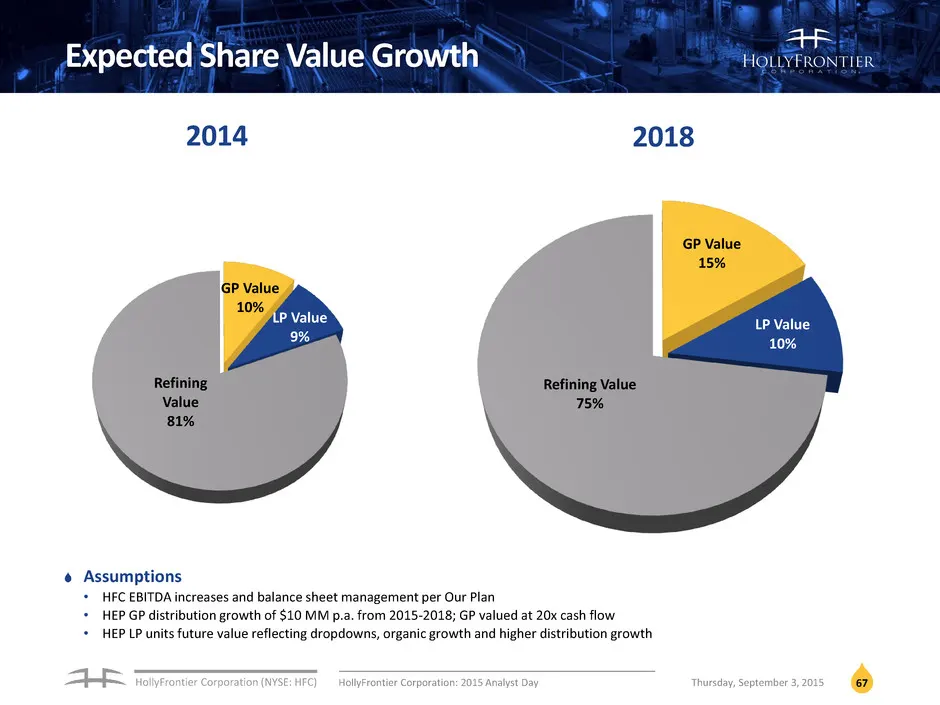
HollyFrontier Corporation (NYSE: HFC) 67 Expected Share Value Growth Assumptions • HFC EBITDA increases and balance sheet management per Our Plan • HEP GP distribution growth of $10 MM p.a. from 2015-2018; GP valued at 20x cash flow • HEP LP units future value reflecting dropdowns, organic growth an
Slide 68: Q&A
Q&A
Slide 69: Appendix
—— i feat! | aN APPENDIX
Slide 70: Participant Biographies
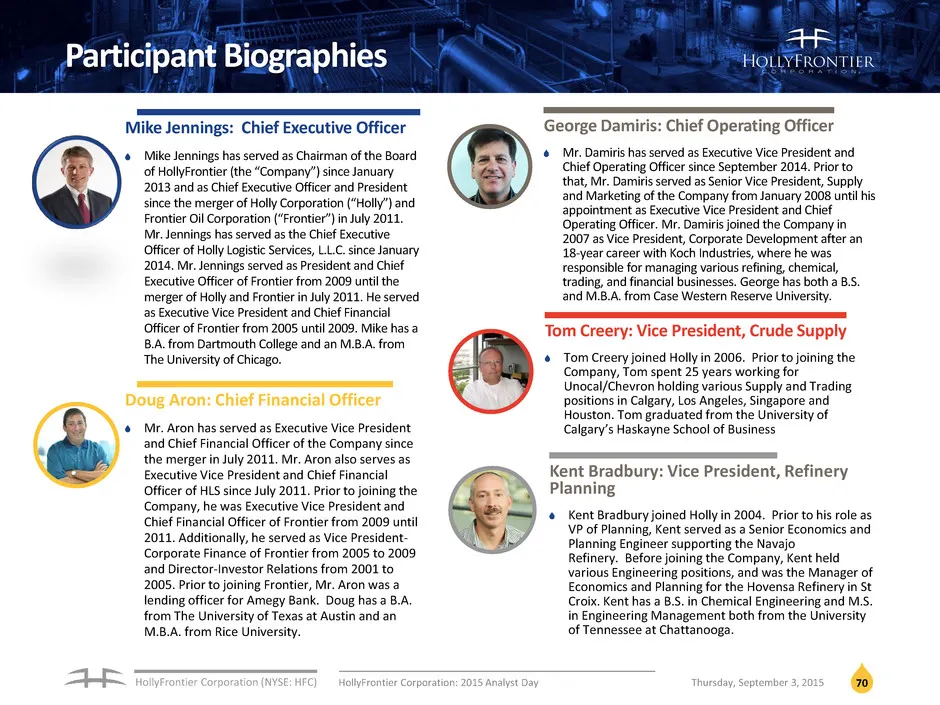
HollyFrontier Corporation (NYSE: HFC) Kent Bradbury: Vice President, Refinery Planning Kent Bradbury joined Holly in 2004. Prior to his role as VP of Planning, Kent served as a Senior Economics and Planning Engineer supporting the Navajo Refinery. Before joining the Company, Kent held various Engine
Slide 71: Participant Biographies
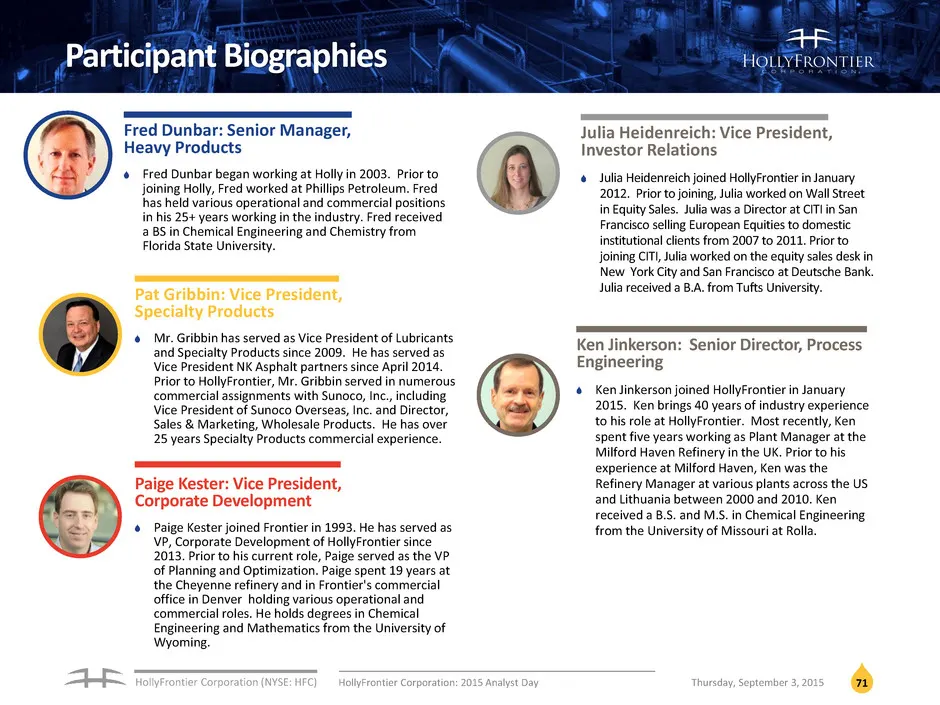
HollyFrontier Corporation (NYSE: HFC) Participant Biographies Pat Gribbin: Vice President, Specialty Products Mr. Gribbin has served as Vice President of Lubricants and Specialty Products since 2009. He has served as Vice President NK Asphalt partners since April 2014. Prior to HollyFrontier, Mr. Gr
Slide 72: Participant Biographies
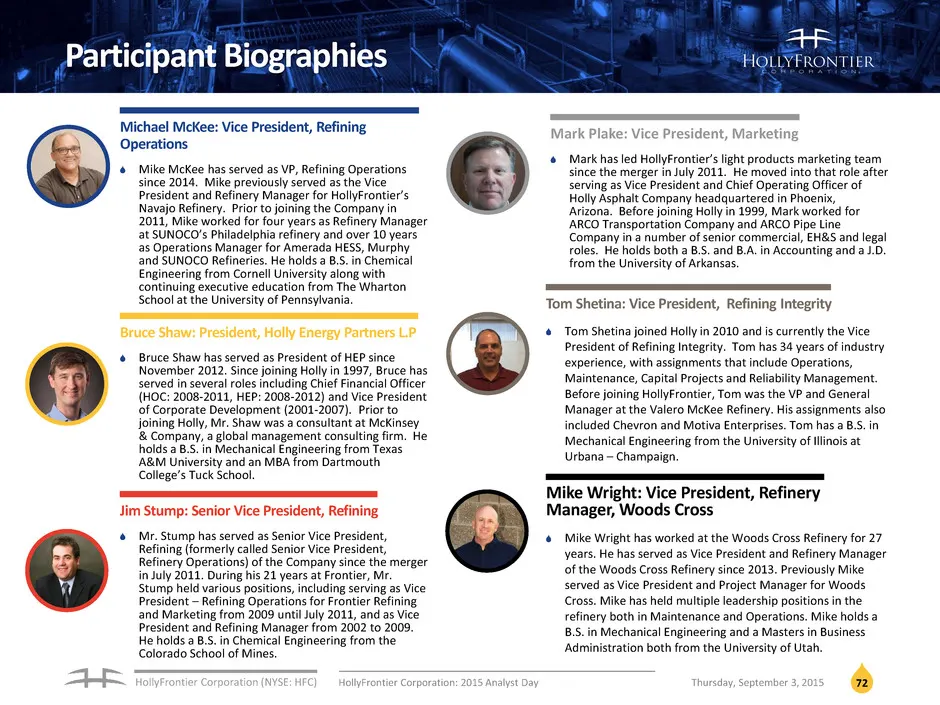
HollyFrontier Corporation (NYSE: HFC) Participant Biographies Michael McKee: Vice President, Refining Operations Mike McKee has served as VP, Refining Operations since 2014. Mike previously served as the Vice President and Refinery Manager for HollyFrontier’s Navajo Refinery. Prior to joining the Co
Slide 73: Appendix
—— i feat! | aN APPENDIX
Slide 74: Definitions
HollyFrontier Corporation (NYSE: HFC) Definitions Non GAAP measurements: We report certain financial measures that are not prescribed or authorized by U. S. generally accepted accounting principles ("GAAP"). We discuss management's reasons for reporting these non-GAAP measures below. Although manage
Slide 75: Definitions
HollyFrontier Corporation (NYSE: HFC) Definitions Free Cash Flow: Calculated by taking operating cash flow and subtracting capital expenditures. RBOB: Reformulated Gasoline Blendstock for Oxygen Blending RVP: Reid vapor pressure is a common measure of how easily the fuel evaporates at a given temper
Slide 76: Definitions
HollyFrontier Corporation (NYSE: HFC) Definitions MSAT2: The control of hazardous air pollutants from mobile sources, a rule issued by the U.S. Environmental Protection Agency to reduce hazardous emissions from motor vehicles and motor vehicle fuels. Natural gasoline: A low octane gasoline blend sto
Slide 77: Contact Information
HollyFrontier Corporation (NYSE: HFC) 2828 N. Harwood, Suite 1300 Dallas, Texas 75201 (214) 954-6510 www.hollyfrontier.com Julia Heidenreich, VP, Investor Relations Craig Biery, Investor Relations investors@hollyfrontier.com 214-954-6510
Source: SEC EDGAR · 8-K filed Sep 3, 2015
More decks from Holly Energy Partners LP
 Investor Presentation (March 2023)20 slides · Mar 2, 2023
 Investor Presentation (August 2022)24 slides · Aug 16, 2022
 Investor Presentation (May 2022)23 slides · May 17, 2022
 Investor Presentation (March 2022)12 slides · Mar 22, 2022
 Investor Presentation (March 2022)18 slides · Mar 1, 2022
 Investor Presentation (December 2021)18 slides · Dec 9, 2021