Scatec ASA · OSL:SCATC
Scatec ASA — Q3 2022 Earnings Presentation
20 slides from Scatec ASA's earnings presentation, November 2022
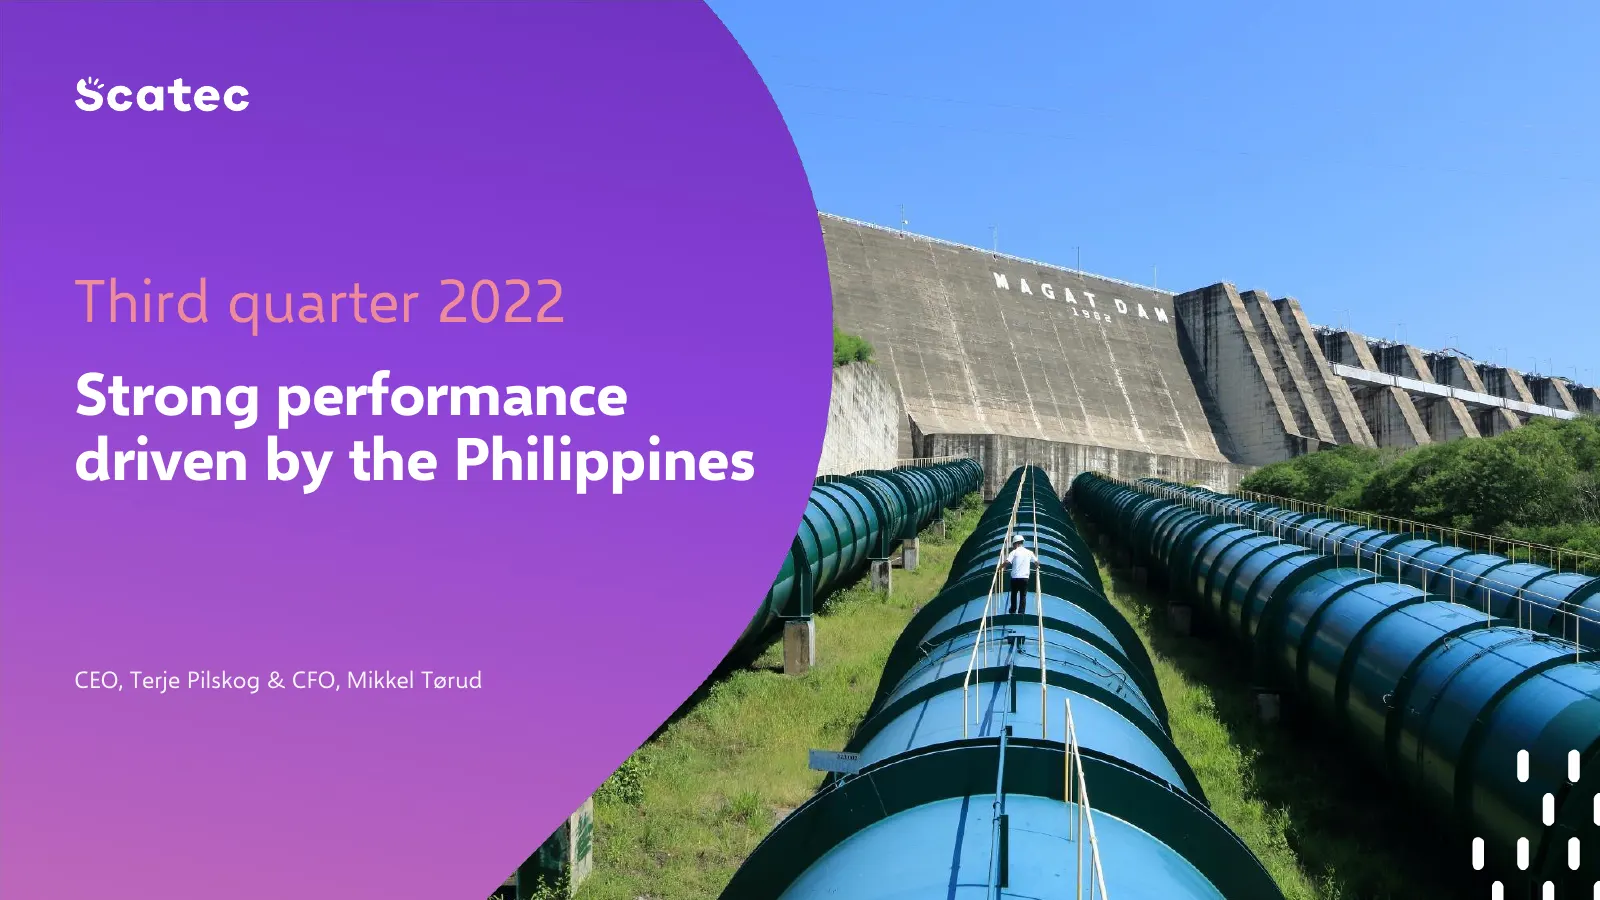
Slide 1: Third quarter 2022: Strong performance driven by the Philippines
Third quarter 2022 Strong performance driven by the Philippines CEO, Terje Pilskog & CFO, Mikkel Tørud
Slide 2: Disclaimer
Disclaimer The following presentation is being made only to, and is only directed at, persons to whom such presentation may lawfully be communicated (’relevant persons’). Any person who is not a relevant person should not rely, act or make assessment on the basis of this presentation or anything inc
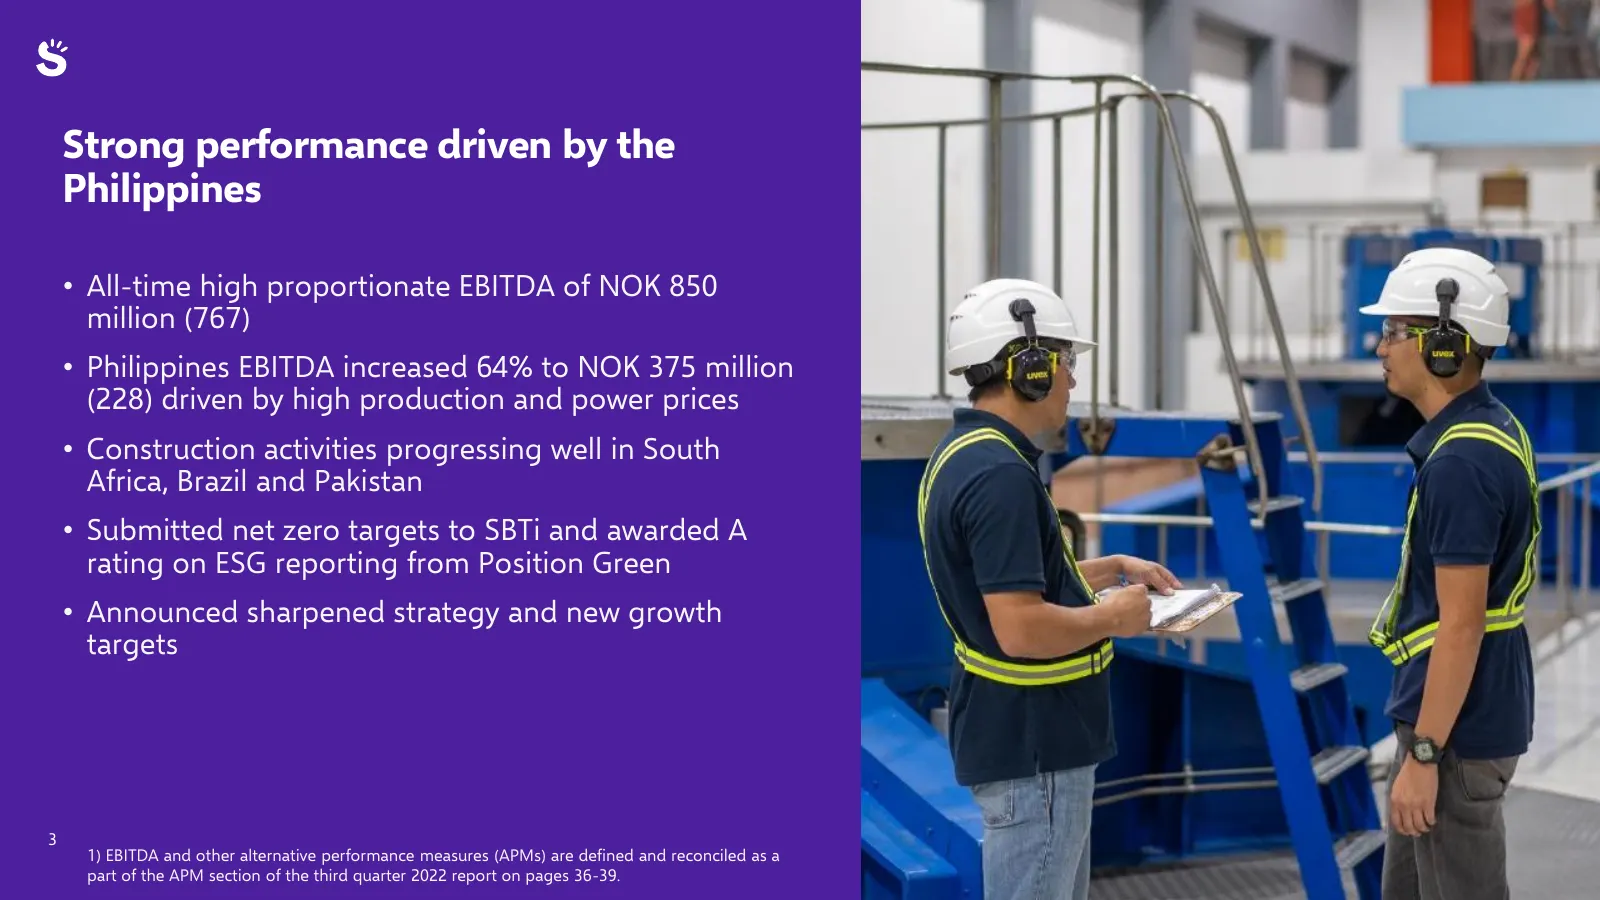
Slide 3: Strong performance driven by the Philippines
Strong performance driven by the Philippines • All-time high proportionate EBITDA of NOK 850 million (767) • Philippines EBITDA increased 64% to NOK 375 million (228) driven by high production and power prices • Construction activities progressing well in South Africa, Brazil and Pakistan • Submitte
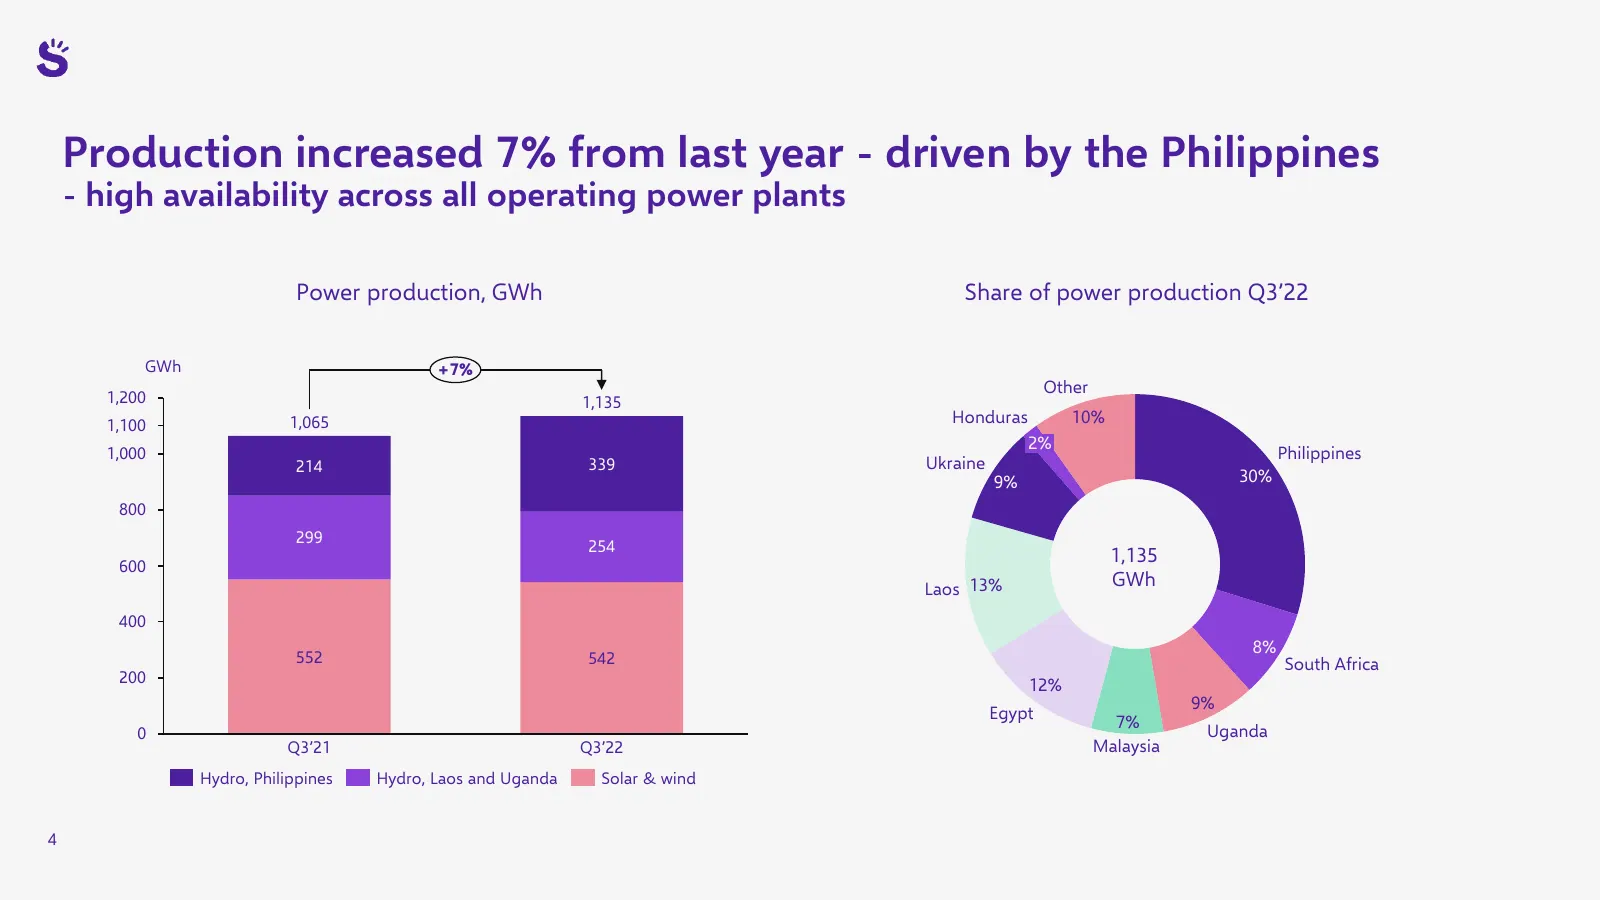
Slide 4: Production increased 7% from last year - driven by the Philippines
Production increased 7% from last year - driven by the Philippines - high availability across all operating power plants Power production, GWh Share of power production Q3’22 GWh +7% Other 1,200 1,135 1,100 1,065 Honduras 10% 2% 1,000 Philippines 214 339 Ukraine 9% 30% 800 299 254 600 1,135 Laos 13%
Slide 5: High production and power prices in the Philippines
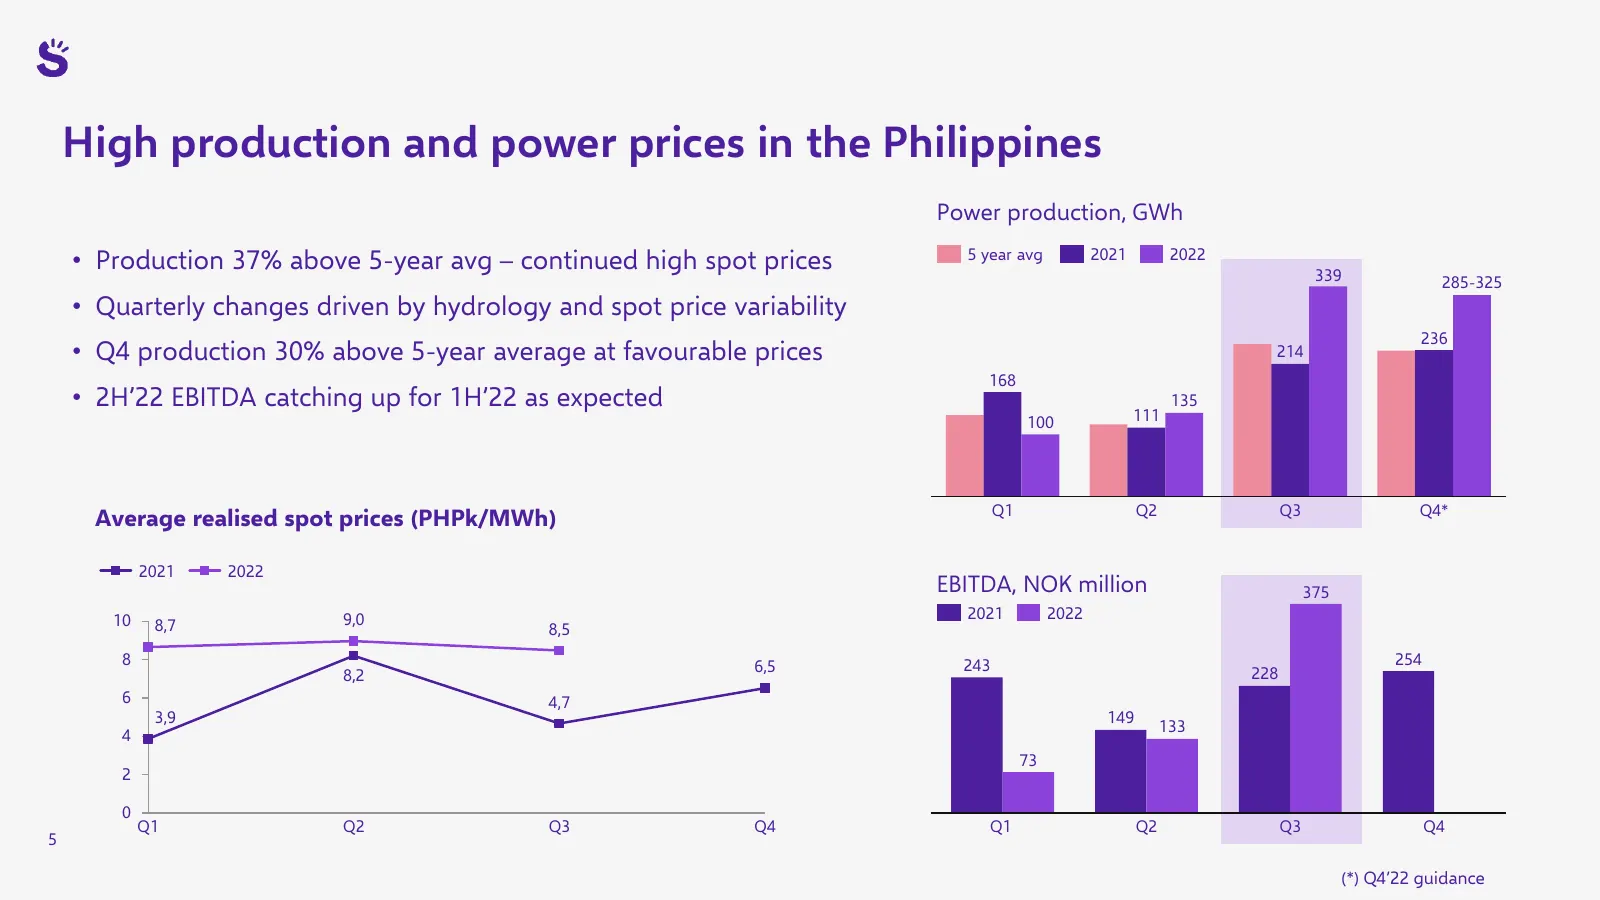
High production and power prices in the Philippines Power production, GWh • Production 37% above 5-year avg – continued high spot prices 5 year avg 2021 2022 339 285-325 • Quarterly changes driven by hydrology and spot price variability 236 • Q4 production 30% above 5-year average at favourable pric
Slide 6: Construction progressing well in South Africa, Brazil and Pakistan
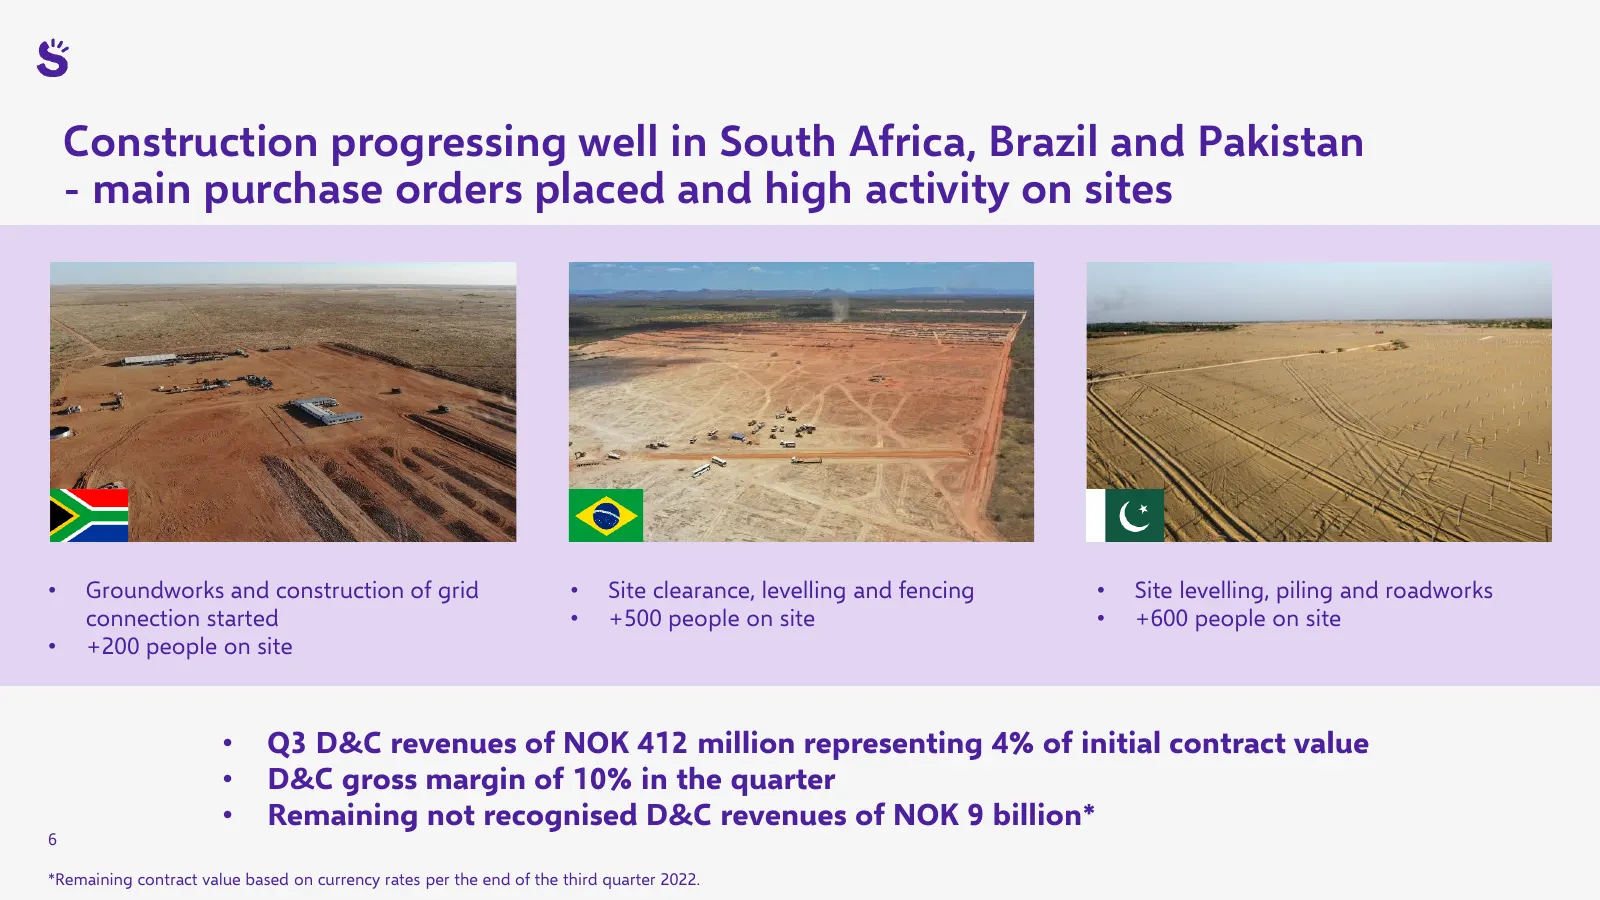
Construction progressing well in South Africa, Brazil and Pakistan - main purchase orders placed and high activity on sites • Groundworks and construction of grid • Site clearance, levelling and fencing • Site levelling, piling and roadworks connection started • +500 people on site • +600 people on
Slide 7: Our strategy: Develop, build, own and operate renewable energy in emerging markets
Our strategy: Develop, build, own and operate renewable energy in emerging markets Grow Advance Optimise Renewables Green Hydrogen Portfolio 7
Slide 8: We target to invest NOK 10 billion and double Power Production EBITDA
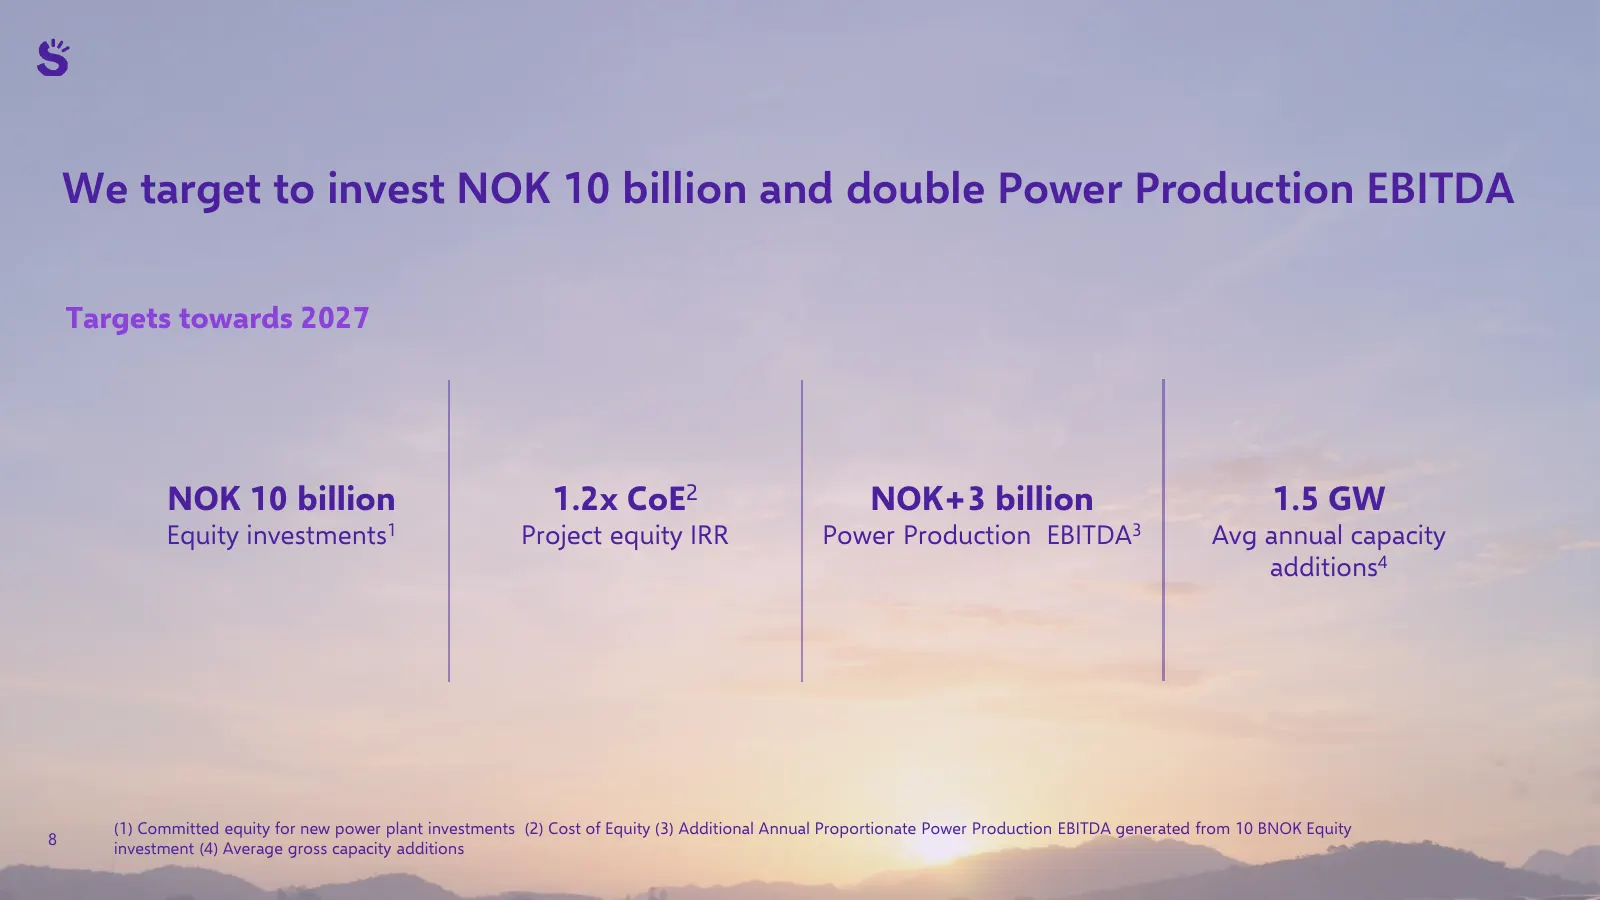
We target to invest NOK 10 billion and double Power Production EBITDA Targets towards 2027 NOK 10 billion 1.2x CoE2 NOK+3 billion 1.5 GW Equity investments1 Project equity IRR Power Production EBITDA3 Avg annual capacity additions4 (1) Committed equity for new power plant investments (2) Cost of Equ
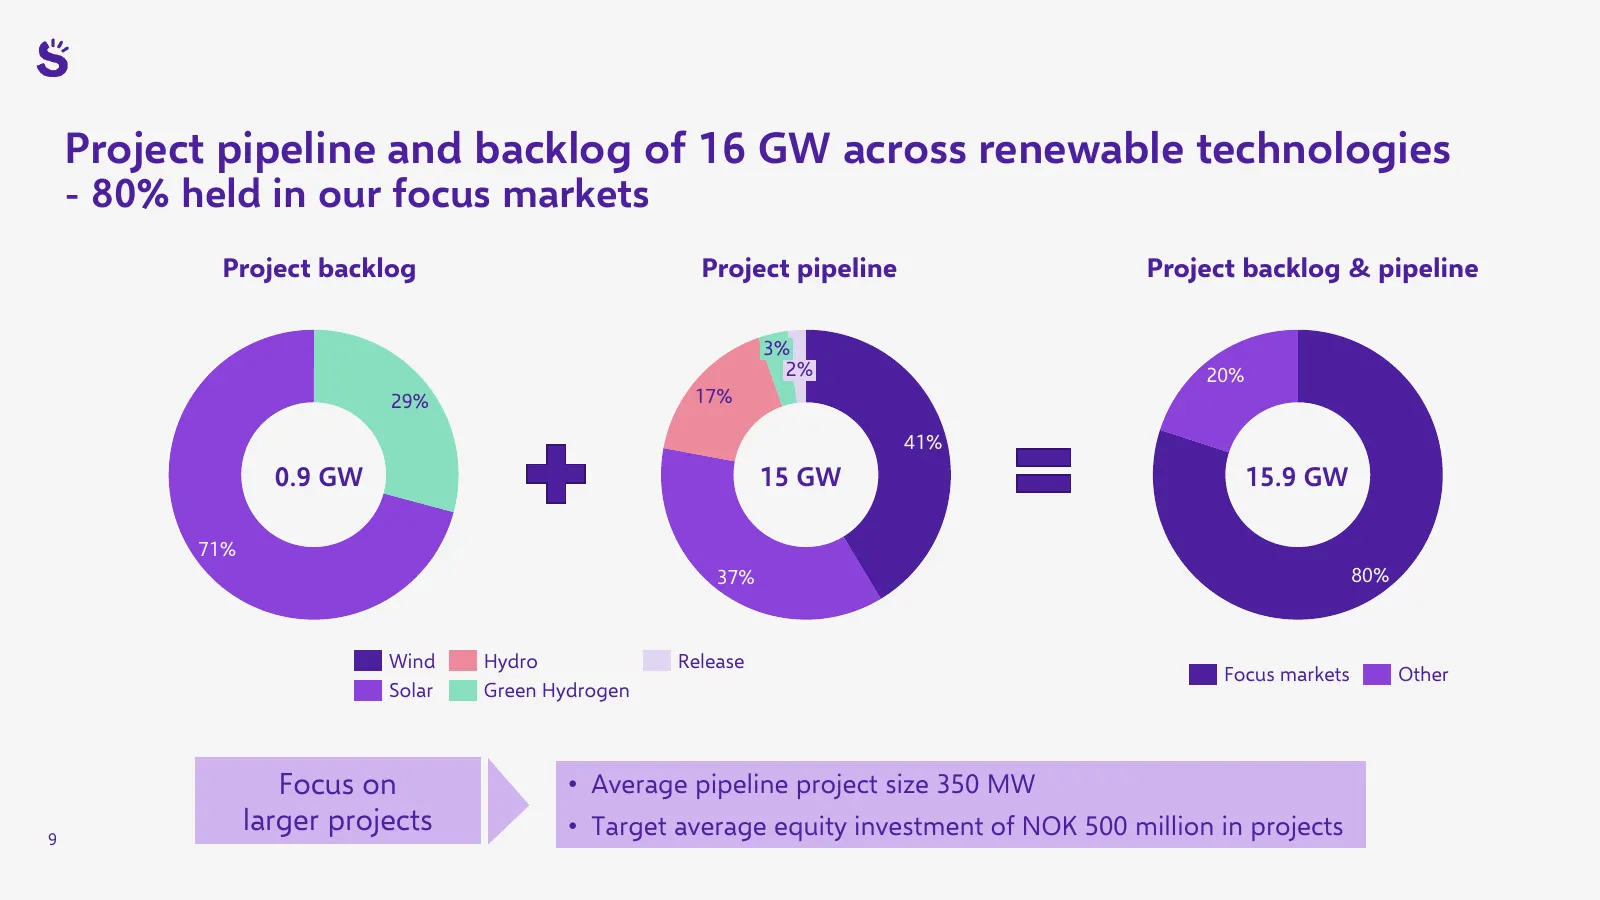
Slide 9: Project pipeline and backlog of 16 GW across renewable technologies
Project pipeline and backlog of 16 GW across renewable technologies - 80% held in our focus markets Project backlog Project pipeline Project backlog & pipeline 3% 2% 20% 29% 17% 41% 0.9 GW 15 GW 15.9 GW 71% 37% 80% Wind Hydro Release Focus markets Other Solar Green Hydrogen Focus on • Average pipeli

Slide 10: Financial review
Financial review Mikkel Tørud, CFO 10
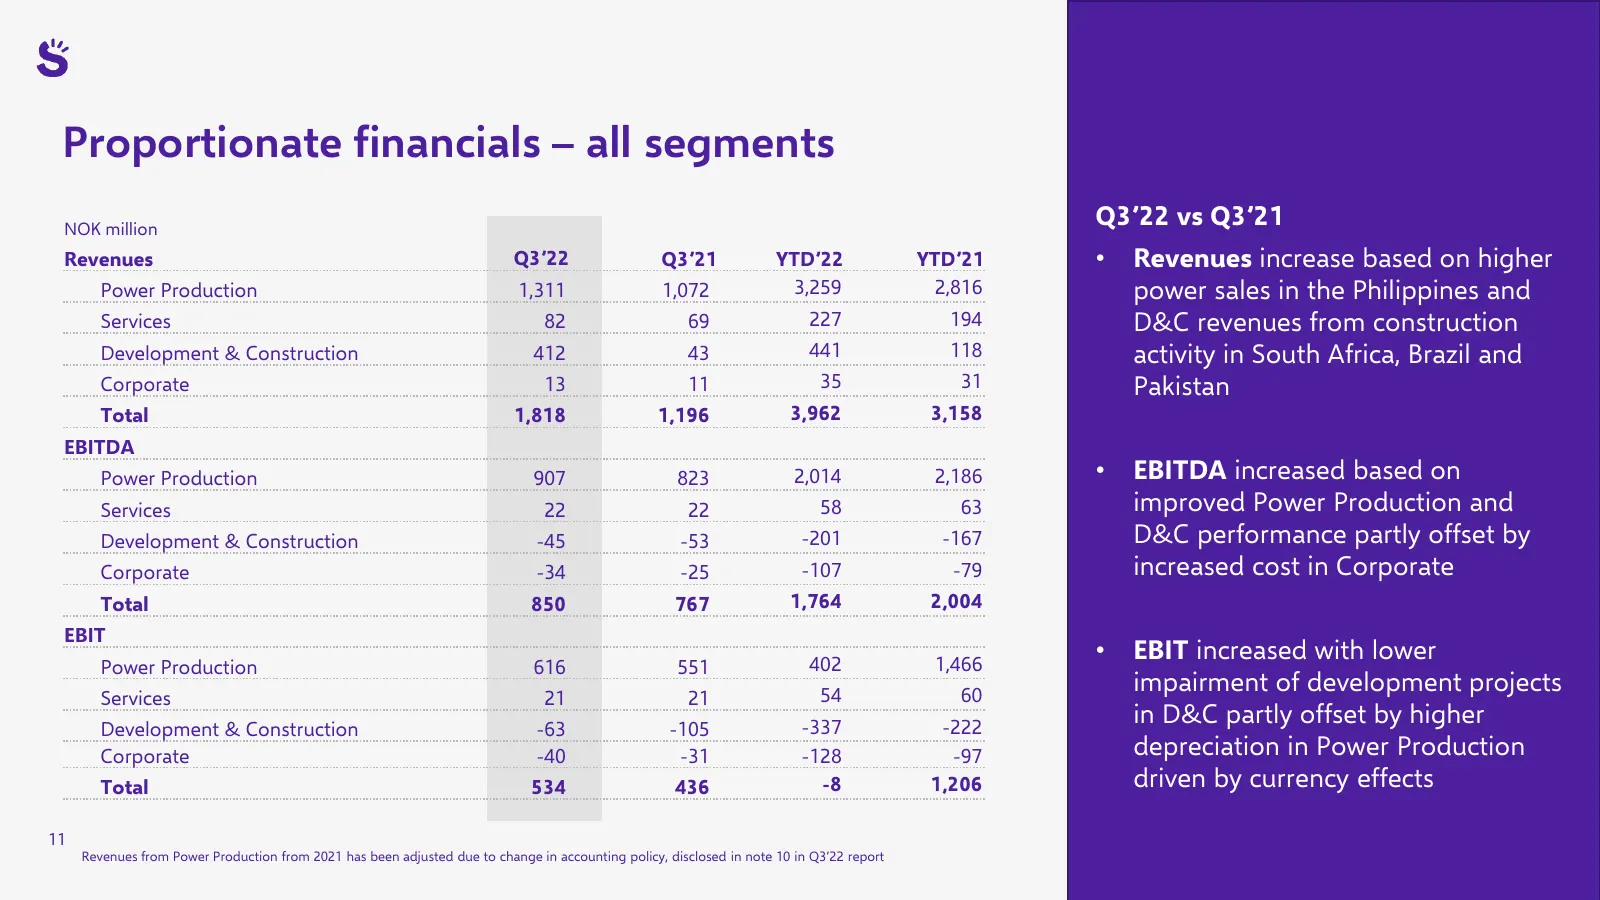
Slide 11: Proportionate financials – all segments
Proportionate financials – all segments NOK million Q3’22 vs Q3’21 Revenues Q3’22 Q3’21 YTD’22 YTD’21 • Revenues increase based on higher Power Production 1,311 1,072 3,259 2,816 power sales in the Philippines and Services 82 69 227 194 D&C revenues from construction Development & Construction 412 4
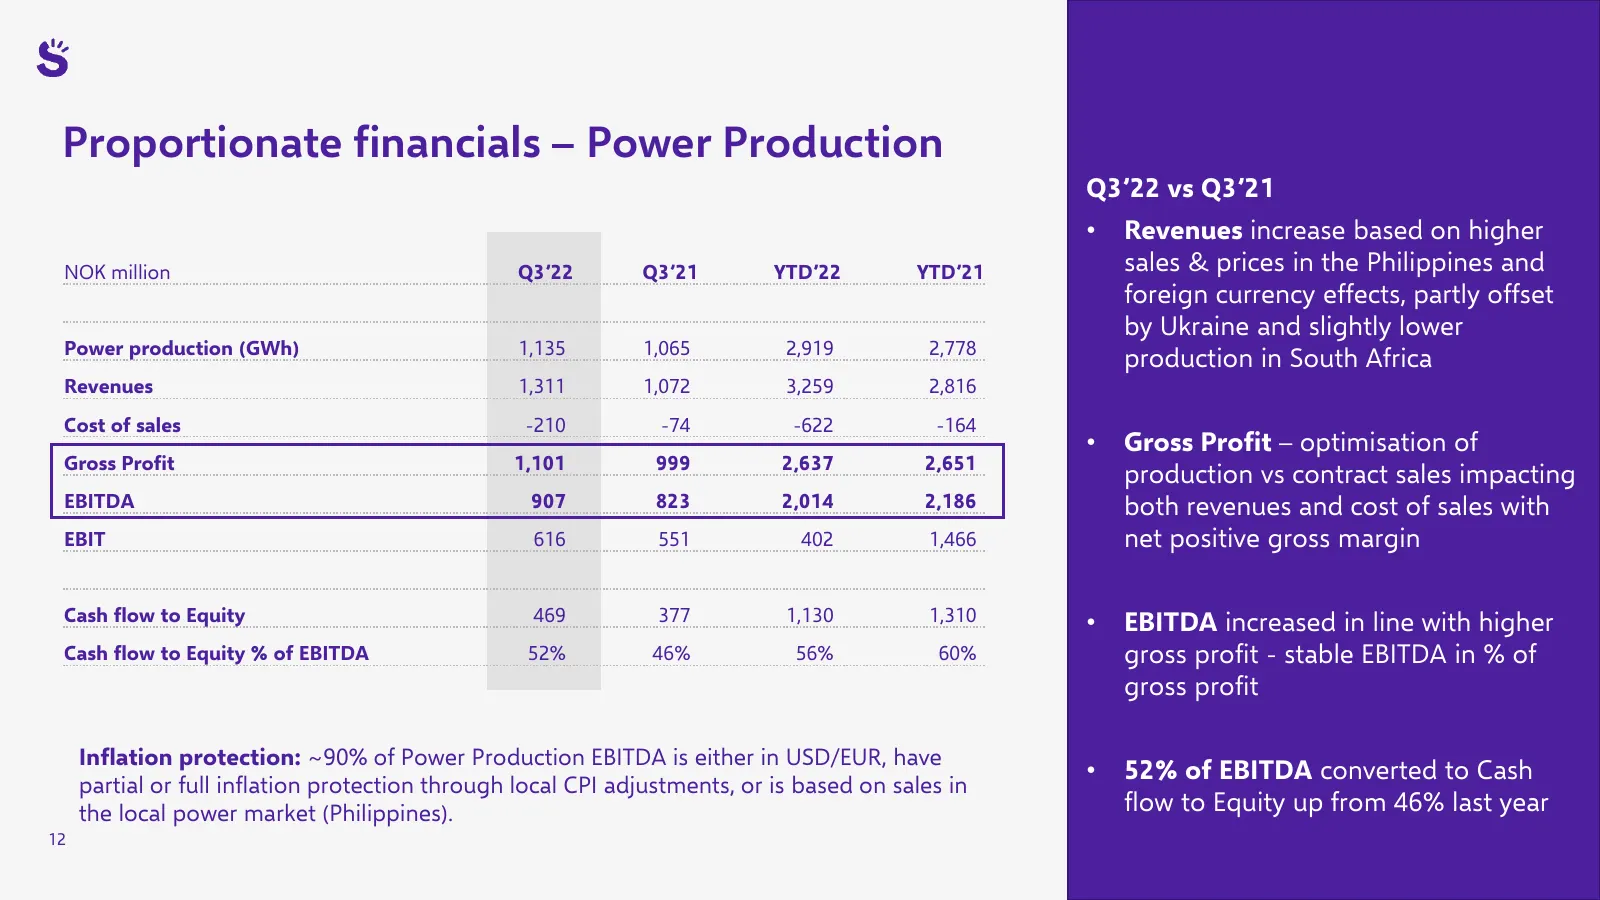
Slide 12: Proportionate financials – Power Production
Proportionate financials – Power Production Q3’22 vs Q3’21 • Revenues increase based on higher NOK million Q3’22 Q3’21 YTD’22 YTD’21 sales & prices in the Philippines and foreign currency effects, partly offset by Ukraine and slightly lower Power production (GWh) 1,135 1,065 2,919 2,778 production i
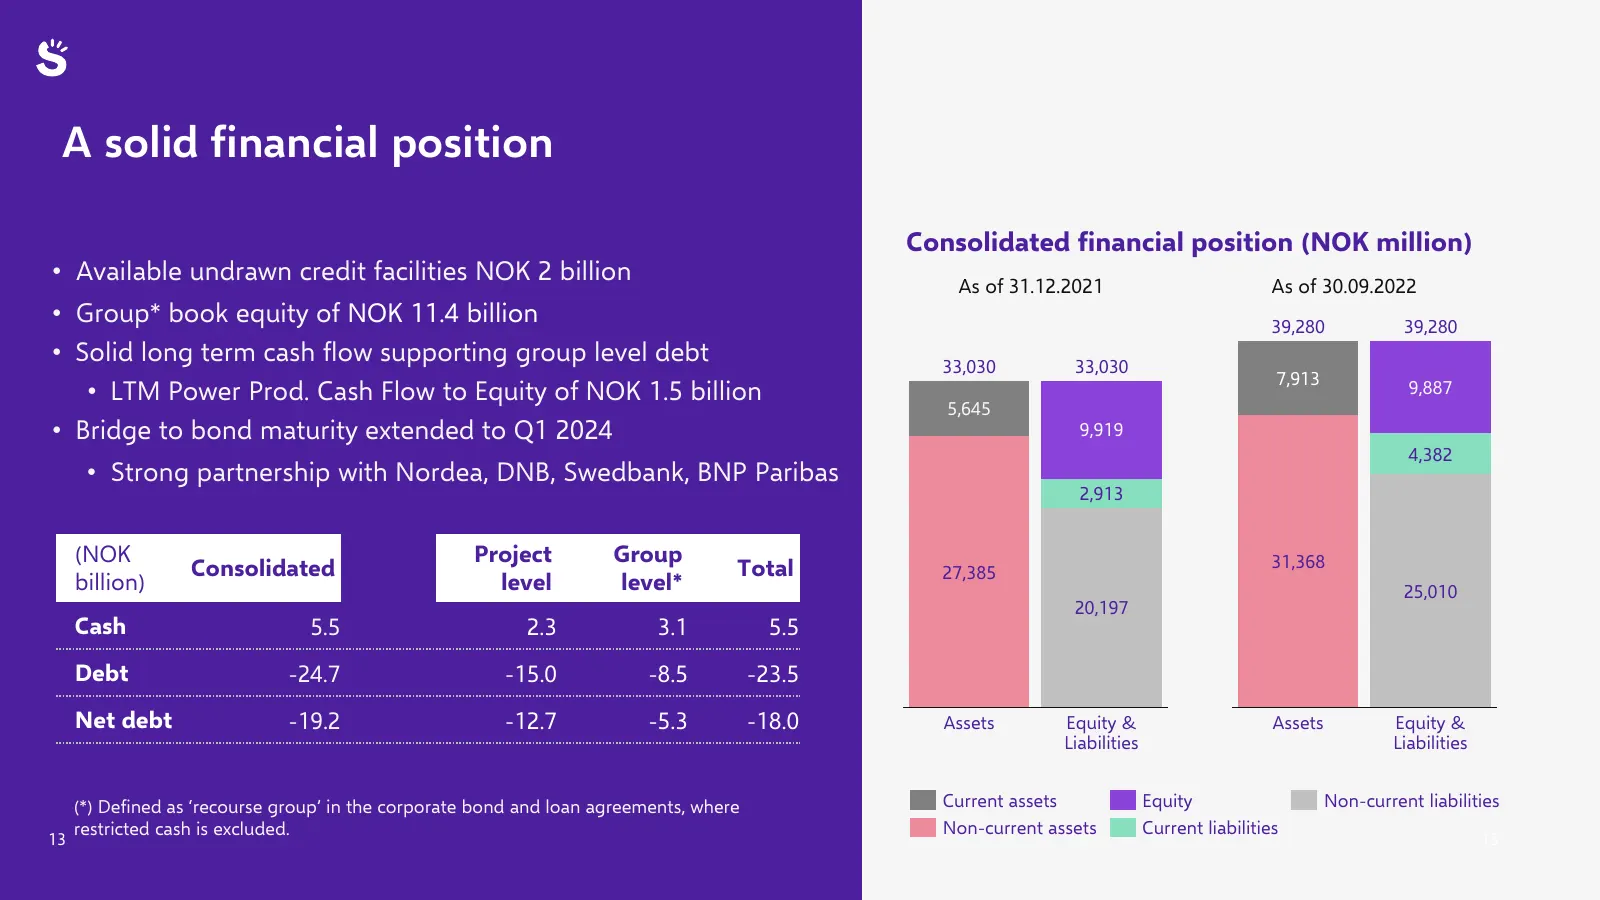
Slide 13: A solid financial position
A solid financial position Consolidated financial position (NOK million) • Available undrawn credit facilities NOK 2 billion As of 31.12.2021 As of 30.09.2022 • Group* book equity of NOK 11.4 billion 39,280 39,280 • Solid long term cash flow supporting group level debt 33,030 33,030 7,913 • LTM Powe
Slide 14: Optimising cash flows during the construction phase
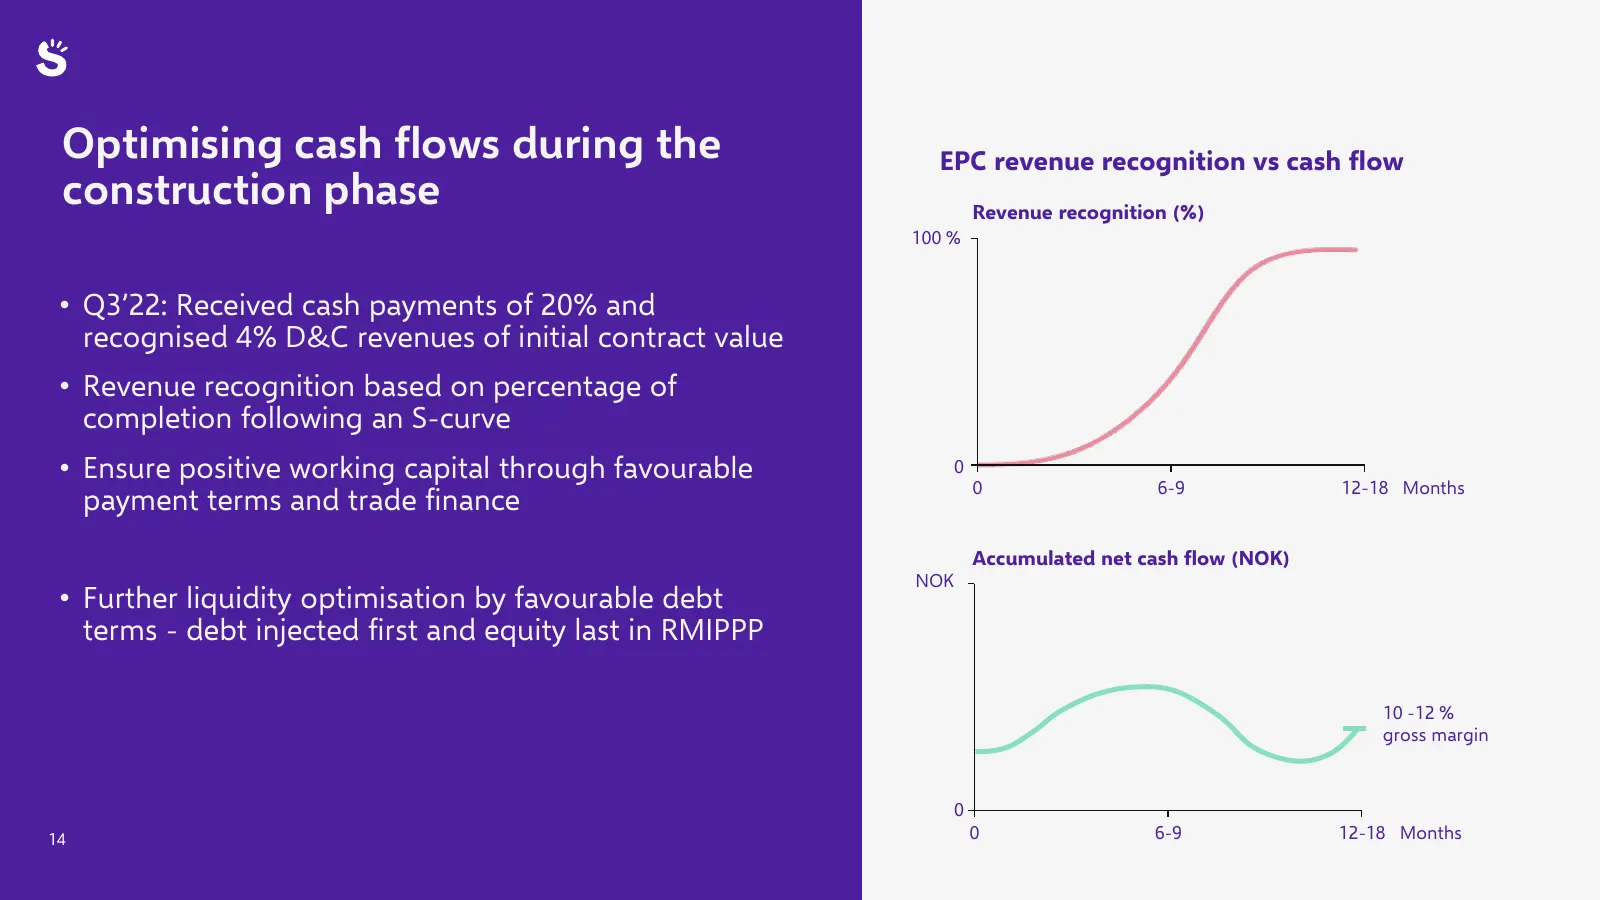
Optimising cash flows during the EPC revenue recognition vs cash flow construction phase Revenue recognition (%) 100 % • Q3’22: Received cash payments of 20% and recognised 4% D&C revenues of initial contract value • Revenue recognition based on percentage of completion following an S-curve • Ensure
Slide 15: Group level free cash up NOK 1.1 billion in Q3
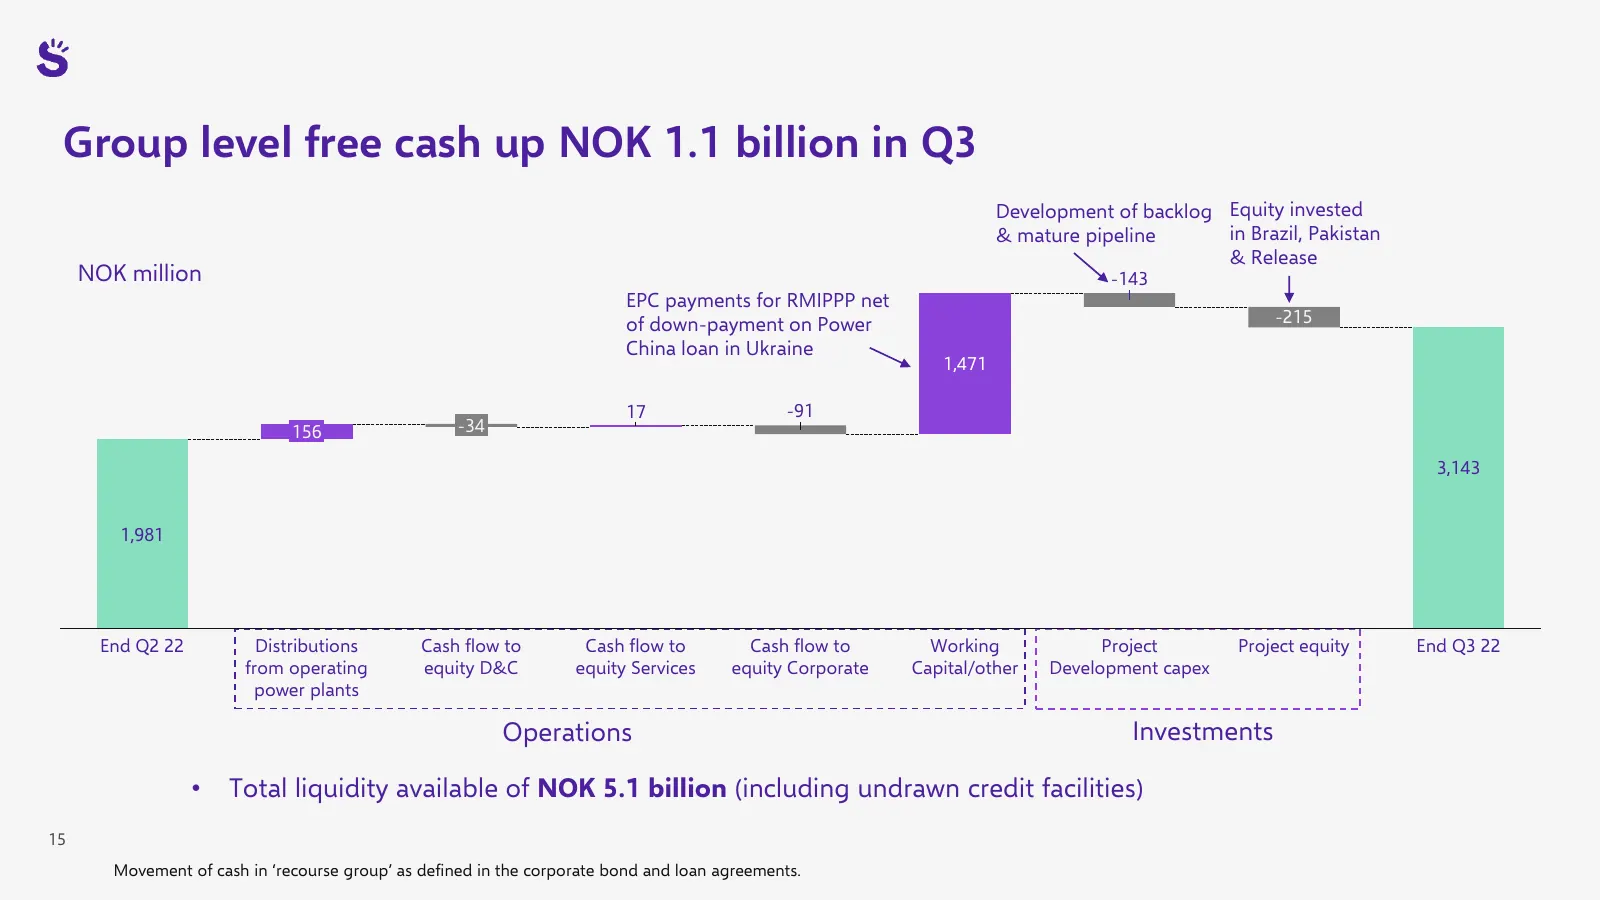
Group level free cash up NOK 1.1 billion in Q3 Development of backlog Equity invested & mature pipeline in Brazil, Pakistan & Release NOK million -143 EPC payments for RMIPPP net of down-payment on Power -215 China loan in Ukraine 1,471 17 -91 156 -34 3,143 1,981 End Q2 22 Distributions Cash flow to
Slide 16: Short term guidance
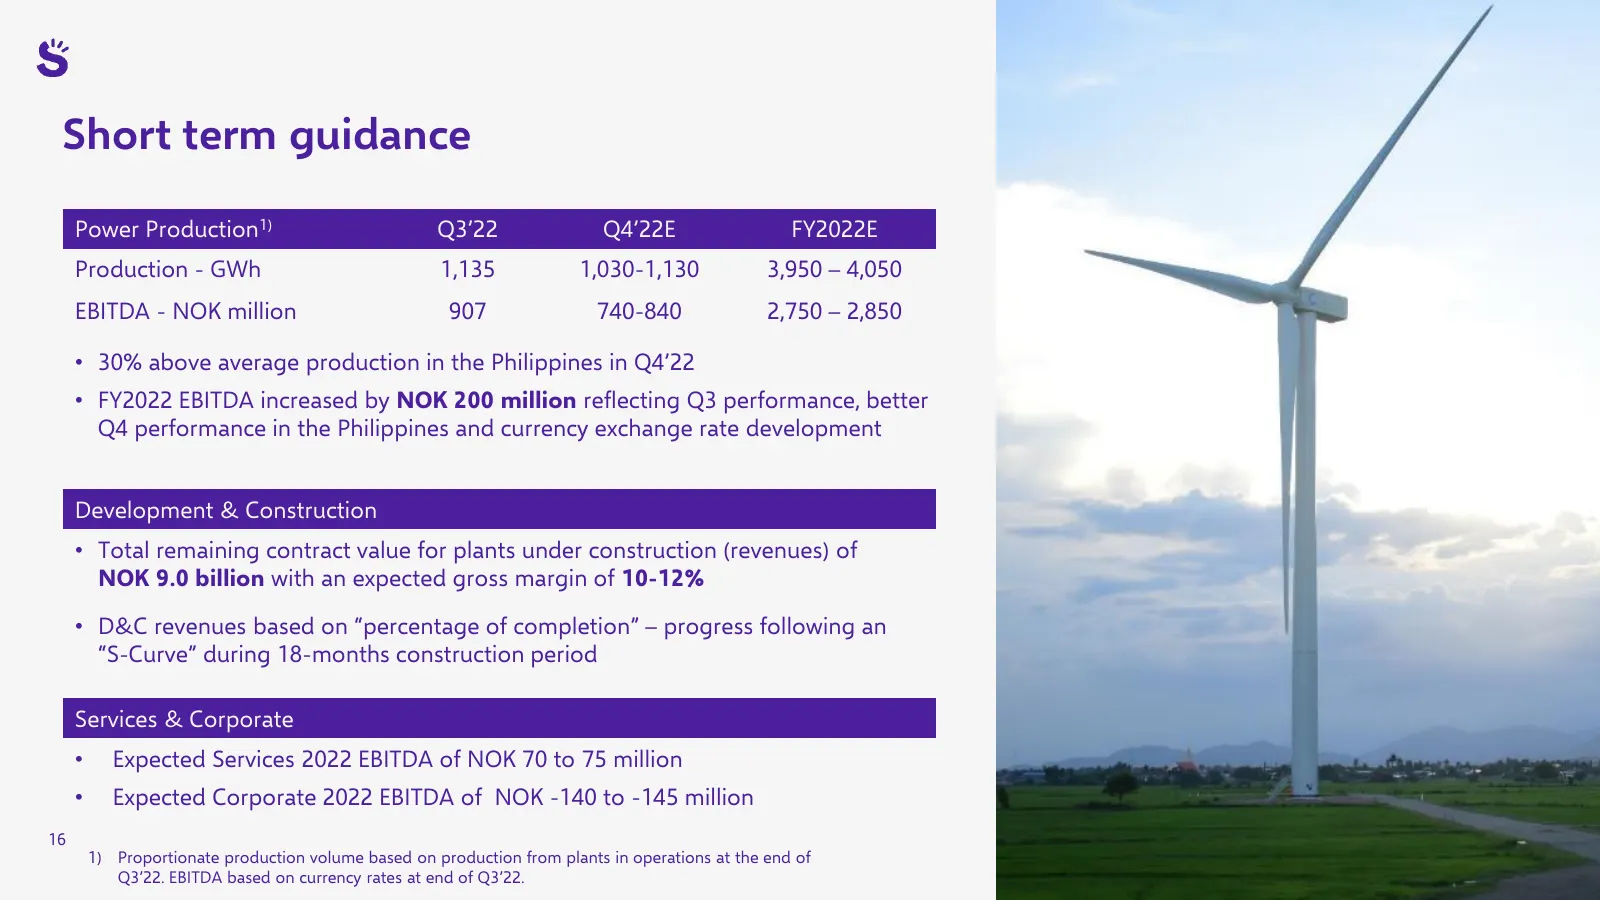
Short term guidance Power Production1) Q3’22 Q4’22E FY2022E Production - GWh 1,135 1,030-1,130 3,950 – 4,050 EBITDA - NOK million 907 740-840 2,750 – 2,850 • 30% above average production in the Philippines in Q4’22 • FY2022 EBITDA increased by NOK 200 million reflecting Q3 performance, better Q4 per
Slide 17: Scatec improving our future
Scate improving our future
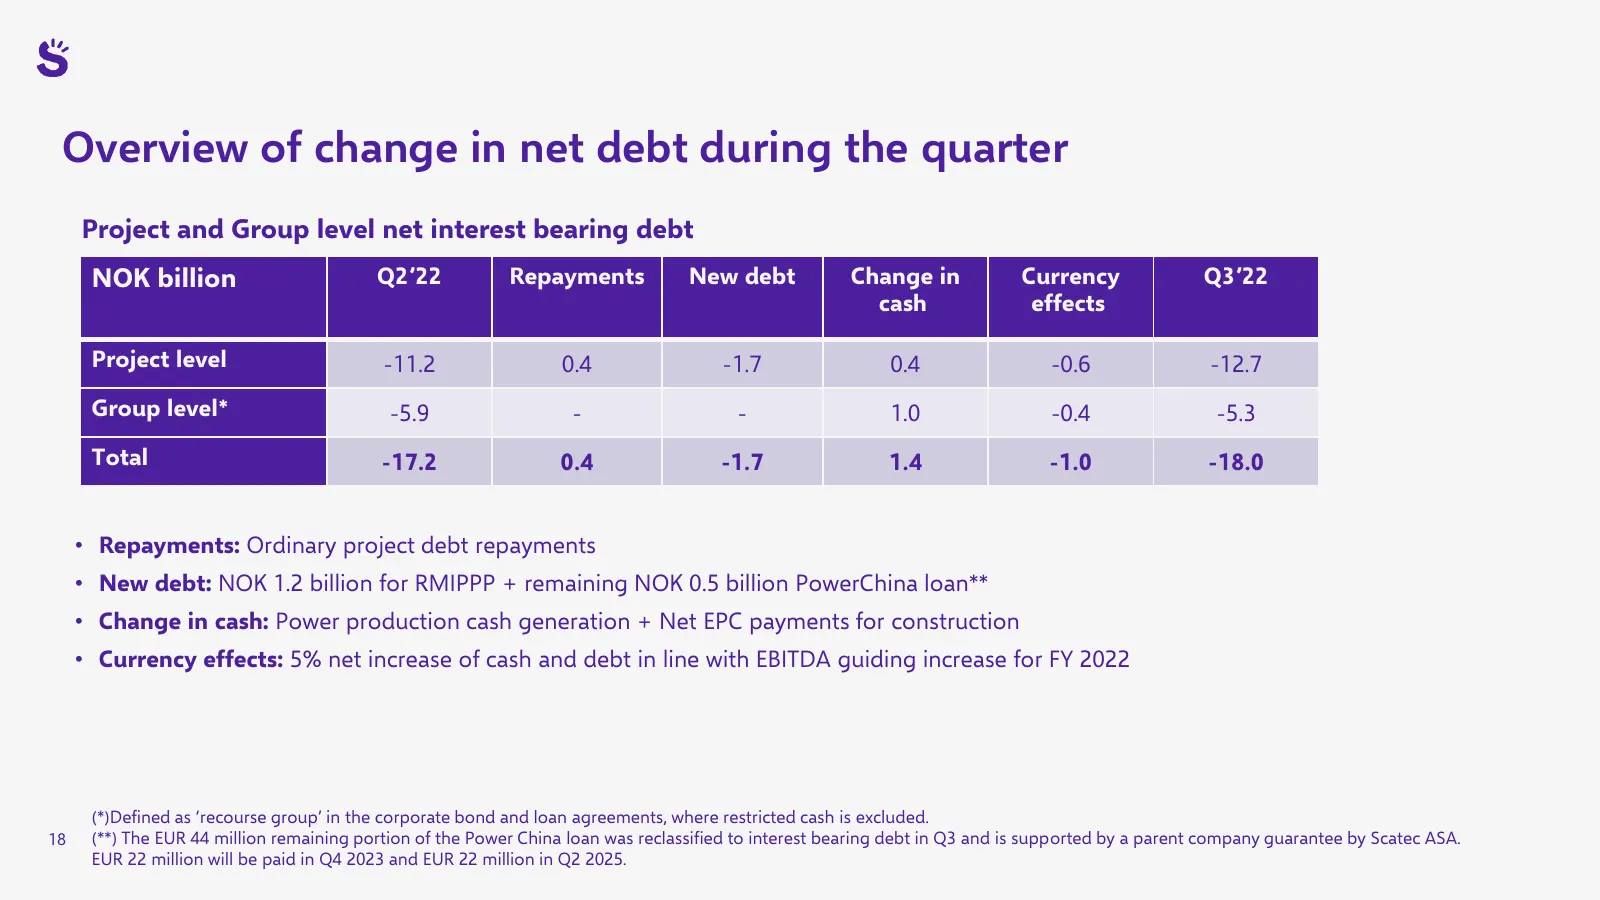
Slide 18: Overview of change in net debt during the quarter
Overview of change in net debt during the quarter Project and Group level net interest bearing debt NOK billion Q2’22 Repayments New debt Change in Currency Q3’22 cash effects Project level -11.2 0.4 -1.7 0.4 -0.6 -12.7 Group level* -5.9 - - 1.0 -0.4 -5.3 Total -17.2 0.4 -1.7 1.4 -1.0 -18.0 • Repaym
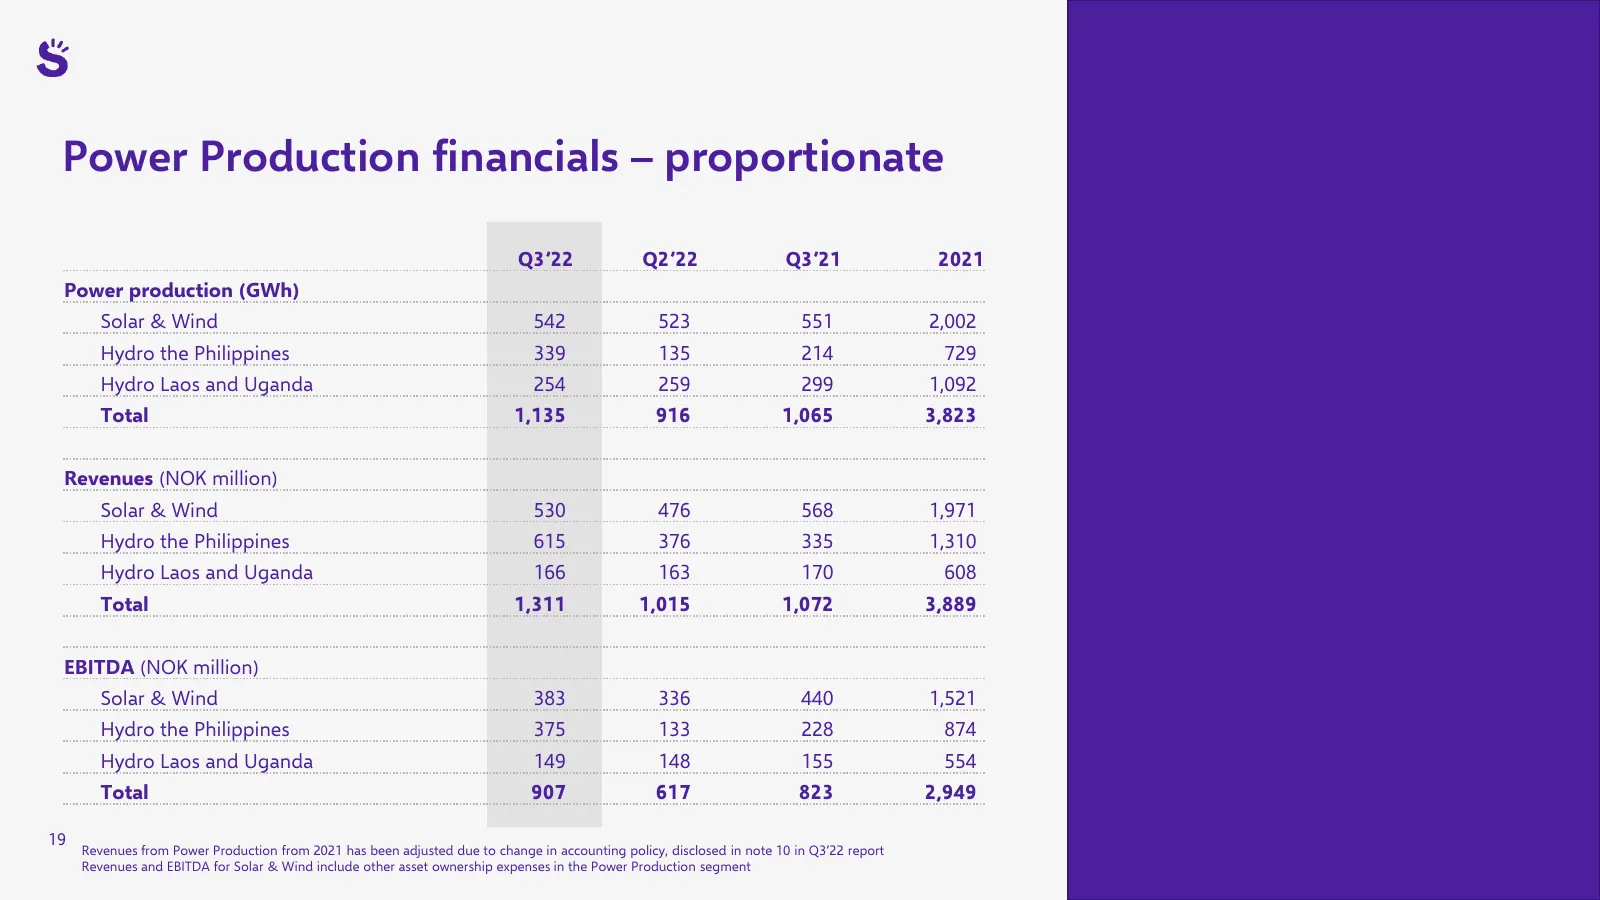
Slide 19: Power Production financials – proportionate
Power Production financials – proportionate Q3’22 Q2’22 Q3’21 2021 Power production (GWh) Solar & Wind 542 523 551 2,002 Hydro the Philippines 339 135 214 729 Hydro Laos and Uganda 254 259 299 1,092 Total 1,135 916 1,065 3,823 Revenues (NOK million) Solar & Wind 530 476 568 1,971 Hydro the Philippin
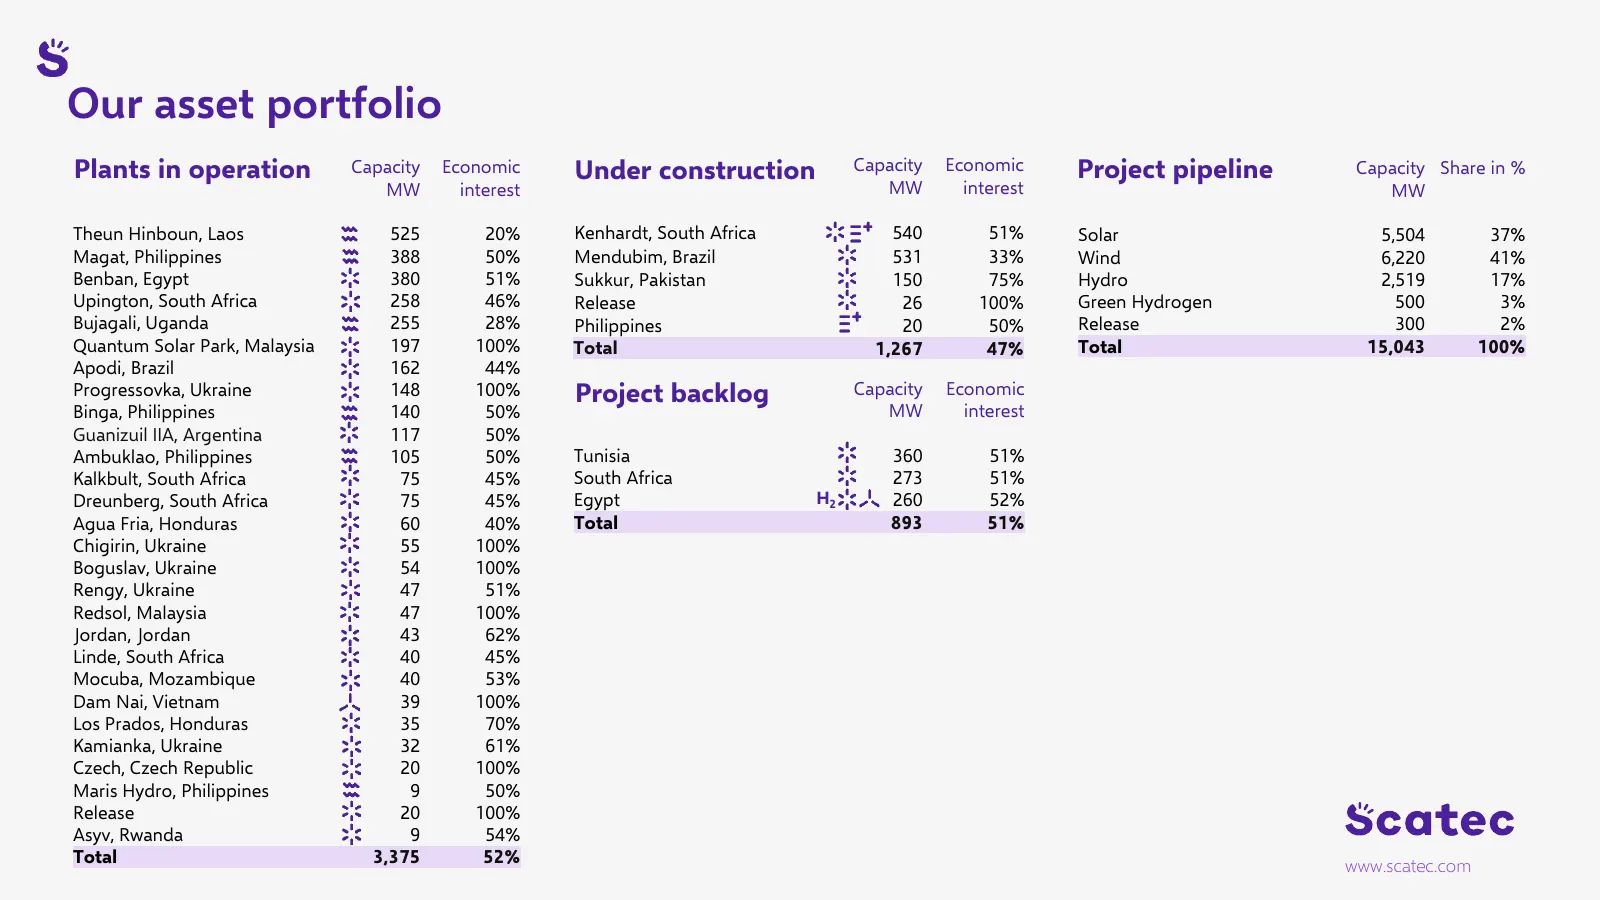
Slide 20: Our asset portfolio
Our asset portfolio Plants in operation Capacity Economic Under construction Capacity Economic Project pipeline Capacity Share in % MW interest MW interest MW Theun Hinboun, Laos 525 20% Kenhardt, South Africa 540 51% Solar 5,504 37% Magat, Philippines 388 50% Mendubim, Brazil 531 33% Wind 6,220 41%
Source: Internet Archive copy of scatec.com
More decks from Scatec ASA
 Q3 2026 Earnings Presentation32 slides · Oct 30, 2026
 Q2 2026 Earnings Presentation23 slides · Aug 21, 2026
 Investor Presentation (August 2026)22 slides · August 2026
 Q1 2026 Earnings Presentation23 slides · May 6, 2026
 Investor Presentation (March 2026)22 slides · March 2026
 Q4 2025 Earnings Presentation24 slides · Jan 30, 2026