Max Financial Services Limited · NSE:MFSL
Max Financial Services — Investor Presentation (February 2020)
64 slides from Max Financial Services's investor presentation, February 2020

Slide 1: Max Financial Services Limited Investor Presentation
Max Financial Services Limited Investor Presentation February 2020

Slide 2: Section I: Max Financial Services
SECTION I Max Financial Services
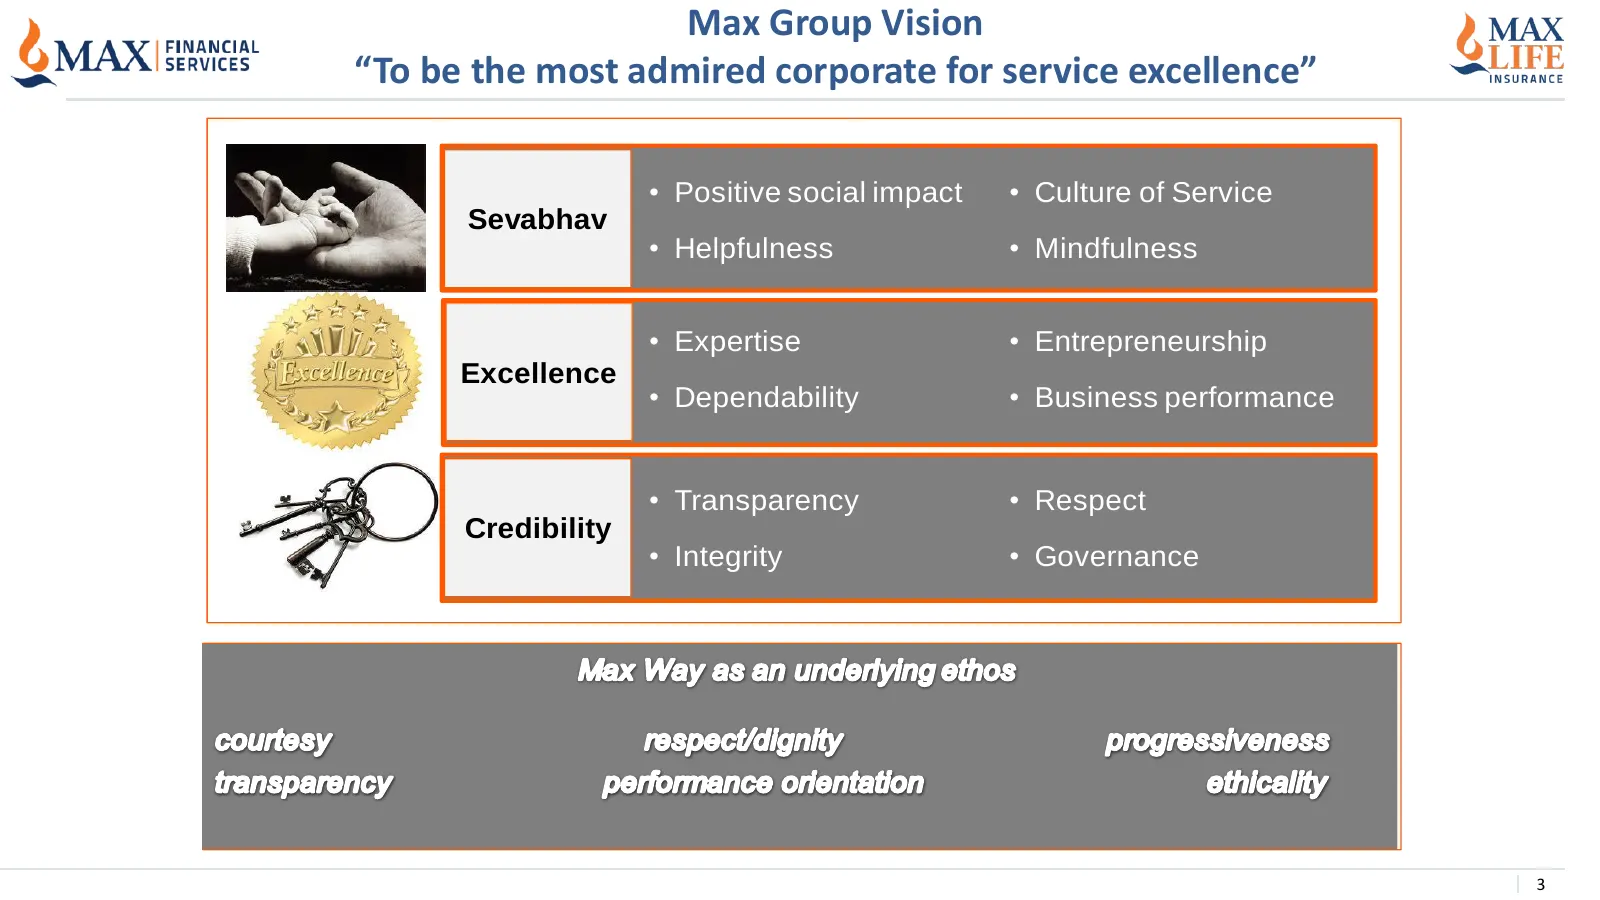
Slide 3: Max Group Vision
Max Group Vision “To be the most admired corporate for service excellence” • Positive social impact • Culture of Service Sevabhav • Helpfulness • Mindfulness • Expertise • Entrepreneurship Excellence • Dependability • Business performance • Transparency • Respect Credibility • Integrity • Governance
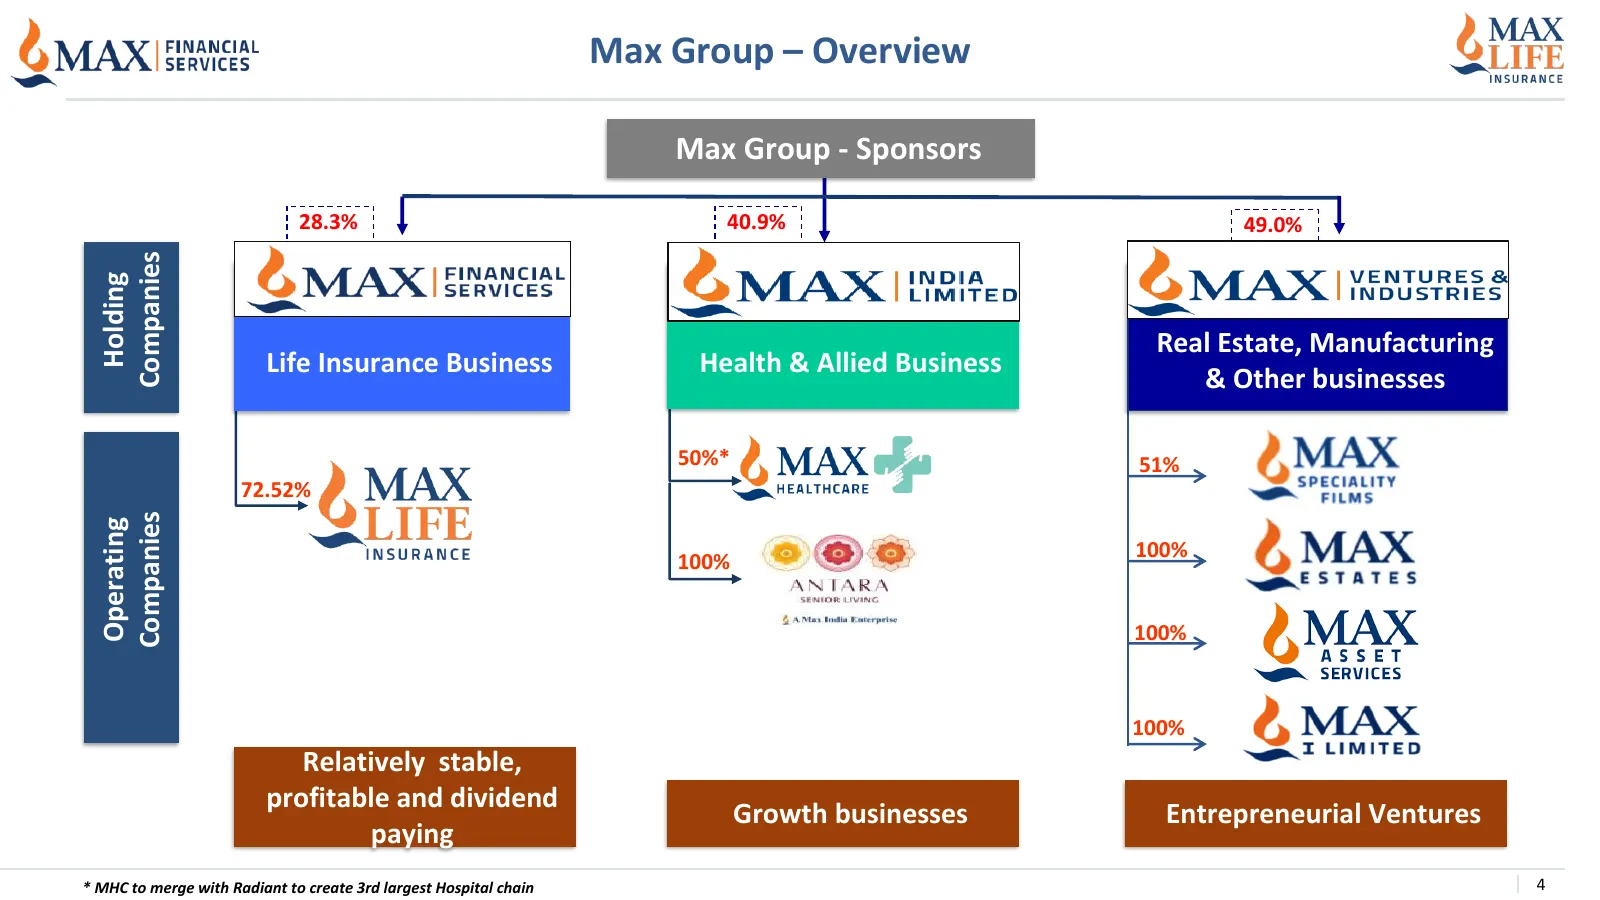
Slide 4: Max Group – Overview
Max Group – Overview Max Group - Sponsors 28.3% 40.9% 49.0% Companies Holding Real Estate, Manufacturing Life Insurance Business Health & Allied Business & Other businesses 50%* 51% 72.52% Companies Operating 100% 100% 100% 100% Relatively stable, profitable and dividend Growth businesses Entreprene
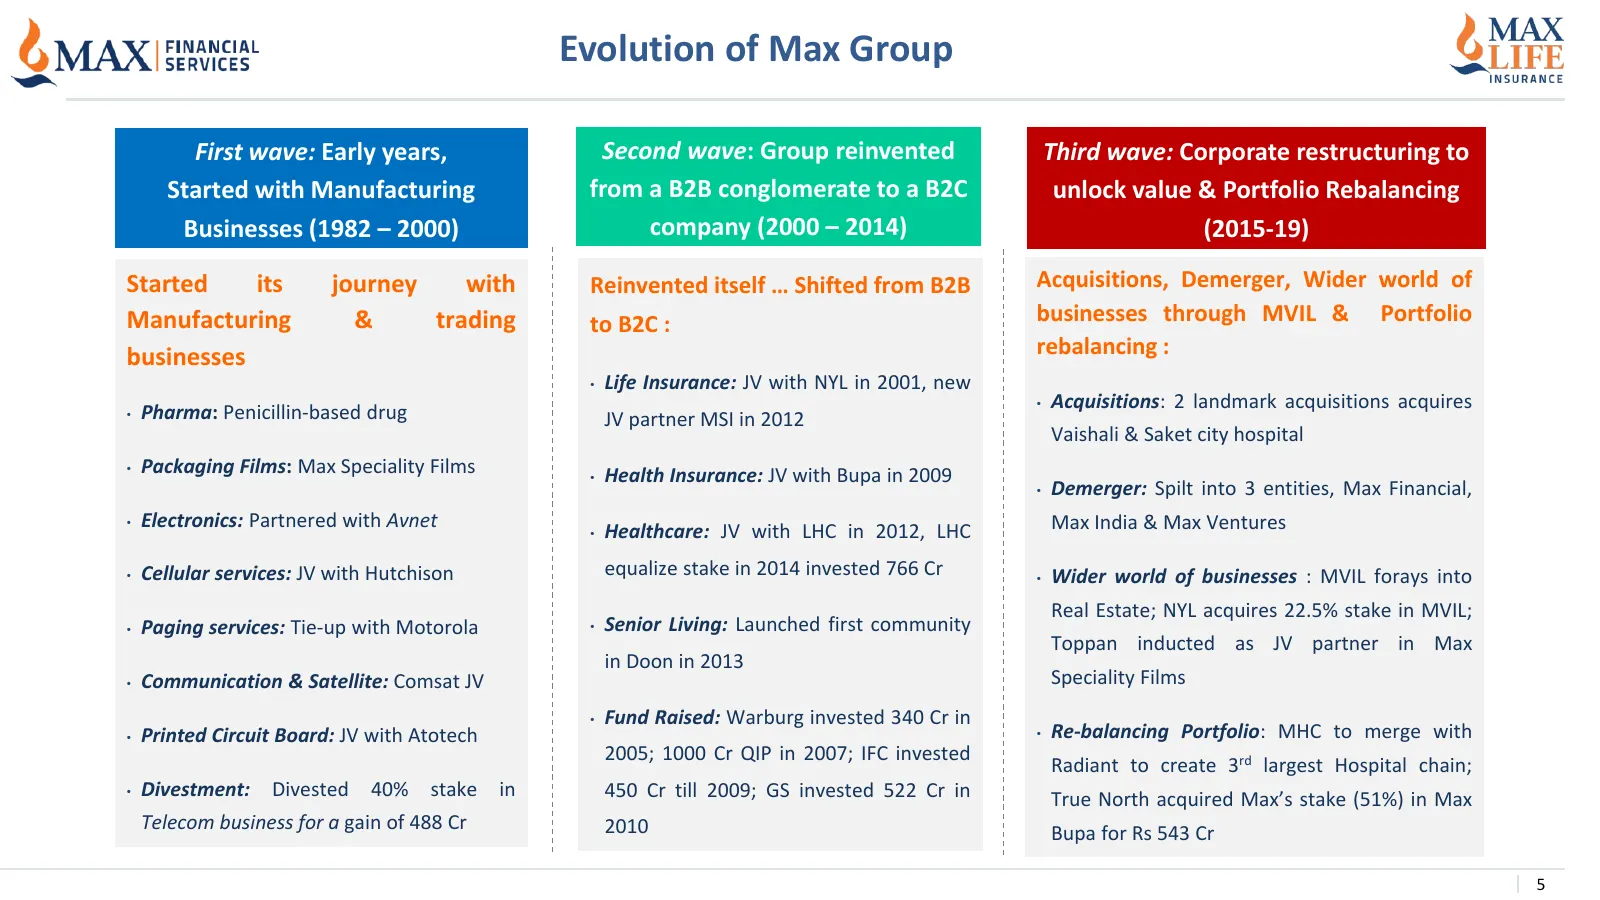
Slide 5: Evolution of Max Group
Evolution of Max Group First wave: Early years, Second wave: Group reinvented Third wave: Corporate restructuring to Started with Manufacturing from a B2B conglomerate to a B2C unlock value & Portfolio Rebalancing Businesses (1982 – 2000) company (2000 – 2014) (2015-19) Started its journey with Rein
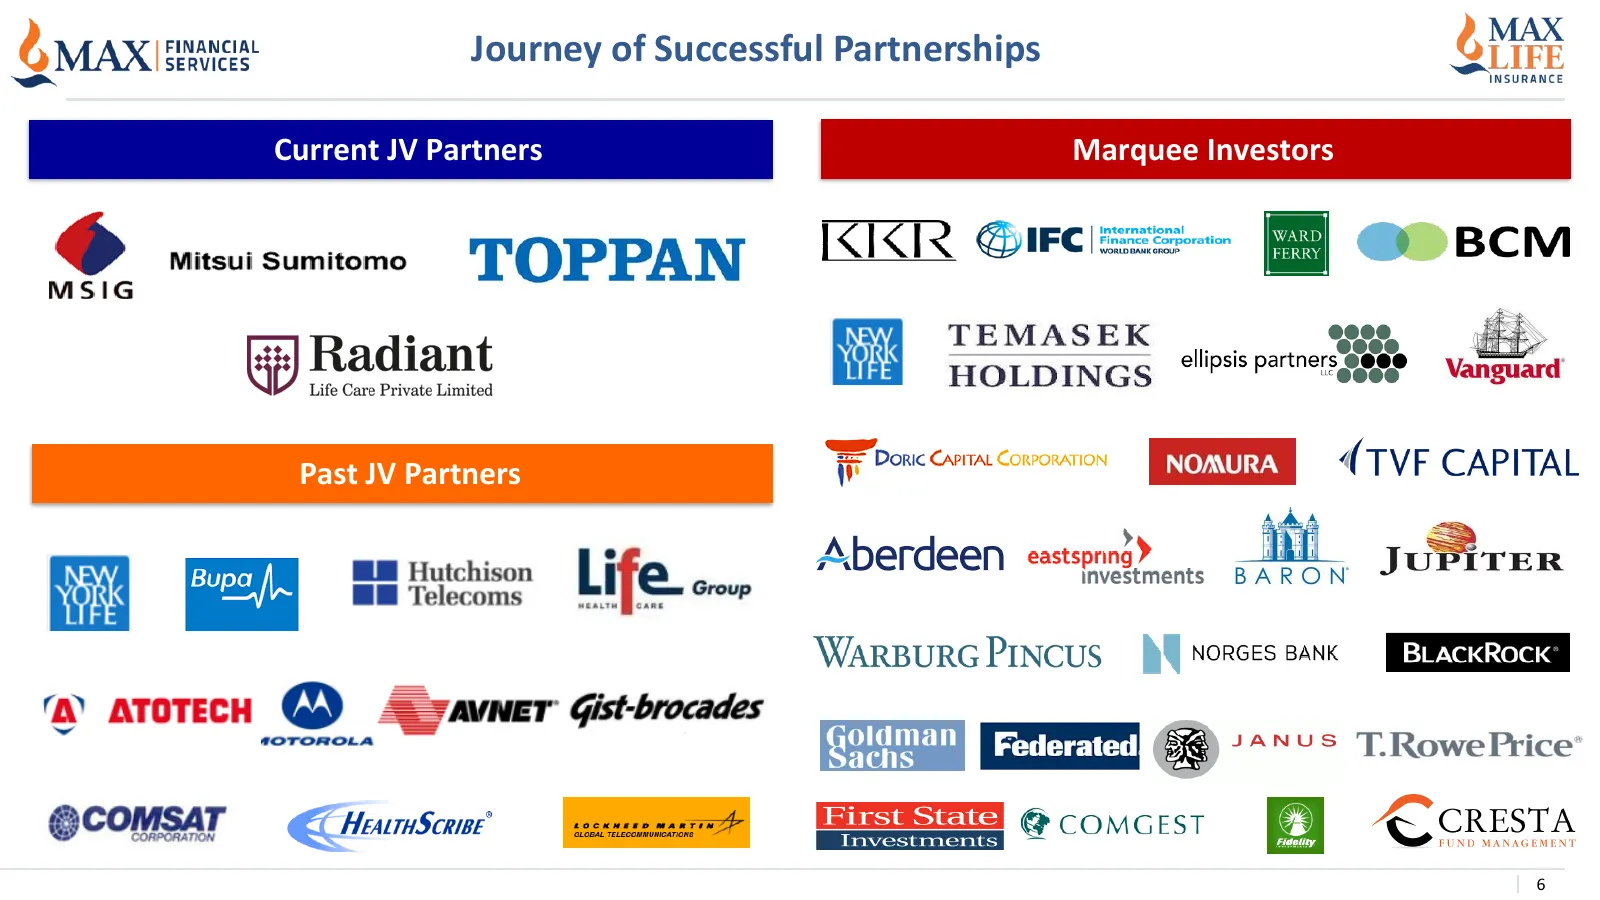
Slide 6: Journey of Successful Partnerships
Journey of Successful Partnerships Current JV Partners Marquee Investors Past JV Partners 6
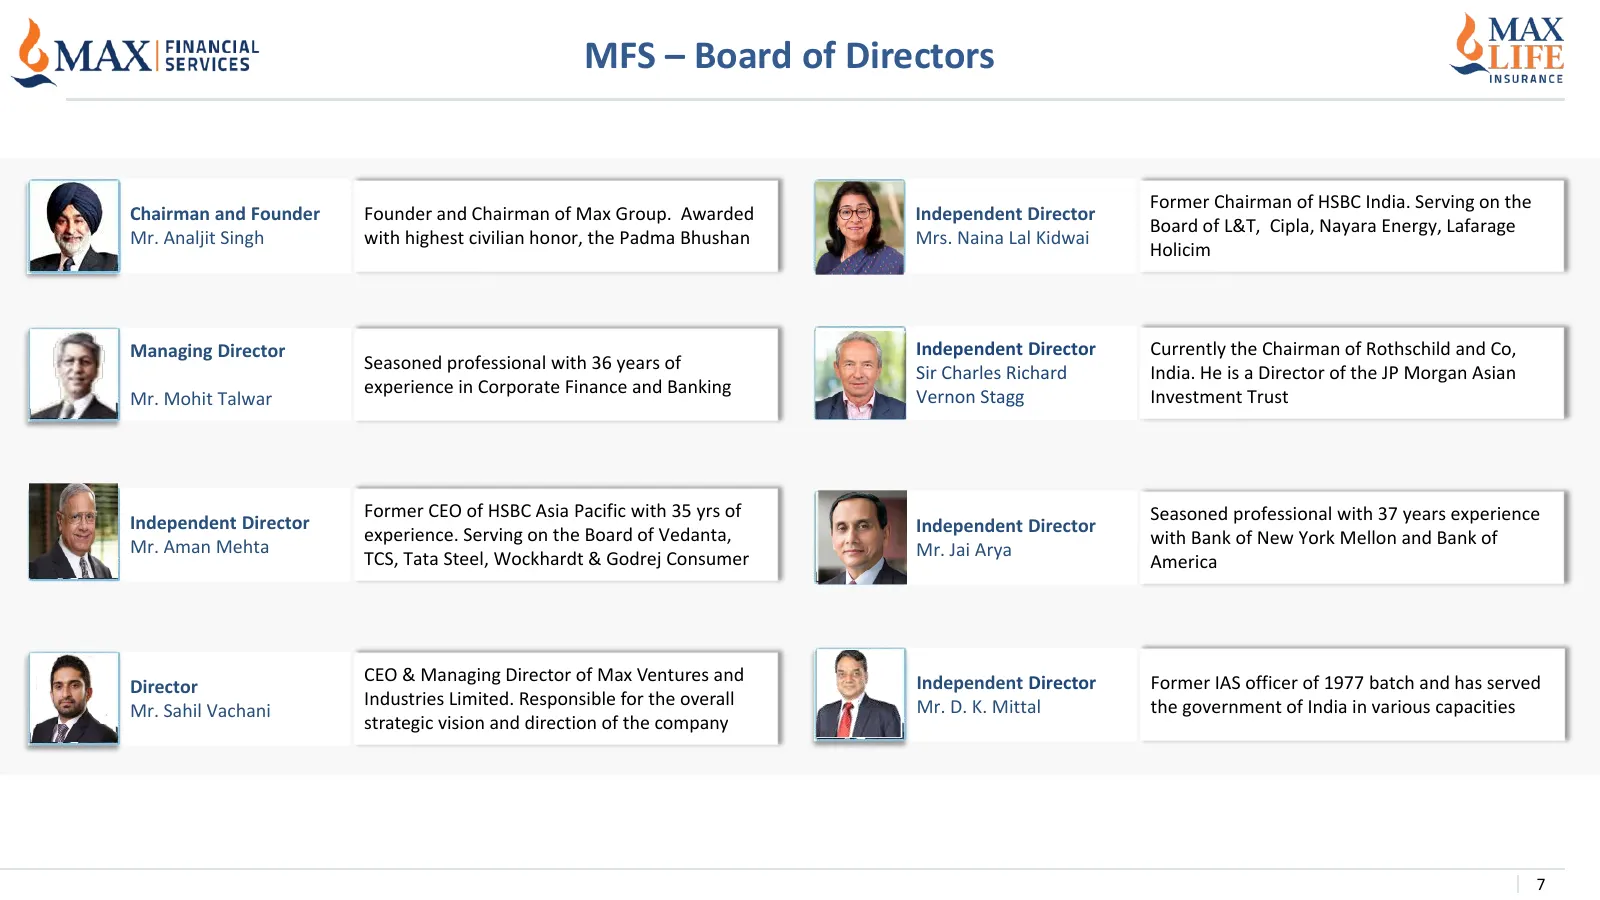
Slide 7: MFS – Board of Directors
MFS – Board of Directors Former Chairman of HSBC India. Serving on the Chairman and Founder Founder and Chairman of Max Group. Awarded Independent Director Board of L&T, Cipla, Nayara Energy, Lafarage Mr. Analjit Singh with highest civilian honor, the Padma Bhushan Mrs. Naina Lal Kidwai Holicim Mana
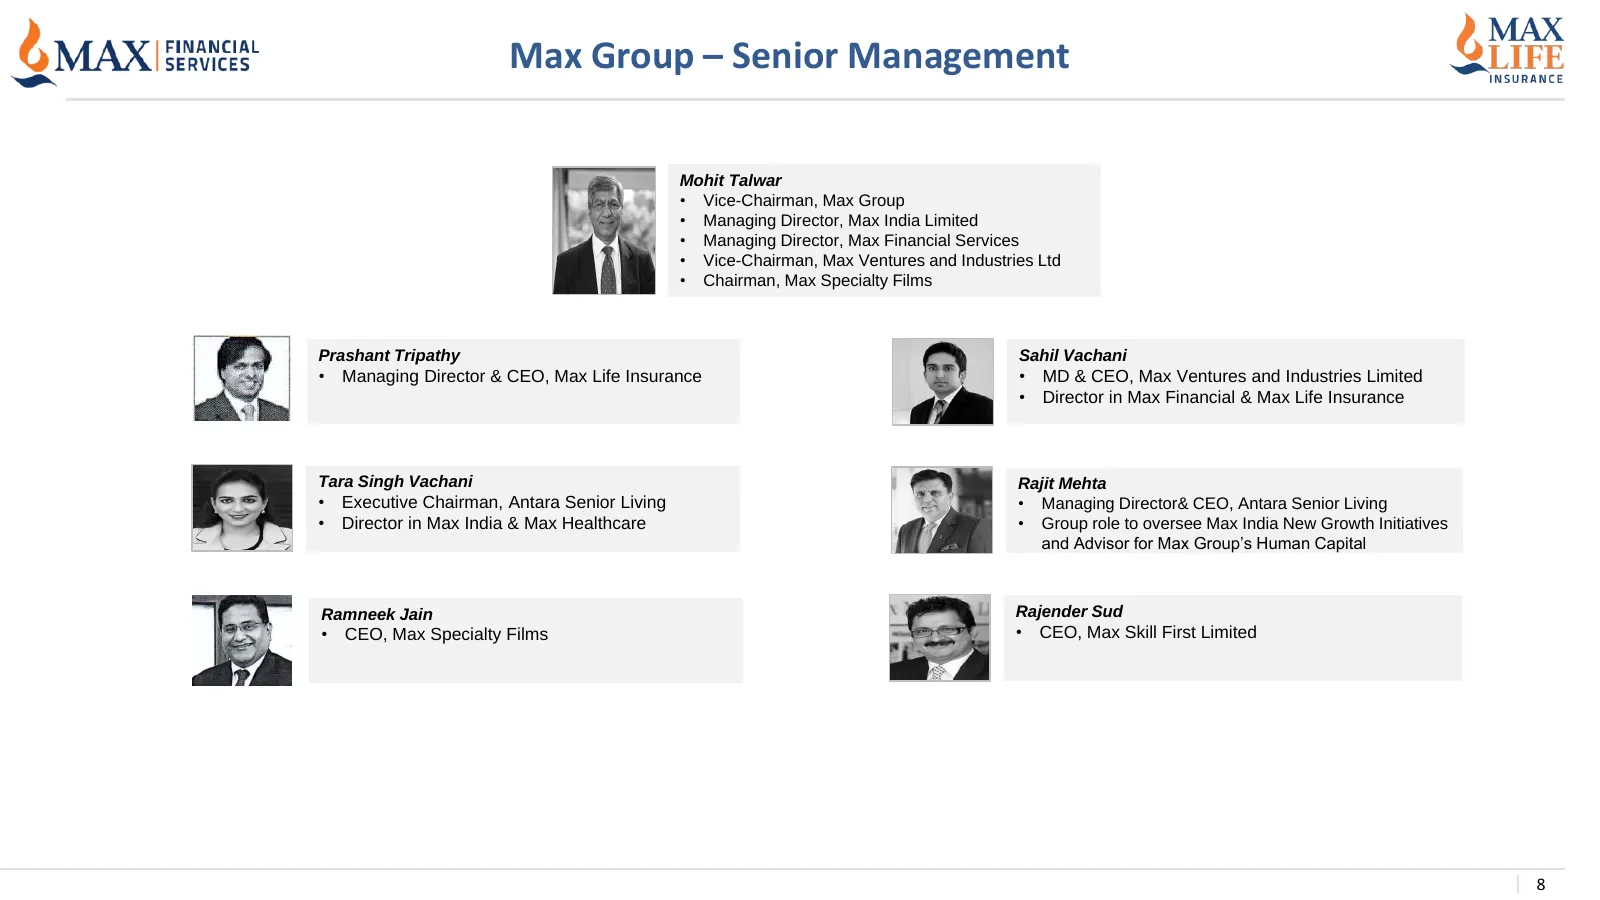
Slide 8: Max Group – Senior Management
Max Group – Senior Management Mohit Talwar • Vice-Chairman, Max Group • Managing Director, Max India Limited • Managing Director, Max Financial Services • Vice-Chairman, Max Ventures and Industries Ltd • Chairman, Max Specialty Films Prashant Tripathy Sahil Vachani • Managing Director & CEO, Max Lif
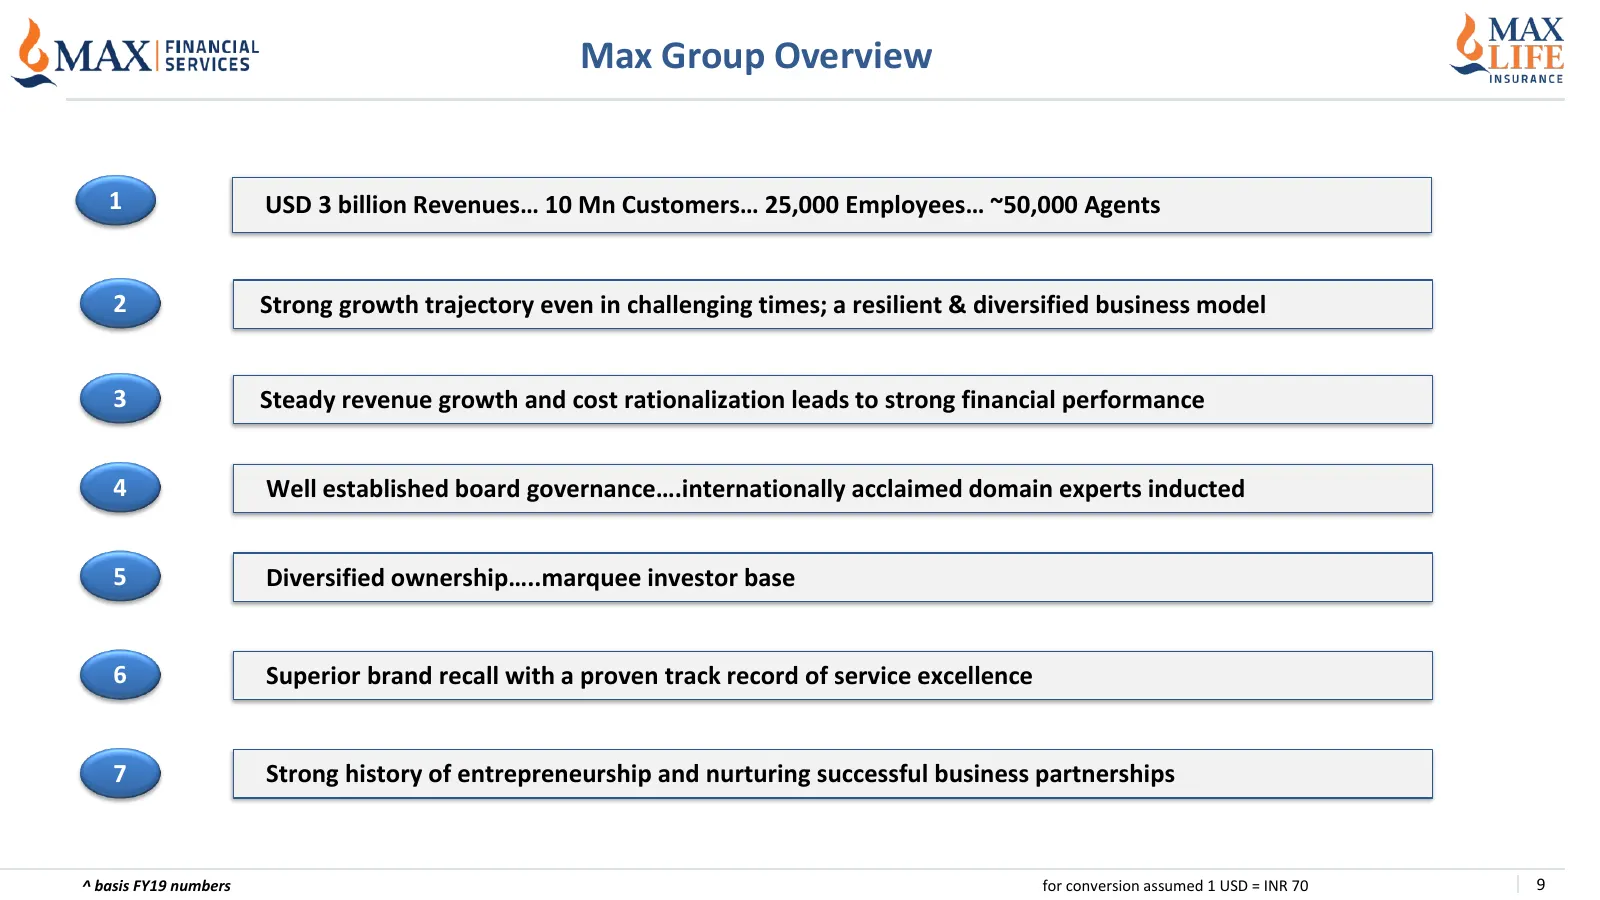
Slide 9: Max Group Overview
Max Group Overview 1 USD 3 billion Revenues… 10 Mn Customers… 25,000 Employees… ~50,000 Agents 2 Strong growth trajectory even in challenging times; a resilient & diversified business model 3 Steady revenue growth and cost rationalization leads to strong financial performance 4 Well established boar
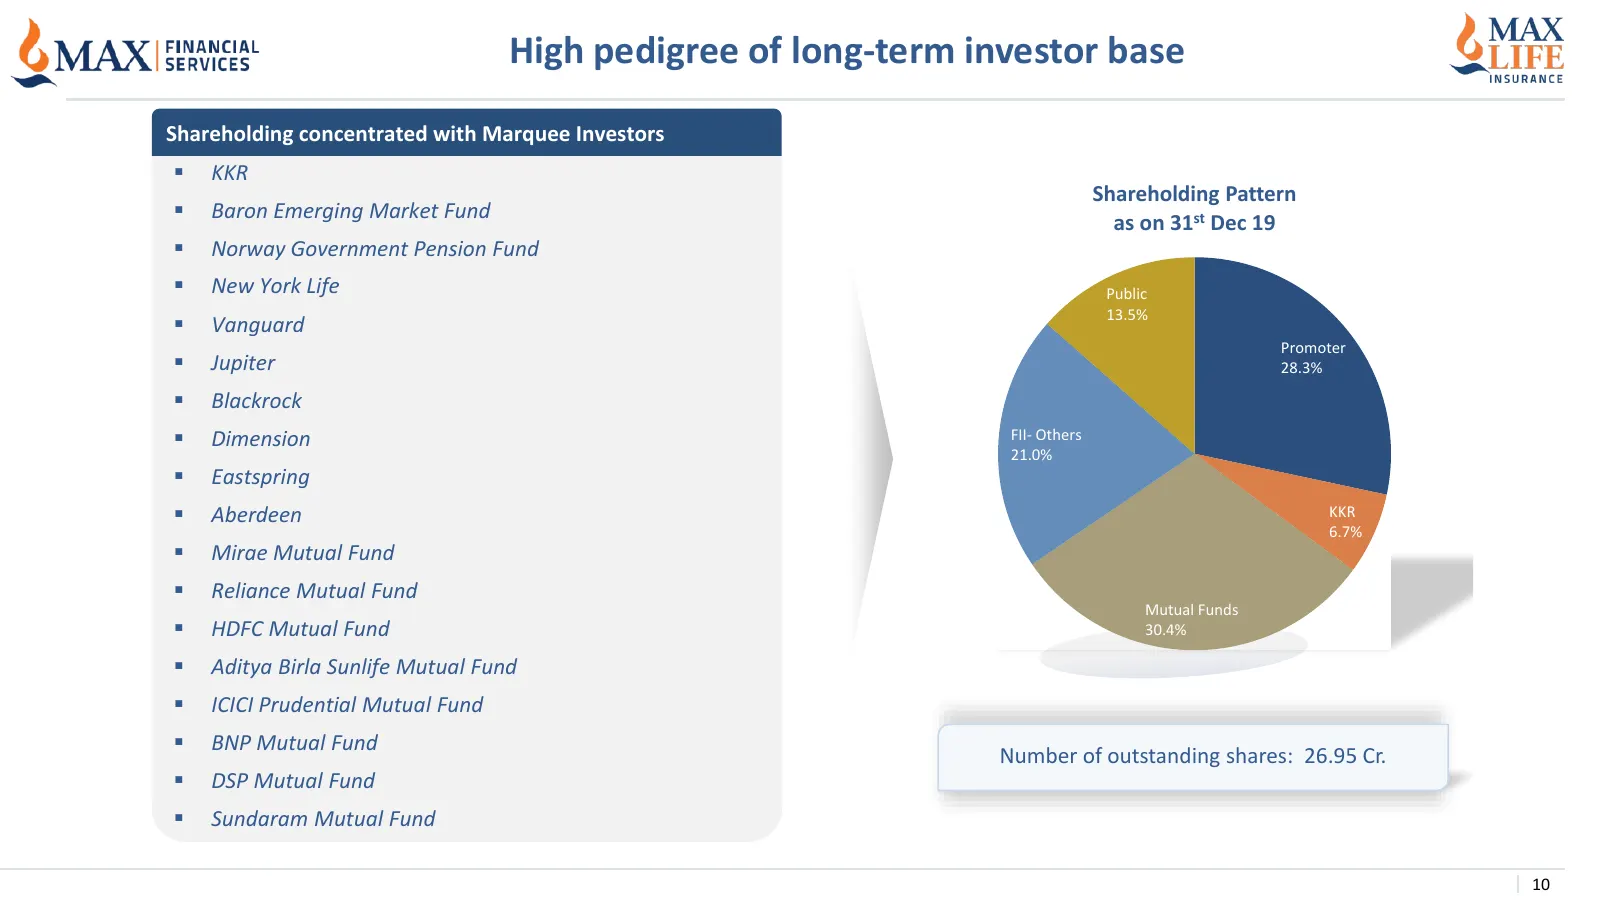
Slide 10: High pedigree of long-term investor base
High pedigree of long-term investor base Shareholding concentrated with Marquee Investors ▪ KKR Shareholding Pattern ▪ Baron Emerging Market Fund as on 31st Dec 19 ▪ Norway Government Pension Fund ▪ New York Life Public 13.5% ▪ Vanguard Promoter ▪ Jupiter 28.3% ▪ Blackrock ▪ Dimension FII- Others 21

Slide 11: Section II: Max Life Insurance – Insurance Opportunity
SECTION II Max Life Insurance – Insurance Opportunity
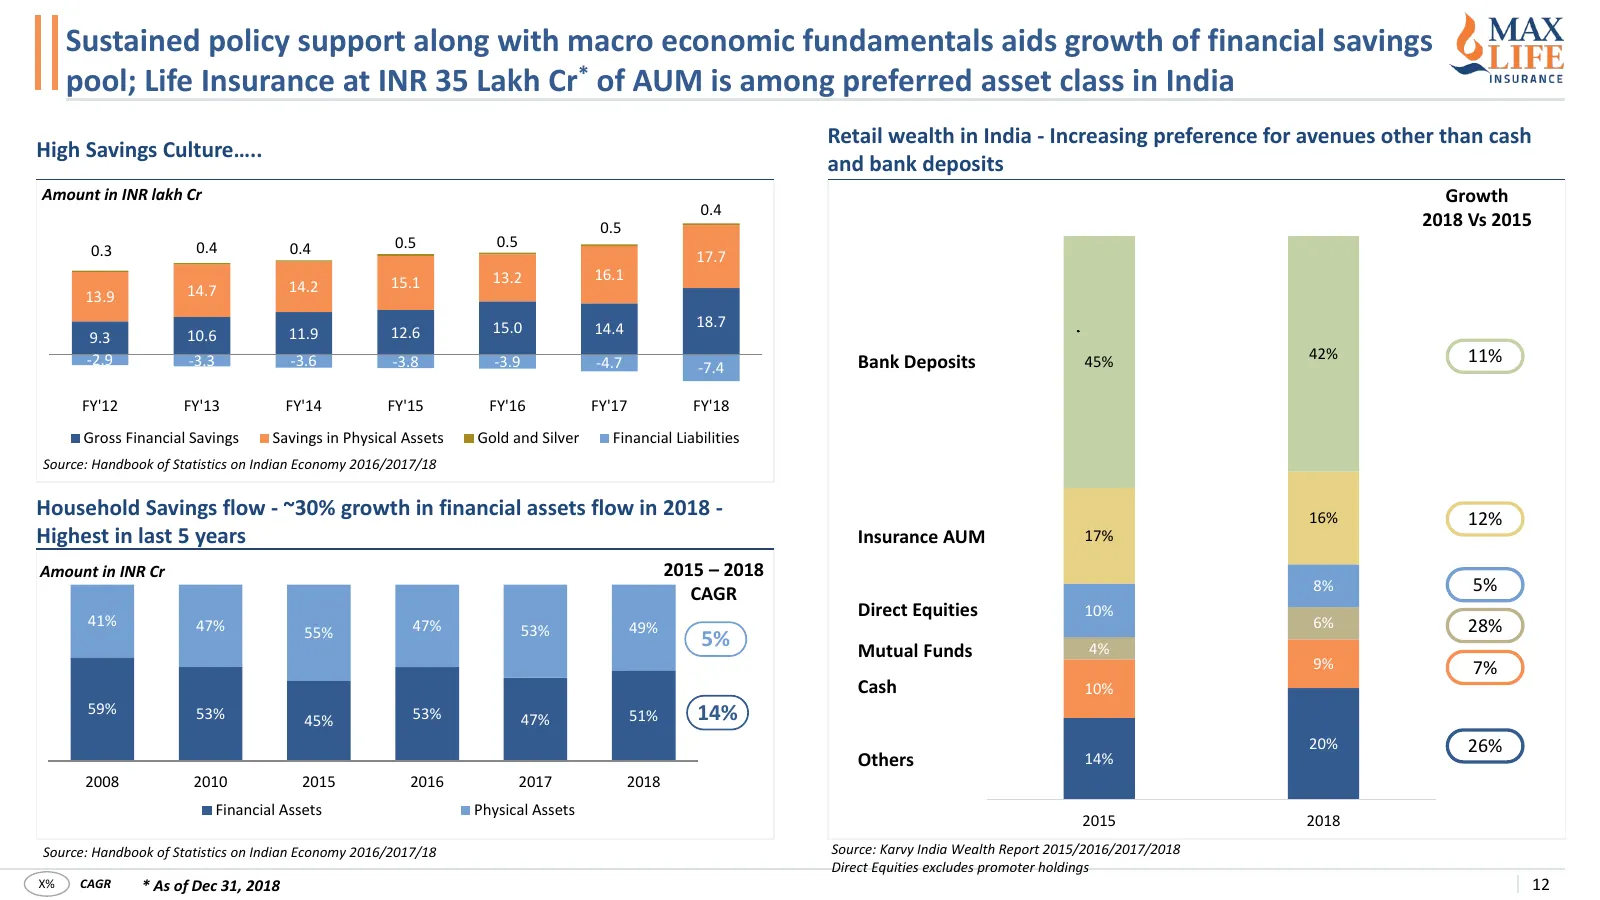
Slide 12: Policy support and macro fundamentals aid growth of financial savings pool
Sustained policy support along with macro economic fundamentals aids growth of financial savings pool; Life Insurance at INR 35 Lakh Cr* of AUM is among preferred asset class in India Retail wealth in India - Increasing preference for avenues other than cash High Savings Culture….. and bank deposits
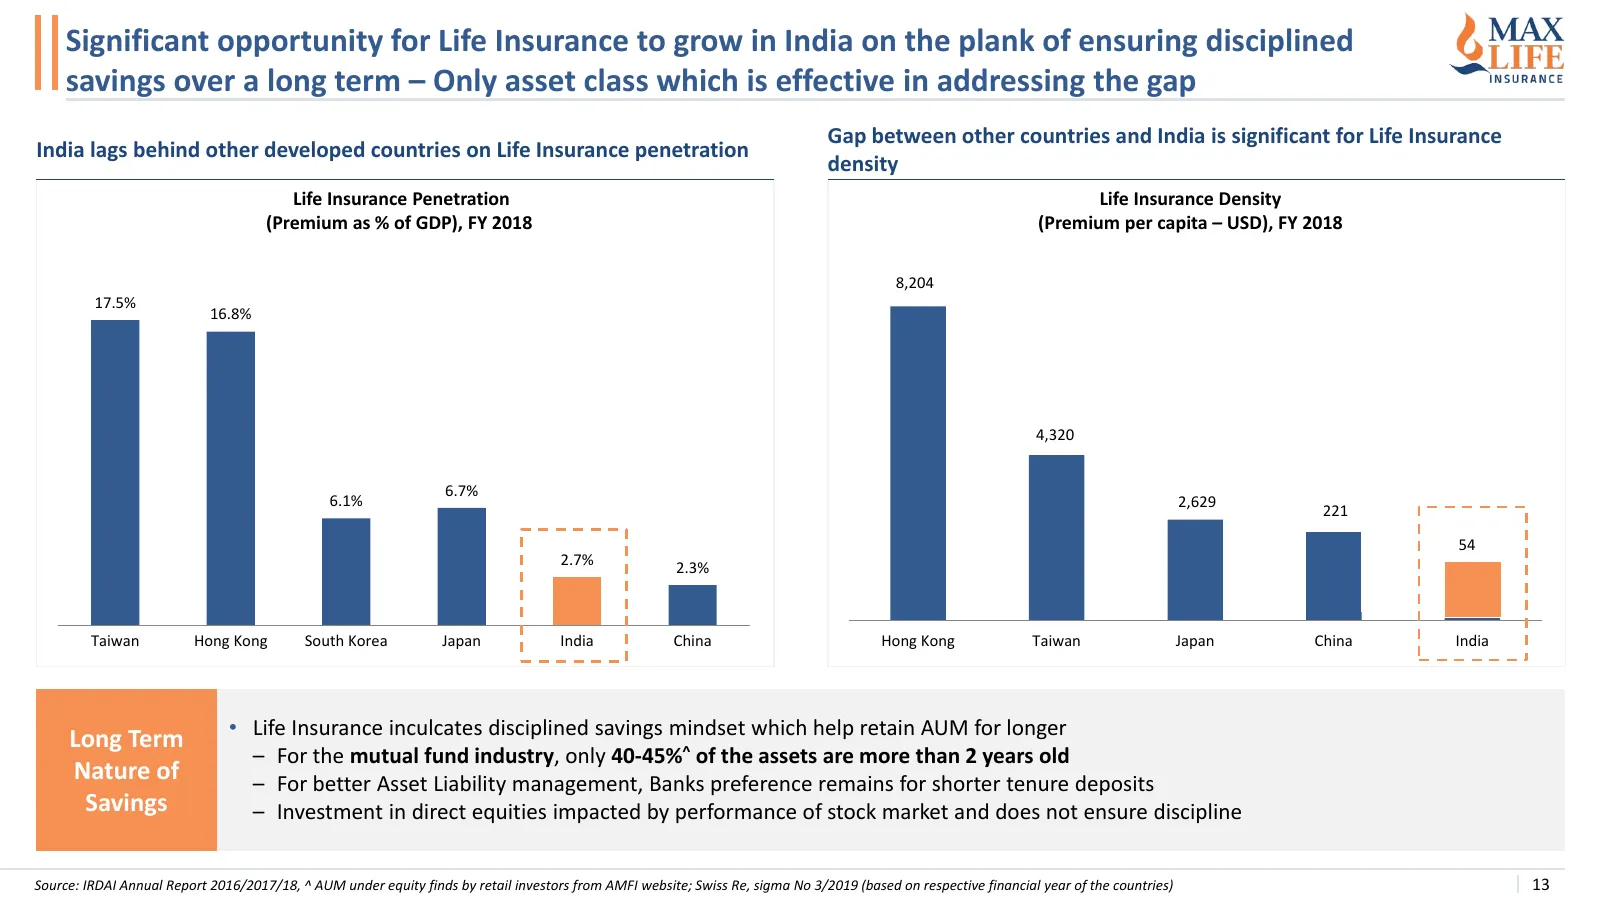
Slide 13: Significant opportunity for Life Insurance to grow in India
Significant opportunity for Life Insurance to grow in India on the plank of ensuring disciplined savings over a long term – Only asset class which is effective in addressing the gap Gap between other countries and India is significant for Life Insurance India lags behind other developed countries on
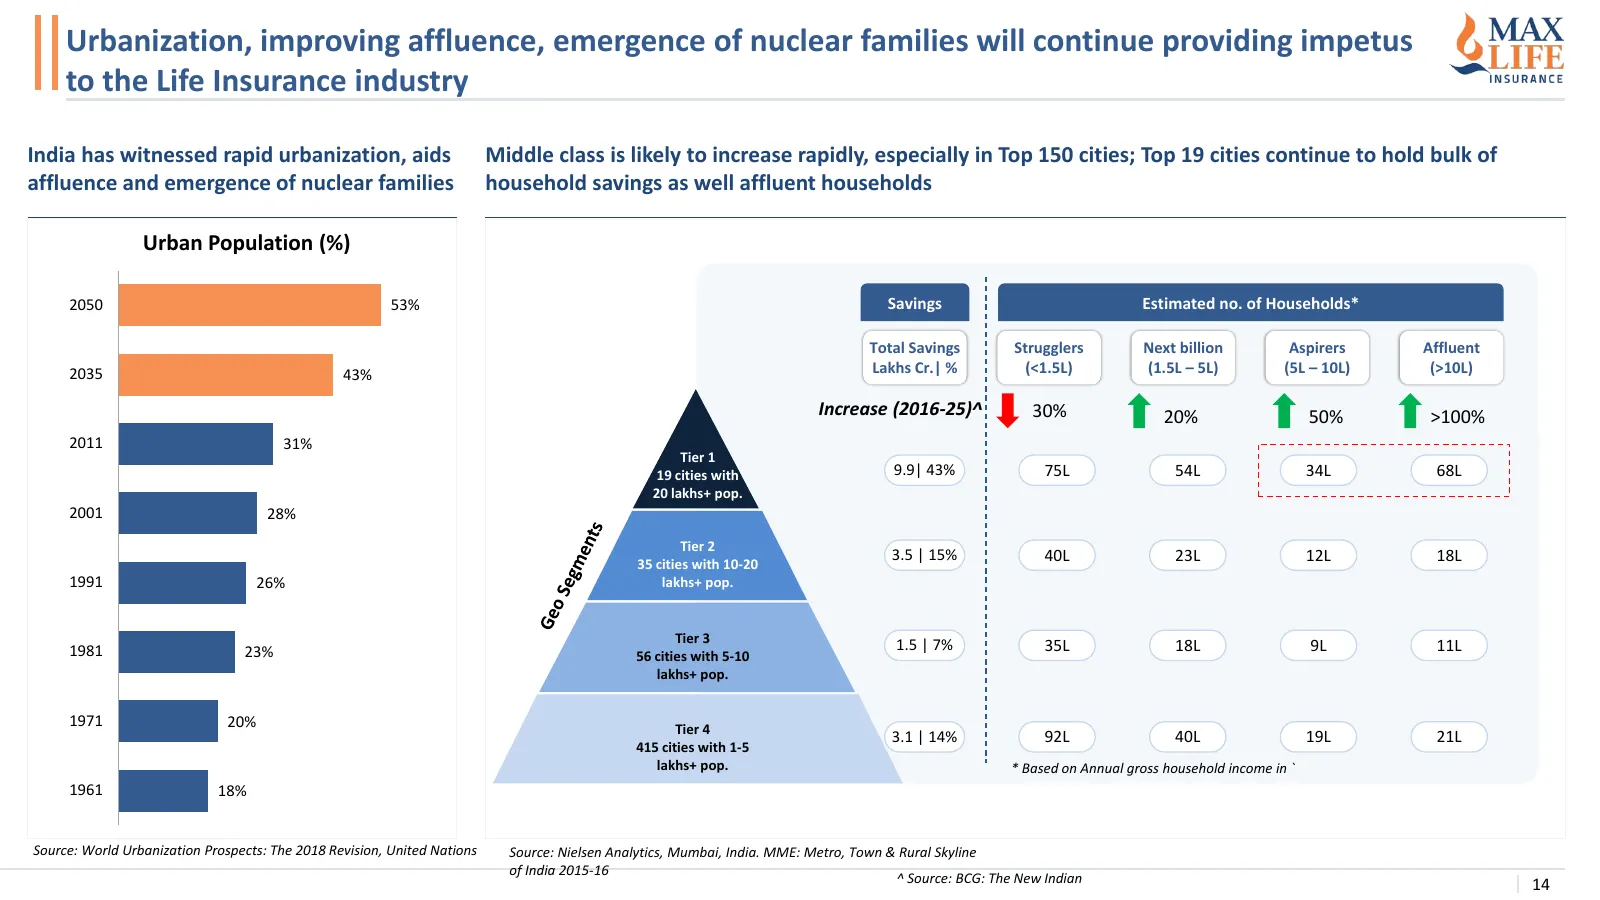
Slide 14: Urbanization, affluence and nuclear families drive life insurance
Urbanization, improving affluence, emergence of nuclear families will continue providing impetus to the Life Insurance industry India has witnessed rapid urbanization, aids Middle class is likely to increase rapidly, especially in Top 150 cities; Top 19 cities continue to hold bulk of affluence and
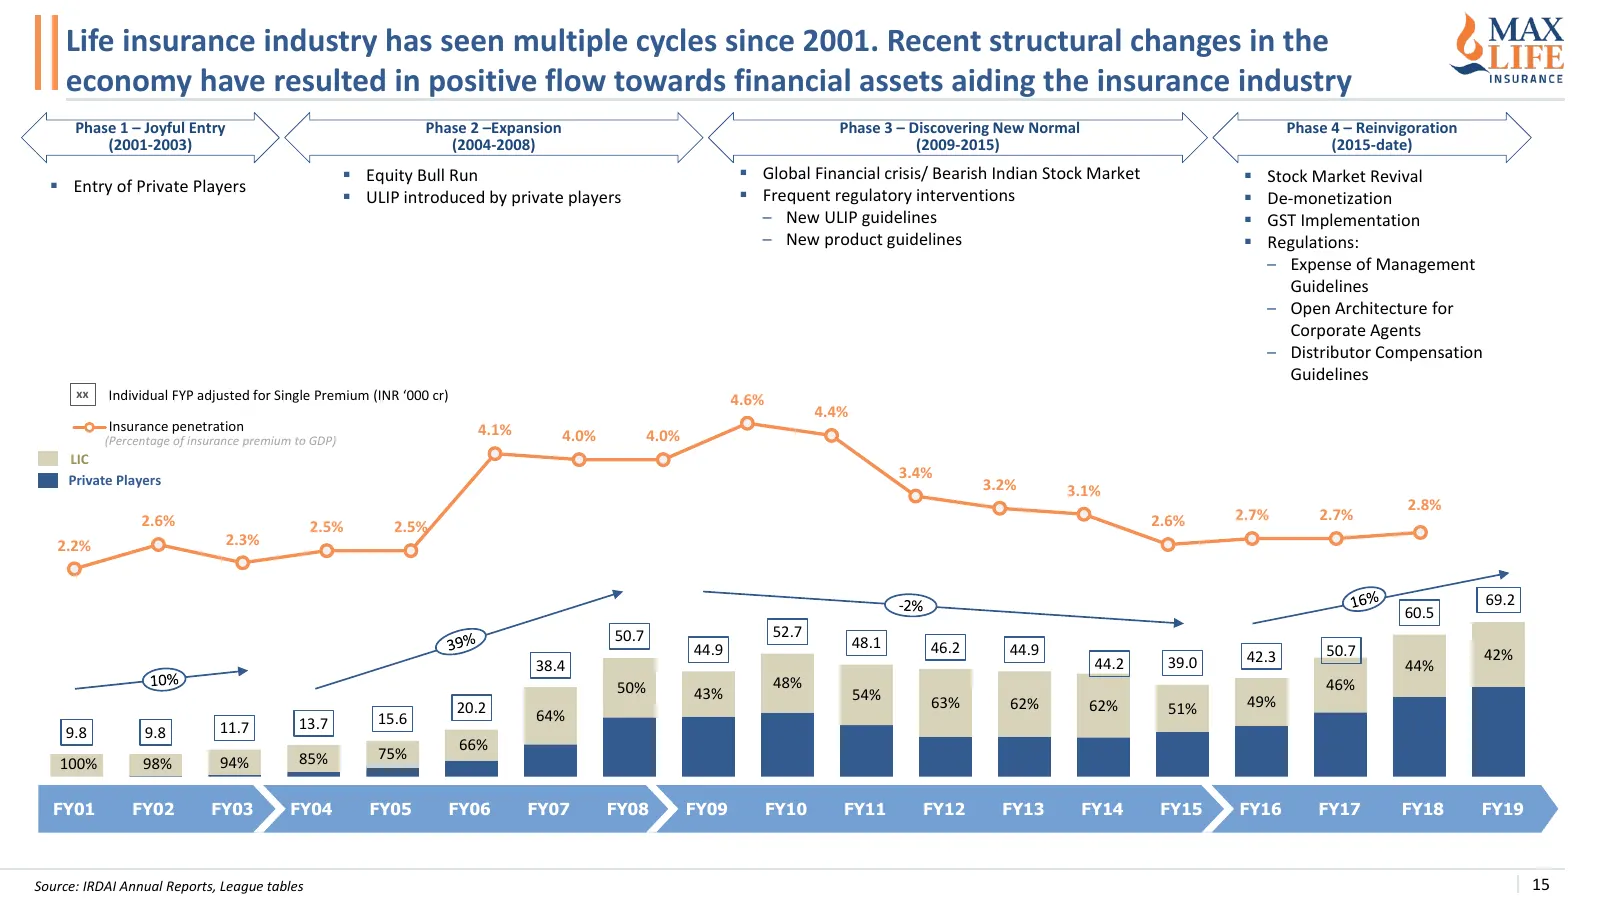
Slide 15: Life insurance industry has seen multiple cycles since 2001
Life insurance industry has seen multiple cycles since 2001. Recent structural changes in the economy have resulted in positive flow towards financial assets aiding the insurance industry Phase 1 – Joyful Entry Phase 2 –Expansion Phase 3 – Discovering New Normal Phase 4 – Reinvigoration (2001-2003)
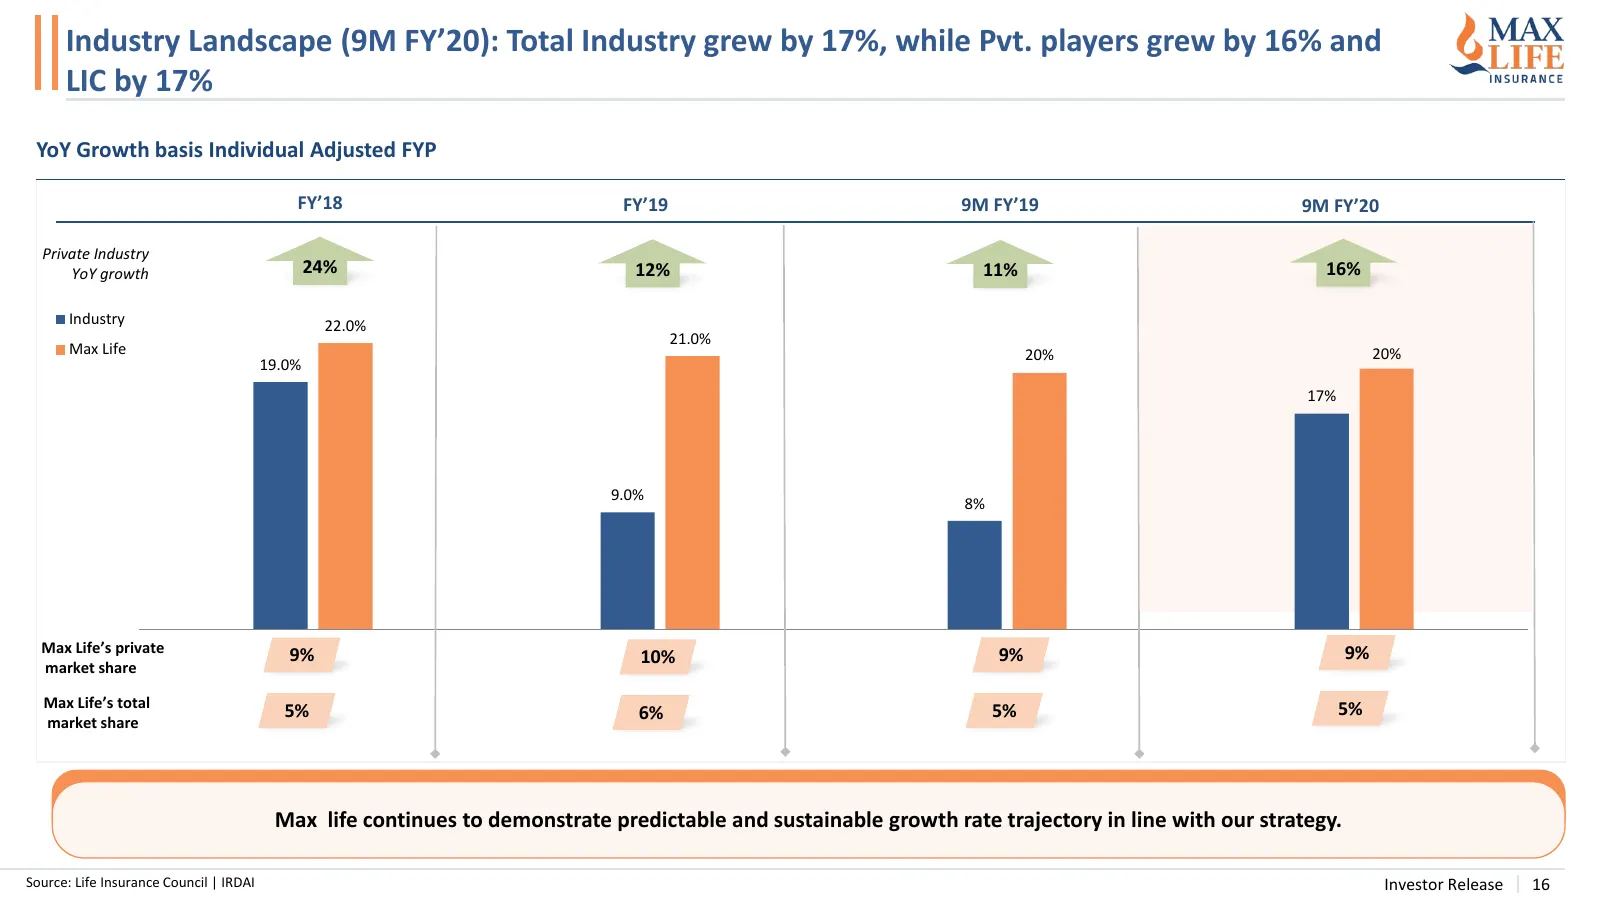
Slide 16: Industry Landscape (9M FY'20)
Industry Landscape (9M FY’20): Total Industry grew by 17%, while Pvt. players grew by 16% and LIC by 17% YoY Growth basis Individual Adjusted FYP FY’18 FY’19 9M FY’19 9M FY’20 Private Industry YoY growth 24% 12% 11% 16% Industry 22.0% 21.0% Max Life 20% 20% 19.0% 17% 9.0% 8% Max Life’s private 9% 9%

Slide 17: Section III: Max Life Insurance – Business Overview
SECTION III Max Life Insurance – Business Overview
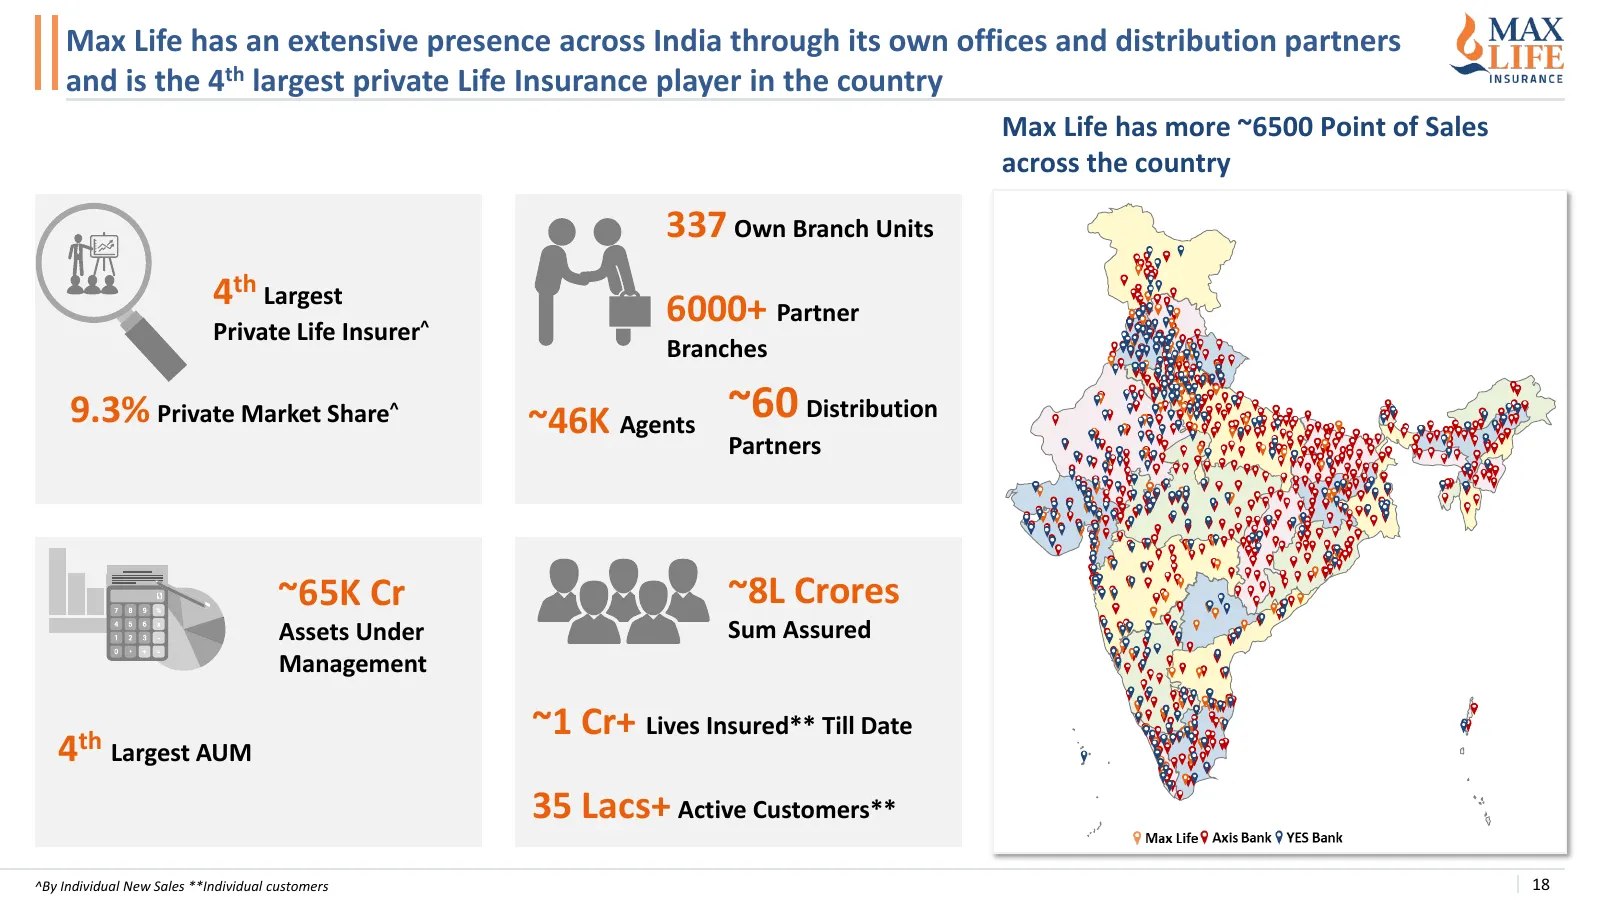
Slide 18: Max Life's extensive presence across India
Max Life has an extensive presence across India through its own offices and distribution partners and is the 4th largest private Life Insurance player in the country Max Life has more ~6500 Point of Sales across the country 337 Own Branch Units 4th Largest 6000+ Partner Private Life Insurer^ Branche
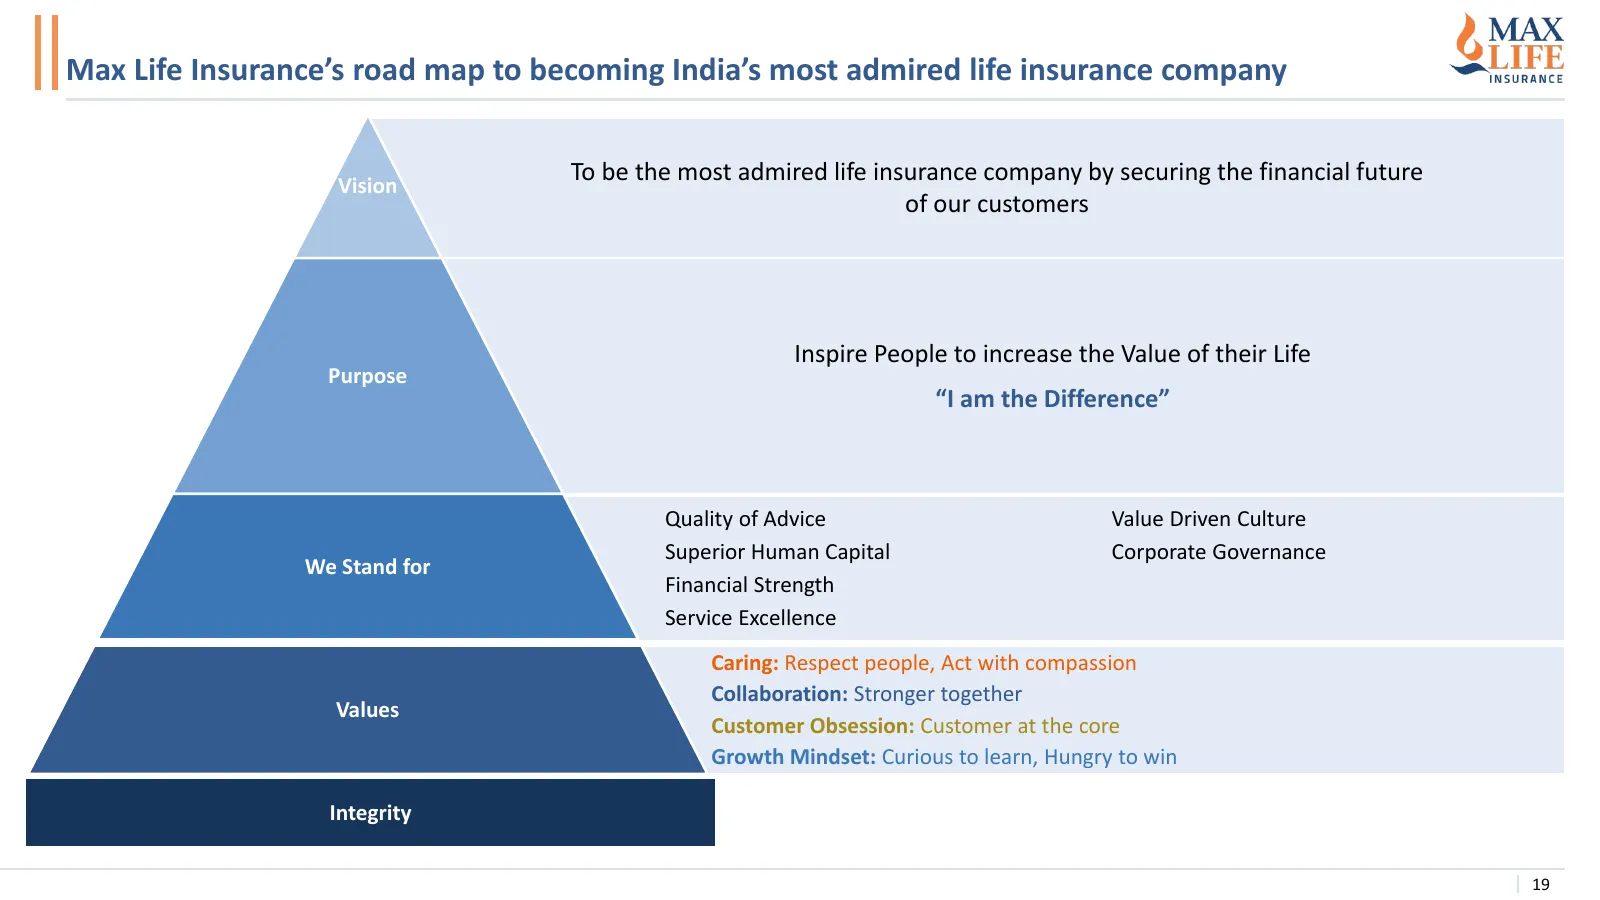
Slide 19: Max Life Insurance's road map to becoming India's most admired life insurer
Max Life Insurance’s road map to becoming India’s most admired life insurance company Vision To be the most admired life insurance company by securing the financial future of our customers Inspire People to increase the Value of their Life Purpose “I am the Difference” Quality of Advice Value Driven
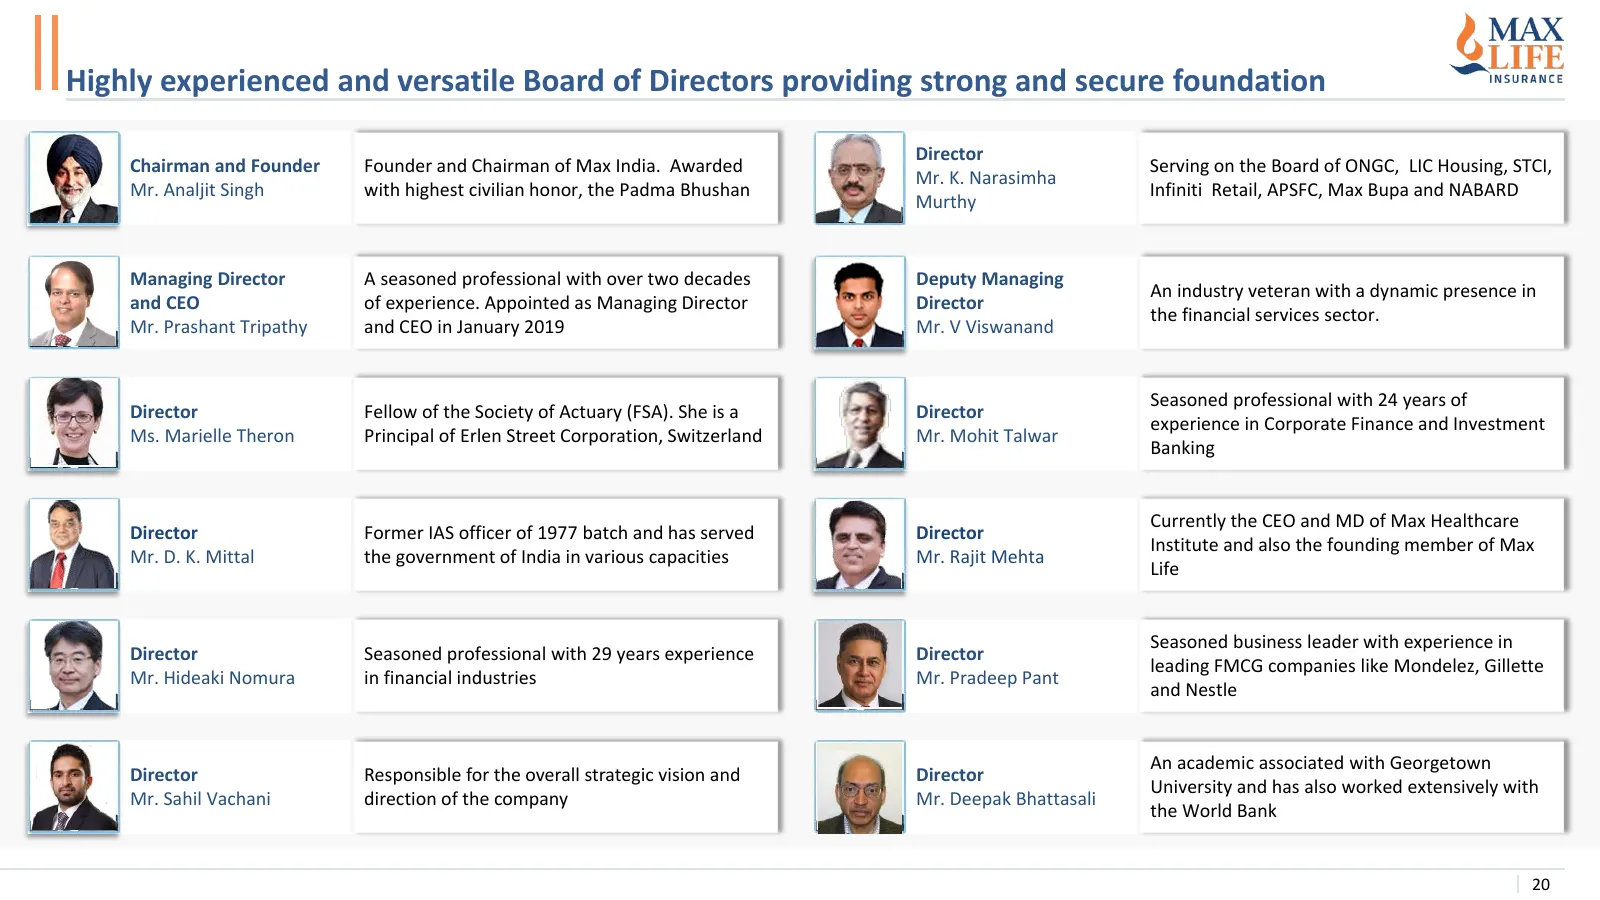
Slide 20: Highly experienced and versatile Board of Directors
Highly experienced and versatile Board of Directors providing strong and secure foundation Director Chairman and Founder Founder and Chairman of Max India. Awarded Serving on the Board of ONGC, LIC Housing, STCI, Mr. K. Narasimha Mr. Analjit Singh with highest civilian honor, the Padma Bhushan Infin
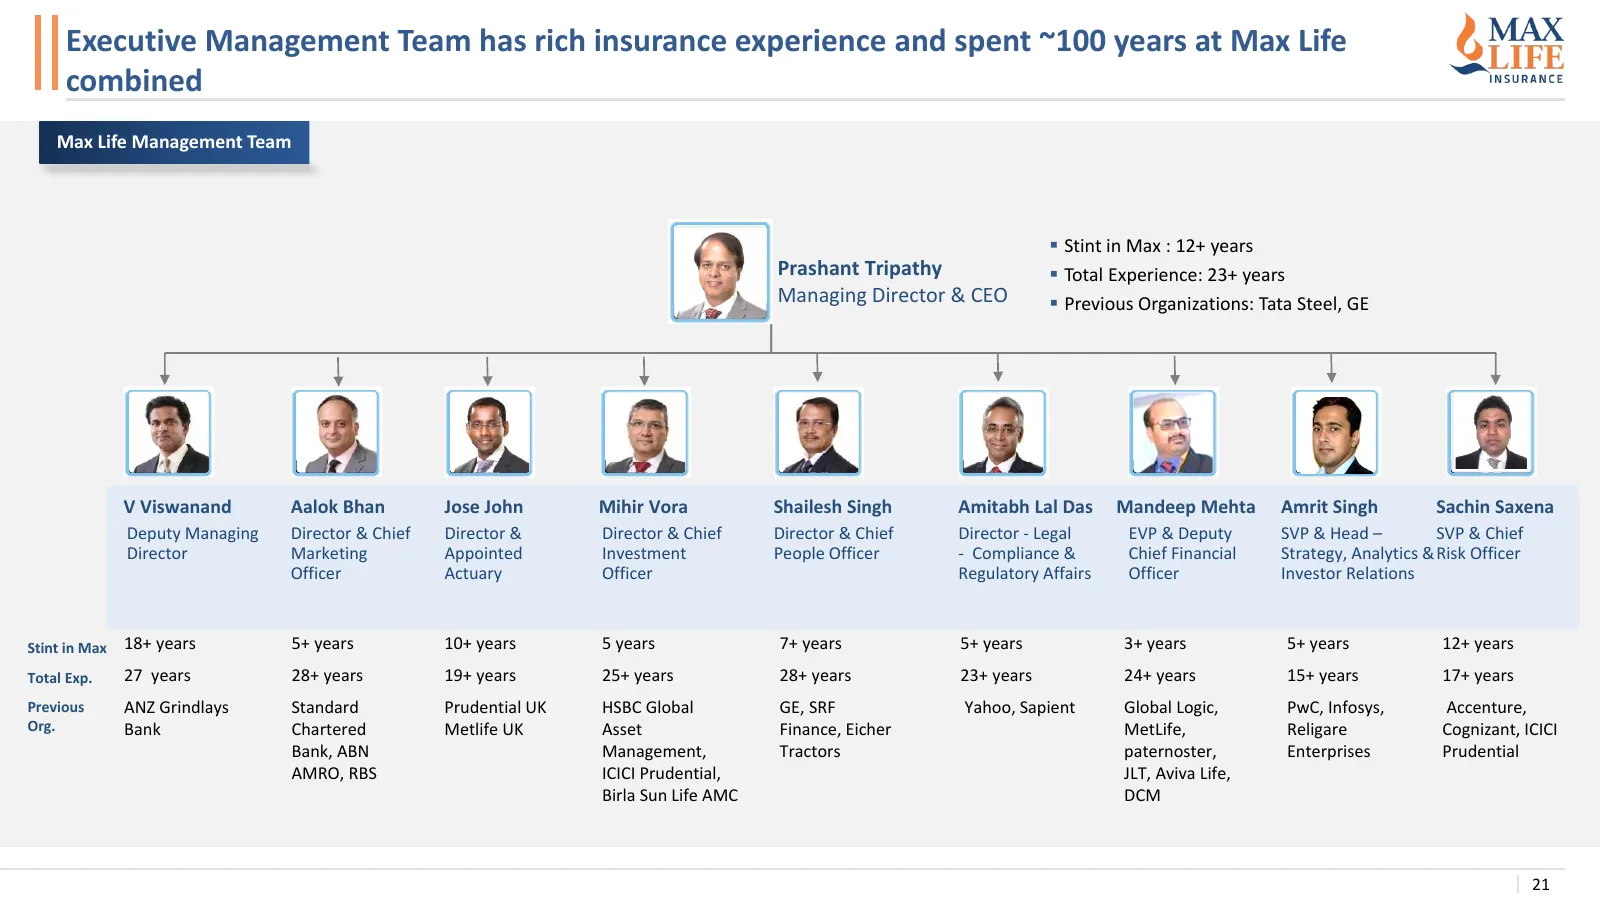
Slide 21: Executive Management Team
Executive Management Team has rich insurance experience and spent ~100 years at Max Life combined Max Life Management Team ▪ Stint in Max : 12+ years Prashant Tripathy ▪ Total Experience: 23+ years Managing Director & CEO ▪ Previous Organizations: Tata Steel, GE V Viswanand Aalok Bhan Jose John Mihi
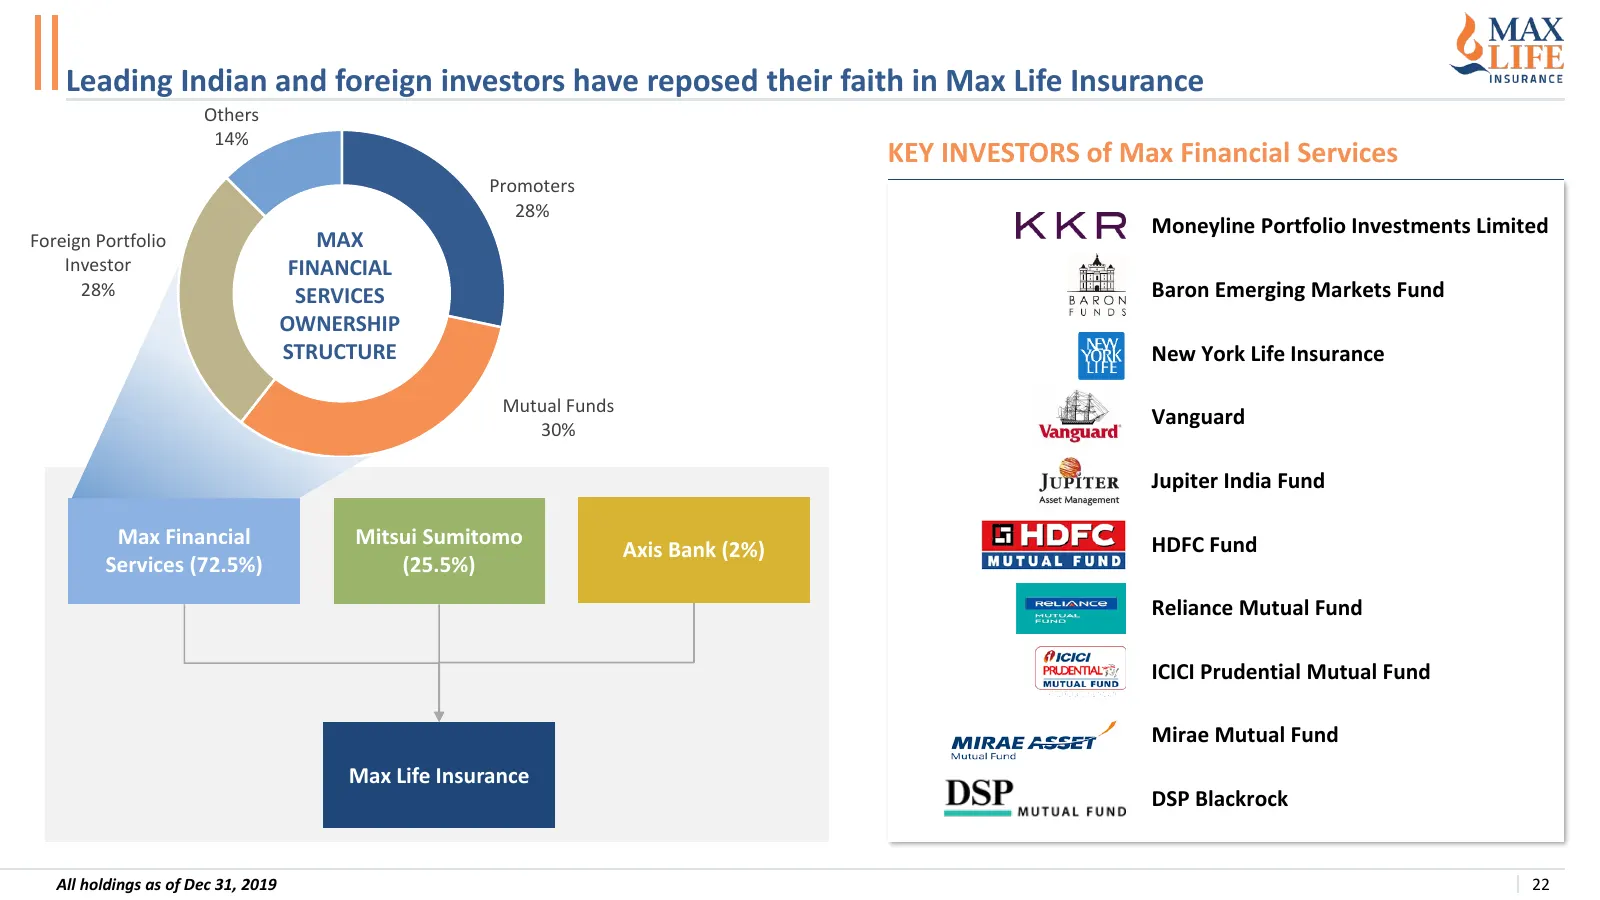
Slide 22: Leading investors have reposed faith in Max Life Insurance
Leading Indian and foreign investors have reposed their faith in Max Life Insurance Others 14% KEY INVESTORS of Max Financial Services Promoters 28% Moneyline Portfolio Investments Limited Foreign Portfolio MAX Investor FINANCIAL 28% SERVICES Baron Emerging Markets Fund OWNERSHIP STRUCTURE New York
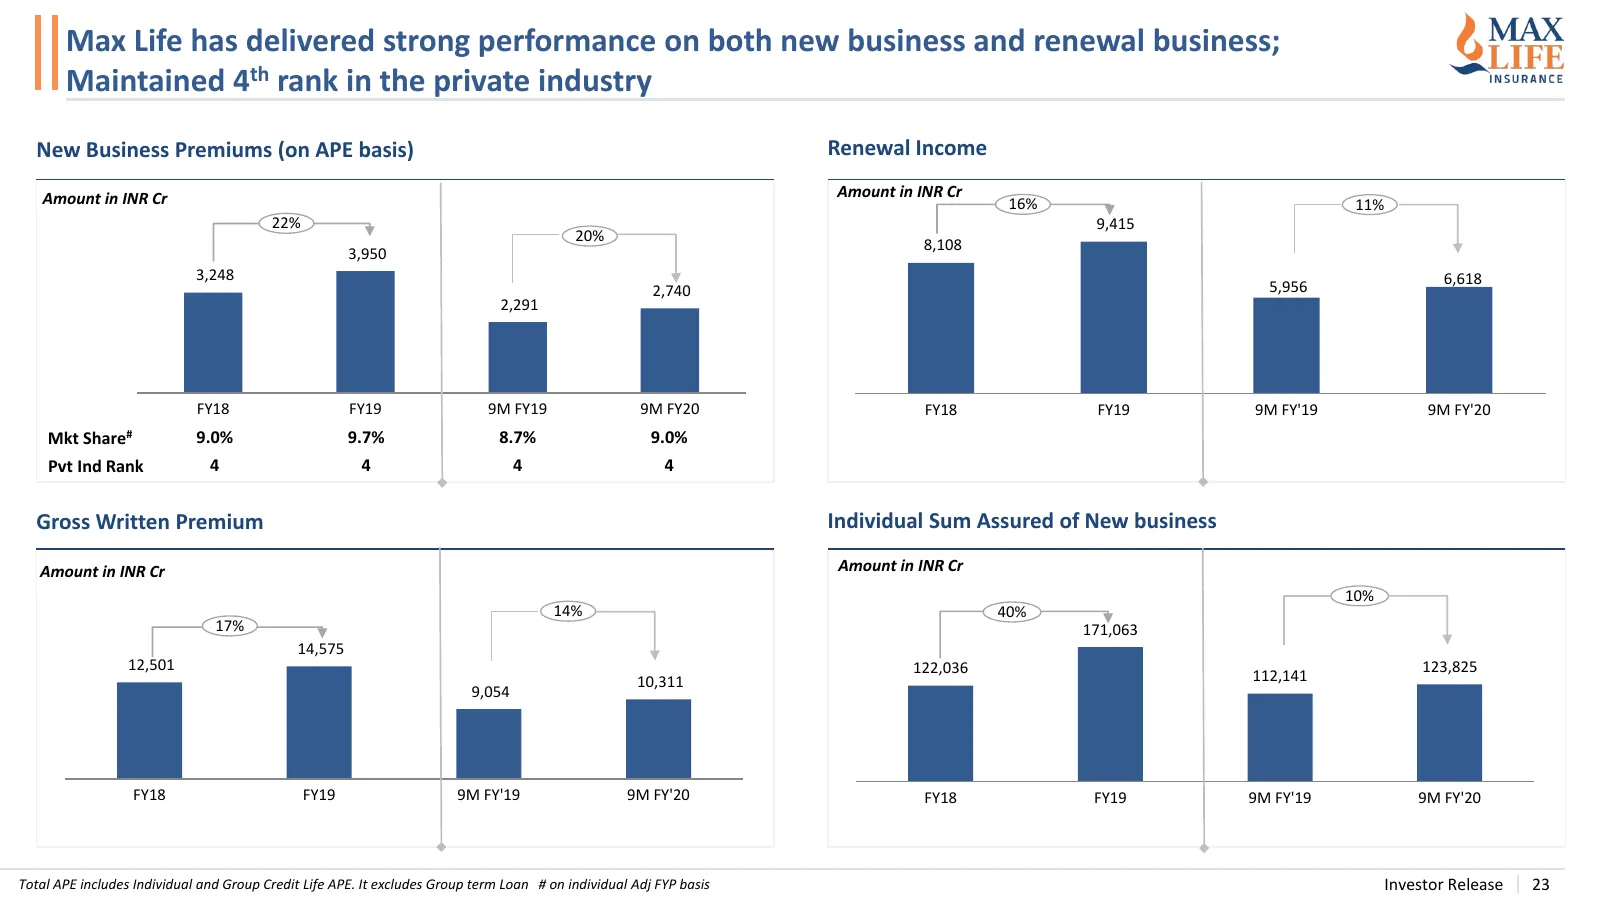
Slide 23: Strong performance on new business and renewal business
Max Life has delivered strong performance on both new business and renewal business; Maintained 4th rank in the private industry New Business Premiums (on APE basis) Renewal Income Amount in INR Cr Amount in INR Cr 16% 11% 22% 9,415 20% 3,950 8,108 3,248 6,618 2,740 5,956 2,291 FY18 FY19 9M FY19 9M
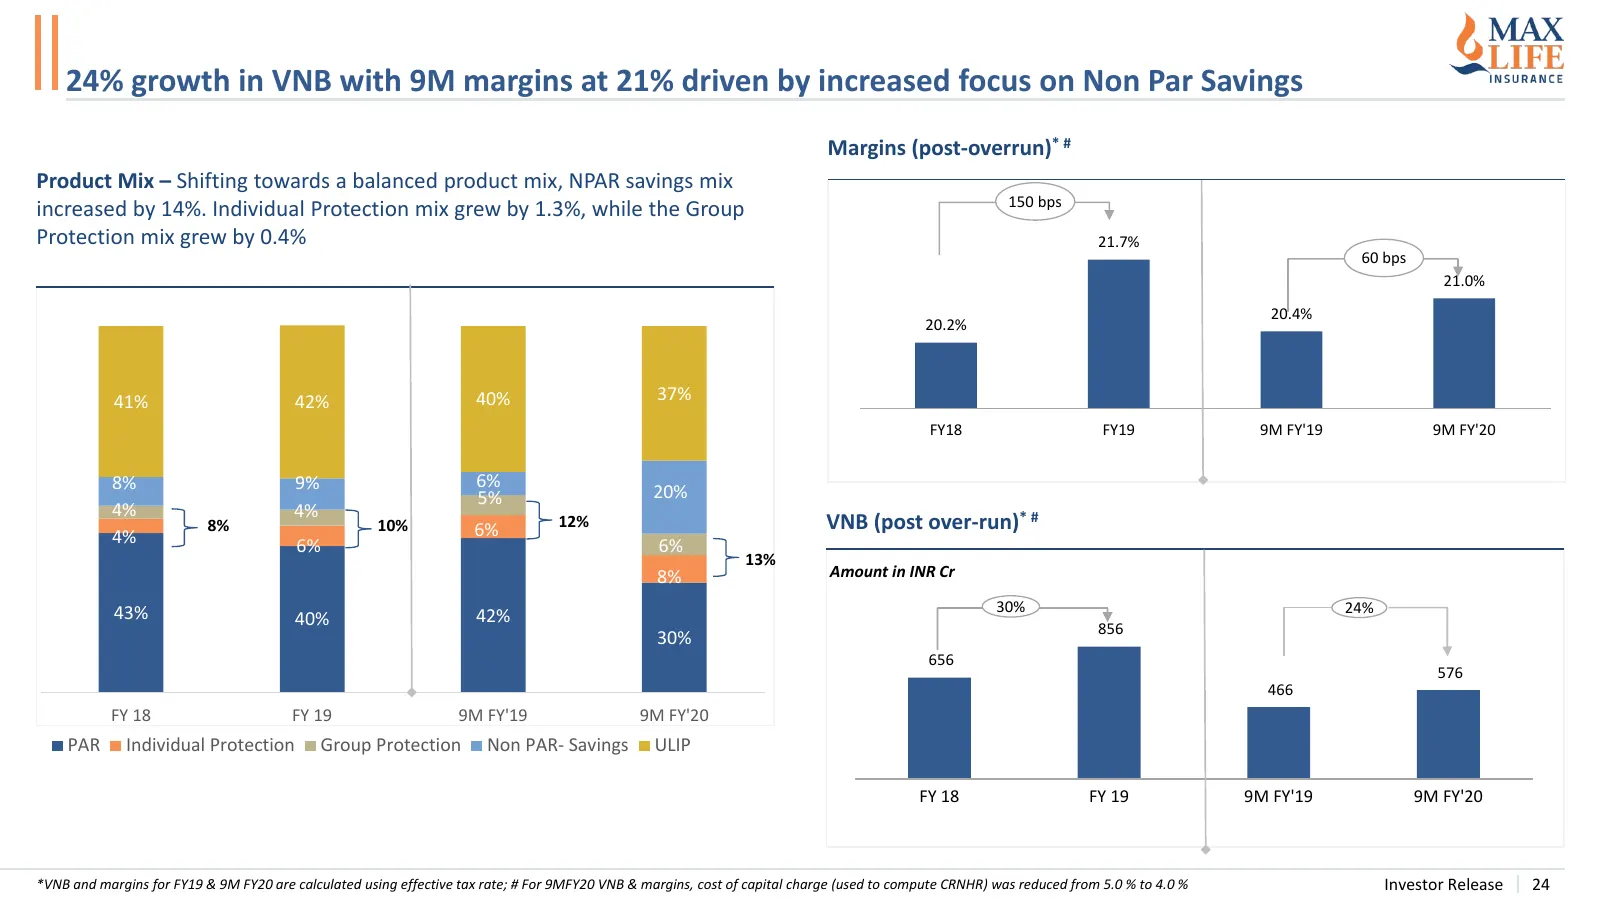
Slide 24: 24% growth in VNB with 9M margins at 21%
24% growth in VNB with 9M margins at 21% driven by increased focus on Non Par Savings Margins (post-overrun)* # Product Mix – Shifting towards a balanced product mix, NPAR savings mix 150 bps increased by 14%. Individual Protection mix grew by 1.3%, while the Group Protection mix grew by 0.4% 21.7%
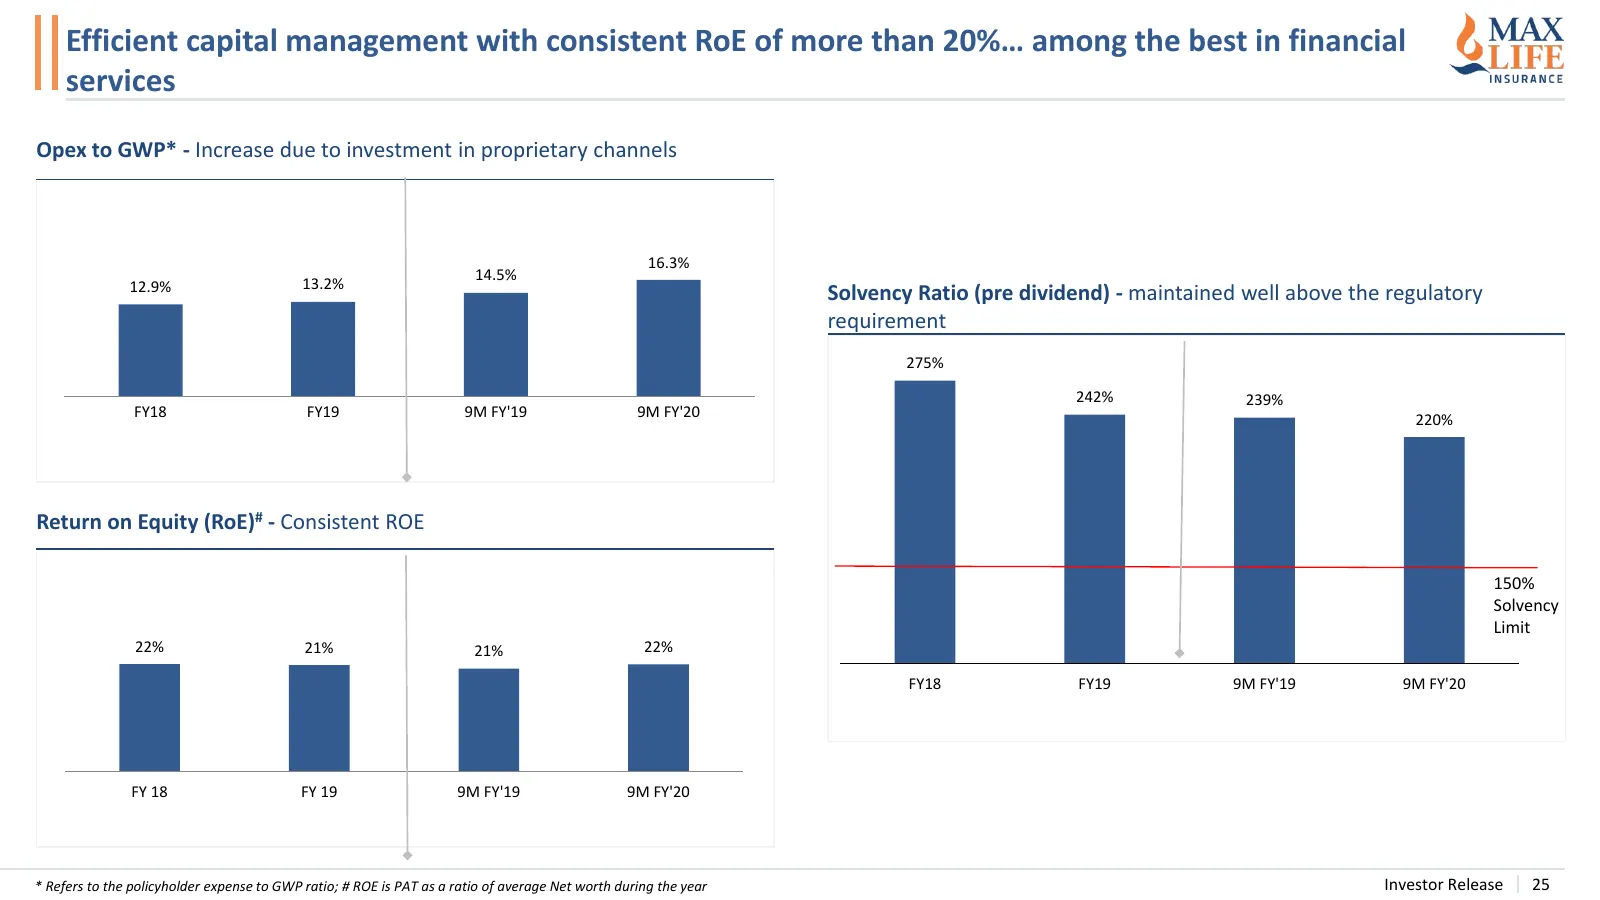
Slide 25: Efficient capital management with consistent RoE above 20%
Efficient capital management with consistent RoE of more than 20%… among the best in financial services Opex to GWP* - Increase due to investment in proprietary channels 16.3% 14.5% 12.9% 13.2% Solvency Ratio (pre dividend) - maintained well above the regulatory requirement 275% 242% 239% FY18 FY19
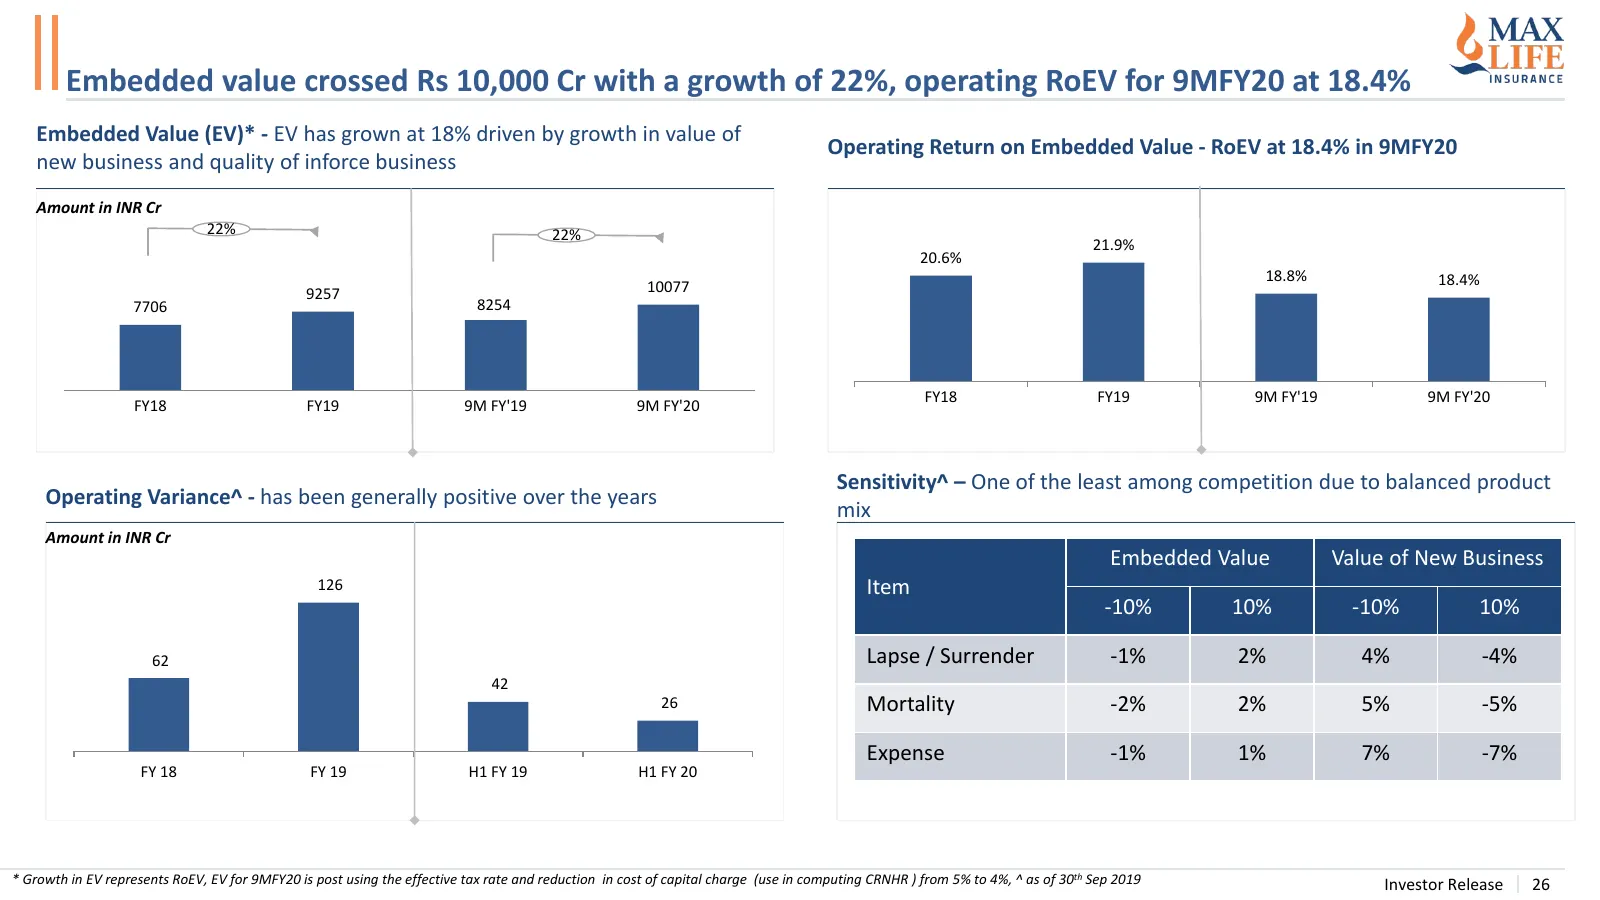
Slide 26: Embedded value crossed Rs 10,000 Cr
Embedded value crossed Rs 10,000 Cr with a growth of 22%, operating RoEV for 9MFY20 at 18.4% Embedded Value (EV)* - EV has grown at 18% driven by growth in value of Operating Return on Embedded Value - RoEV at 18.4% in 9MFY20 new business and quality of inforce business Amount in INR Cr 22% 22% 21.9
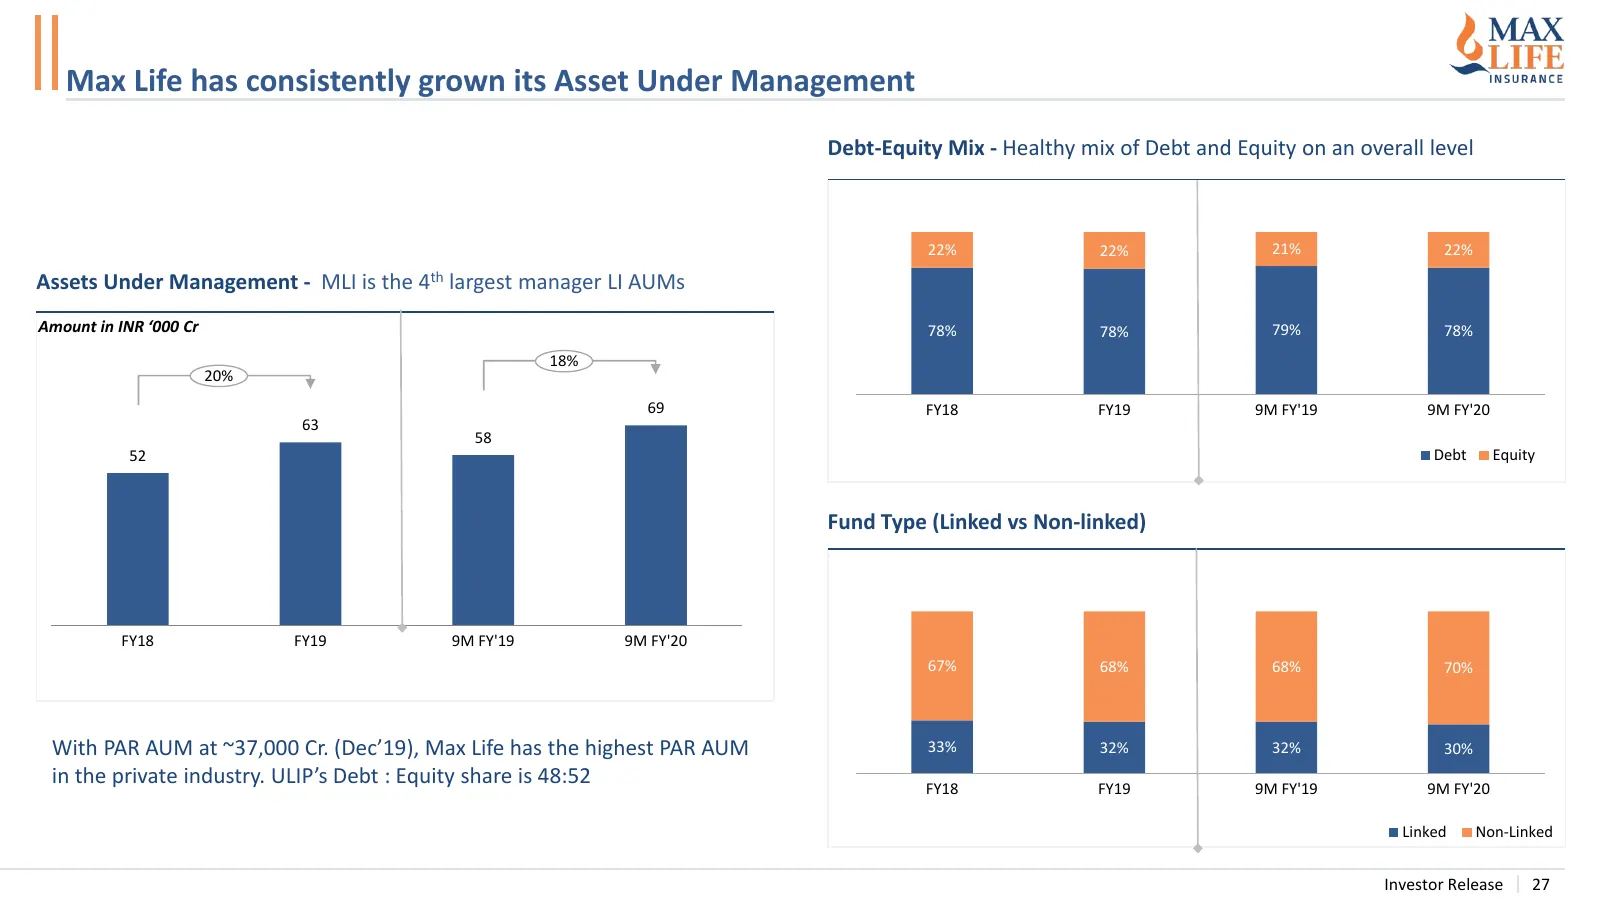
Slide 27: Max Life has consistently grown its Assets Under Management
Max Life has consistently grown its Asset Under Management Debt-Equity Mix - Healthy mix of Debt and Equity on an overall level 22% 22% 21% 22% Assets Under Management - MLI is the 4th largest manager LI AUMs Amount in INR ‘000 Cr 78% 78% 79% 78% 18% 20% 69 FY18 FY19 9M FY'19 9M FY'20 63 58 52 Debt
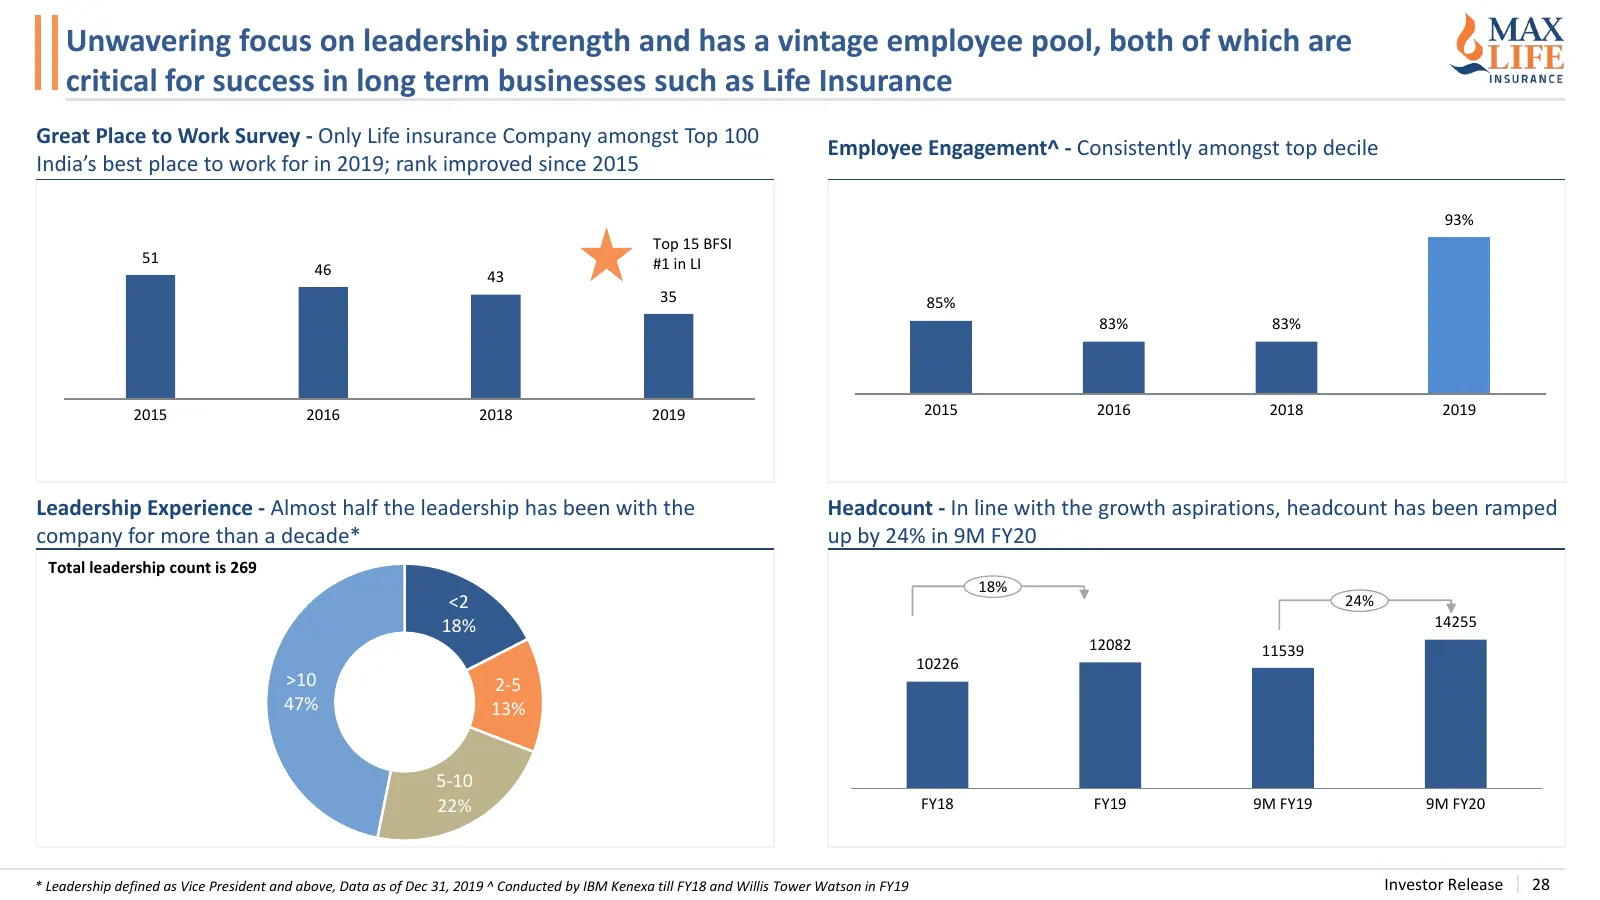
Slide 28: Leadership strength and vintage employee pool
Unwavering focus on leadership strength and has a vintage employee pool, both of which are critical for success in long term businesses such as Life Insurance Great Place to Work Survey - Only Life insurance Company amongst Top 100 Employee Engagement^ - Consistently amongst top decile India’s best
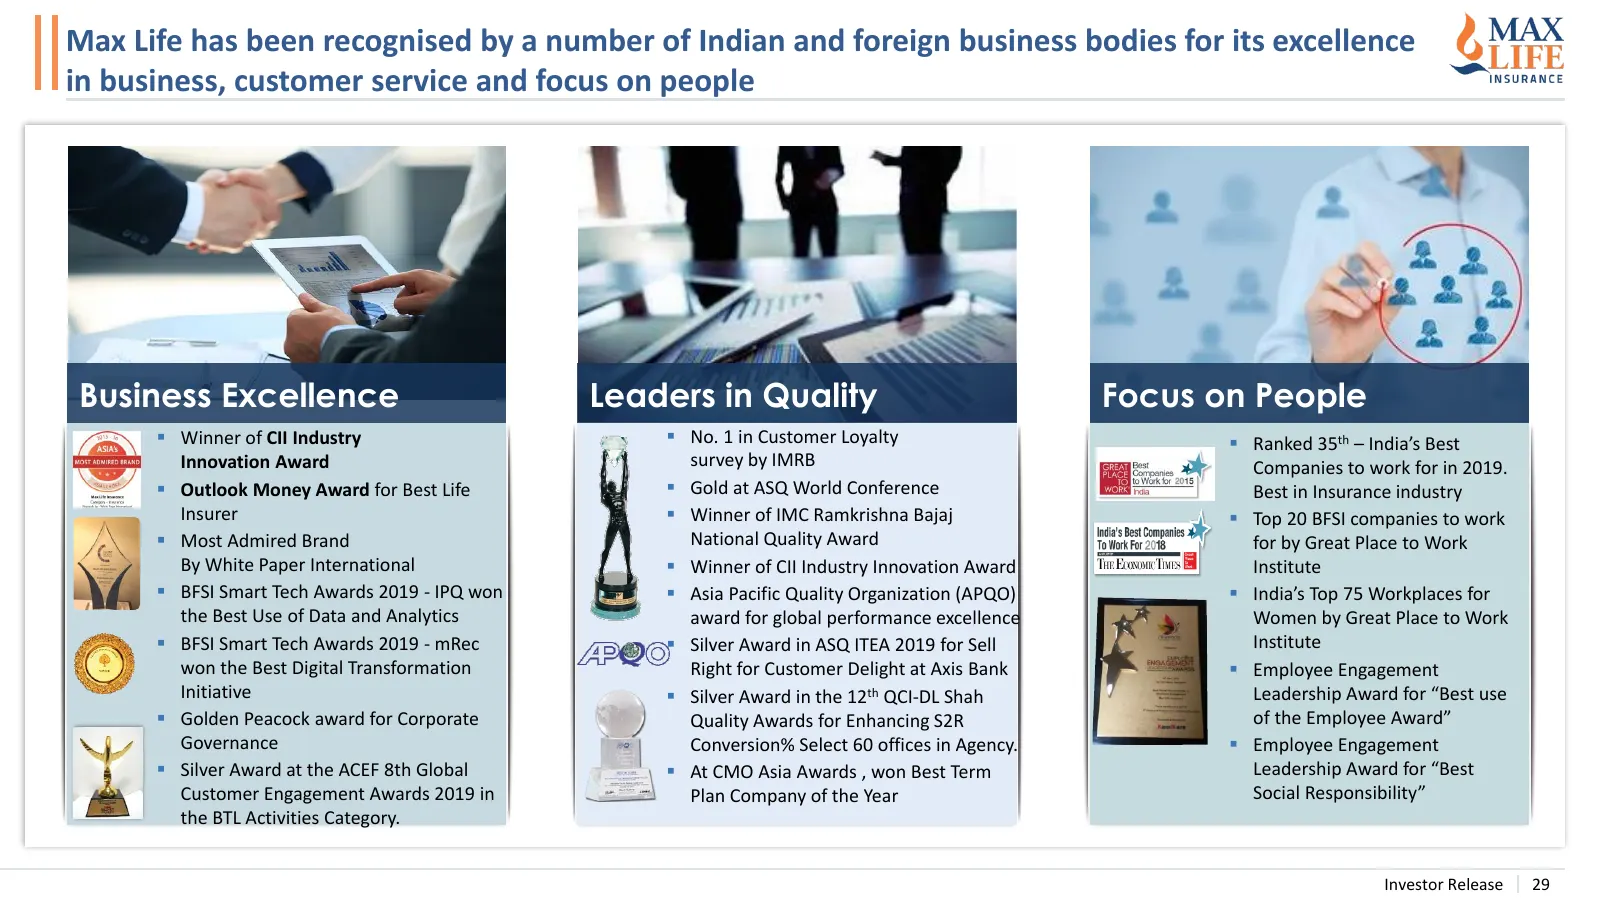
Slide 29: Recognition for business excellence, quality and people focus
Max Life has been recognised by a number of Indian and foreign business bodies for its excellence in business, customer service and focus on people Business Excellence Leaders in Quality Focus on People ▪ Winner of CII Industry ▪ No. 1 in Customer Loyalty ▪ Ranked 35th – India’s Best Innovation Awar
Slide 30: Section IV: Max Life Insurance – Strategy FY19-22
SECTION IV Max Life Insurance – Strategy FY19-22
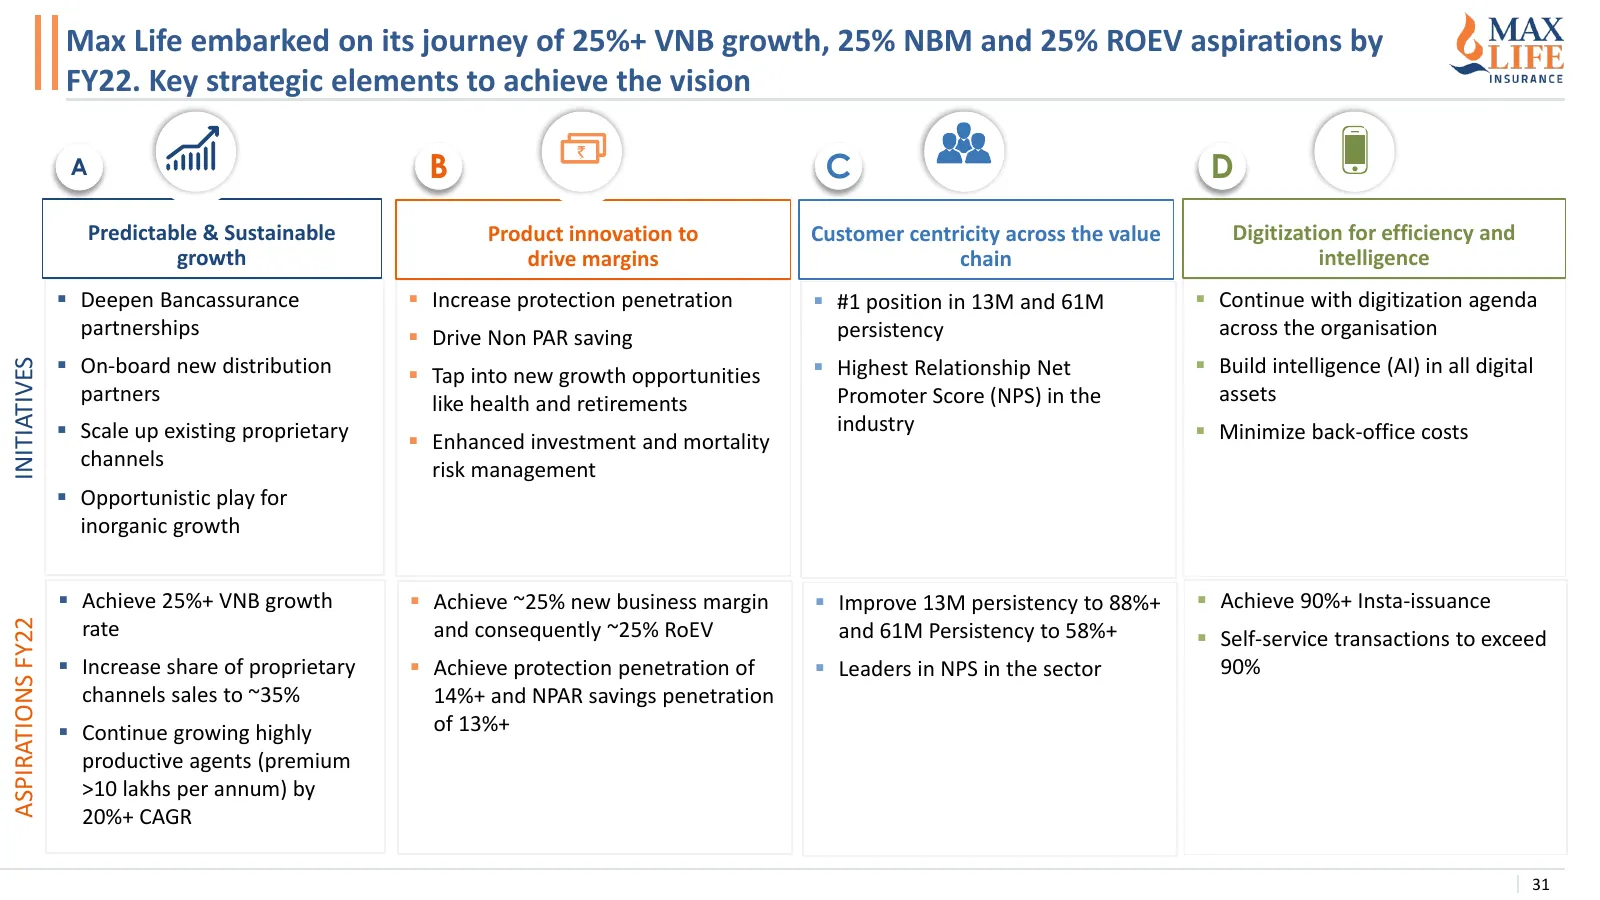
Slide 31: Aspirations FY22
Max Life embarked on its journey of 25%+ VNB growth, 25% NBM and 25% ROEV aspirations by FY22. Key strategic elements to achieve the vision A B C D Predictable & Sustainable Digitalto Product innovation Customer centricity across the value Digitization for efficiency and growth drive margins chain i
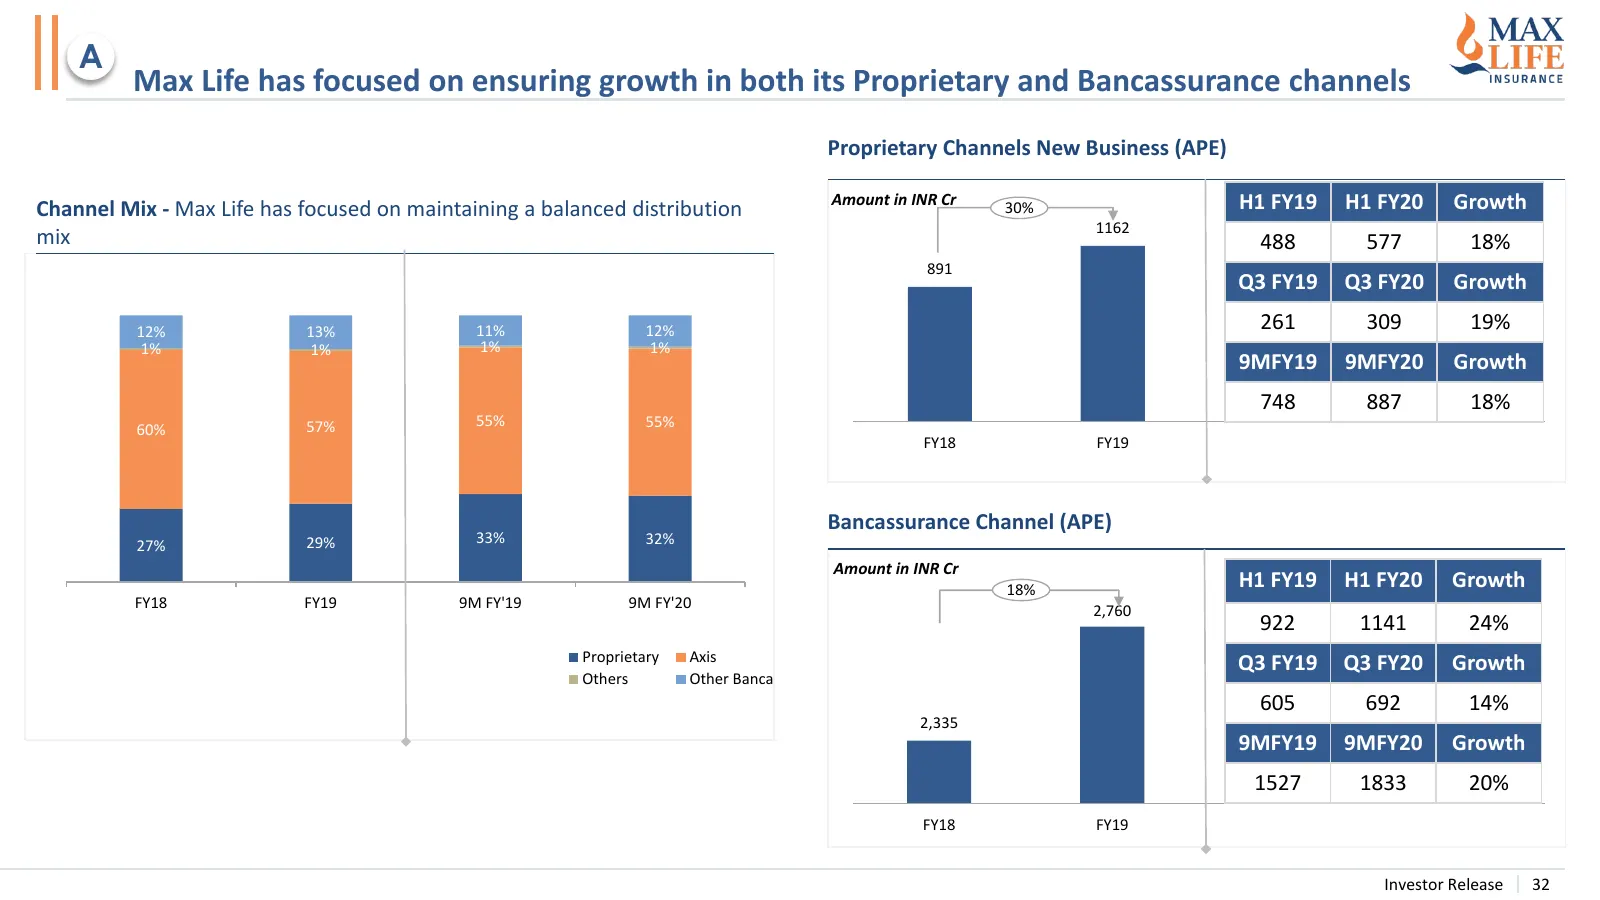
Slide 32: Growth in Proprietary and Bancassurance channels
A Max Life has focused on ensuring growth in both its Proprietary and Bancassurance channels Proprietary Channels New Business (APE) Channel Mix - Max Life has focused on maintaining a balanced distribution Amount in INR Cr 30% H1 FY19 H1 FY20 Growth 1162 mix 488 577 18% 891 Q3 FY19 Q3 FY20 Growth 1
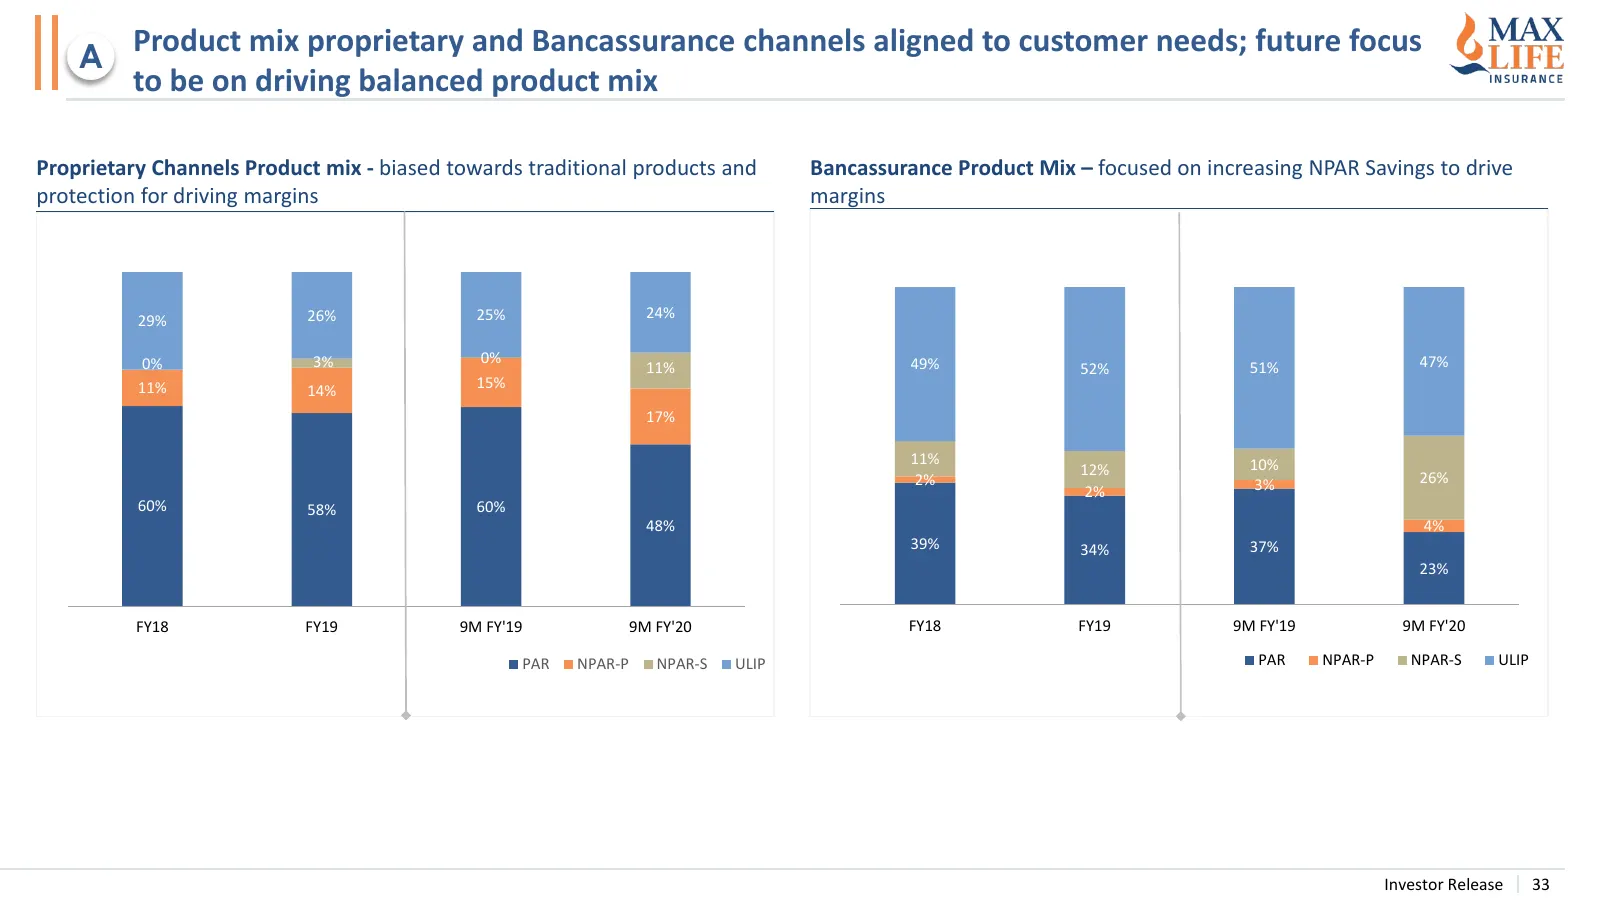
Slide 33: Product mix across proprietary and Bancassurance channels
Product mix proprietary and Bancassurance channels aligned to customer needs; future focus A to be on driving balanced product mix Proprietary Channels Product mix - biased towards traditional products and Bancassurance Product Mix – focused on increasing NPAR Savings to drive protection for driving
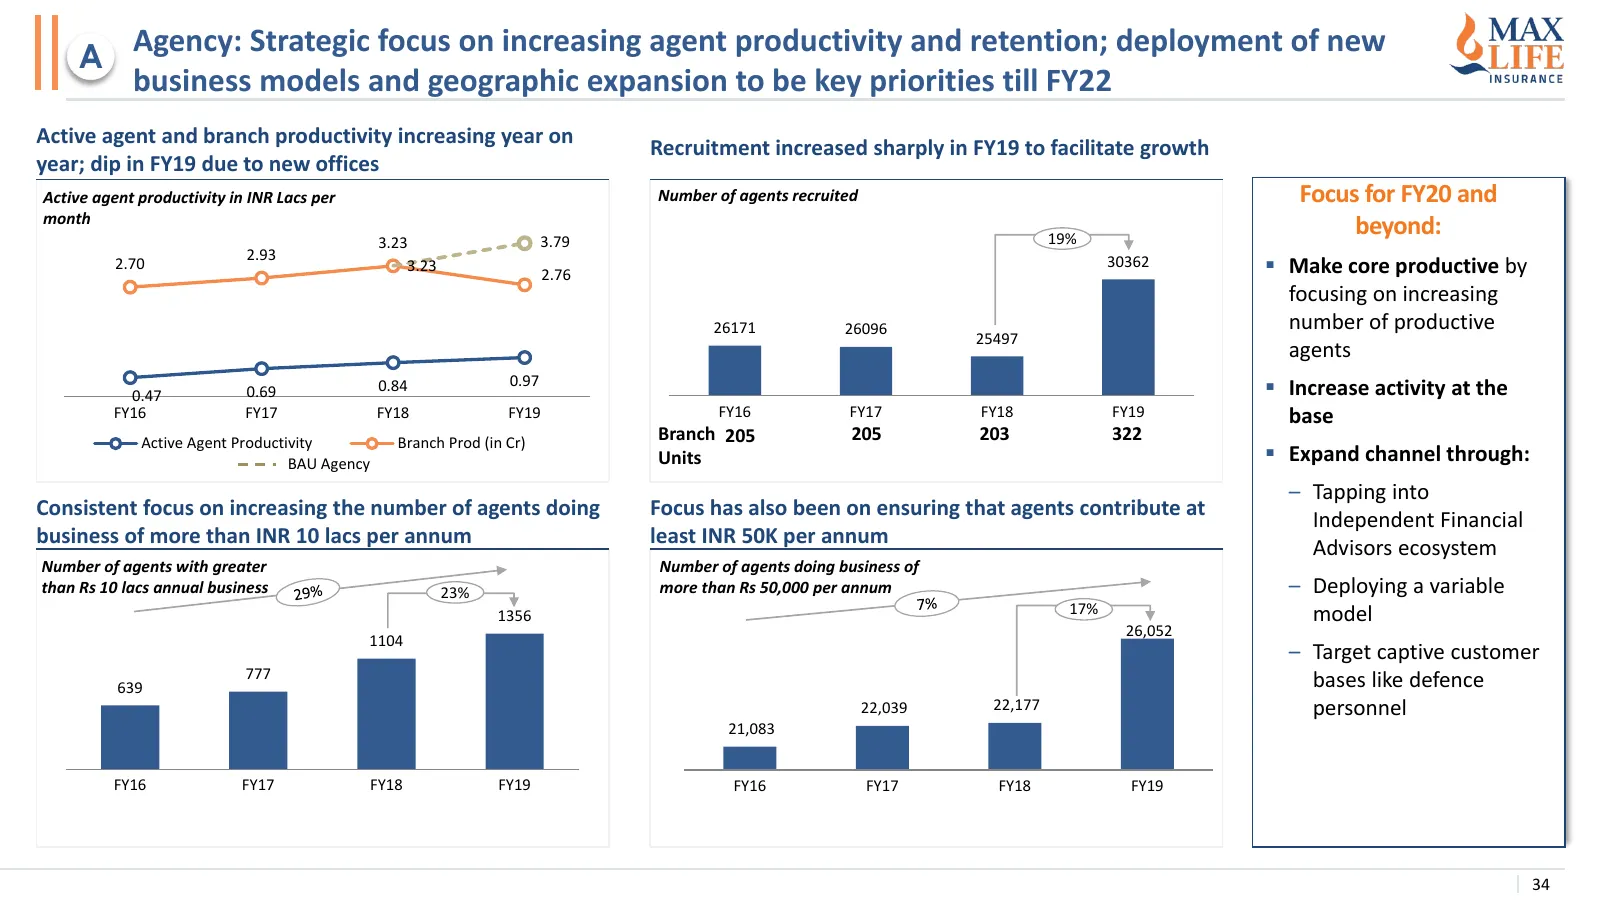
Slide 34: Agency: increasing agent productivity and retention
Agency: Strategic focus on increasing agent productivity and retention; deployment of new A business models and geographic expansion to be key priorities till FY22 Active agent and branch productivity increasing year on Recruitment increased sharply in FY19 to facilitate growth year; dip in FY19 due
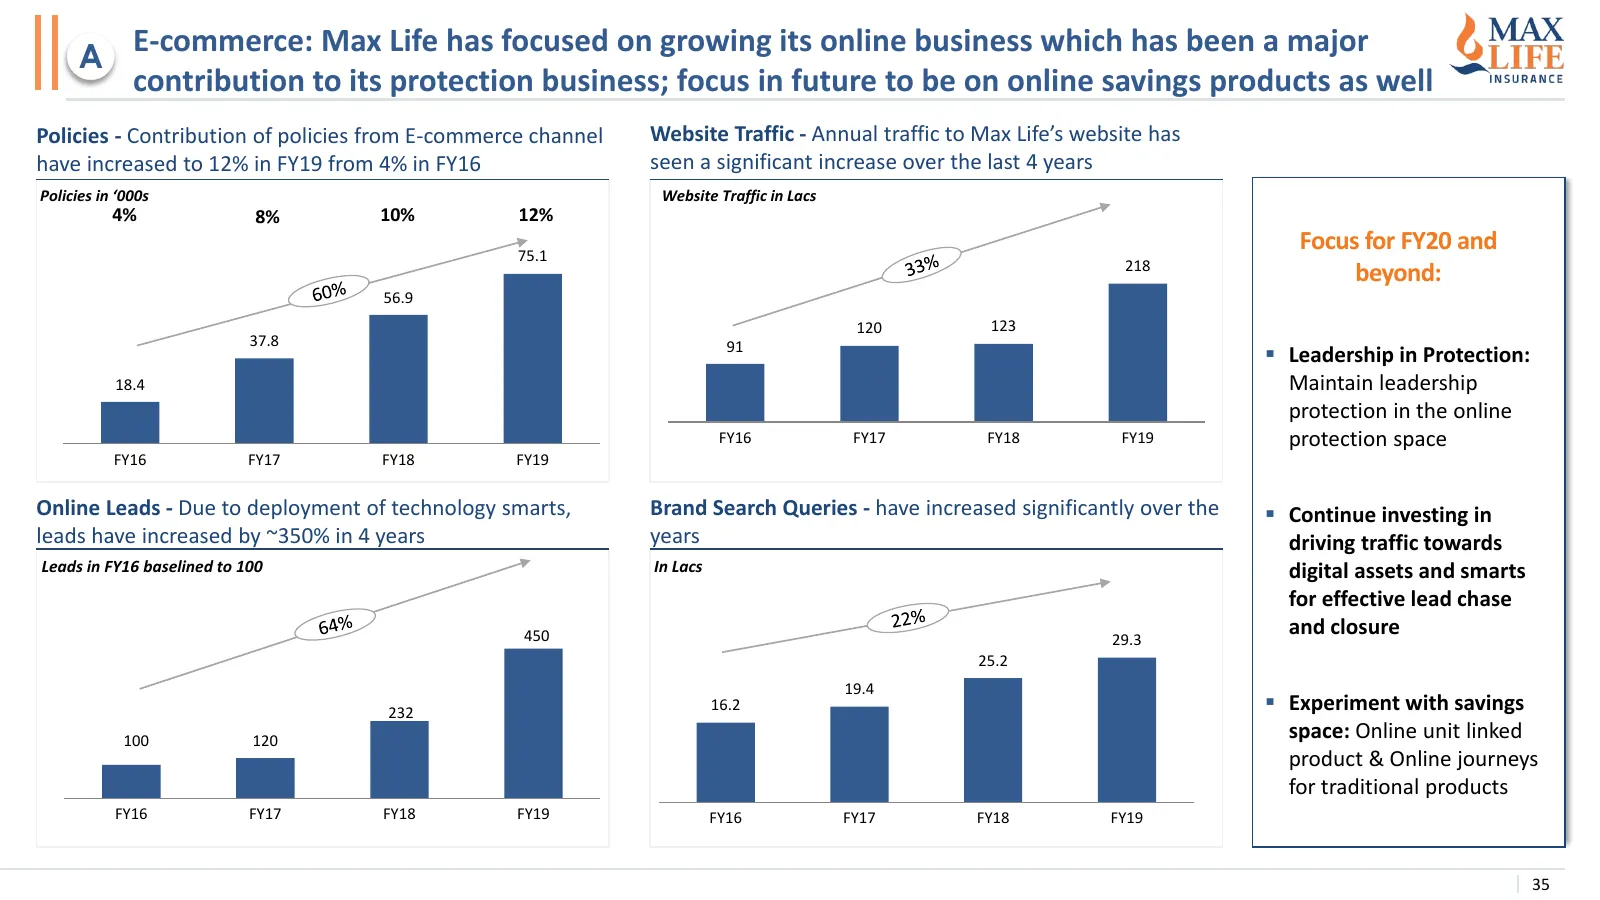
Slide 35: E-commerce: growing online business
E-commerce: Max Life has focused on growing its online business which has been a major A contribution to its protection business; focus in future to be on online savings products as well Policies - Contribution of policies from E-commerce channel Website Traffic - Annual traffic to Max Life’s websit
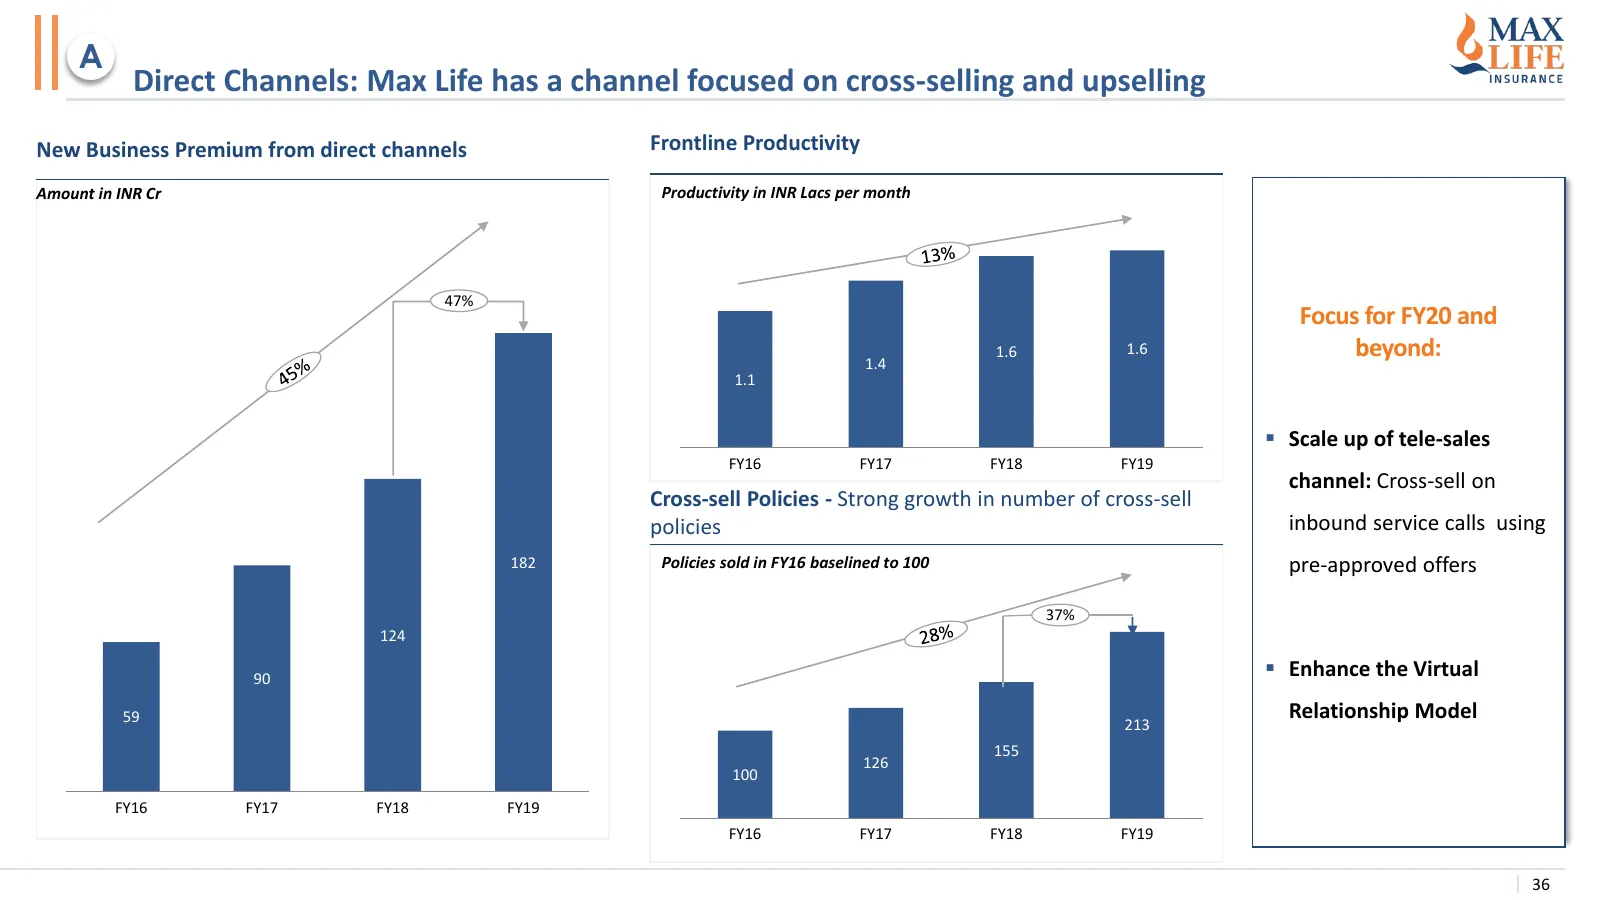
Slide 36: Direct Channels: cross-selling and upselling
A Direct Channels: Max Life has a channel focused on cross-selling and upselling New Business Premium from direct channels Frontline Productivity Amount in INR Cr Productivity in INR Lacs per month 47% Focus for FY20 and 1.6 1.6 beyond: 1.4 1.1 ▪ Scale up of tele-sales FY16 FY17 FY18 FY19 channel: C
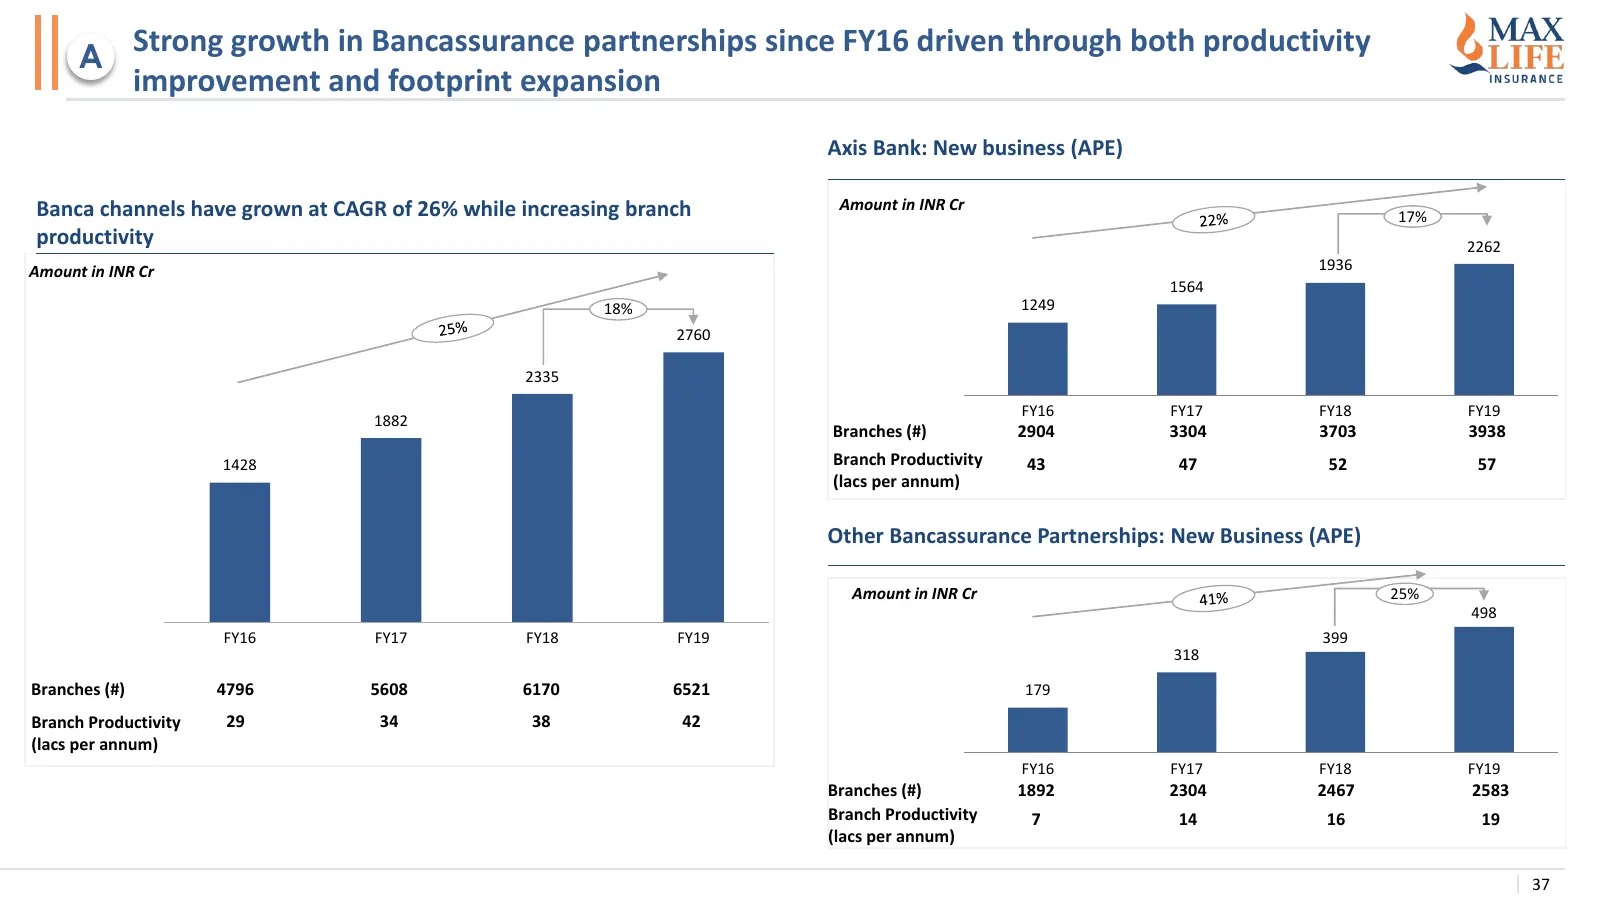
Slide 37: Strong growth in Bancassurance partnerships since FY16
Strong growth in Bancassurance partnerships since FY16 driven through both productivity A improvement and footprint expansion Axis Bank: New business (APE) Banca channels have grown at CAGR of 26% while increasing branch Amount in INR Cr 17% productivity 2262 Amount in INR Cr 1936 1564 18% 1249 2760
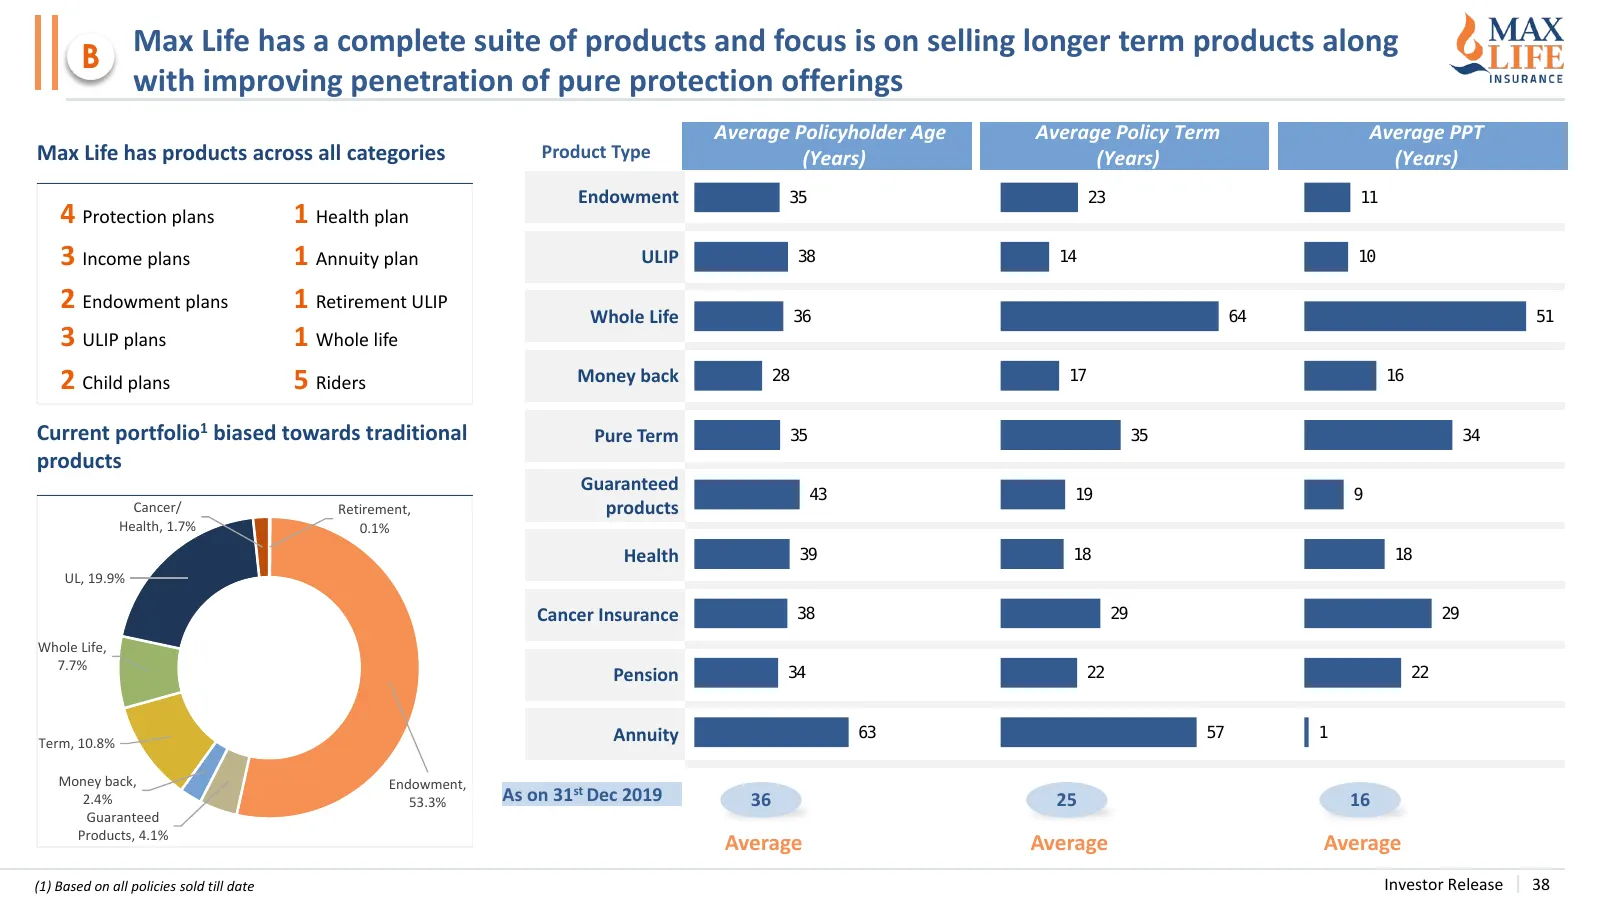
Slide 38: Complete suite of products
Max Life has a complete suite of products and focus is on selling longer term products along B with improving penetration of pure protection offerings Average Policyholder Age Average Policy Term Average PPT Max Life has products across all categories Product Type (Years) (Years) (Years) Endowment 3
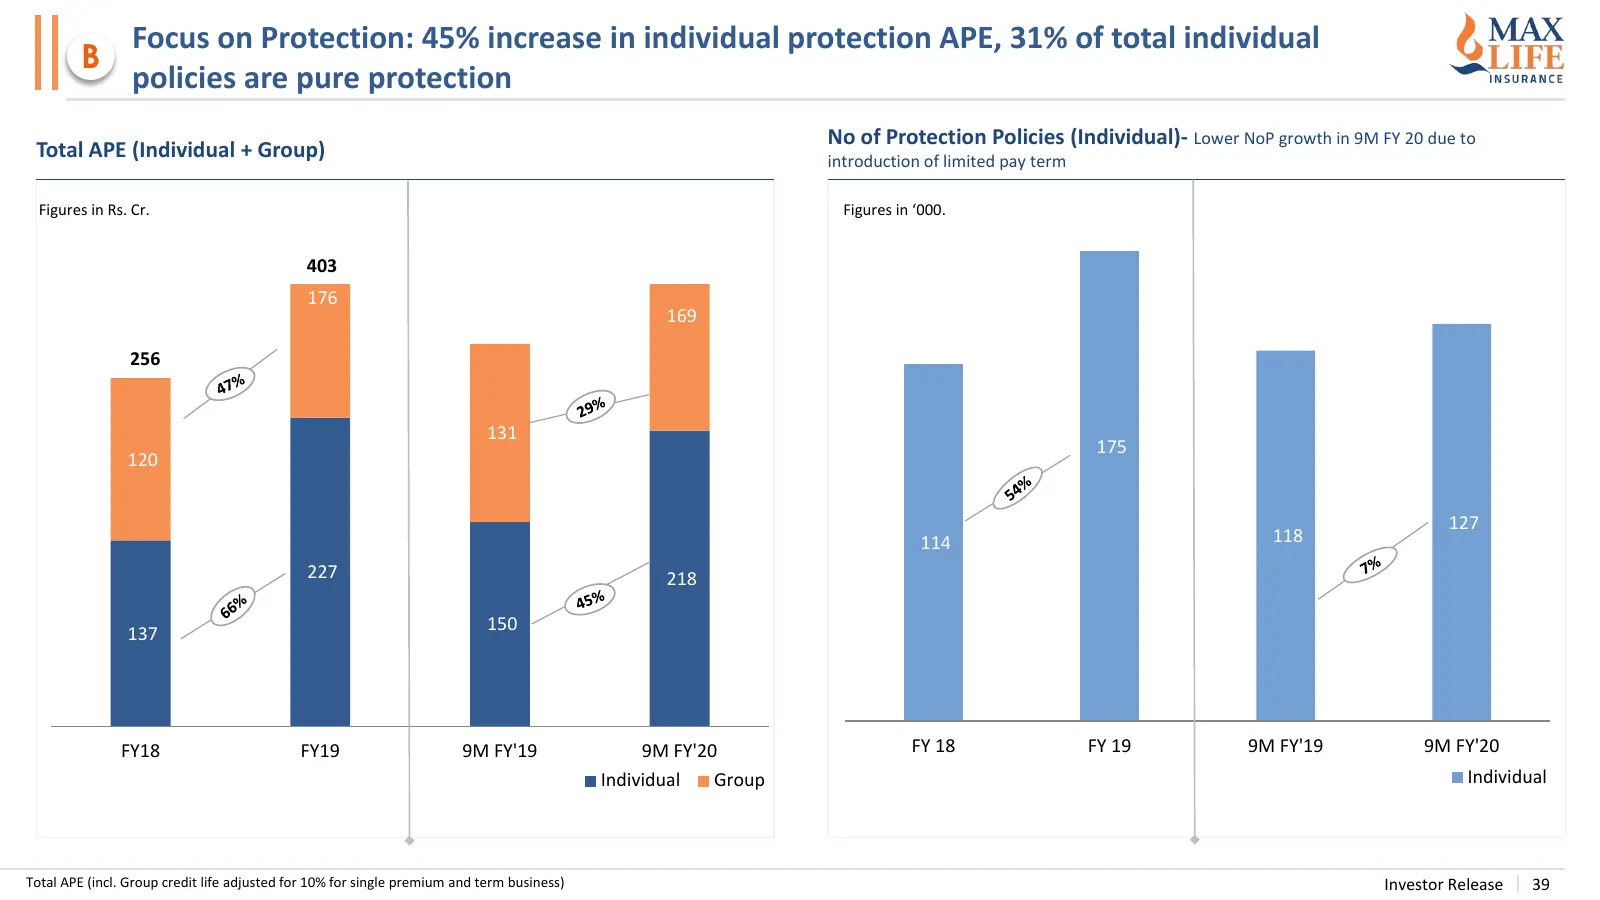
Slide 39: Focus on Protection
Focus on Protection: 45% increase in individual protection APE, 31% of total individual B policies are pure protection No of Protection Policies (Individual)- Lower NoP growth in 9M FY 20 due to Total APE (Individual + Group) introduction of limited pay term Figures in Rs. Cr. Figures in ‘000. 403 1
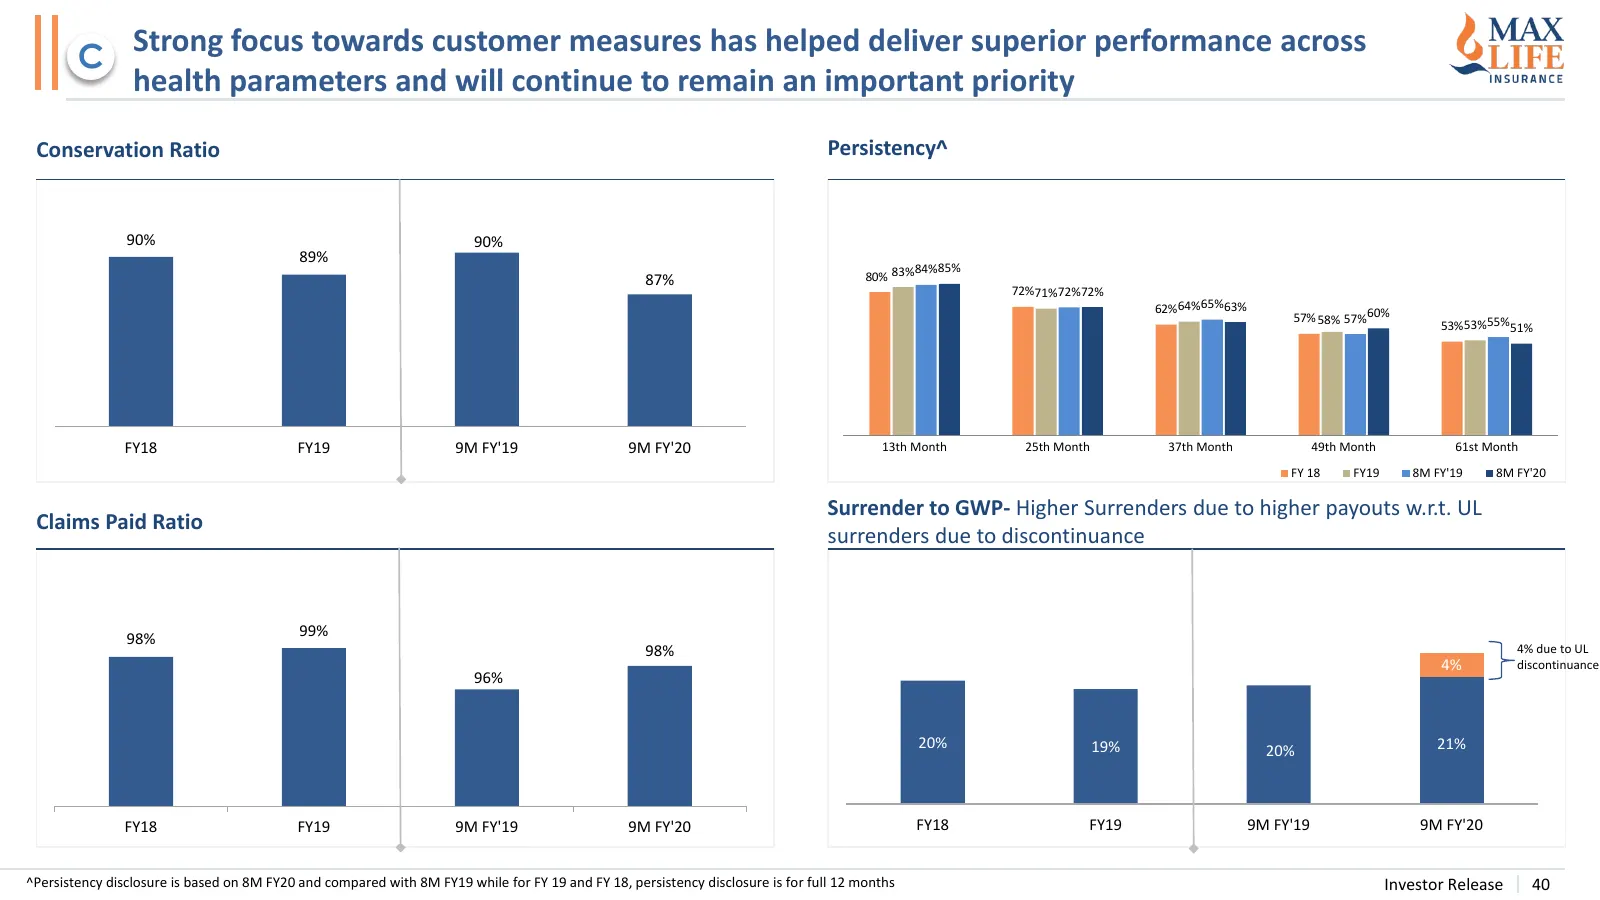
Slide 40: Customer measures drive superior performance
Strong focus towards customer measures has helped deliver superior performance across C health parameters and will continue to remain an important priority Conservation Ratio Persistency^ 90% 90% 89% 84%85% 87% 80% 83% 72% 71%72%72% 62% 64%65%63% 57% 58% 57%60% 53% 53%55%51% FY18 FY19 9M FY'19 9M FY
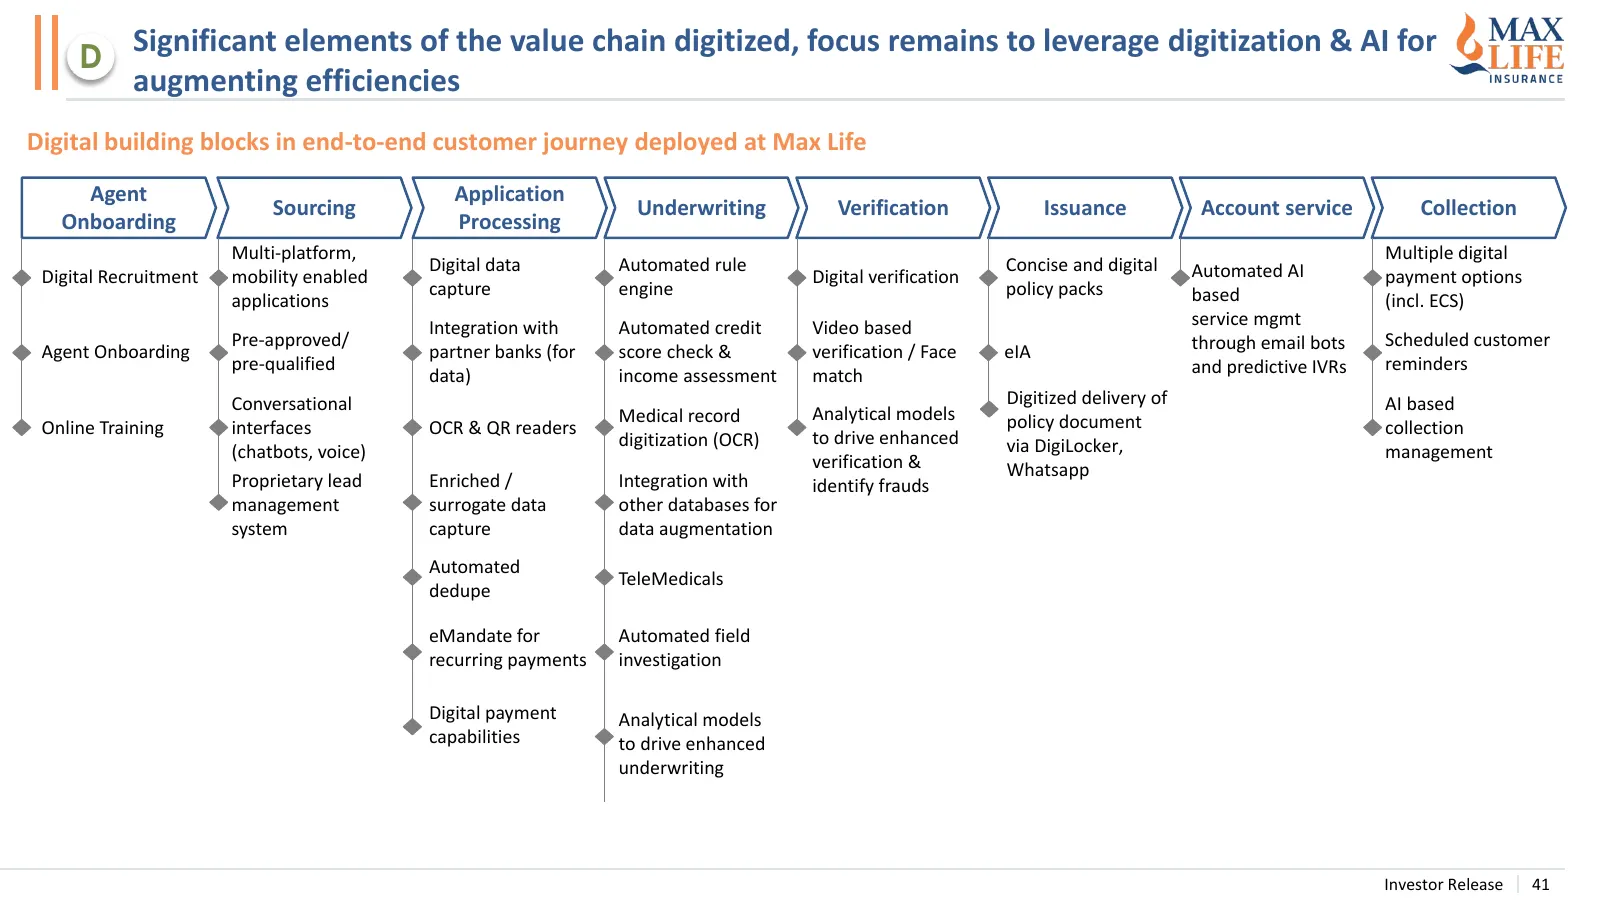
Slide 41: Value chain digitized; leveraging digitization and AI
Significant elements of the value chain digitized, focus remains to leverage digitization & AI for D augmenting efficiencies Digital building blocks in end-to-end customer journey deployed at Max Life Agent Application Sourcing Underwriting Verification Issuance Account service Collection Onboarding
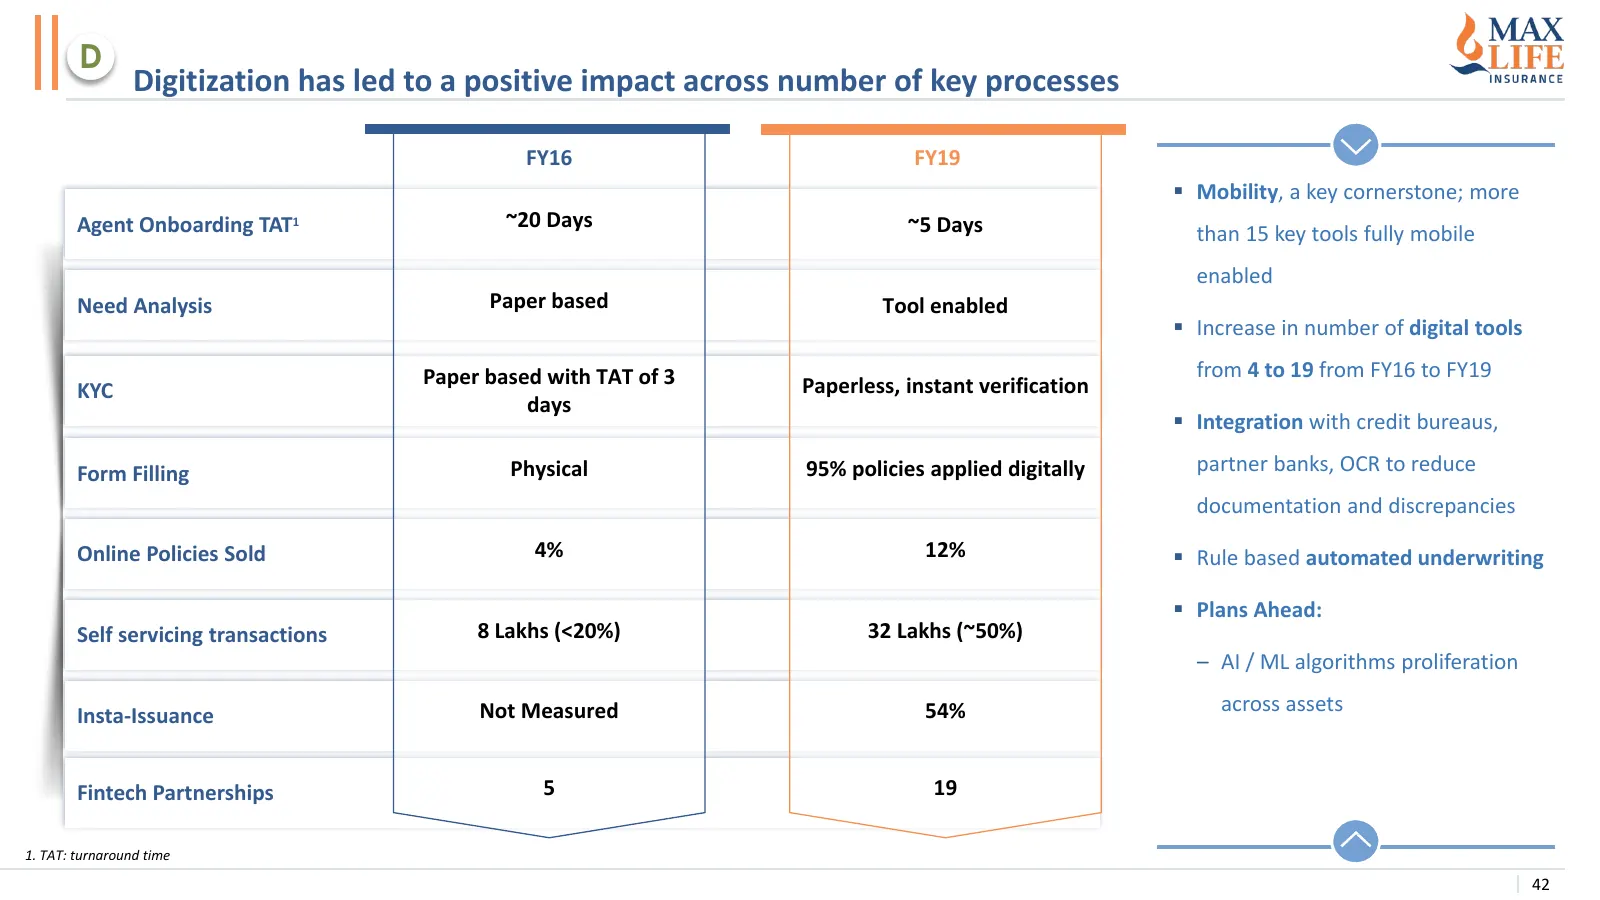
Slide 42: Digitization has positive impact across key processes
D Digitization has led to a positive impact across number of key processes FY16 FY19 ▪ Mobility, a key cornerstone; more Agent Onboarding TAT1 ~20 Days ~5 Days than 15 key tools fully mobile enabled Need Analysis Paper based Tool enabled ▪ Increase in number of digital tools Paper based with TAT of
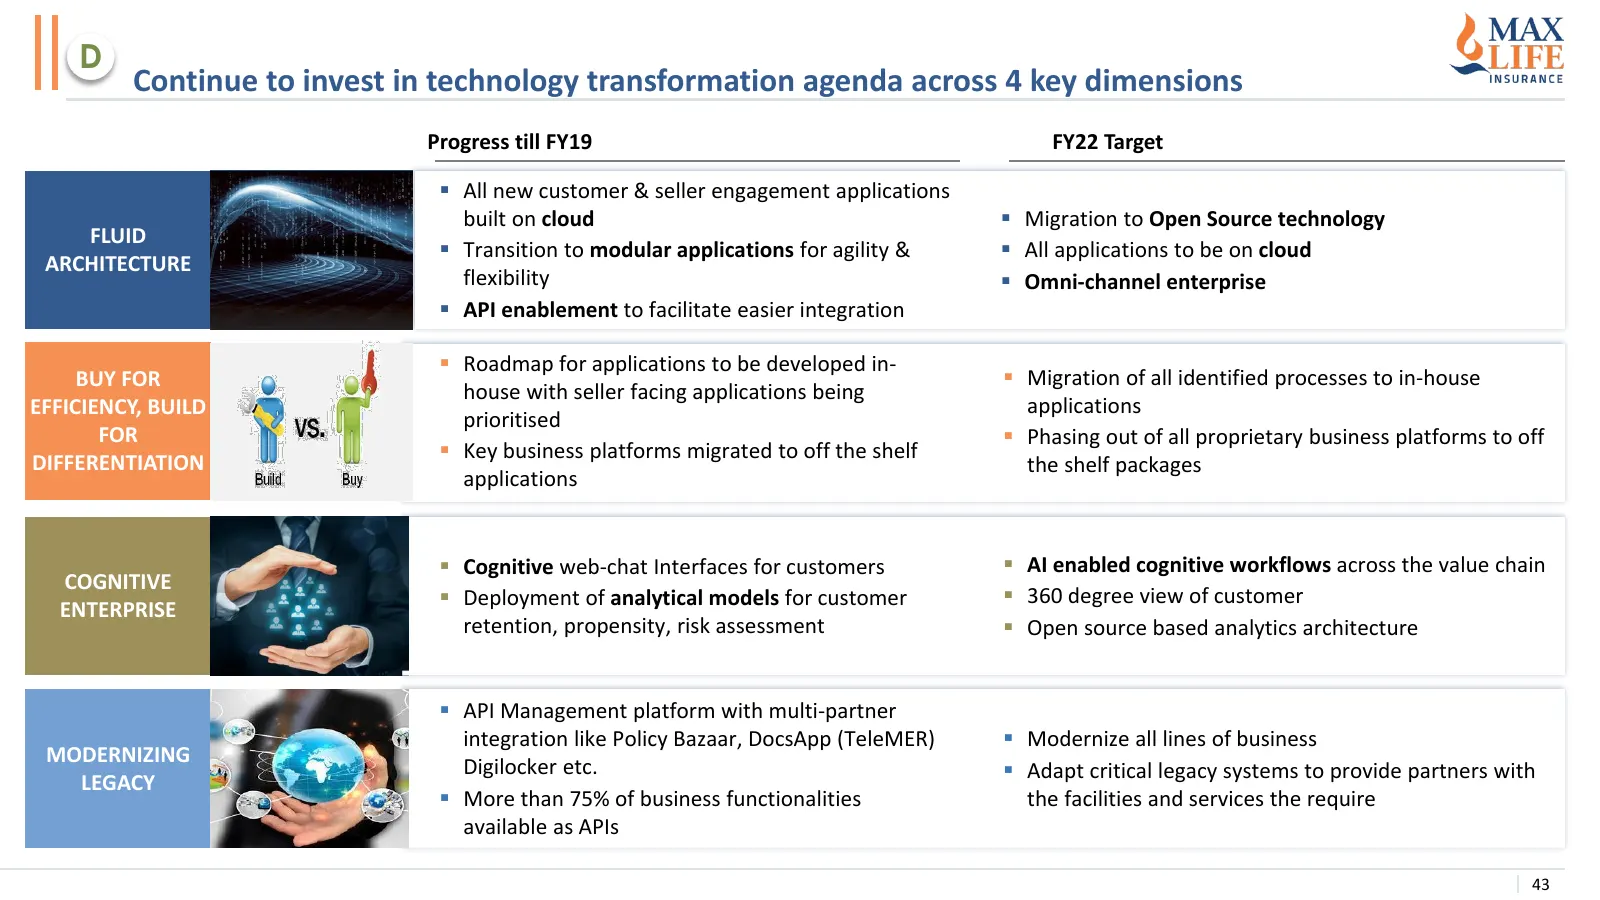
Slide 43: Technology transformation agenda across 4 key dimensions
D Continue to invest in technology transformation agenda across 4 key dimensions Progress till FY19 FY22 Target ▪ All new customer & seller engagement applications built on cloud ▪ Migration to Open Source technology FLUID ▪ Transition to modular applications for agility & ▪ All applications to be o
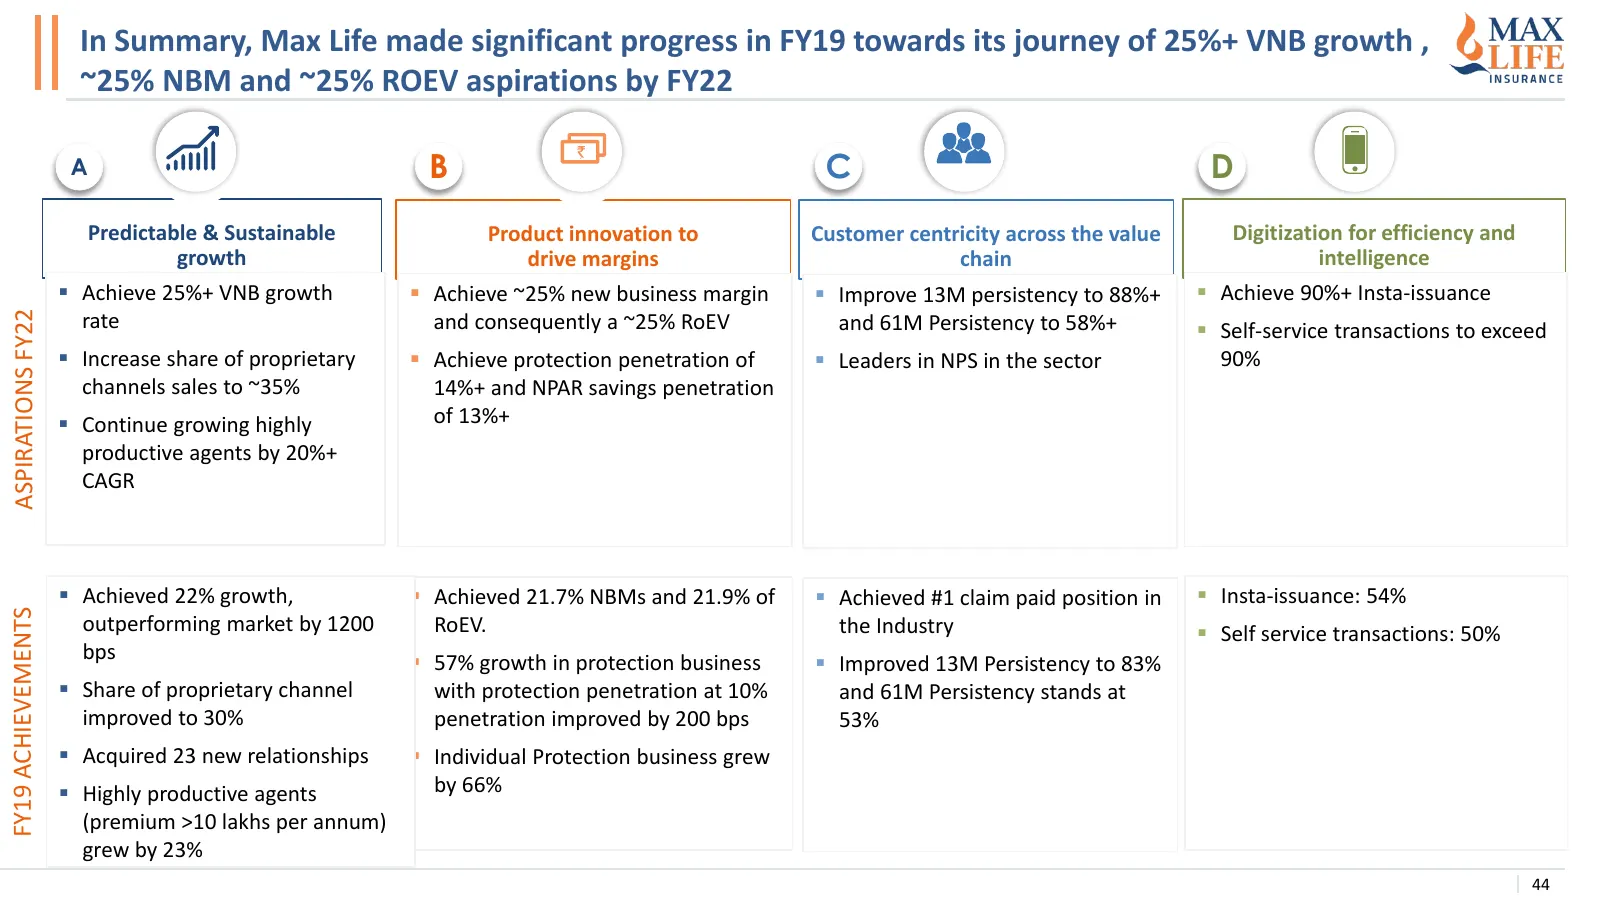
Slide 44: FY19 Achievements
In Summary, Max Life made significant progress in FY19 towards its journey of 25%+ VNB growth , ~25% NBM and ~25% ROEV aspirations by FY22 A B C D Predictable & Sustainable Product innovation to Customer centricity across the value Digitization for efficiency and growth drive margins chain intellige
Slide 45: Section IV: Max Life Insurance – MCEV Disclosures 9M FY'20
SECTION IV Max Life Insurance – MCEV Disclosures: 9M FY’20
Slide 46: Key Results
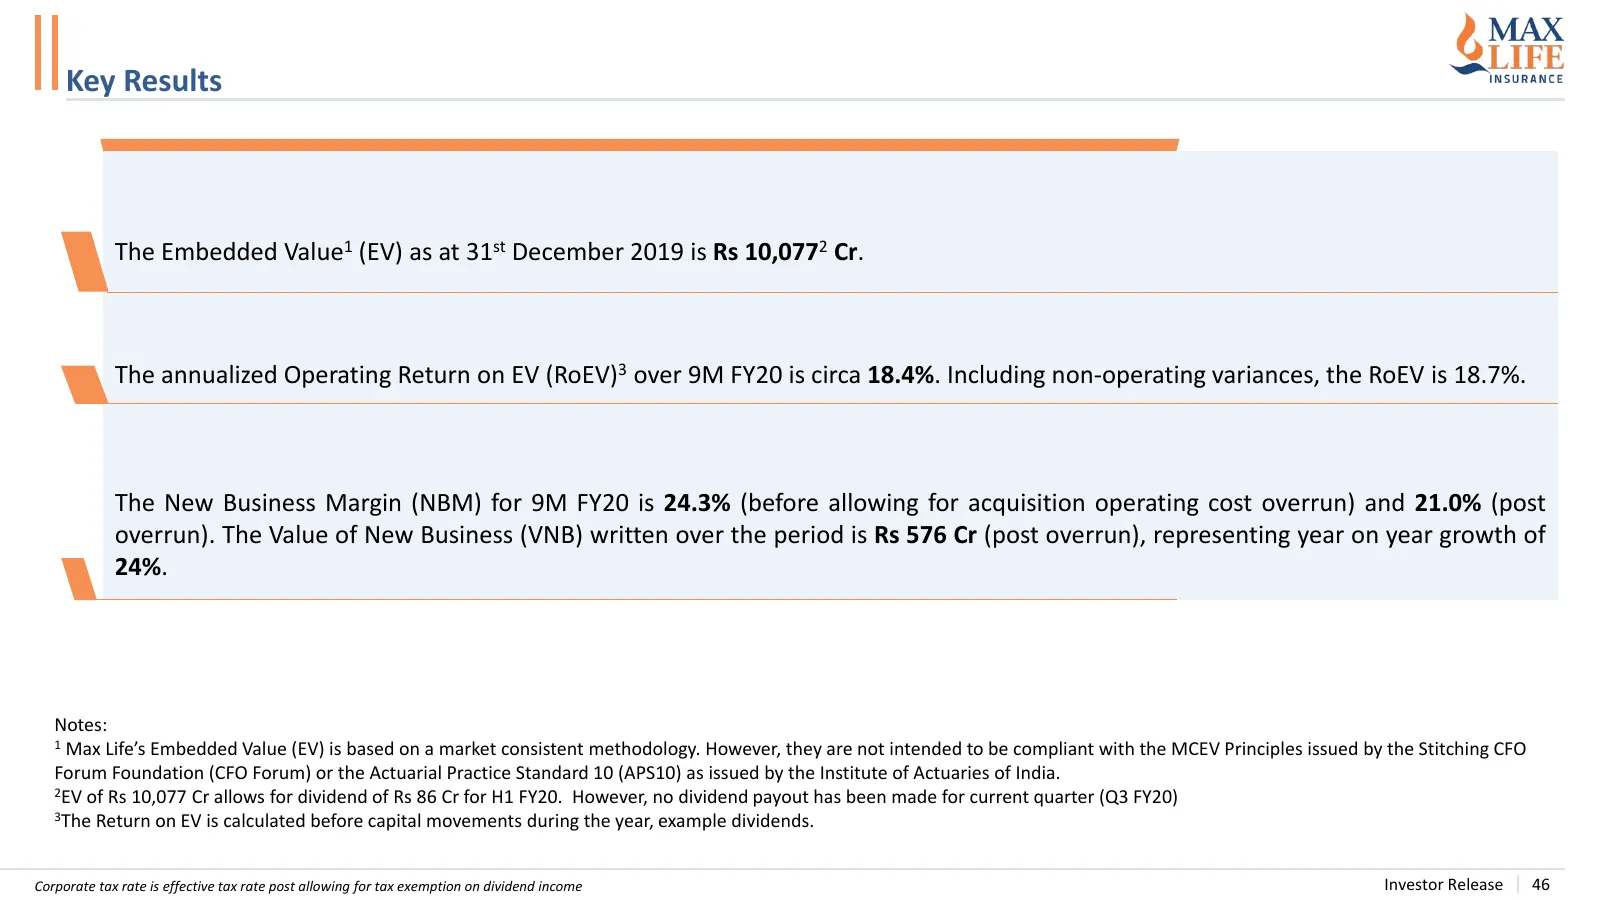
Key Results The Embedded Value1 (EV) as at 31st December 2019 is Rs 10,0772 Cr. The annualized Operating Return on EV (RoEV)3 over 9M FY20 is circa 18.4%. Including non-operating variances, the RoEV is 18.7%. The New Business Margin (NBM) for 9M FY20 is 24.3% (before allowing for acquisition operati
Slide 47: Components of the EV as at 31 December 2019
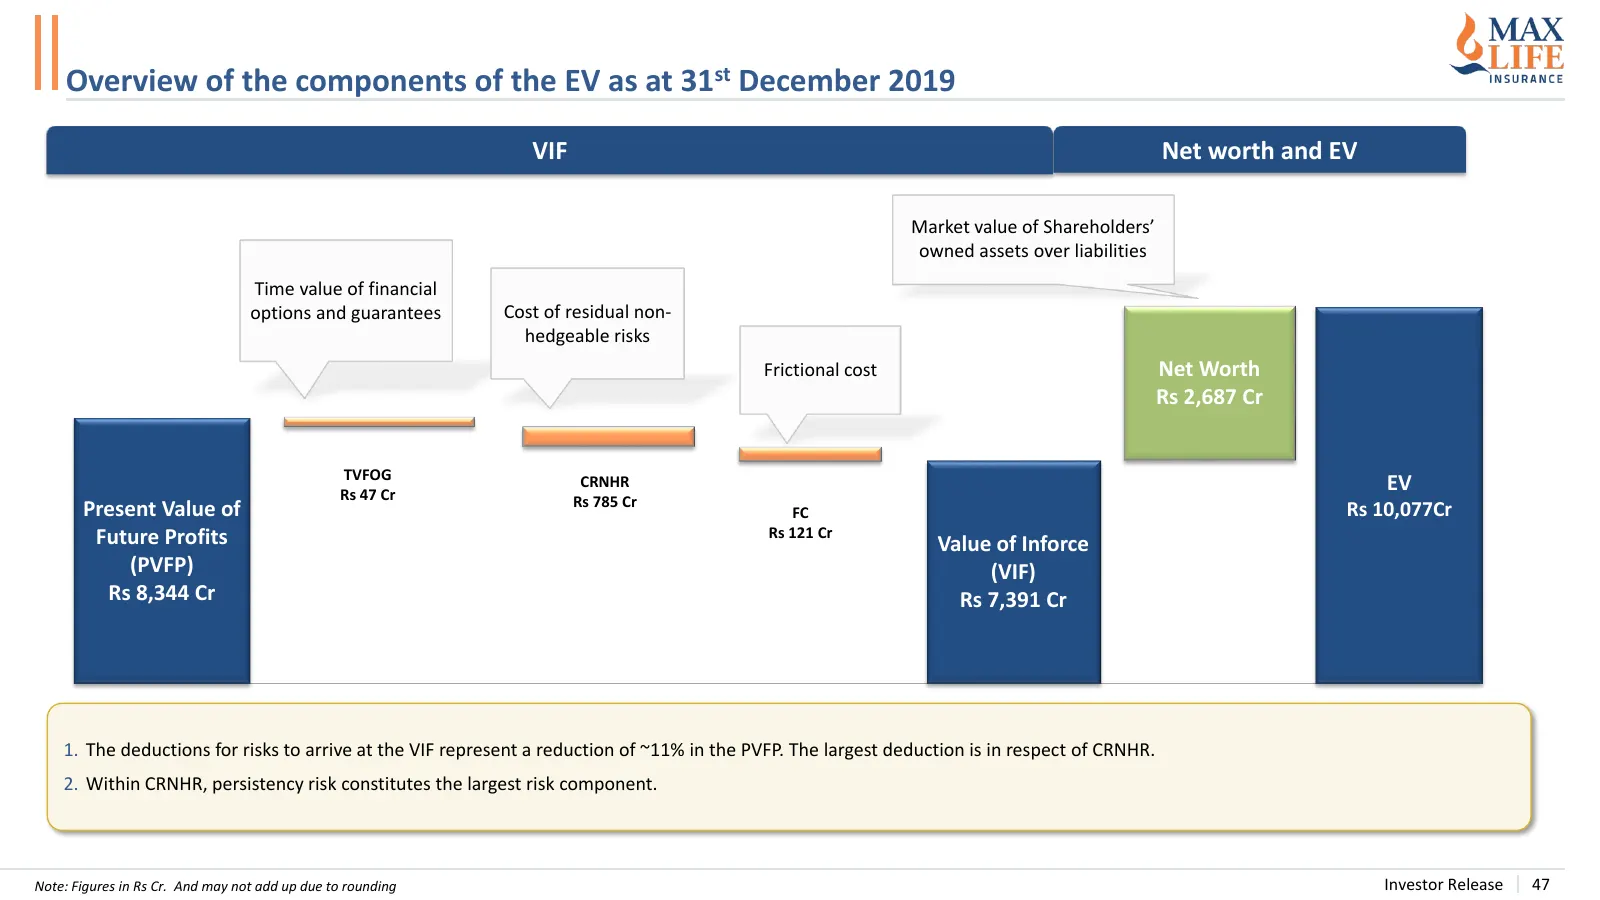
Overview of the components of the EV as at 31st December 2019 VIF Net worth and EV Market value of Shareholders’ owned assets over liabilities Time value of financial options and guarantees Cost of residual non- hedgeable risks Frictional cost Net Worth Rs 2,687 Cr TVFOG Rs 47 Cr CRNHR EV Rs 785 Cr
Slide 48: Value of New Business and New Business Margins
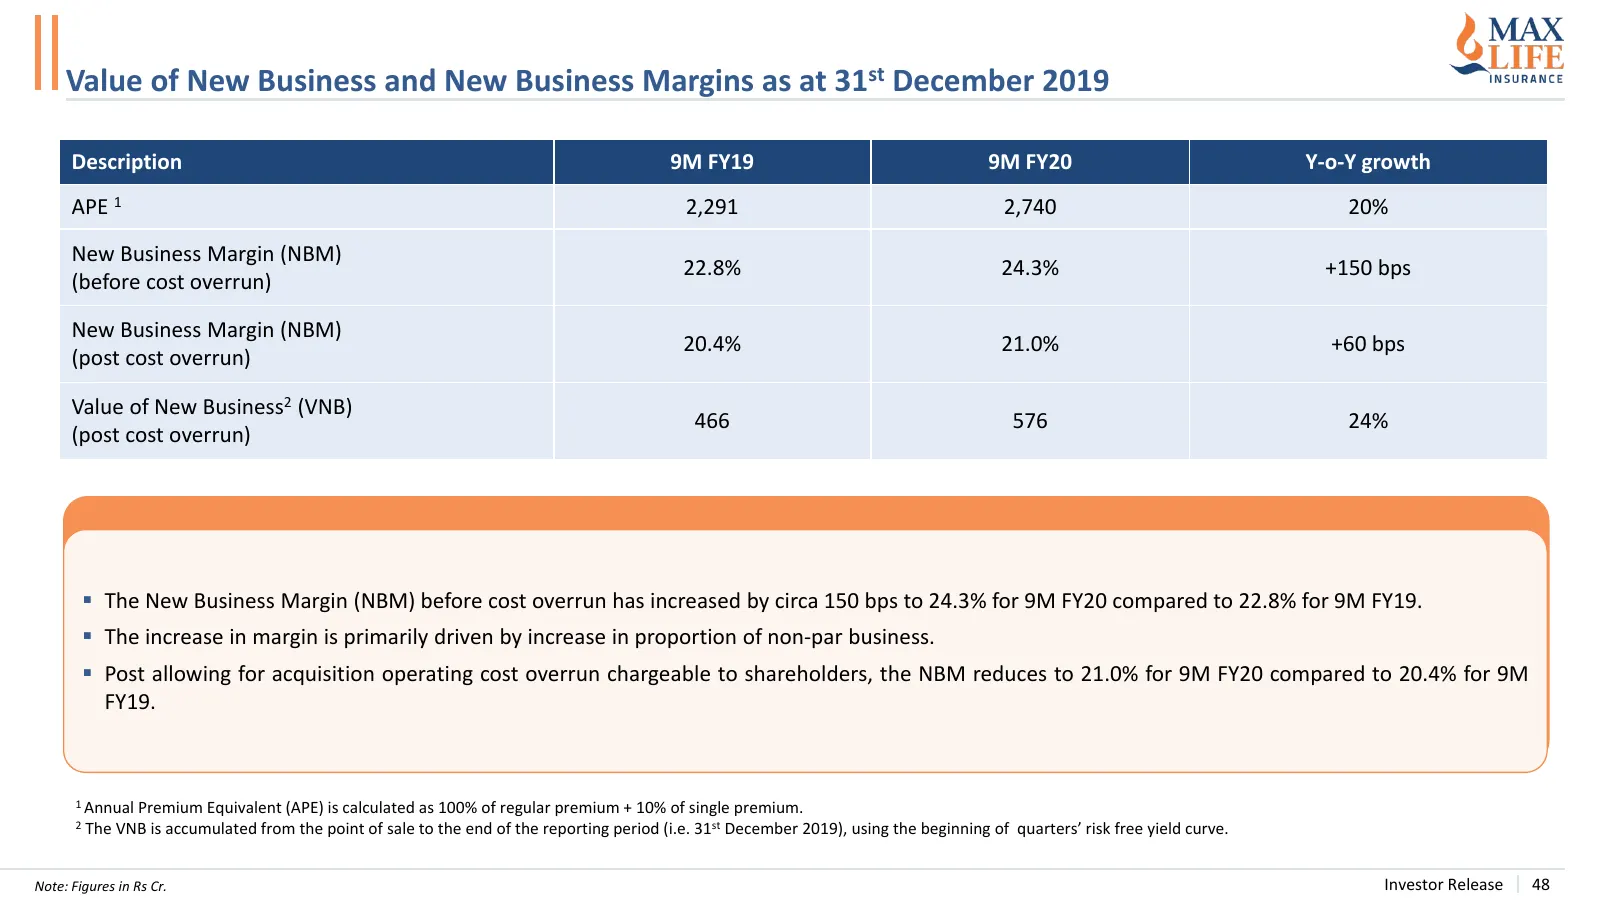
Value of New Business and New Business Margins as at 31st December 2019 Description 9M FY19 9M FY20 Y-o-Y growth APE 1 2,291 2,740 20% New Business Margin (NBM) 22.8% 24.3% +150 bps (before cost overrun) New Business Margin (NBM) 20.4% 21.0% +60 bps (post cost overrun) Value of New Business2 (VNB) 4
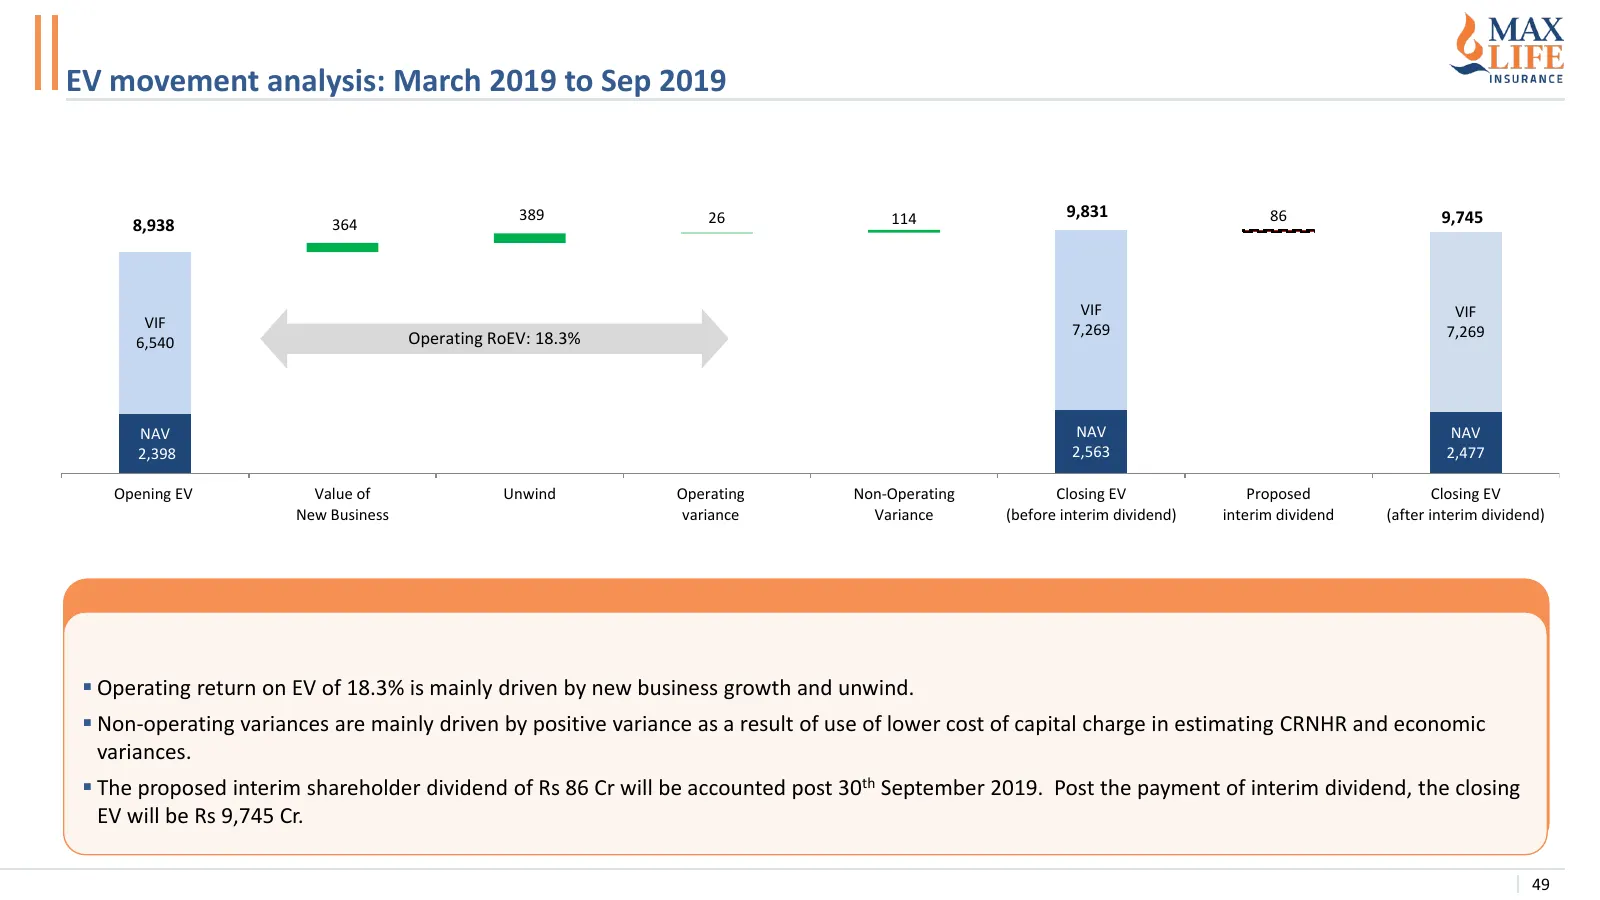
Slide 49: EV movement analysis: March 2019 to Sep 2019
EV movement analysis: March 2019 to Sep 2019 389 26 114 9,831 86 9,745 8,938 364 VIF VIF VIF 7,269 Operating RoEV: 18.3% 7,269 6,540 NAV NAV NAV NAV NAV NAV NAV NAV 2,398 2,563 2,477 Opening EV Value of Unwind Operating Non-Operating Closing EV Proposed Closing EV New Business variance Variance (bef
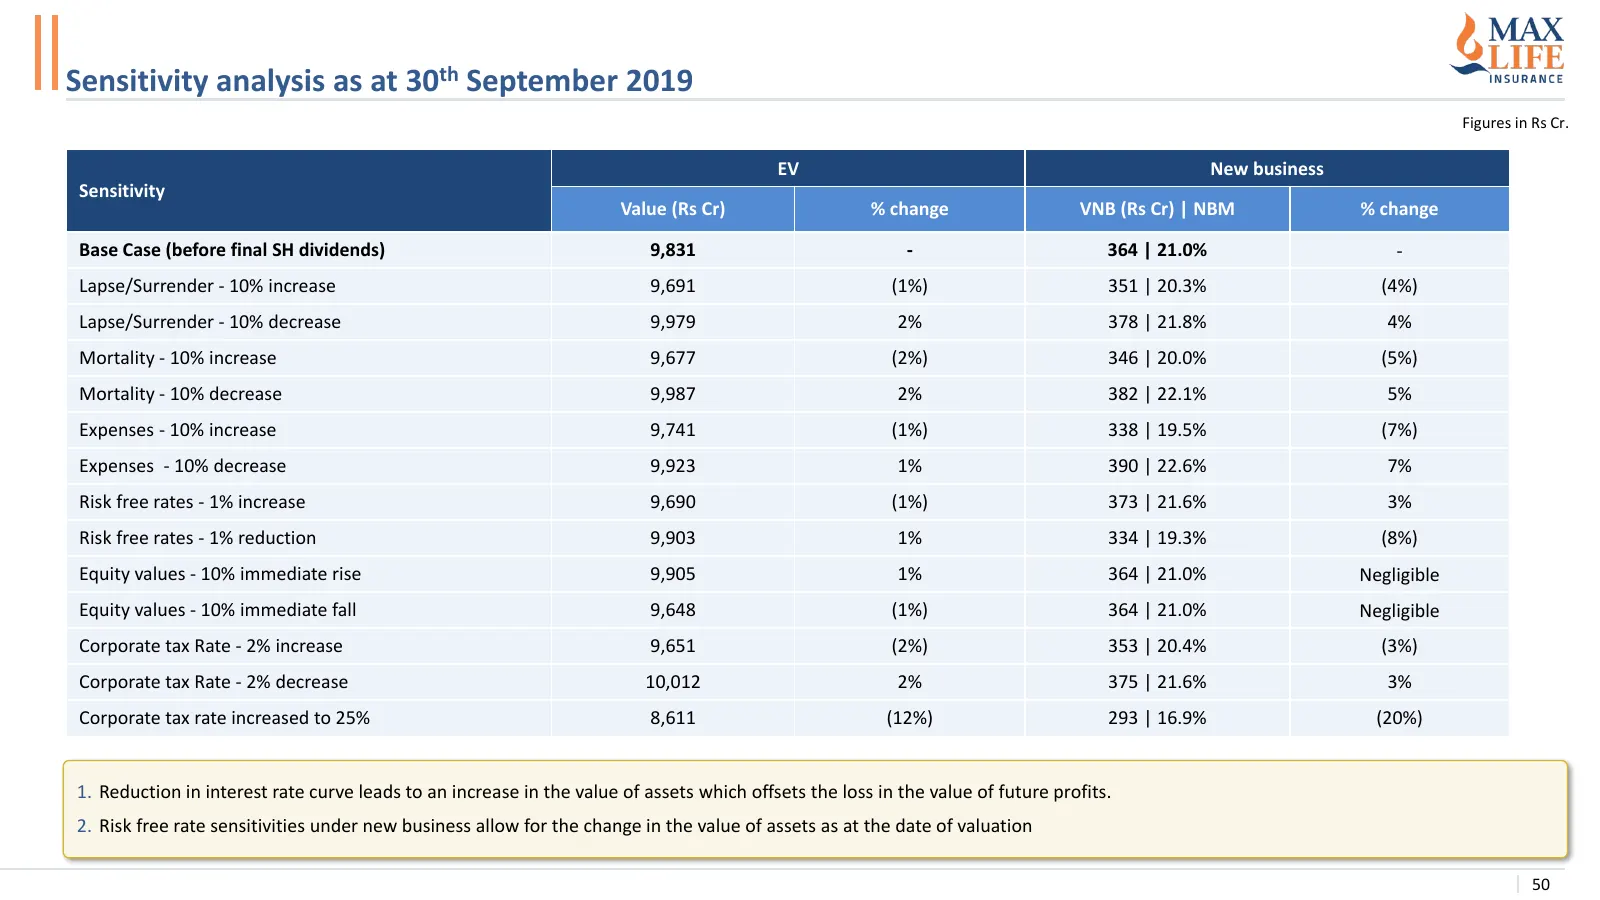
Slide 50: Sensitivity analysis as at 30 September 2019
Sensitivity analysis as at 30th September 2019 Figures in Rs Cr. EV New business Sensitivity Value (Rs Cr) % change VNB (Rs Cr) | NBM % change Base Case (before final SH dividends) 9,831 - 364 | 21.0% - Lapse/Surrender - 10% increase 9,691 (1%) 351 | 20.3% (4%) Lapse/Surrender - 10% decrease 9,979 2

Slide 51: Max Insurance
MAX INSURANCE

Slide 52: Annexures
> ANNEXURES a
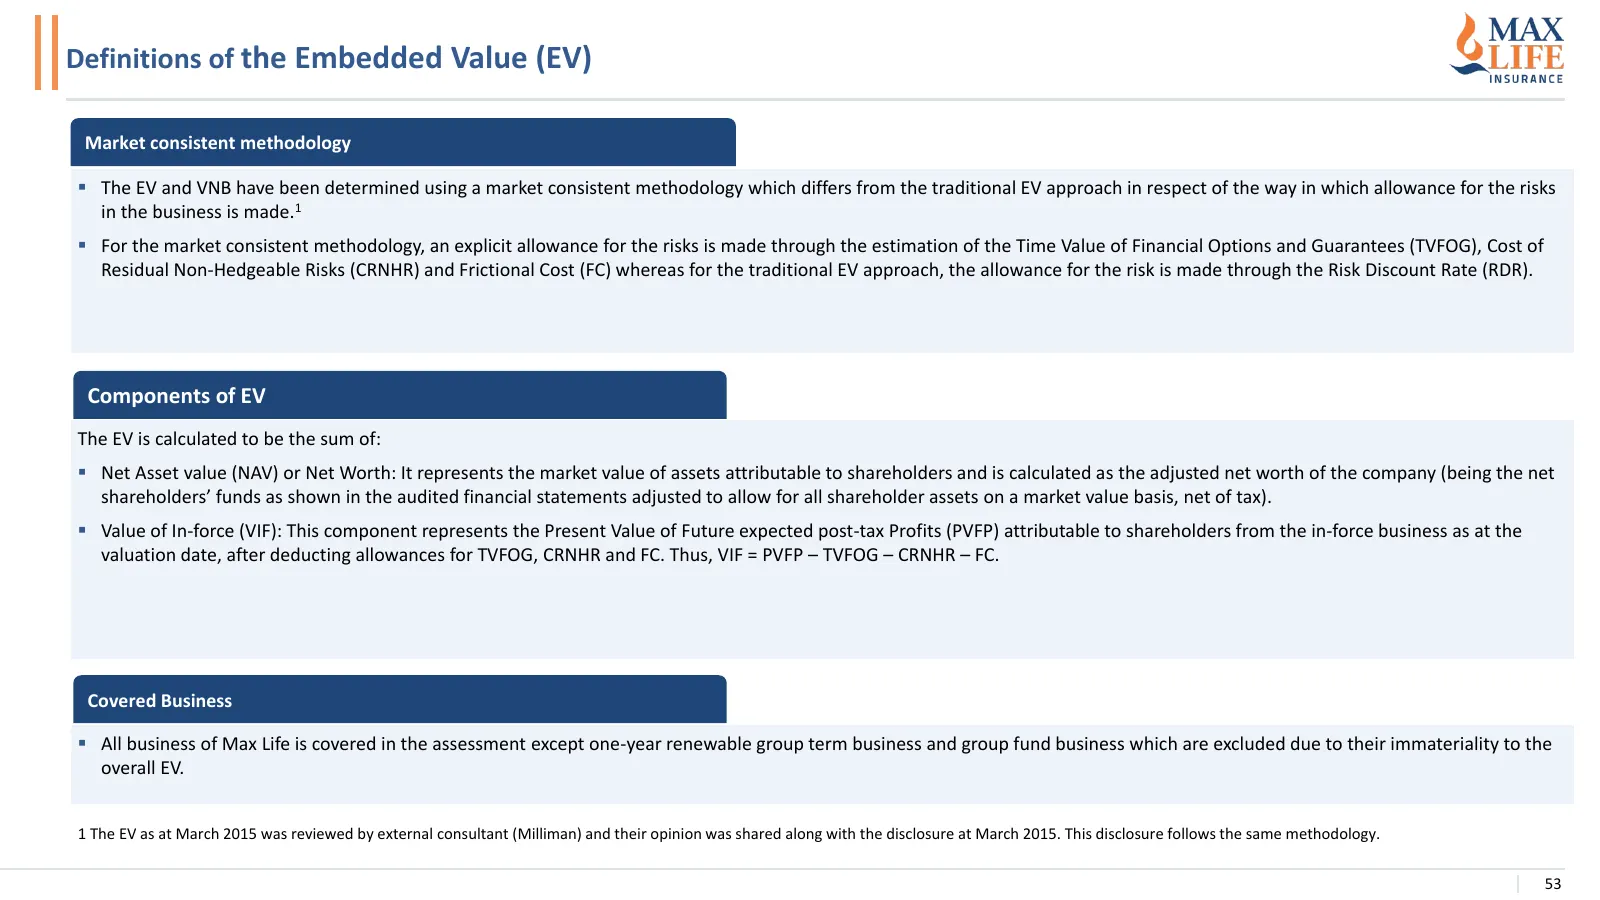
Slide 53: Definitions of the Embedded Value (EV)
Definitions of the Embedded Value (EV) Market consistent methodology ▪ The EV and VNB have been determined using a market consistent methodology which differs from the traditional EV approach in respect of the way in which allowance for the risks in the business is made.1 ▪ For the market consistent
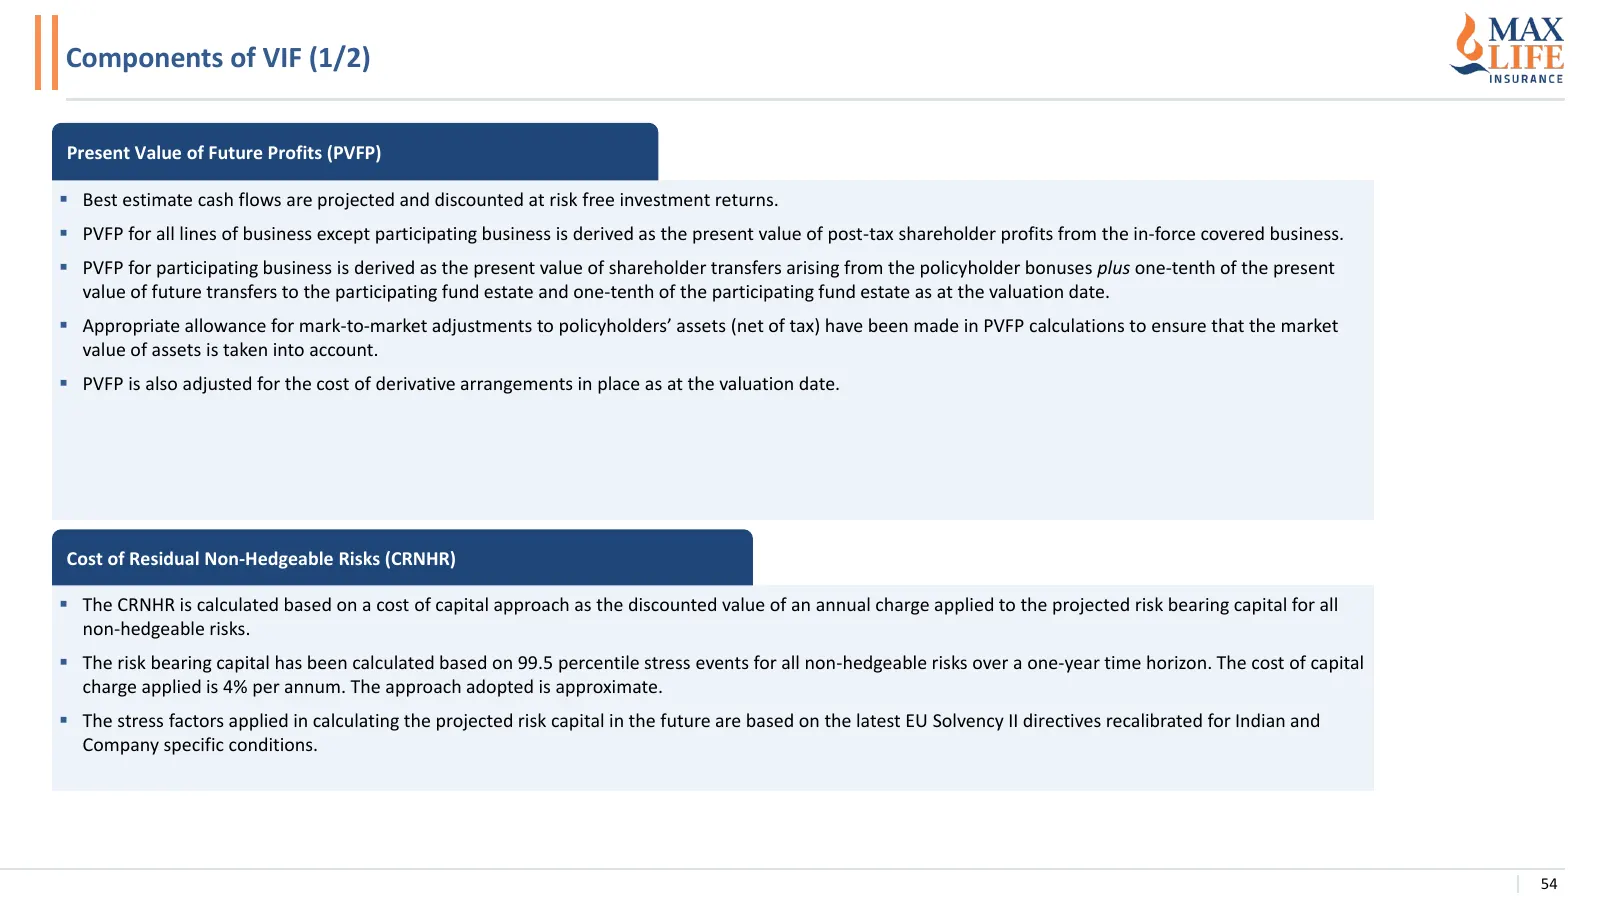
Slide 54: Components of VIF (1/2)
Components of VIF (1/2) Present Value of Future Profits (PVFP) ▪ Best estimate cash flows are projected and discounted at risk free investment returns. ▪ PVFP for all lines of business except participating business is derived as the present value of post-tax shareholder profits from the in-force cov
Slide 55: Components of VIF (2/2)
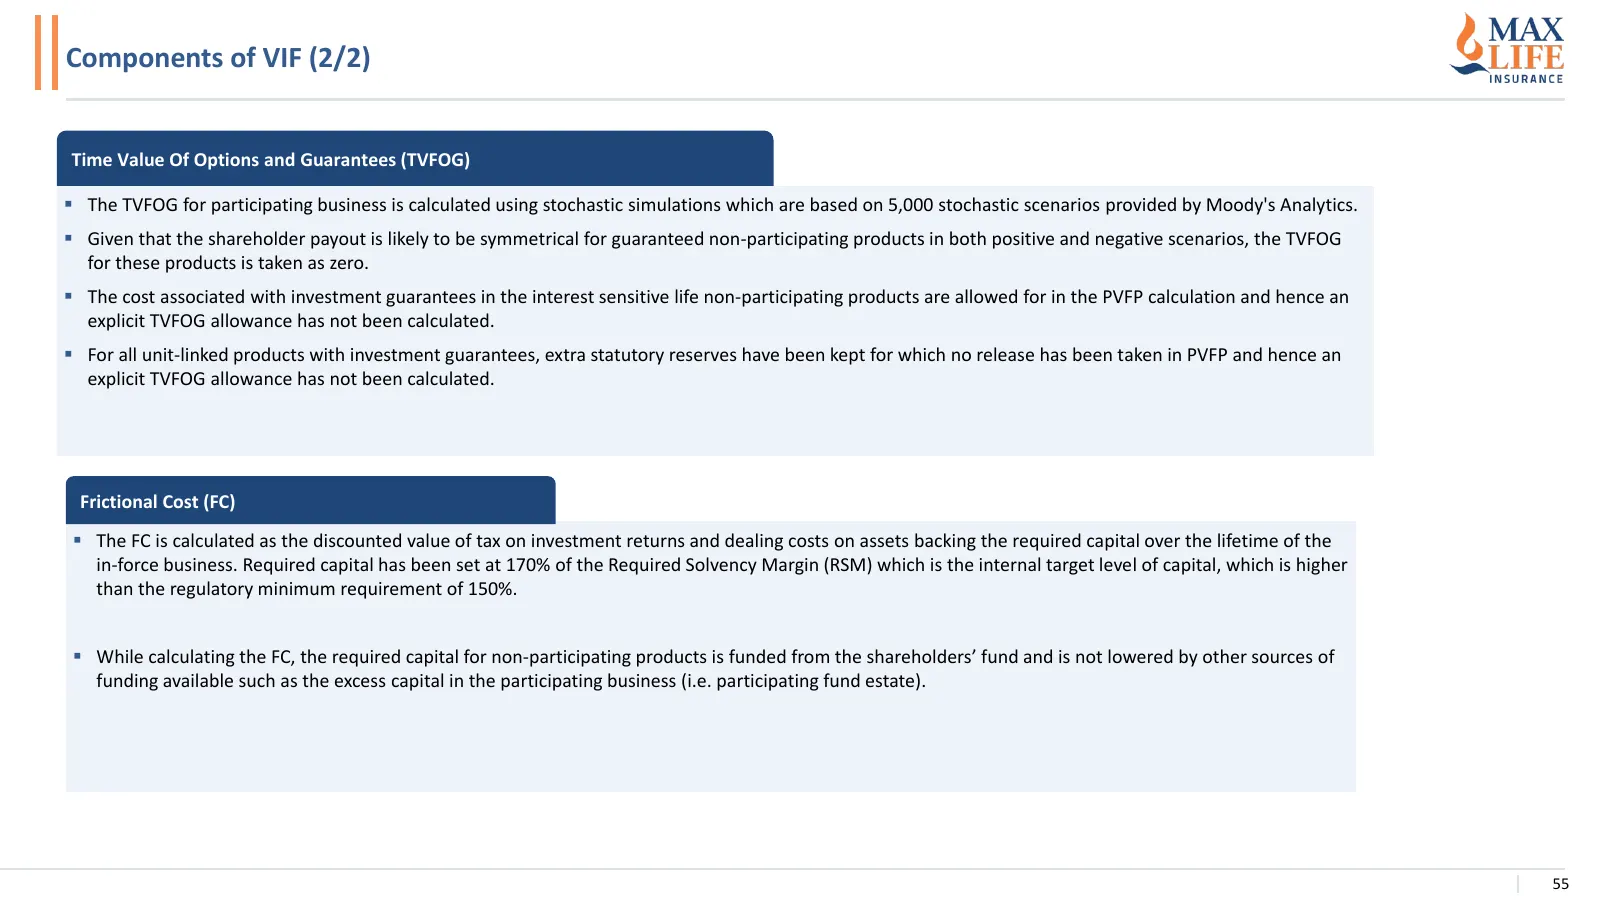
Components of VIF (2/2) Time Value Of Options and Guarantees (TVFOG) ▪ The TVFOG for participating business is calculated using stochastic simulations which are based on 5,000 stochastic scenarios provided by Moody's Analytics. ▪ Given that the shareholder payout is likely to be symmetrical for guar
Slide 56: Key Assumptions for the EV and VNB (1/2)
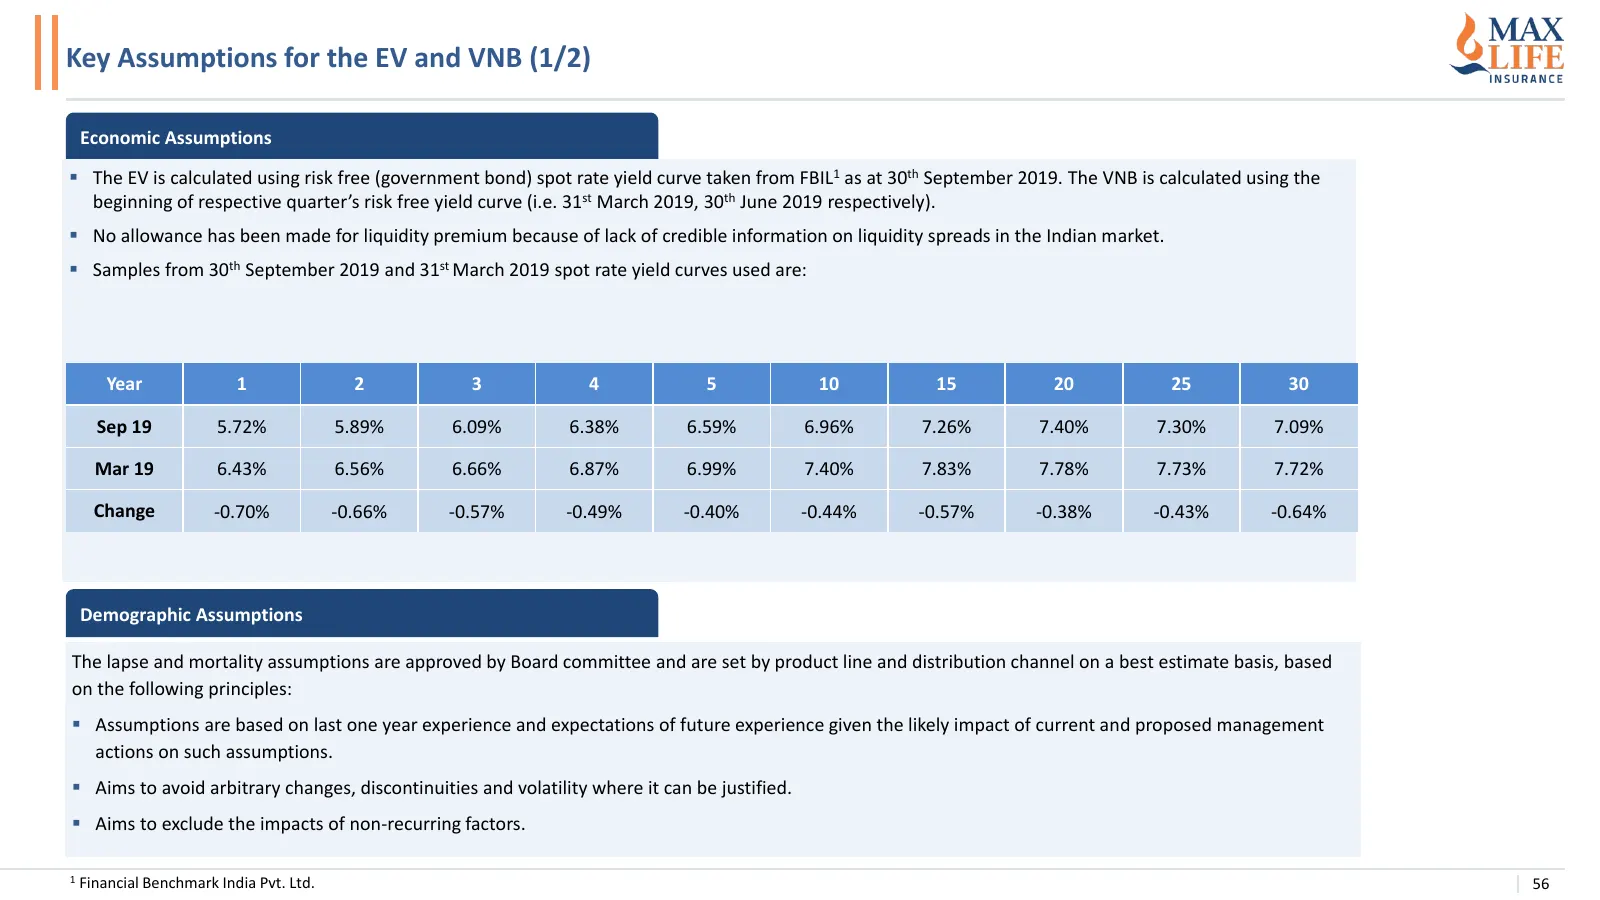
Key Assumptions for the EV and VNB (1/2) Economic Assumptions ▪ The EV is calculated using risk free (government bond) spot rate yield curve taken from FBIL1 as at 30th September 2019. The VNB is calculated using the beginning of respective quarter’s risk free yield curve (i.e. 31st March 2019, 30th
Slide 57: Key Assumptions for the EV and VNB (2/2)
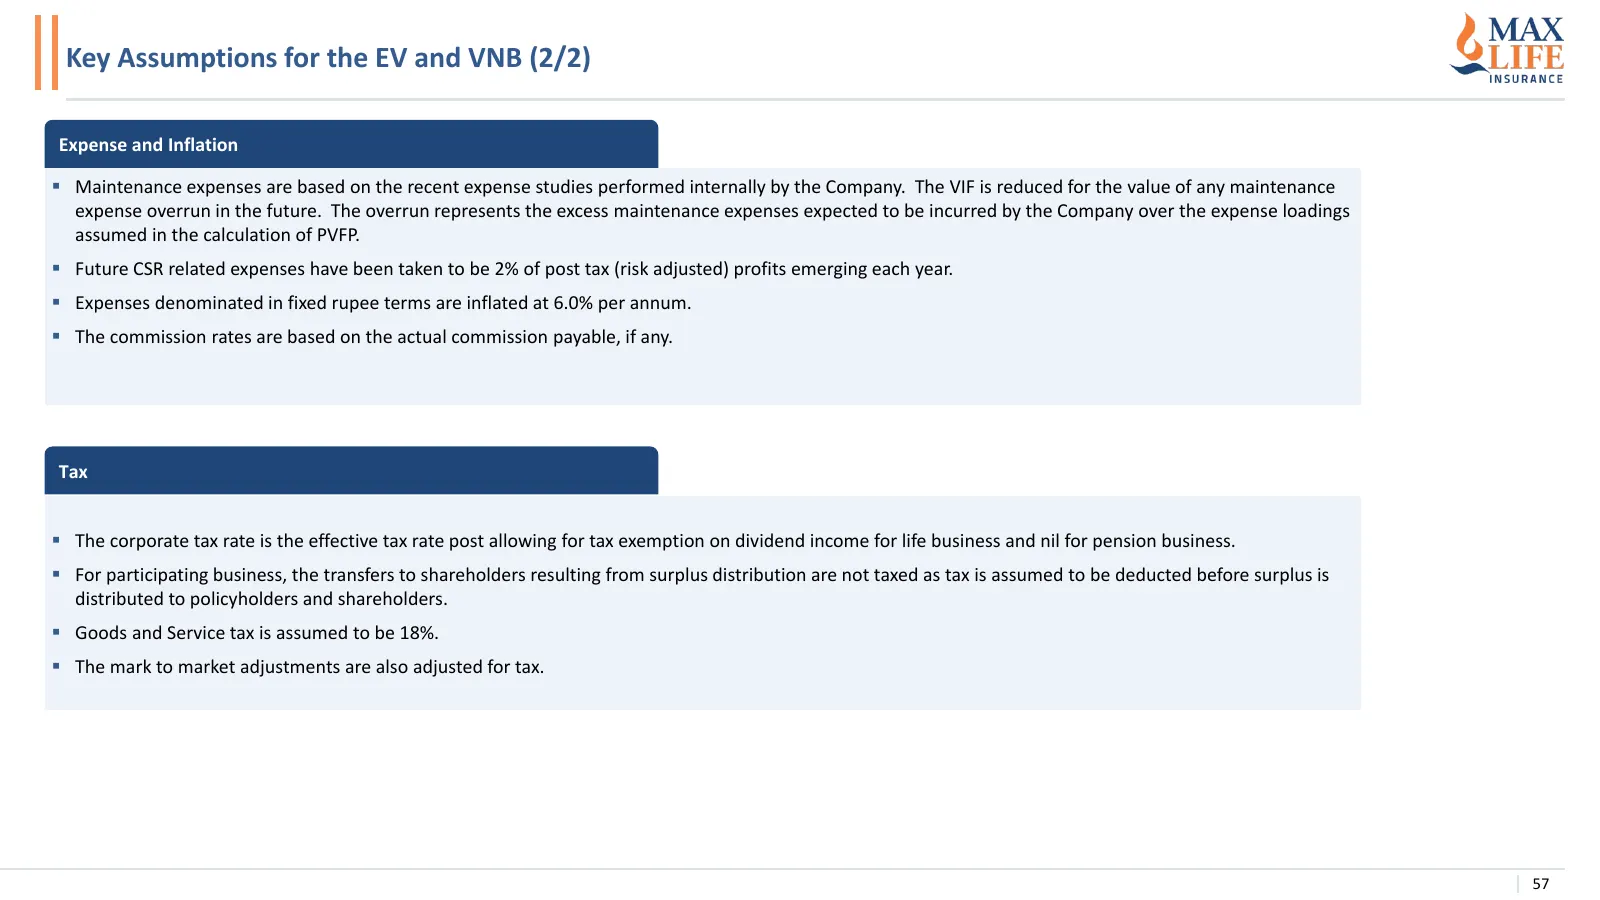
Key Assumptions for the EV and VNB (2/2) Expense and Inflation ▪ Maintenance expenses are based on the recent expense studies performed internally by the Company. The VIF is reduced for the value of any maintenance expense overrun in the future. The overrun represents the excess maintenance expenses
Slide 58: Financial Performance Summary FY19
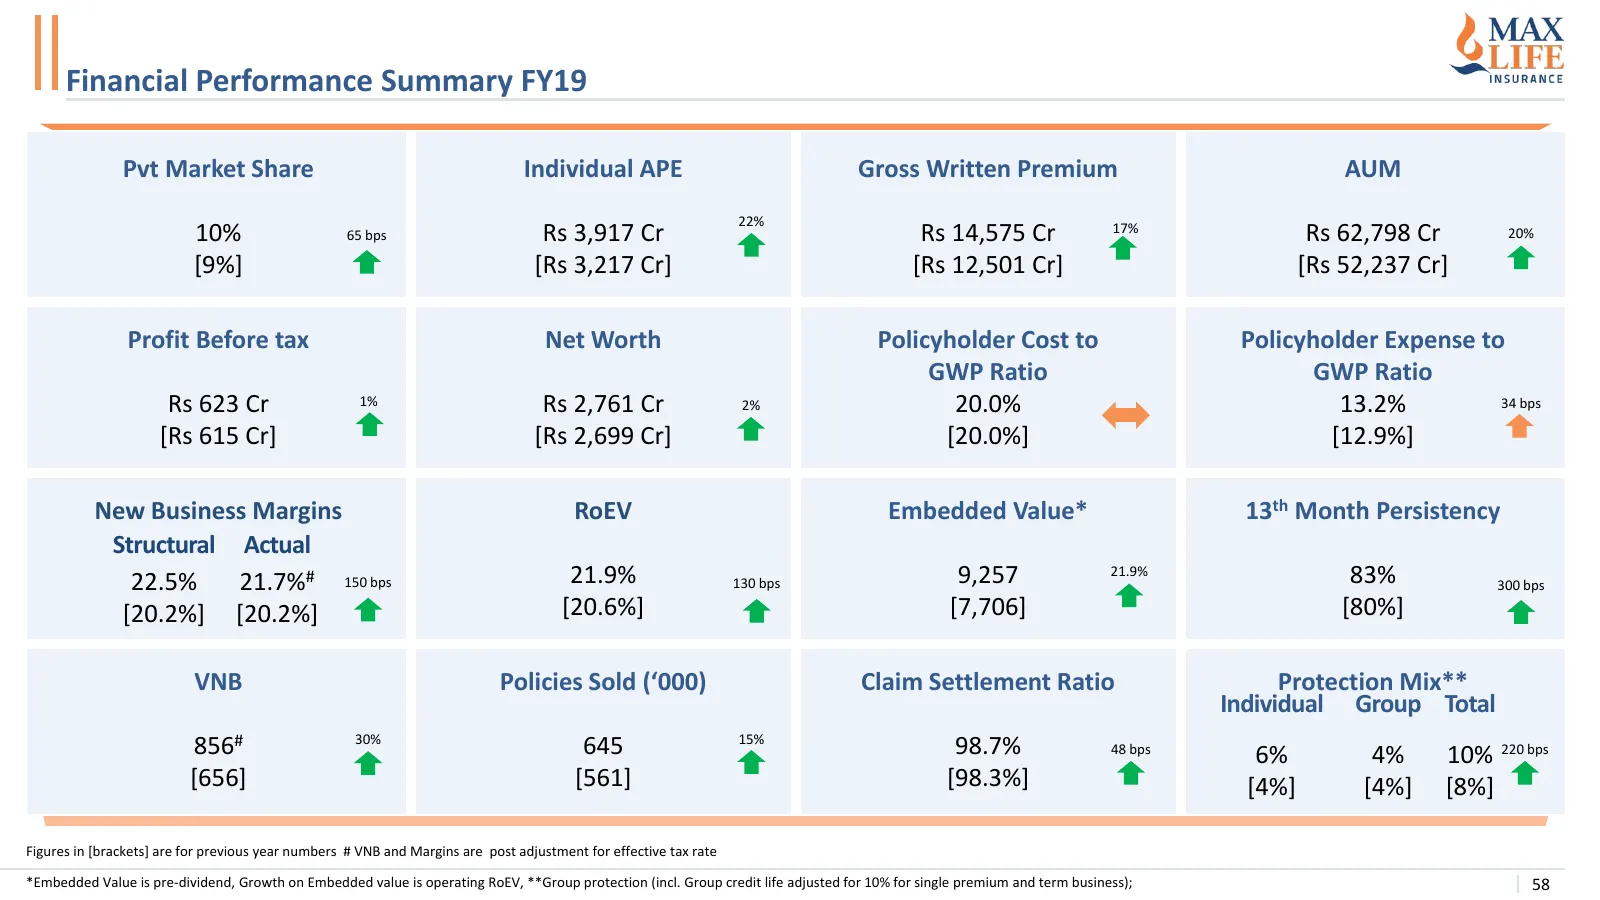
Financial Performance Summary FY19 Pvt Market Share Individual APE Gross Written Premium AUM 22% 10% 65 bps Rs 3,917 Cr Rs 14,575 Cr 17% Rs 62,798 Cr 20% [9%] [Rs 3,217 Cr] [Rs 12,501 Cr] [Rs 52,237 Cr] Profit Before tax Net Worth Policyholder Cost to Policyholder Expense to GWP Ratio GWP Ratio Rs 6
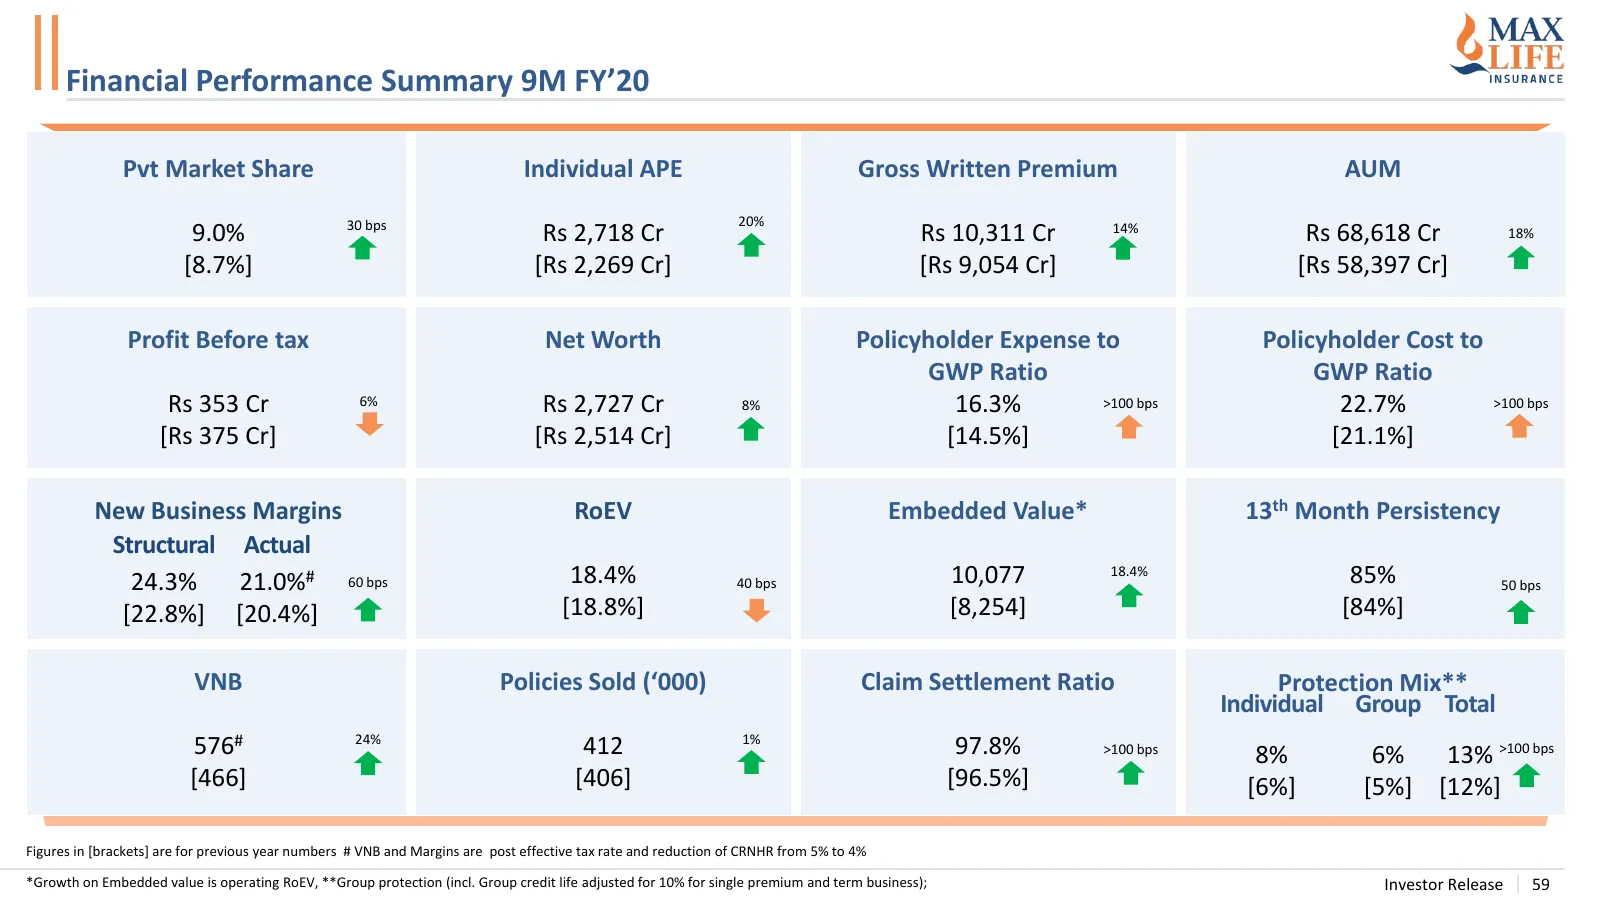
Slide 59: Financial Performance Summary 9M FY'20
Financial Performance Summary 9M FY’20 Pvt Market Share Individual APE Gross Written Premium AUM 30 bps 20% 9.0% Rs 2,718 Cr Rs 10,311 Cr 14% Rs 68,618 Cr 18% [8.7%] [Rs 2,269 Cr] [Rs 9,054 Cr] [Rs 58,397 Cr] Profit Before tax Net Worth Policyholder Expense to Policyholder Cost to GWP Ratio GWP Rati
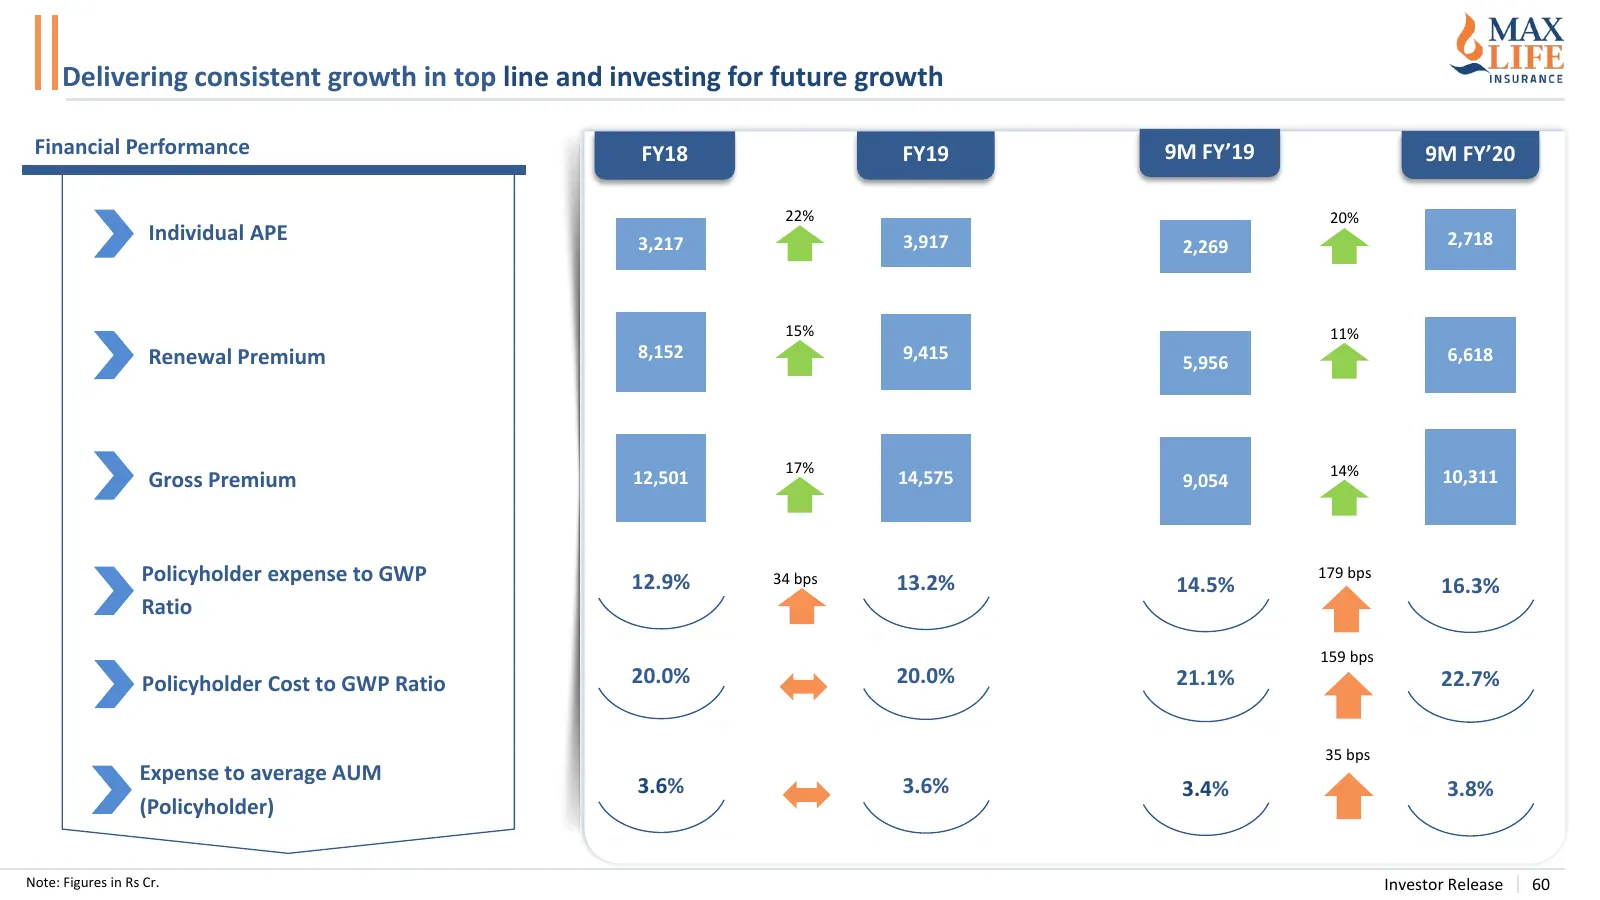
Slide 60: Delivering consistent growth in top line and investing for future growth
Delivering consistent growth in top line and investing for future growth Financial Performance FY18 FY19 9M FY’19 9M FY’20 22% 20% Individual APE 3,217 3,917 2,718 2,269 15% 11% Renewal Premium 8,152 9,415 6,618 5,956 17% 14% Gross Premium 12,501 14,575 9,054 10,311 Policyholder expense to GWP 12.9%
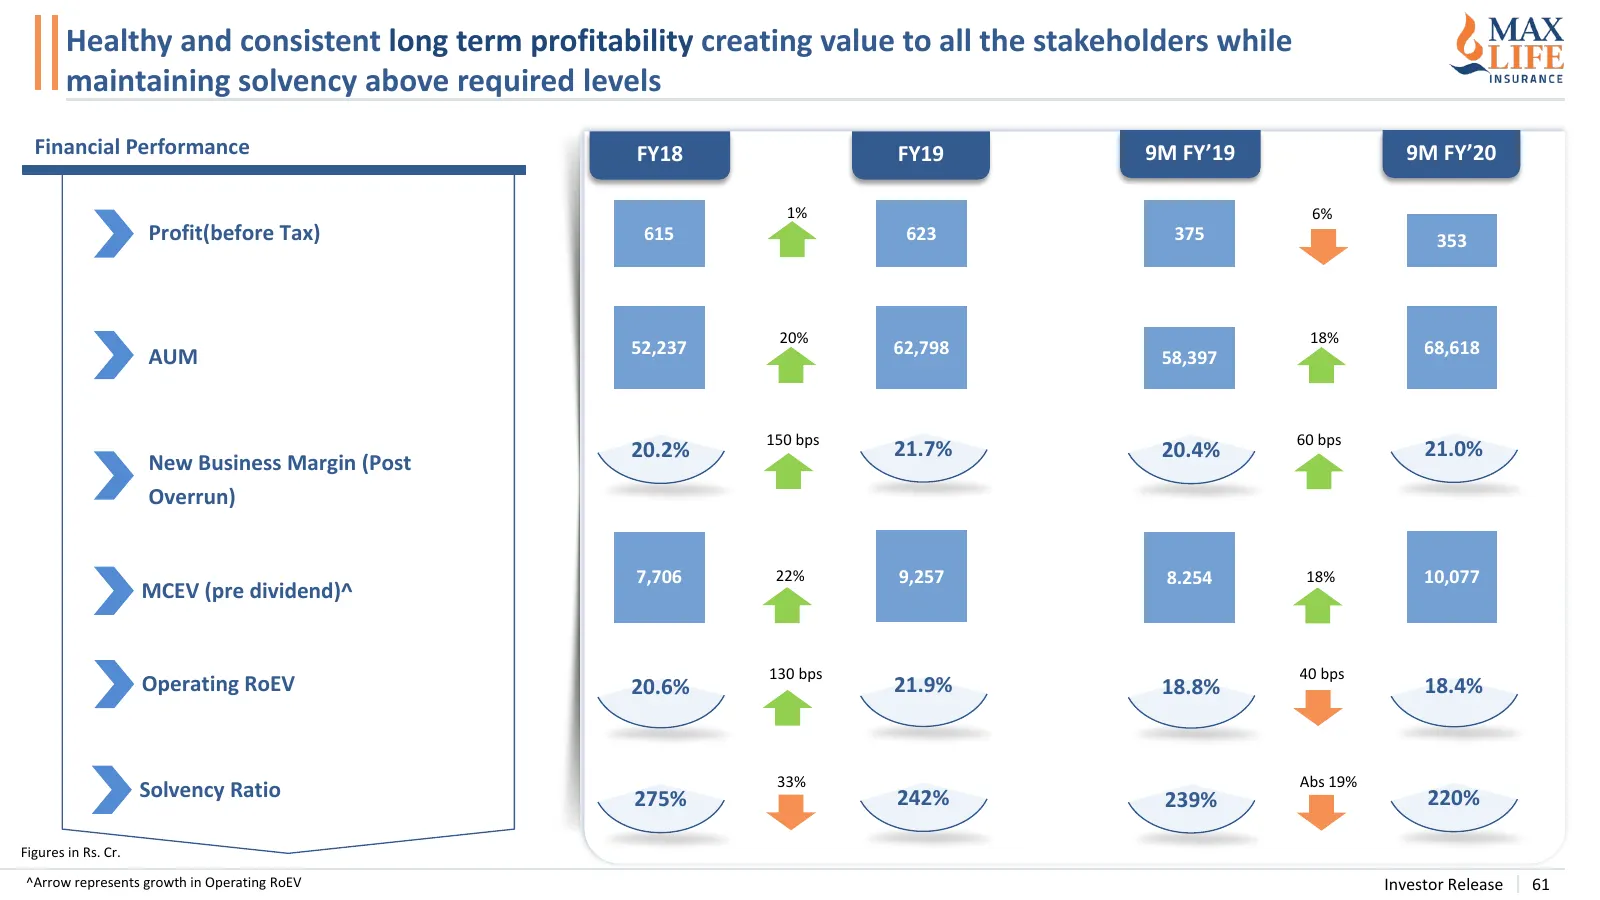
Slide 61: Healthy and consistent long term profitability
Healthy and consistent long term profitability creating value to all the stakeholders while maintaining solvency above required levels Financial Performance FY18 FY19 9M FY’19 9M FY’20 1% 6% Profit(before Tax) 615 623 375 353 20% 18% 52,237 62,798 68,618 AUM 58,397 150 bps 60 bps 20.2% 21.7% 20.4% 2
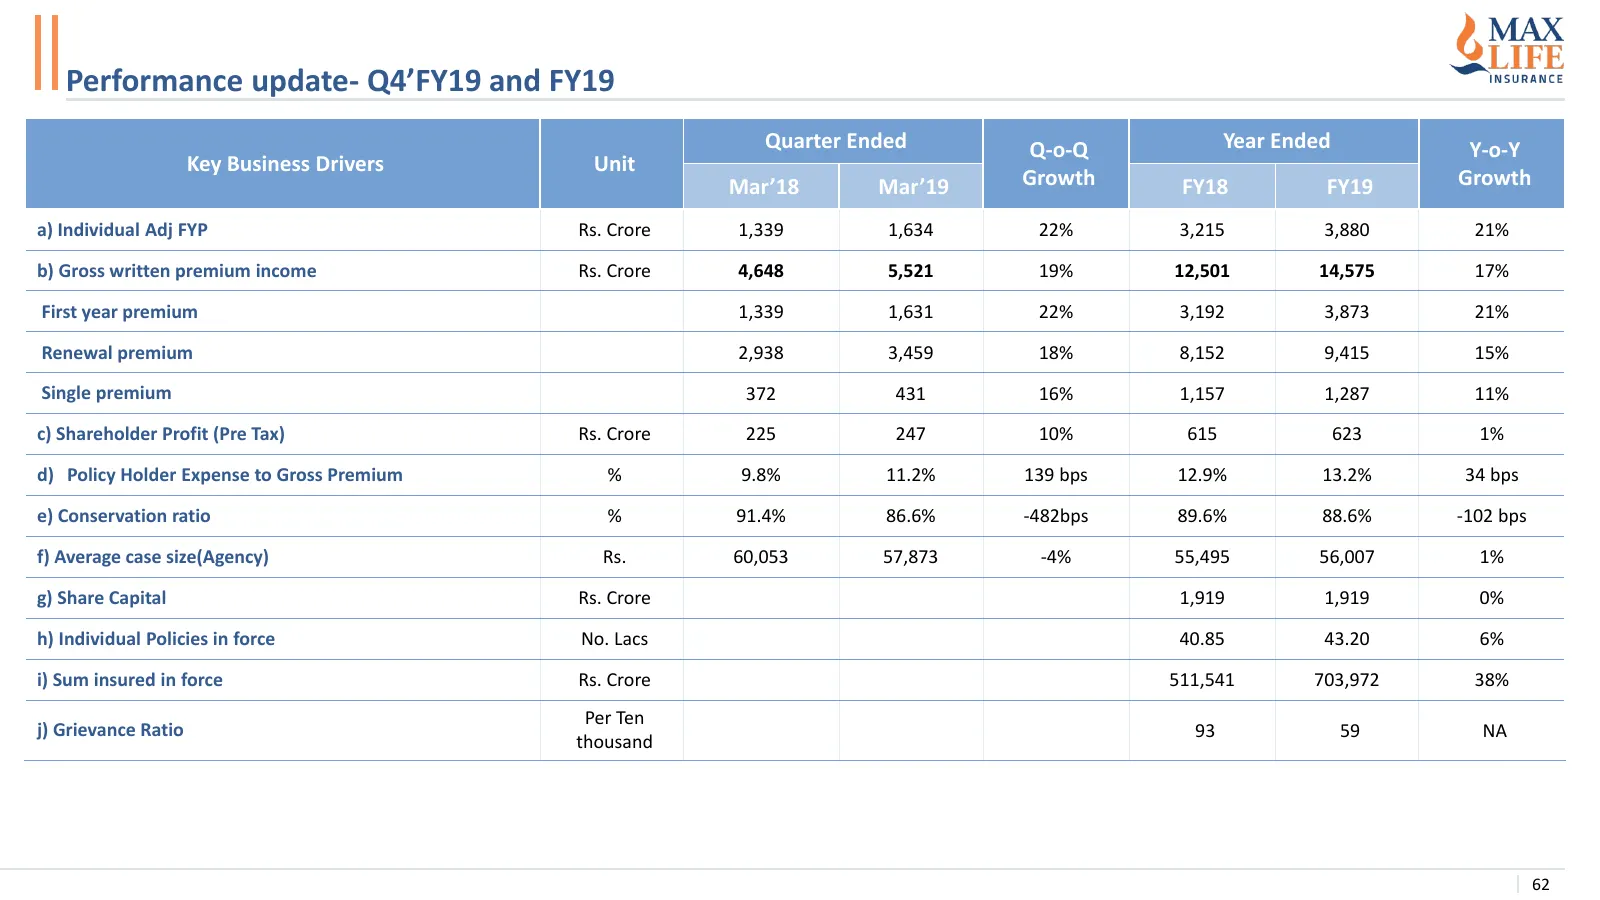
Slide 62: Performance update- Q4'FY19 and FY19
Performance update- Q4’FY19 and FY19 Quarter Ended Q-o-Q Year Ended Y-o-Y Key Business Drivers Unit Mar’18 Mar’19 Growth FY18 FY19 Growth a) Individual Adj FYP Rs. Crore 1,339 1,634 22% 3,215 3,880 21% b) Gross written premium income Rs. Crore 4,648 5,521 19% 12,501 14,575 17% First year premium 1,3
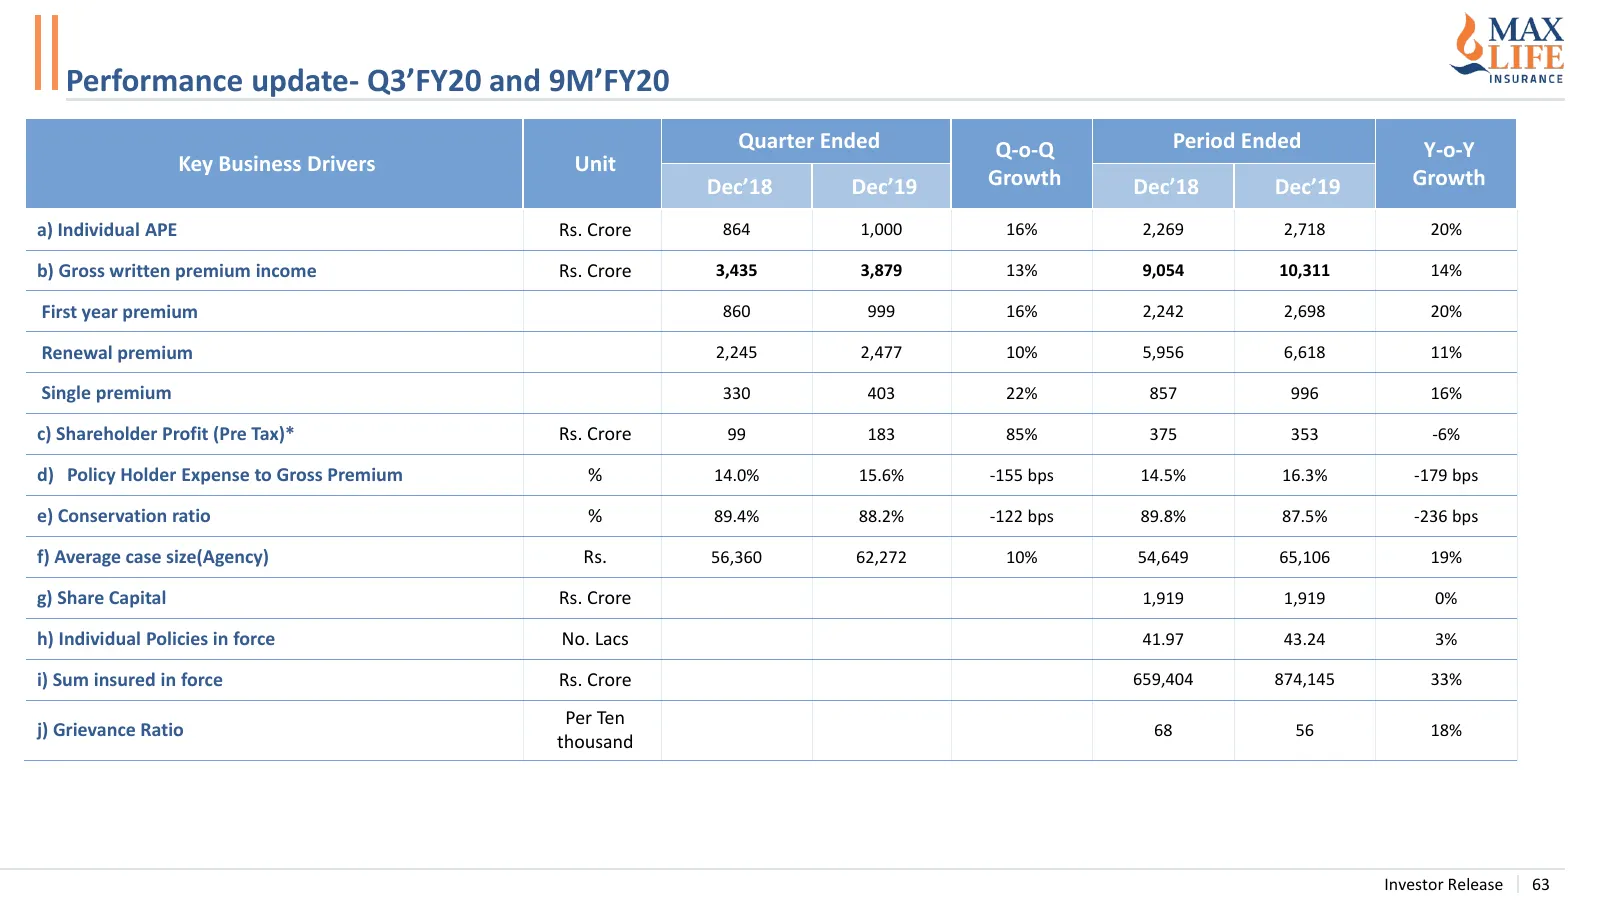
Slide 63: Performance update- Q3'FY20 and 9M'FY20
Performance update- Q3’FY20 and 9M’FY20 Quarter Ended Q-o-Q Period Ended Y-o-Y Key Business Drivers Unit Dec’18 Dec’19 Growth Dec’18 Dec’19 Growth a) Individual APE Rs. Crore 864 1,000 16% 2,269 2,718 20% b) Gross written premium income Rs. Crore 3,435 3,879 13% 9,054 10,311 14% First year premium 8

Slide 64: Max Insurance
MAX INSURANCE
Source: Internet Archive copy of maxfinancialservices.com
More decks from Max Financial Services Limited
 H1 FY2027 Earnings Presentation48 slides · Oct 27, 2026
 Q1 FY2027 Earnings Presentation47 slides · Aug 13, 2026
 FY2026 Earnings Presentation25 slides · May 12, 2026
 Investor Presentation (March 2026)51 slides · Mar 18, 2026
 9M FY2026 Earnings Presentation48 slides · Feb 11, 2026
 H1 FY26 Earnings Presentation49 slides · Nov 11, 2025