GMO Payment Gateway, Inc. · TSE:3769
GMO Payment Gateway — FY2026 Earnings Presentation
62 slides from GMO Payment Gateway's earnings presentation, Nov 13, 2026
Slide 1: FinTech Powers Next: Financial Results Briefing for FY2026
FinTech Powers Next Financial Results Briefing GMO for FY2026 PAYMENT GATEWAY Become the payment/FinTech infrastructure by expanding business domains November 13, 2026 87* Investor Meeting
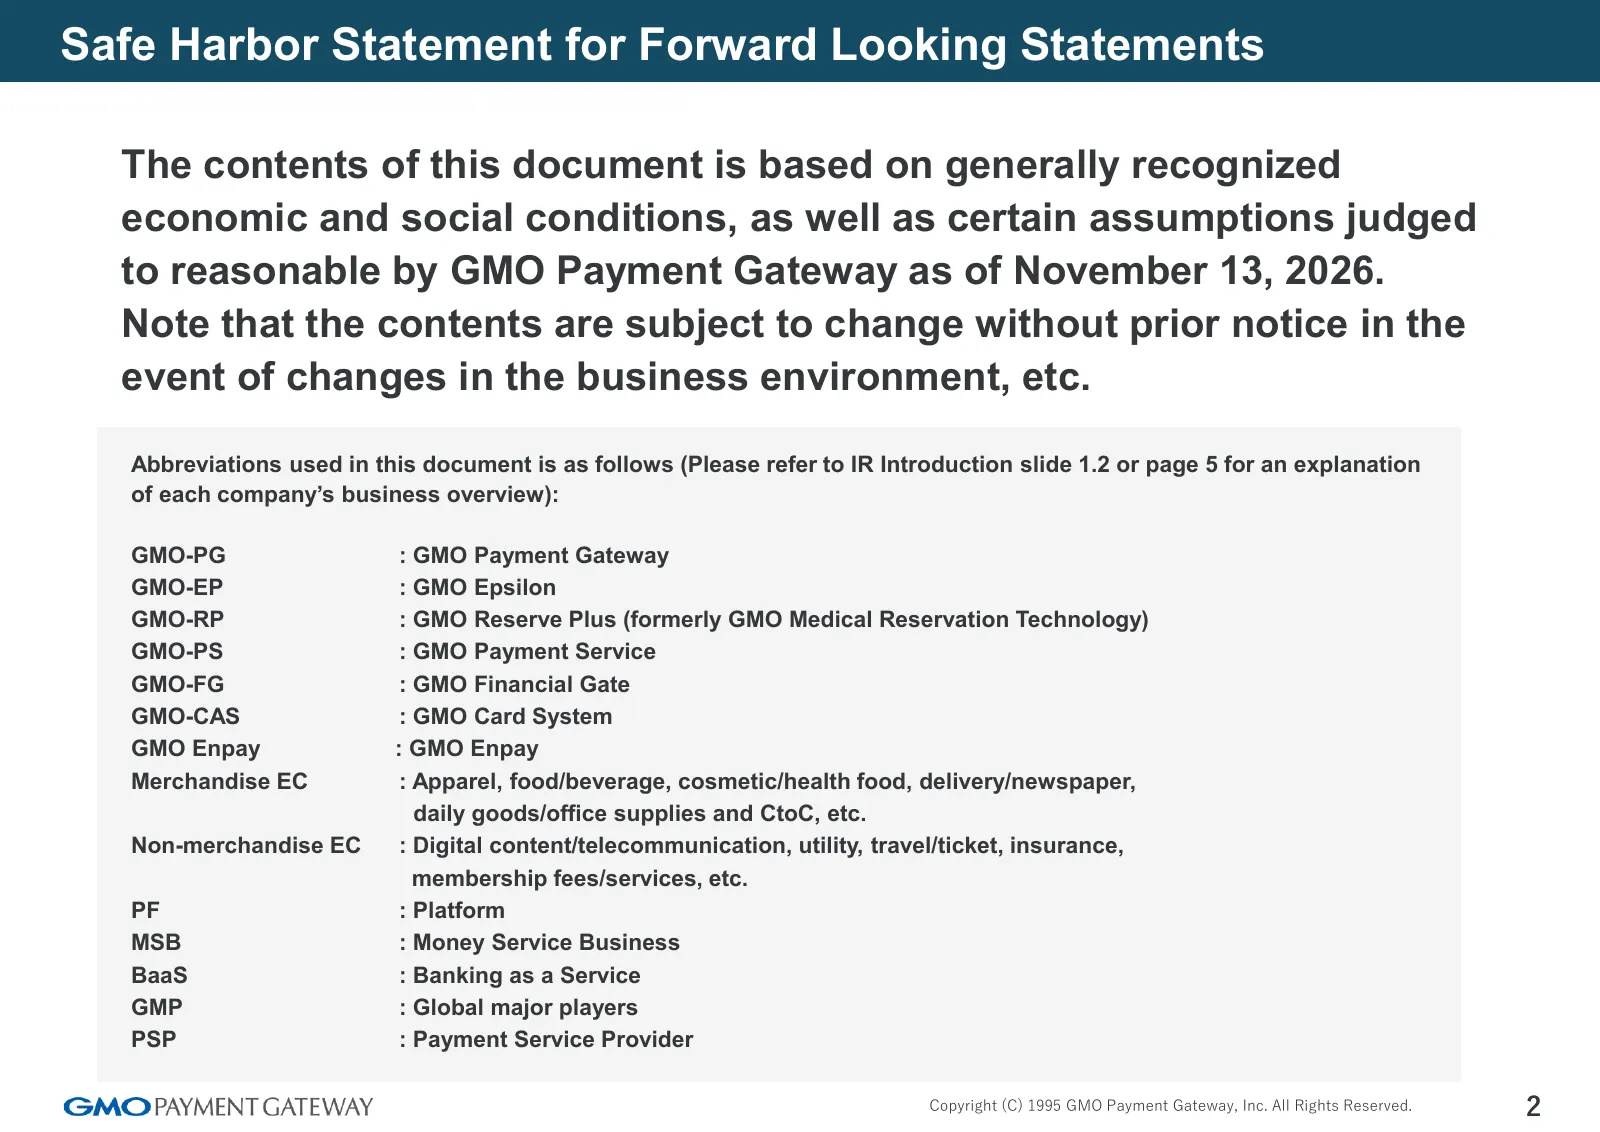
Slide 2: Safe Harbor Statement for Forward Looking Statements
Safe Harbor Statement for Forward Looking Statements The contents of this document is based on generally recognized economic and social conditions, as well as certain assumptions judged to reasonable by GMO Payment Gateway as of November 13, 2026. Note that the contents are subject to change without
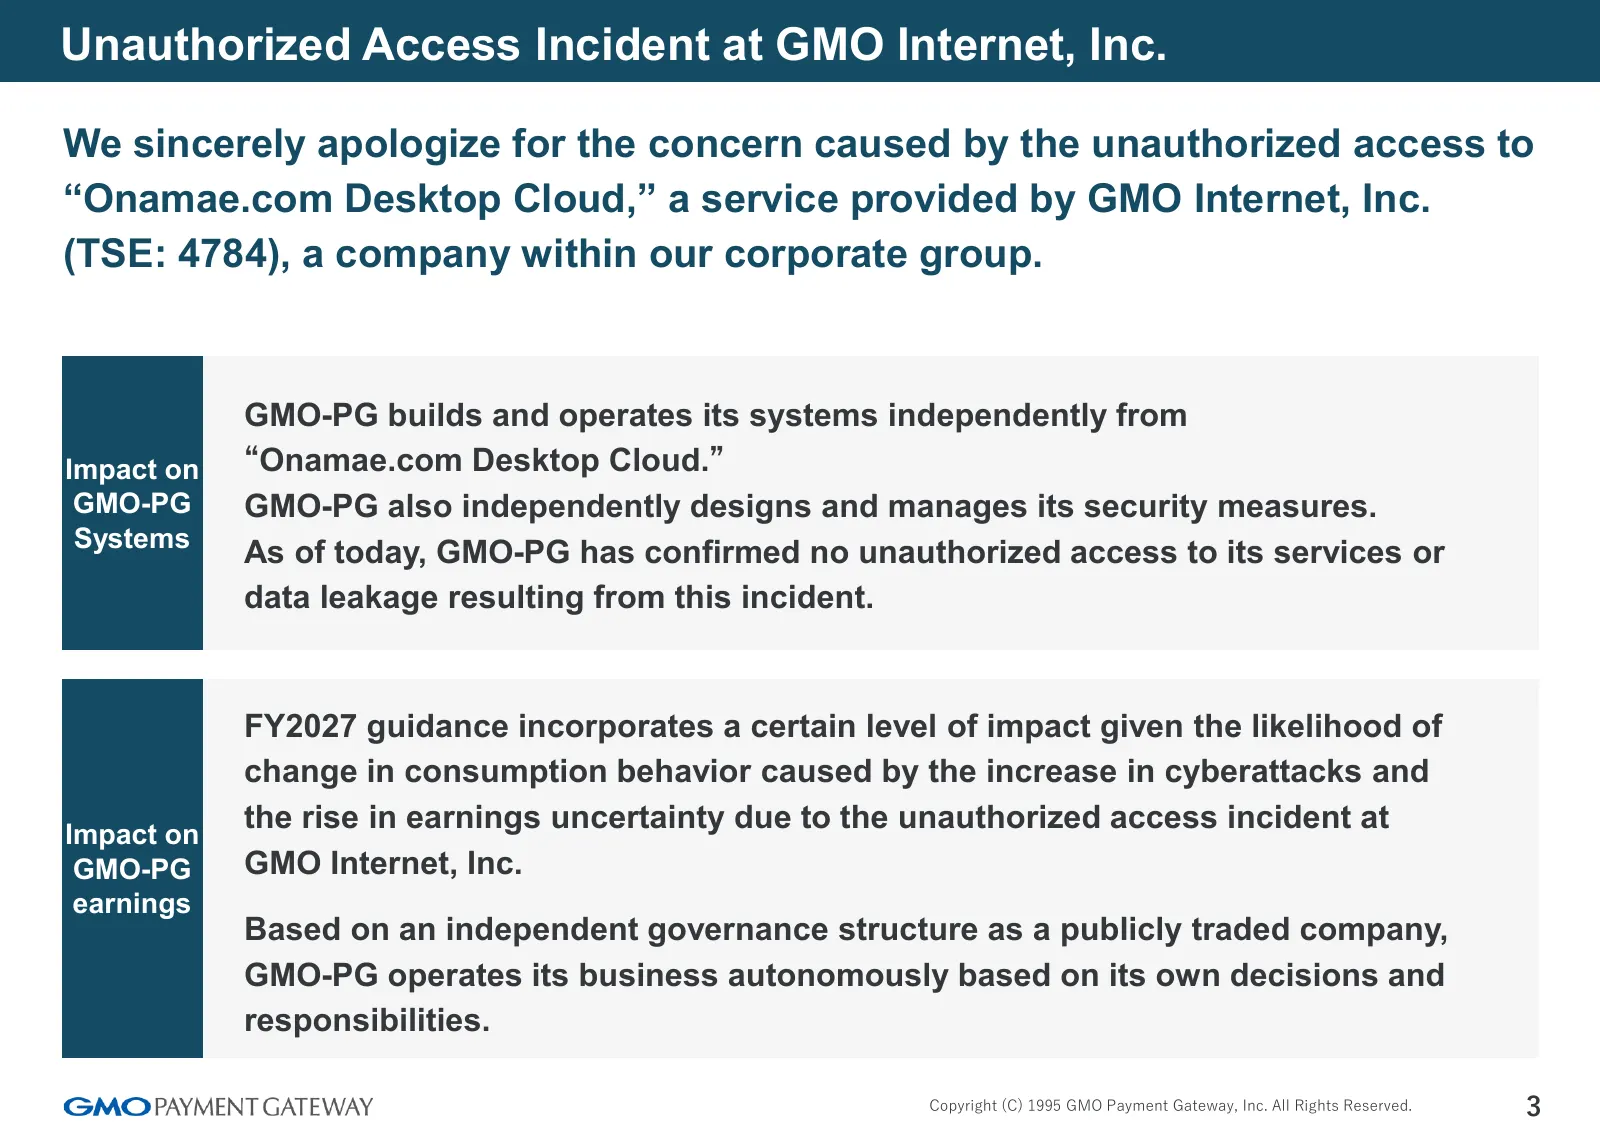
Slide 3: Unauthorized Access Incident at GMO Internet, Inc.
Unauthorized Access Incident at GMO Internet, Inc. We sincerely apologize for the concern caused by the unauthorized access to “Onamae.com Desktop Cloud,” a service provided by GMO Internet, Inc. (TSE: 4784), a company within our corporate group. GMO-PG builds and operates its systems independently
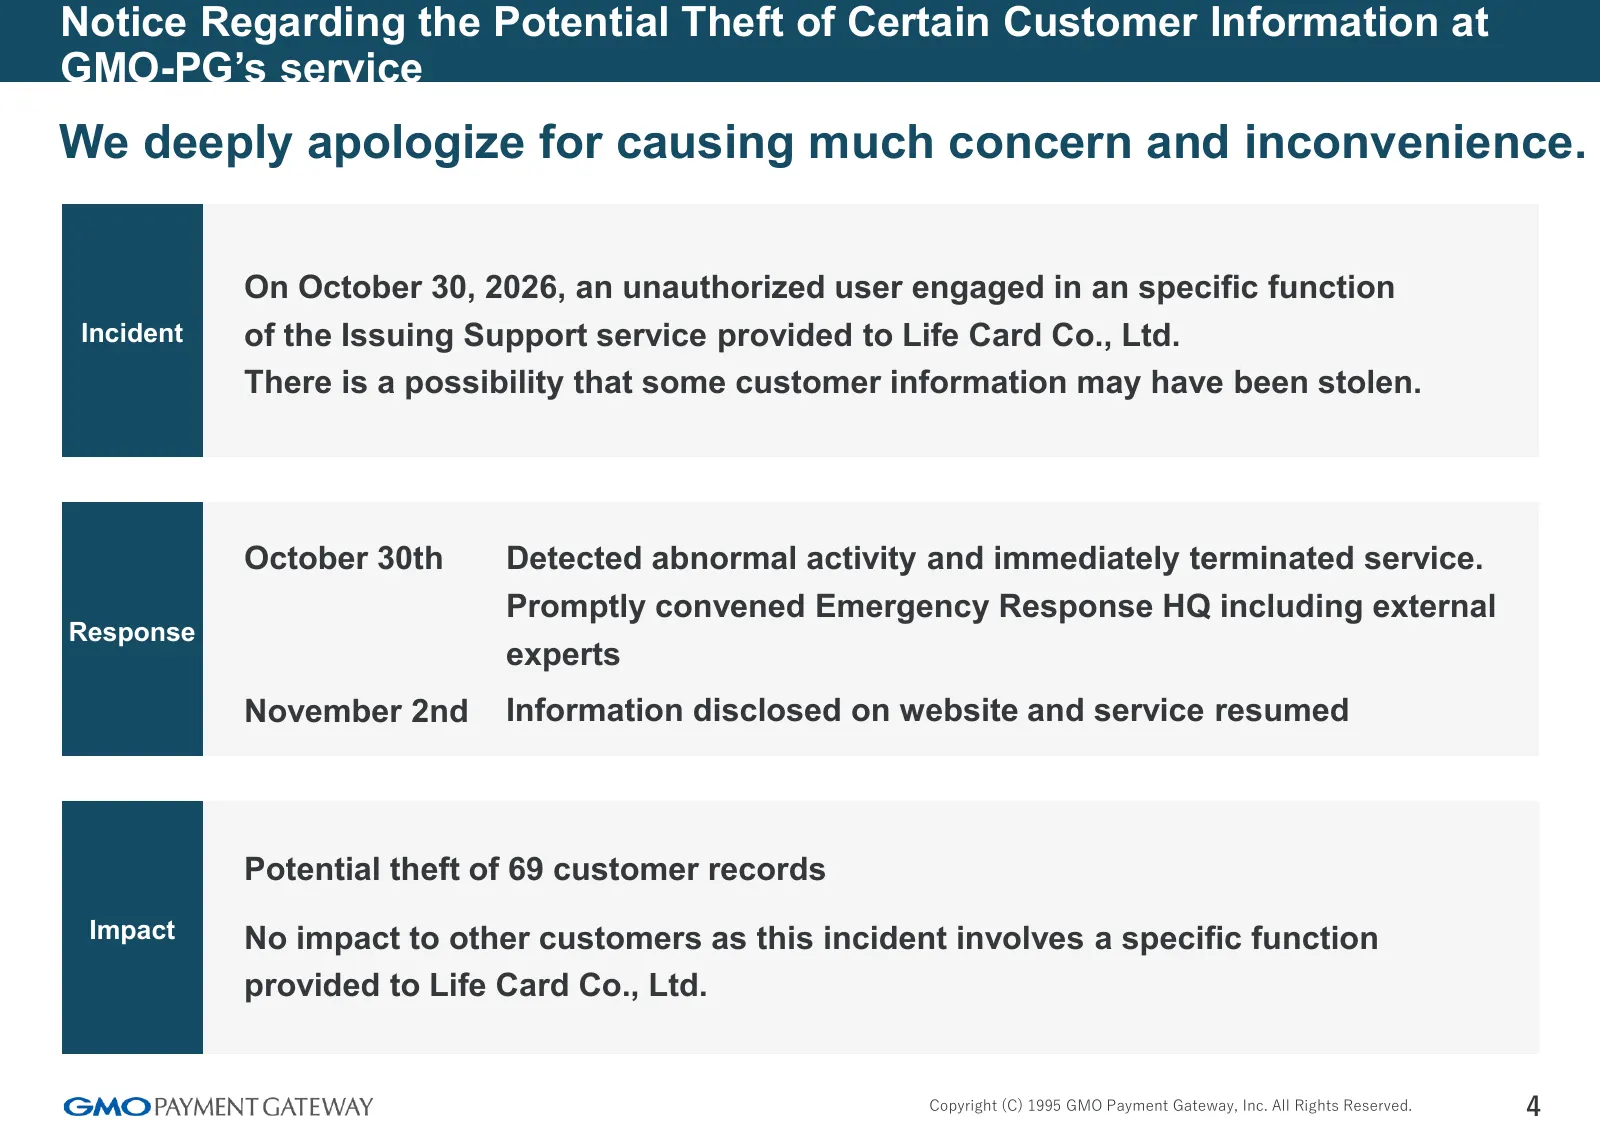
Slide 4: Notice Regarding Potential Theft of Certain Customer Information
Notice Regarding the Potential Theft of Certain Customer Information at GMO-PG’s service We deeply apologize for causing much concern and inconvenience. On October 30, 2026, an unauthorized user engaged in an specific function Incident of the Issuing Support service provided to Life Card Co., Ltd. T
Slide 5: Initiatives on Security at GMO-PG
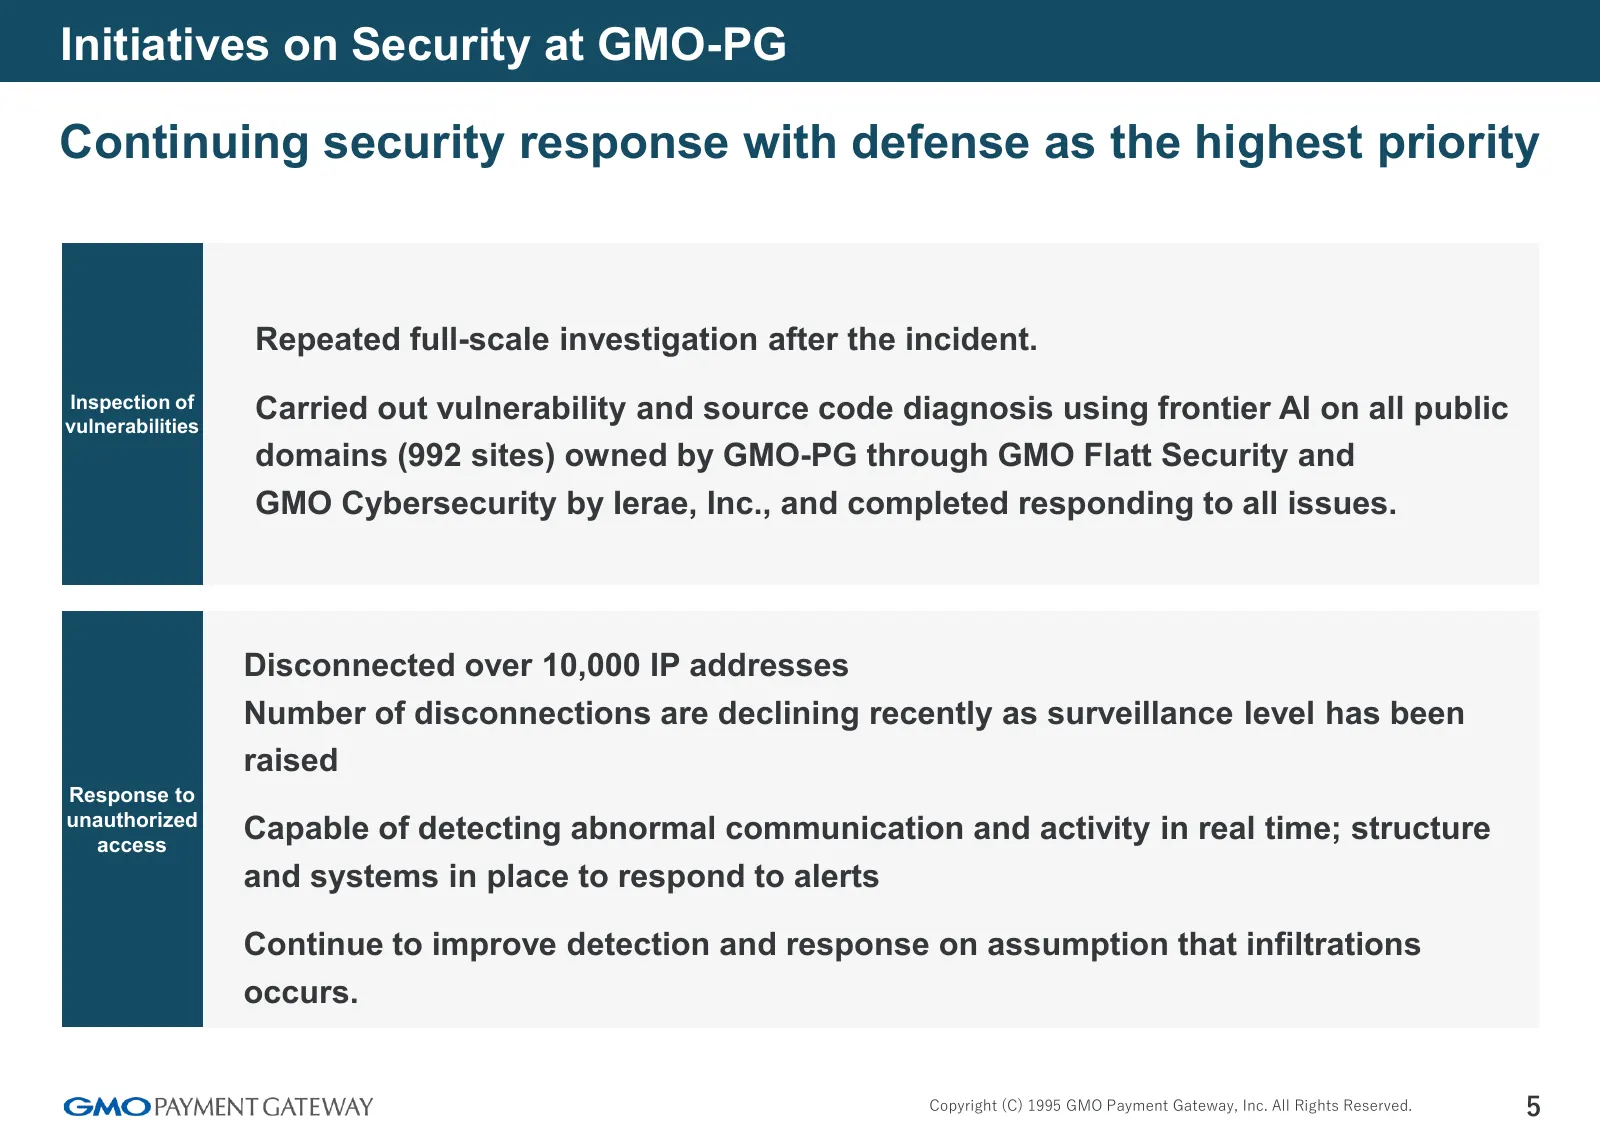
Initiatives on Security at GMO-PG Continuing security response with defense as the highest priority Repeated full-scale investigation after the incident. Inspection of vulnerabilities Carried out vulnerability and source code diagnosis using frontier AI on all public domains (992 sites) owned by GMO
Slide 6: Agenda
Agenda 1. FY2026 Earnings Summary 2. FY2027 Earnings Guidance 3. Growth Strategy 4. Financial Strategy and Sustainability 5. Financial Highlights and Reference Materials Copyright (C) 1995 GMO Payment Gateway, Inc. All Rights Reserved. 6
Slide 7: 1. FY2026 Earnings Summary
1. FY2026 Earnings Summary GMO PAYMENT GATEWAY
Slide 8: 1.1 Summary of Consolidated Results
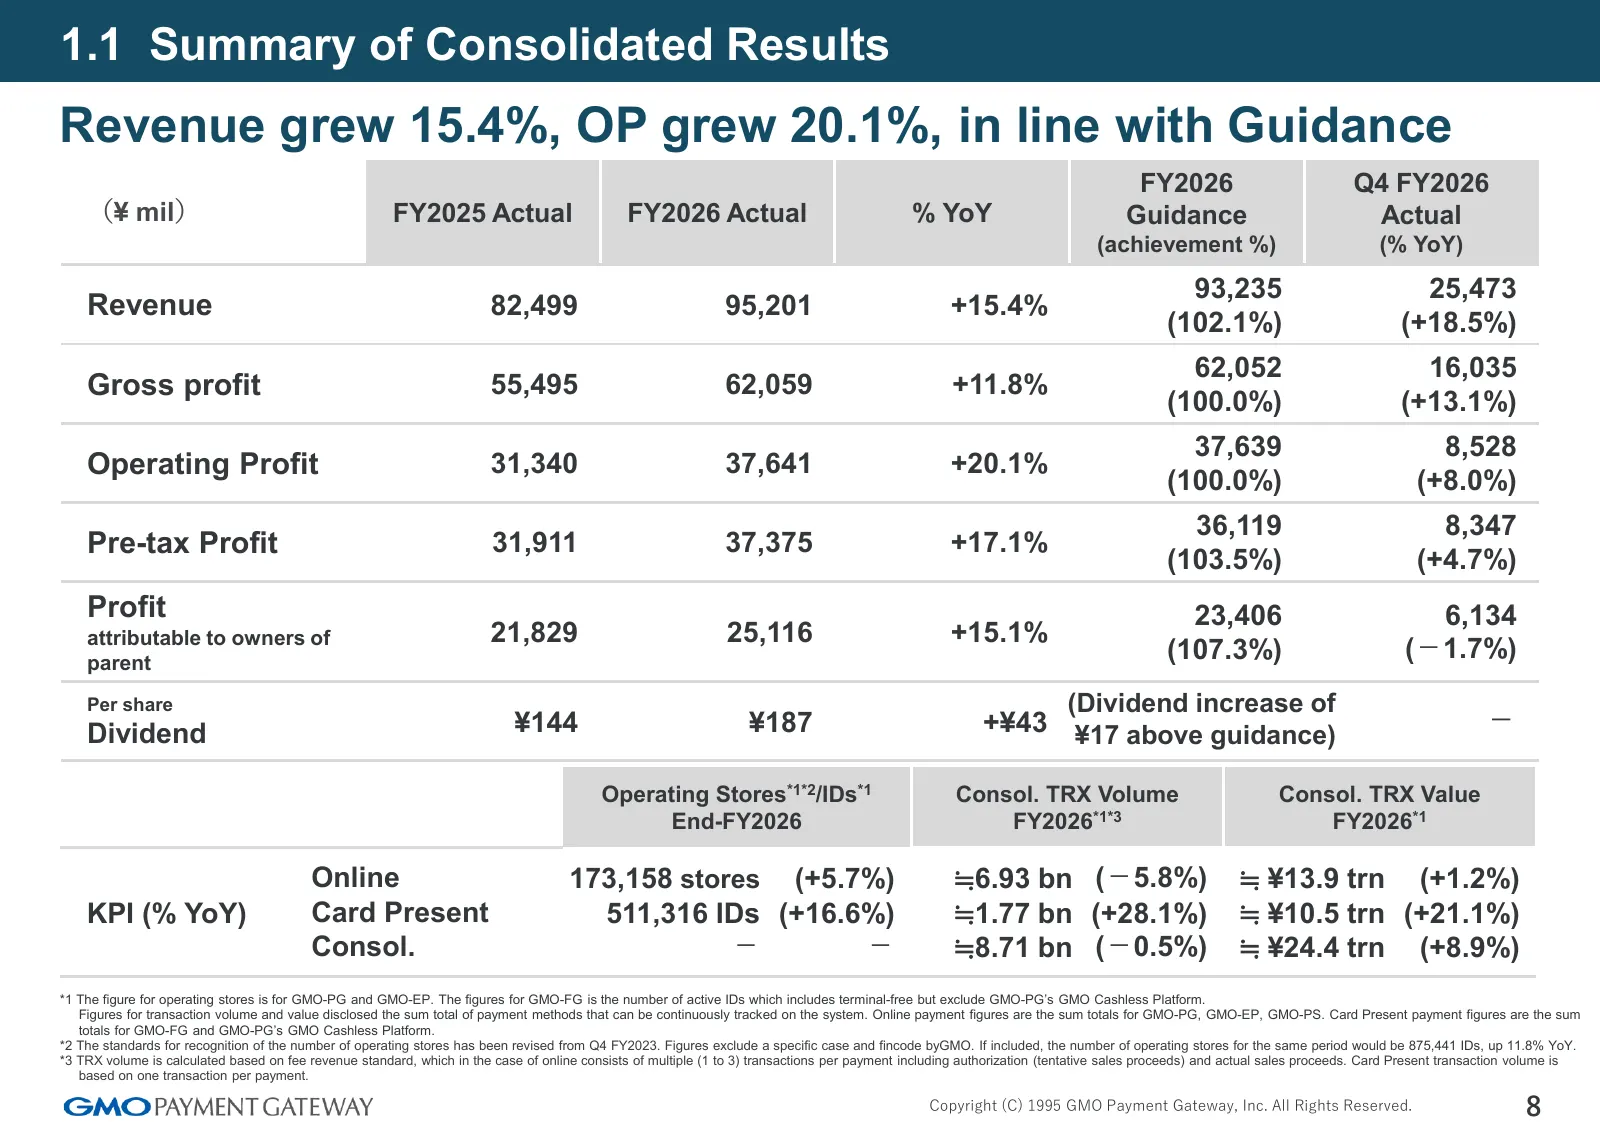
1.1 Summary of Consolidated Results Revenue grew 15.4%, OP grew 20.1%, in line with Guidance FY2026 Q4 FY2026 (¥ mil) FY2025 Actual FY2026 Actual % YoY Guidance Actual (achievement %) (% YoY) 93,235 25,473 Revenue 82,499 95,201 +15.4% (102.1%) (+18.5%) 62,052 16,035 Gross profit 55,495 62,059 +11.8%
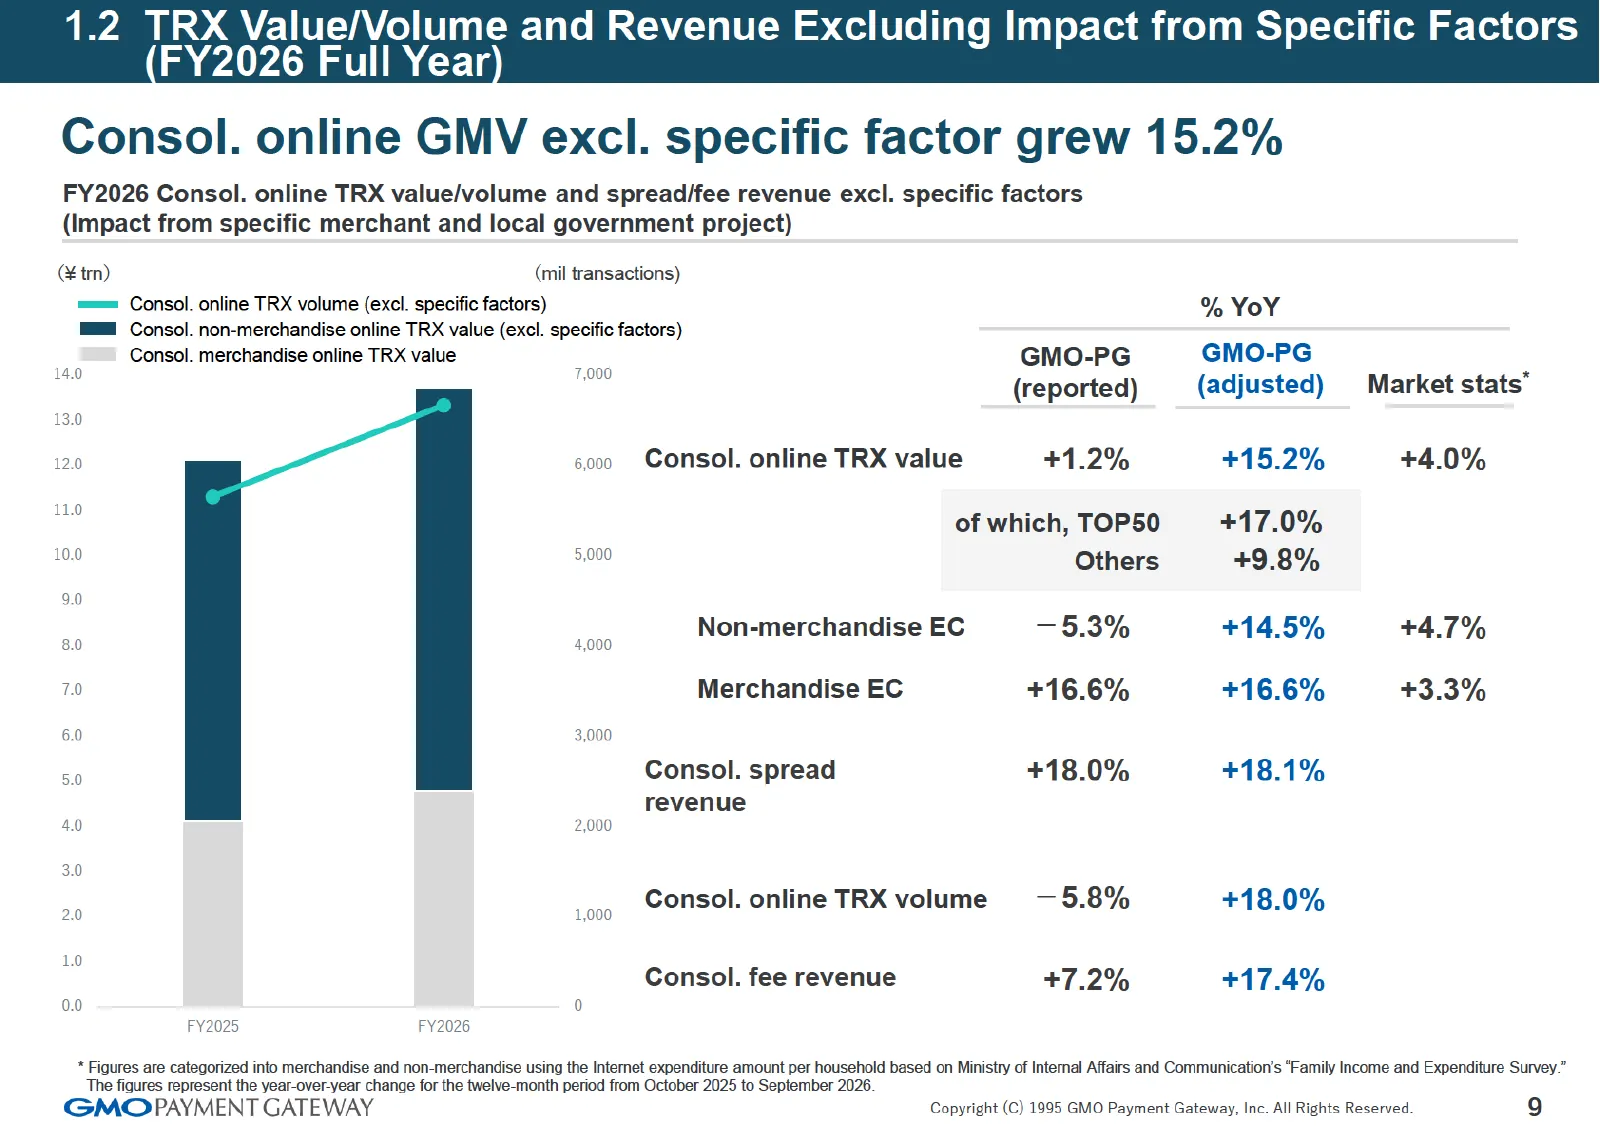
Slide 9: 1.2 TRX Value/Volume and Revenue Excluding Impact from Specific Factors
1.2 TRX Value/Volume and Revenue Excluding Impact from Specific Factors FY2026 Full Year Consol. online GMV excl. specific factor grew 15.2% FY2026 Consol. online TRX value/volume and spread/fee revenue excl. specific factors (Impact from specific merchant and local government project) (¥trn) (mil t
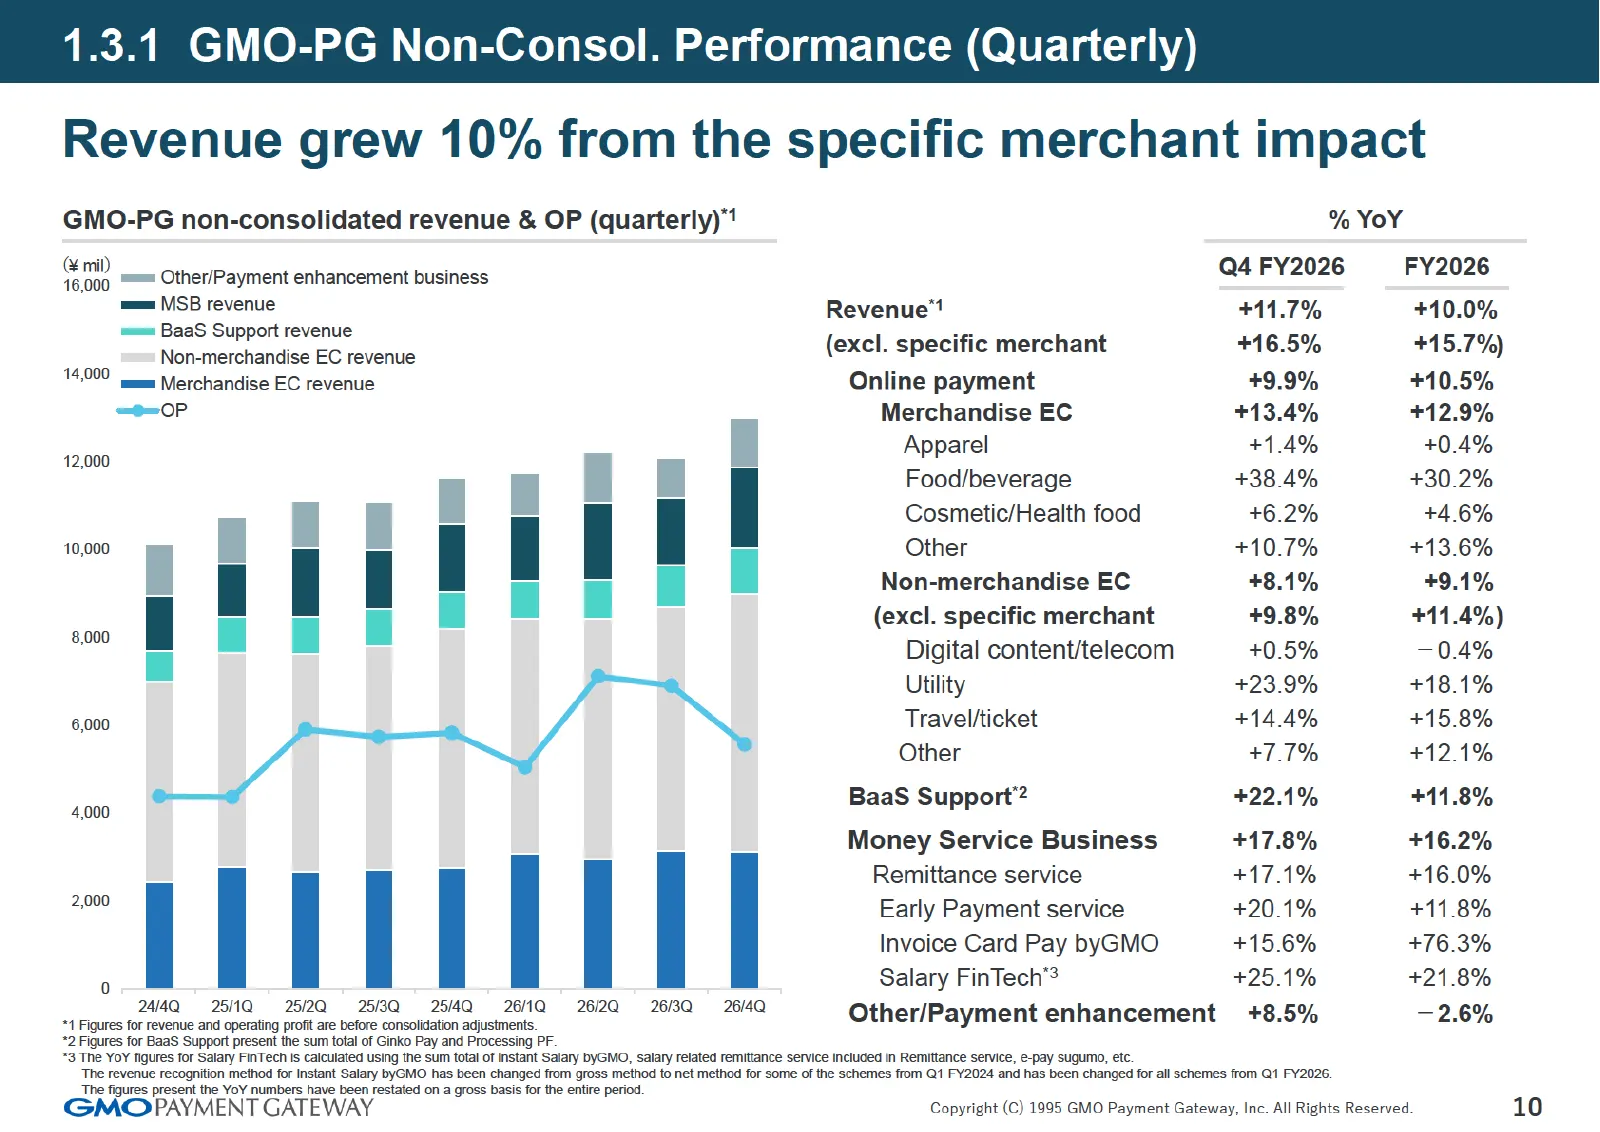
Slide 10: 1.3.1 GMO-PG Non-Consol. Performance (Quarterly)
.1 GMO-PG Non-Consol. Performance (Quarterly) Revenue grew 10% from the specific merchant impact GMO-PG non-consolidated revenue & OP (quarterly) % YoY amb Other/Payment enhancement business Q4 FY2026 FY2026 mms MSB revenue Revenue’ +11.7% +10.0% = Nee bet ee EC revenue (excl. specific merchant +16.
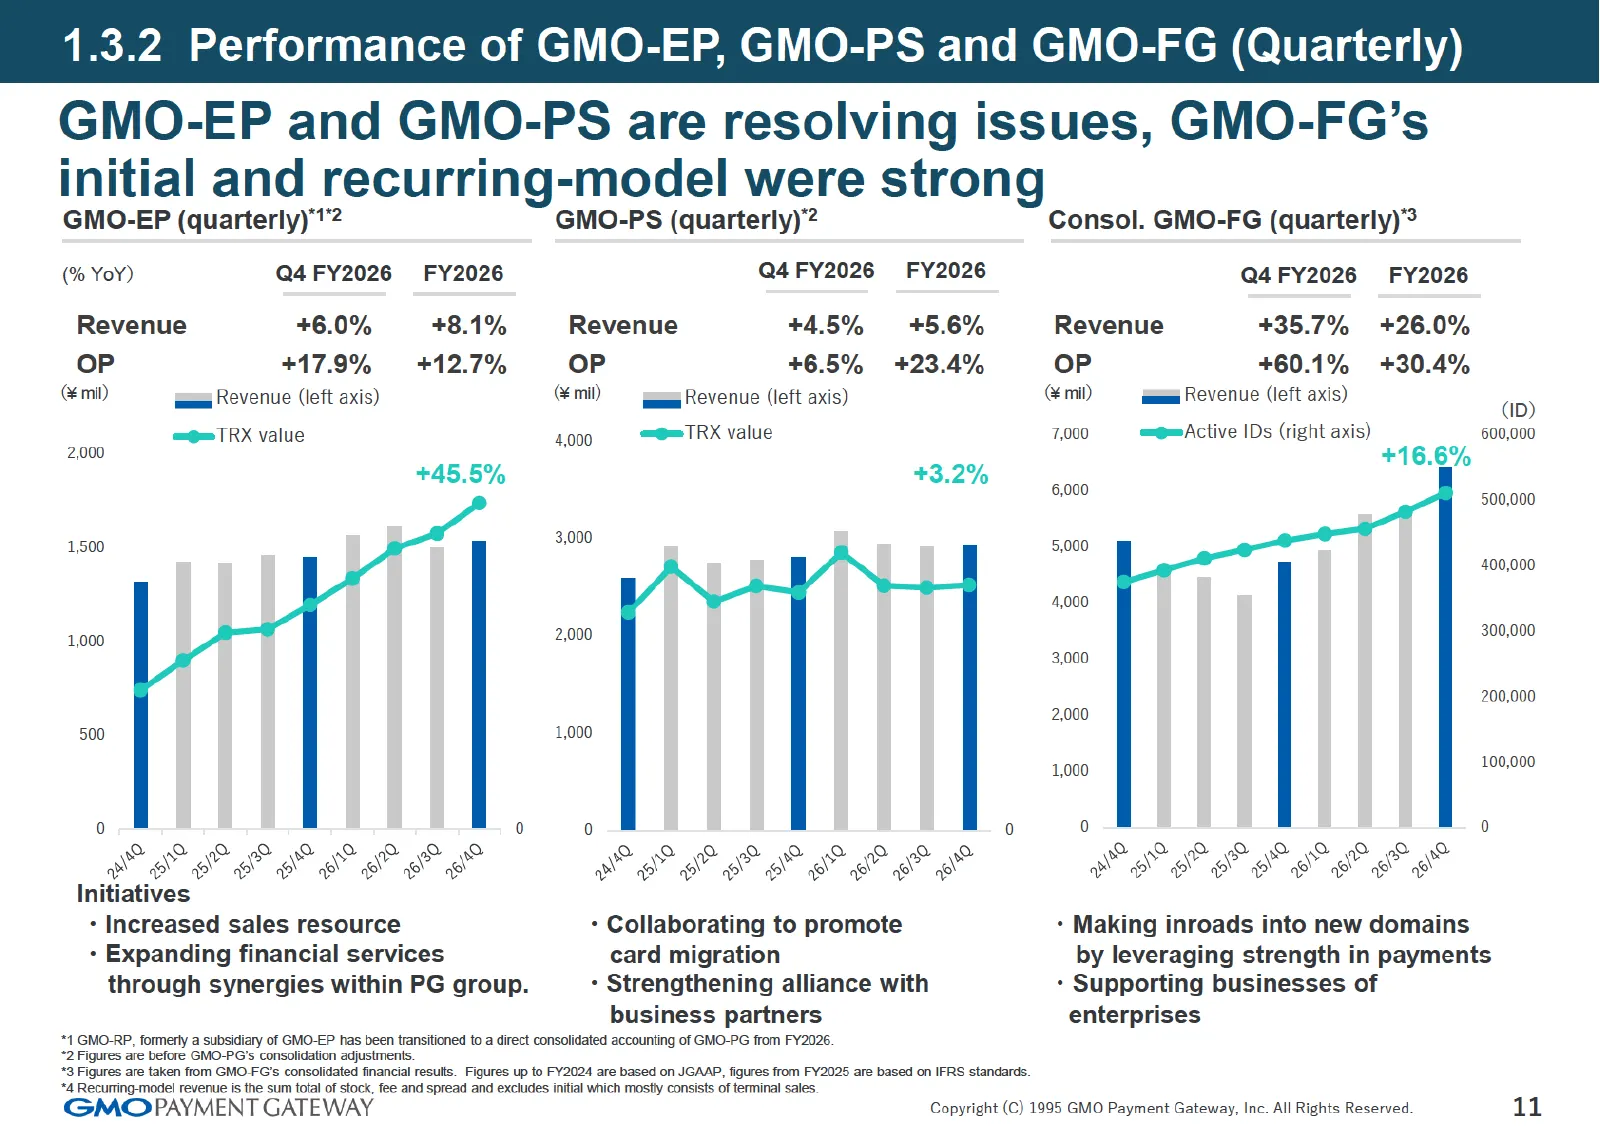
Slide 11: 1.3.2 Performance of GMO-EP, GMO-PS and GMO-FG (Quarterly)
1.3.2 Performance of GMO-EP, GMO-PS and GMO-FG (Quarterly) GMO-EP and GMO-PS are resolving issues, GMO-FG’s initial and recurring-model were strong GMO-EP (quarterly)'"’2 GMO-PS (quarterly)"2 Consol. GMO-FG (quarterly)? (% YoY) Q4FY2026 FY2026 Q4FY2026 FY2026 Q4FY2026 FY2026 Revenue +6.0% +8.1% Reve
Slide 12: 2. FY2027 Earnings Guidance
2. FY2027 Earnings Guidance GMO PAYMENT GATEWAY
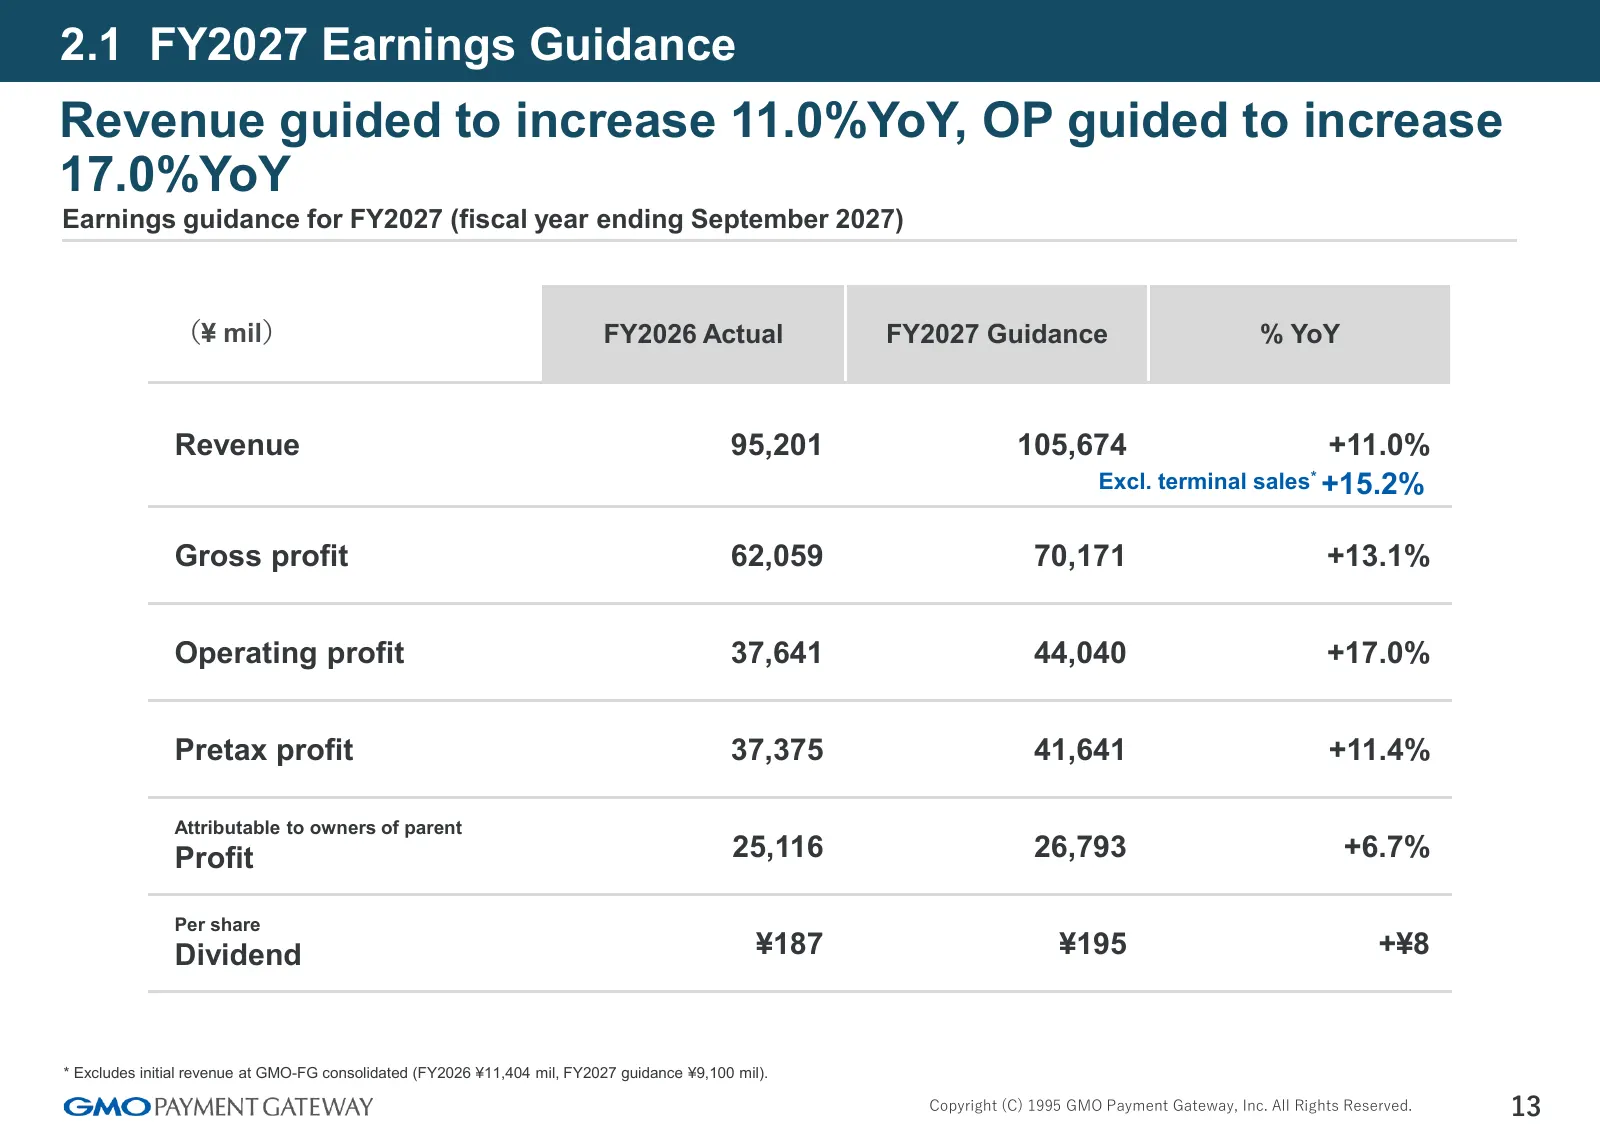
Slide 13: 2.1 FY2027 Earnings Guidance
2.1 FY2027 Earnings Guidance Revenue guided to increase 11.0%YoY, OP guided to increase 17.0%YoY Earnings guidance for FY2027 (fiscal year ending September 2027) (¥ mil) FY2026 Actual FY2027 Guidance % YoY Revenue 95,201 105,674 +11.0% Excl. terminal sales* +15.2% Gross profit 62,059 70,171 +13.1% O
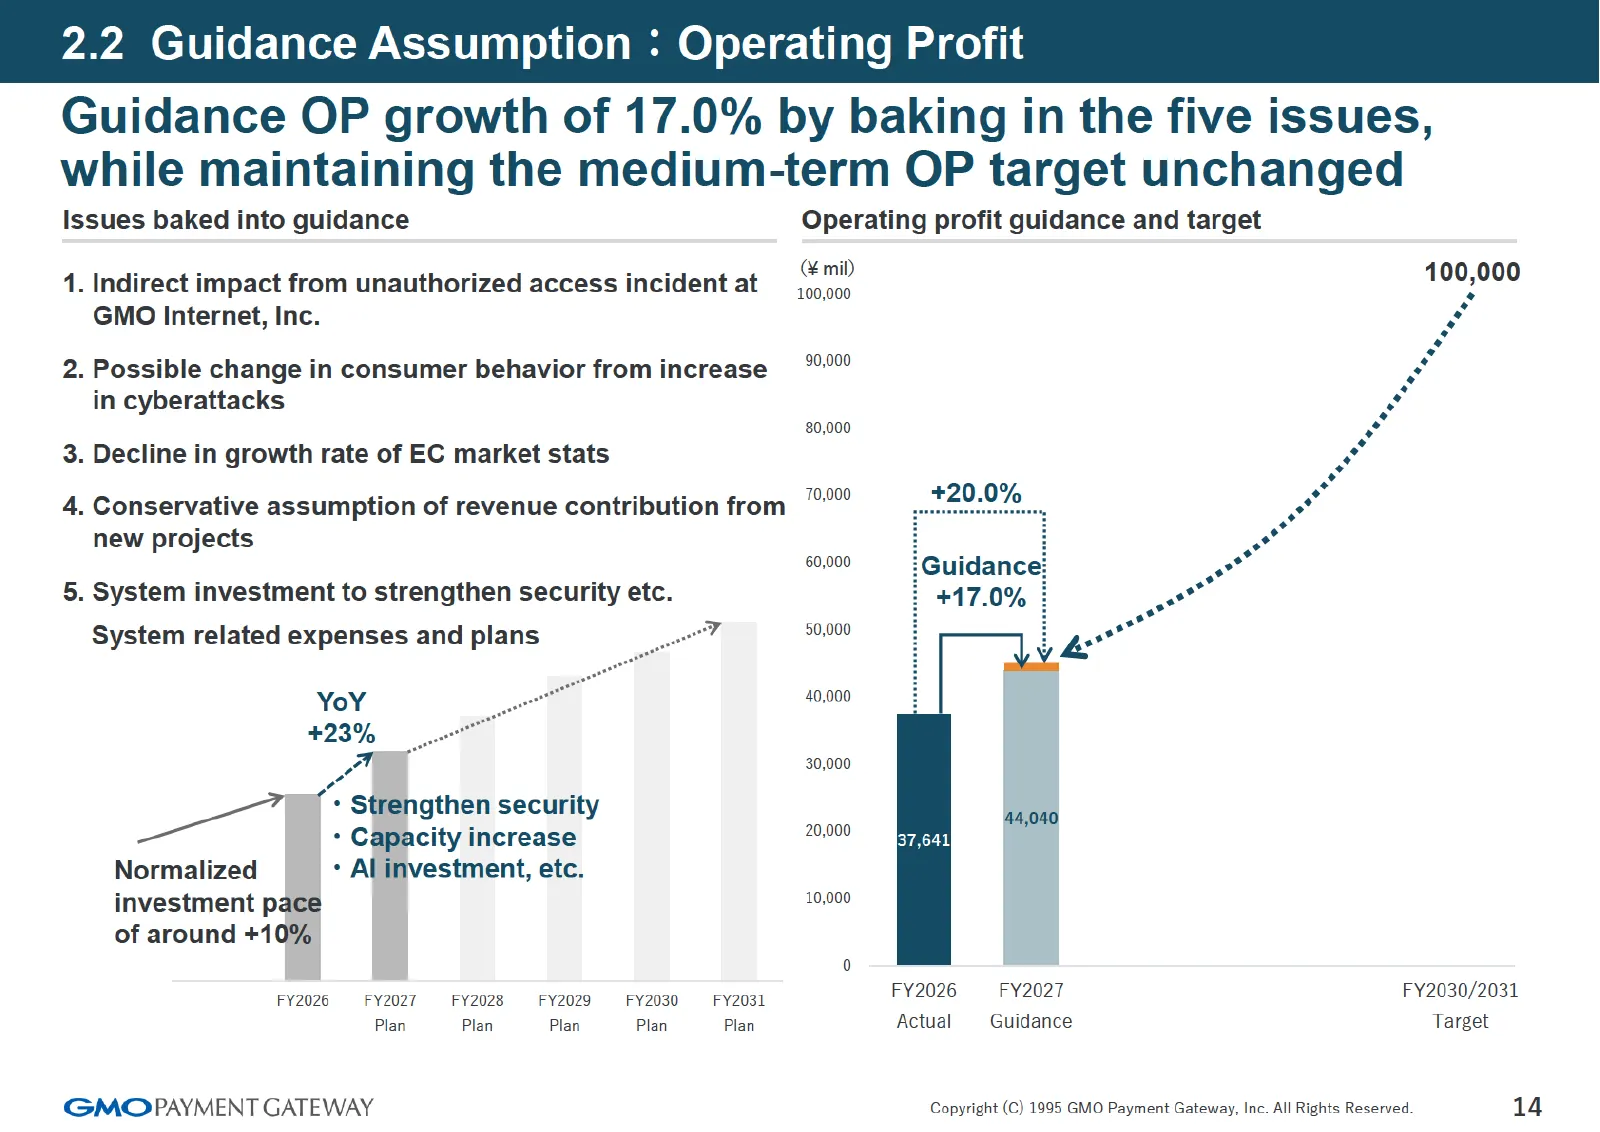
Slide 14: 2.2 Guidance Assumption: Operating Profit
2.2 Guidance Assumption : Operating Profit Guidance OP growth of 17.0% by baking in the five issues, while maintaining the medium-term OP target unchanged Issues baked into guidance Operating profit guidance and target 1. Indirect impact from unauthorized access incident at mb 100,000 GMO Internet,
Slide 15: 3. Growth Strategy
3. Growth Strategy GMO PAYMENT GATEWAY
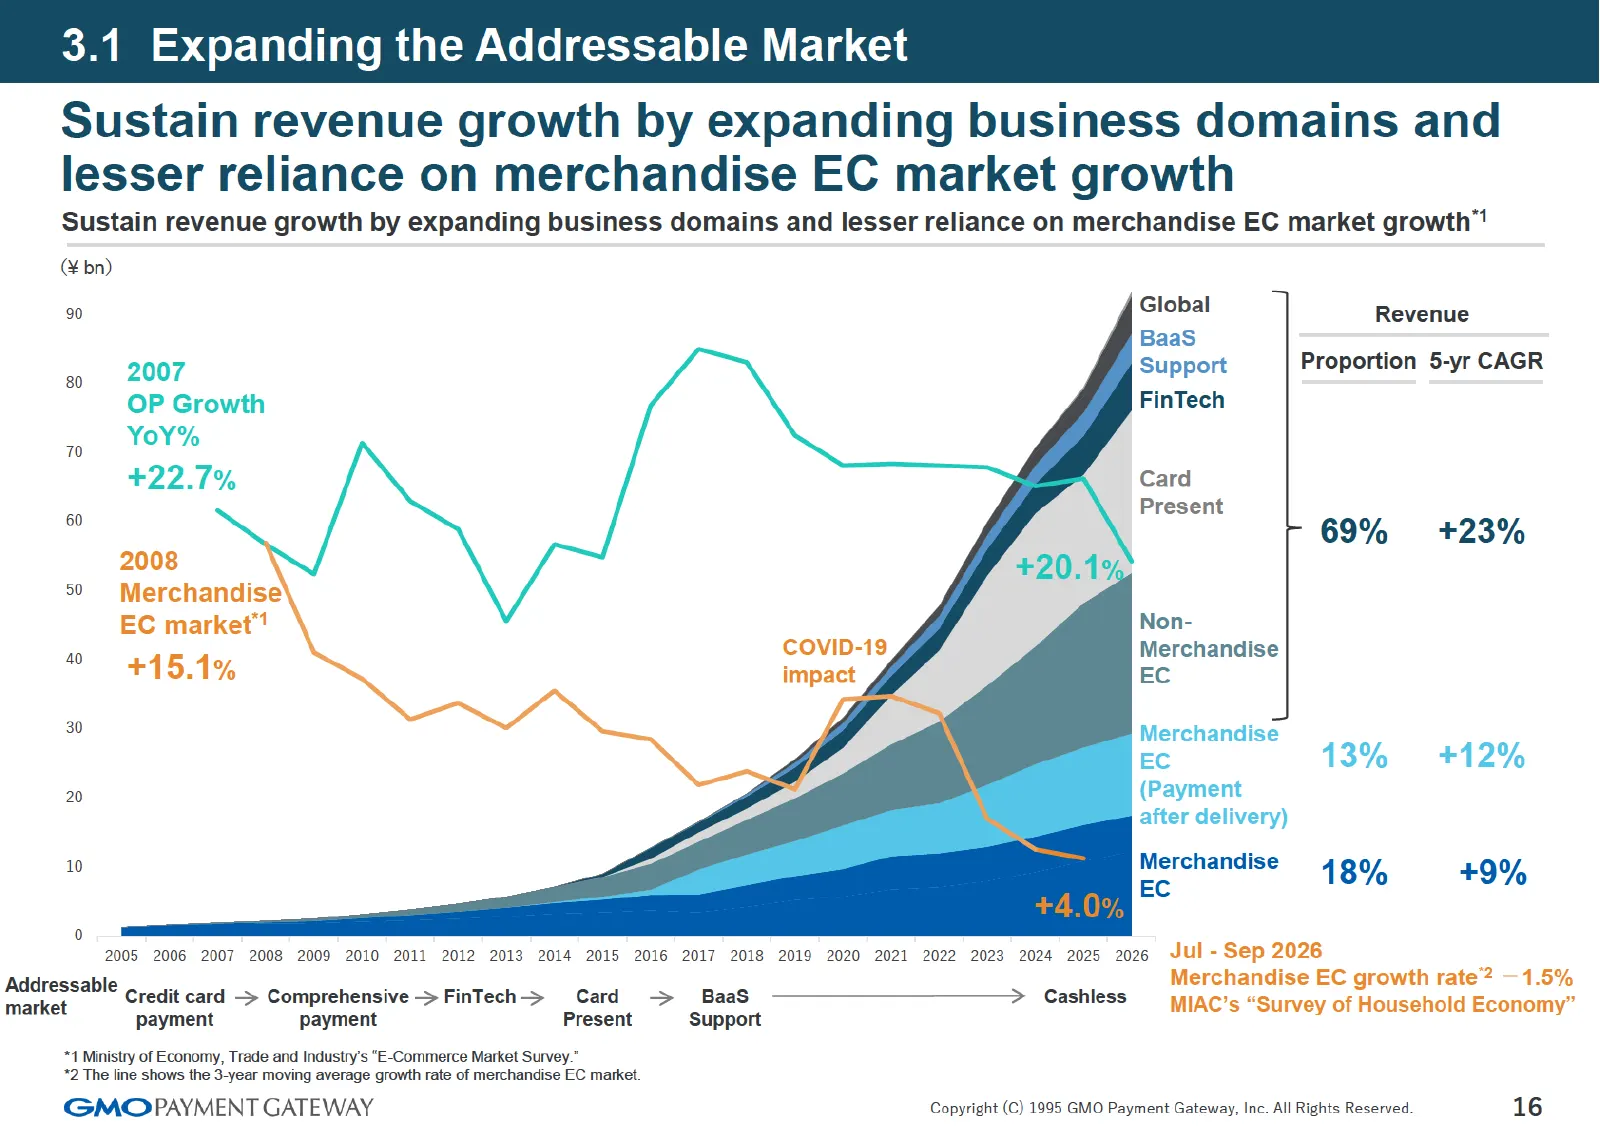
Slide 16: 3.1 Expanding the Addressable Market
3.1 Expanding the Addressable Market Sustain revenue growth by expanding business domains and lesser reliance on merchandise EC market growth Sustain revenue growth by expanding business domains and lesser reliance on merchandise EC market growth" (¥ bn) ” Global 1 Revenue BaaS : go 2007 Support Pro
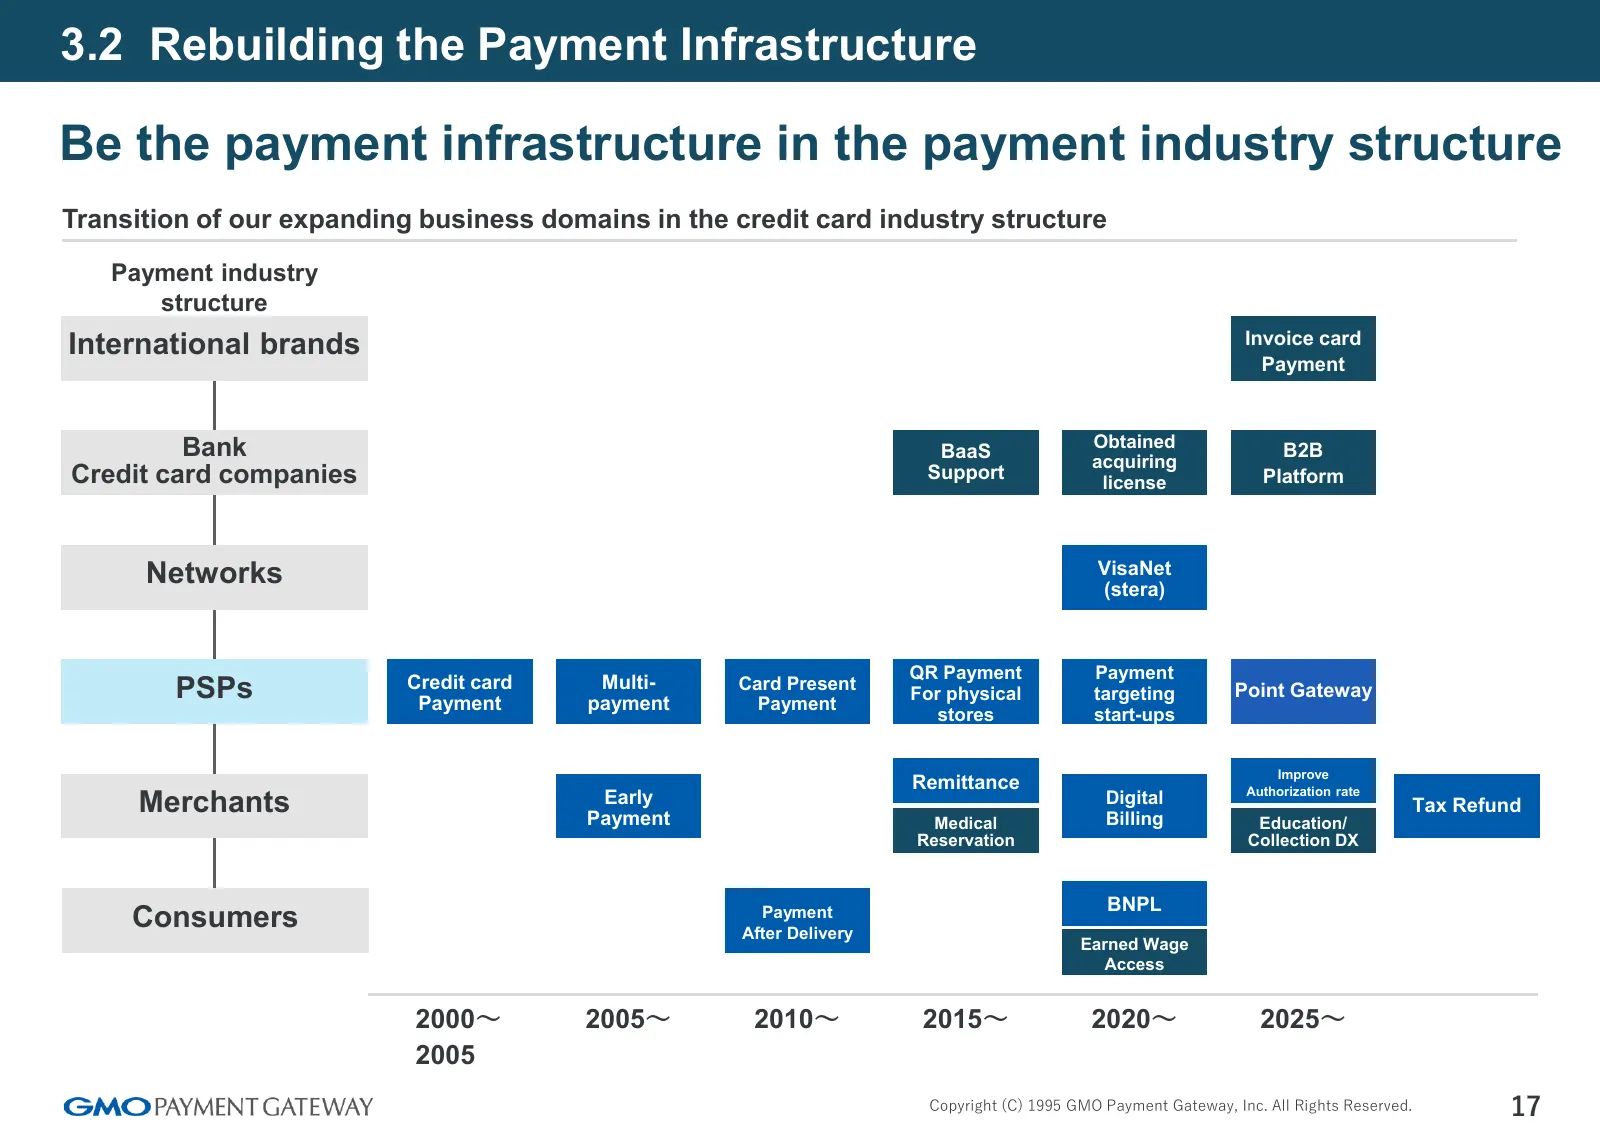
Slide 17: 3.2 Rebuilding the Payment Infrastructure
3.2 Rebuilding the Payment Infrastructure Be the payment infrastructure in the payment industry structure Transition of our expanding business domains in the credit card industry structure Payment industry structure International brands Invoice card Payment Bank Obtained B2B BaaS acquiring Credit ca
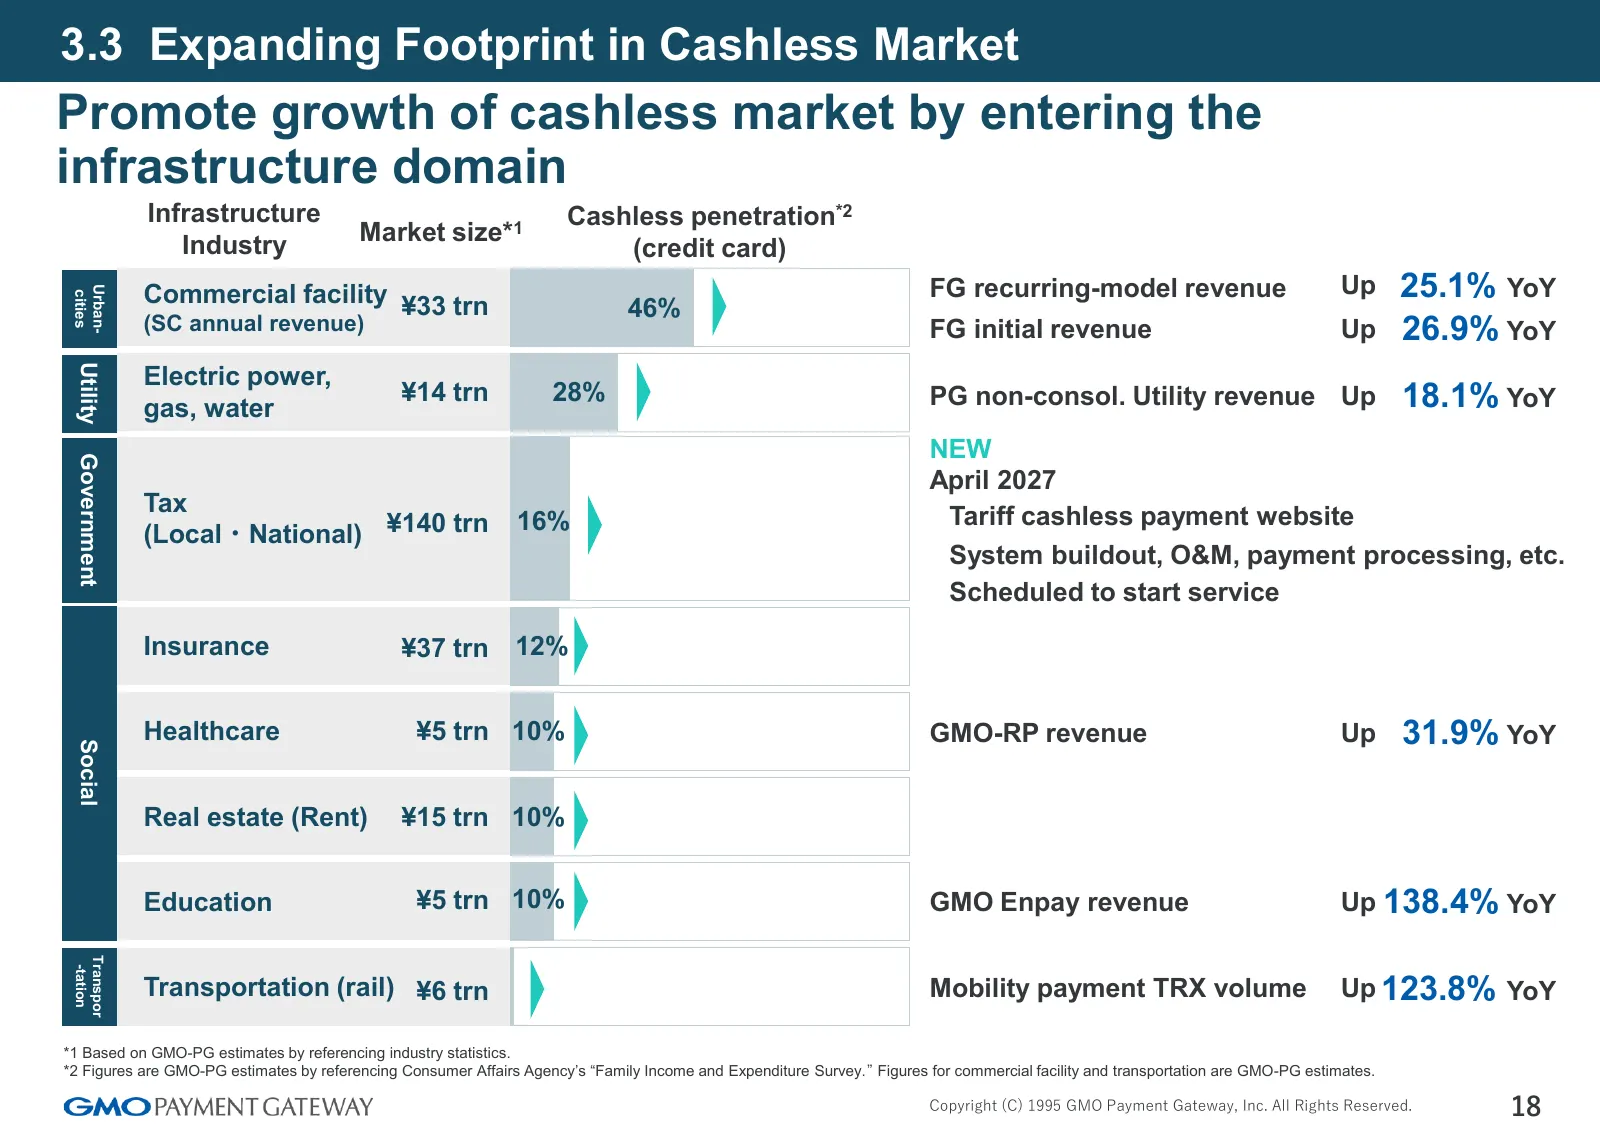
Slide 18: 3.3 Expanding Footprint in Cashless Market
3.3 Expanding Footprint in Cashless Market Promote growth of cashless market by entering the infrastructure domain Infrastructure Cashless penetration*2 Industry Market size*1 (credit card) Commercial facility ¥33 trn FG recurring-model revenue Up 25.1% YoY Urban- cities 46% (SC annual revenue) FG i
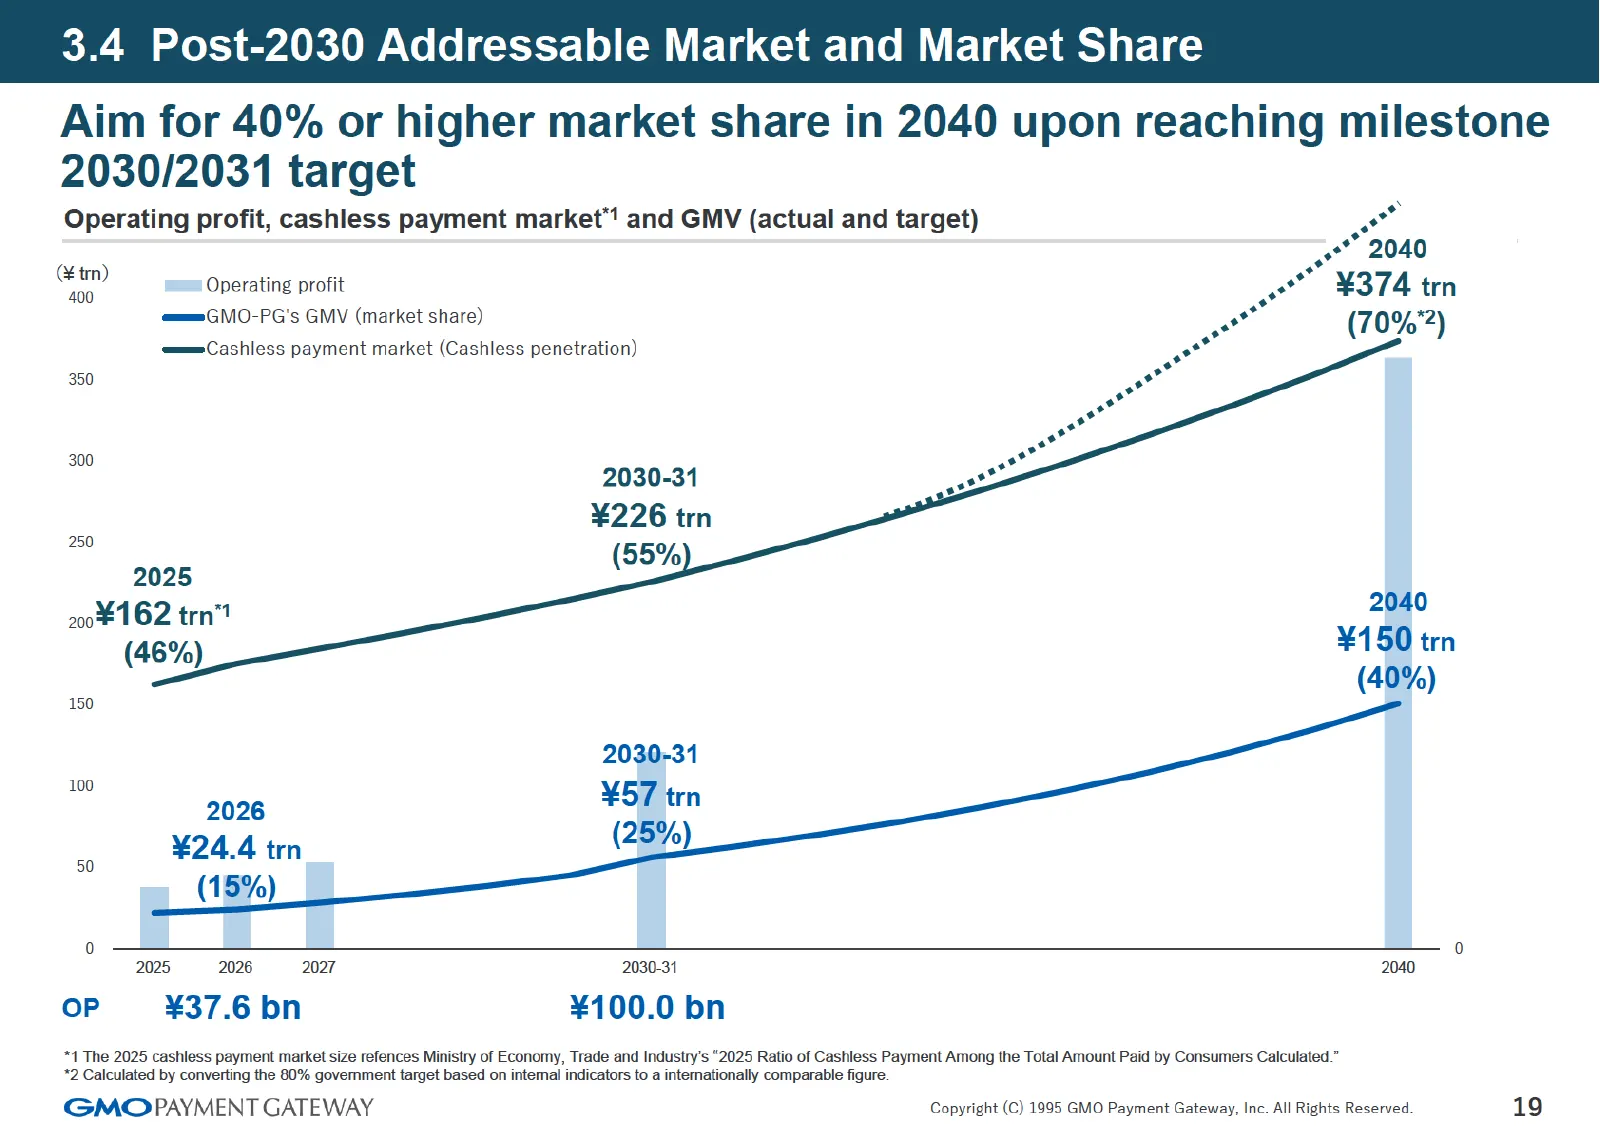
Slide 19: 3.4 Post-2030 Addressable Market and Market Share
3.4 Post-2030 Addressable Market and Market Share Aim for 40% or higher market share in 2040 upon reaching milestone 2030/2031 target Operating profit, cashless payment market’ and GMV (actual and target) 4 . wo" 2040 Gt) Operating profit oe ¥374 trn ==GMO-PG's GMV (market share) oo (70%"2) —Cashles
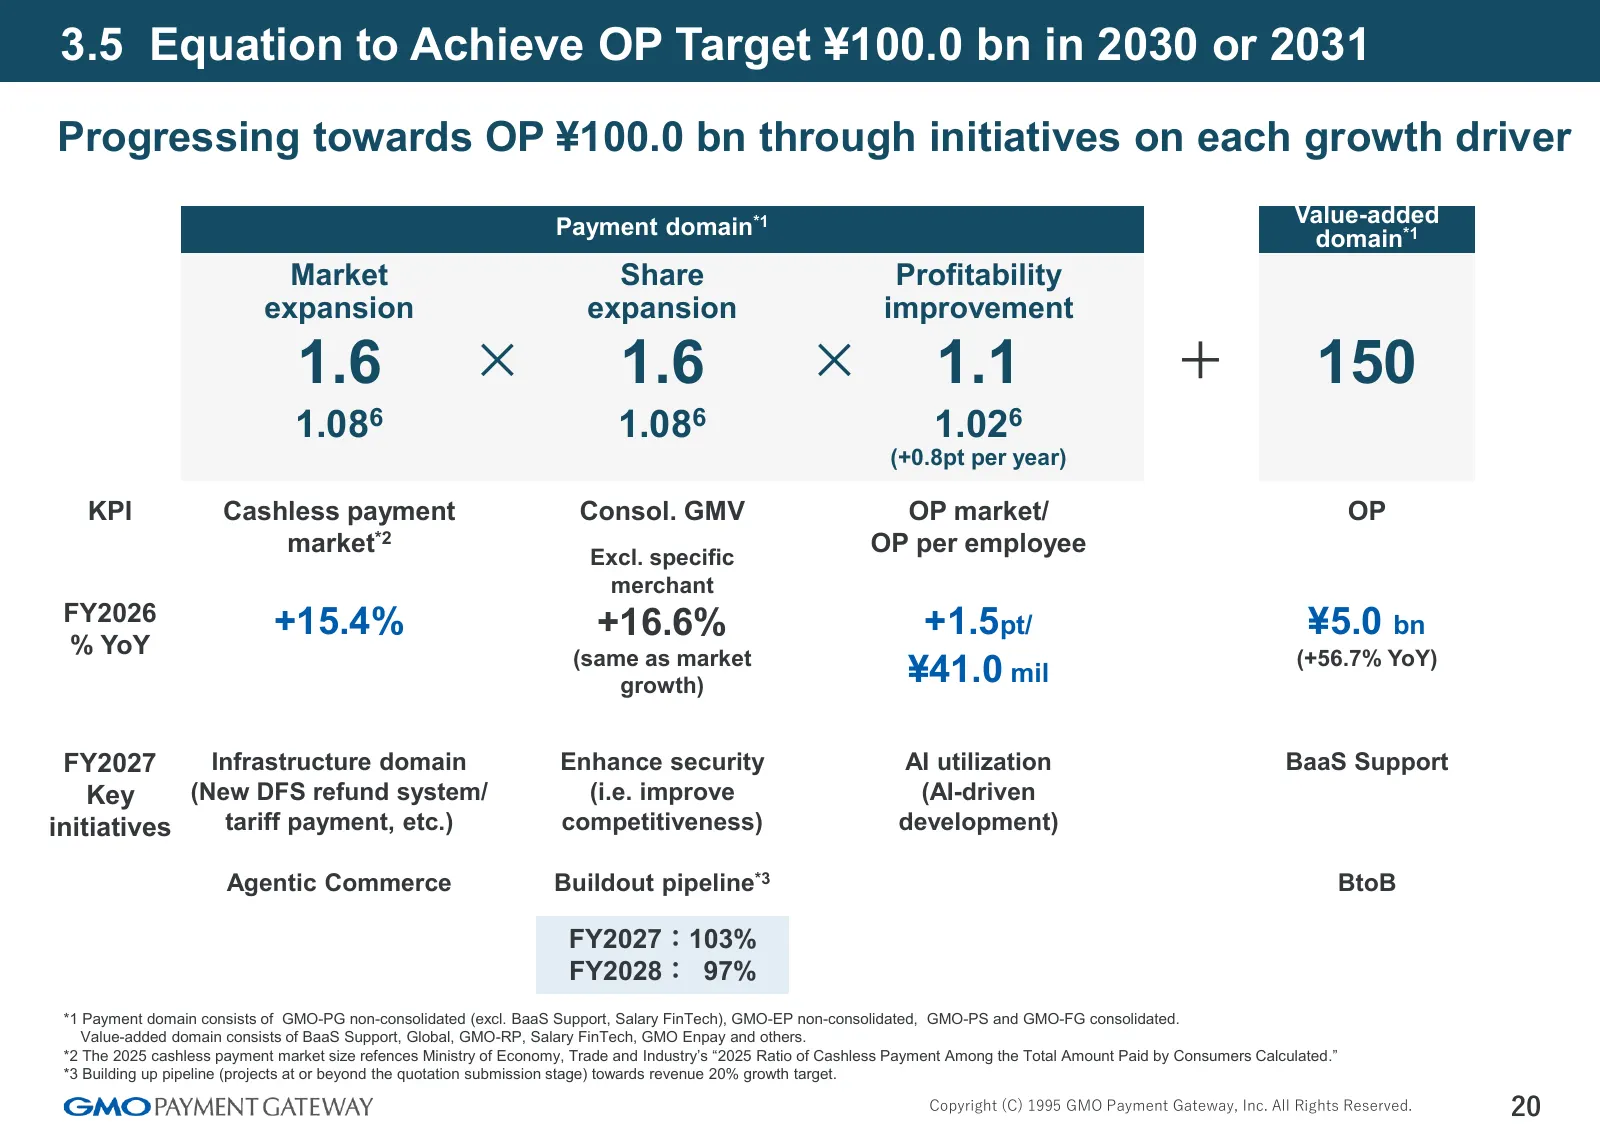
Slide 20: 3.5 Equation to Achieve OP Target ¥100.0 bn in 2030 or 2031
3.5 Equation to Achieve OP Target ¥100.0 bn in 2030 or 2031 Progressing towards OP ¥100.0 bn through initiatives on each growth driver Payment domain*1 Value-added domain*1 Market Share Profitability expansion expansion improvement 1.6 × 1.6 × 1.1 + 150 1.086 1.086 1.026 (+0.8pt per year) KPI Cashle
Slide 21: 3.6.1 Share Expansion: Large-scale Projects
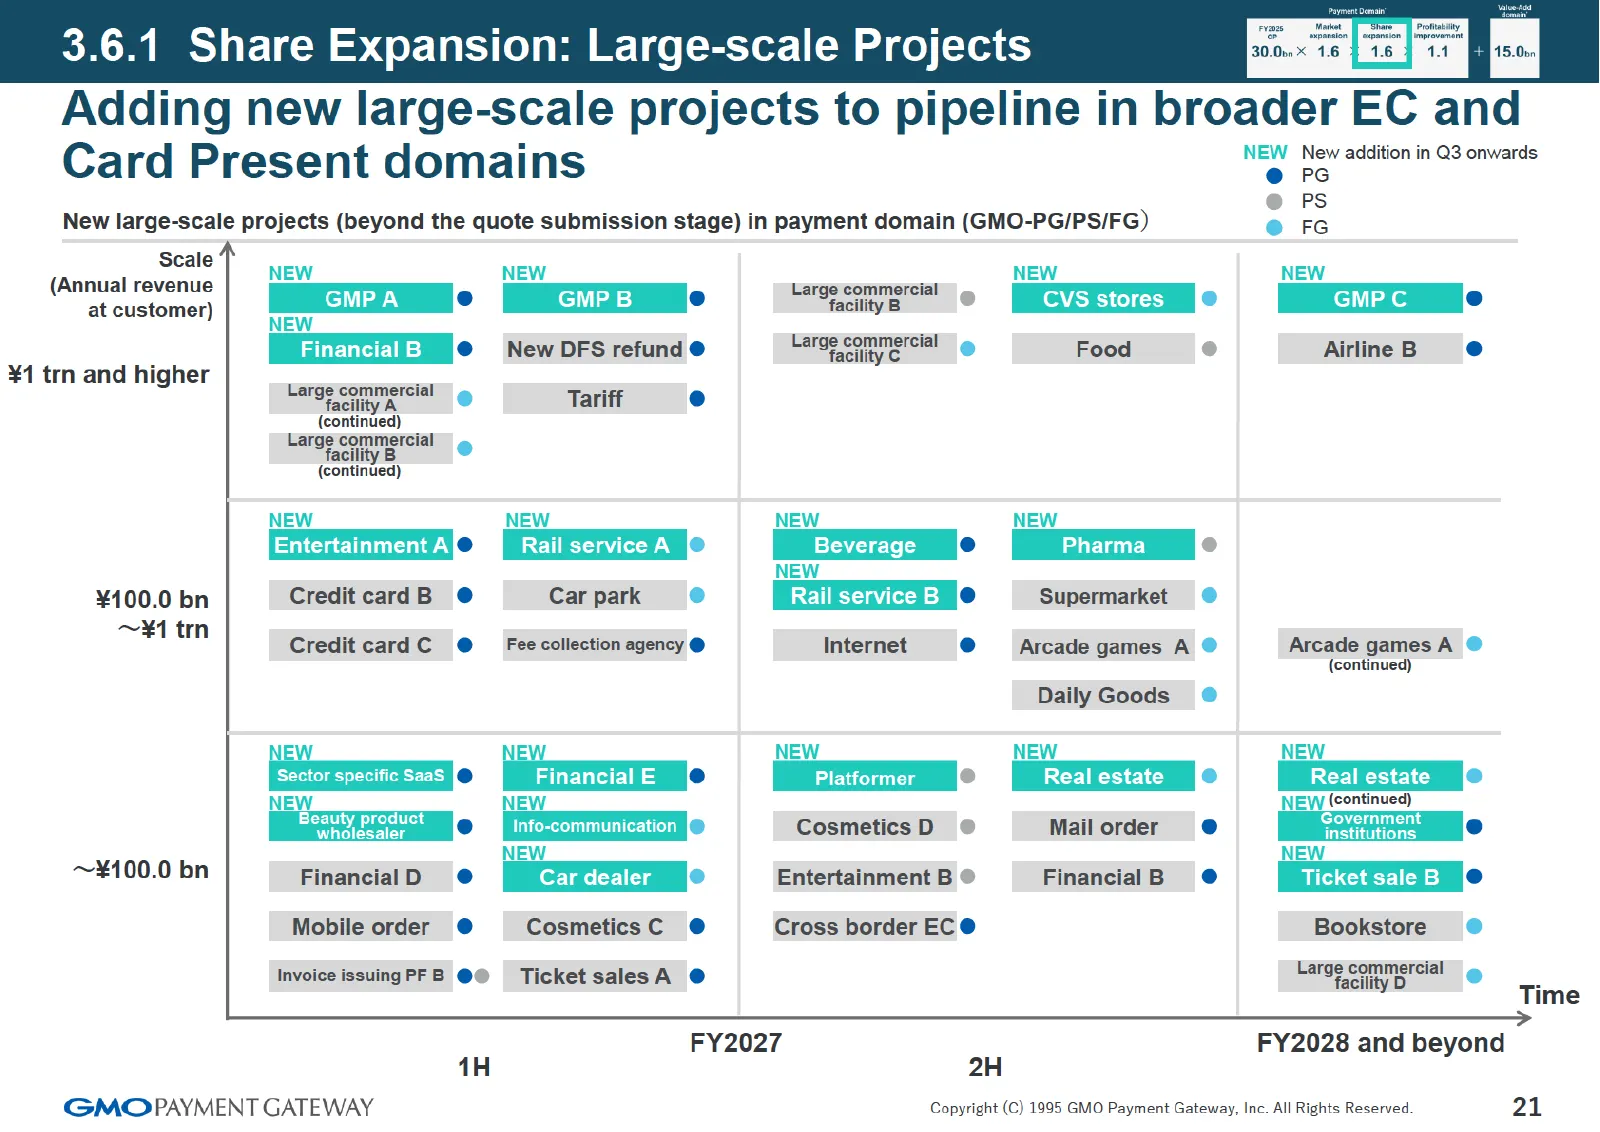
3.6.1 Share Expansion: Lar Adding new large-scale projects to pipeline in broader EC and Card Present domains NEW New addition in Q3 onwards @ PG @ PS New large-scale projects (beyond the quote submission stage) in payment domain (GMO-PG/PS/FG) e@ FG Scale (Annual revenue NeW NEW Large commercial NE
Slide 22: 3.6.2 Share Expansion: Card Present Cashless Market
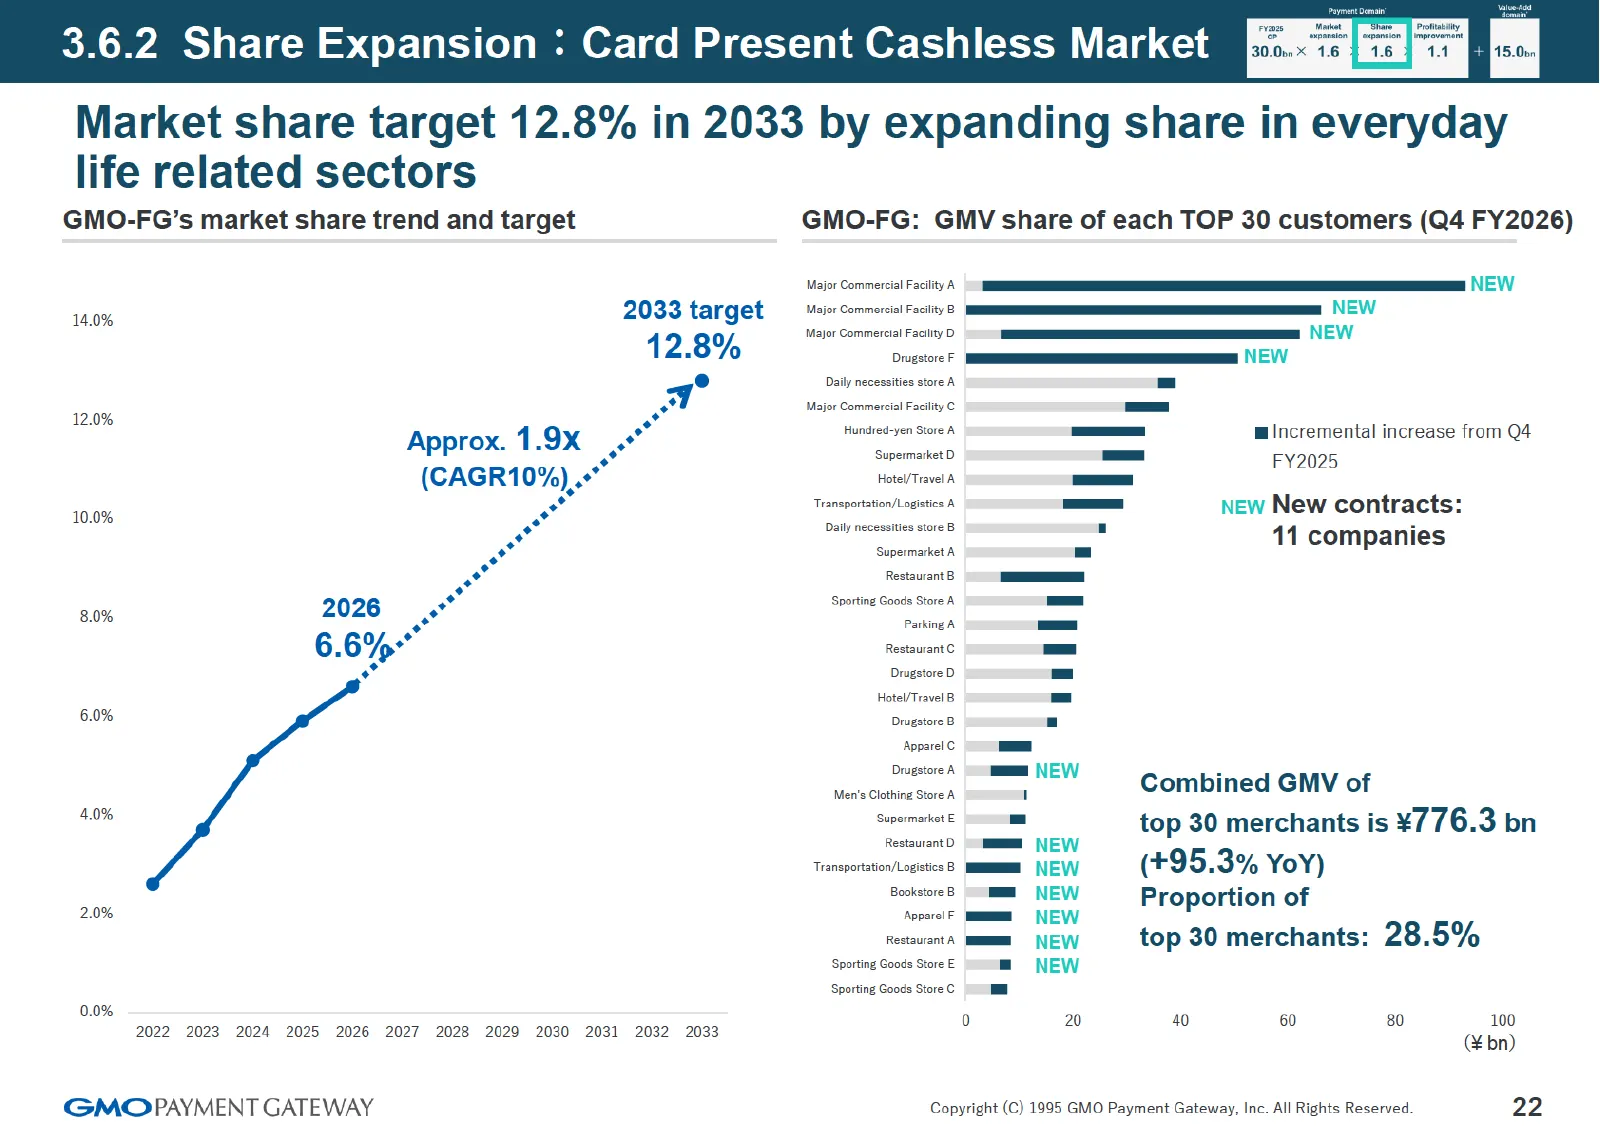
3.6.2 Share Expansion : Card Present Cashless Market Market share target 12.8% in 2033 by expanding share in everyday life related sectors GMO-FG’s market share trend and target GMO-FG: GMV share of each TOP 30 customers (Q4 FY2026) NEW Major Commercial Facility A 140% 2033 target Mojor Commercial F
Slide 23: 3.7.1 Value-added Domain
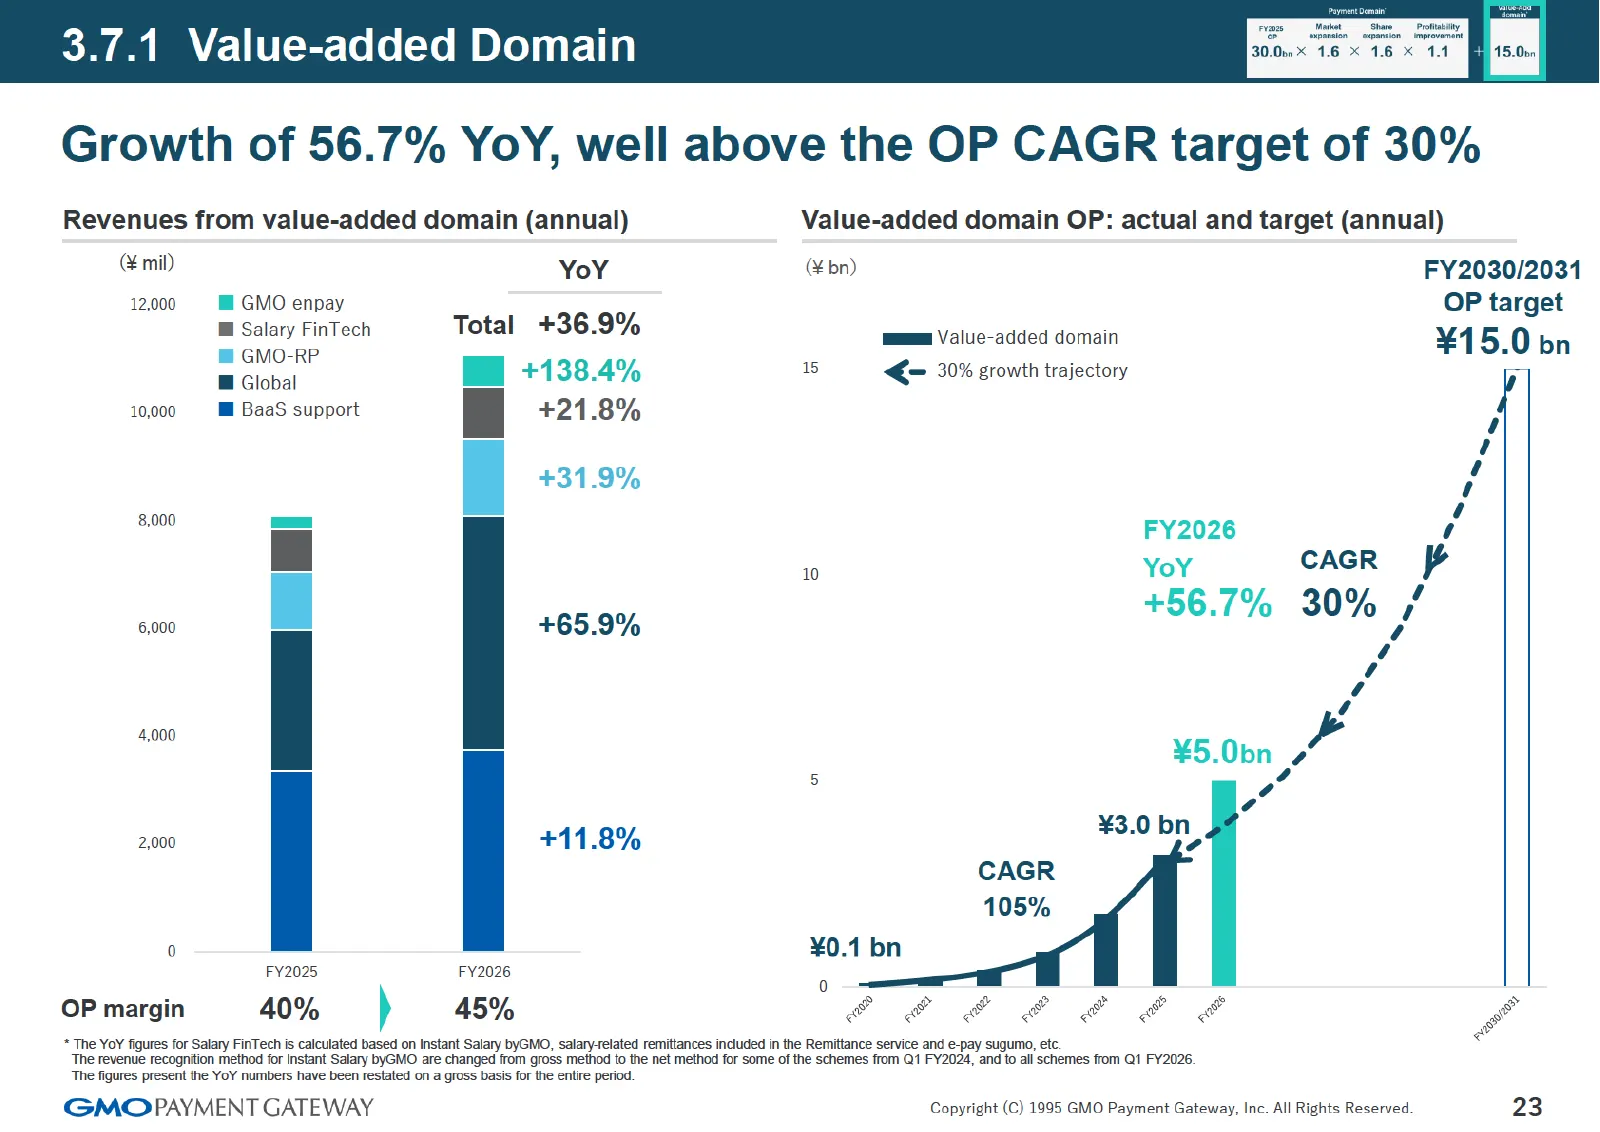
3.7.1 Value-added Domain Growth of 56.7% YoY, well above the OP CAGR target of 30% Revenues from value-added domain (annual) Value-added domain OP: actual and target (annual) (mil) YoY (¥bn) FY2030/2031 12,000 ‘Mi GMO enpay OP target @ Salary FinTech Total +36.9% mama Value-added domain ¥15.0 bn / v
Slide 24: 3.7.2 Value-Added Domain: Earnings Summary for Global
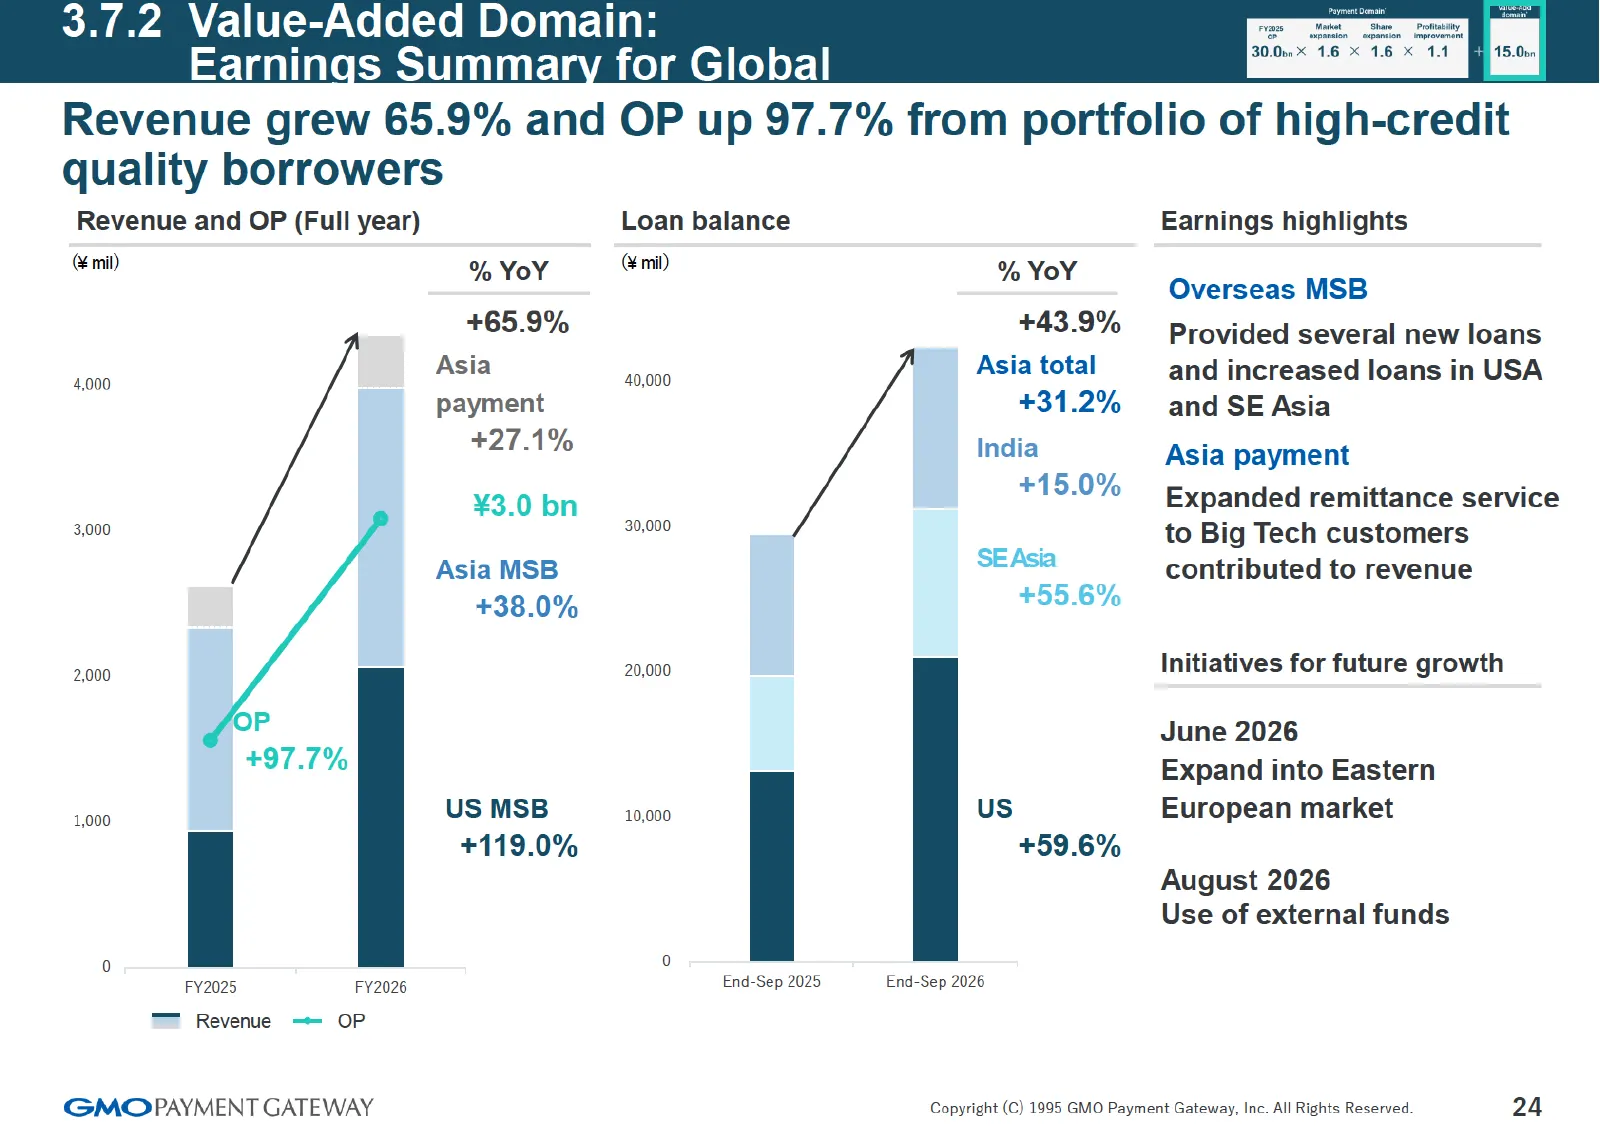
3./.2 Value-Added Domain: Earnings Summary for Global Revenue grew 65.9% and OP up 97.7% from portfolio of high-credit quality borrowers Revenue and OP (Full year) Loan balance Earnings highlights & mi % YoY @ mi) % YoY Overseas MSB +65.9% +43.9% Provided several new loans 000 Asia 40,00 Asia total
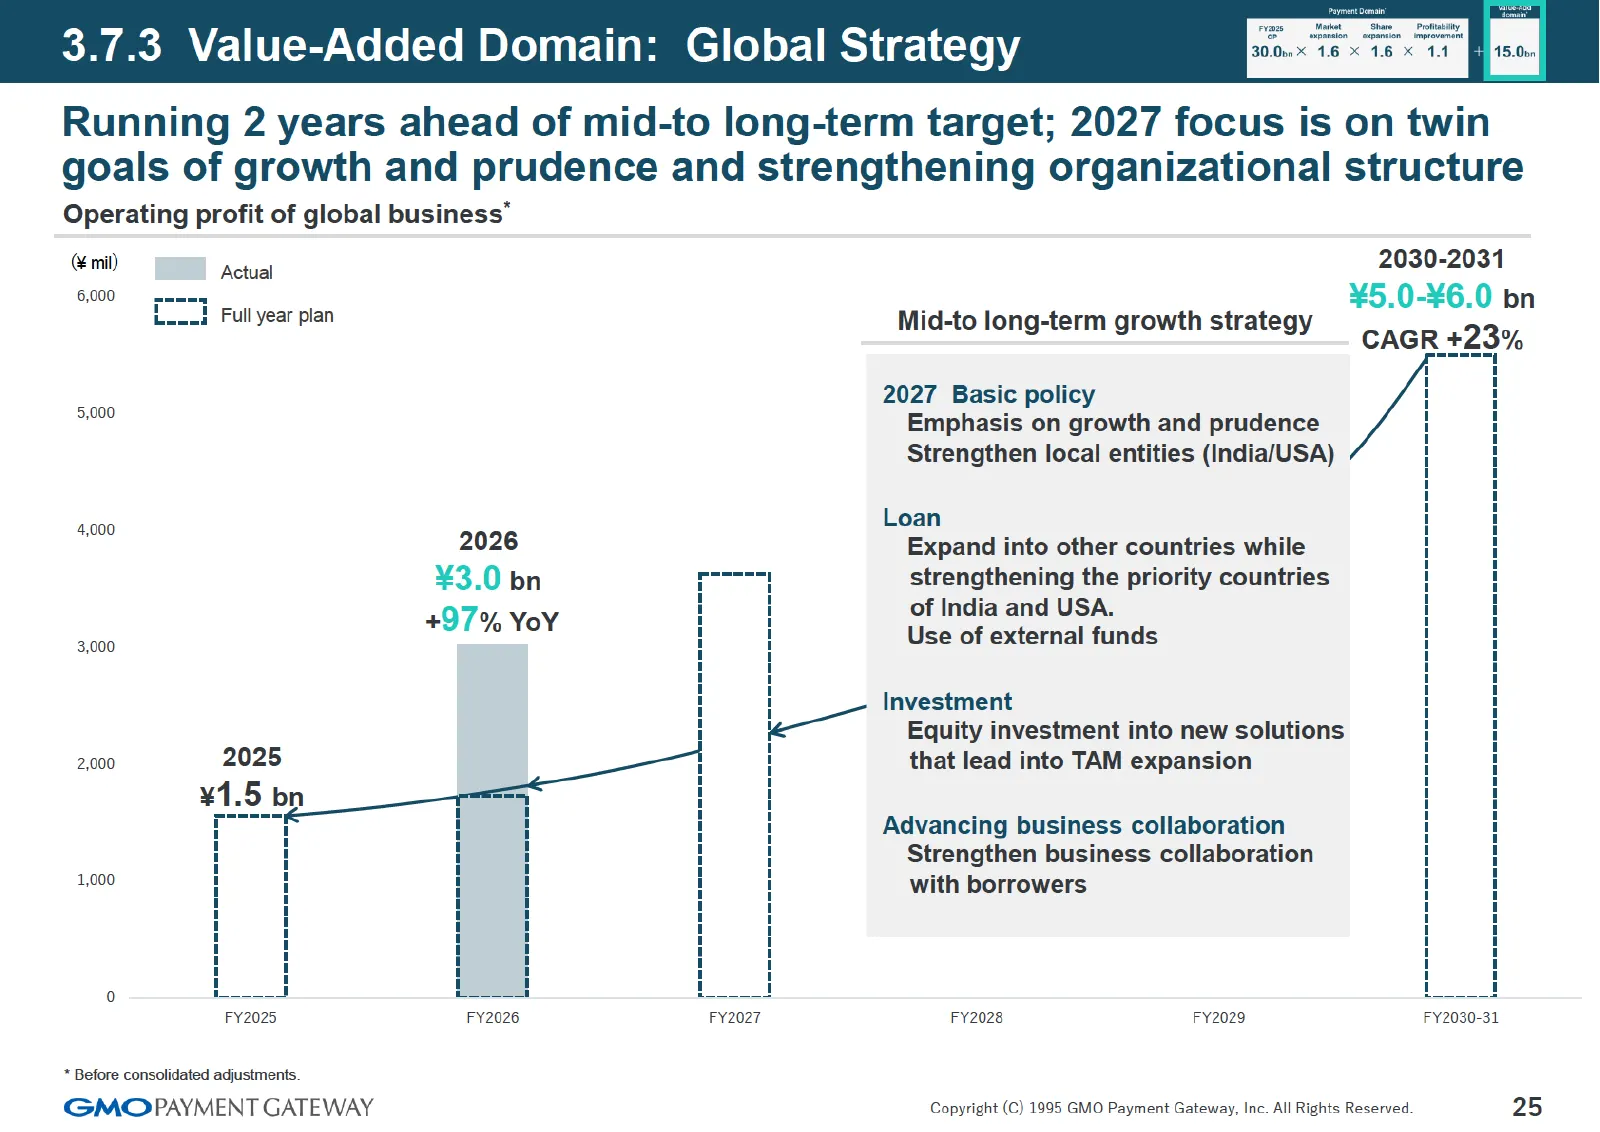
Slide 25: 3.7.3 Value-Added Domain: Global Strategy
3.7.3 Value-Added Domain: Global Strategy Running 2 years ahead of mid-to long-term target; 2027 focus is on twin goals of growth and prudence and strengthening organizational structure Operating profit of global business” em _ 2030-2031 *O° LIZZ ruyear pan Mid-to long-t with strategy No:0-¥6.0 bn L
Slide 26: 4. Financial Strategy and Sustainability
4. Financial Strategy and Sustainability GMO PAYMENT GATEWAY Copyright (C) 1995 GMO Payment Gateway, Inc. All Rights Reserved. 26
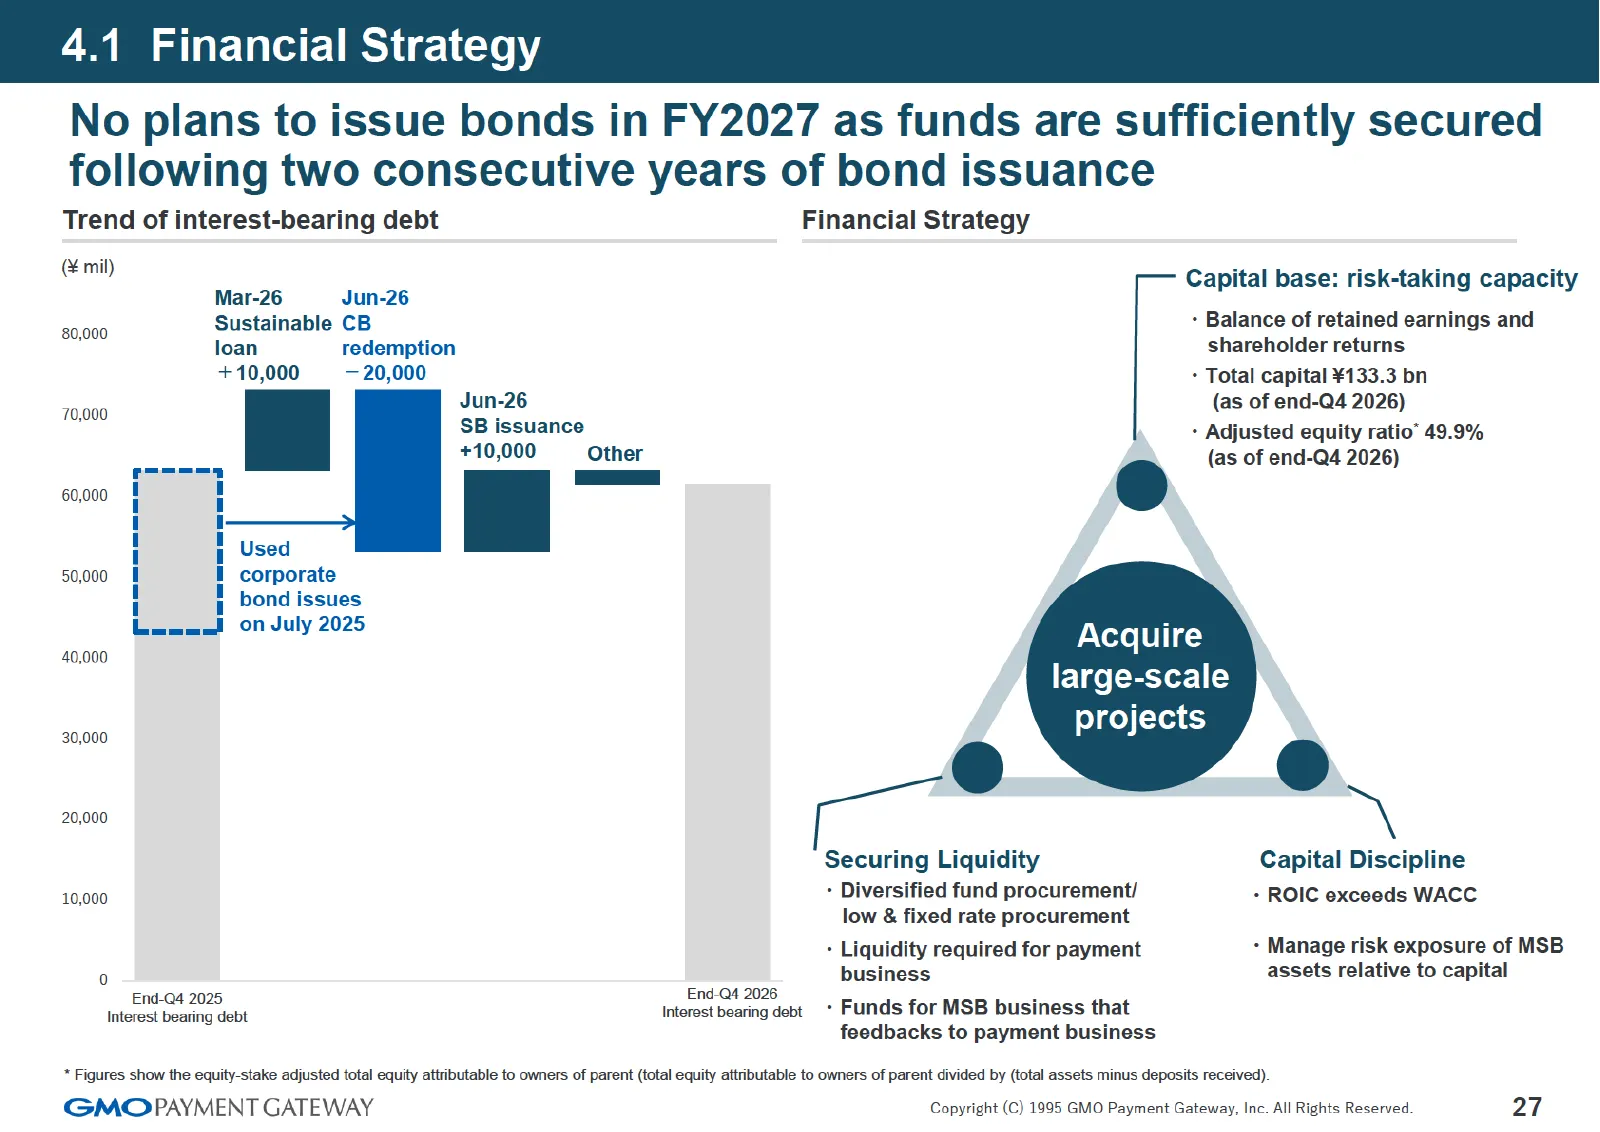
Slide 27: 4.1 Financial Strategy
4.1 Financial Strategy No plans to issue bonds in FY2027 as funds are sufficiently secured following two consecutive years of bond issuance Trend of interest-bearing debt Financial Strategy (mil) . a . Capital base: risk-taking capaci Mar-26 Jun-26 P 9 capacity 80,000 Sustainable CB : Balance of ret
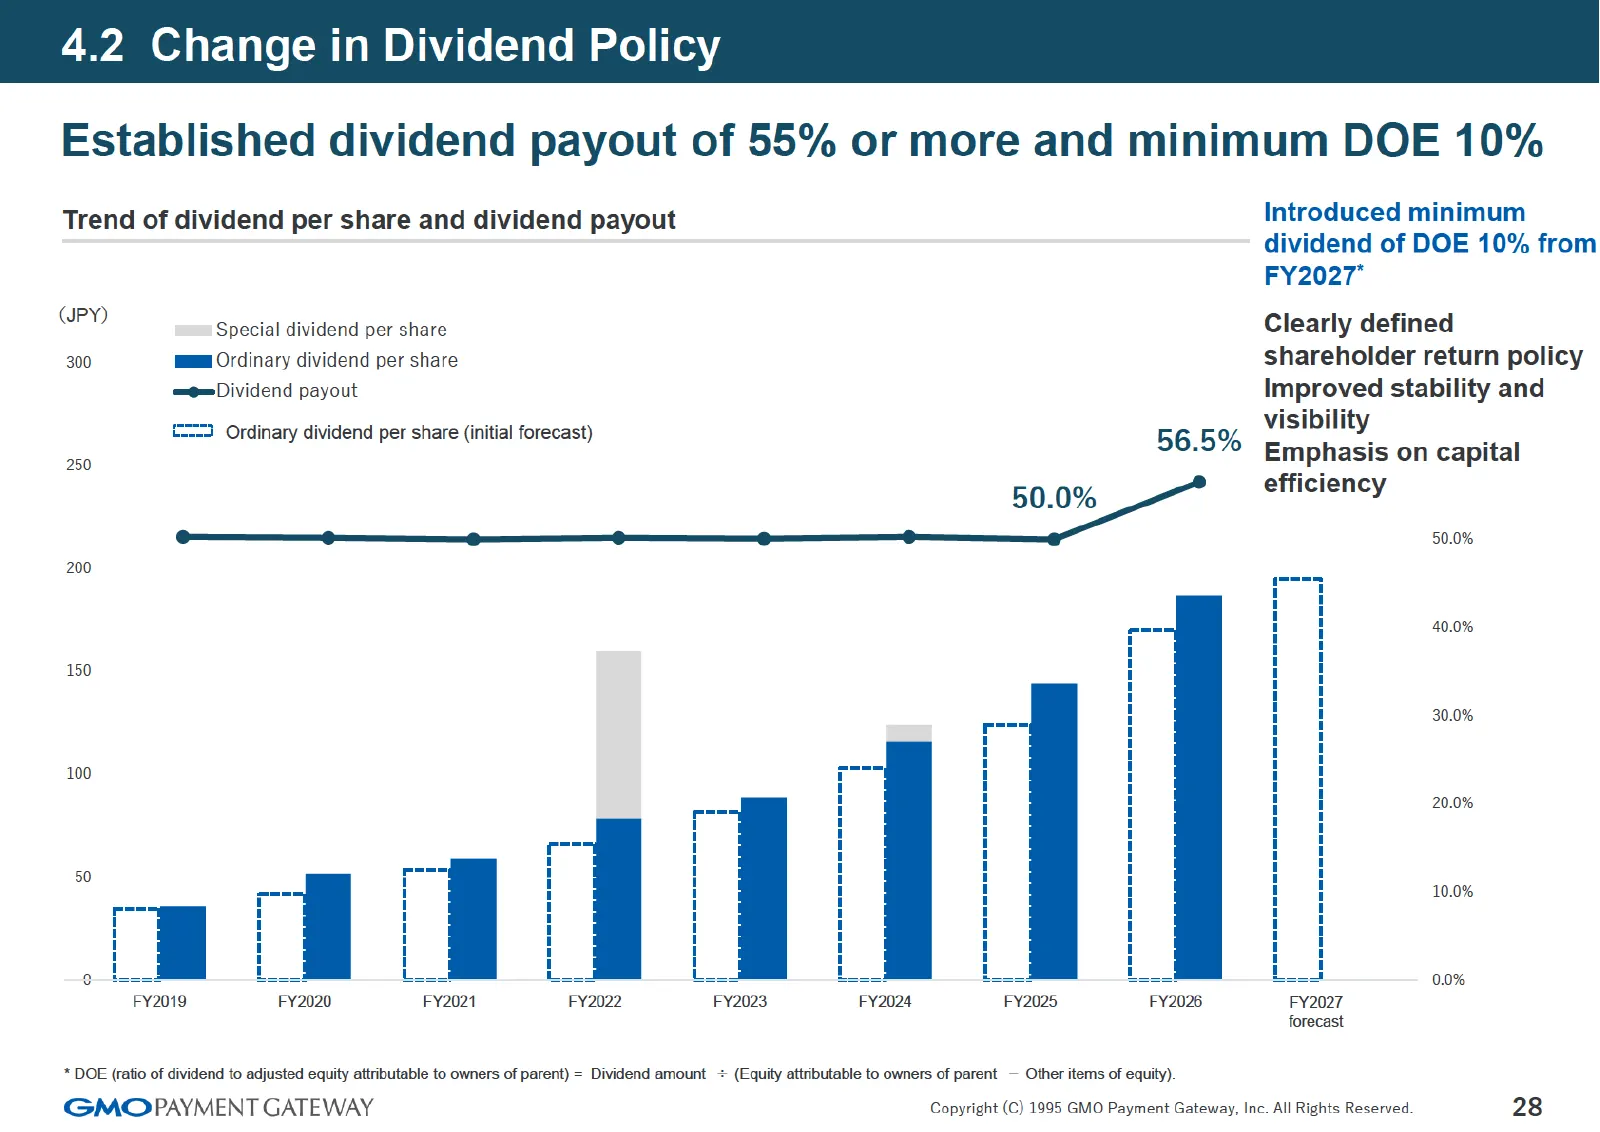
Slide 28: 4.2 Change in Dividend Policy
4.2 Change in Dividend Policy Established dividend payout of 55% or more and minimum DOE 10% Trend of dividend per share and dividend payout Introduced minimum dividend of DOE 10% from FY2027* wey) Special dividend per share Clearly defined 300 mam Ordinary dividend per share shareholder return poli
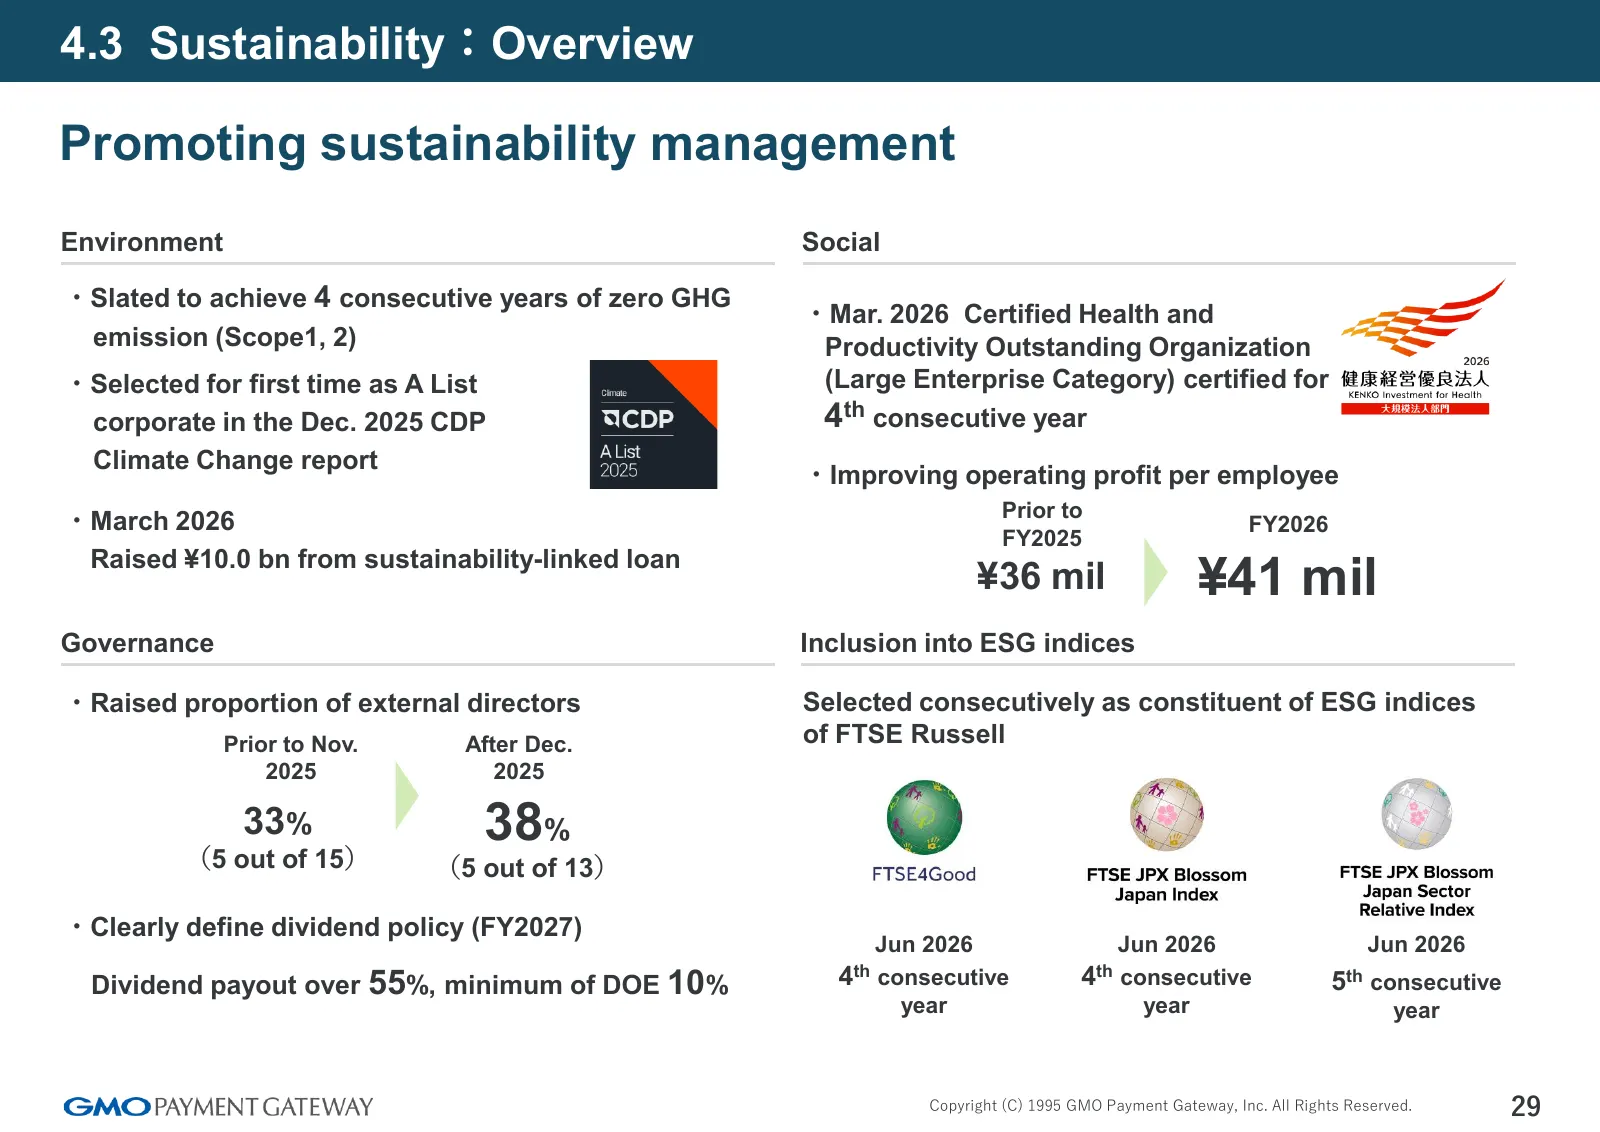
Slide 29: 4.3 Sustainability: Overview
4.3 Sustainability:Overview Promoting sustainability management Environment Social ・Slated to achieve 4 consecutive years of zero GHG ・Mar. 2026 Certified Health and emission (Scope1, 2) Productivity Outstanding Organization ・Selected for first time as A List (Large Enterprise Category) certified fo
Slide 30: 5. Financial Highlights and Reference Materials
5. Financial Highlights and Reference Materials GMO PAYMENT GATEWAY Copyright (C) 1995 GMO Payment Gateway, Inc. All Rights Reserved. 30
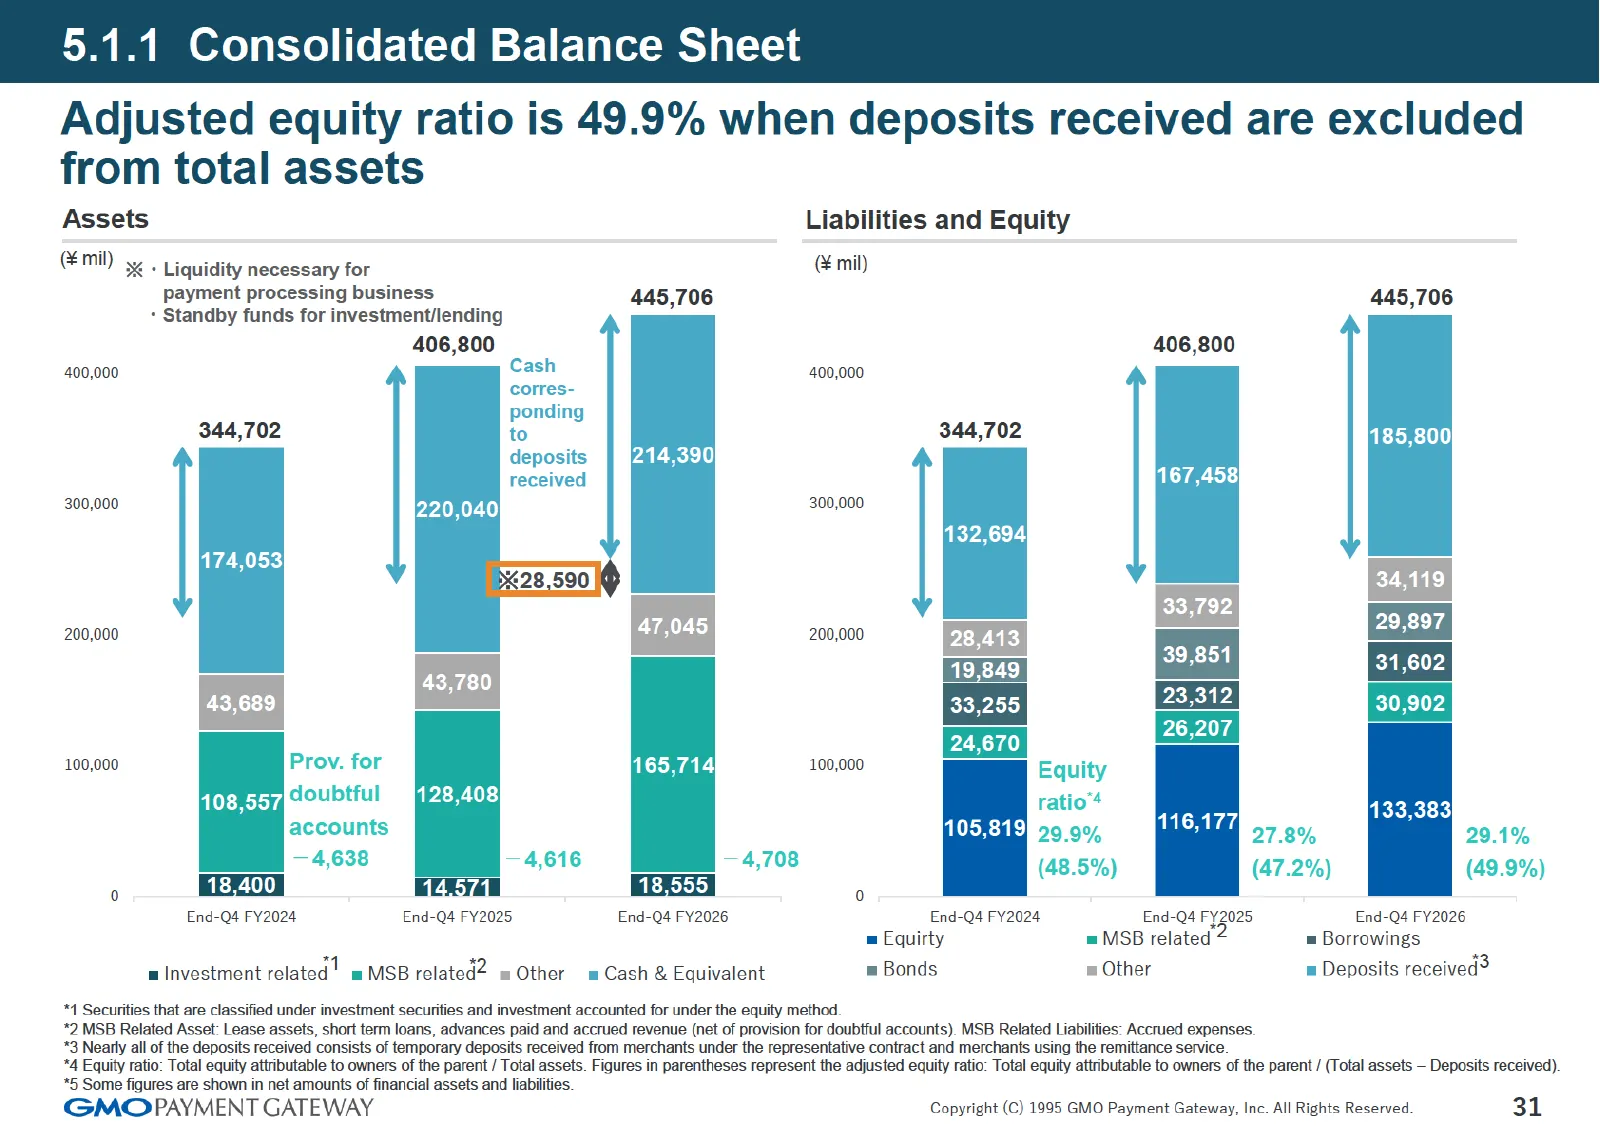
Slide 31: 5.1.1 Consolidated Balance Sheet
5.1.1 Consolidated Balance Sheet Adjusted equity ratio is 49.9% when deposits received are excluded from total assets Assets Liabilities and Equity (Emil) x . Liquidity necessary for mil) payment processing business 445,706 445,706 * Standby funds for investment/lending 406,800 406,800 400,000 Cash
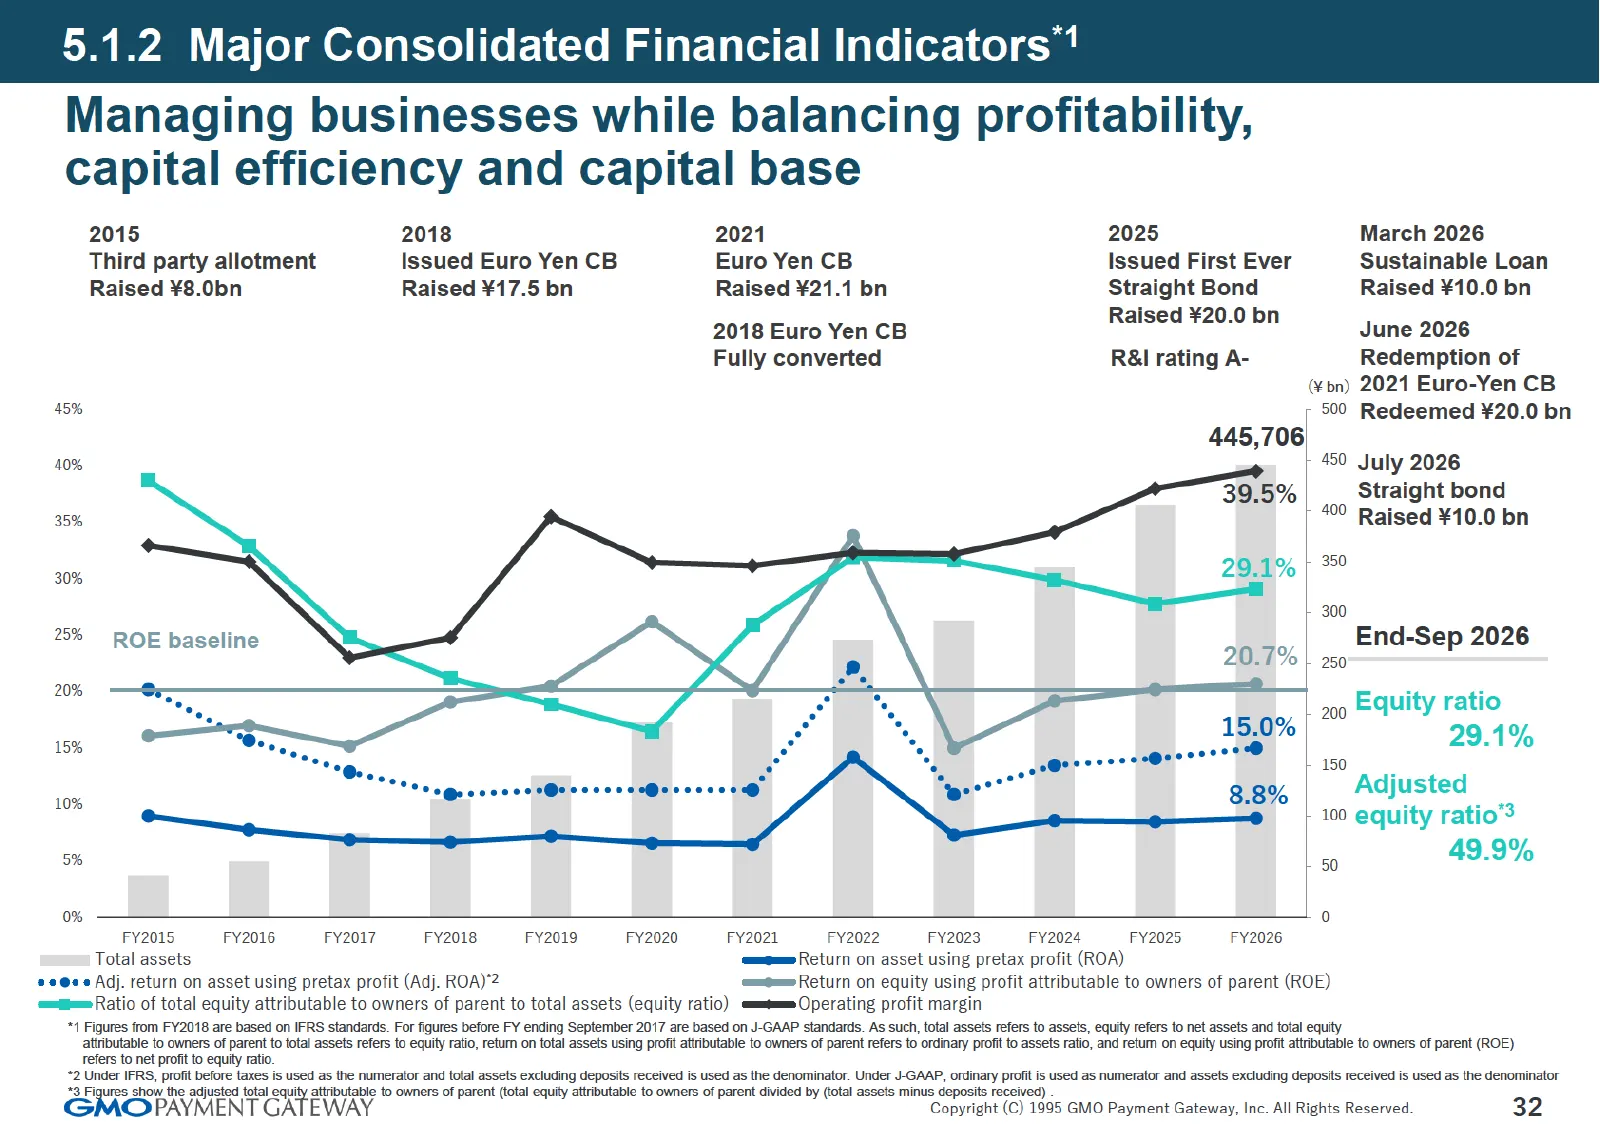
Slide 32: 5.1.2 Major Consolidated Financial Indicators
1.2 Major Consolidated Financial Indicators Managing businesses while balancing profitability, capital efficiency and capital base 2015 2018 2021 2025 March 2026 Third party allotment Issued Euro Yen CB Euro Yen CB Issued First Ever Sustainable Loan Raised ¥8.0bn Raised ¥17.5 bn Raised ¥21.1 bn Stra
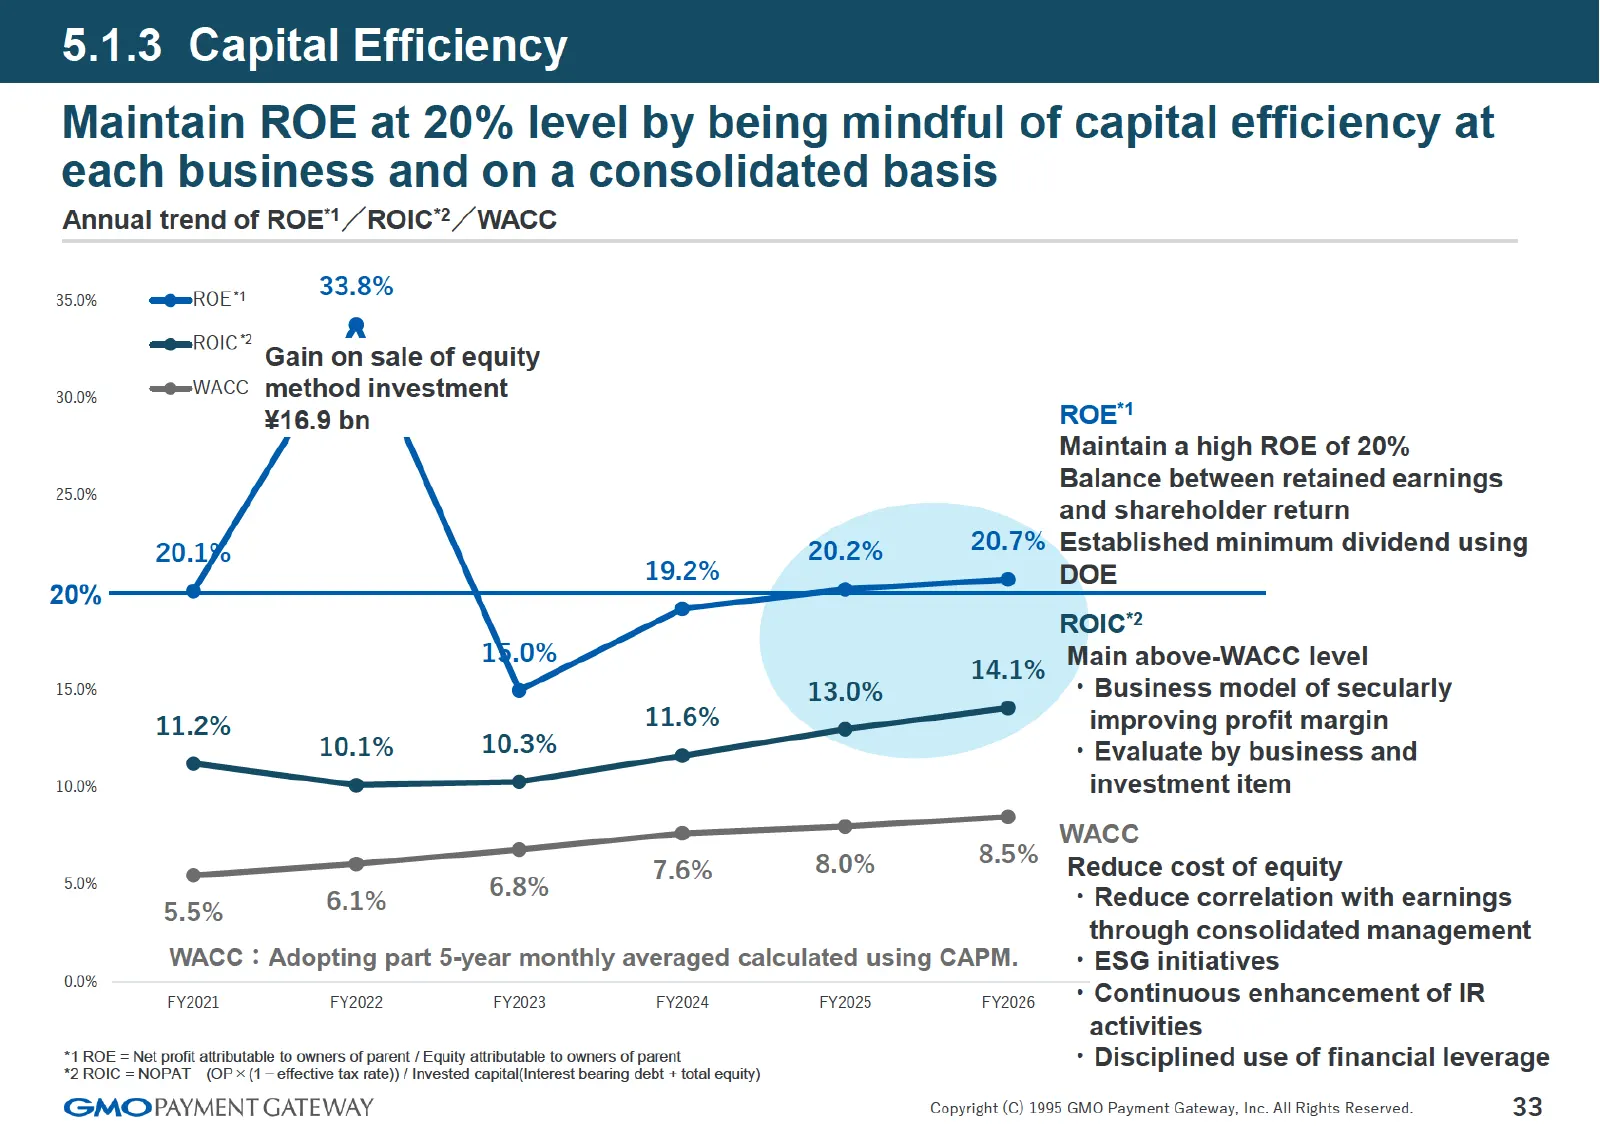
Slide 33: 5.1.3 Capital Efficiency
) Maintain ROE at 20% level by being mindful of capital efficiency at each business and on a consolidated basis Annual trend of ROE’ /ROIC2,“WACG .1.3 Capital Efficiency 33.8% R Gain on sale of equity 30.0% =®=WACC method investment ¥16.9 bn ROE" Maintain a high ROE of 20% Balance between retained e
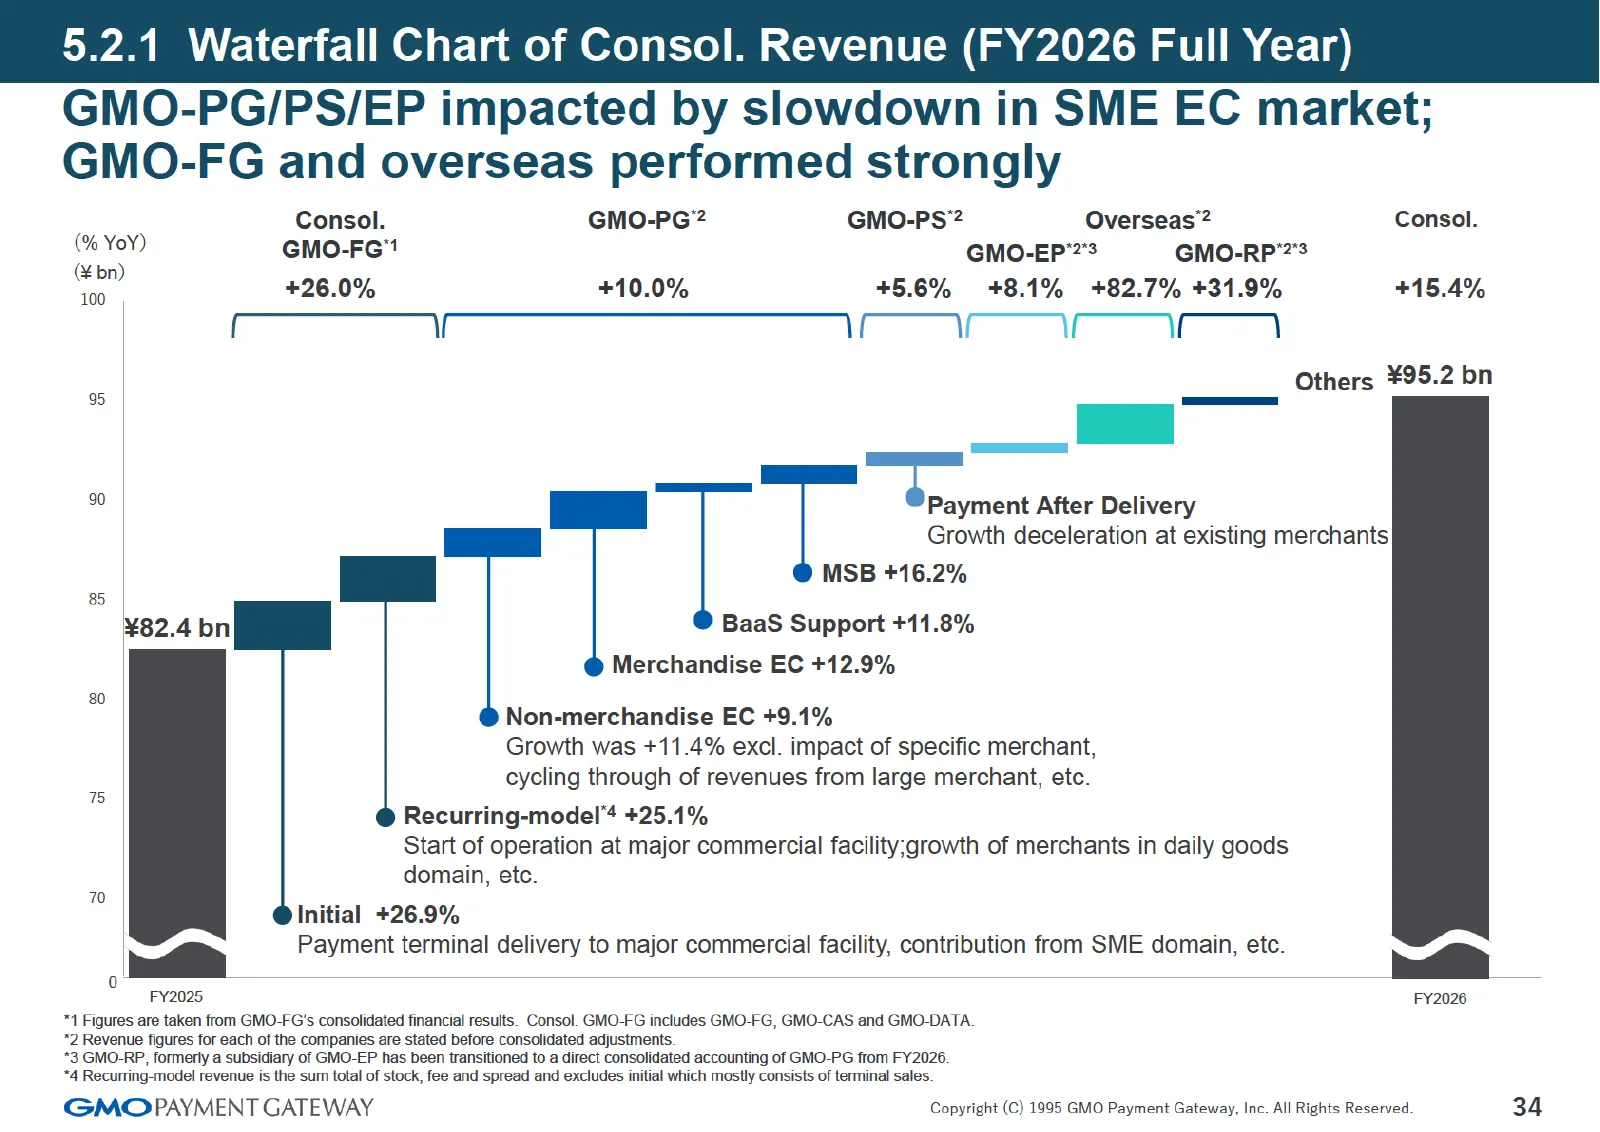
Slide 34: 5.2.1 Waterfall Chart of Consol. Revenue (FY2026 Full Year)
5.2.1 Waterfall Chart of Consol. Revenue (FY2026 Full Year GMO-PG/PS/EP impacted by slowdown in SME EC market; GMO-FG and overseas performed strongly Consol. GMO-PG? GMO-PS? Overseas? Consol. ae GMO-FG" GMO-EP’?"3 GMO-RP’?’s vce. +26.0% +10.0% 45.6% 48.1% +82.7% +31.9% +15.4% f V Vf Vf iT iT \ Other
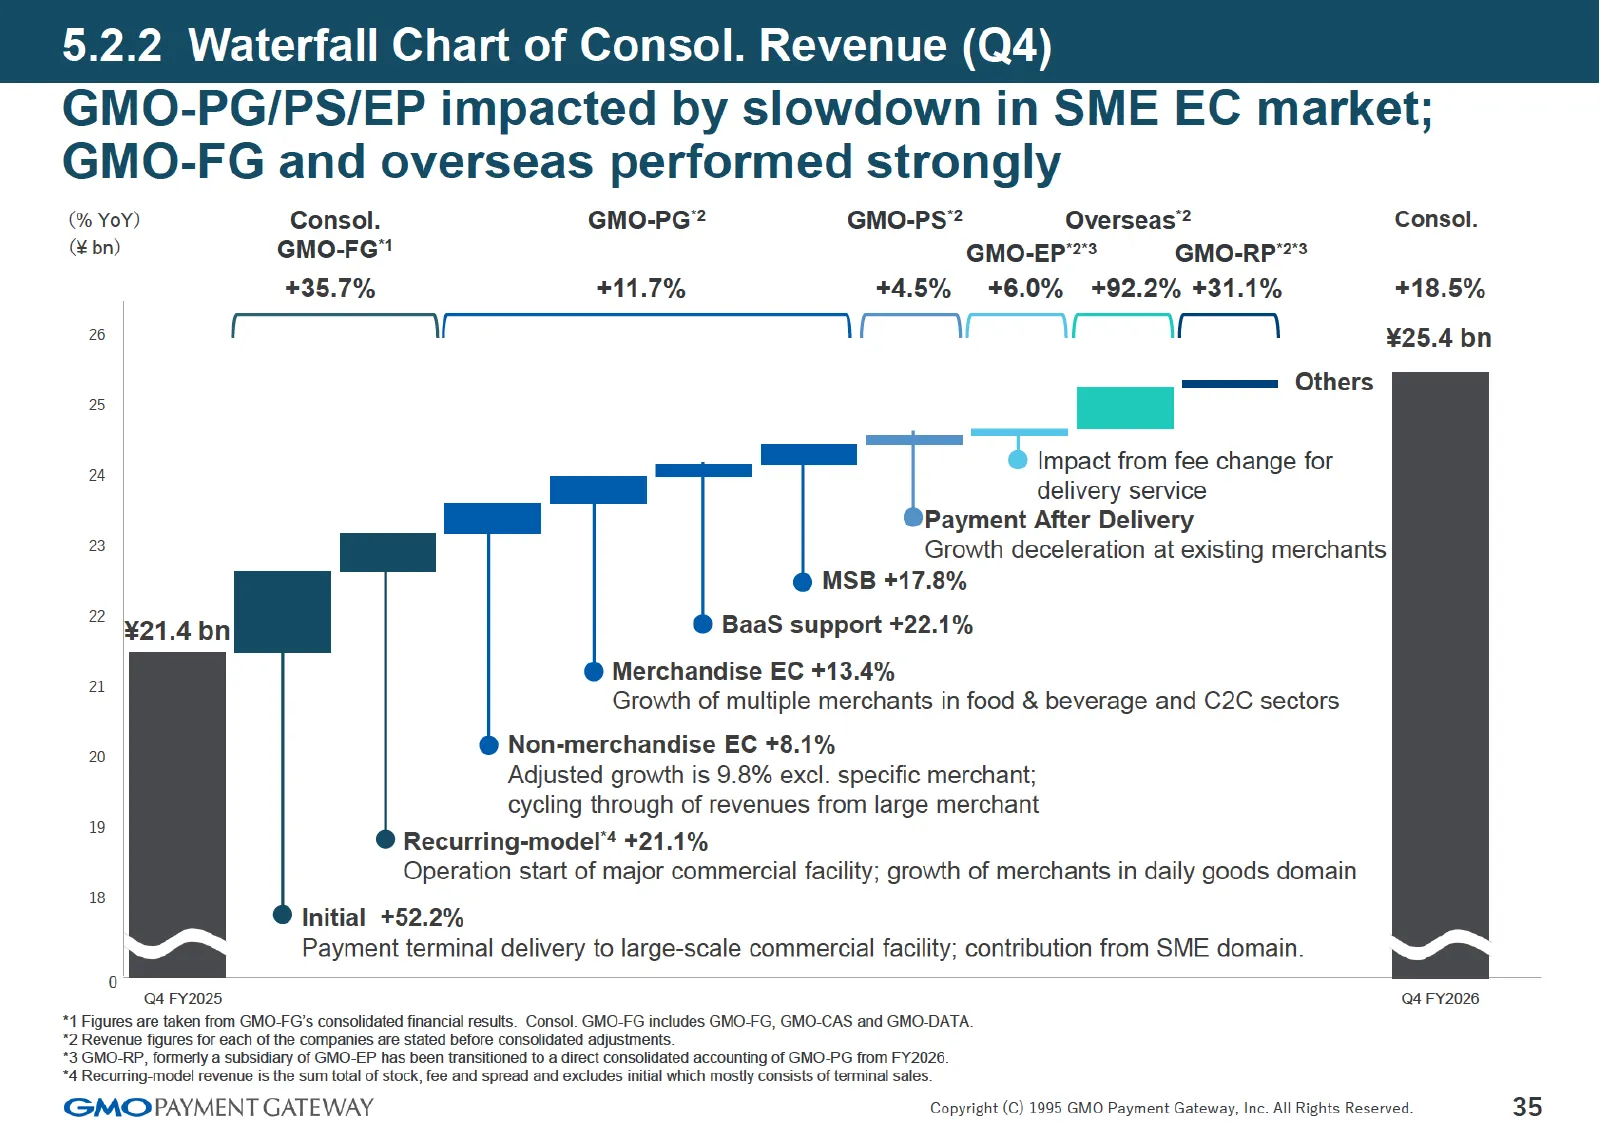
Slide 35: 5.2.2 Waterfall Chart of Consol. Revenue (Q4)
5.2.2 Waterfall Chart of Consol. Revenue (Q4) GMO-PG/PS/EP impacted by slowdown in SME EC market; GMO-FG and overseas performed strongly (% YoY) Consol. GMO-PG? GMO-PS? Overseas? Consol. (bn) GMO-FG" GMO-EP’?’s GMO-RP*?* +35.7% +11.7% 44.5% +6.0% +92.2% +31.1% +18.5% s f V Vf V Mf Mf 1 25.4 bn Other
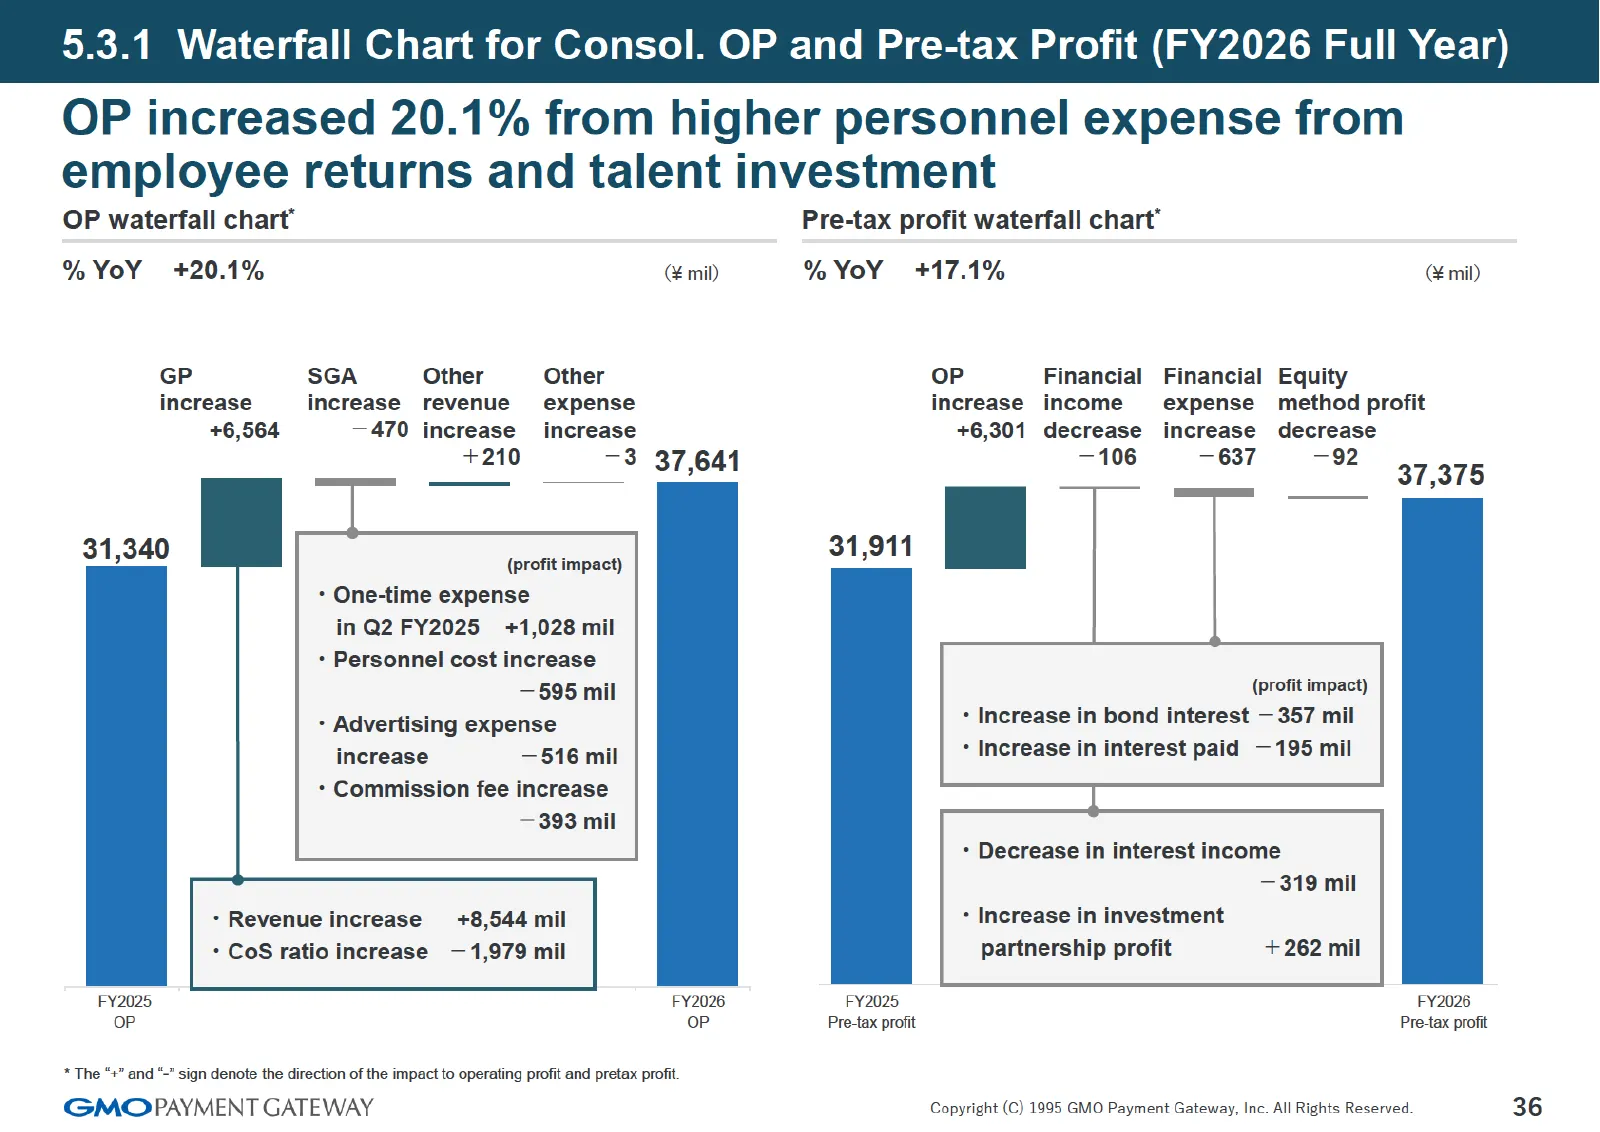
Slide 36: 5.3.1 Waterfall Chart for Consol. OP and Pre-tax Profit (FY2026)
5.3.1 Waterfall Chart for Consol. OP and Pre-tax Profit (FY2026 Full Year) OP increased 20.1% from higher personnel expense from employee returns and talent investment OP waterfall chart" %YOY +20.1% ( mil) GP SGA Other Other increase increase revenue expense +6,564 31,340 [| —470 increase increase
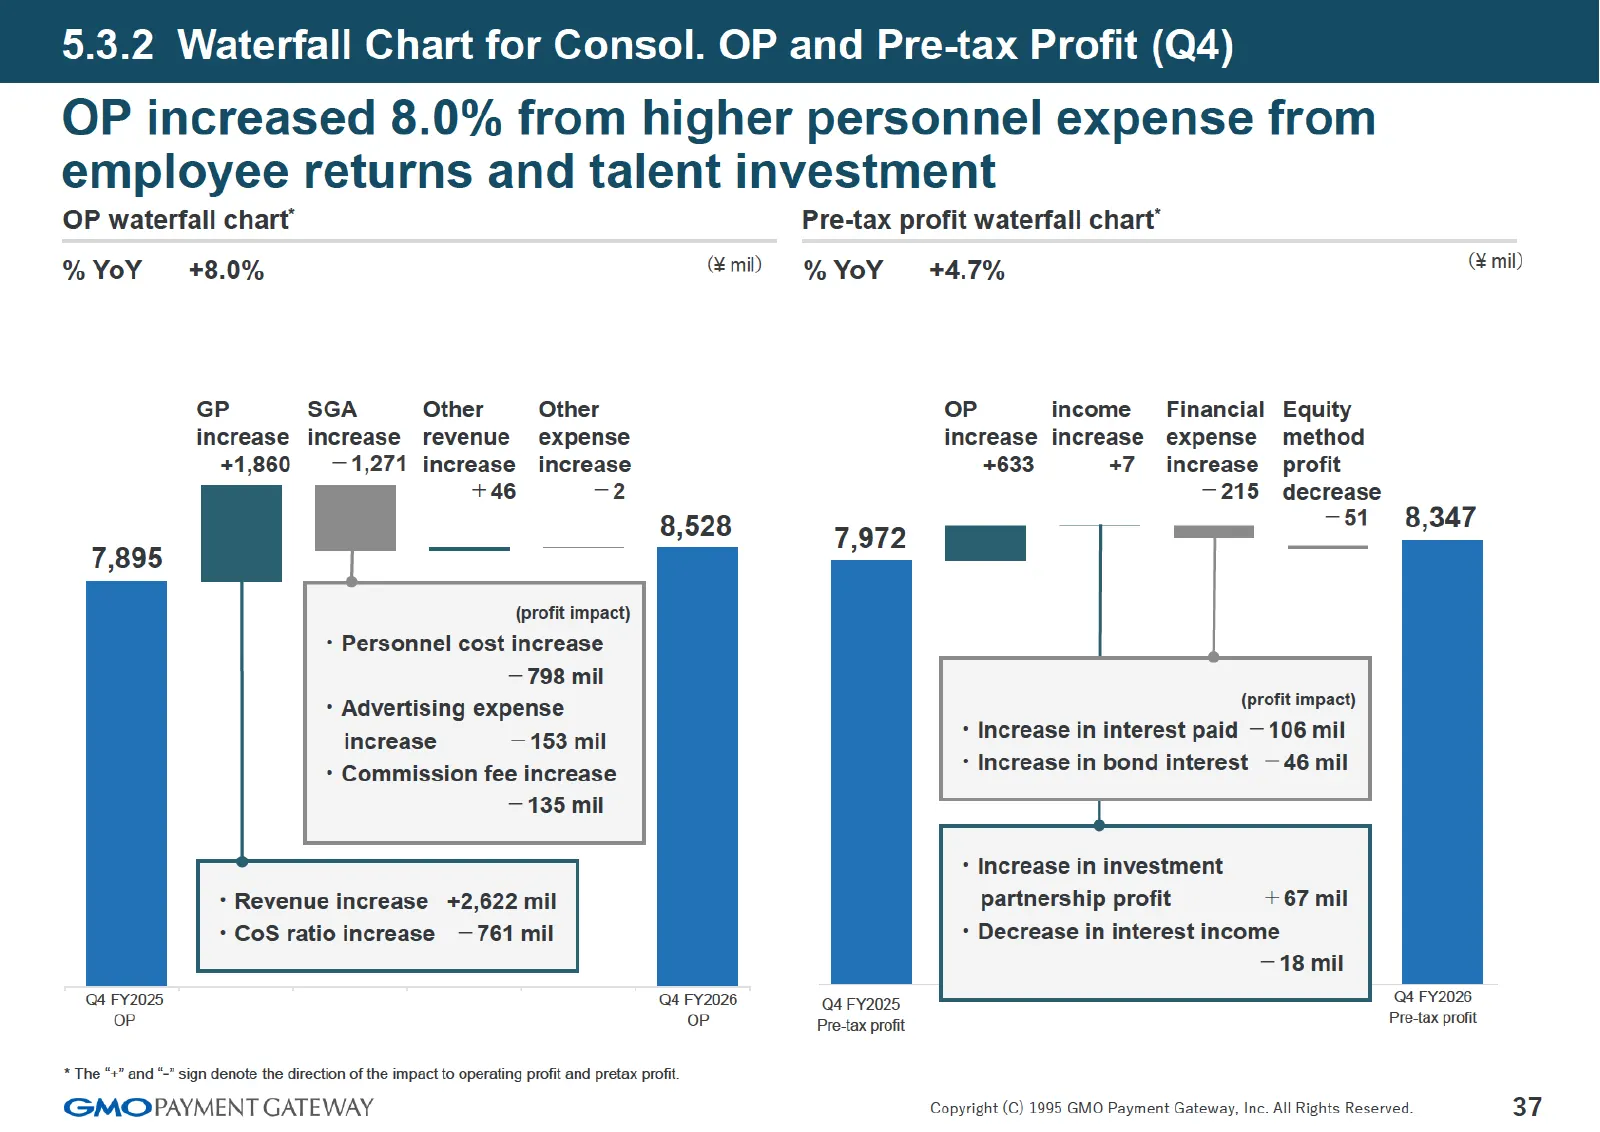
Slide 37: 5.3.2 Waterfall Chart for Consol. OP and Pre-tax Profit (Q4)
5.3.2 Waterfall Chart for Consol. OP and Pre-tax Profit (Q4) OP increased 8.0% from higher personnel expense from employee returns and talent investment OP waterfall chart" % YoY 7,895 Q4 FY2025 OP +8.0% GP SGA Other increase increase revenue +1,860 —1,271 increase +46 Other expense increase —2 incr
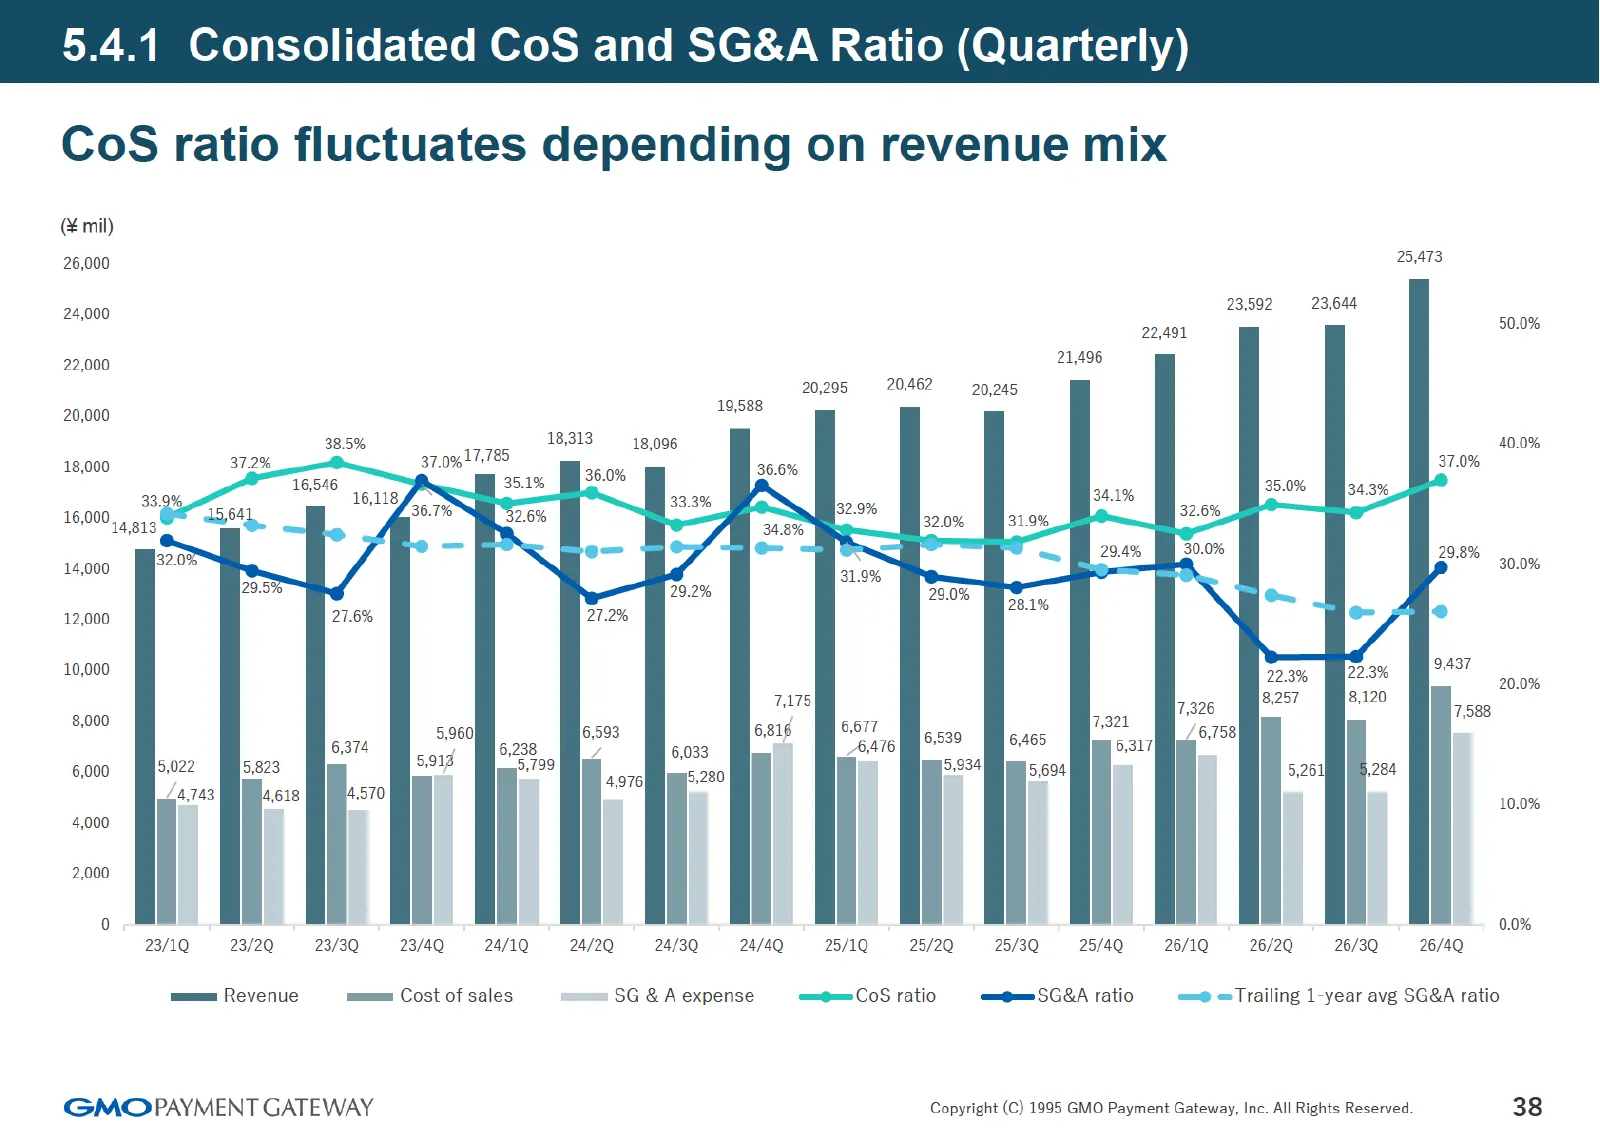
Slide 38: 5.4.1 Consolidated CoS and SG&A Ratio (Quarterly)
5.4.1 Consolidated CoS and SG&A Ratio (Quarterly) CoS ratio fluctuates depending on revenue mix (¥ mil) 26,000 25,473 23,592 23,644 24,000 50.0% 22,000 20,000 38.5% 18313 18,096 37.0%17.785 36.0% 36.6% 35.1% 34.1% 36.770 33.3% ON Fis2.0% 32.6%, 320% |g 31.9% i | as - o~- = 30.0% a : 30.0% 18,000 372
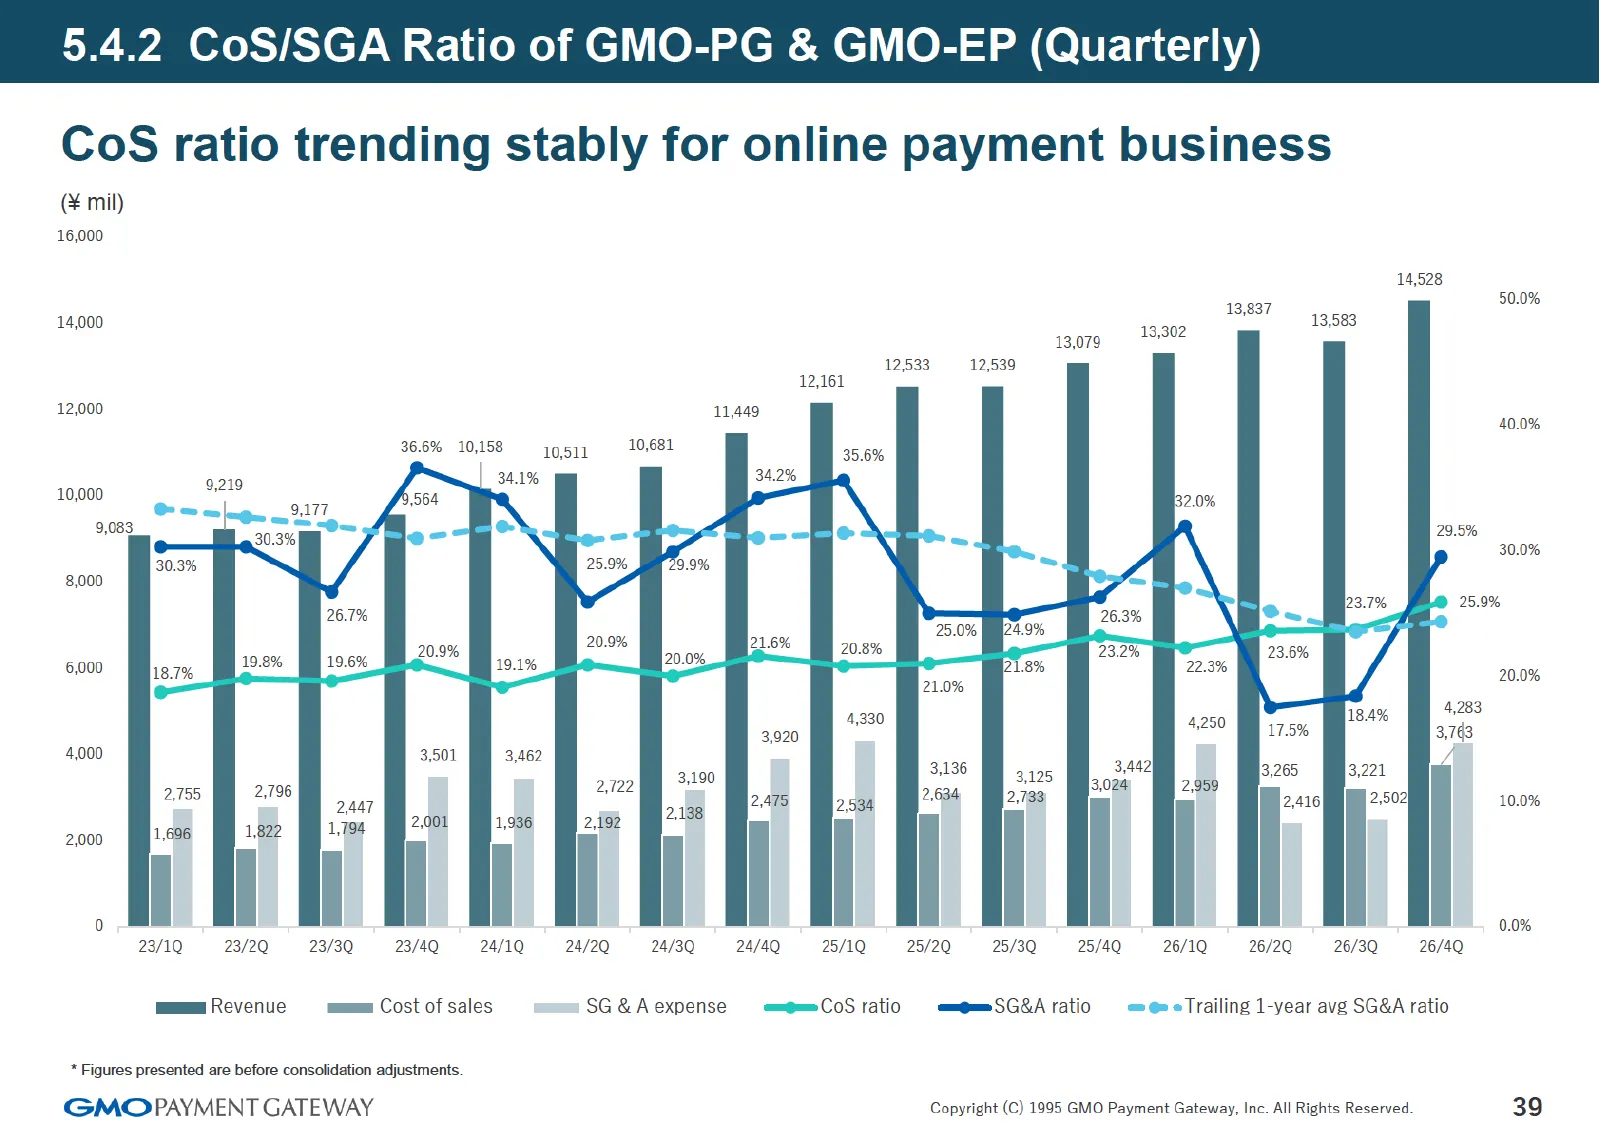
Slide 39: 5.4.2 CoS/SGA Ratio of GMO-PG & GMO-EP (Quarterly)
5.4.2 CoS/SGA Ratio of GMO-PG & GMO-EP (Quarterly) CoS ratio trending stably for online payment business (¥ mil) 16,000 14,528 50.0% 14,000 13,079 12.533 12,539 12,161 12,000 40.0% 36.6% 10,158 — jg51; —*10,681 34.1% 10,000 8219 eon 9177 9,083 303% == _ - 30.0% 30.3% 25.9% 8,000 25.9% 26.1% 20.9% 19
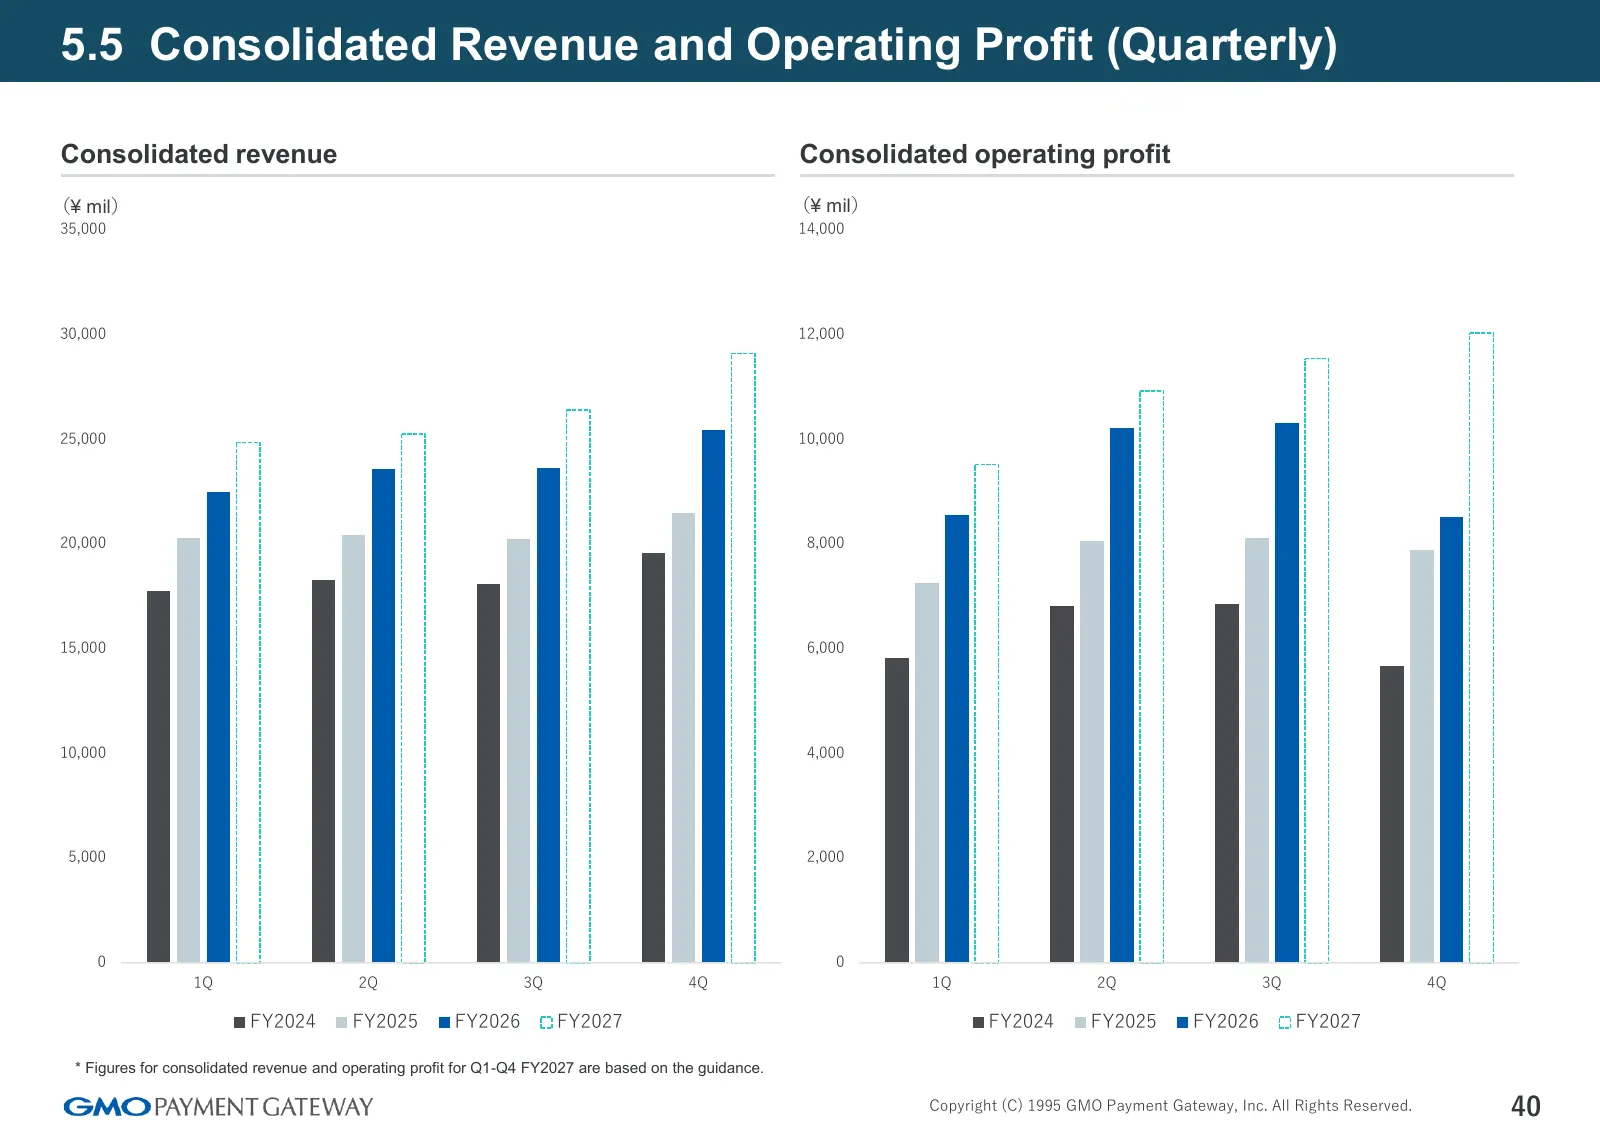
Slide 40: 5.5 Consolidated Revenue and Operating Profit (Quarterly)
5.5 Consolidated Revenue and Operating Profit (Quarterly) Consolidated revenue Consolidated operating profit (¥ mil) (¥ mil) 35,000 14,000 30,000 12,000 25,000 10,000 20,000 8,000 15,000 6,000 10,000 4,000 5,000 2,000 0 0 1Q 2Q 3Q 4Q 1Q 2Q 3Q 4Q FY2024 FY2025 FY2026 FY2027 FY2024 FY2025 FY2026 FY202
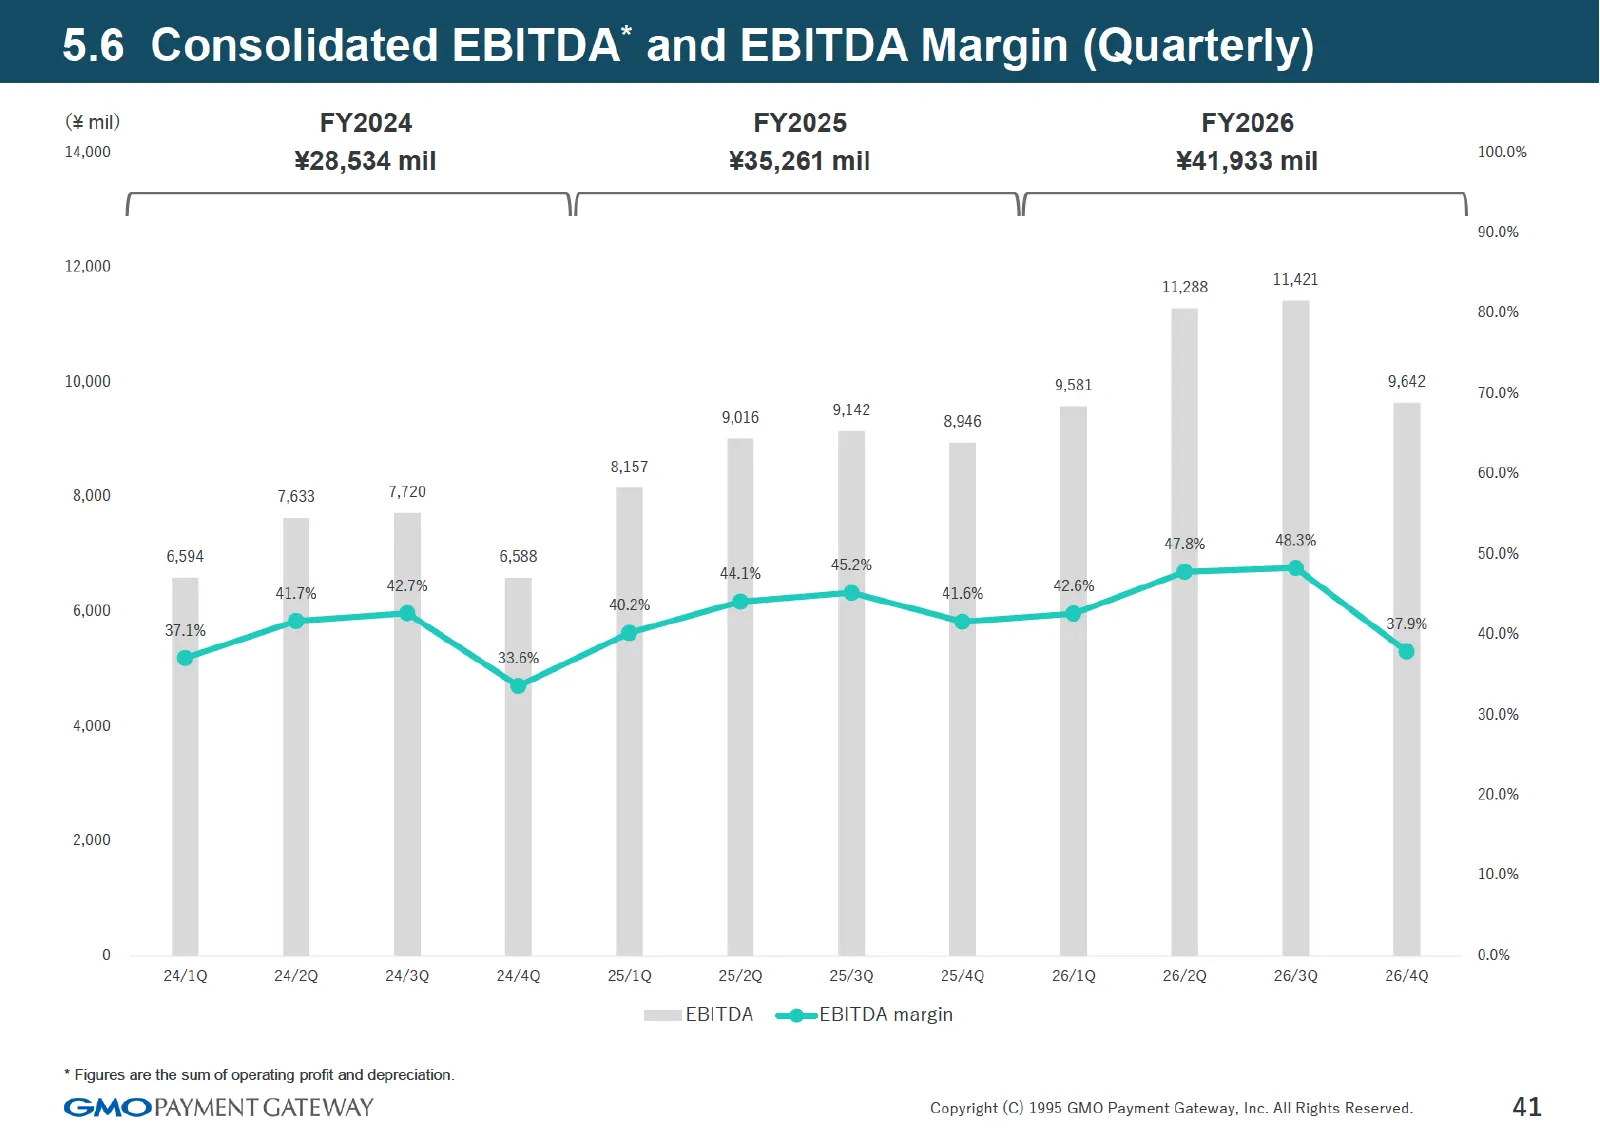
Slide 41: 5.6 Consolidated EBITDA and EBITDA Margin (Quarterly)
5.6 Consolidated EBITDA’ and EBITDA Margin (Quarterly) (mil) FY2024 FY2025 FY2026 +4000 ¥28,534 mil ¥35,261 mil ¥41,933 mil 100.0% f V Y \ 90.0% 12,000 1288 11421 80.0% 10,000 9,581 9.042 70.0% 9,016 9142 8,946 8,157 60.0% 8,000 7,633 7,120 478% 48.3% 50.0% 6,000 40.0% 4,000 $0.0% 20.0% 2,000 10.0%
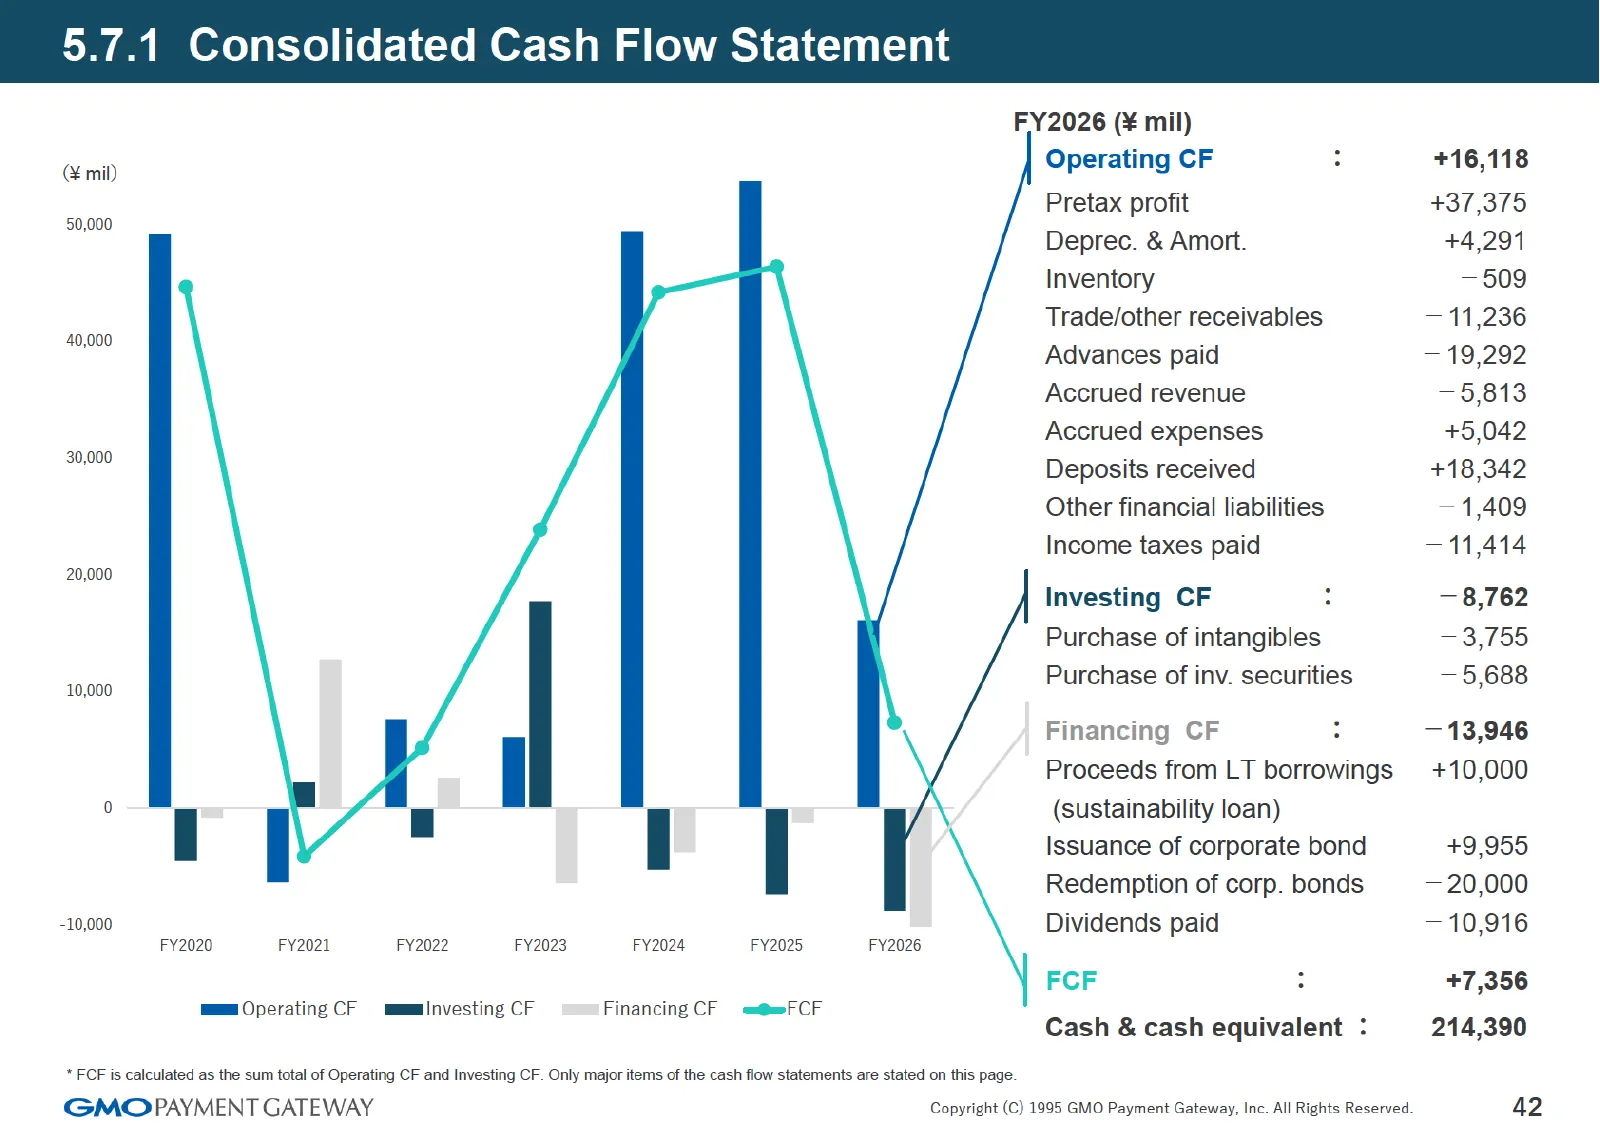
Slide 42: 5.7.1 Consolidated Cash Flow Statement
5.7.1 Consolidated Cash Flow Statement FY2026 (¥ mil) & mid Operating CF : +16,118 Pretax profit +37,375 enone Deprec. & Amort. +4,291 Inventory —509 Trade/other receivables — 11,236 “nn Advances paid —19,292 Accrued revenue — 5,813 Accrued expenses +5,042 3.000 Deposits received +18,342 Other finan
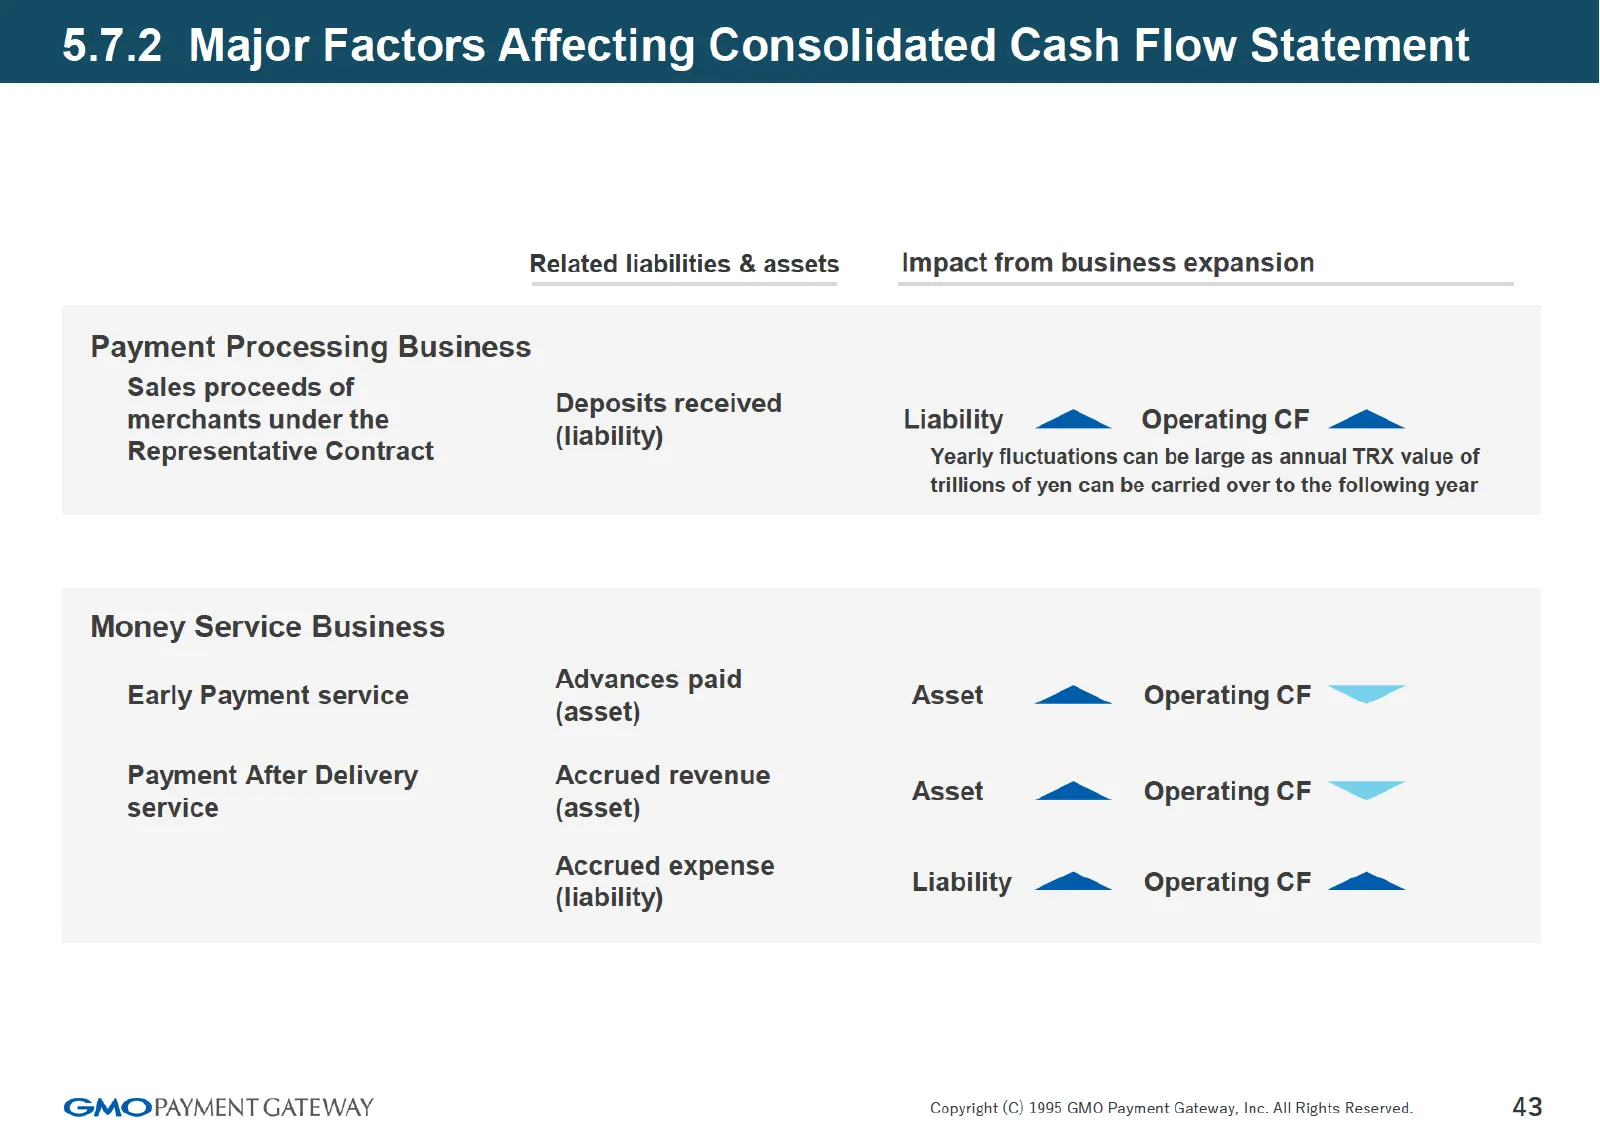
Slide 43: 5.7.2 Major Factors Affecting Consolidated Cash Flow Statement
5.7.2 Major Factors Affecting Consolidated Cash Flow Statem Related liabilities & assets Impact from business expansion Payment Processing Business Gals (OSES Gi Deposits received merchants under the Teatte Liability -<@. Operating CF <i Representative Contract Yearly fluctuations can be large as an
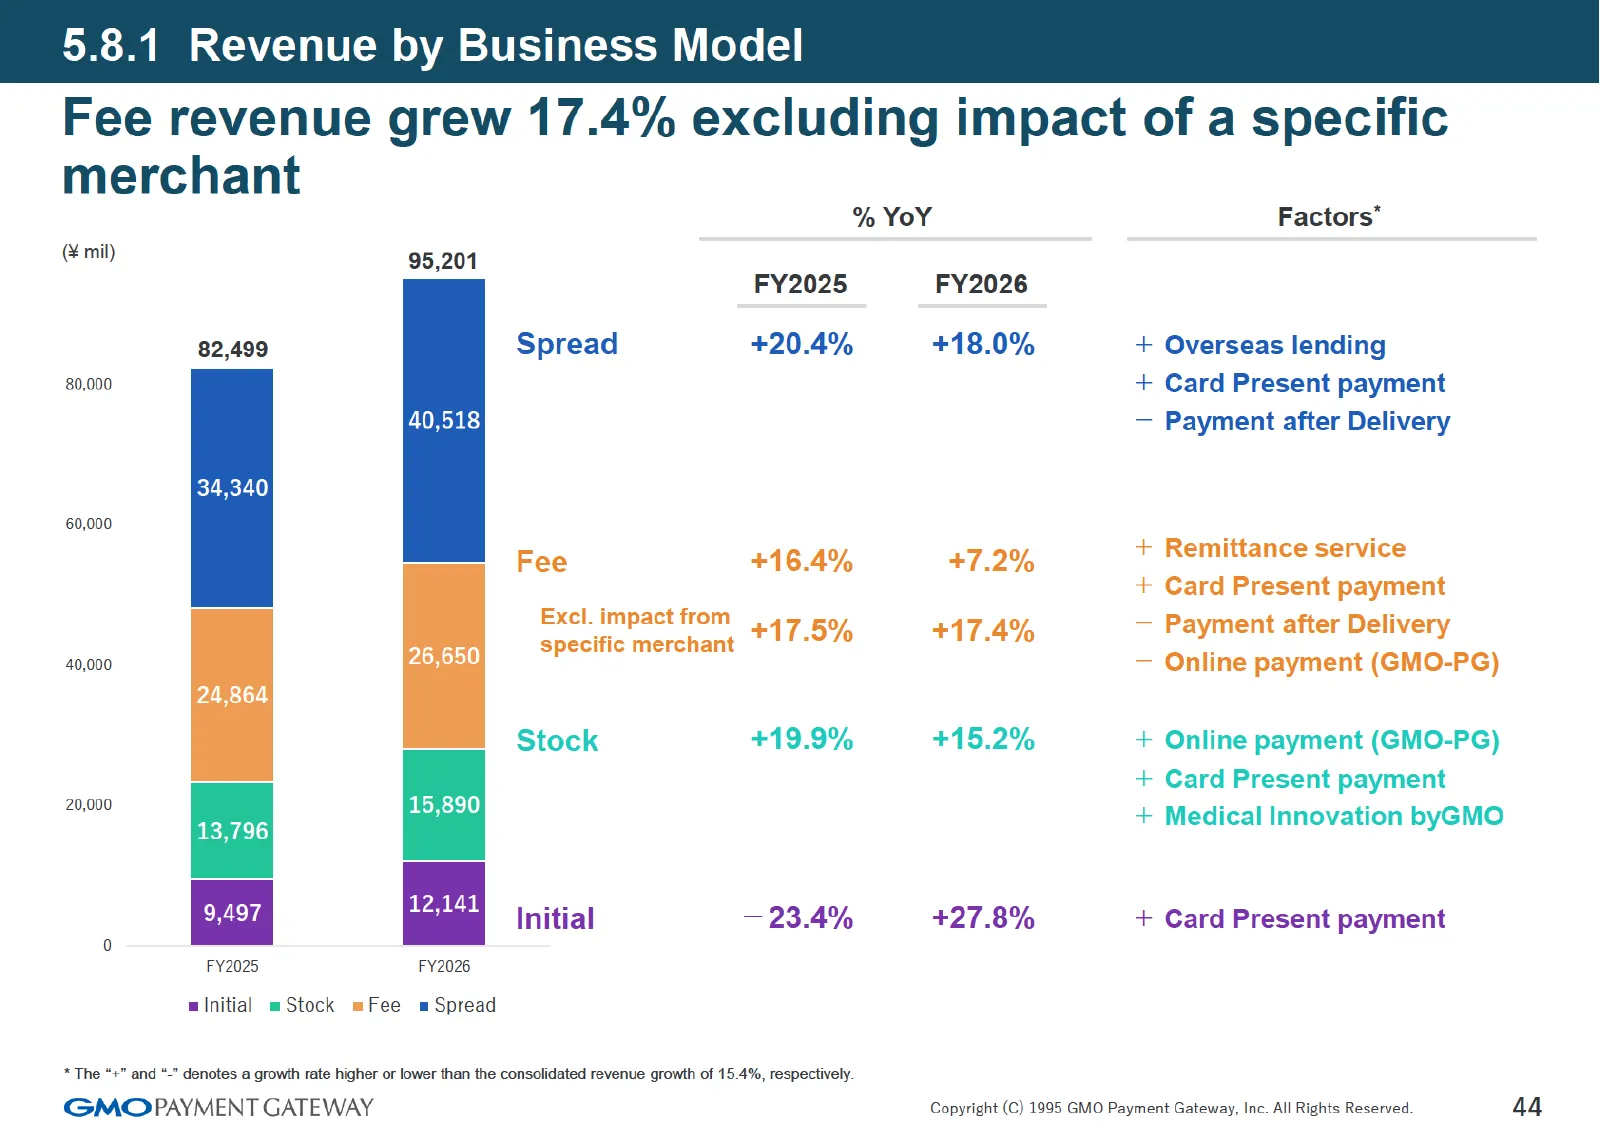
Slide 44: 5.8.1 Revenue by Business Model
5.8.1 Revenue by Business Model Fee revenue grew 17.4% excluding impact of a specific (mil) 95,201 82,499 80,000 40,518 34,340 60,000 40,000 26,650 24,864 20,000 15,890 13,796 9,497 12,141 0 FY2025 FY2026 alnitial mStock mFee m Spread % YoY FY2025 FY2026 Spread +20.4% +18.0% Fee +16.4% +7.2% Excl. i
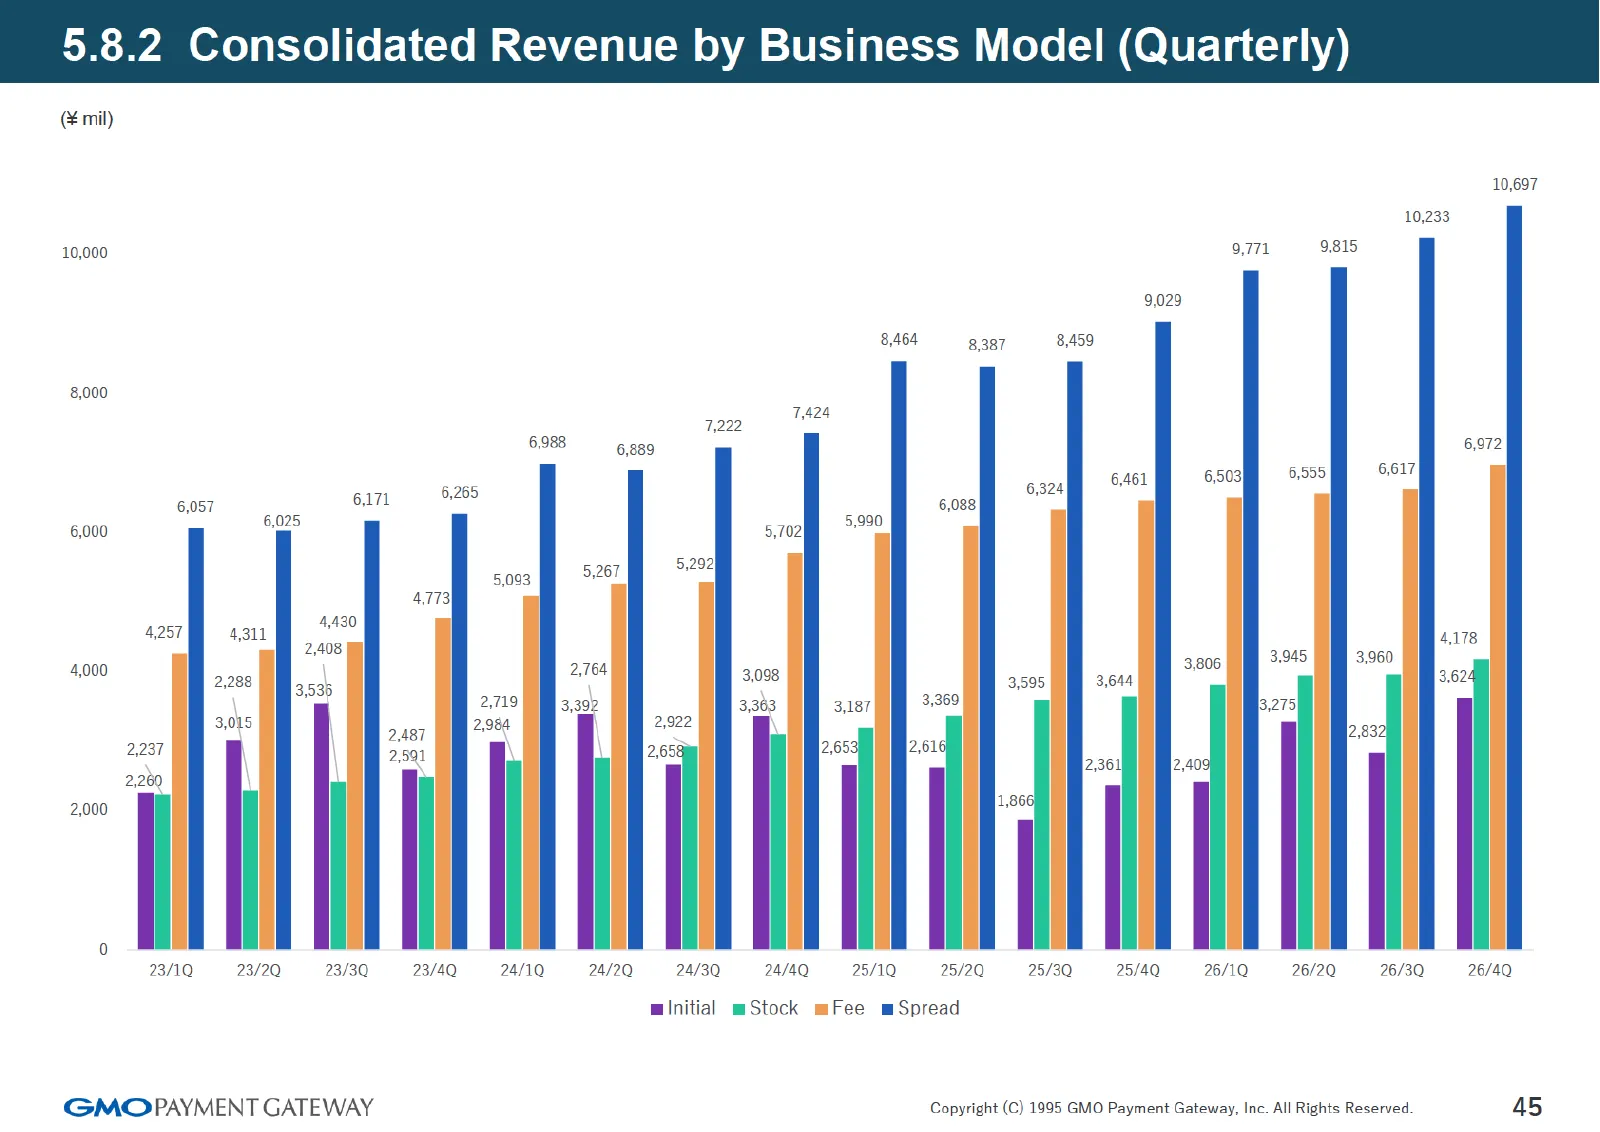
Slide 45: 5.8.2 Consolidated Revenue by Business Model (Quarterly)
5.8.2 Consolidated Revenue by Business Model (Quarterly) (¥ mil) 10,697 10,233 ~ 9771 9815 9,029 8464 g3g7 8,459 8,000 7,424 7,222 6988 ggg 6,972 , 6503] 5,555 6617 6171 6,265 6,000 : 5,702, 990 5,292} 5,093 5,267 4178 3,945 | 3.960 3,806, x ~ : a : 3,595 3,644 362 2,719 3,392 36: 3,187 3,369 son 7
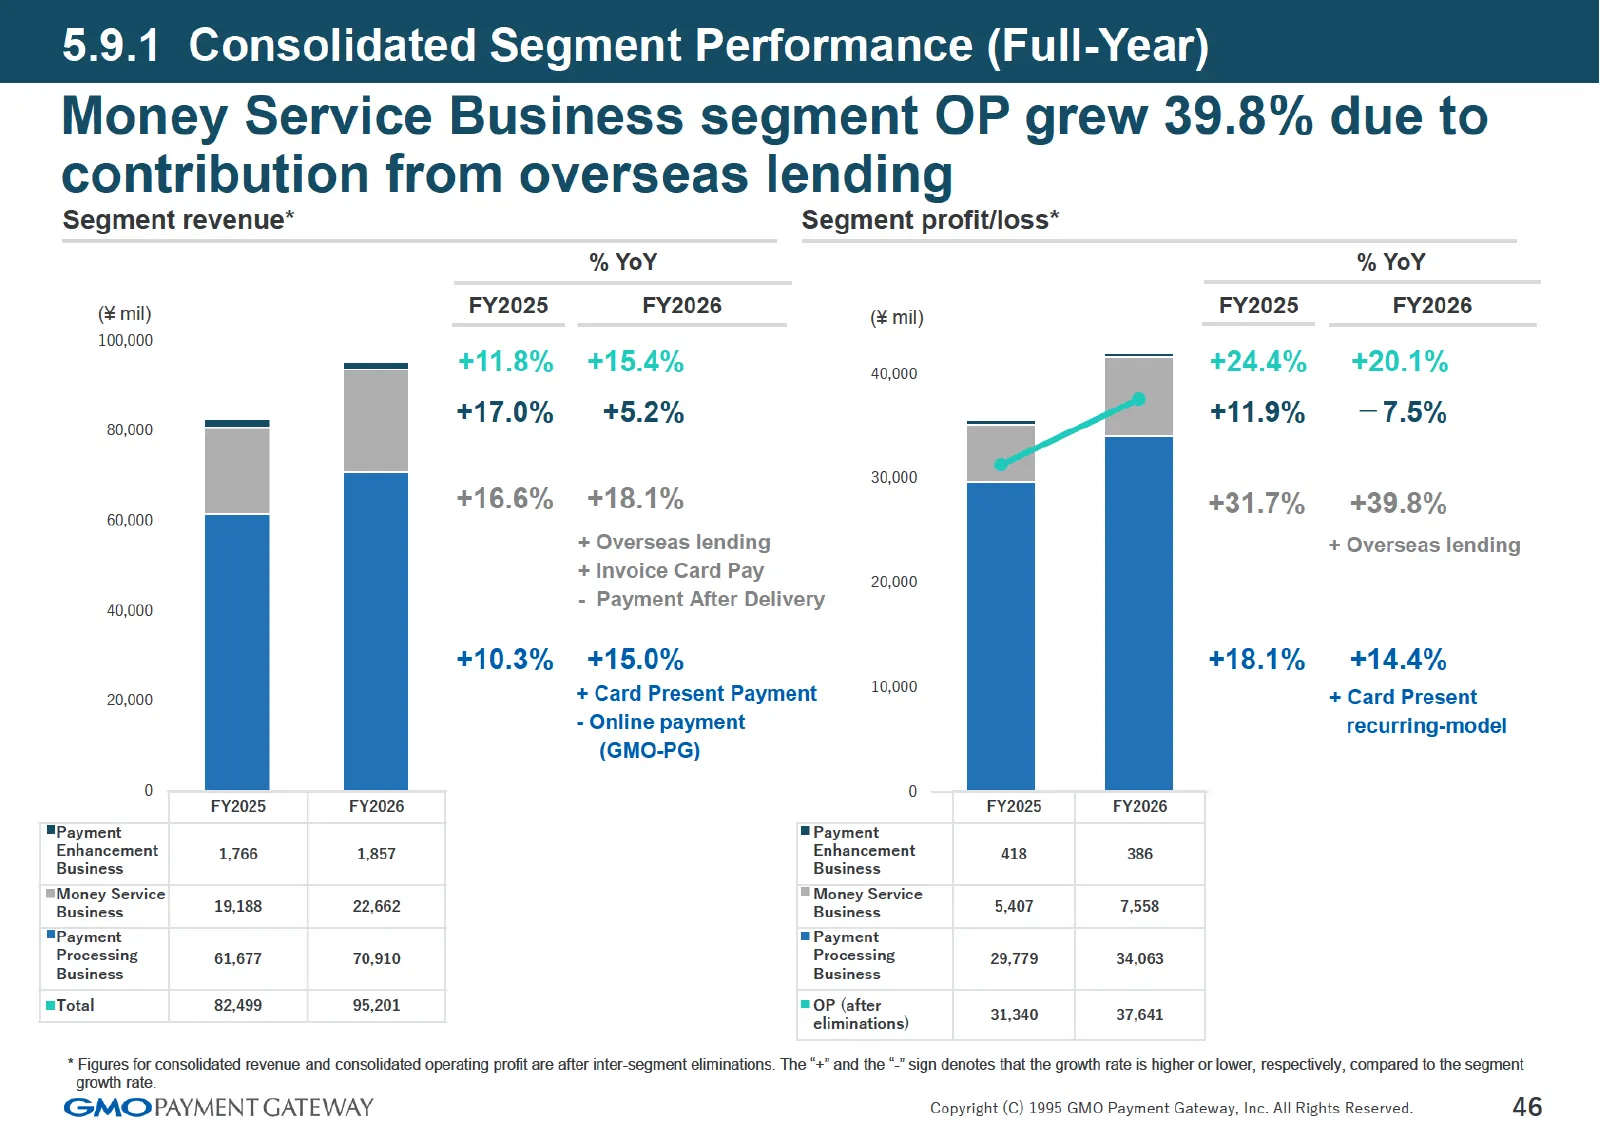
Slide 46: 5.9.1 Consolidated Segment Performance (Full-Year)
5.9.1 Consolidated Segment Performance (Full-Year) Money Service Business segment OP grew 39.8% due to contribution from overseas lending Segment revenue* (mil) 100,000 80,000 60,000 40,000 20,000 "Payment Enhancement Business Money Service Business ™Payment Processing Business =Total FY2025 1,766 1
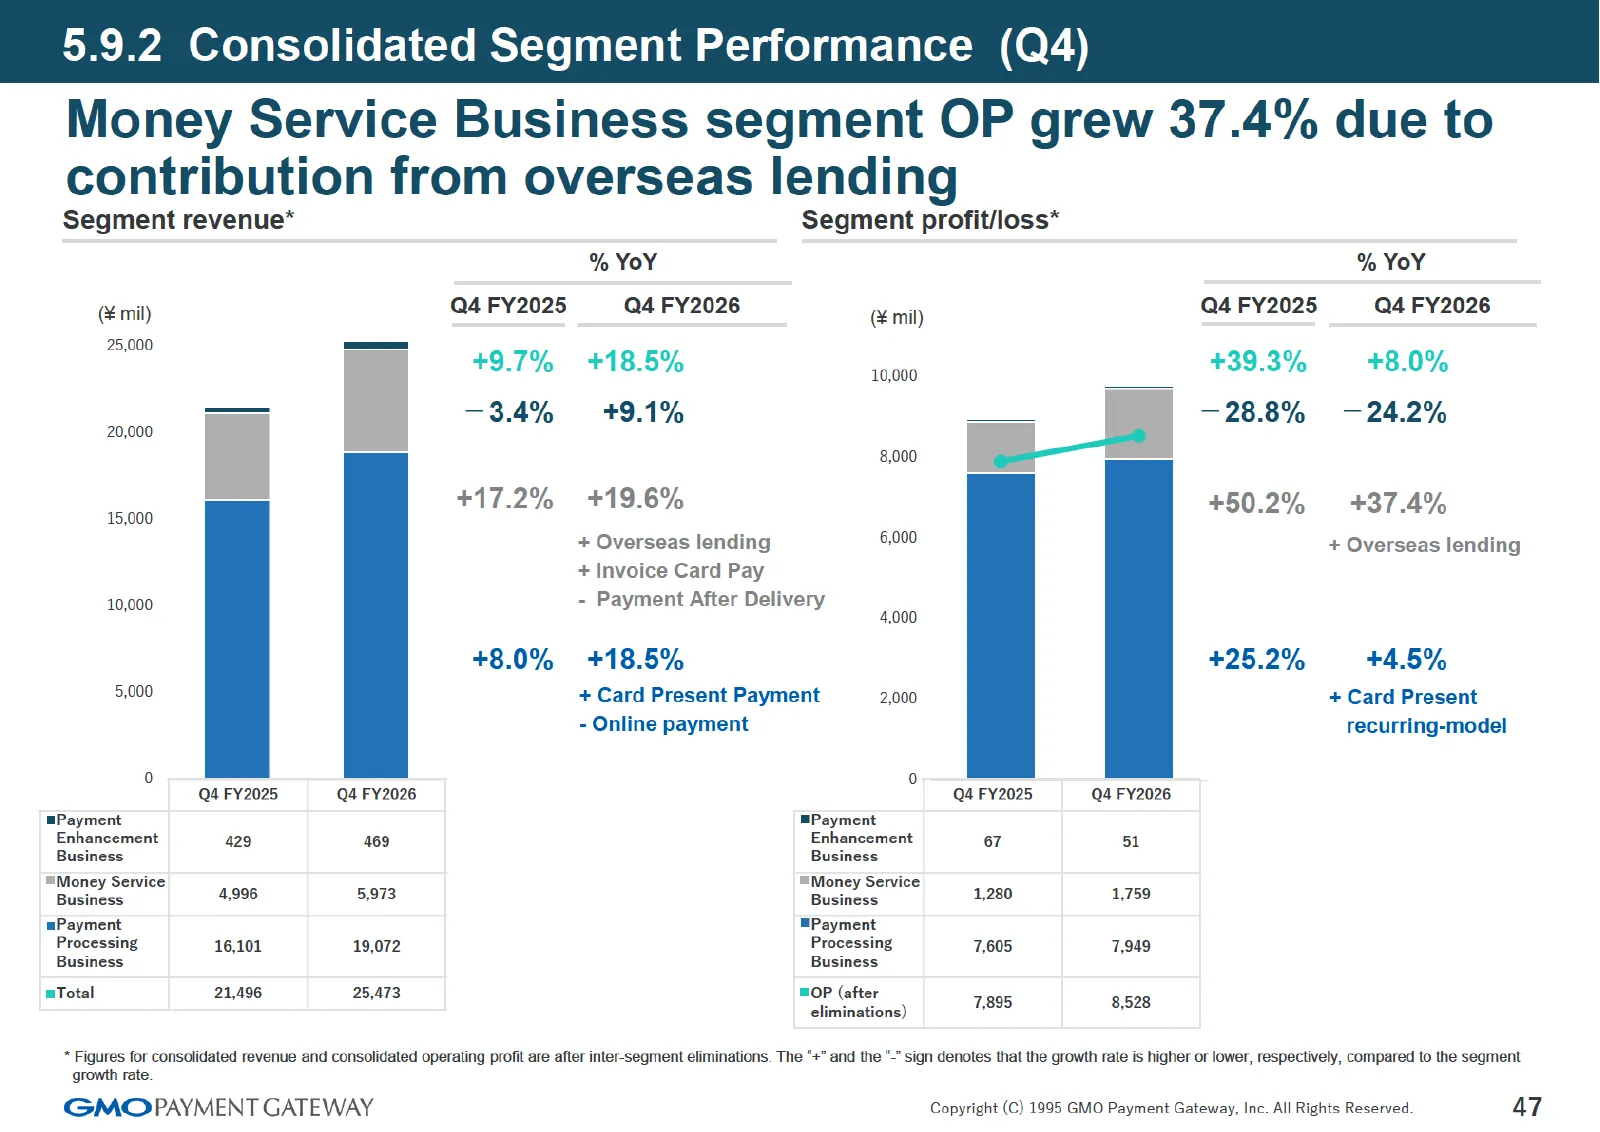
Slide 47: 5.9.2 Consolidated Segment Performance (Q4)
5.9.2 Consolidated Segment Performance (Q4) Money Service Business segment OP grew 37.4% due to contribution from overseas lending Segment revenue* (mil) 25,000 20,000 15,000 10,000 5,000 mPayment Enhancement = Money Service Business Payment Processing Business mTotal Q4 FY2025 +9.7% —3.4% +17.2% +8
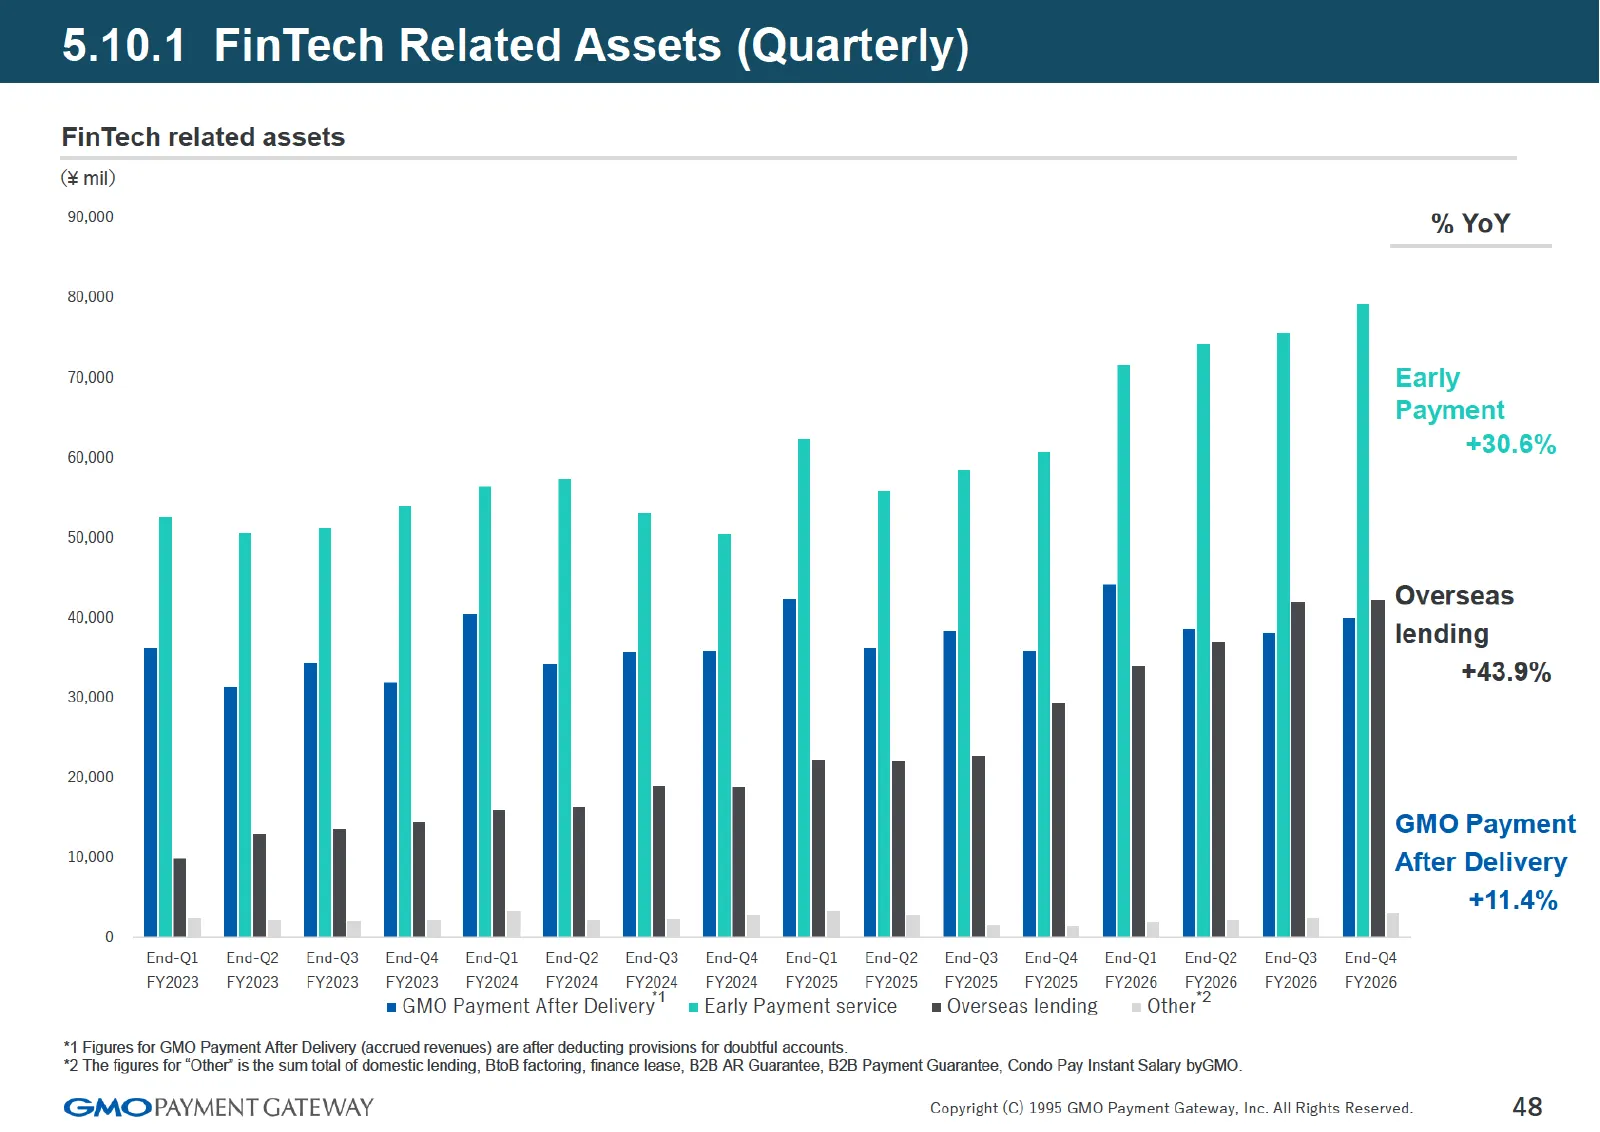
Slide 48: 5.10.1 FinTech Related Assets (Quarterly)
5.10.1 FinTech Related Assets (Quarterly) FinTech related assets (mil) 90,000 % YoY 80,000 70,000 Early Payment +30.6% 60,000 50,000 Overseas 40,000 . lending +43.9% 30,000 20,000 GMO Payment 10,000 After Delivery +11.4% End-Ql End-Q2 End-Q3_ End-Q4 End-Q1_ End-Q2_ End-Q3_ End-Q4_—End-Ql_ End-Q2_ En
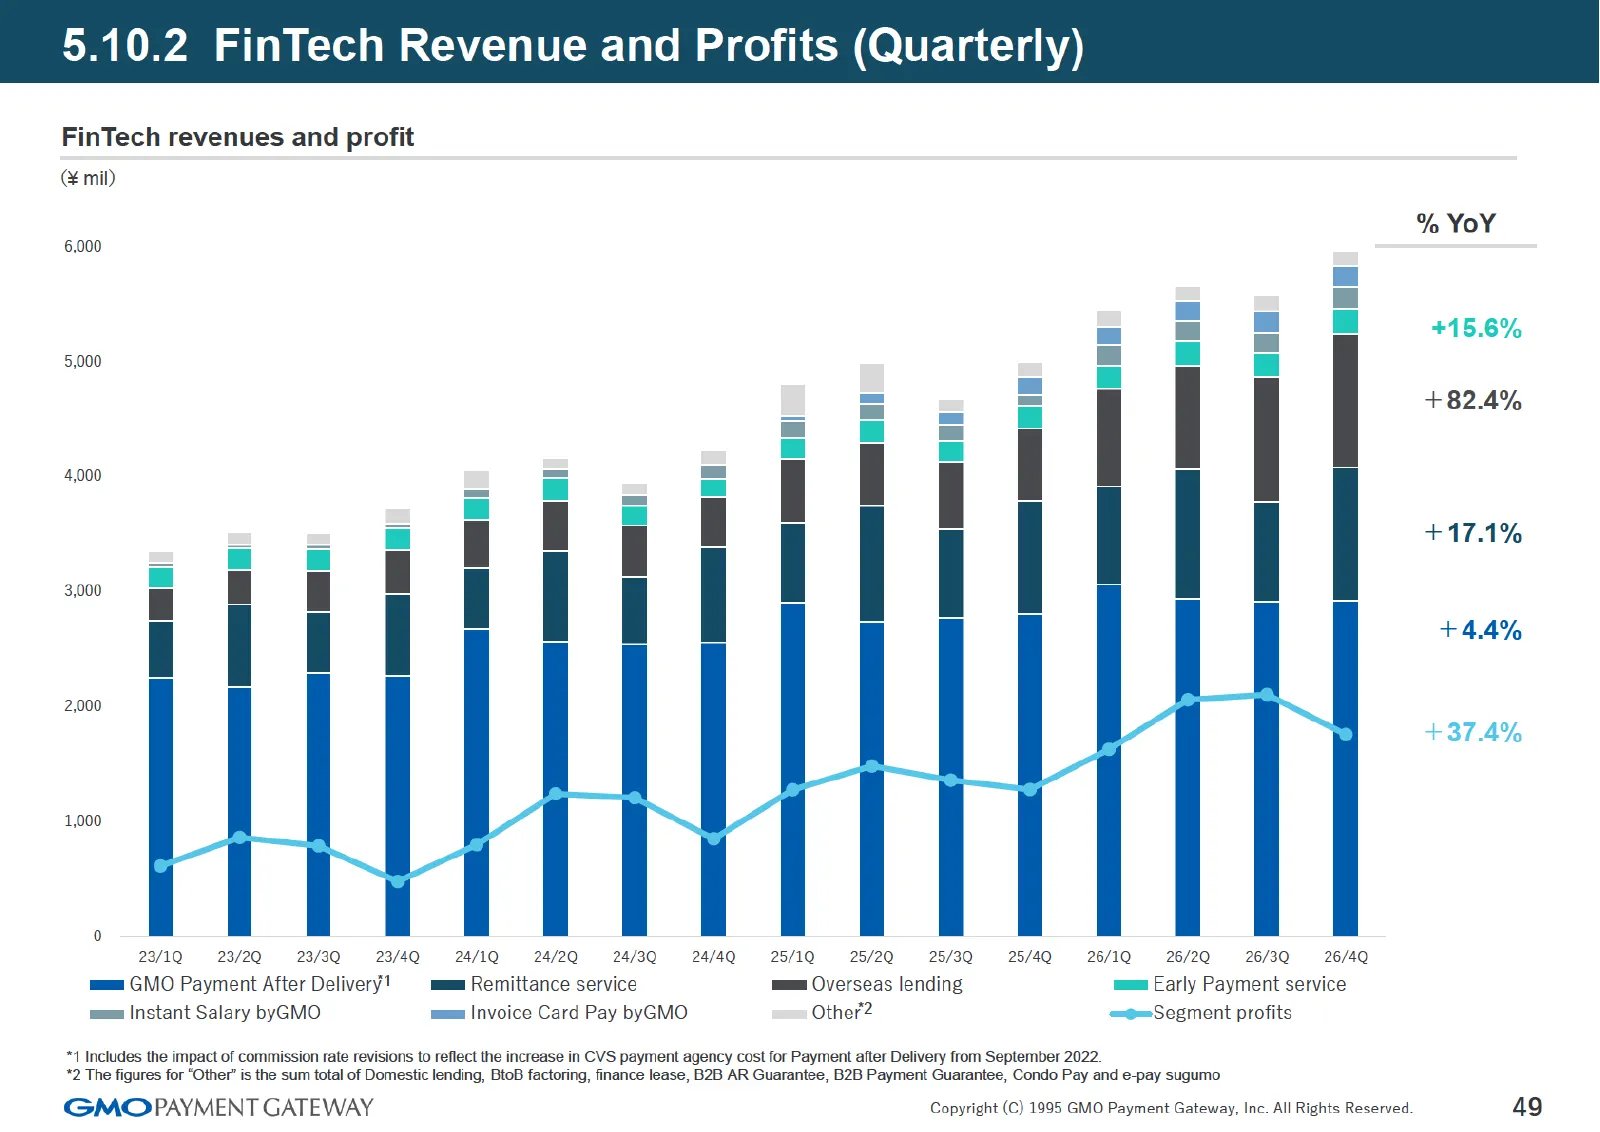
Slide 49: 5.10.2 FinTech Revenue and Profits (Quarterly)
5.10.2 FinTech Revenue and Profits (Quarterly) FinTech revenues and profit (mil) % YoY 6.000 +15.6% 5,000 +82.4% 4,000 +17.1% 3,000 +44% 2,000 +374% 1,000 0 23/1Q —-23/2Q.-23/3Q_--23/4Q_-24/1Q.—24/2Q_~—-24/3Q_-24/4Q_—-25/1Q_-25/2Q_-28/3Q_—-28/4Q_--26/1Q_-26/2Q_-26/3Q._--26/4Q mam GMO Payment After D
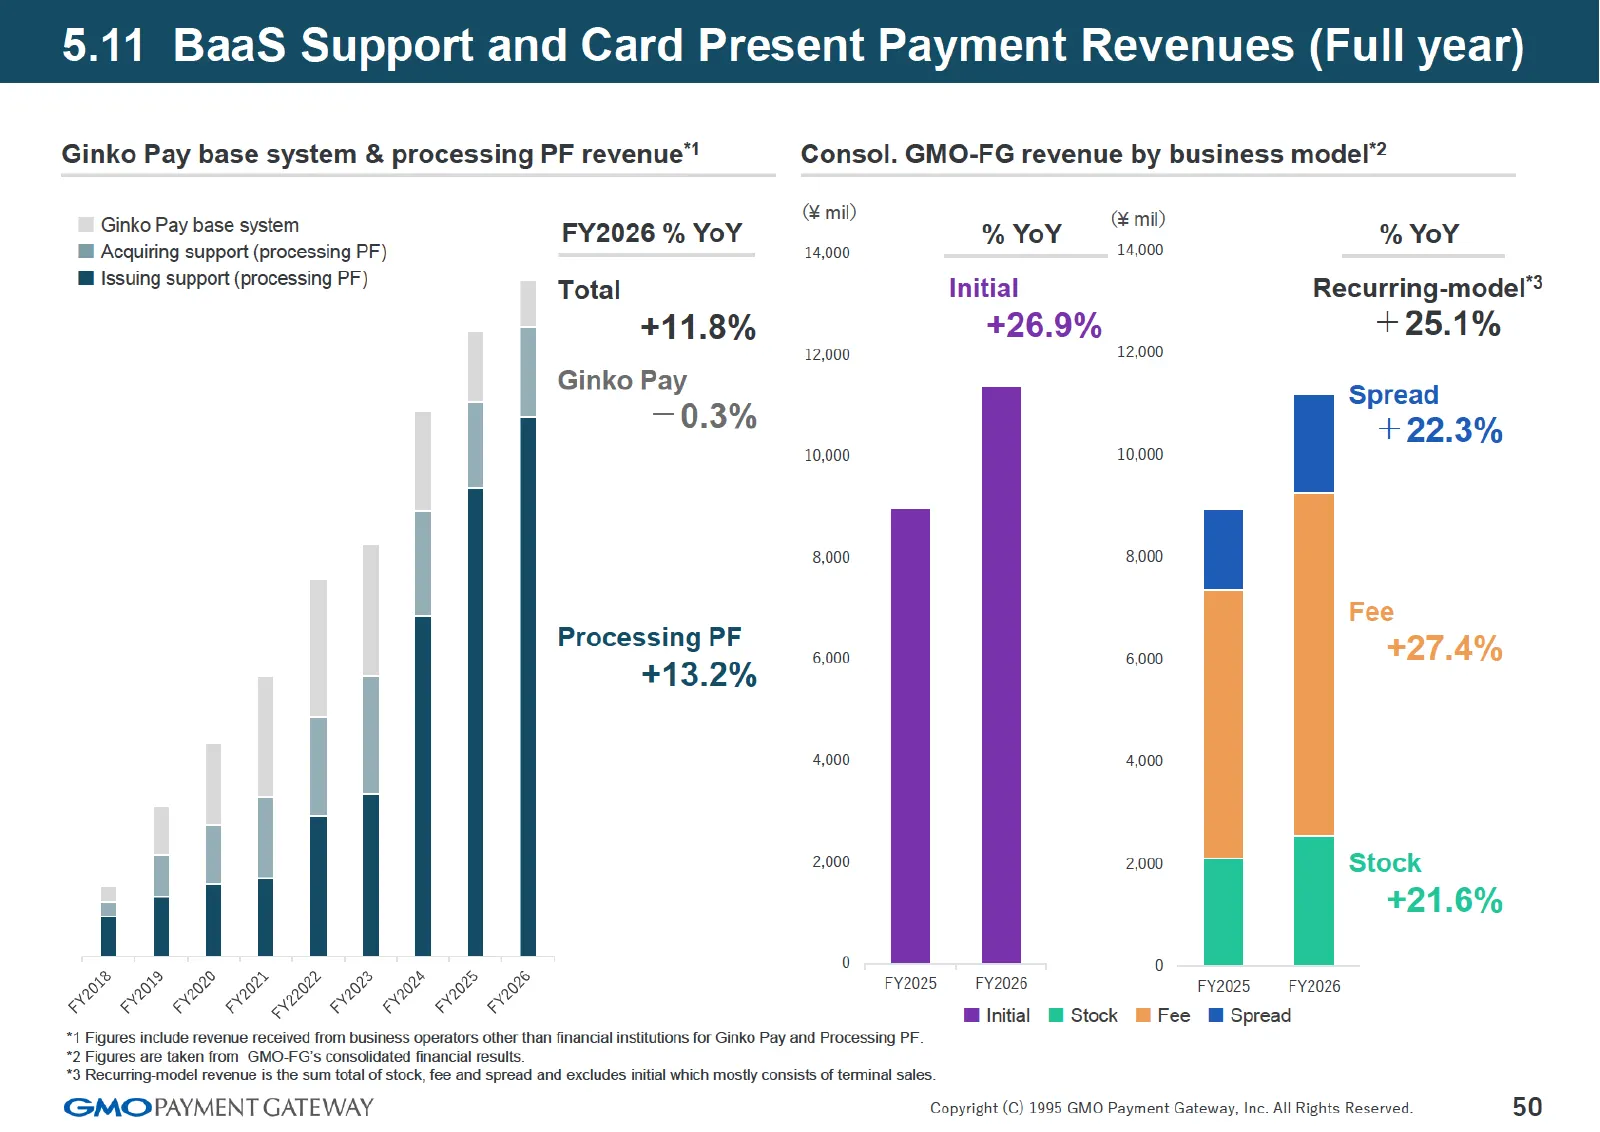
Slide 50: 5.11 BaaS Support and Card Present Payment Revenues (Full year)
.11 BaaS Support and Card Present Payment Revenues (Full year) Ginko Pay base system & processing PF revenue™ Ginko Pay base system FY2026 % YoY @ Acquiring support (processing PF) I Issuing support (processing PF) Total +11.8% Ginko Pay —0.3% Processing PF +13.2% se & eg Consol. GMO-FG revenue by b
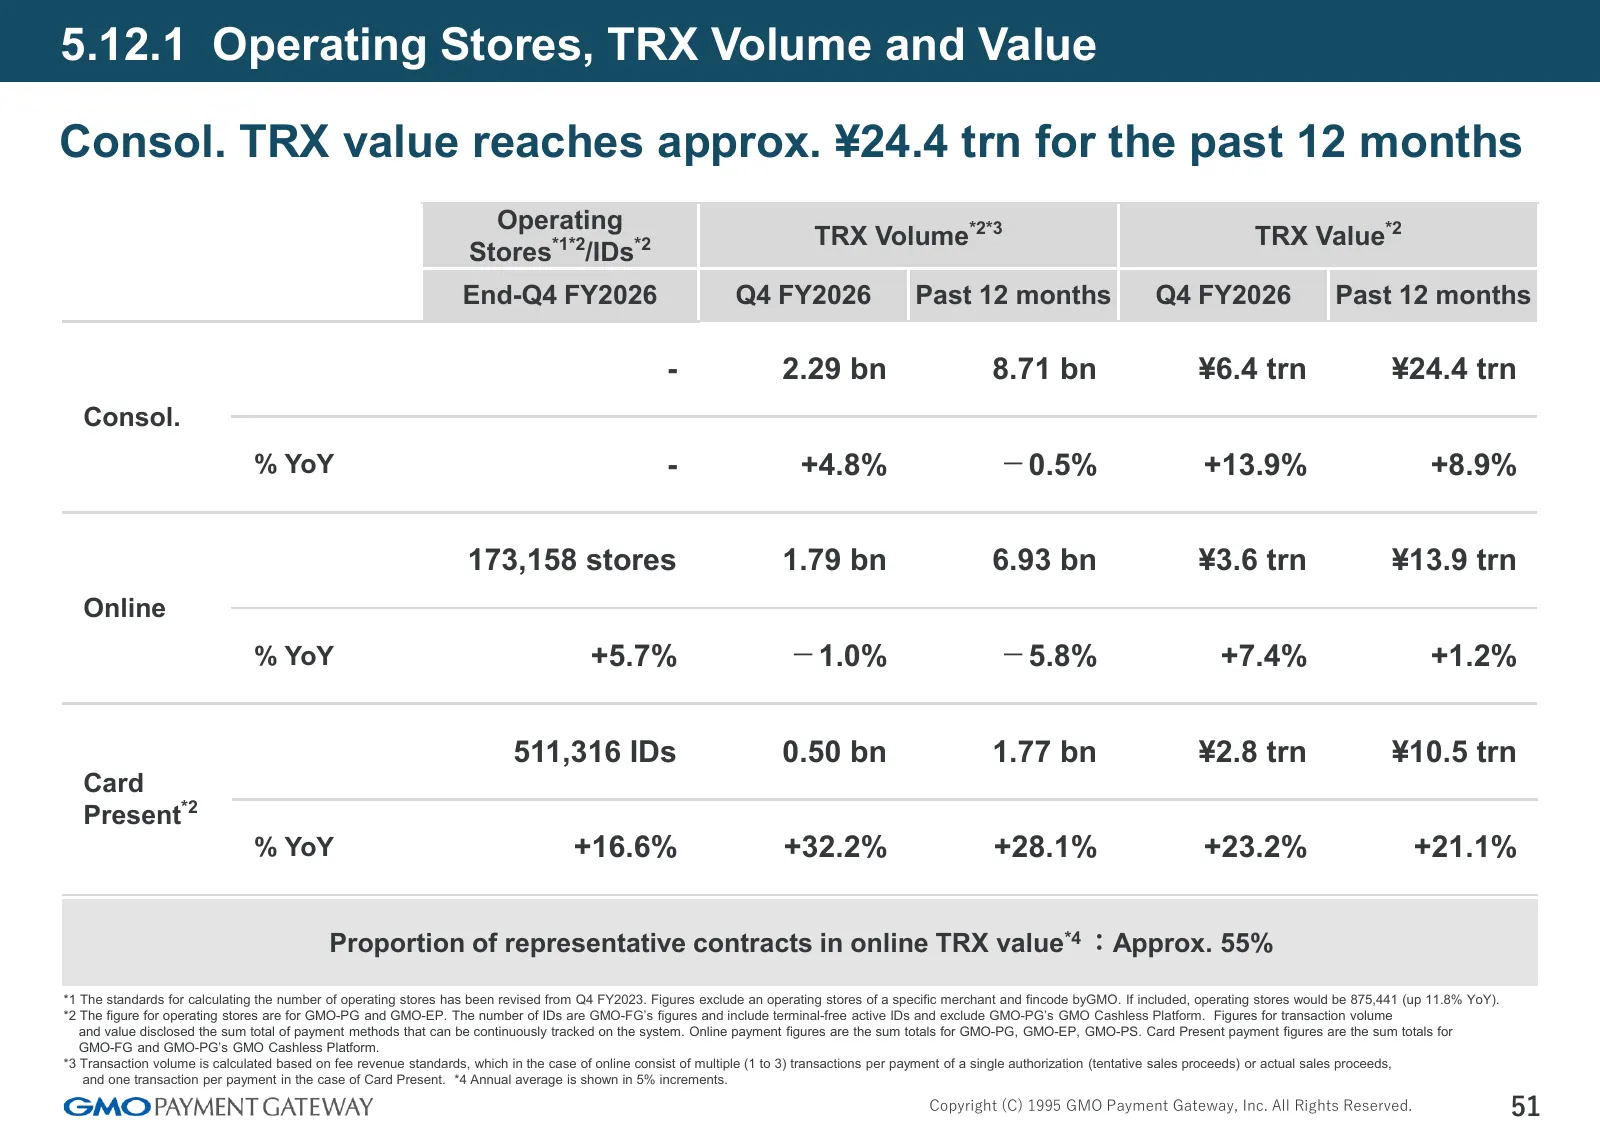
Slide 51: 5.12.1 Operating Stores, TRX Volume and Value
5.12.1 Operating Stores, TRX Volume and Value Consol. TRX value reaches approx. ¥24.4 trn for the past 12 months Operating TRX Volume*2*3 TRX Value*2 Stores*1*2/IDs*2 End-Q4 FY2026 Q4 FY2026 Past 12 months Q4 FY2026 Past 12 months - 2.29 bn 8.71 bn ¥6.4 trn ¥24.4 trn Consol. % YoY - +4.8% -0.5% +13.
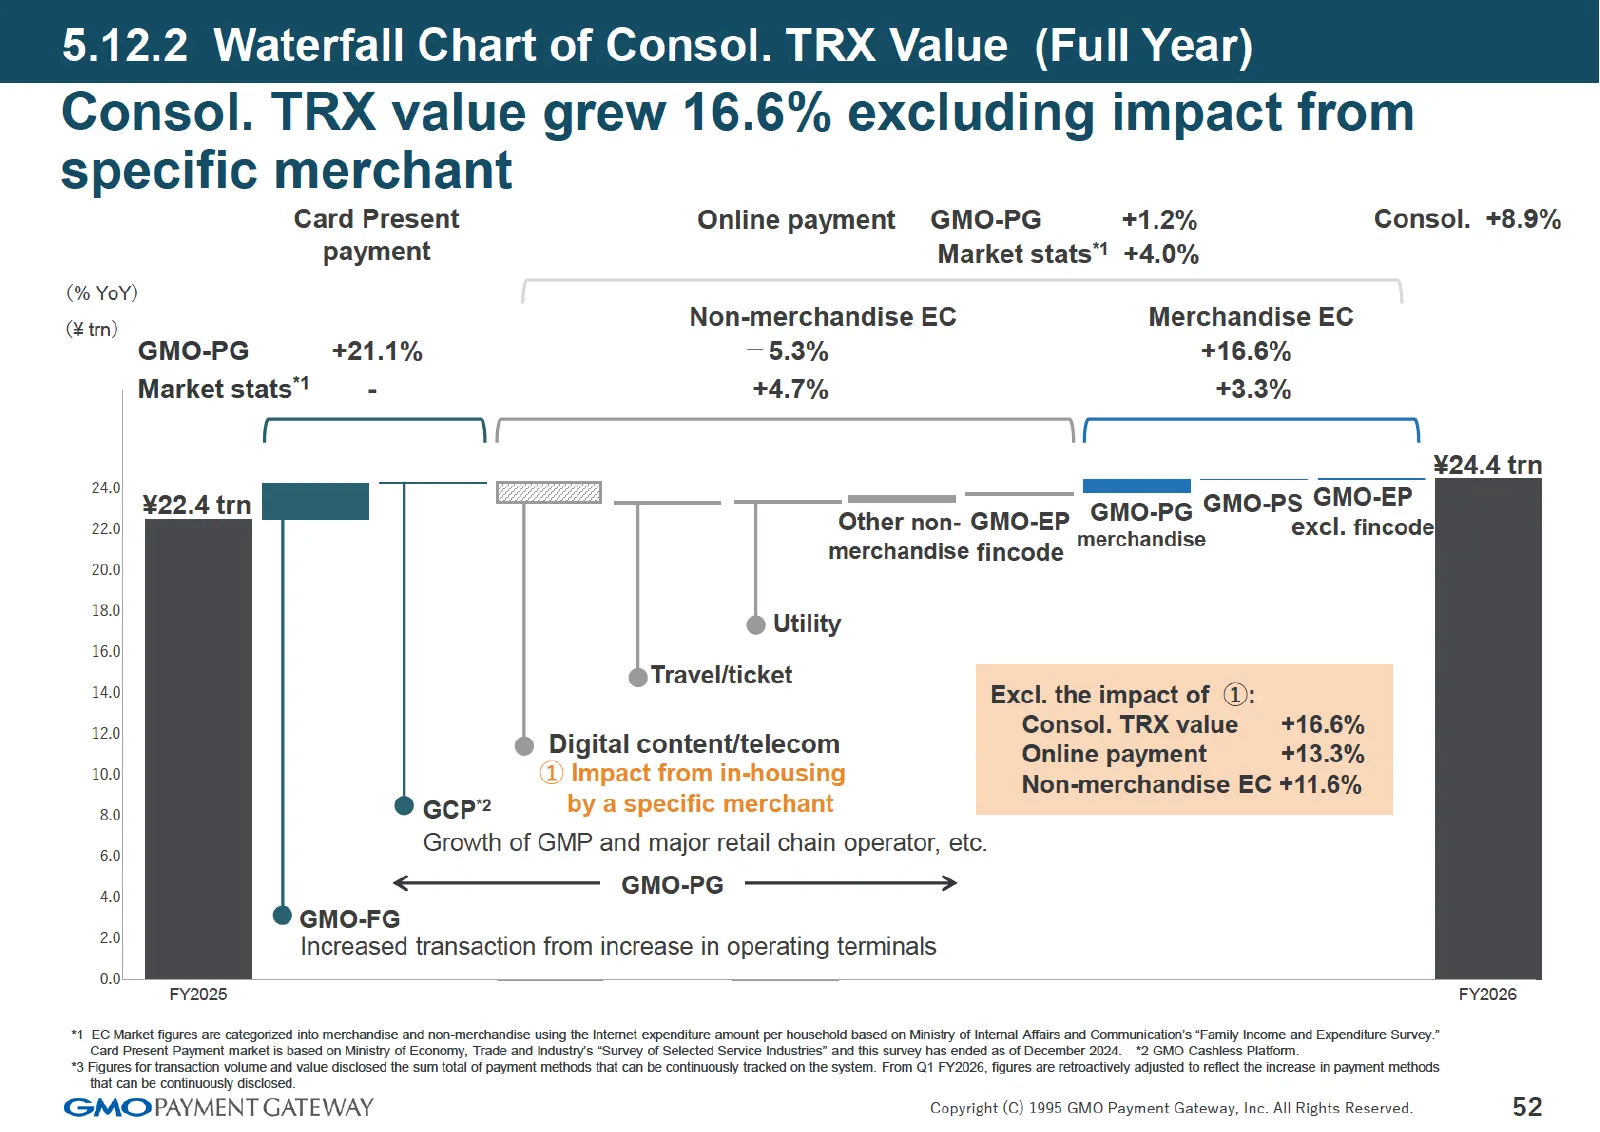
Slide 52: 5.12.2 Waterfall Chart of Consol. TRX Value (Full Year)
12.2 Waterfall Chart of Consol. TRX Value (Full Year) Consol. TRX value grew 16.6% excluding impact from specific merchant Card Present Online payment GMO-PG +1.2% Consol. +8.9% payment Market stats” +4.0% (% YoY) (tm) Non-merchandise EC Merchandise EC GMO-PG +21.1% — 5.3% +16.6% Market stats” - +4.
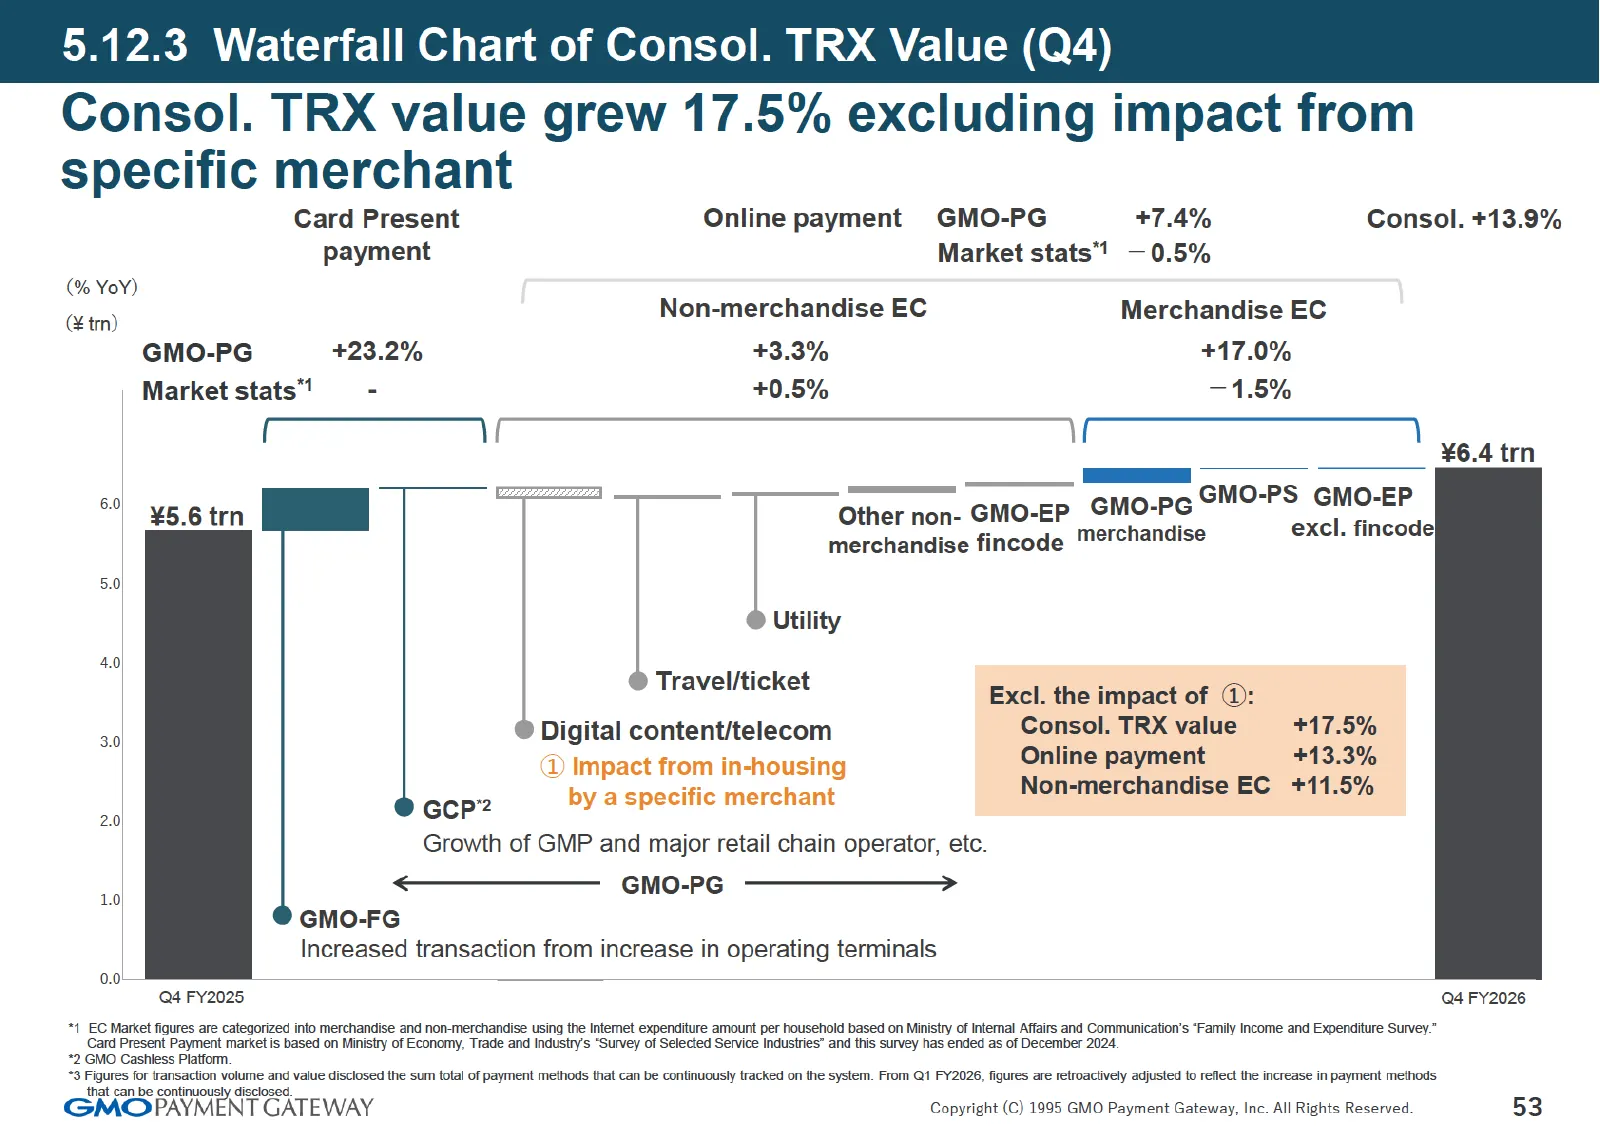
Slide 53: 5.12.3 Waterfall Chart of Consol. TRX Value (Q4)
.12.3 Waterfall Chart of Consol. TRX Value (Q4) Consol. TRX value grew 17.5% excluding impact from specific merchant Card Present Online payment GMO-PG +7.4% Consol. +13.9% payment Market stats” — 0.5% (% YoY) (¥tm) Non-merchandise EC Merchandise EC GMO-PG 423.2% +3.3% +17.0% Market stats” - +0.5% —
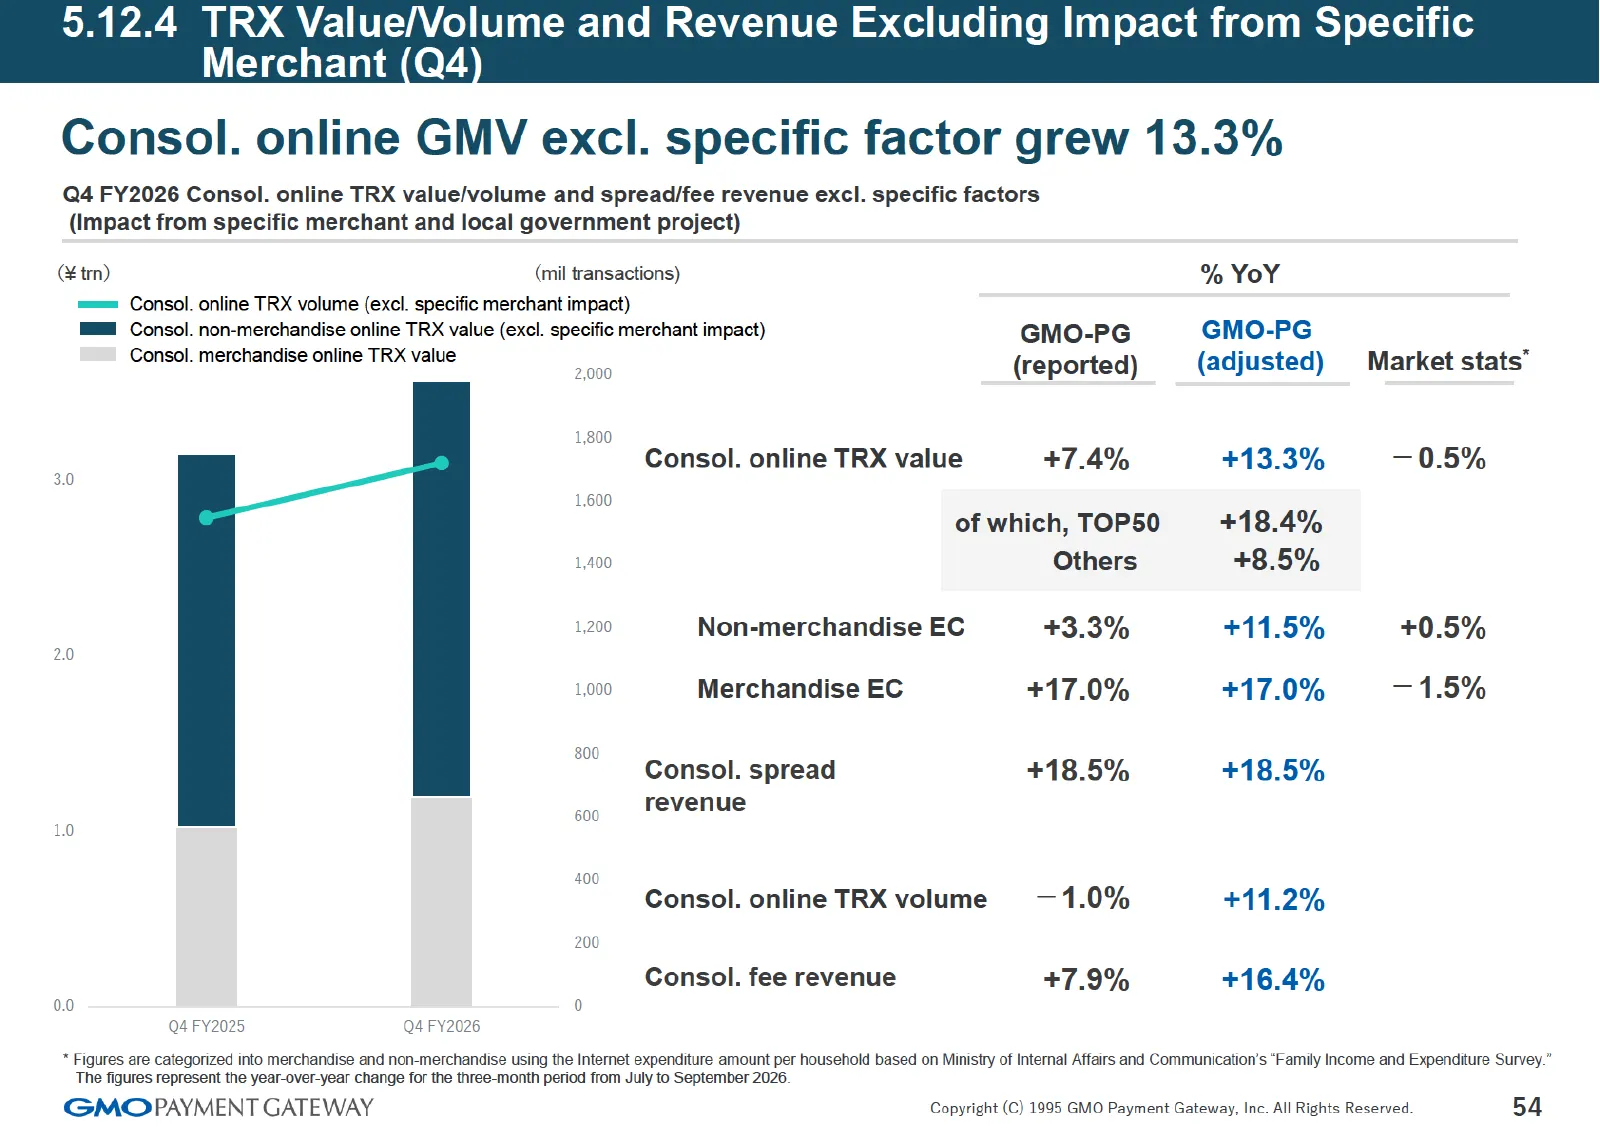
Slide 54: 5.12.4 TRX Value/Volume and Revenue Excluding Impact from Specific Merchant (Q4)
5.12.4 TRX Value/Volume and Revenue Excluding Impact from Specific Merchant (Q4 Consol. online GMV excl. specific factor grew 13.3% Q4 FY2026 Consol. online TRX value/volume and spread/fee revenue excl. specific factors (Impact from specific merchant and local government project) (¥trn) (mil transac
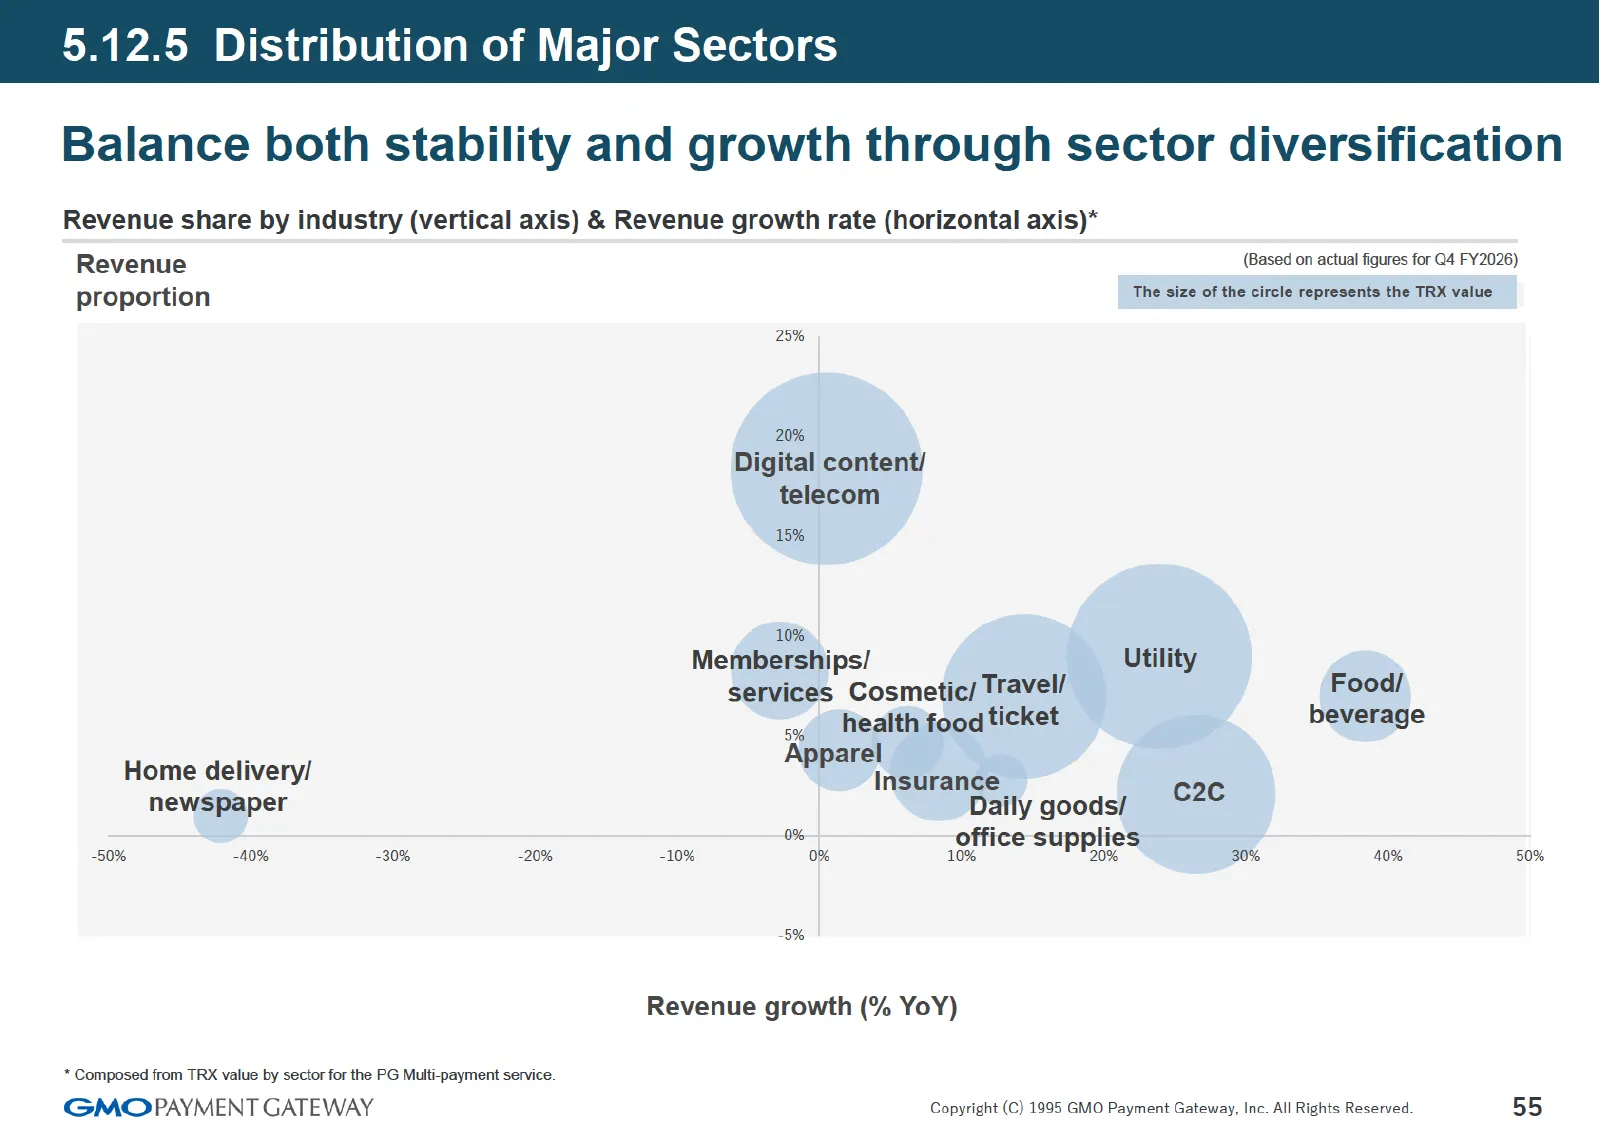
Slide 55: 5.12.5 Distribution of Major Sectors
5.12.5 Distribution of Major Sectors Balance both stability and growth through sector diversification Revenue share by industry (vertical axis) & Revenue growth rate (horizontal axis)* Revenue proportion Home delivery/ newspaper 50% -40% -30% -20% * Composed from TRX value by sector for the PG Multi
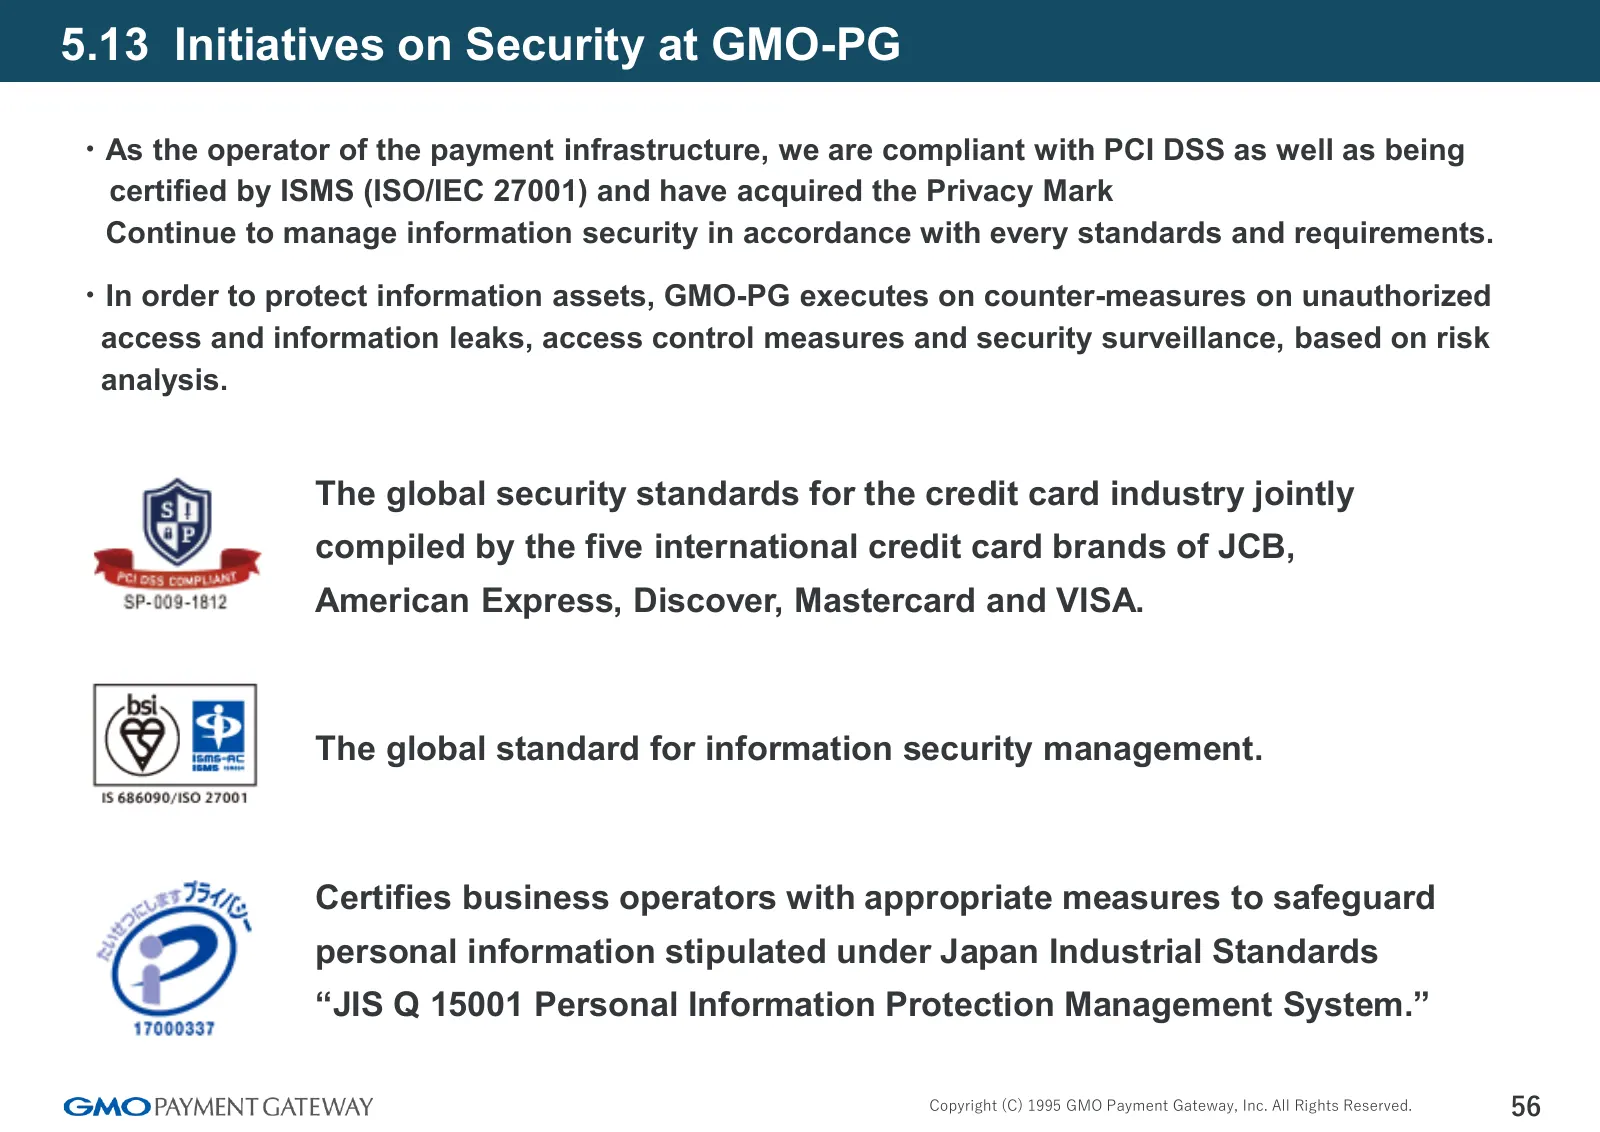
Slide 56: 5.13 Initiatives on Security at GMO-PG
5.13 Initiatives on Security at GMO-PG ・As the operator of the payment infrastructure, we are compliant with PCI DSS as well as being certified by ISMS (ISO/IEC 27001) and have acquired the Privacy Mark Continue to manage information security in accordance with every standards and requirements. ・In
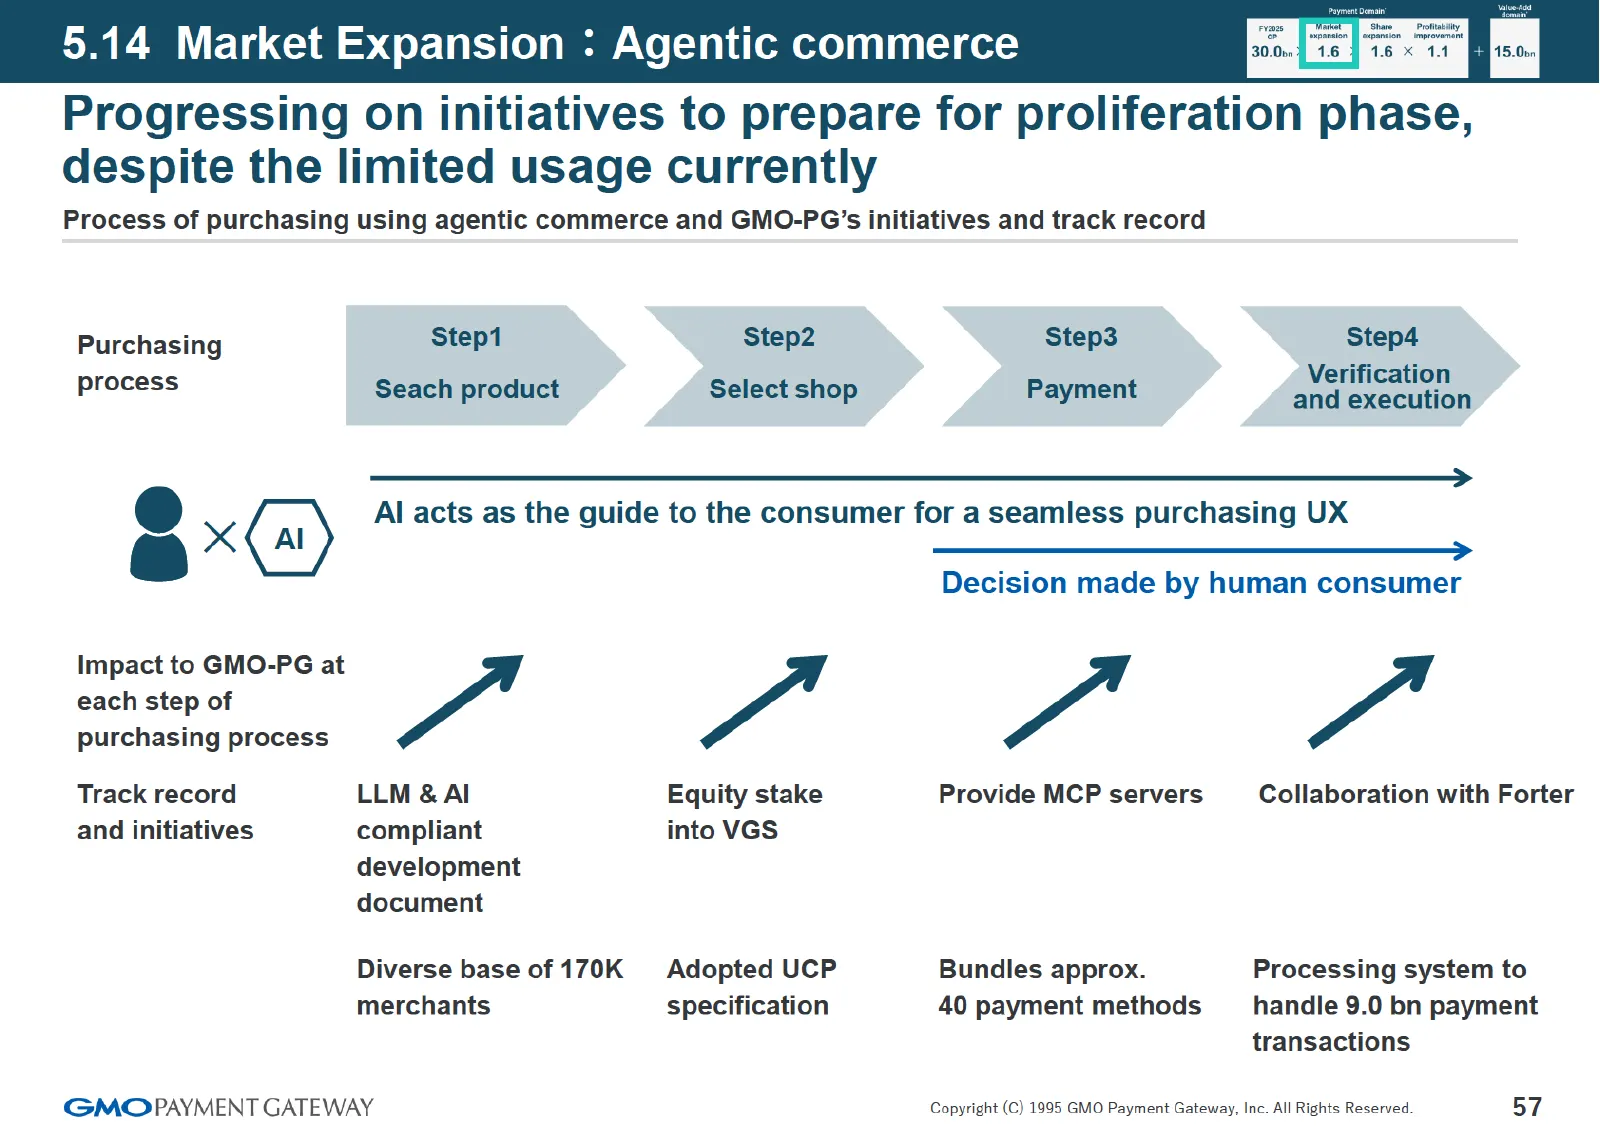
Slide 57: 5.14 Market Expansion: Agentic commerce
5.14 Market Expansion : Agentic commerce Progressing on initiatives to prepare for proliferation phase, despite the limited usage currently Process of purchasing using agentic commerce and GMO-PG’s initiatives and track record Purchasing Step1 Step2 Step3 Step4 process Seach product Select shop Paym
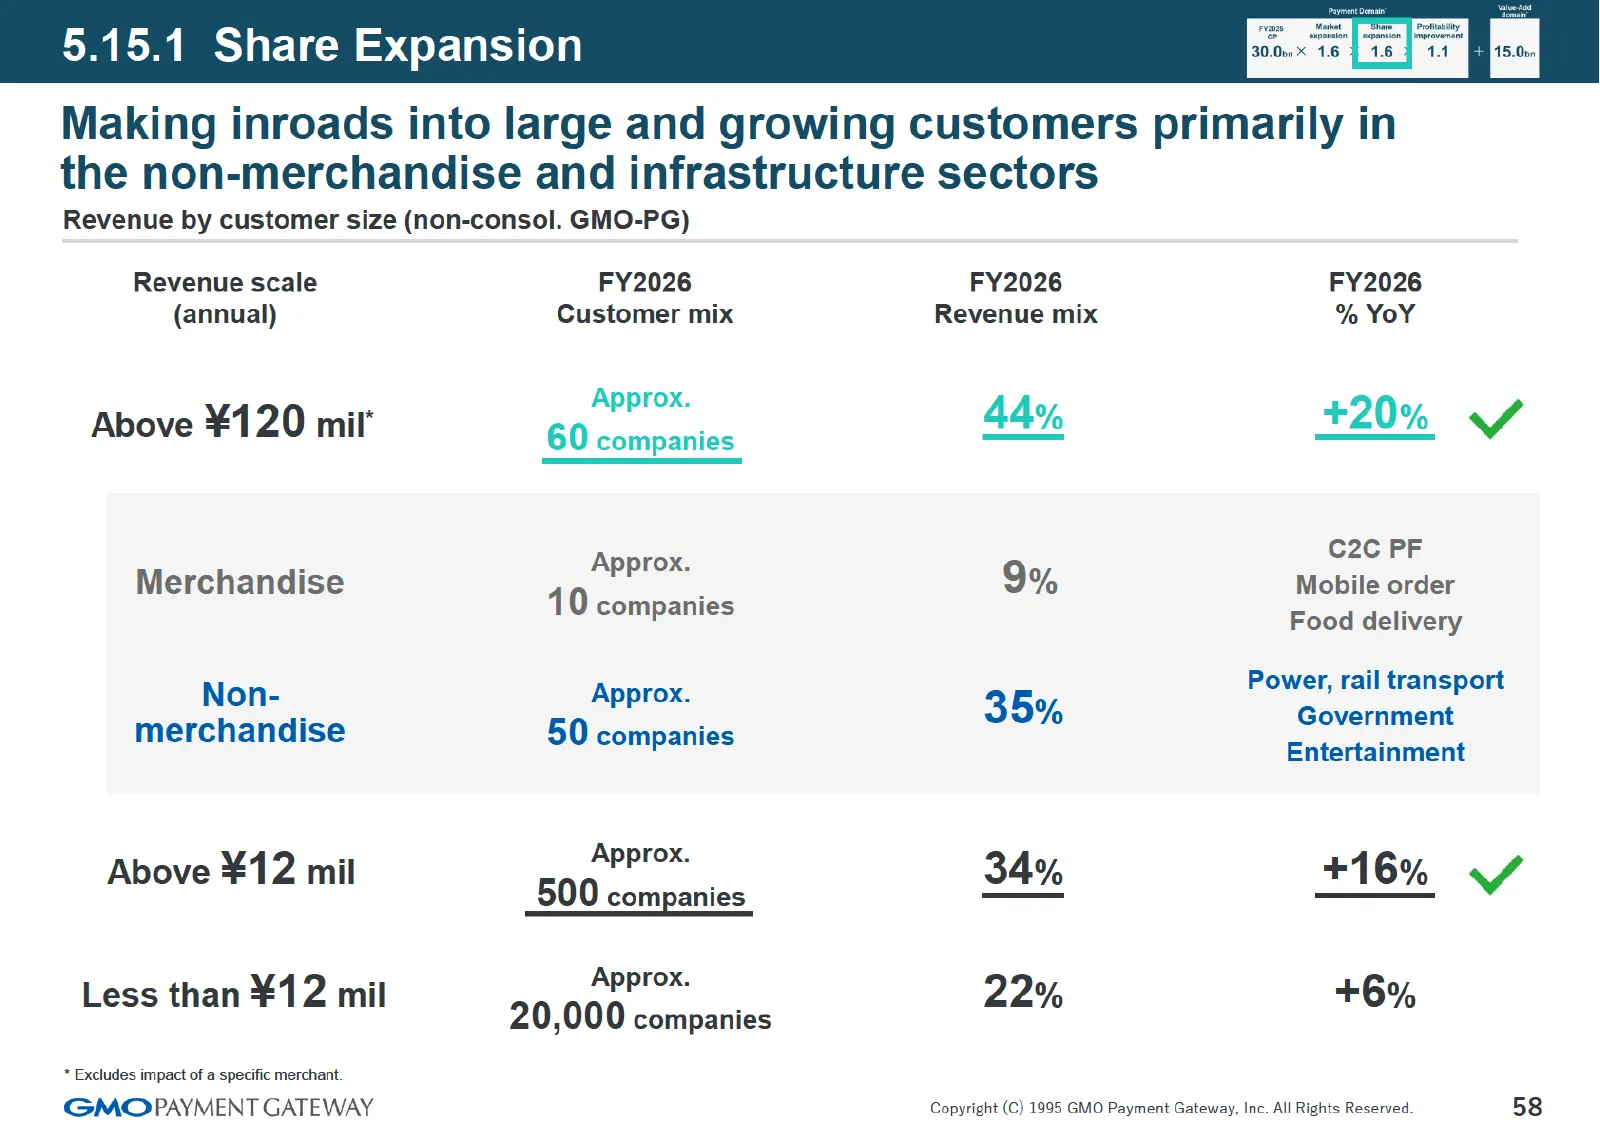
Slide 58: 5.15.1 Share Expansion
5.15.1 Share Expansion Making inroads into large and growing customers primarily in the non-merchandise and infrastructure sectors Revenue by customer size (non-consol. GMO-PG) Revenue scale FY2026 FY2026 FY2026 (annual) Customer mix Revenue mix % YoY vee Approx. Above ¥120 mil 44% +20% 60 companies
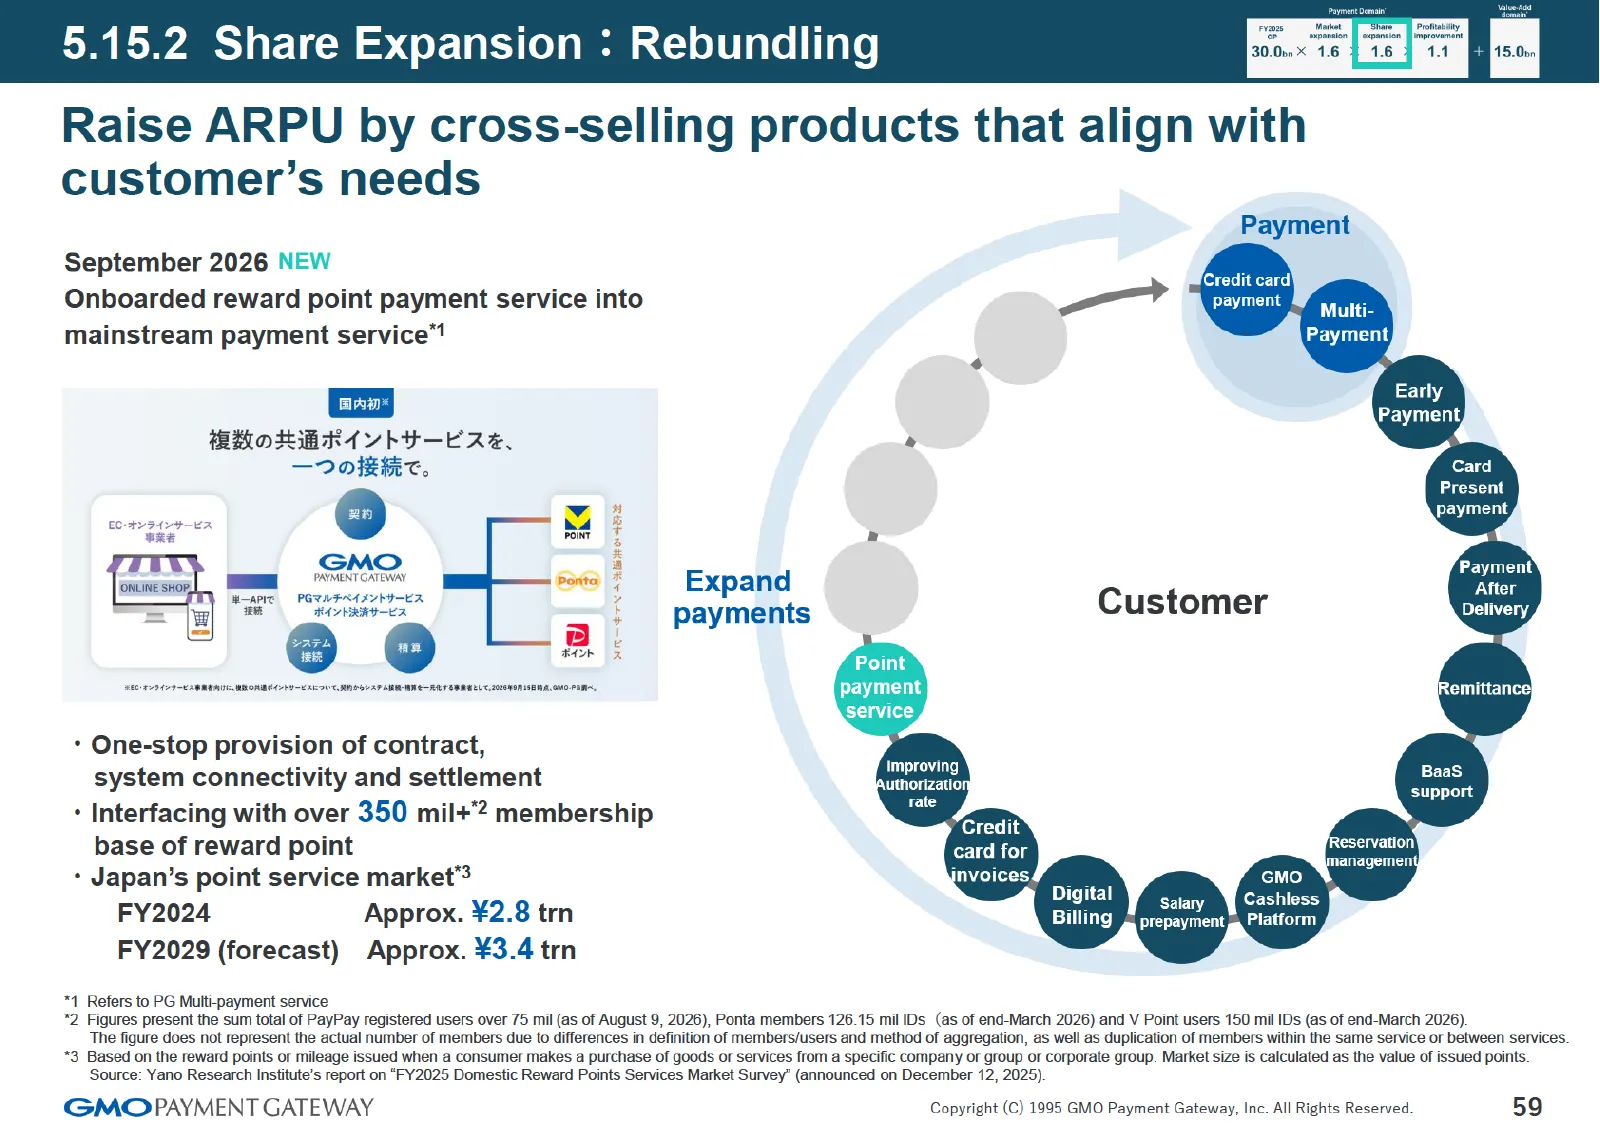
Slide 59: 5.15.2 Share Expansion: Rebundling
5.15.2 Share Expansion : Rebundling Raise ARPU by cross-selling products that align with customer’s needs September 2026 NEW Onboarded reward point payment service into mainstream payment service” MBOX RAYEG-ERE,. — oT. " @ Bi GMO : PAYMENT GATEWAY Bonta * Expand Ne POLHEAA SHIA a ae RonaaoNeA 5 pay
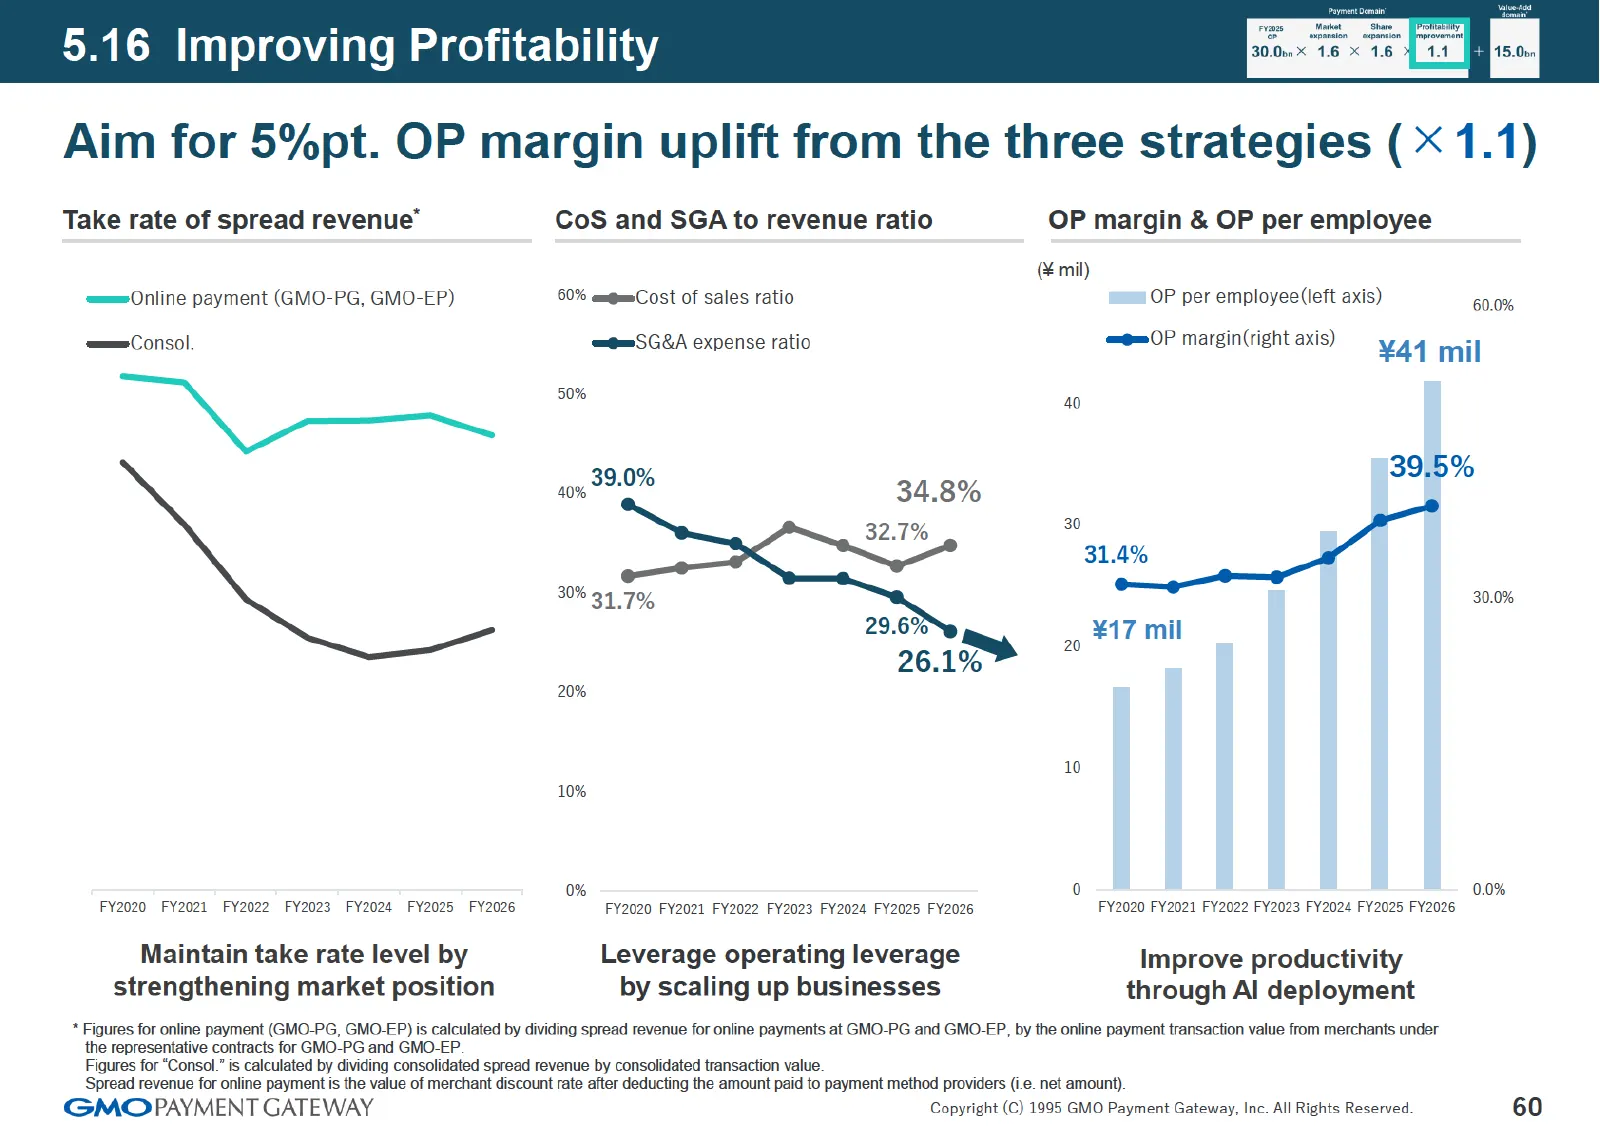
Slide 60: 5.16 Improving Profitability
5.16 Improving Profitability Aim for 5%pt. OP margin uplift from the three strategies ( < 1.1) Take rate of spread revenue” ====Online payment (GMO-PG, GMO-EP) ===Consol. FY2020 FY2021 FY2022 FY2023 FY2024 FY2025 FY2026 Maintain take rate level by strengthening market position CoS and SGA to revenue
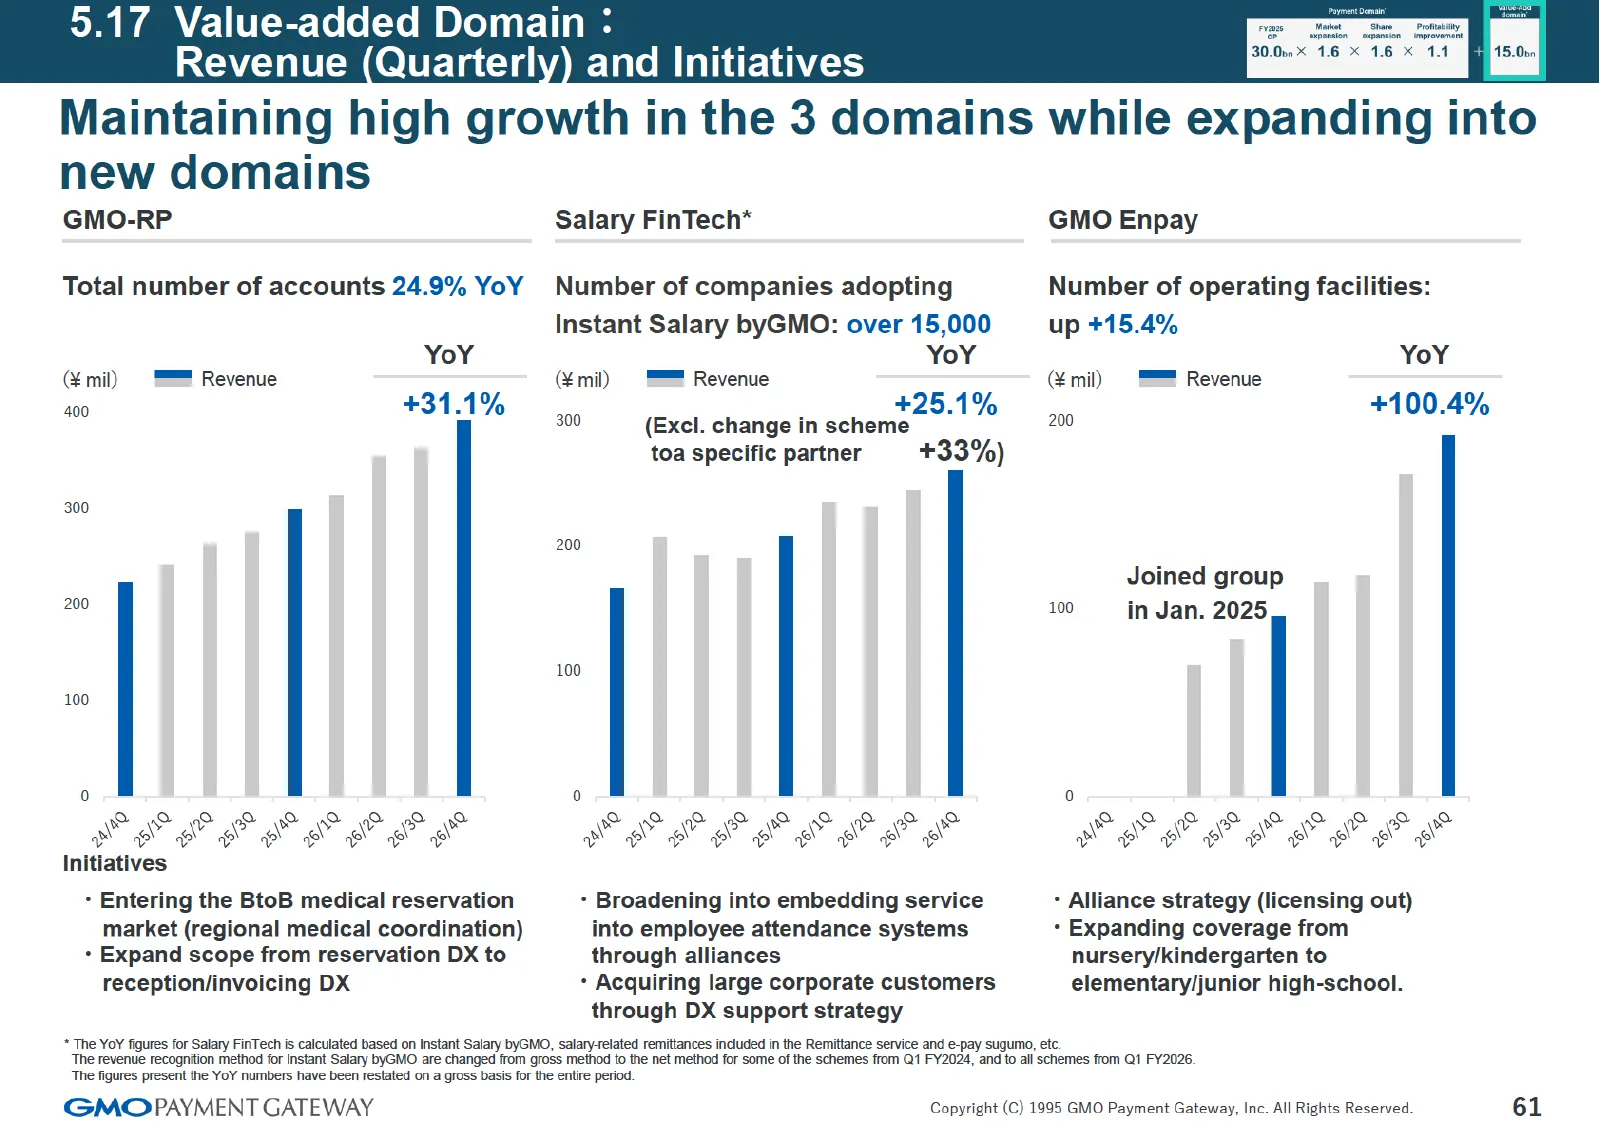
Slide 61: 5.17 Value-added Domain: Revenue (Quarterly) and Initiatives
.17 Value-added Domain : Revenue (Quarterly) and Initiatives Maintaining high growth in the 3 domains while expanding into new domains GMO-RP Salary FinTech* GMO Enpay Total number of accounts 24.9% YoY Number of companies adopting Number of operating facilities: Instant Salary byGMO: over 15,000 up
Slide 62: Thank You Very Much
Thank You Very Much FinTech Powers Next GMO PAYMENT GATEWAY GMO Payment Gateway, Inc. (3769; Tokyo Stock Exchange Prime) Please contact the IR Department for inquiries or requests for 1-on-1 interviews using the email address or telephone number shown below: TEL : +81-3-3464-0182 E-mail : ir-contact
Source: company website
More decks from GMO Payment Gateway, Inc.
 Investor Presentation (November 2026)63 slides · Nov 13, 2026
 FY2026 Earnings Presentation62 slides · Nov 13, 2026
 Q3 FY2026 Earnings Presentation60 slides · Aug 14, 2026
 Q3 FY2026 Earnings Presentation60 slides · Aug 14, 2026
 Investor Presentation (August 2026)70 slides · Aug 14, 2026
 Q2 FY2026 Earnings Presentation57 slides · May 15, 2026