Essity AB Class A · OMXSTO:ESSITY_A
Essity AB Class A — Non-Deal Roadshow (2017)
29 slides from Essity AB Class A's roadshow presentation, 2017
Slide 1: The Future Hygiene and Health Company
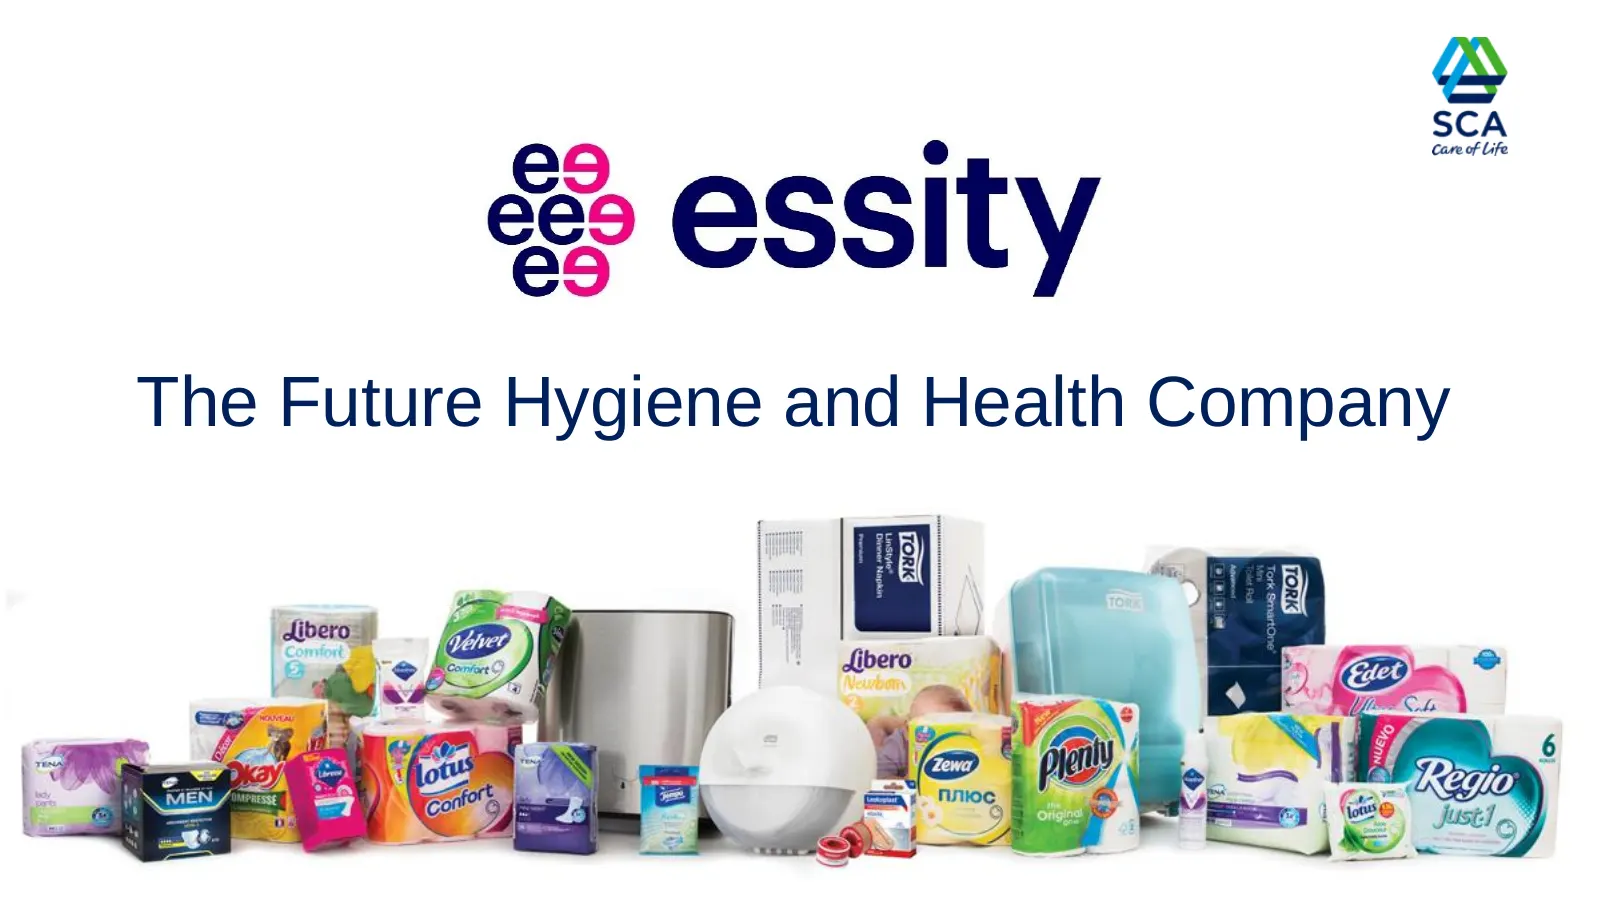
The Future Hygiene and Health Company
Slide 2: Forward-looking statements
This presentation may contain forward-looking statements. Such statements are based on our current expectations and are subject to certain risks and uncertainties that could negatively affect our business. Please read our most recent annual report for a better understanding of these risks and uncert
Slide 3: Essity in Brief
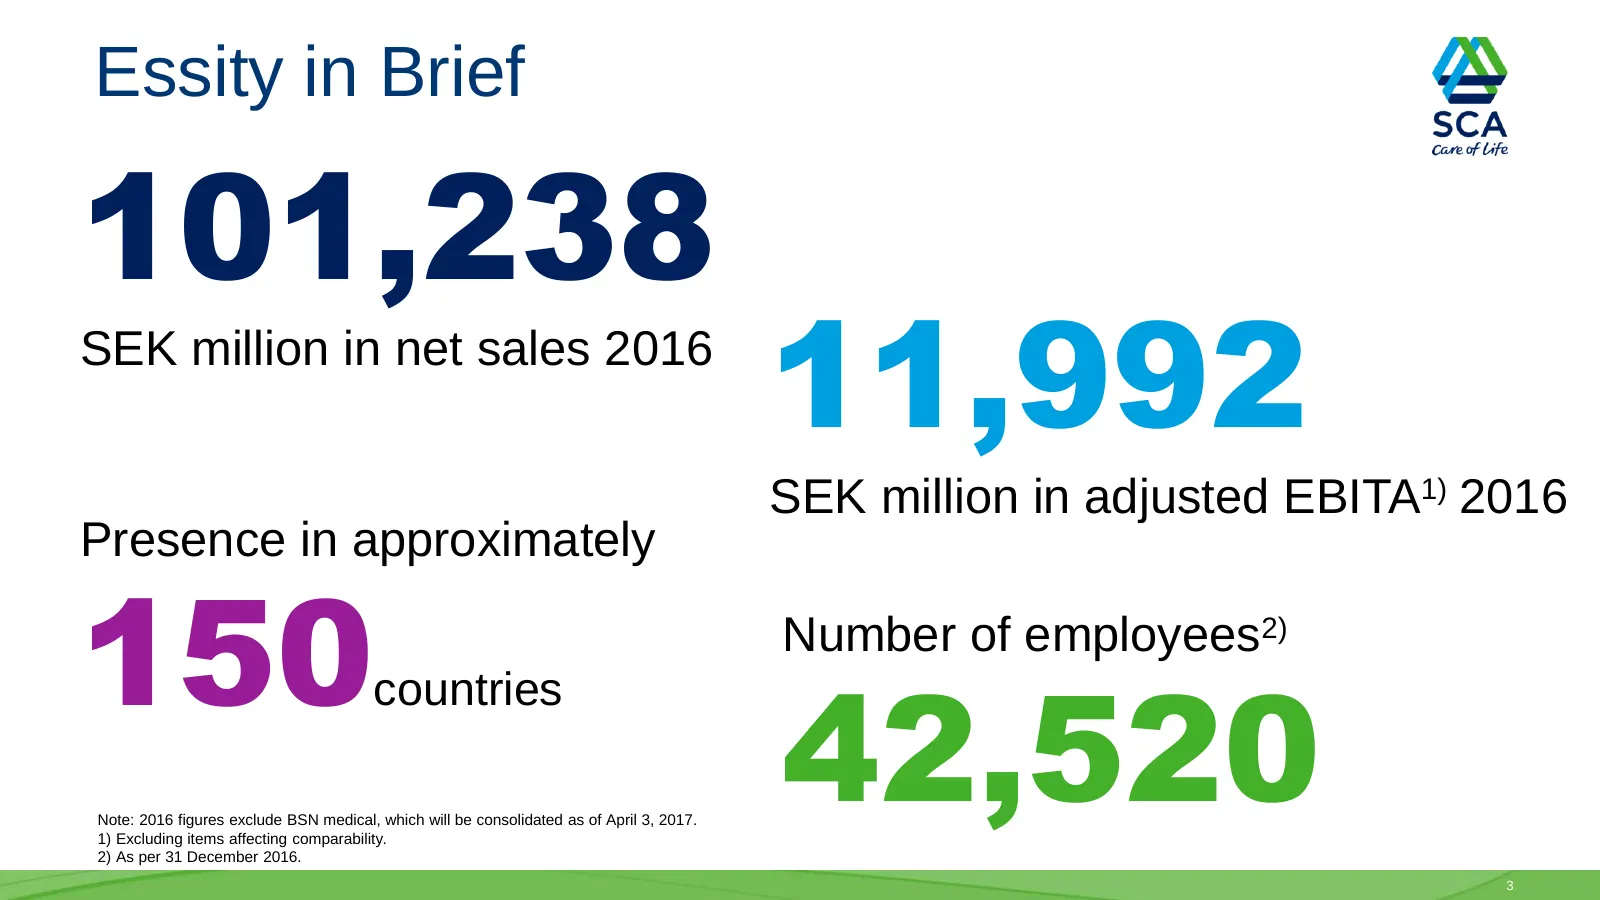
Essity in Brief 101,238 SEK million in net sales 2016 11,992 SEK million in adjusted EBITA1) 2016 Presence in approximately 150 Number of employees2) 42,520 countries Note: 2016 figures exclude BSN medical, which will be consolidated as of April 3, 2017. 1) Excluding items affecting comparability. 2
Slide 4: Essity’s Business
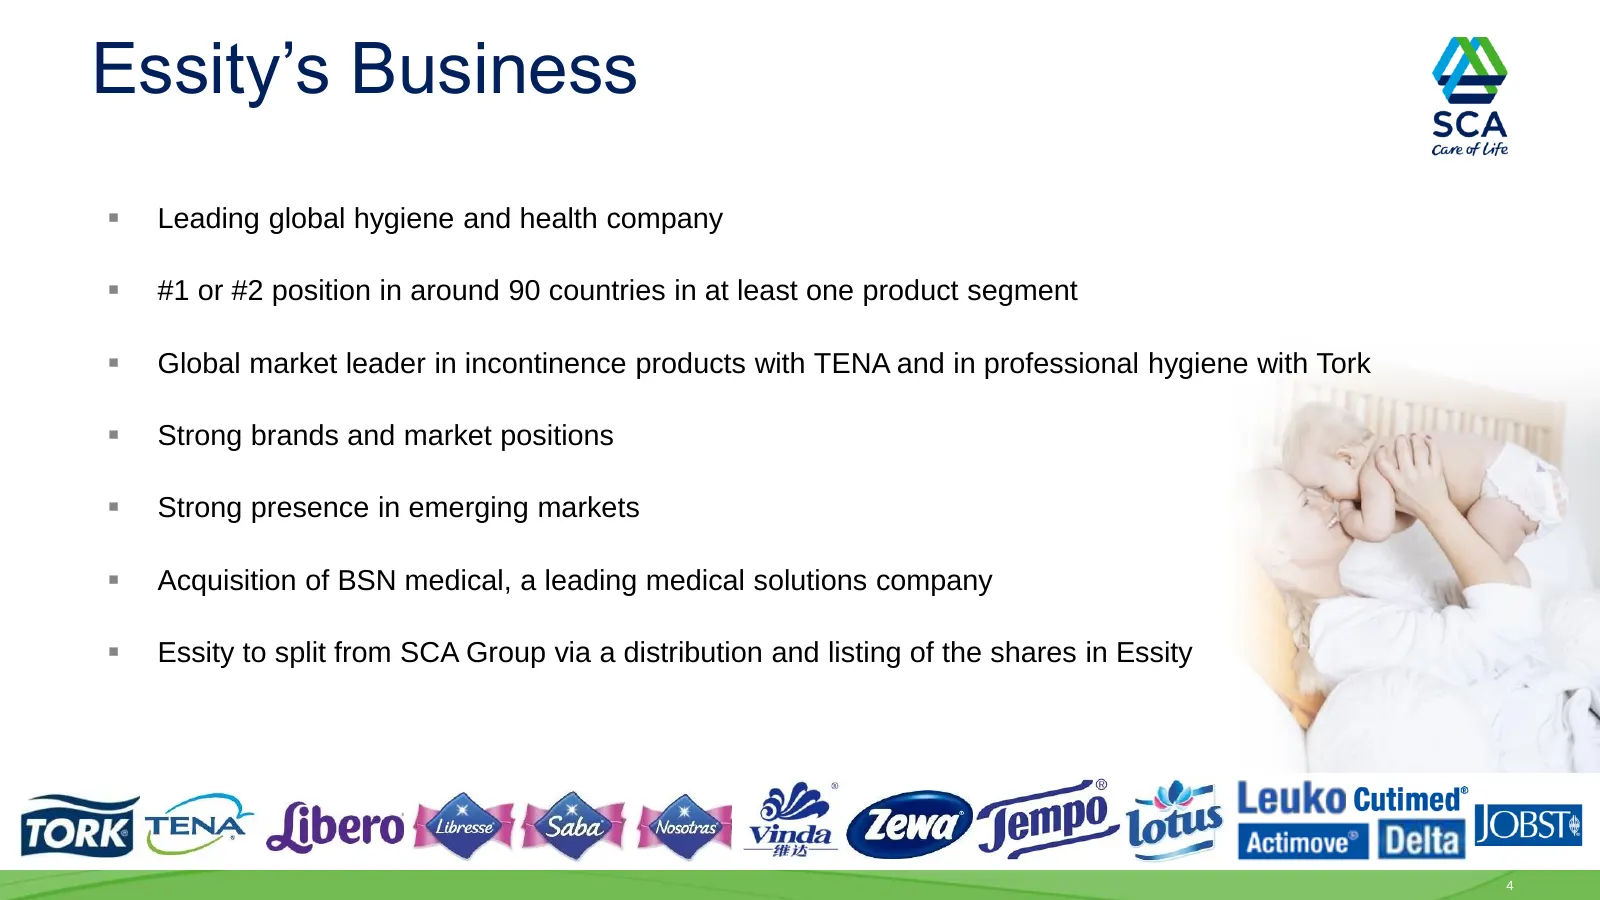
Essity’s Business Leading global hygiene and health company #1 or #2 position in around 90 countries in at least one product segment Global market leader in incontinence products with TENA and in professional hygiene with Tork Strong brands and market positions Strong presence in emerging
Slide 5: Key Investment Highlights
Key Investment Highlights Operates in attractive markets supported by demographic trends Leading market positions and strong brands Strong presence in emerging markets Successful innovations strengthen product offerings BSN medical acquisition creates new growth platform Track record of
Slide 6: 2016 Net Sales
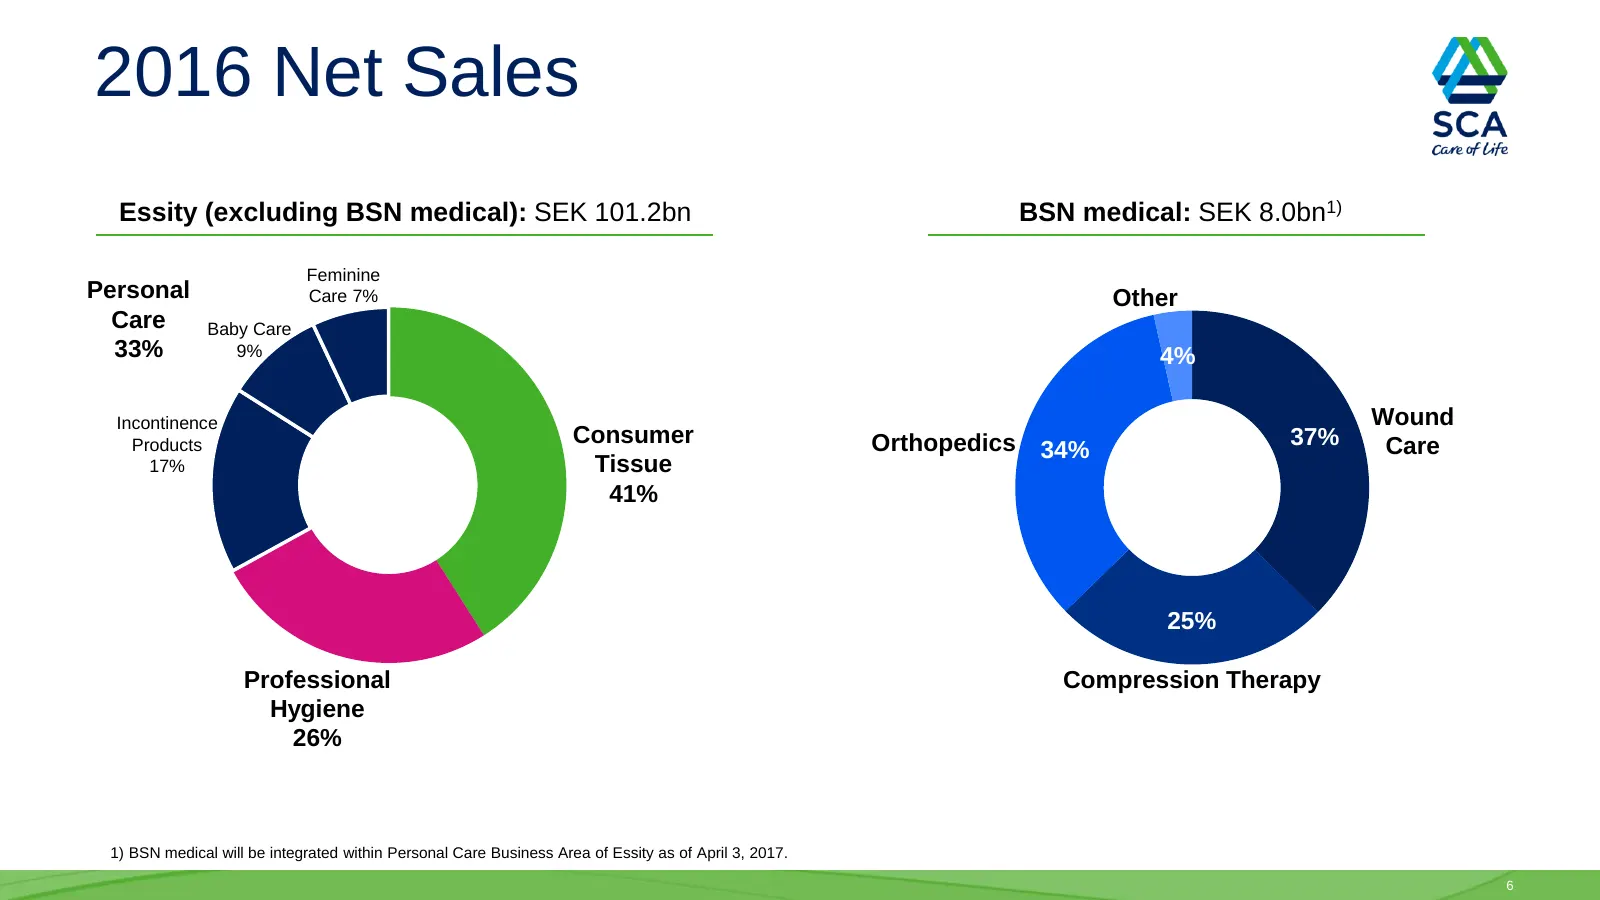
2016 Net Sales Essity (excluding BSN medical): SEK 101.2bn BSN medical: SEK 8.0bn1) Feminine Personal Care 7% Other Care Baby Care 33% 9% 4% Incontinence Wound Products Consumer Orthopedics 37% Care 34% 17% Tissue 41% 25% Professional Compression Therapy Hygiene 26% 1) BSN medical will be integrated
Slide 7: 2016 Net Sales by Geography
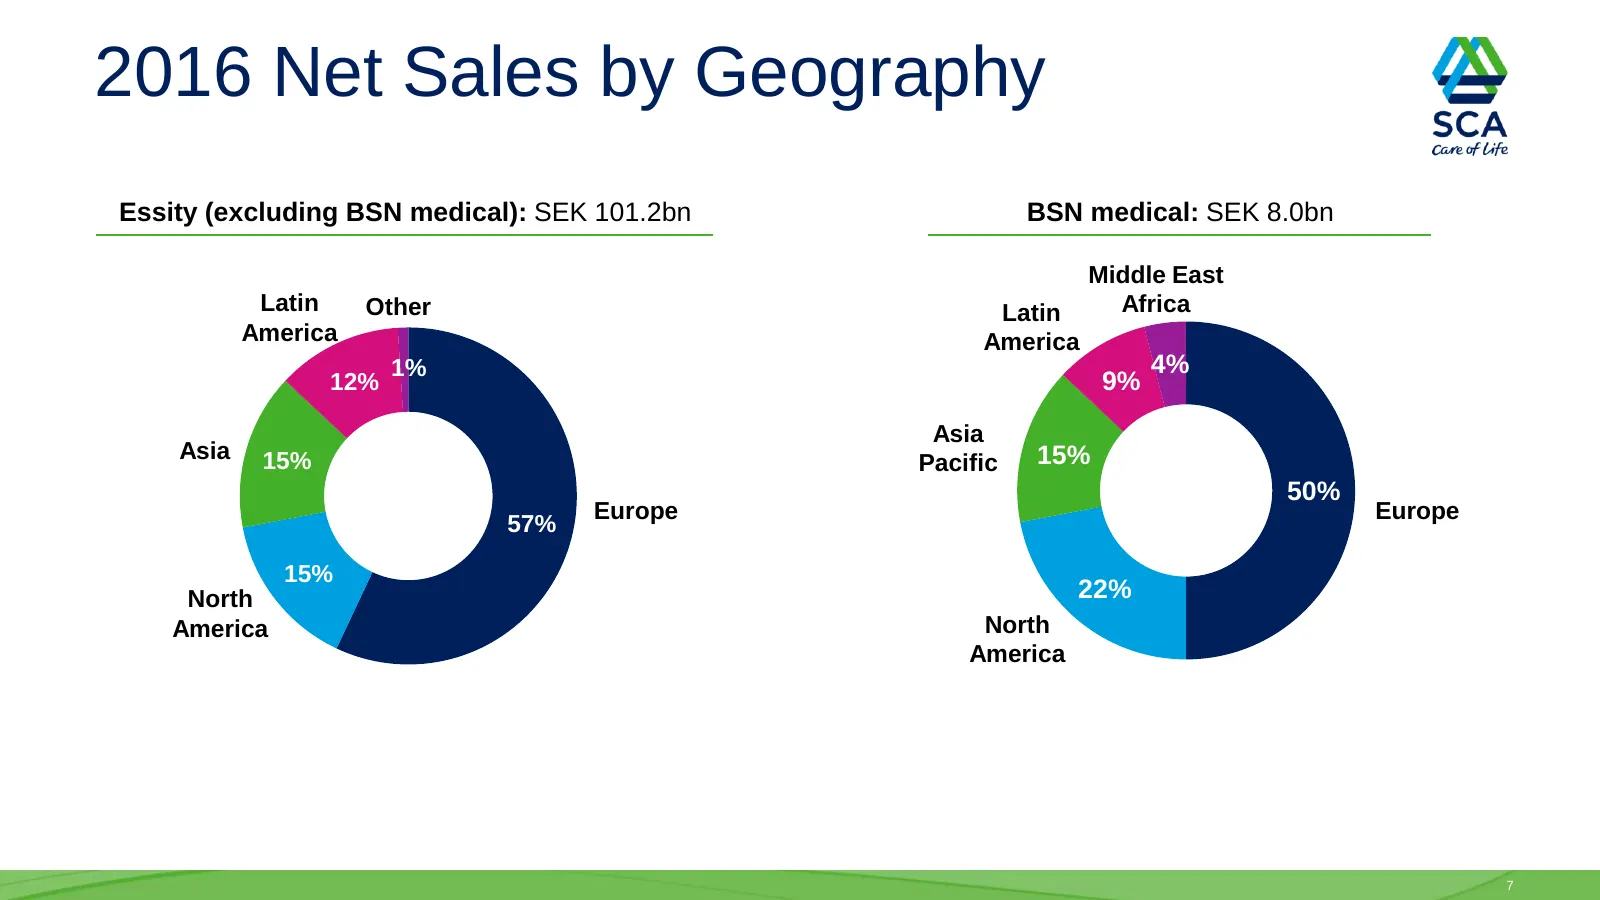
2016 Net Sales by Geography Essity (excluding BSN medical): SEK 101.2bn BSN medical: SEK 8.0bn Middle East Latin Other Latin Africa America America 1% 4% 12% 9% Asia Asia 15% Pacific 15% 50% Europe Europe 57% 15% North 22% America North America 7
Slide 8: 2016 Net Sales by Distribution Channel
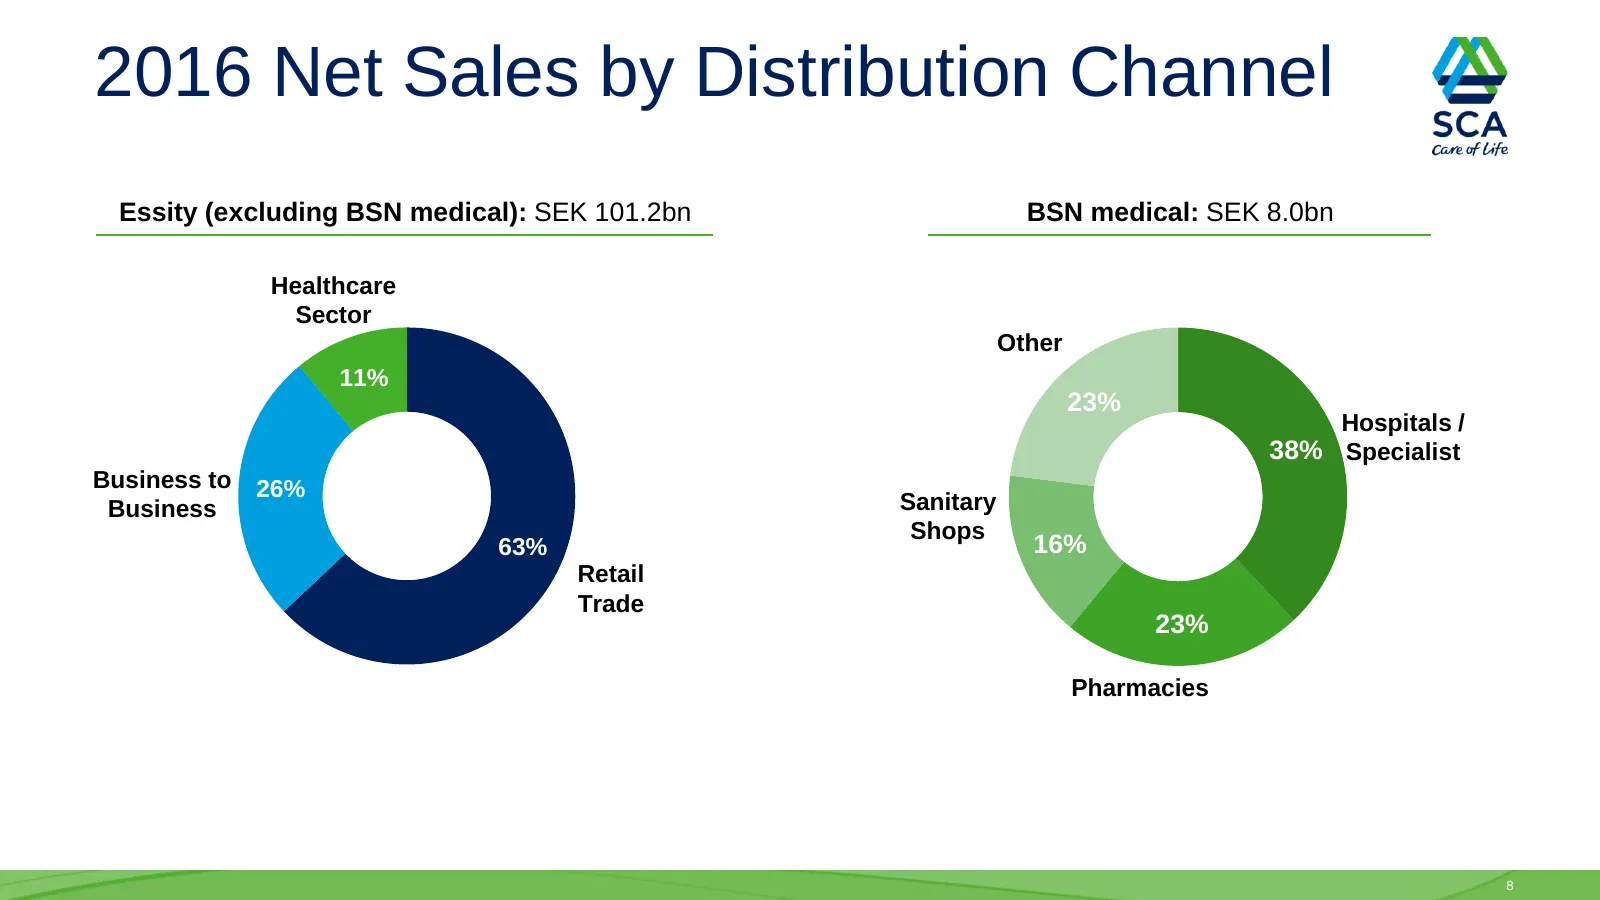
2016 Net Sales by Distribution Channel Essity (excluding BSN medical): SEK 101.2bn BSN medical: SEK 8.0bn Healthcare Sector Other 11% 23% Hospitals / 38% Specialist Business to 26% Business Sanitary Shops 63% 16% Retail Trade 23% Pharmacies 8
Slide 9: Global Market Positions
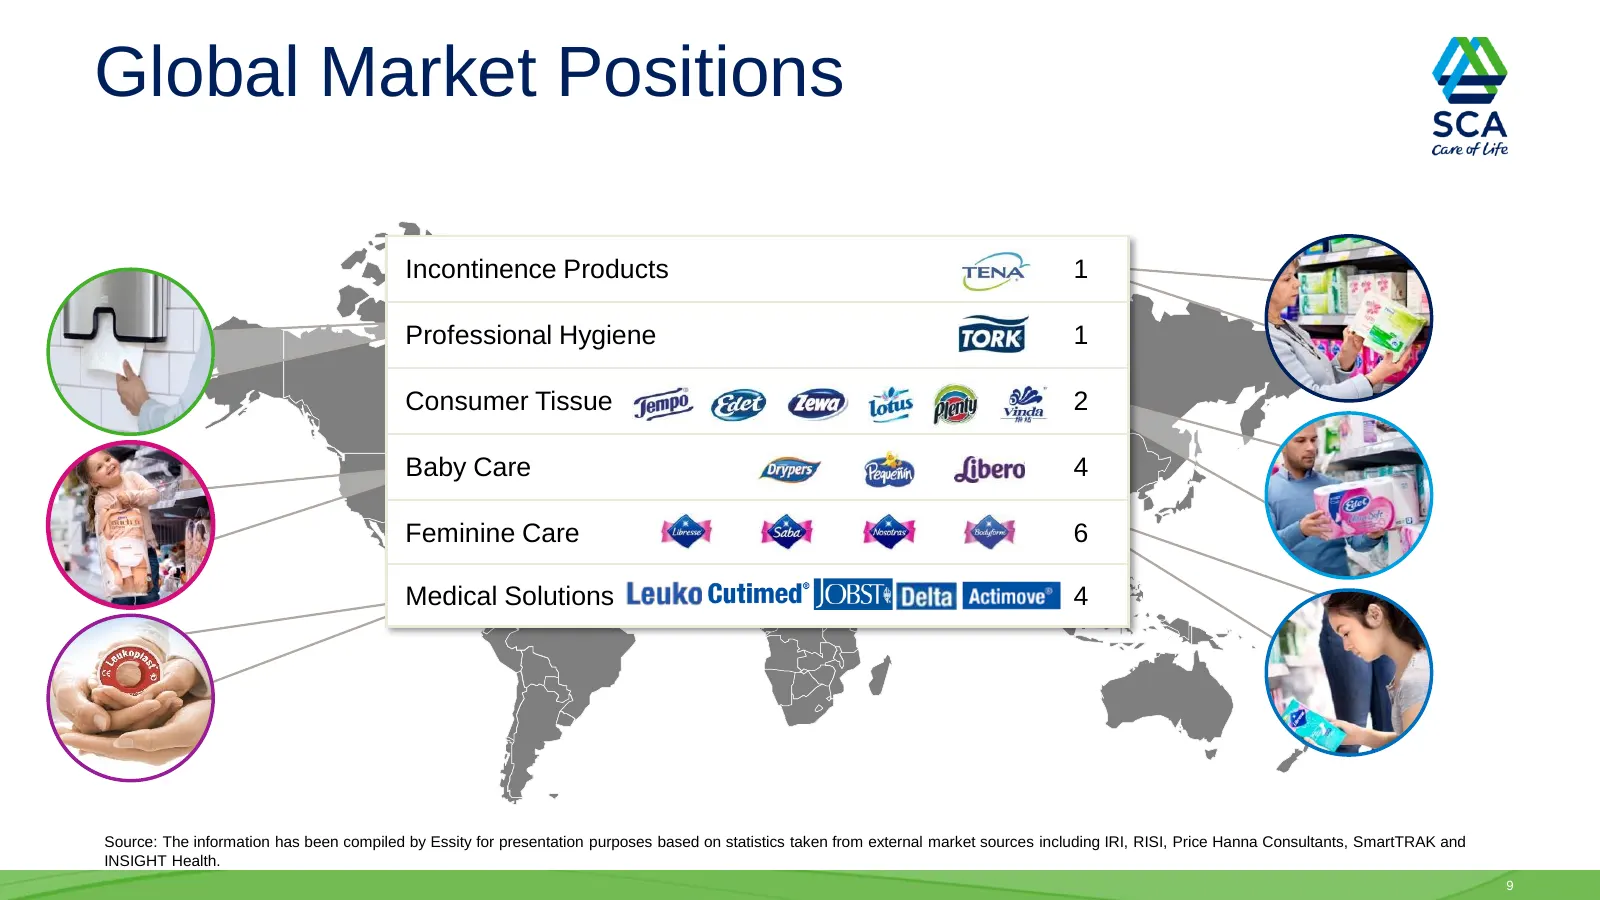
Global Market Positions Incontinence Products 1 Professional Hygiene 1 Consumer Tissue 2 Baby Care 4 Feminine Care 6 Medical Solutions 4 Source: The information has been compiled by Essity for presentation purposes based on statistics taken from external market sources including IRI, RISI, Price Han
Slide 10: Addressable Hygiene and Health Market by Region
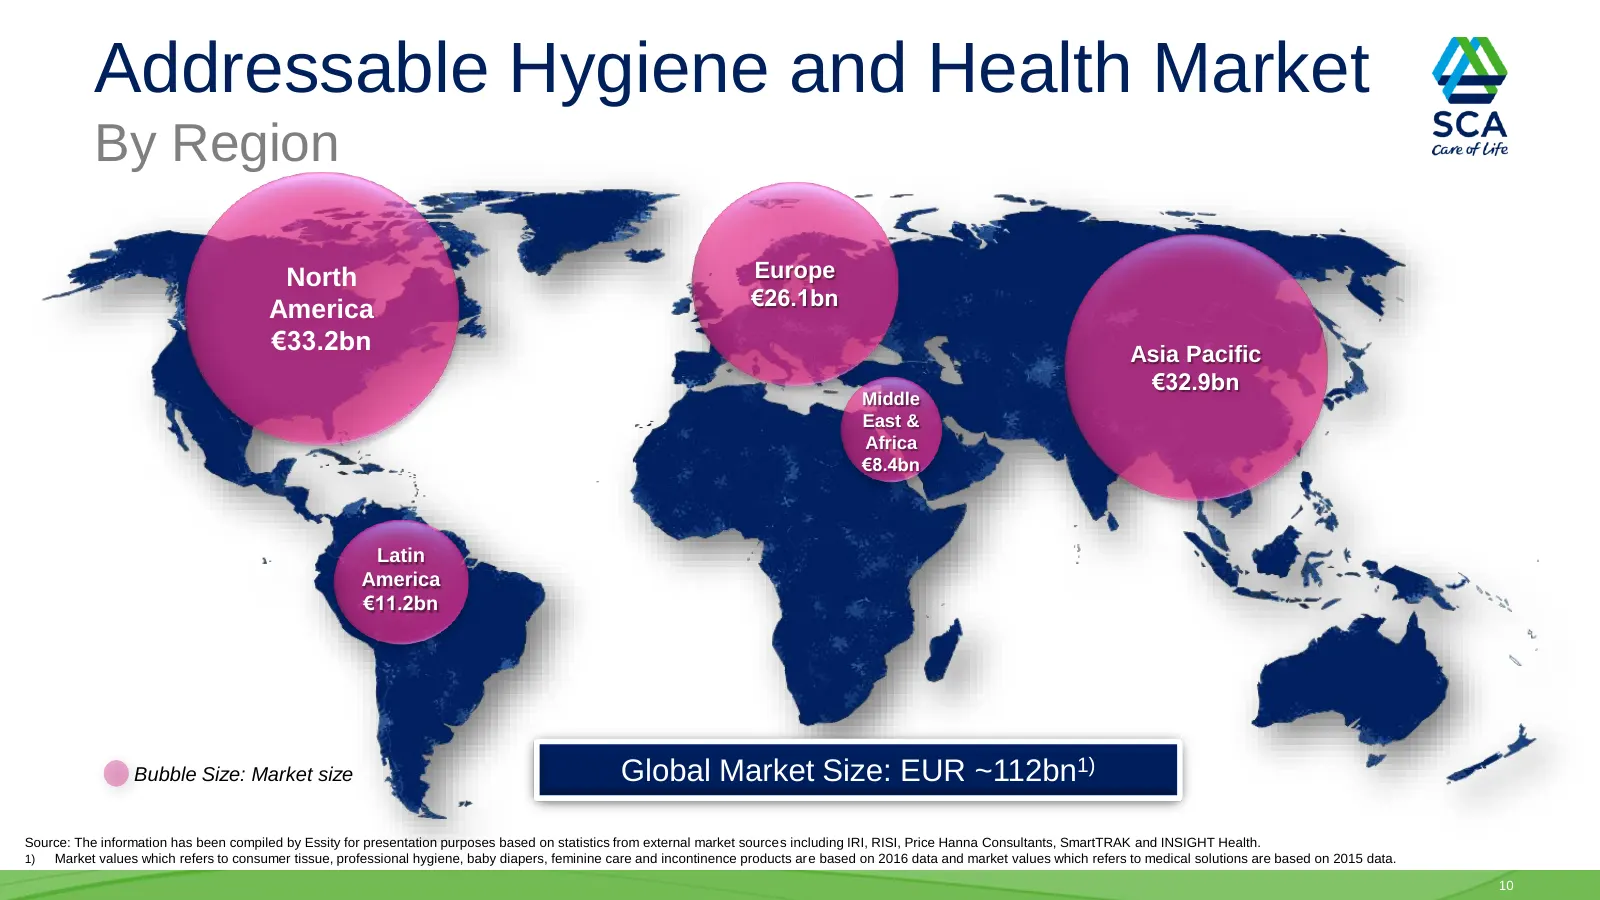
Addressable Hygiene and Health Market By Region North Europe America €26.1bn €33.2bn Asia Pacific €32.9bn Middle East & Africa €8.4bn Latin America €11.2bn Bubble Size: Market size Global Market Size: EUR ~112bn1) Source: The information has been compiled by Essity for presentation purposes based on
Slide 11: Addressable Hygiene and Health Market by Category
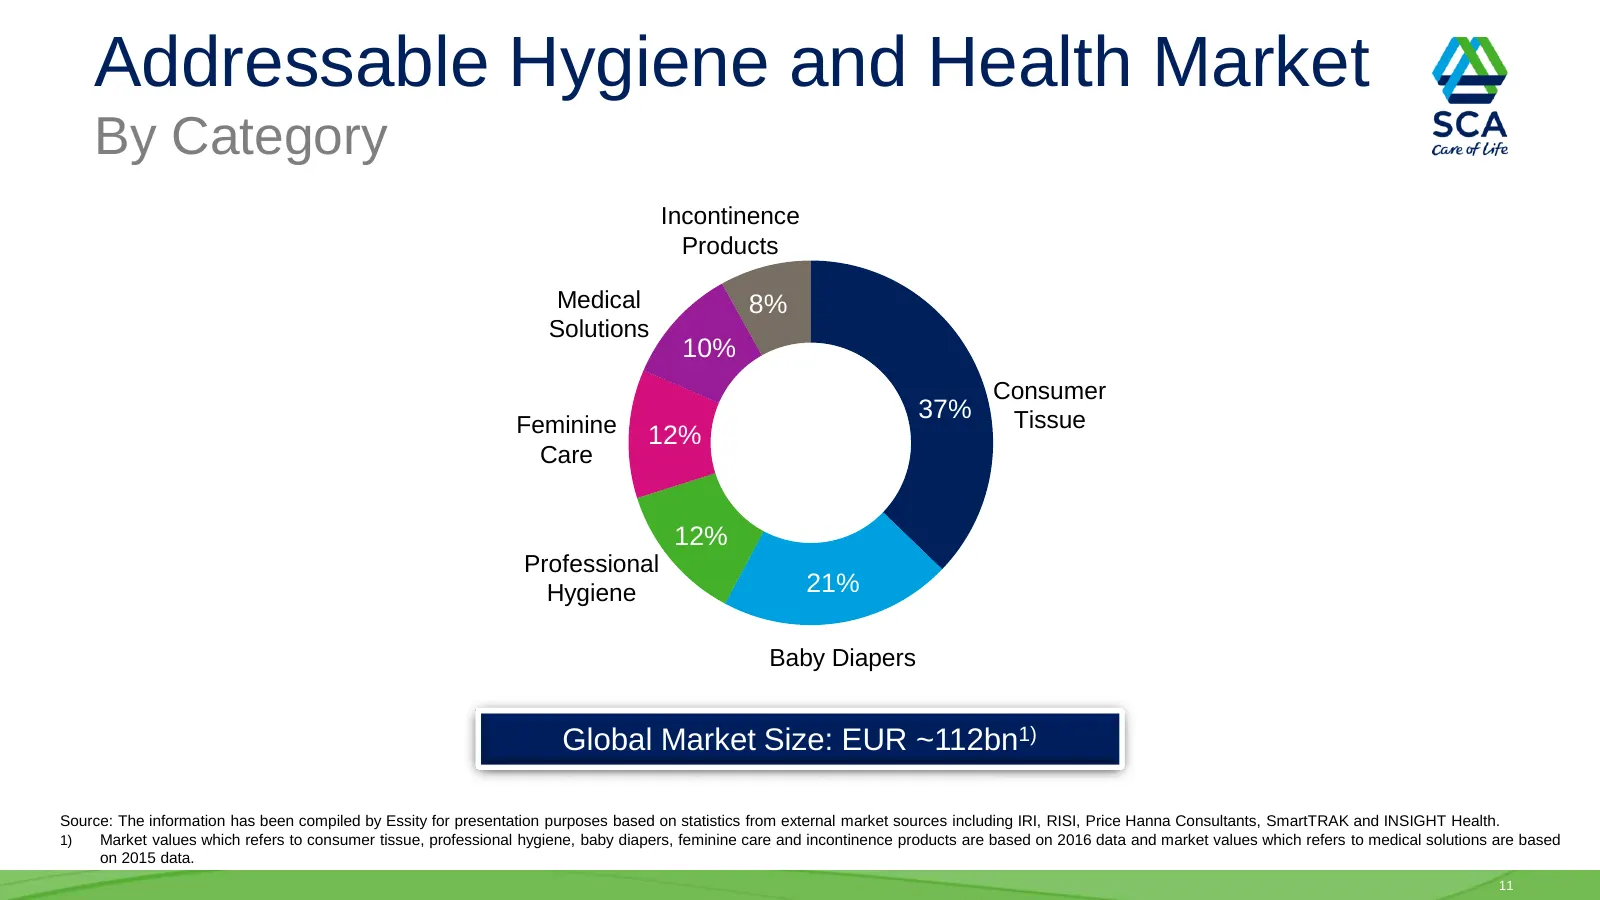
Addressable Hygiene and Health Market By Category Incontinence Products Medical 8% Solutions 10% Consumer 37% Tissue Feminine 12% Care 12% Professional Hygiene 21% Baby Diapers Global Market Size: EUR ~112bn1) Source: The information has been compiled by Essity for presentation purposes based on sta
Slide 12: Favorable Market Trends
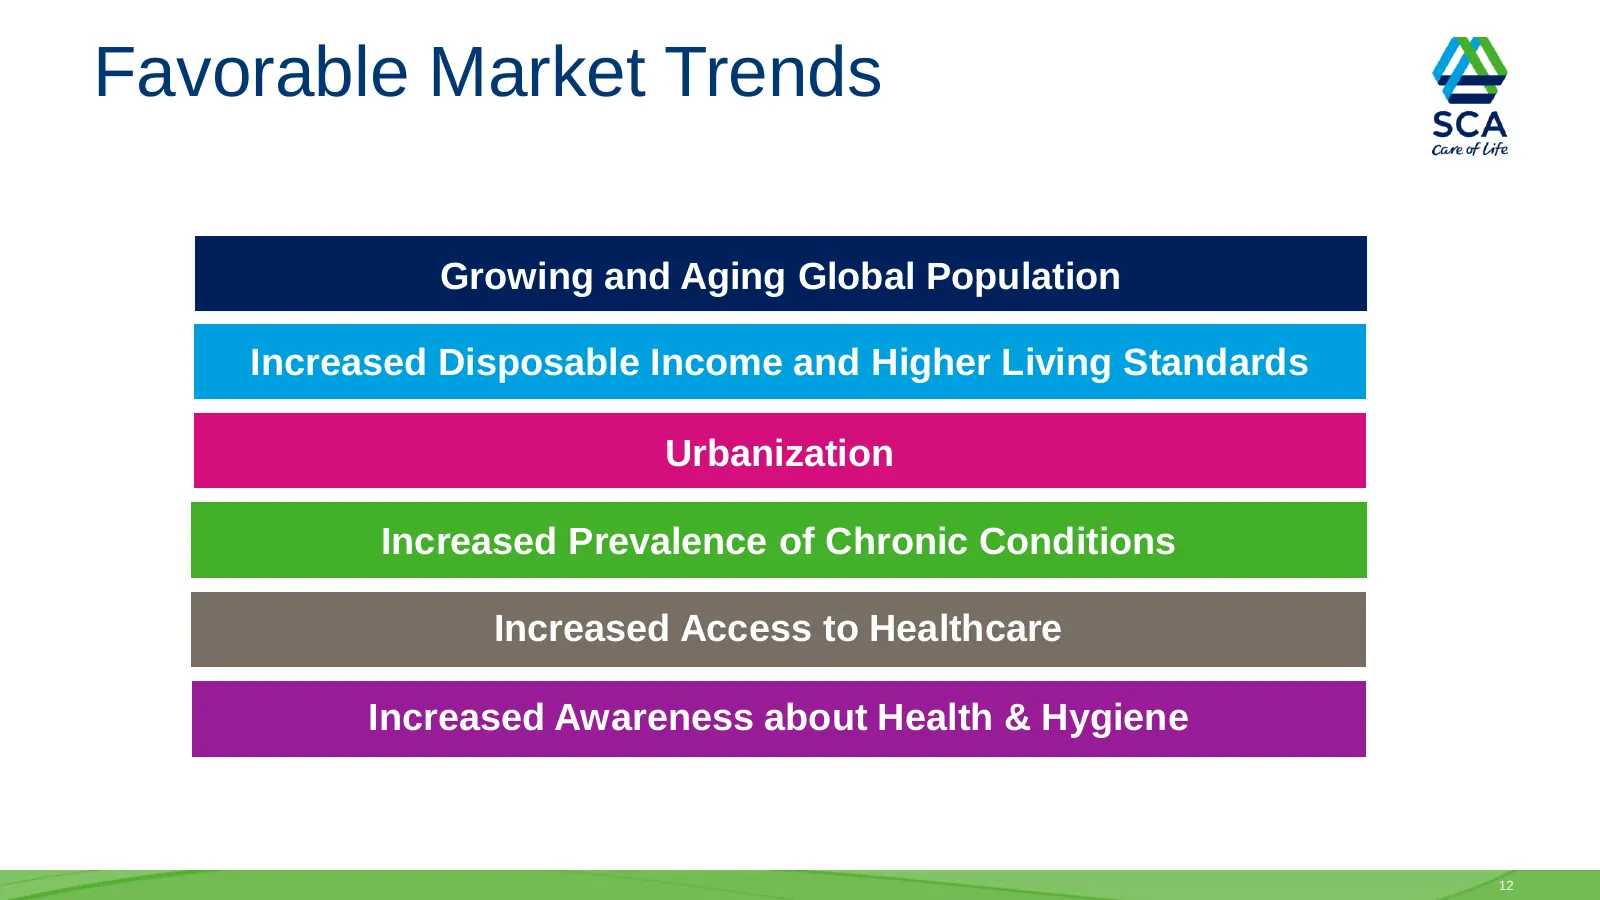
Favorable Market Trends Growing and Aging Global Population Increased Disposable Income and Higher Living Standards Urbanization Increased Prevalence of Chronic Conditions Increased Access to Healthcare Increased Awareness about Health & Hygiene 12
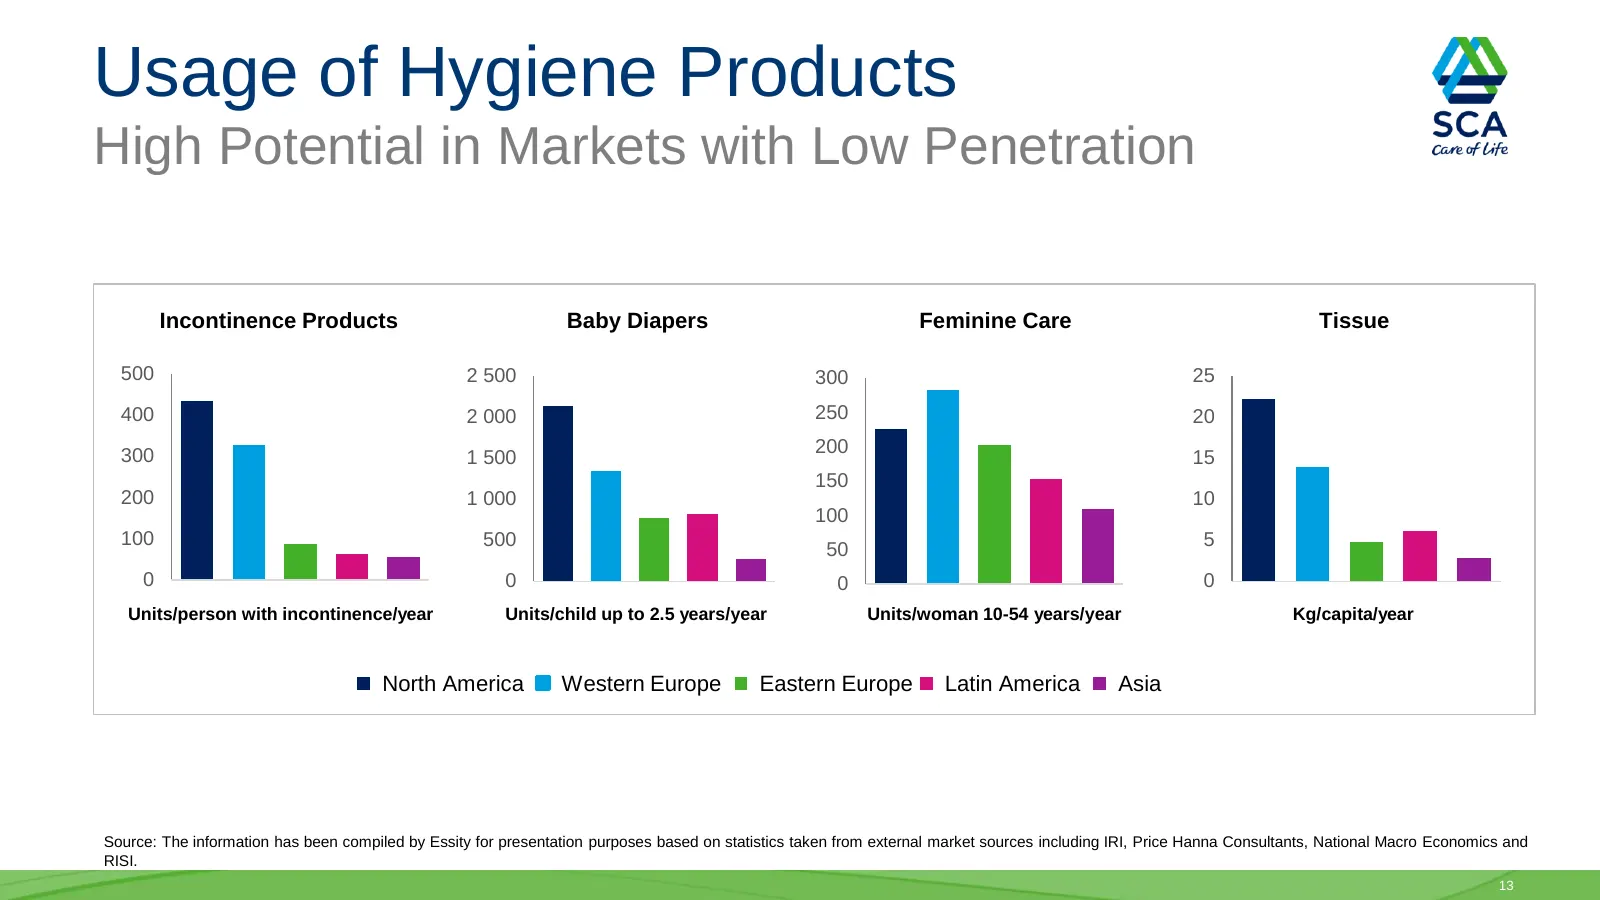
Slide 13: Usage of Hygiene Products
Usage of Hygiene Products High Potential in Markets with Low Penetration Incontinence Products Baby Diapers Feminine Care Tissue 500 2 500 300 25 400 2 000 250 20 300 200 1 500 15 150 200 1 000 10 100 100 500 5 50 0 North America West Europé Eastern Europé Latinamerica Asia 0 North America West Euro
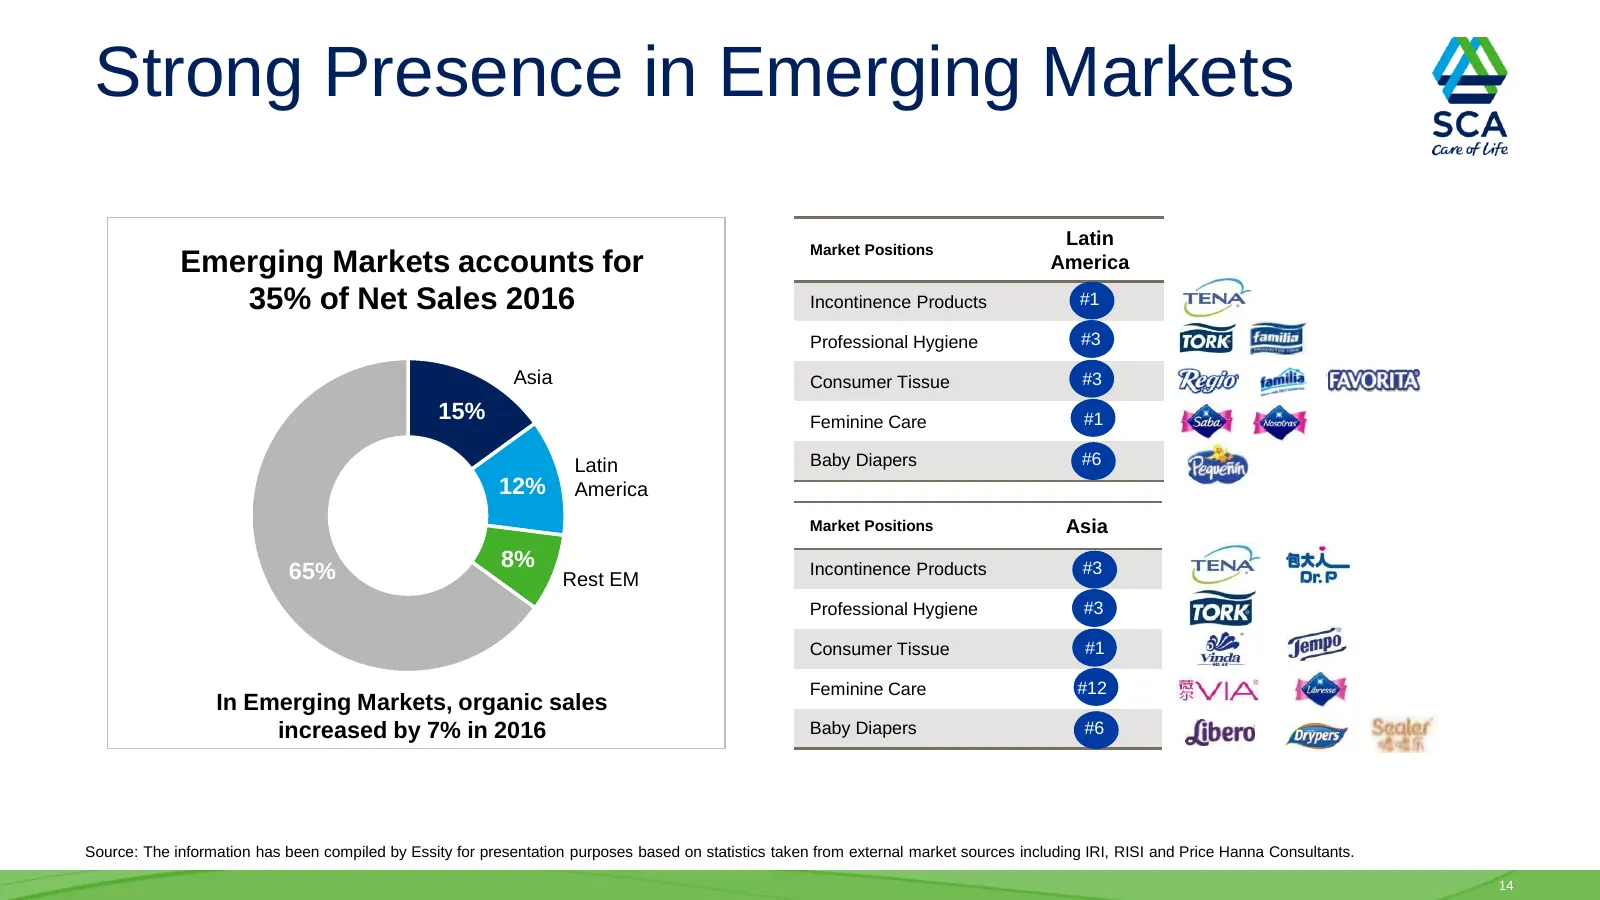
Slide 14: Strong Presence in Emerging Markets
Strong Presence in Emerging Markets Latin Market Positions Emerging Markets accounts for America 35% of Net Sales 2016 Incontinence Products #1 Professional Hygiene #3 Asia Consumer Tissue #3 15% Feminine Care #1 Latin Baby Diapers #6 12% America Market Positions Asia 8% Incontinence Products #3 65%
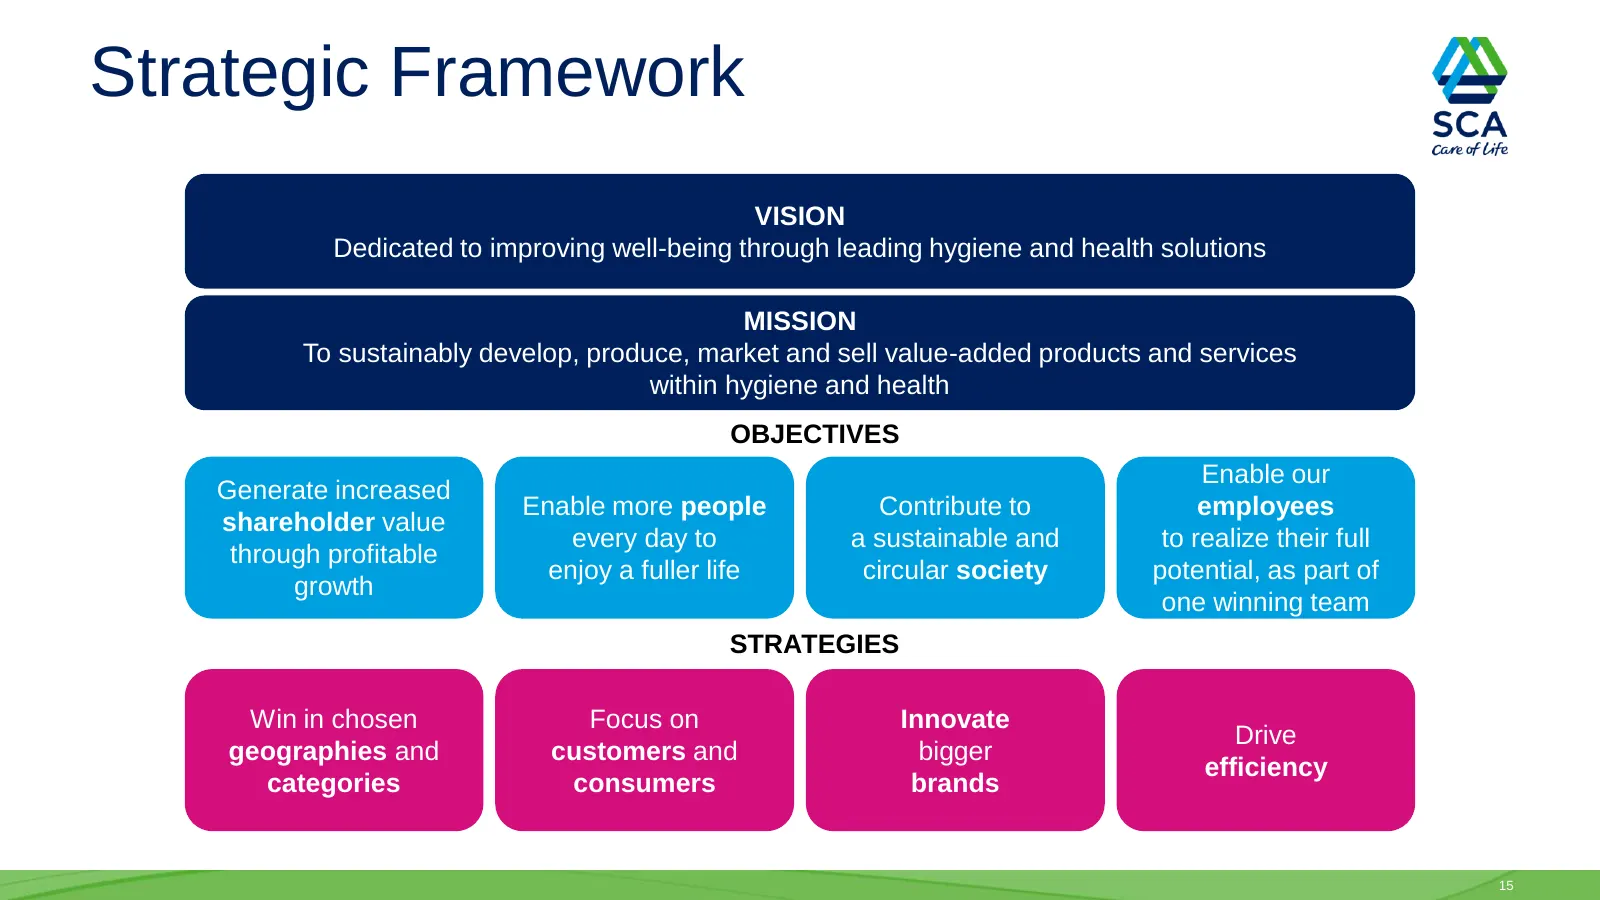
Slide 15: Strategic Framework
Strategic Framework VISION Dedicated to improving well-being through leading hygiene and health solutions MISSION To sustainably develop, produce, market and sell value-added products and services within hygiene and health OBJECTIVES Enable our Generate increased Enable more people Contribute to emp
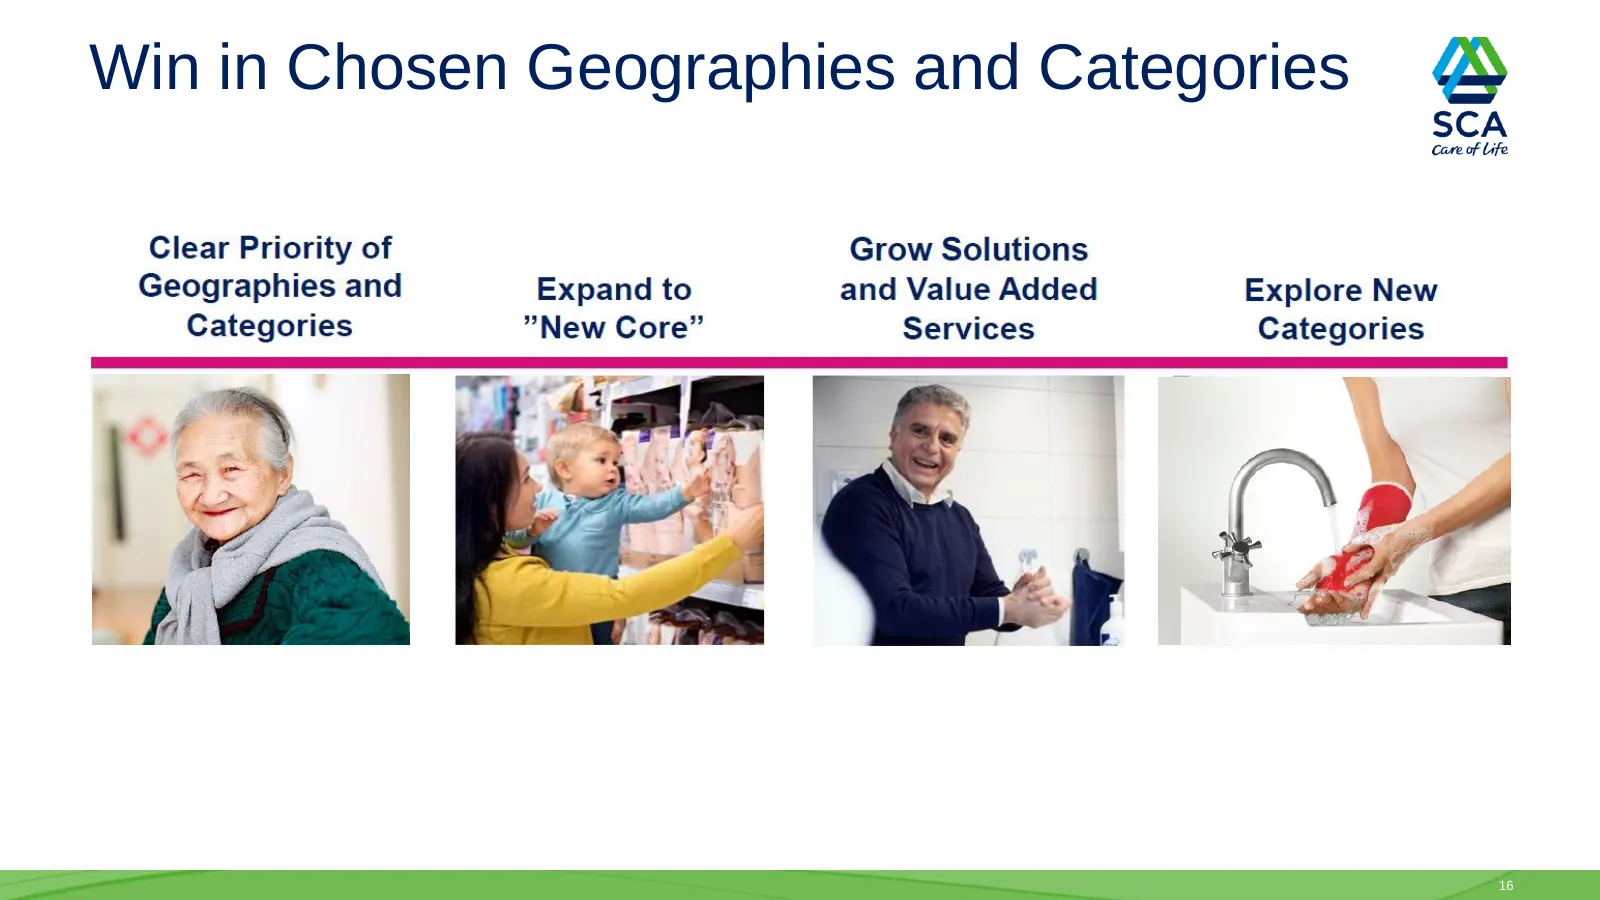
Slide 16: Win in Chosen Geographies and Categories
Win in Chosen Geographies and Categories 16
Slide 17: BSN Medical: A Value Creating Acquisition
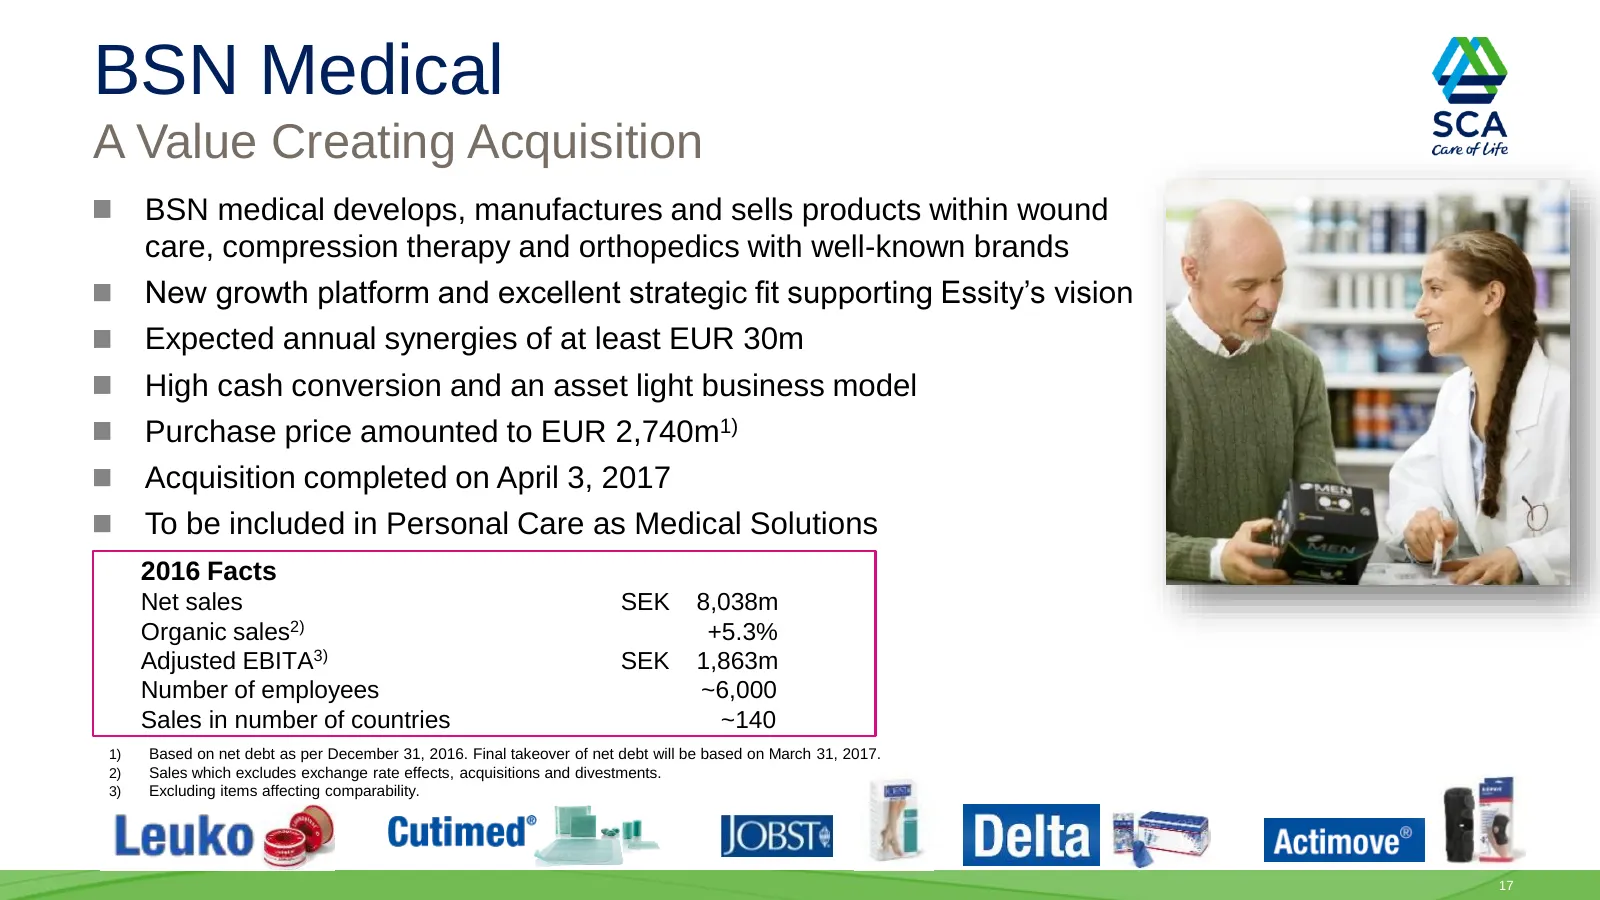
BSN Medical A Value Creating Acquisition BSN medical develops, manufactures and sells products within wound care, compression therapy and orthopedics with well-known brands New growth platform and excellent strategic fit supporting Essity’s vision Expected annual synergies of at least EUR 30m High c
Slide 18: Category Strategies
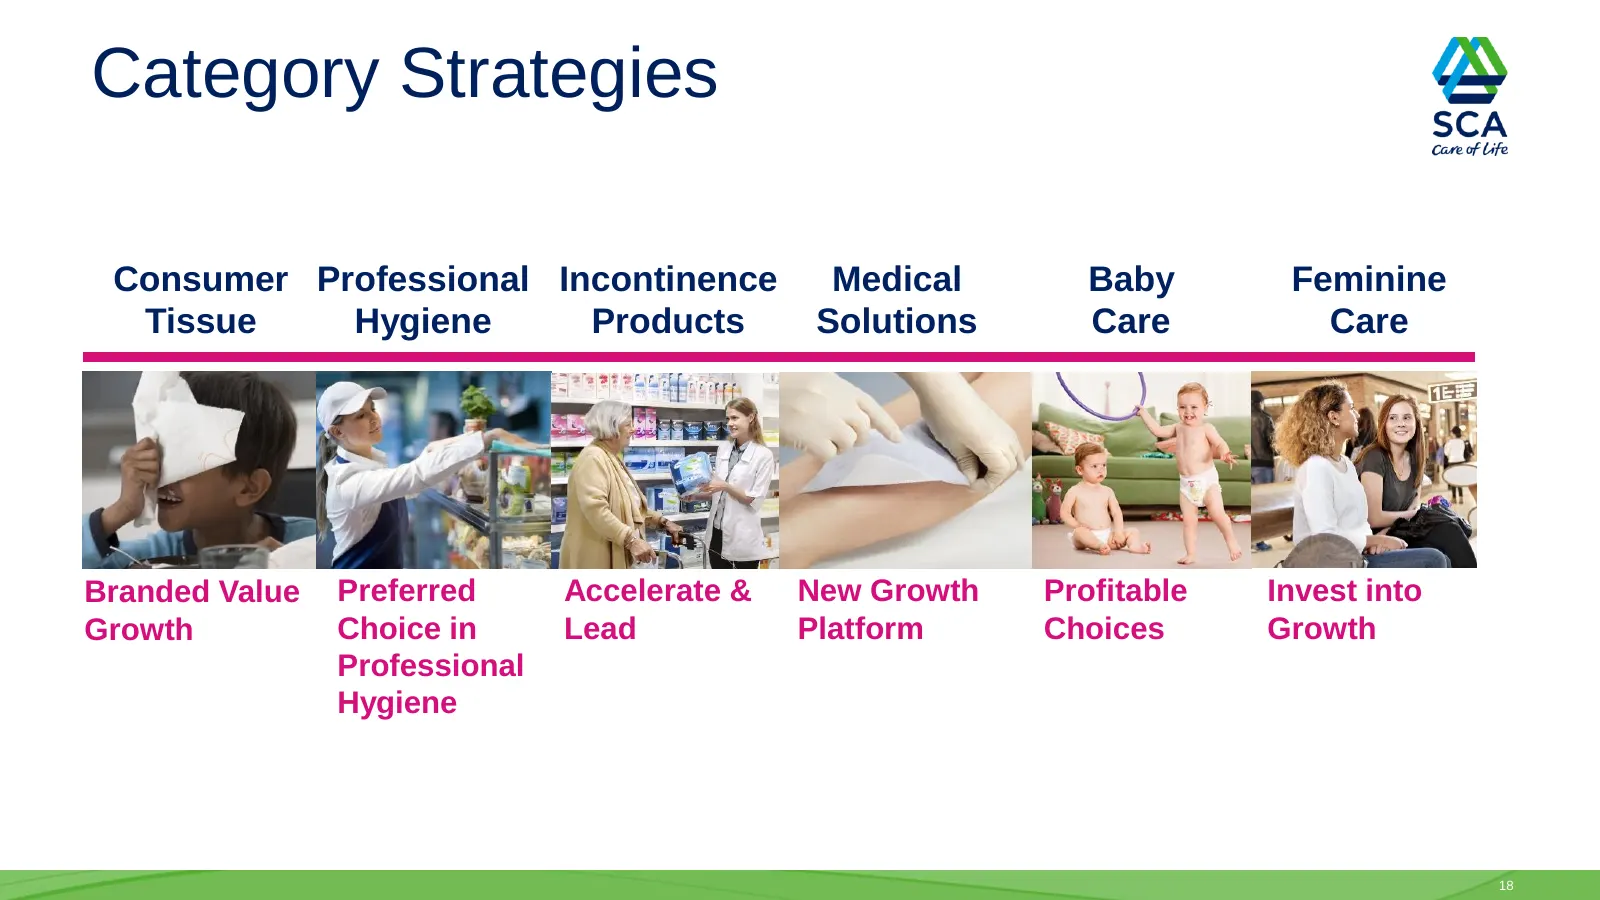
Category Strategies Consumer Professional Incontinence Medical Baby Feminine Tissue Hygiene Products Solutions Care Care Branded Value Preferred Accelerate & New Growth Profitable Invest into Growth Choice in Lead Platform Choices Growth Professional Hygiene 18
Slide 19: Innovate Bigger Brands
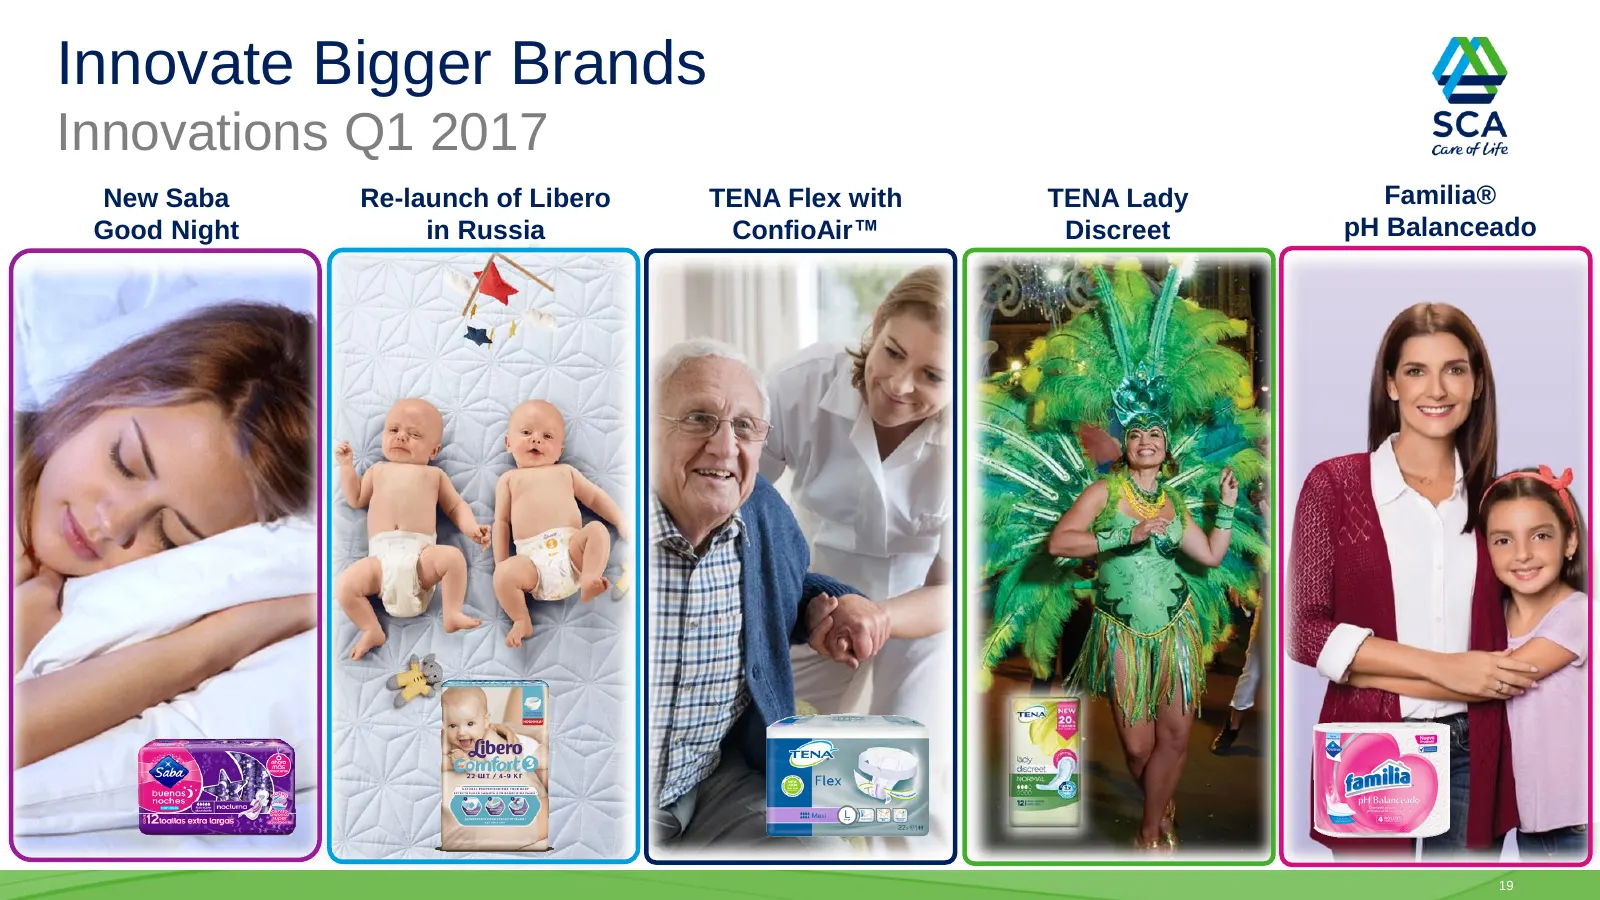
Innovate Bigger Brands Innovations Q1 2017 New Saba Re-launch of Libero TENA Flex with TENA Lady Familia® Good Night in Russia ConfioAir™ Discreet pH Balanceado 19
Slide 20: Drive Efficiency
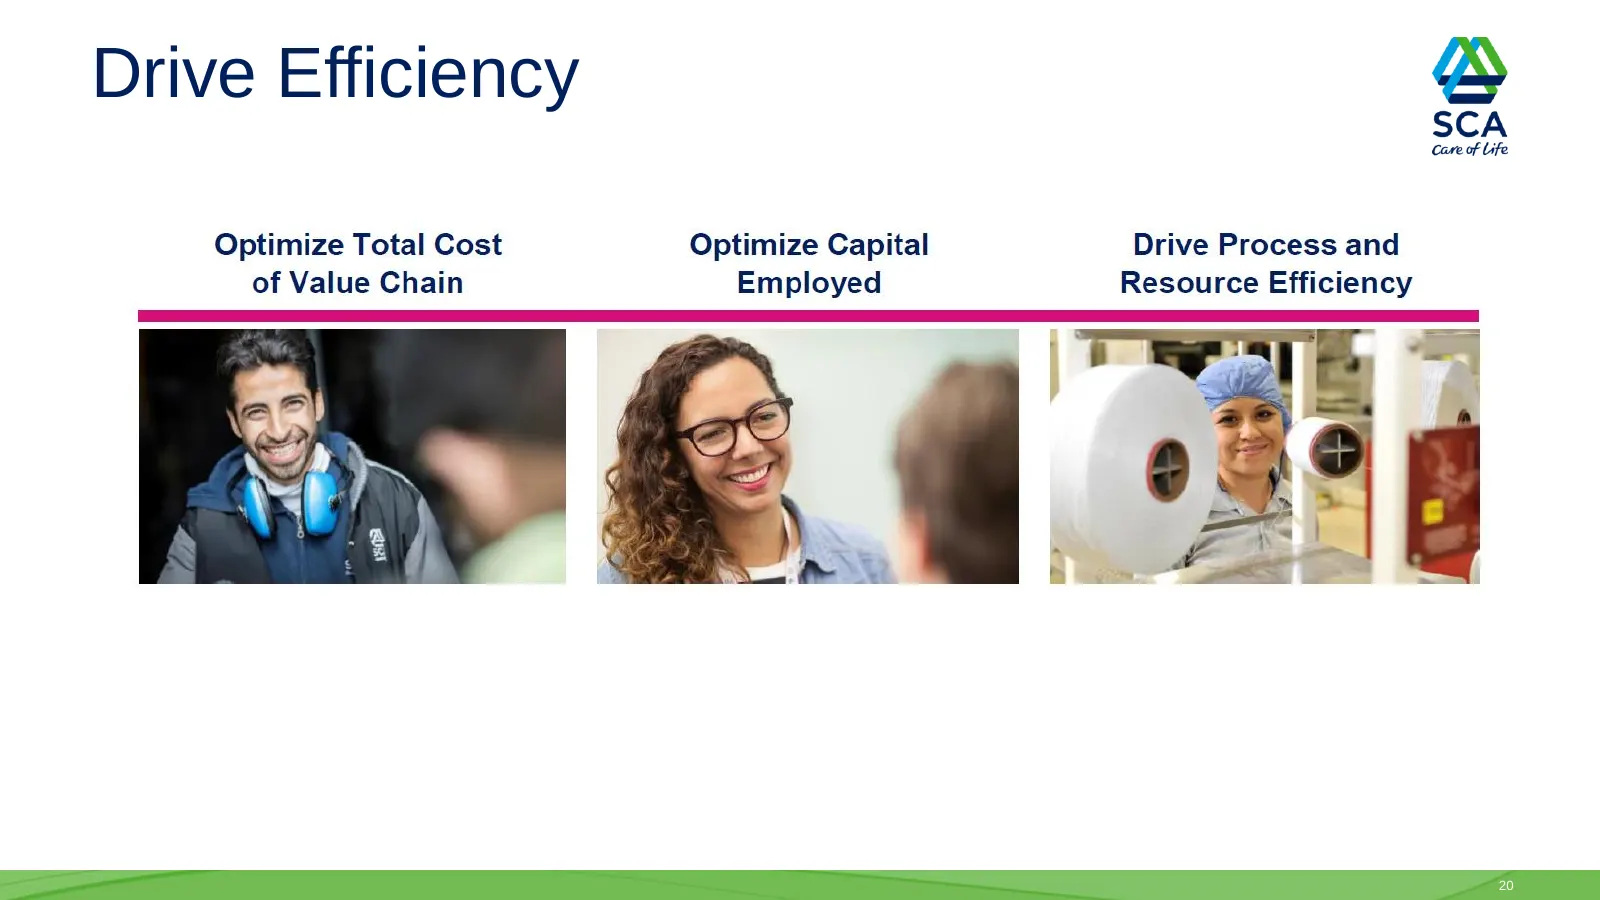
Drive Efficiency Optimize Total Cost of Value Chain Optimize Capital Employed Drive Process and Resource Efficiency
Slide 21: Tissue Roadmap
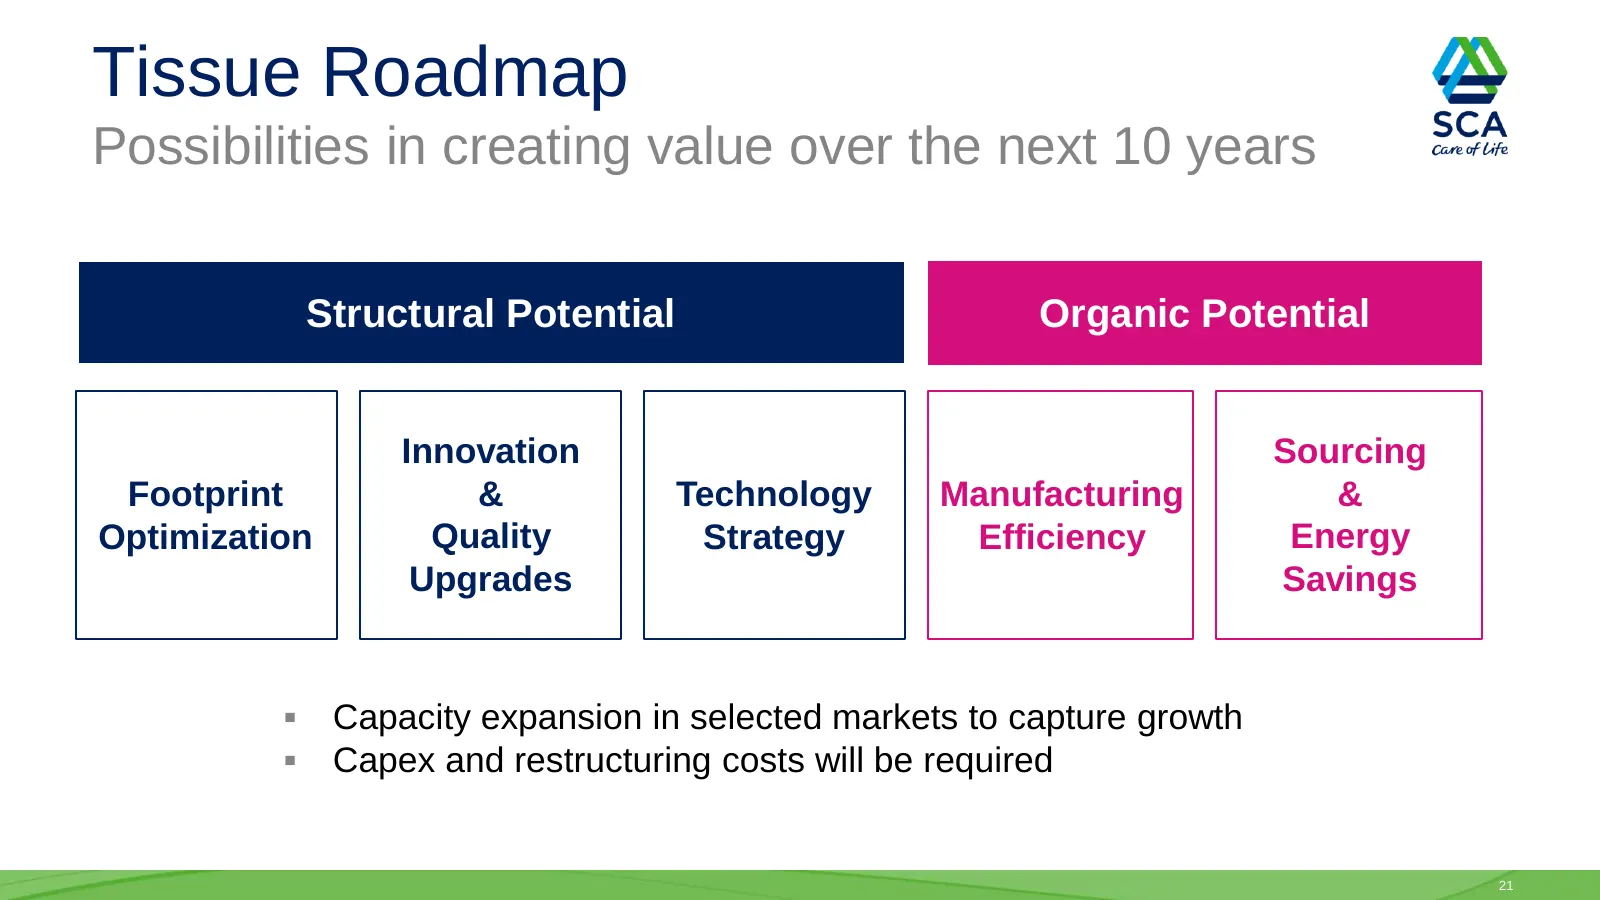
Tissue Roadmap Possibilities in creating value over the next 10 years Structural Potential Organic Potential Innovation Sourcing Footprint & Technology Manufacturing & Optimization Quality Strategy Efficiency Energy Upgrades Savings Capacity expansion in selected markets to capture growth Capex
Slide 22: Digital Strategy
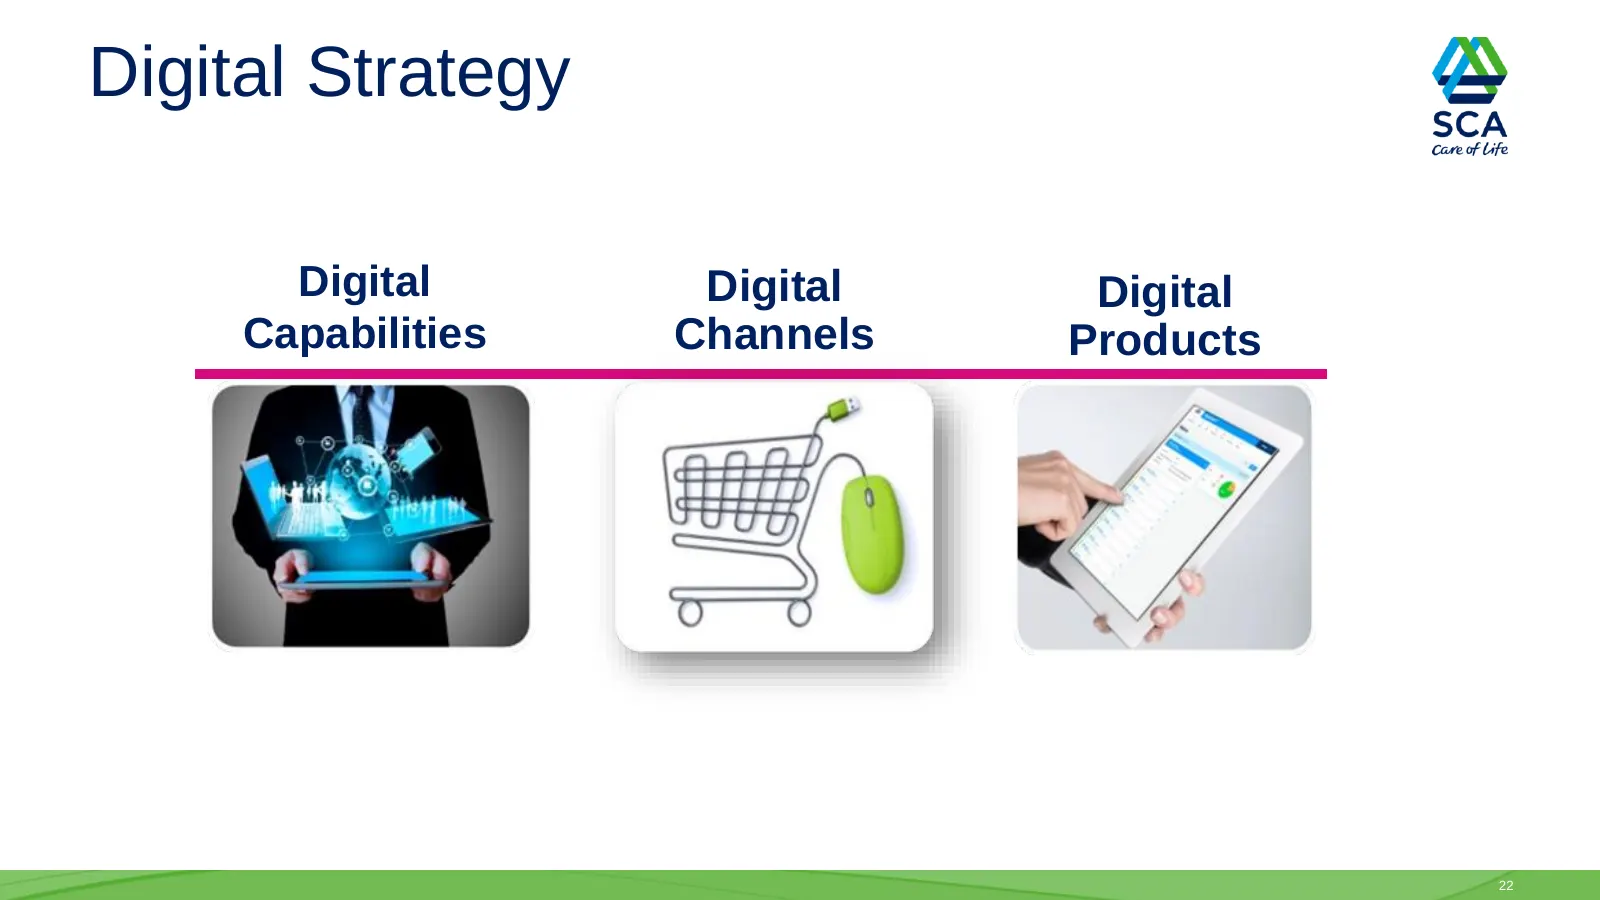
Digital Strategy Digital Digital Digital Capabilities Channels Products 22
Slide 23: Essity Financial Profile (Excluding BSN Medical)
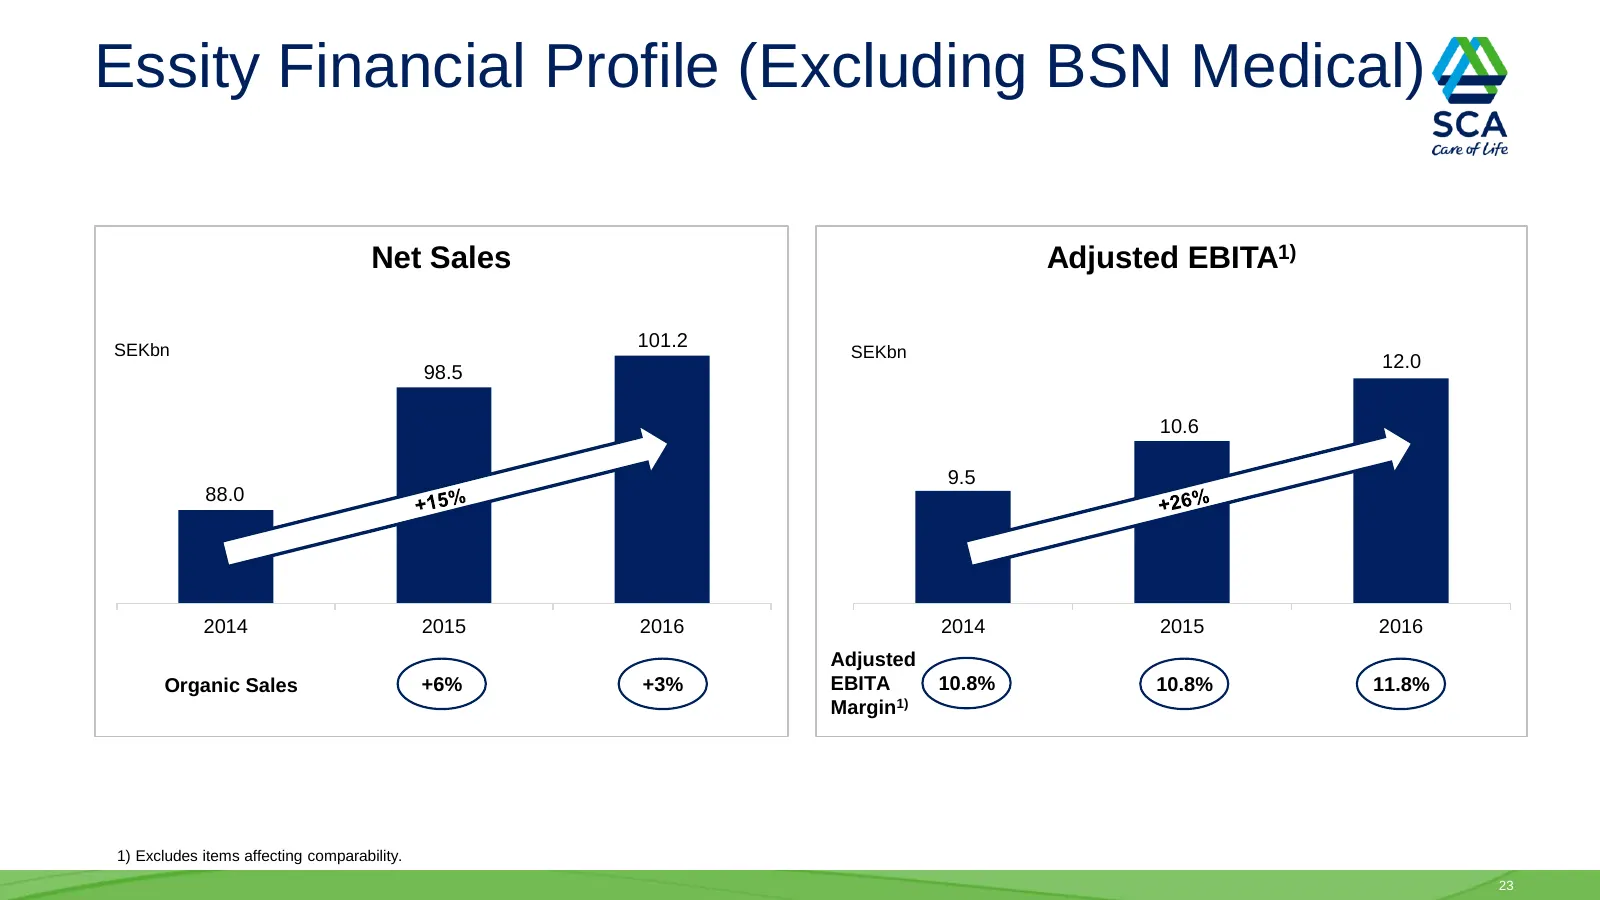
Essity Financial Profile (Excluding BSN Medical) Net Sales Adjusted EBITA1) SEKbn 101.2 SEKbn 12.0 98.5 10.6 9.5 88.0 2014 2015 2016 2014 2015 2016 Adjusted Organic Sales +6% +3% EBITA 10.8% 10.8% 11.8% Margin1) 1) Excludes items affecting comparability. 23
Slide 24: Essity Financial Targets and Policies
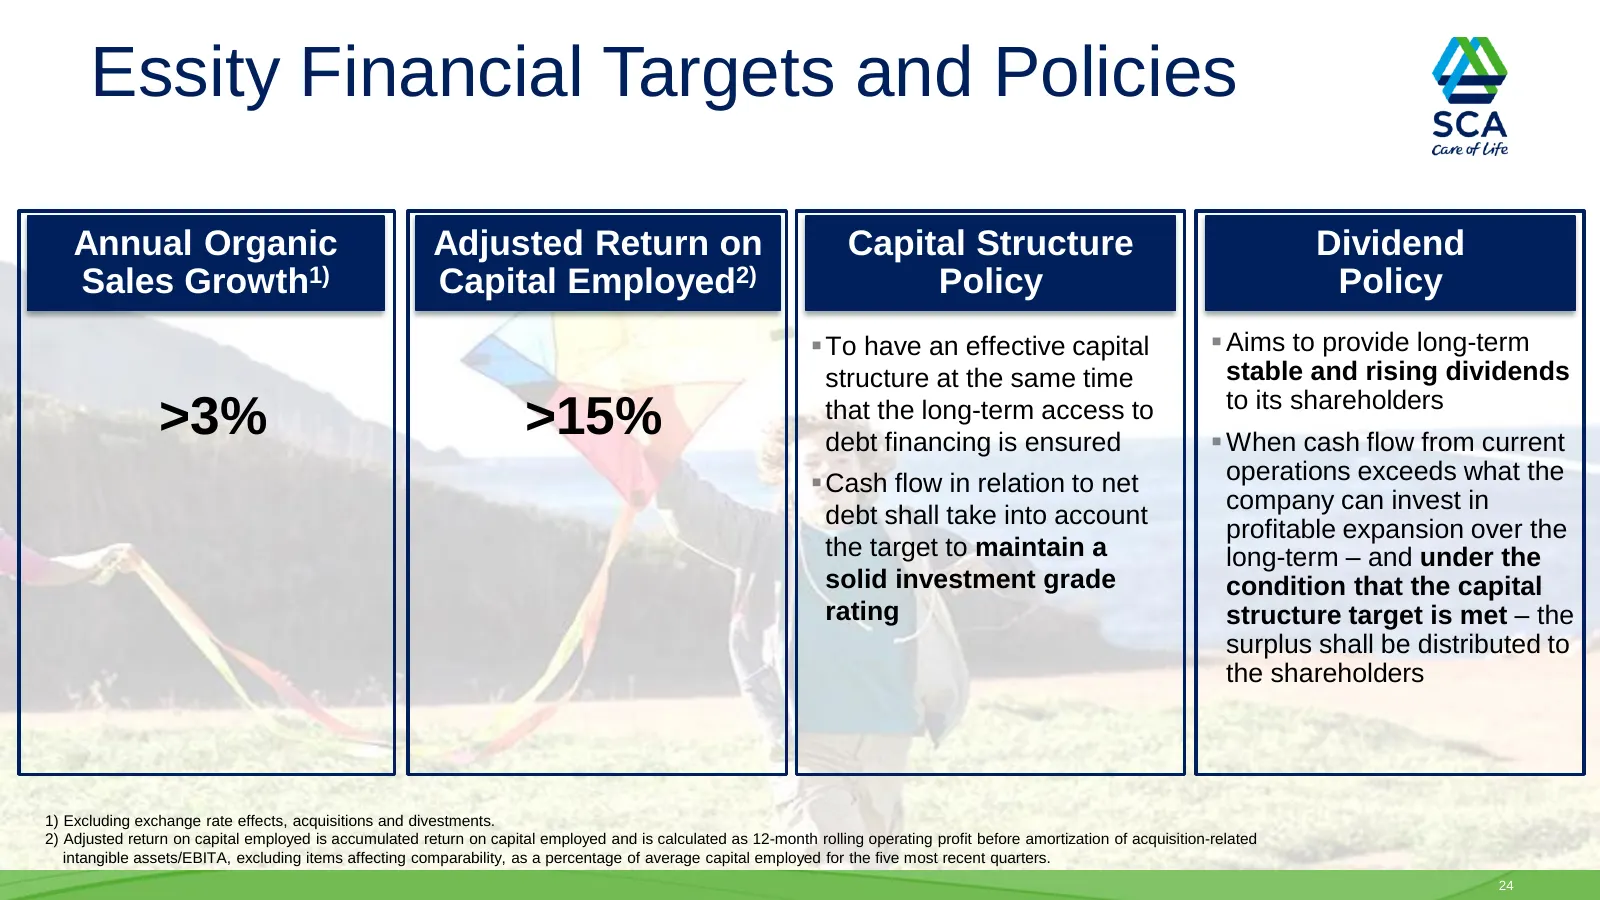
Essity Financial Targets and Policies Annual Organic Adjusted Return on Capital Structure Dividend Sales Growth1) Capital Employed2) Policy Policy To have an effective capital Aims to provide long-term structure at the same time stable and rising dividends to its shareholders >3% >15% that the l
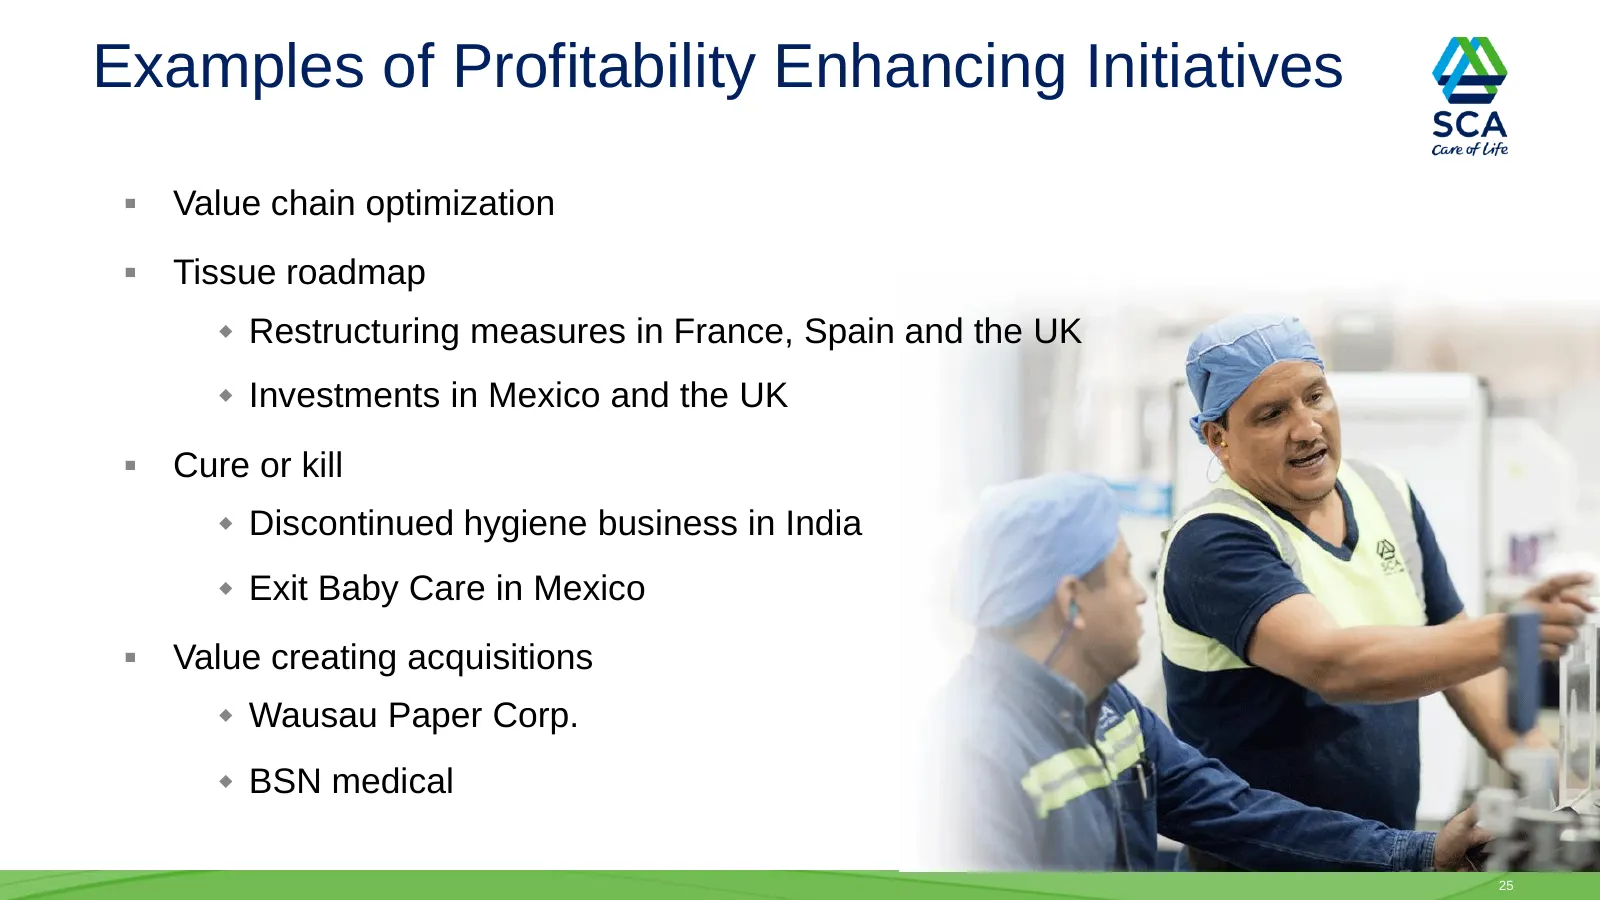
Slide 25: Examples of Profitability Enhancing Initiatives
Examples of Profitability Enhancing Initiatives Value chain optimization Tissue roadmap Restructuring measures in France, Spain and the UK Investments in Mexico and the UK Cure or kill Discontinued hygiene business in India Exit Baby Care in Mexico Value creating acquisitions Wausa
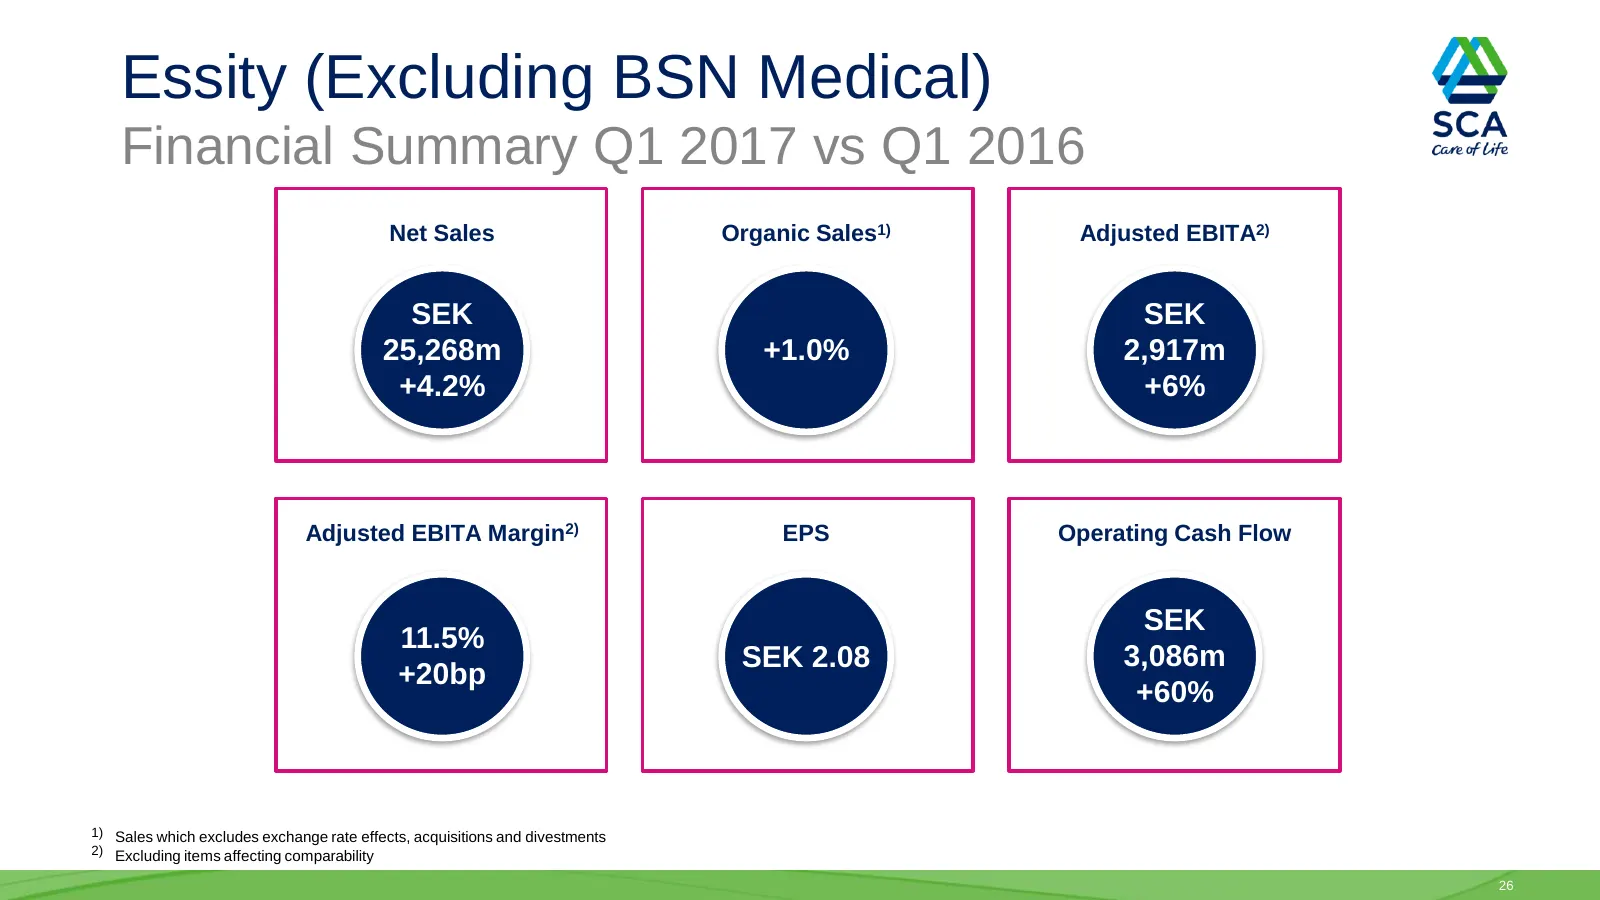
Slide 26: Financial Summary Q1 2017 vs Q1 2016
Essity (Excluding BSN Medical) Financial Summary Q1 2017 vs Q1 2016 Net Sales Organic Sales1) Adjusted EBITA2) SEK SEK 25,268m +1.0% 2,917m +4.2% +6% Adjusted EBITA Margin2) EPS Operating Cash Flow SEK 11.5% SEK 2.08 3,086m +20bp +60% 1) Sales which excludes exchange rate effects, acquisitions and d
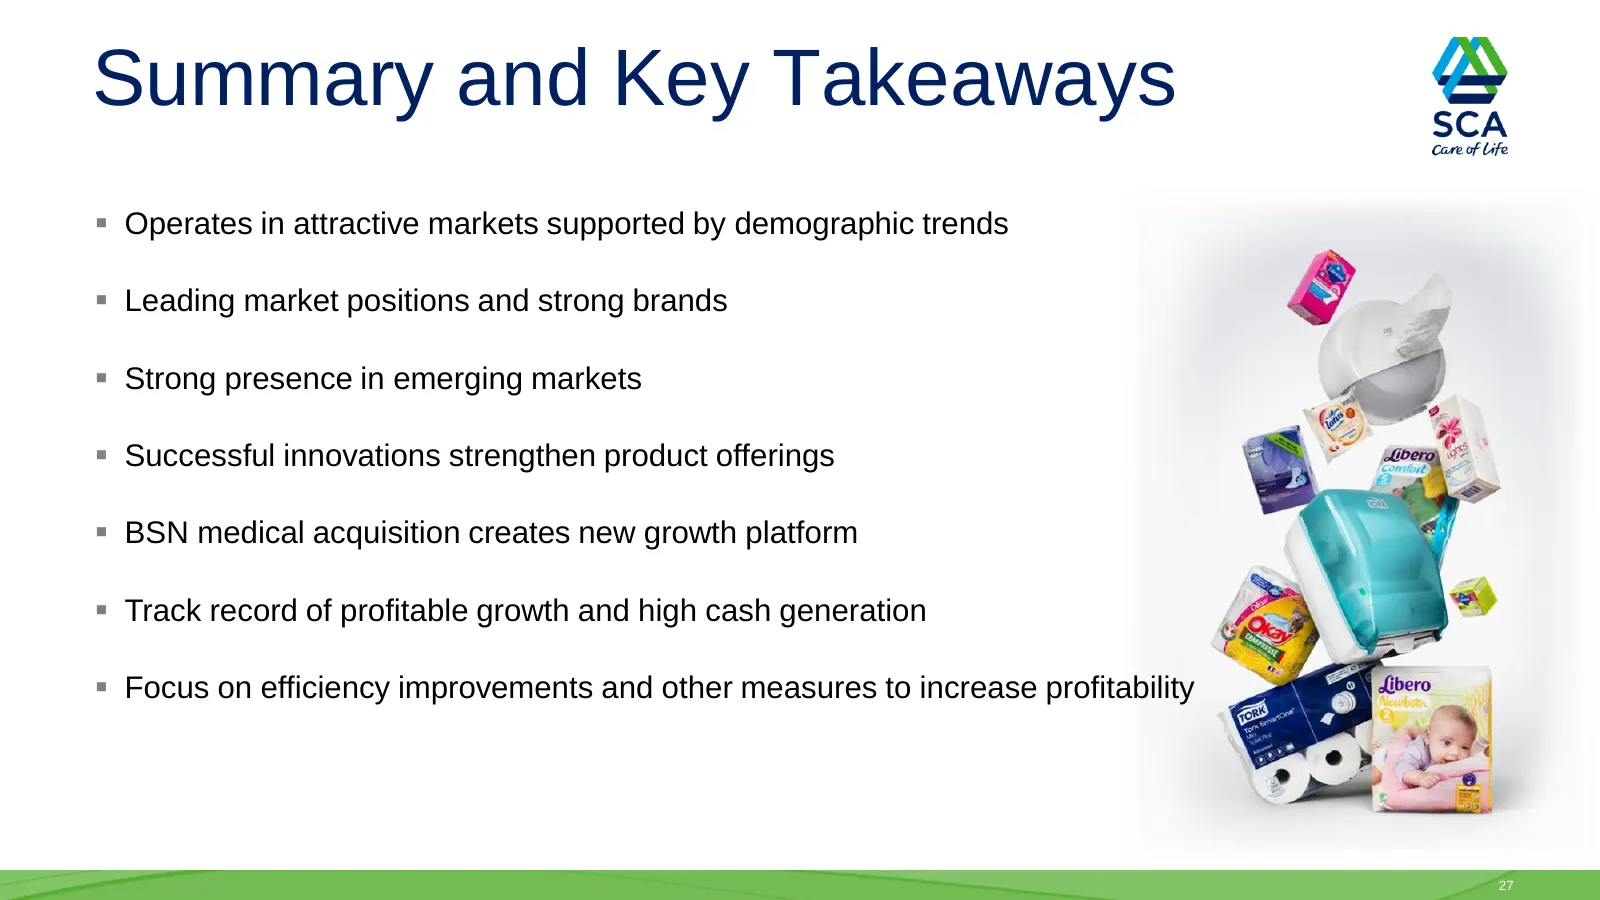
Slide 27: Summary and Key Takeaways
Summary and Key Takeaways Operates in attractive markets supported by demographic trends Leading market positions and strong brands Strong presence in emerging markets Successful innovations strengthen product offerings BSN medical acquisition creates new growth platform Track record of

Slide 28: Q&A
Q&A 28

Slide 29
Source: Internet Archive copy of essity.com
More decks from Essity AB Class A
 Q3 2026 Earnings Presentation28 slides · Oct 22, 2026
 Q2 2026 Earnings Presentation20 slides · Jul 16, 2026
 Investor Day (May 2026)122 slides · May 7, 2026
 Q1 2026 Earnings Presentation20 slides · Apr 23, 2026
 Q4 2025 Earnings Presentation22 slides · Jan 22, 2026
 Q3 2025 Earnings Presentation17 slides · Oct 23, 2025