PHX Minerals — Panhandle Oil & Gas — IPO Roadshow (August 2020)
22 slides from PHX Minerals's IPO roadshow presentation, Aug 27, 2020
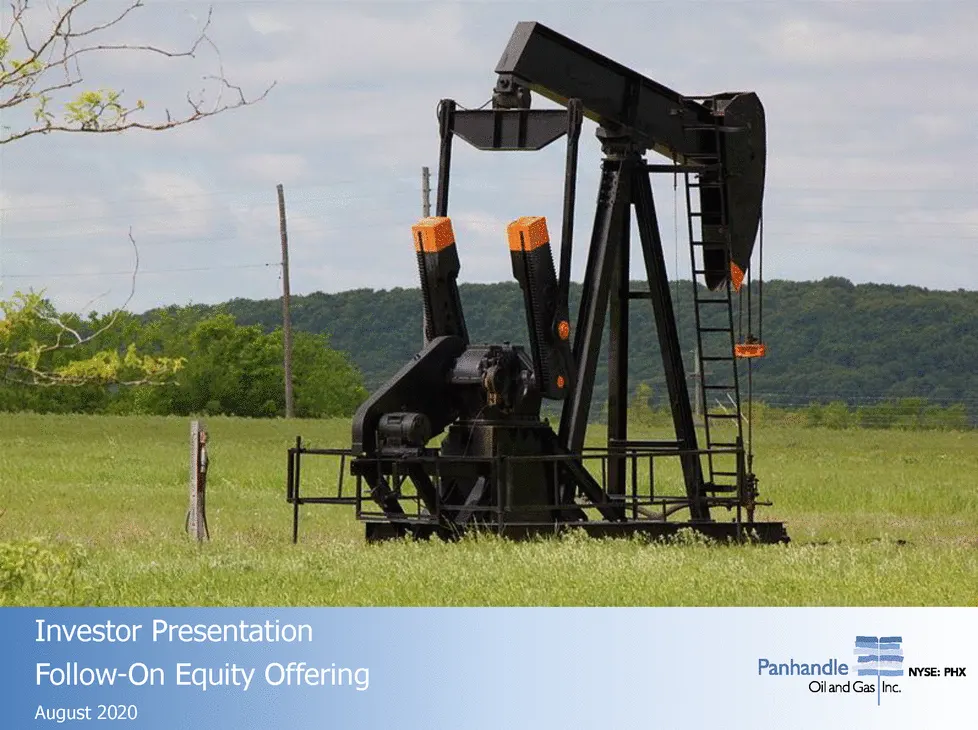
Slide 1: Panhandle Oil and Gas Inc.
Panhandle NYSE: PHX Oiland Gas |Inc.
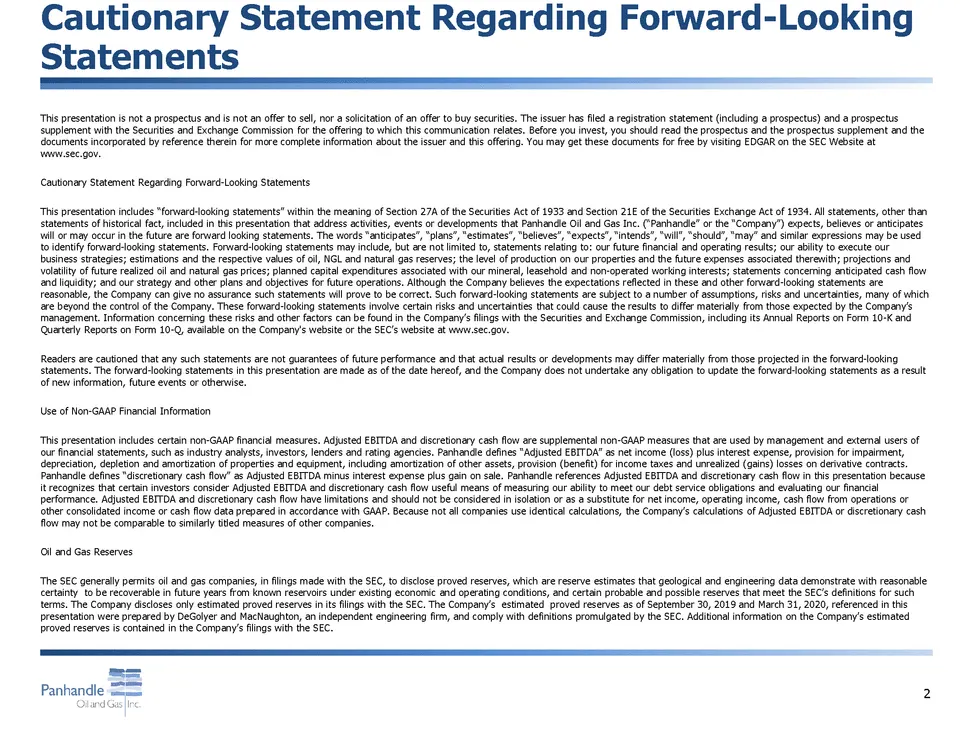
Slide 2: Disclaimer and forward-looking statements
This presentation is not a prospectus and is not an offer to sell, nor a solicitation of an offer to buy securities. The issuer has filed a registration statement (including a prospectus) and a prospectus supplement with the Securities and Exchange Commission for the offering to which this communica
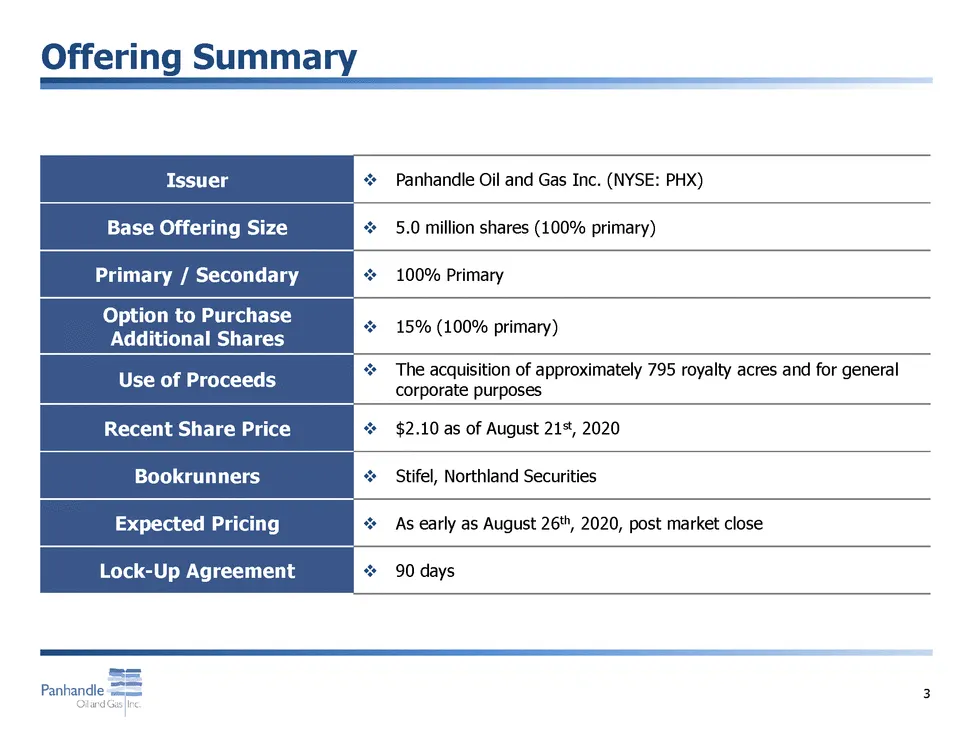
Slide 3: Offering Summary
Offering Summary Panhandle Oil and Gas Inc. (NYSE: PHX) 5.0 million shares (100% primary) 100% Primary to Purchase nal Shares 15% (100% primary) The acquisition of approximately 795 royalty acres and for general corporate purposes $2.10 as of August 21%, 2020 Stifel, Northland Securities As early as
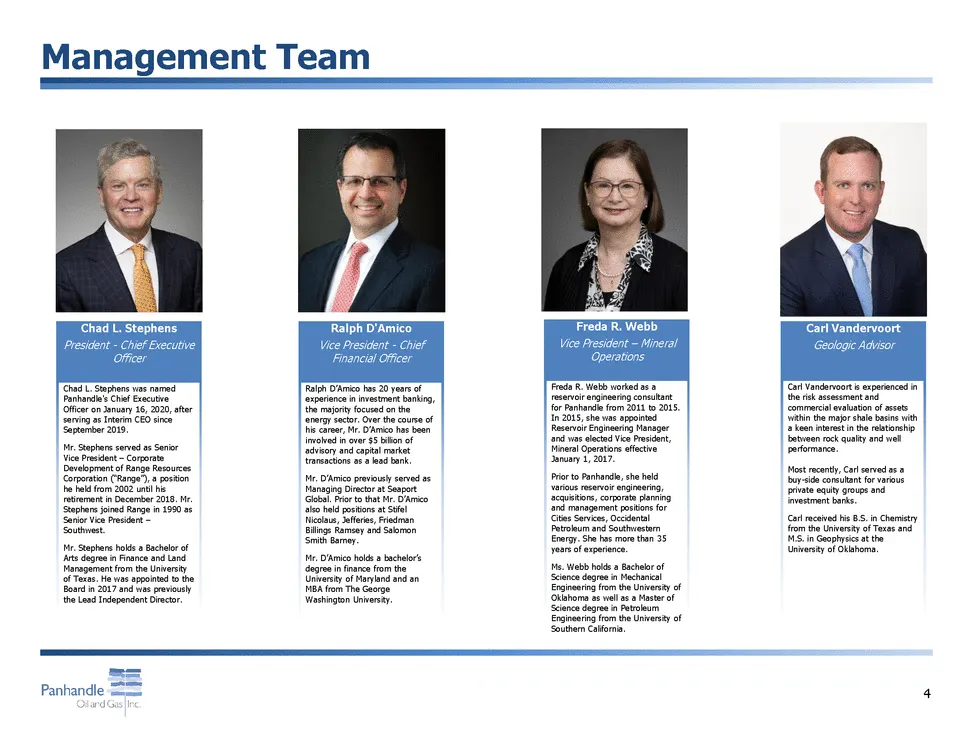
Slide 4: Management team
Chad L. Stephens President - Chief Executive Officer Ralph D'Amico Vice President - Chief Financial Officer Freda R. Webb Vice President – Mineral Operations Carl Vandervoort Geologic Advisor Chad L. Stephens was named Panhandle's Chief Executive Officer on January 16, 2020, after serving as Interim
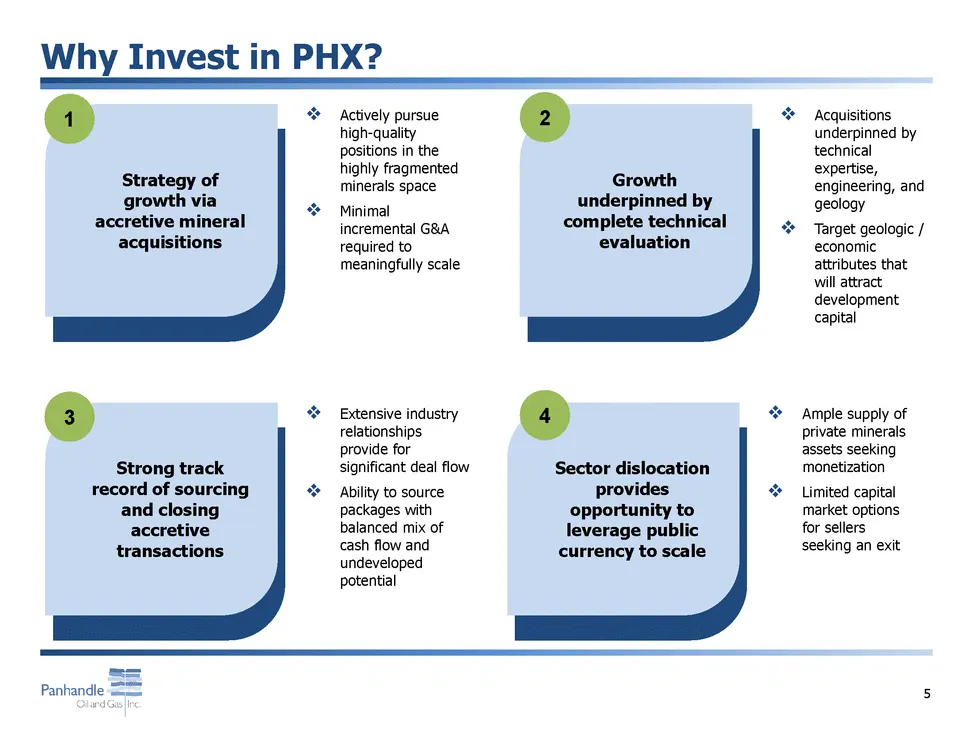
Slide 5: Strategy of growth via accretive mineral acquisitions
1 Strategy of growth via accretive mineral acquisitions □Actively pursue high-quality positions in the highly fragmented minerals space □Minimal incremental G&A required to meaningfully scale 2 Growth underpinned by complete technical evaluation □Acquisitions underpinned by technical expertise, engi
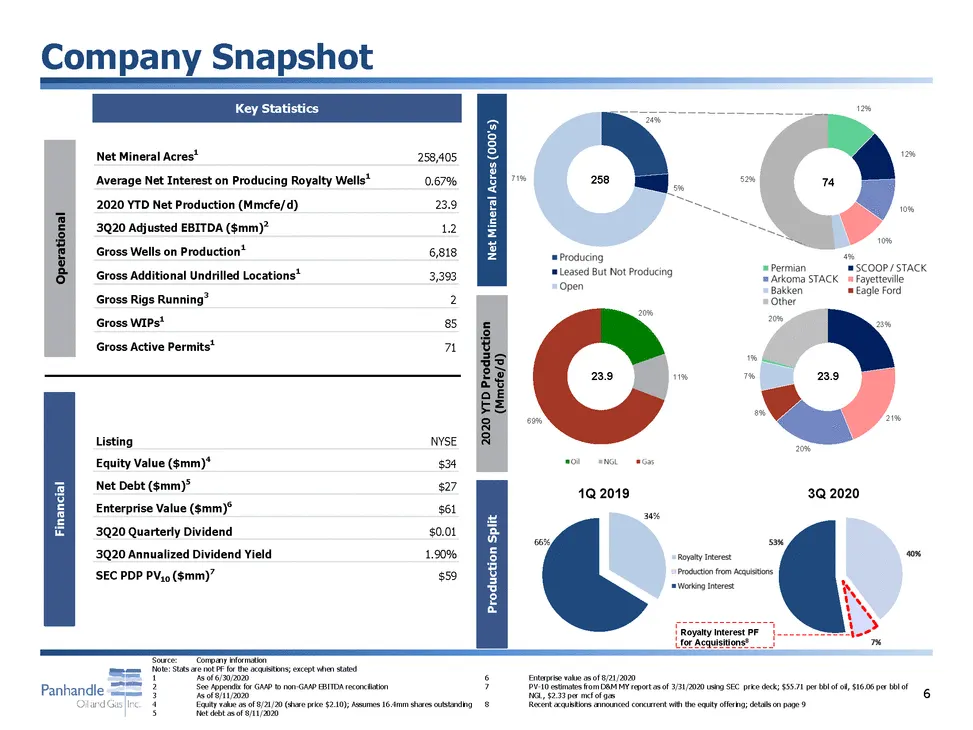
Slide 6: Company snapshot and key statistics
Net Mineral Acres (000's) 24% 12% Net Mineral Acres1258,405 Average Net Interest on Producing Royalty Wells10.67% Operational 3Q20 Adjusted EBITDA ($mm)21.2 Gross Wells on Production16,818 Gross Additional Undrilled Locations13,393 Gross Rigs Running32 Gross WIPs185 Gross Active Permits171 71% 258 2
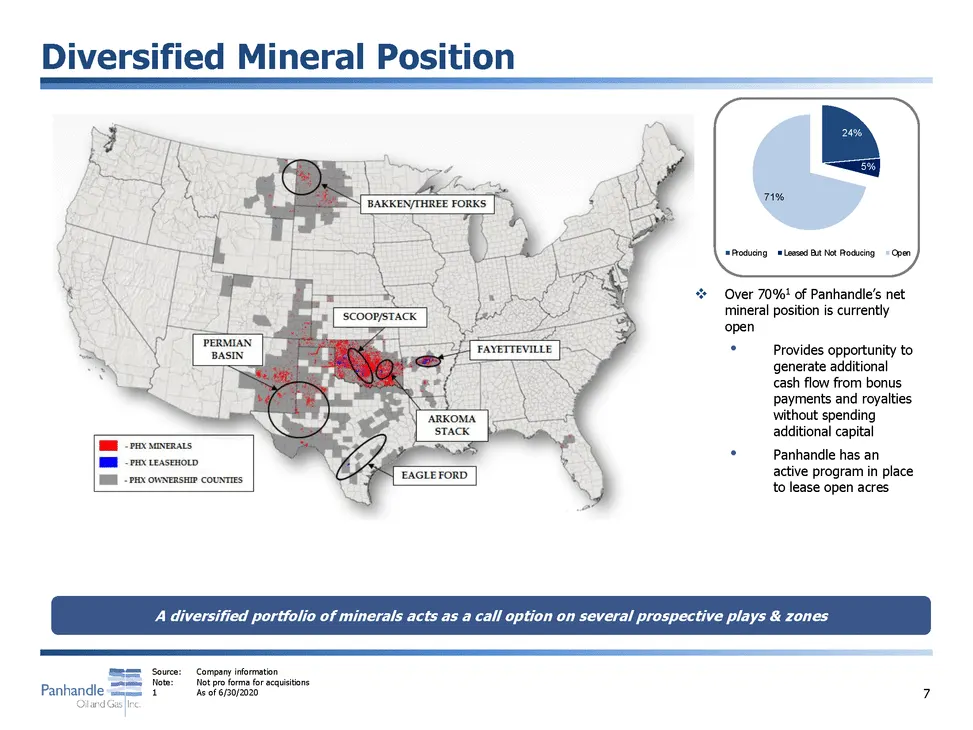
Slide 7: Open acreage as opportunity
71% 24% ProducingLeased But Not ProducingOpen □Over 70%1 of Panhandle’s net mineral position is currently open •Provides opportunity to generate additional cash flow from bonus payments and royalties without spending additional capital •Panhandle has an active program in place to lease open acres A
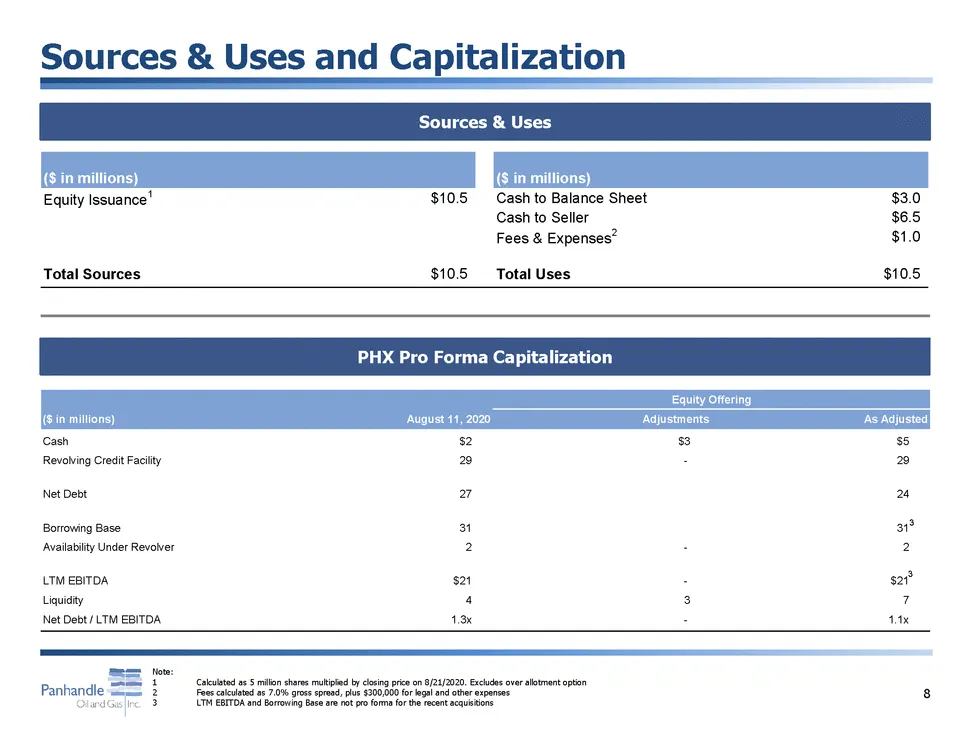
Slide 8: Sources & Uses and Pro Forma Capitalization
Sources & Uses PHX Pro Forma Capitalization Equity Offering Note: 1Calculated as 5 million shares multiplied by closing price on 8/21/2020. Excludes over allotment option
Slide 9: Overview of Acquisitions
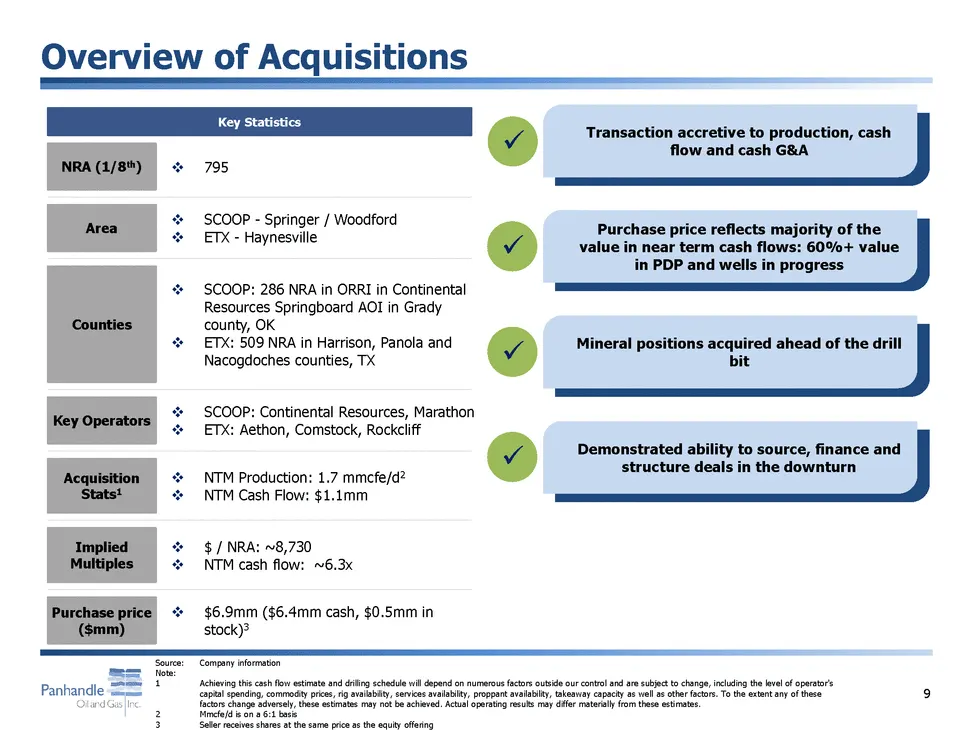
NRA (1/8th) Key Statistics □795 x Area Counties □SCOOP - Springer / Woodford □ETX - Haynesvillex □SCOOP: 286 NRA in ORRI in Continental Resources Springboard AOI in Grady county, OK x Nacogdoches counties, TX Purchase price reflects majority of the value in near term cash flows: 60%+ value in PDP an
Slide 10: Overview of Acquisitions – SCOOP minerals
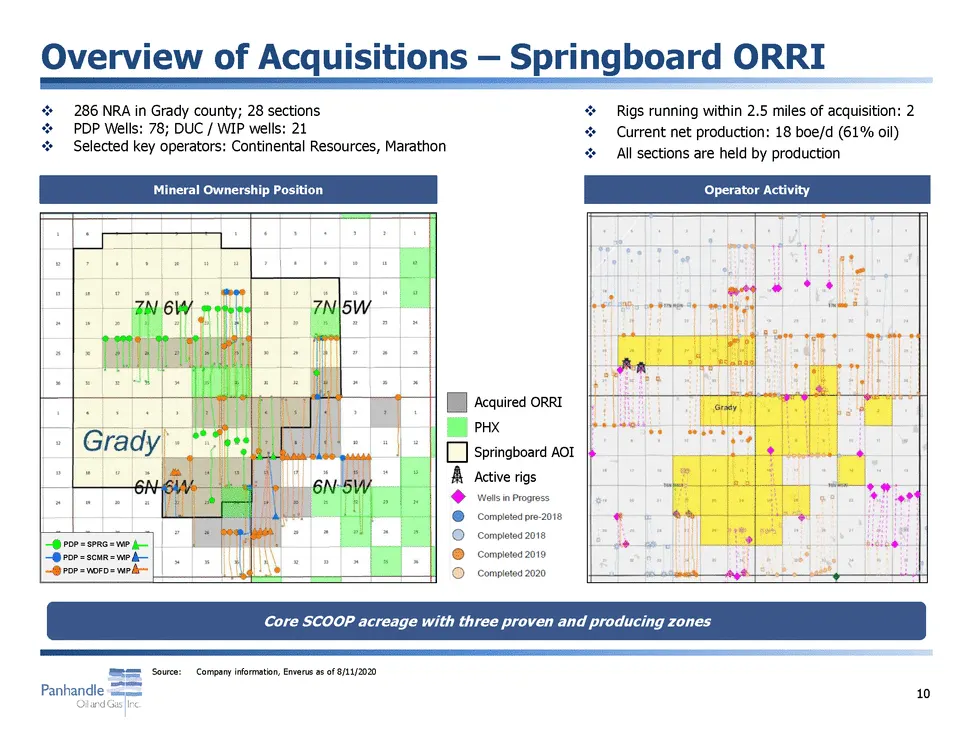
□286 NRA in Grady county; 28 sections □PDP Wells: 78; DUC / WIP wells: 21 □Selected key operators: Continental Resources, Marathon □Rigs running within 2.5 miles of acquisition: 2 □Current net production: 18 boe/d (61% oil) □All sections are held by production Mineral Ownership PositionOperator Acti
Slide 11: Overview of Acquisitions – Minerals in ETX
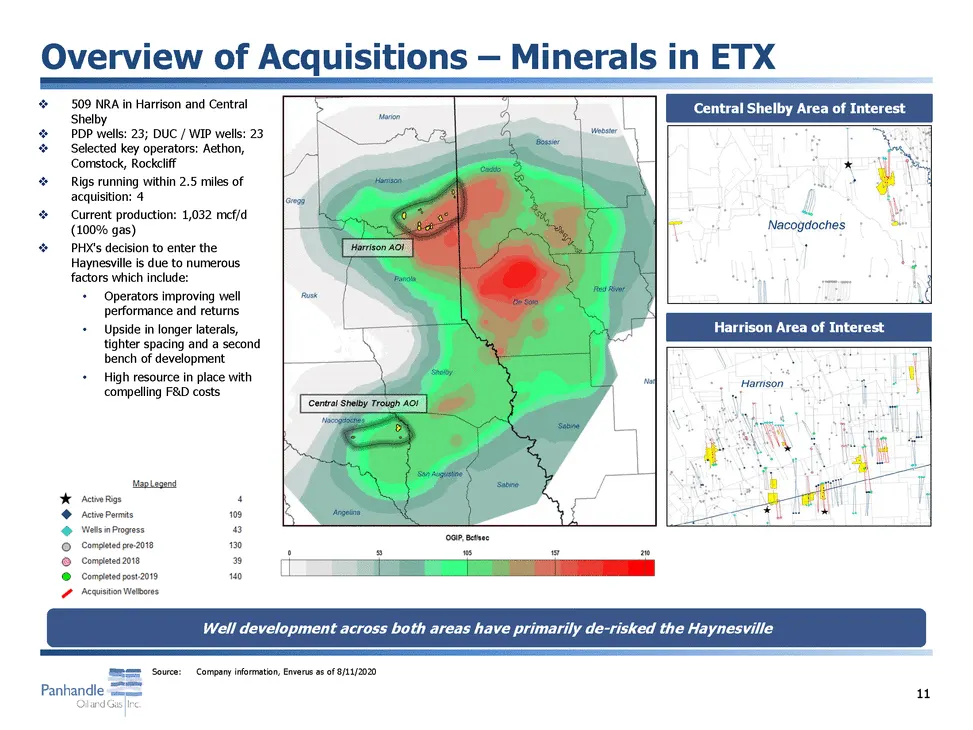
Overview of Acquisitions – Minerals in ETX □ 509 NRA in Harrison and Central Shelby □ PDP wells: 23; DUC / WIP wells: 23 □ Selected key operators: Aethon, Comstock, Rockcliff □ Rigs running within 2.5 miles of acquisition: 4 □ Current production: 1,032 mcf/d (100% gas) □ PHX's decision to enter the
Slide 12: Past Mineral Acquisitions Successfully Completed
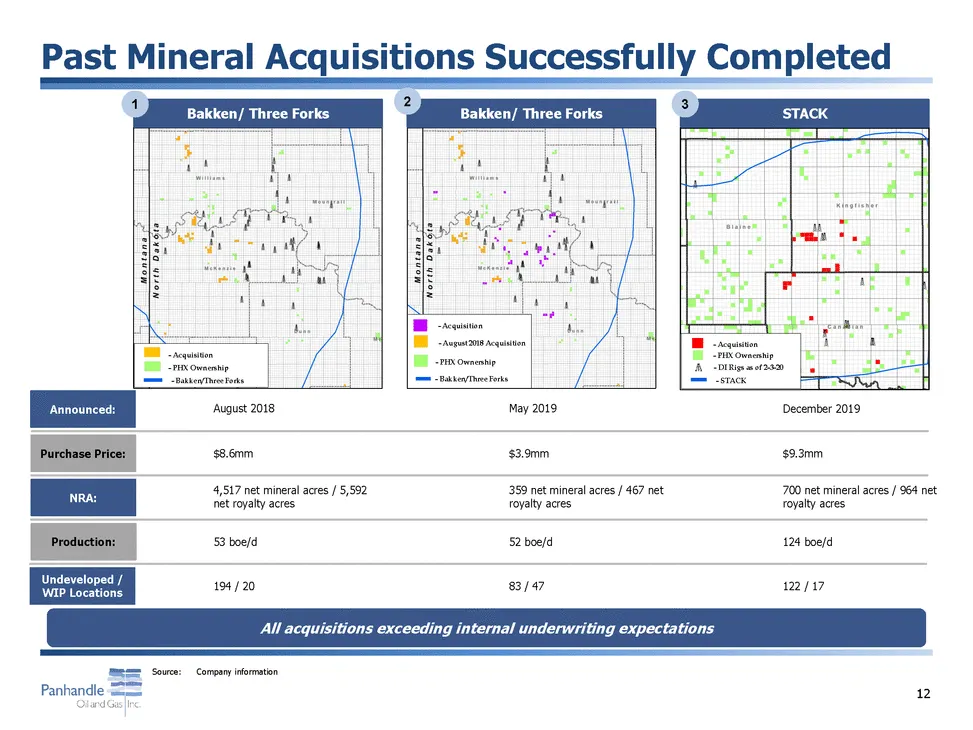
Past Mineral Acquisitions Successfully Completed 123 Bakken/ Three Forks Bakken/ Three Forks STACK - Acquisition - Acquisition - PHX Ownership - Bakken/Three Forks - August 2018 Acquisition - PHX Ownership - Bakken/Three Forks - Acquisition - PHX Ownership - DI Rigs as of 2-3-20 - STACK Announced: P
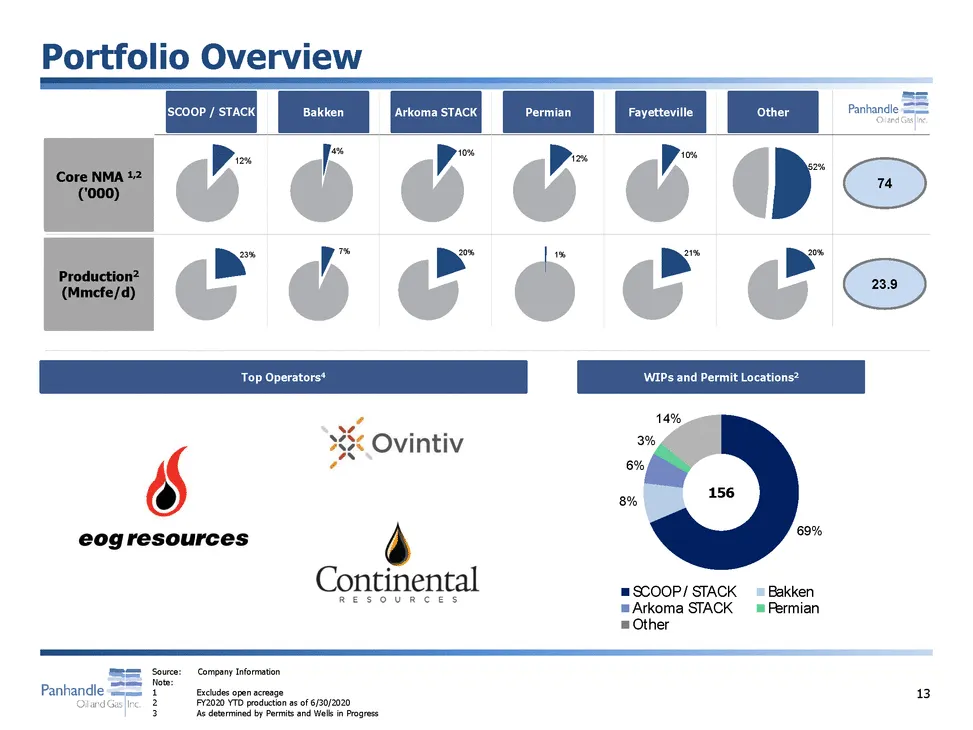
Slide 13: Portfolio Overview
Portfolio Overview SCOOP / STACKBakken Arkoma STACK Permian FayettevilleOther Core NMA 1,2 ('000) 4% 12% 10% 12% 10% 52% 74 Production2 (Mmcfe/d) 23% 7% 20% 1% 21% 20% 23.9 Top Operators4WIPs and Permit Locations2 14% 3% 6% 8% 156 69% SCOOP / STACK Bakken Arkoma STACK Permian Other Source:Company In
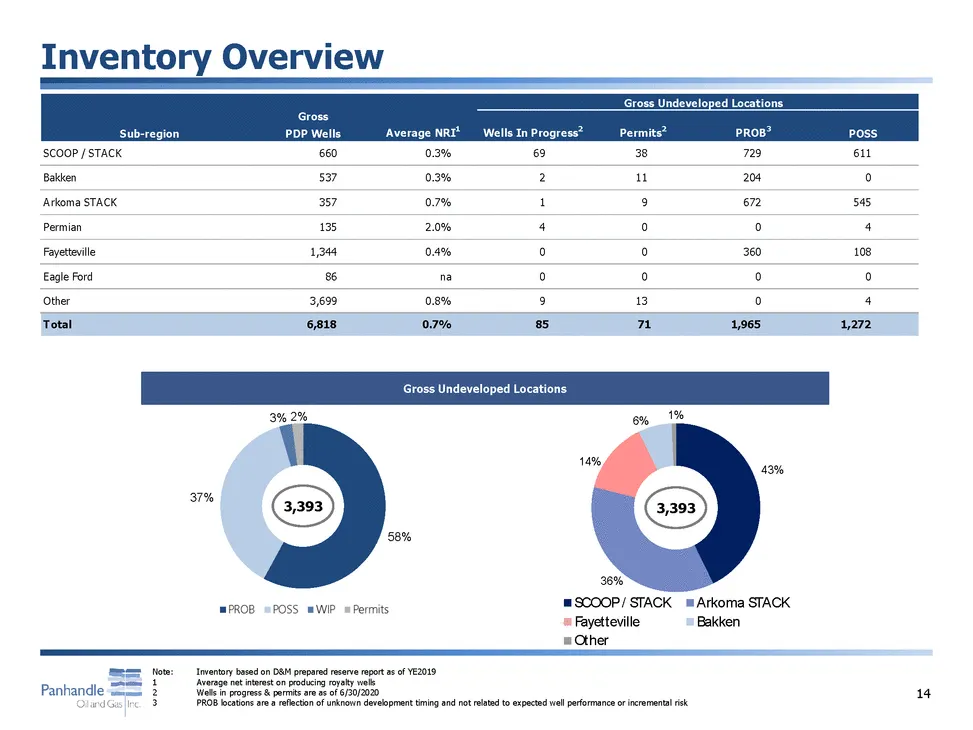
Slide 14: Inventory Overview
Inventory Overview Gross Undeveloped Locations 3% 2% Gross Undeveloped Locations 6% 1% 14% 43% 37% 3,393 3,393 58% 36% SCOOP / STACK Arkoma STACK FayettevilleBakken Other Note:Inventory based on D&M prepared reserve report as of YE2019 1Average net interest on producing royalty wells 2Wells in progr
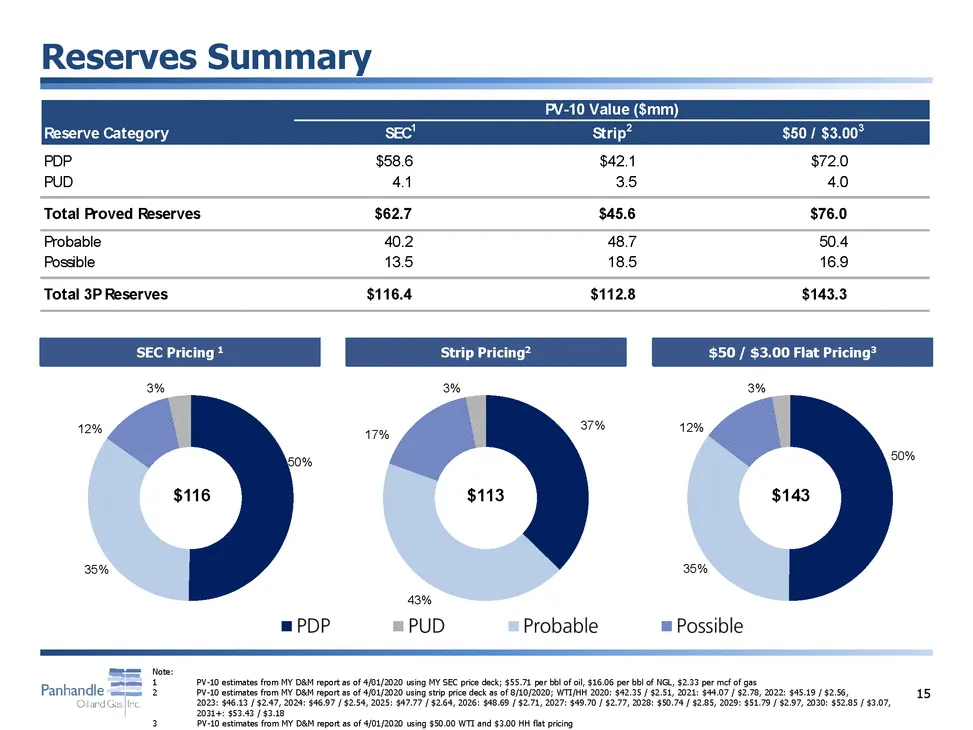
Slide 15: PV-10 under SEC, strip and flat pricing
SEC Pricing 1 Strip Pricing2 $50 / $3.00 Flat Pricing3 3%3%3% 12% 50% 17% 37% 12% 50% $116$113$143 35% 35% 43% Note: 1PV-10 estimates from MY D&M report as of 4/01/2020 using MY SEC price deck; $55.71 per bbl of oil, $16.06 per bbl of NGL, $2.33 per mcf of gas 2PV-10 estimates from MY D&M report as
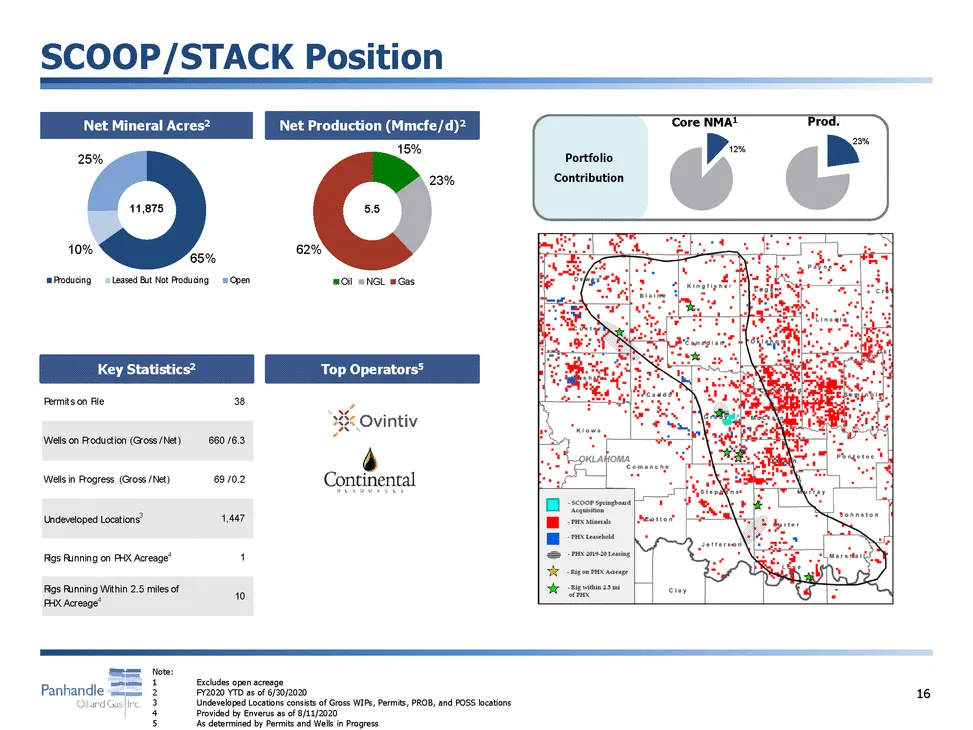
Slide 16: Core area key statistics
Net Mineral Acres2 25% Net Production (Mmcfe/d)2 15% 23% Portfolio Contribution Core NMA1Prod. 12% 23% 11,8755.5 10% 65% 62% Producing Leased But Not Producing Open OilNGLGas Key Statistics2 Top Operators5 Permits on File38 Wells on Production (Gross / Net)660 / 6.3 Wells in Progress (Gross / Net)69
Slide 17: Core area key statistics
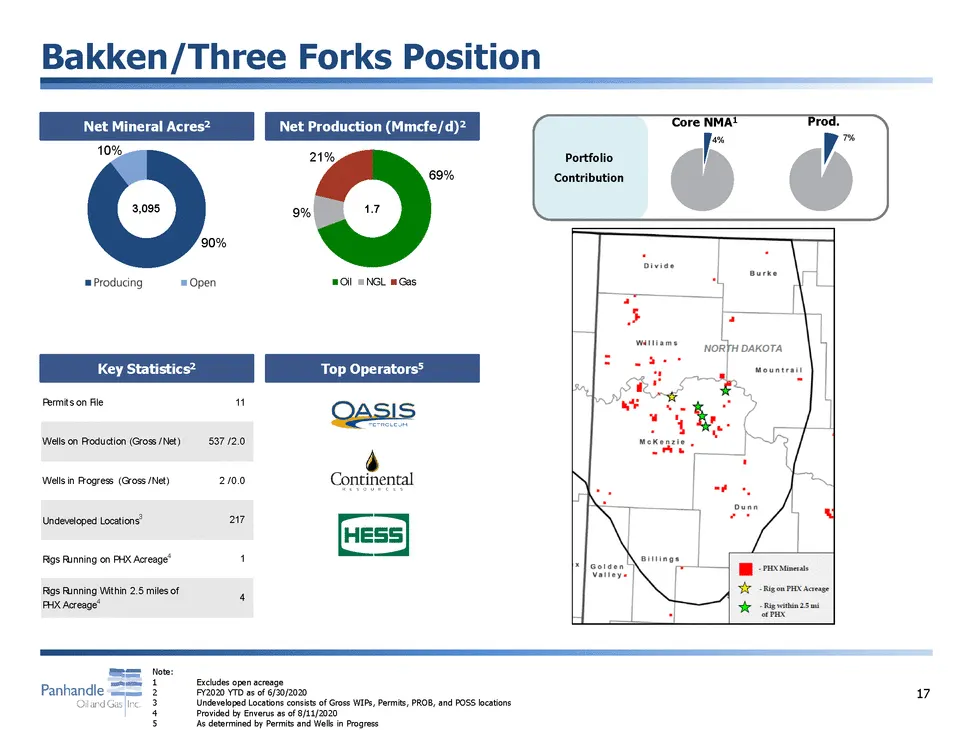
Net Mineral Acres2 Net Production (Mmcfe/d)2 Core NMA1 4% Prod. 7% 10% 21% 69% Portfolio Contribution 3,095 9% 1.7 90% Key Statistics2 Oil NGL Gas Top Operators5 Permits on File11 Wells on Production (Gross / Net)537 / 2.0 Wells in Progress (Gross / Net)2 / 0.0 Undeveloped Locations3217 Rigs Running
Slide 18: Production, Adjusted EBITDA, cash flow and net debt
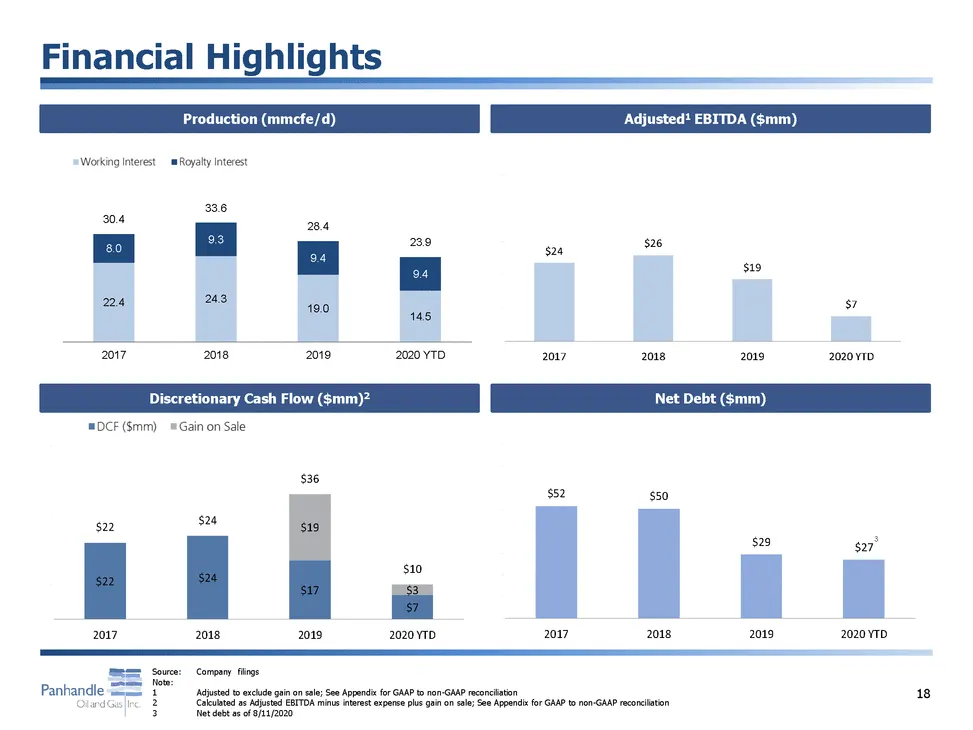
Production (mmcfe/d)Adjusted1 EBITDA ($mm) $50 30.4 8.0 33.6 9.3 28.4 9.4 23.9 9.4 $40 $30 $20 $24 $26 $19 22.424.319.0 14.5 $10$7 2017201820192020 YTD $0 2017201820192020 YTD Discretionary Cash Flow ($mm)2 Net Debt ($mm) $50 $80 $40 $36 $70 $60 $52$50 $50 $30 $20 $22 $24 $19 $40 $29$27 3 $10 $22$24
Slide 19: Natural gas and crude oil hedges
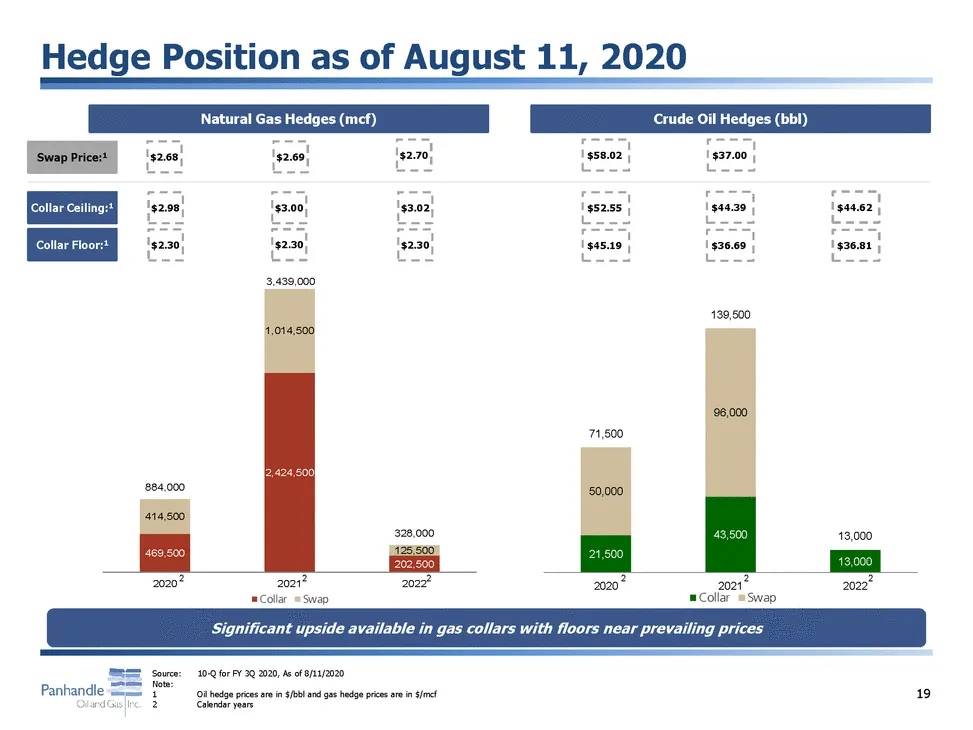
Natural Gas Hedges (mcf)Crude Oil Hedges (bbl) Swap Price:1 $2.68 $2.69 $2.70 $58.02 $37.00 Collar Ceiling:1 $2.98 $3.00 $3.02 $52.55 $44.39 $44.62 Collar Floor:1 $2.30 $2.30 $2.30 $45.19 $36.69 $36.81 3,439,000 1,014,500 139,500 71,500 96,000 884,000 2,424,500 50,000 414,500 469,500 328,000 125,500
Slide 20: Strategy of growth via accretive mineral acquisitions
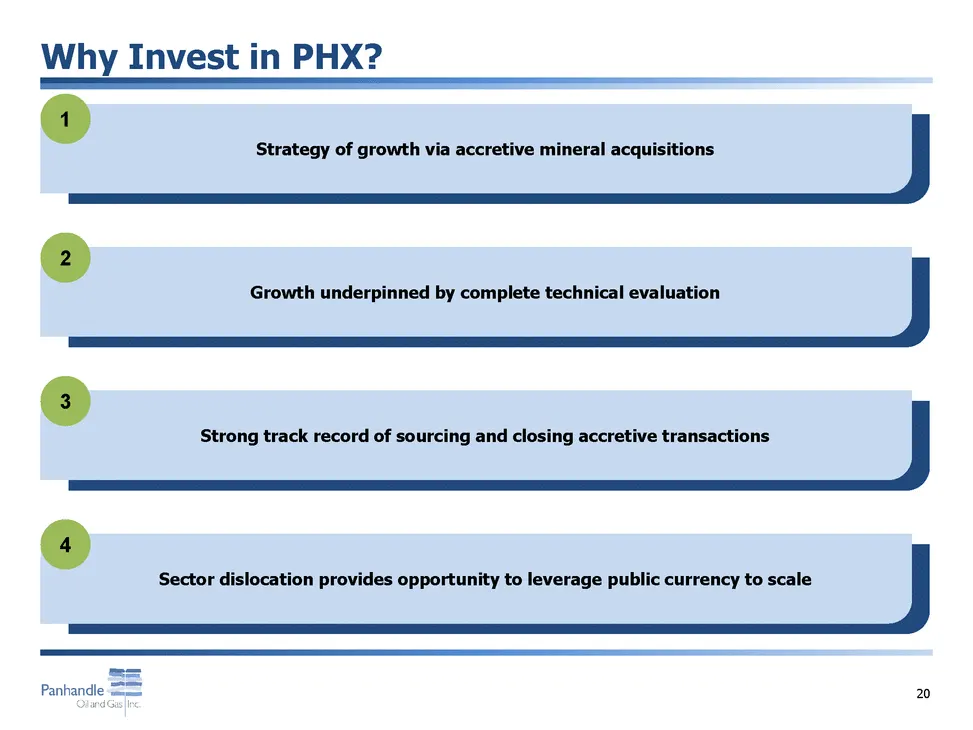
1 Strategy of growth via accretive mineral acquisitions 2 Growth underpinned by complete technical evaluation 3 Strong track record of sourcing and closing accretive transactions 4 Sector dislocation provides opportunity to leverage public currency to scale
Slide 21: Appendix
— Panhandle NYSE: PHX Oiland Gas} Inc. Appendix
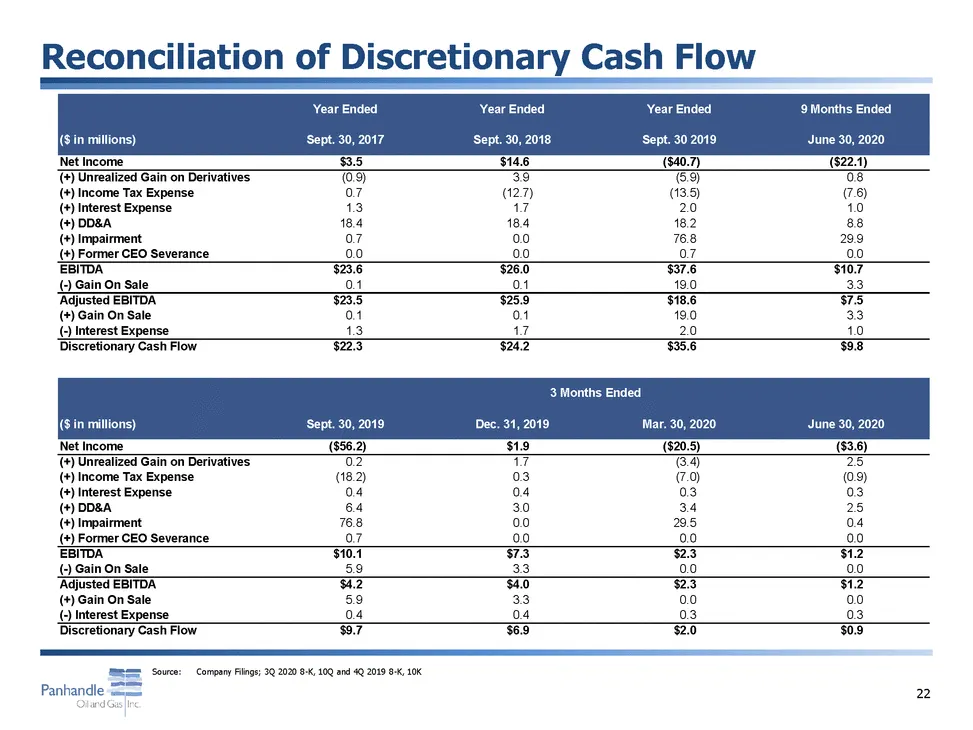
Slide 22: GAAP to non-GAAP reconciliation
3 Months Ended ($ in millions)Sept. 30, 2019Dec. 31, 2019Mar. 30, 2020June 30, 2020
Source: SEC EDGAR · FWP filed Aug 27, 2020
More decks from PHX Minerals Inc
 Investor Presentation (March 2025)29 slides · Mar 12, 2025
 Investor Presentation (November 2024)33 slides · Nov 6, 2024
 Investor Presentation (August 2024)33 slides · Aug 7, 2024
 Investor Presentation (May 2024)33 slides · May 8, 2024
 Investor Presentation (March 2024)33 slides · Mar 12, 2024
 Investor Presentation (November 2023)40 slides · Nov 8, 2023