First Interstate BancSystem, Inc. · NASDAQ:FIBK
First Interstate BancSystem — Shareholder Meeting (May 2023)
21 slides from First Interstate BancSystem's shareholder meeting presentation, May 24, 2023
Slide 1: Annual Shareholder's Meeting
Exhibit 99.1 Annual Shareholder’s Meeting May 24, 2023
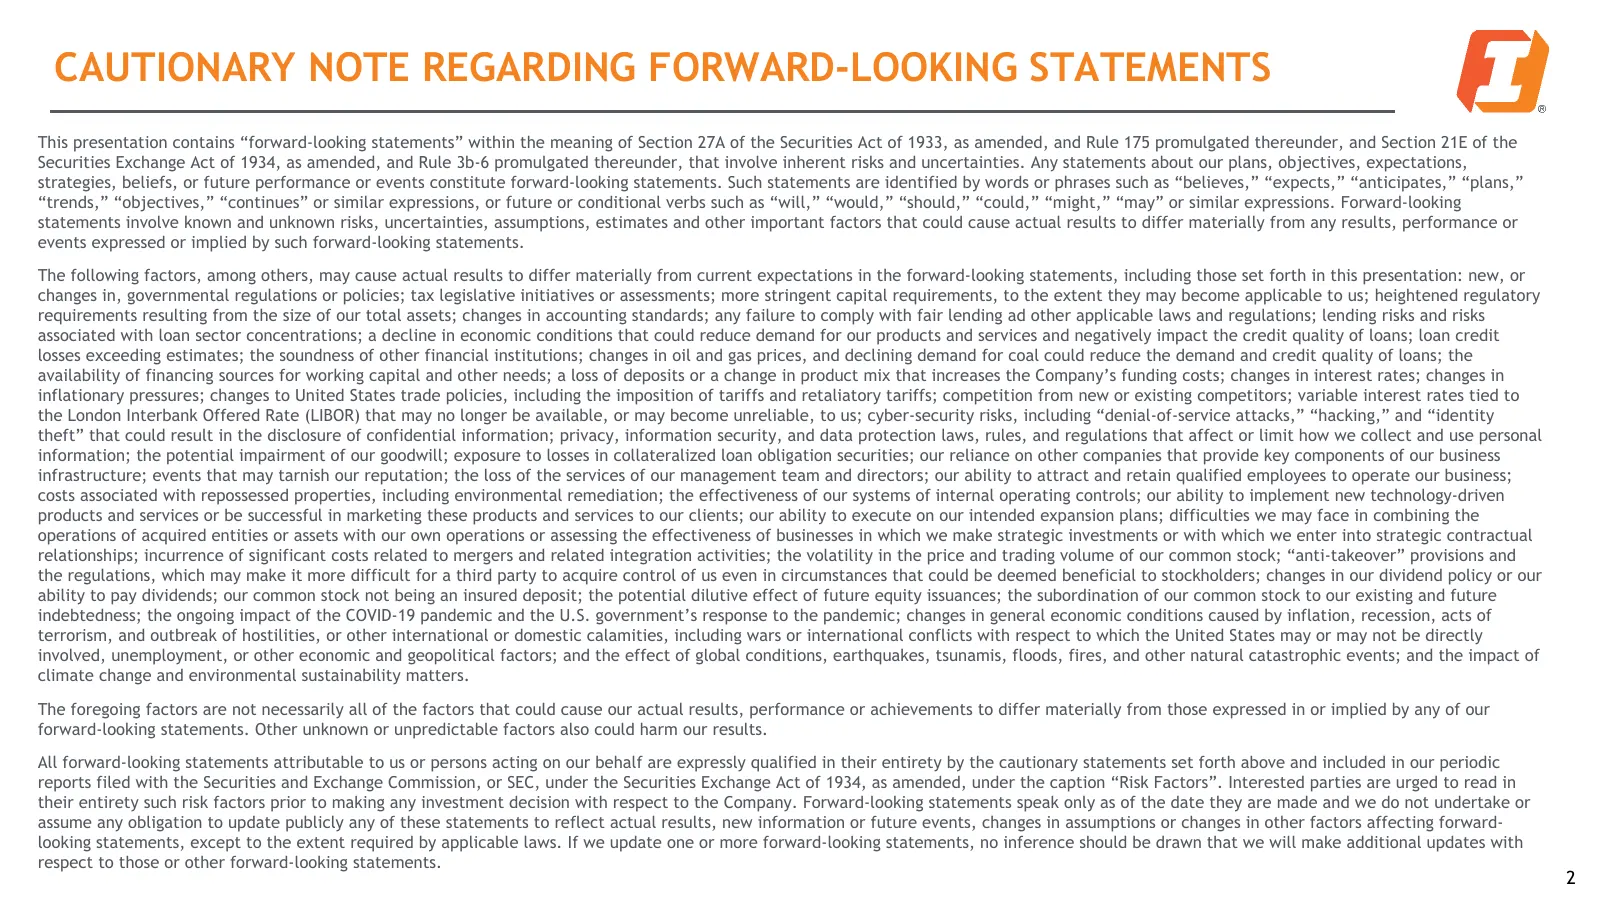
Slide 2: Cautionary Note Regarding Forward-Looking Statements
CAUTIONARY NOTE REGARDING FORWARD-LOOKING STATEMENTS This presentation contains “forward-looking statements” within the meaning of Section 27A of the Securities Act of 1933, as amended, and Rule 175 promulgated thereunder, and Section 21E of the Securities Exchange Act of 1934, as amended, and Rule
Slide 3: Our Company
Our Company
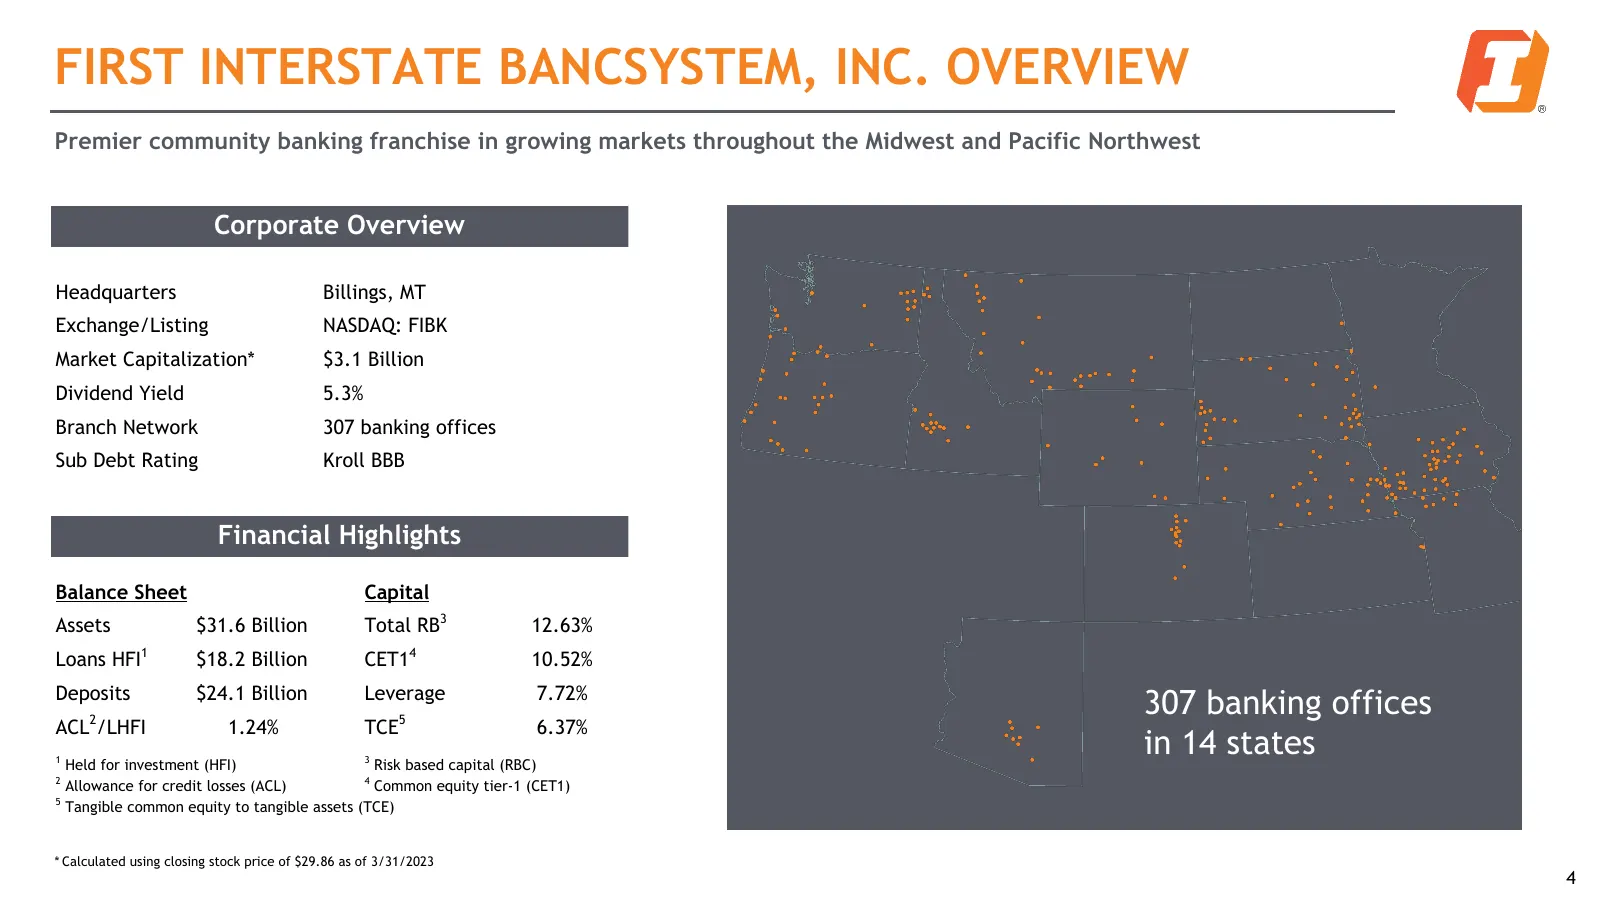
Slide 4: First Interstate BancSystem, Inc. Overview
FIRST INTERSTATE BANCSYSTEM, INC. OVERVIEW Premier community banking franchise in growing markets throughout the Midwest and Pacific Northwest Corporate Overview Headquarters Billings, MT Exchange/Listing NASDAQ: FIBK Market Capitalization* $3.1 Billion Dividend Yield 5.3% Branch Network 307 banking
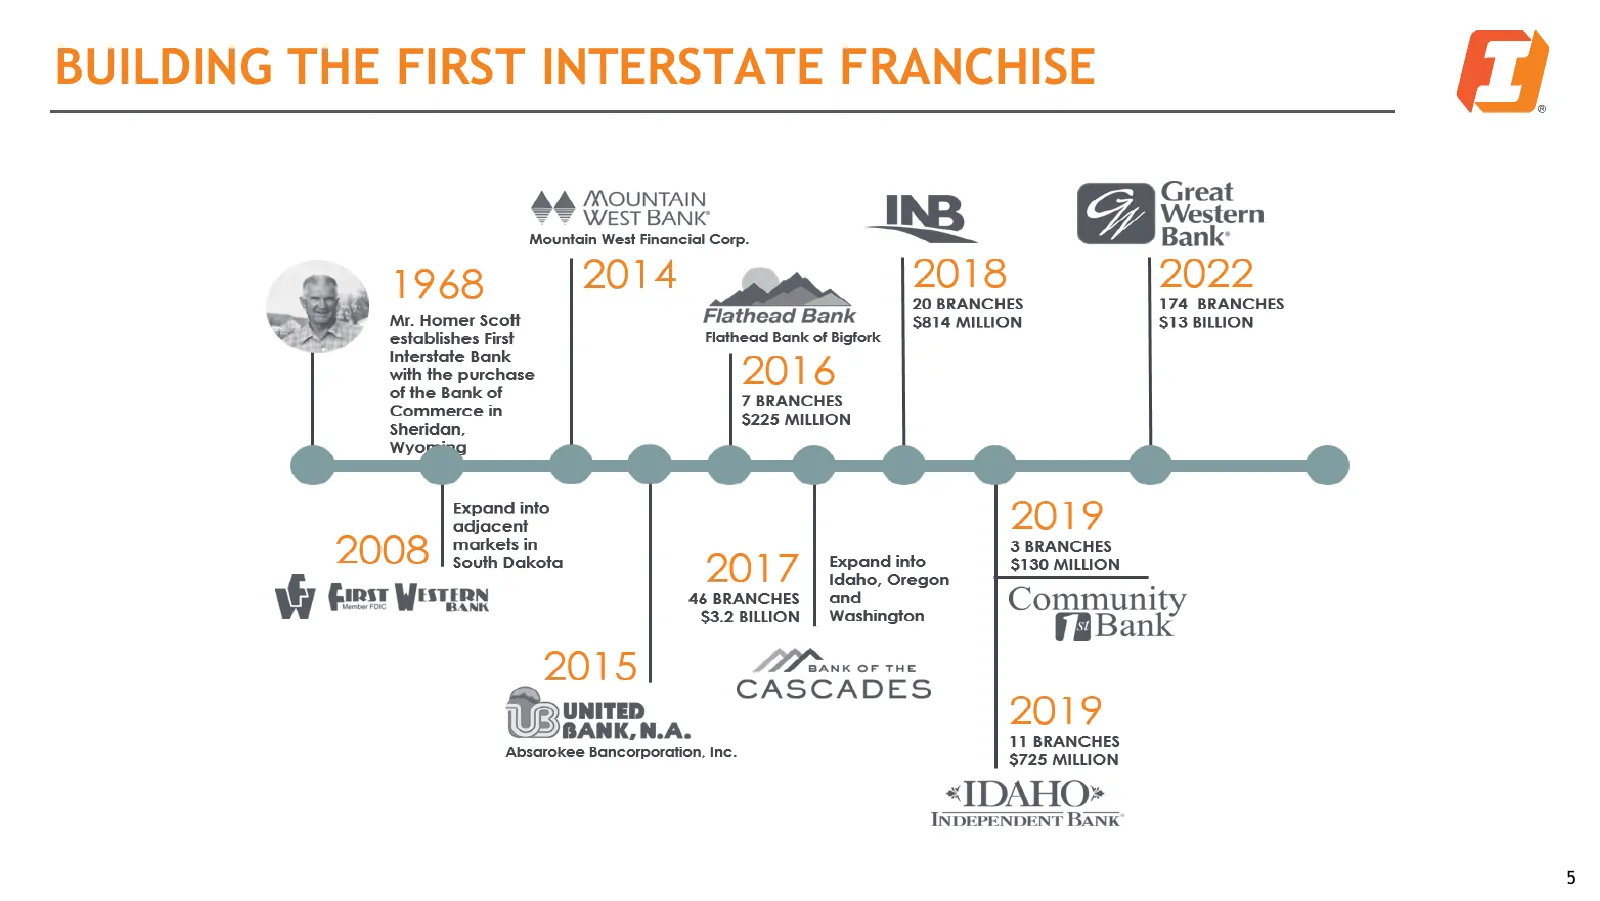
Slide 5: Building the First Interstate Franchise
BUILDING THE FIRST INTERSTATE FRANCHISE 5
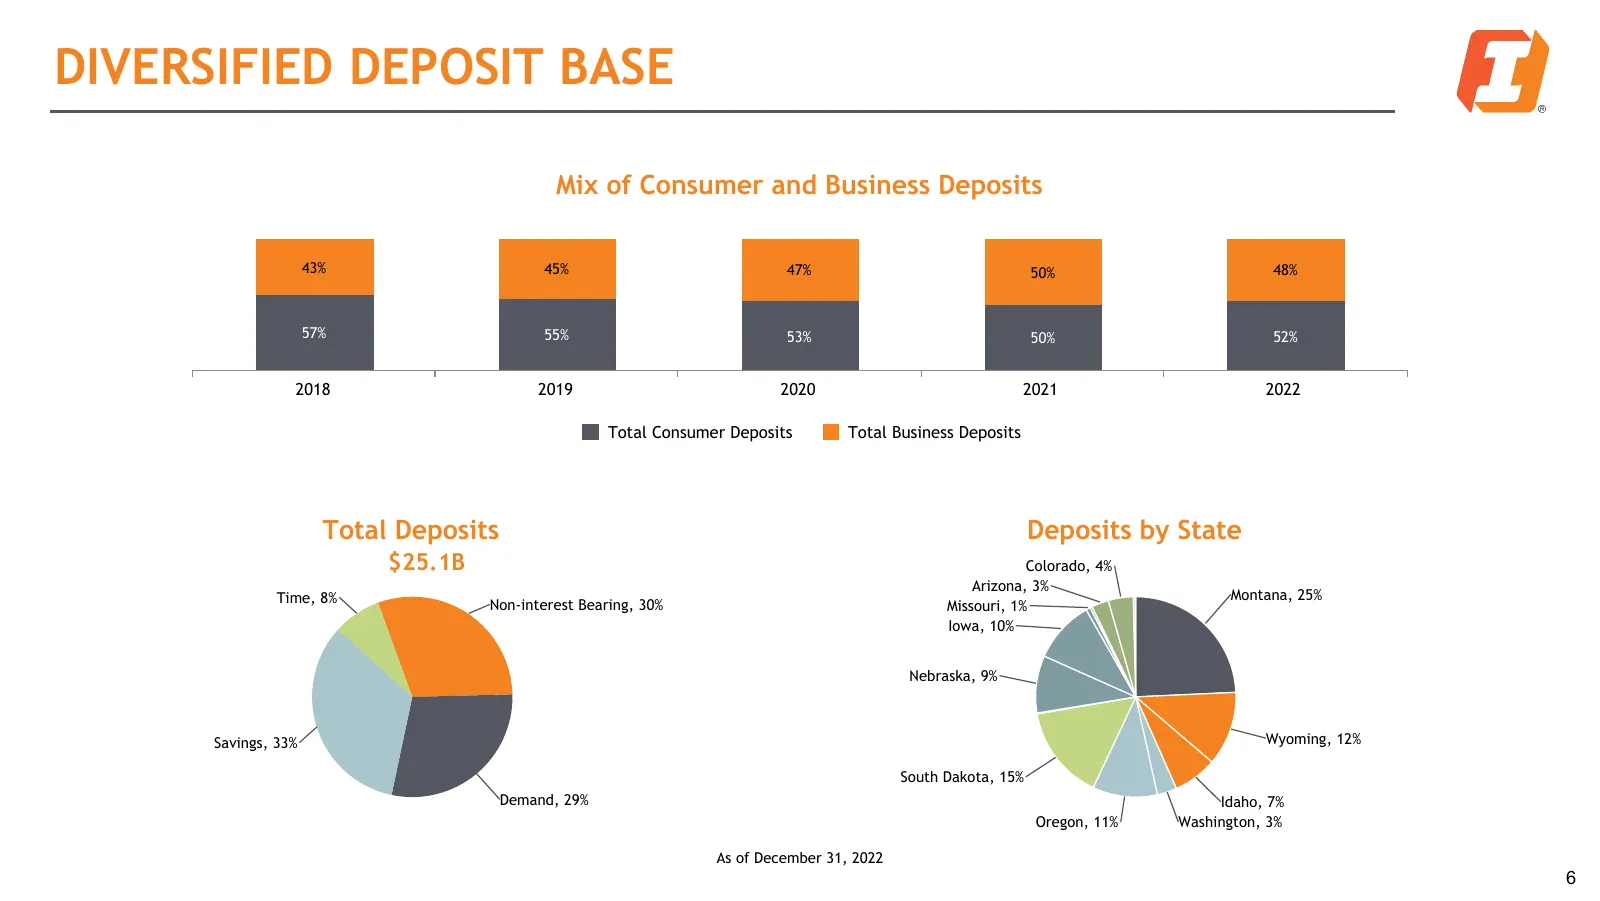
Slide 6: Diversified Deposit Base
DIVERSIFIED DEPOSIT BASE Mix of Consumer and Business Deposits 43% 45% 47% 50% 48% 57% 55% 53% 50% 52% 2018 2019 2020 2021 2022 Total Consumer Deposits Total Business Deposits Total Deposits Deposits by State $25.1B Colorado, 4% Arizona, 3% Time, 8% Montana, 25% Non-interest Bearing, 30% Missouri, 1
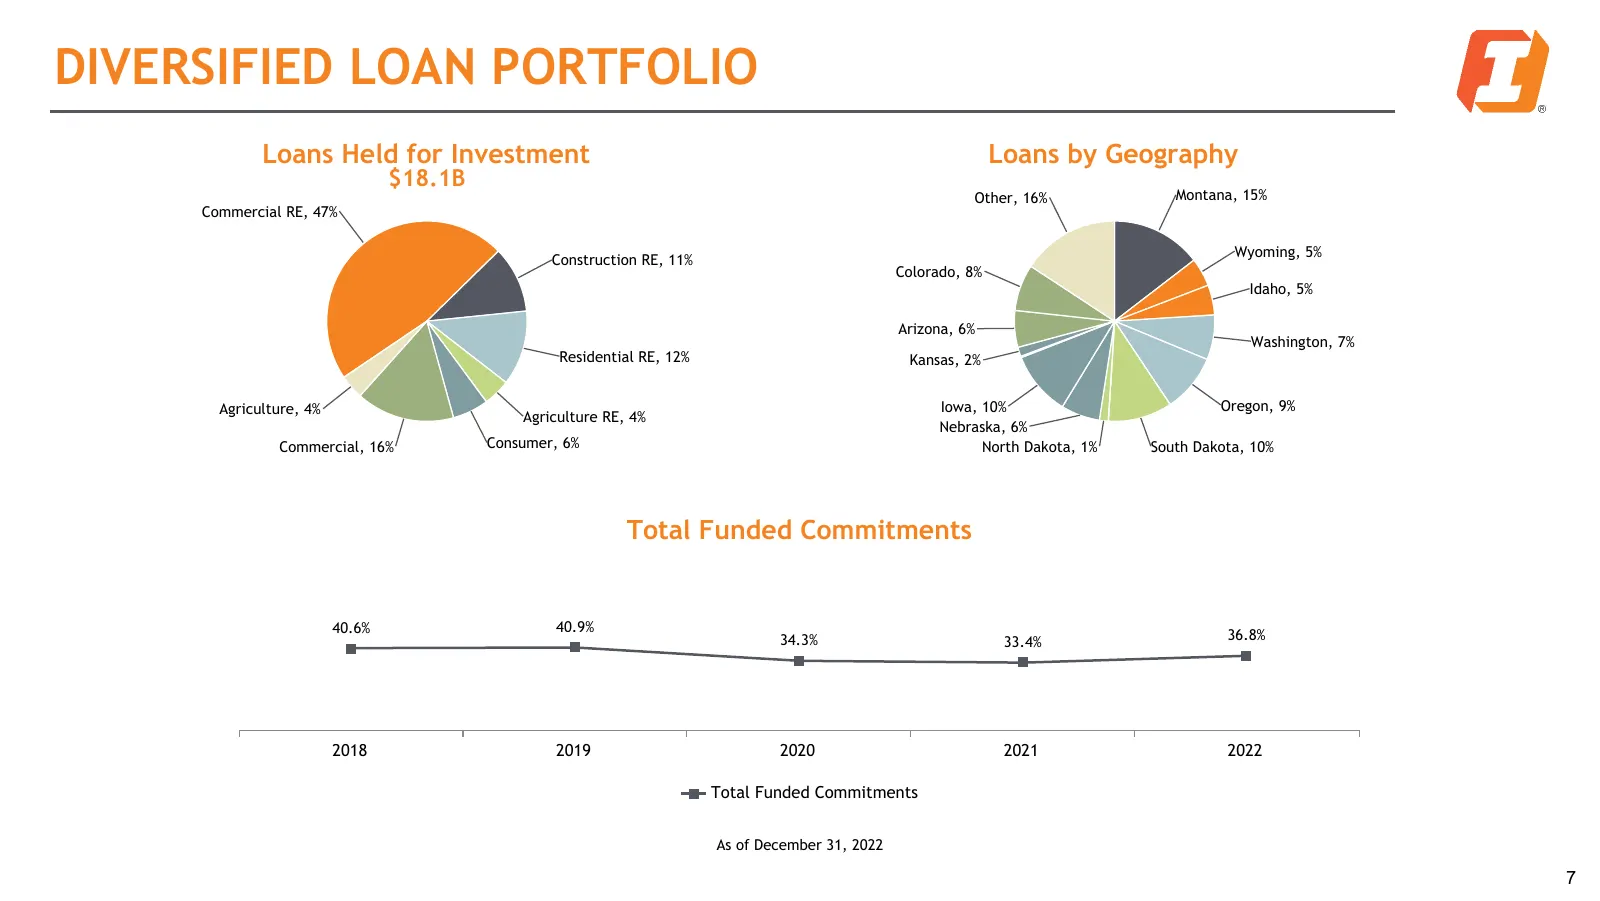
Slide 7: Diversified Loan Portfolio
DIVERSIFIED LOAN PORTFOLIO Loans Held for Investment Loans by Geography $18.1B Other, 16% Montana, 15% Commercial RE, 47% Wyoming, 5% Construction RE, 11% Colorado, 8% Idaho, 5% Arizona, 6% Washington, 7% Residential RE, 12% Kansas, 2% Agriculture, 4% Iowa, 10% Oregon, 9% Agriculture RE, 4% Nebraska
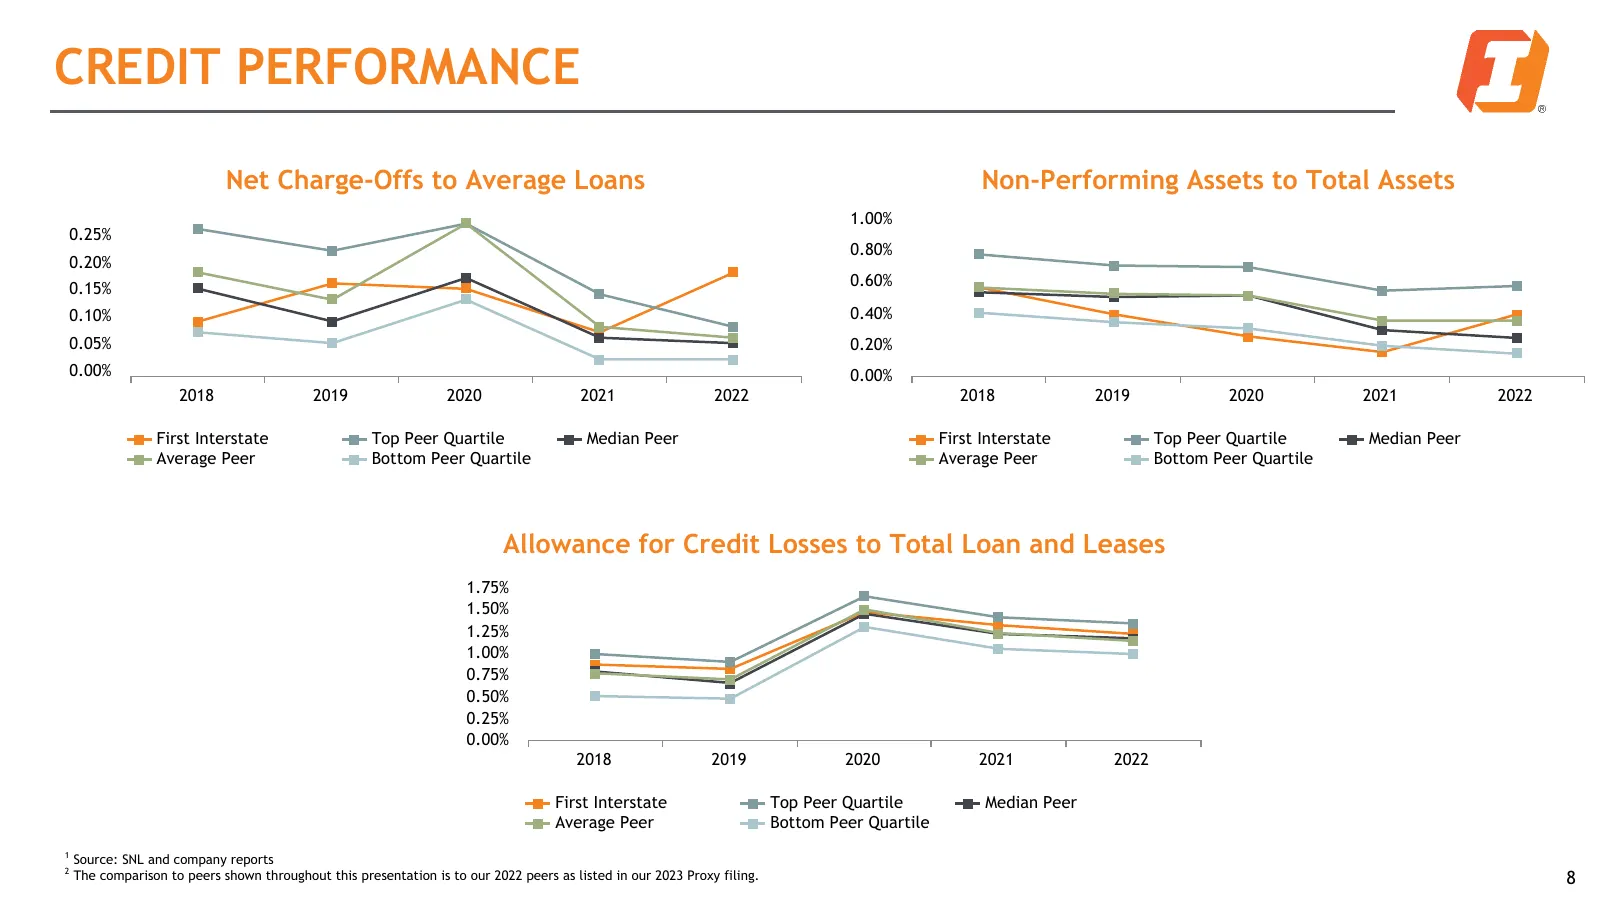
Slide 8: Credit Performance
CREDIT PERFORMANCE Net Charge-Offs to Average Loans Non-Performing Assets to Total Assets 1.00% 0.25% 0.80% 0.20% 0.15% 0.60% 0.10% 0.40% 0.05% 0.20% 0.00% 0.00% 2018 2019 2020 2021 2022 2018 2019 2020 2021 2022 First Interstate Top Peer Quartile Median Peer First Interstate Top Peer Quartile Median

Slide 9: 2022 Year in Review
2022 Year in Review
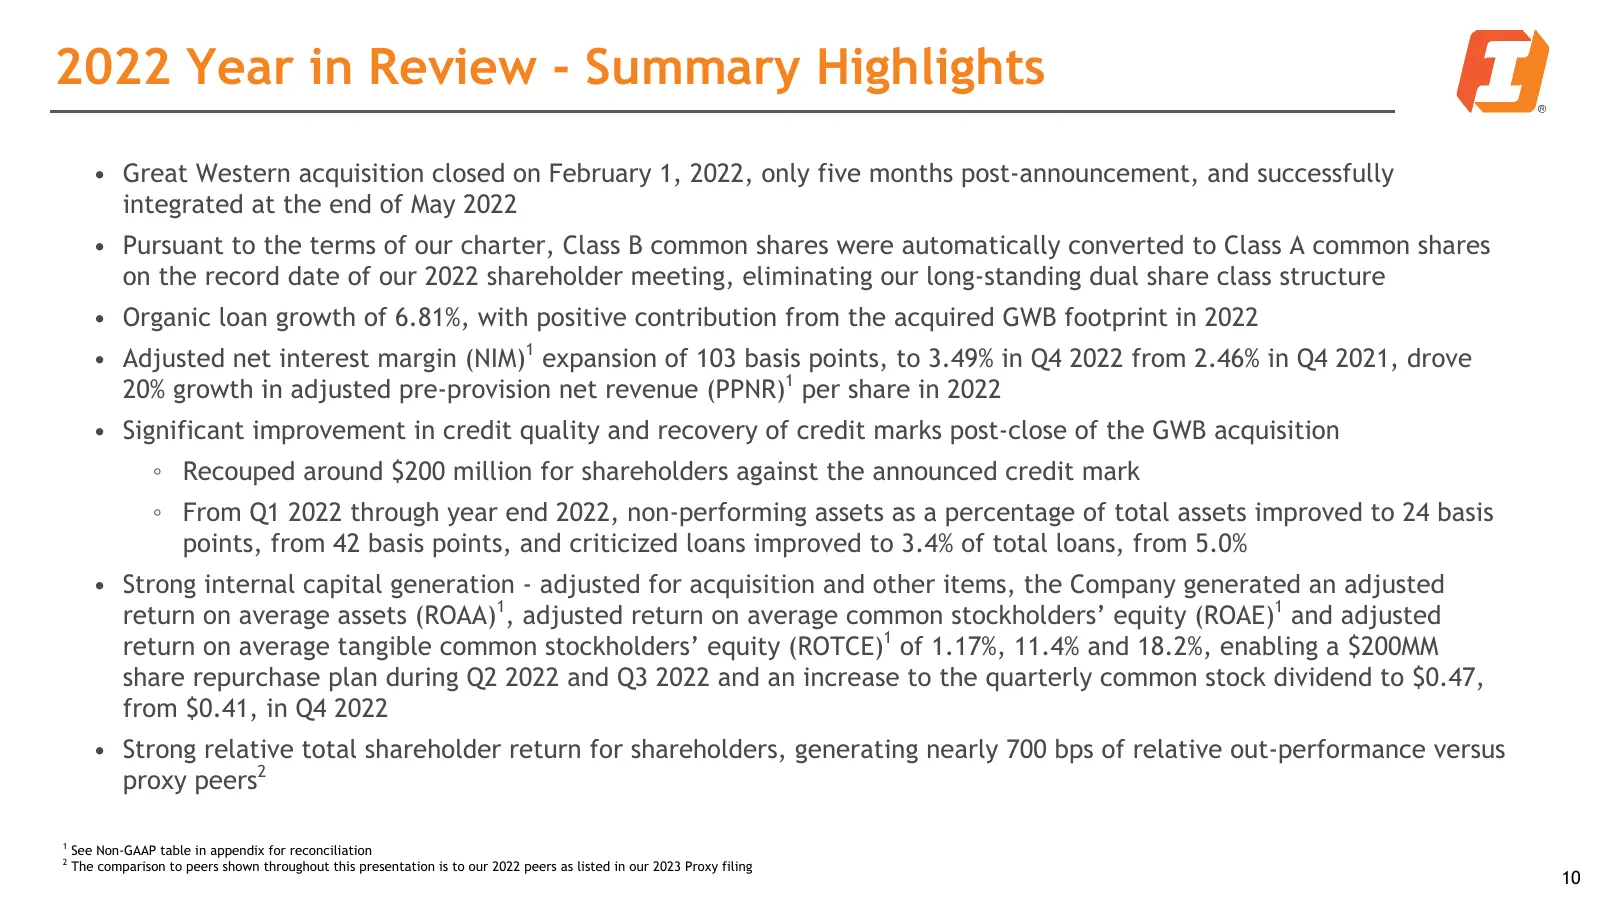
Slide 10: 2022 Year in Review - Summary Highlights
2022 Year in Review - Summary Highlights • Great Western acquisition closed on February 1, 2022, only five months post-announcement, and successfully integrated at the end of May 2022 • Pursuant to the terms of our charter, Class B common shares were automatically converted to Class A common shares

Slide 11: Maximizing Shareholder Value
Maximizing Shareholder Value
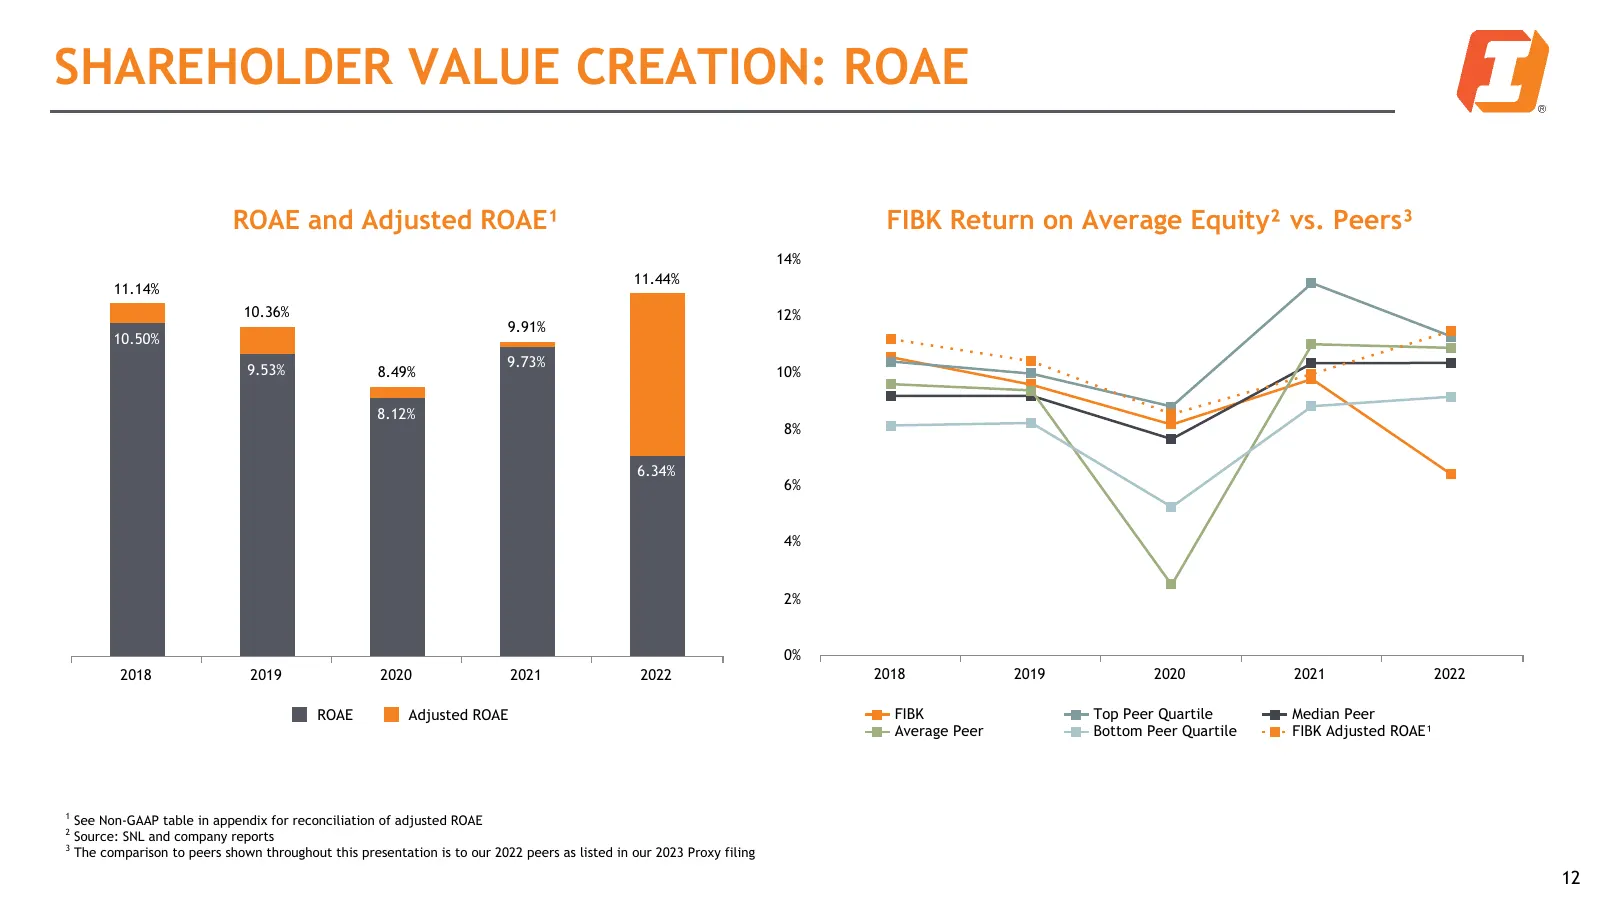
Slide 12: Shareholder Value Creation: ROAE
SHAREHOLDER VALUE CREATION: ROAE ROAE and Adjusted ROAE¹ FIBK Return on Average Equity² vs. Peers³ 14% 11.44% 11.14% 10.36% 12% 9.91% 10.50% 9.53% 9.73% 8.49% 10% 8.12% 8% 6.34% 6% 4% 2% 0% 2018 2019 2020 2021 2022 2018 2019 2020 2021 2022 ROAE Adjusted ROAE FIBK Top Peer Quartile Median Peer Averag
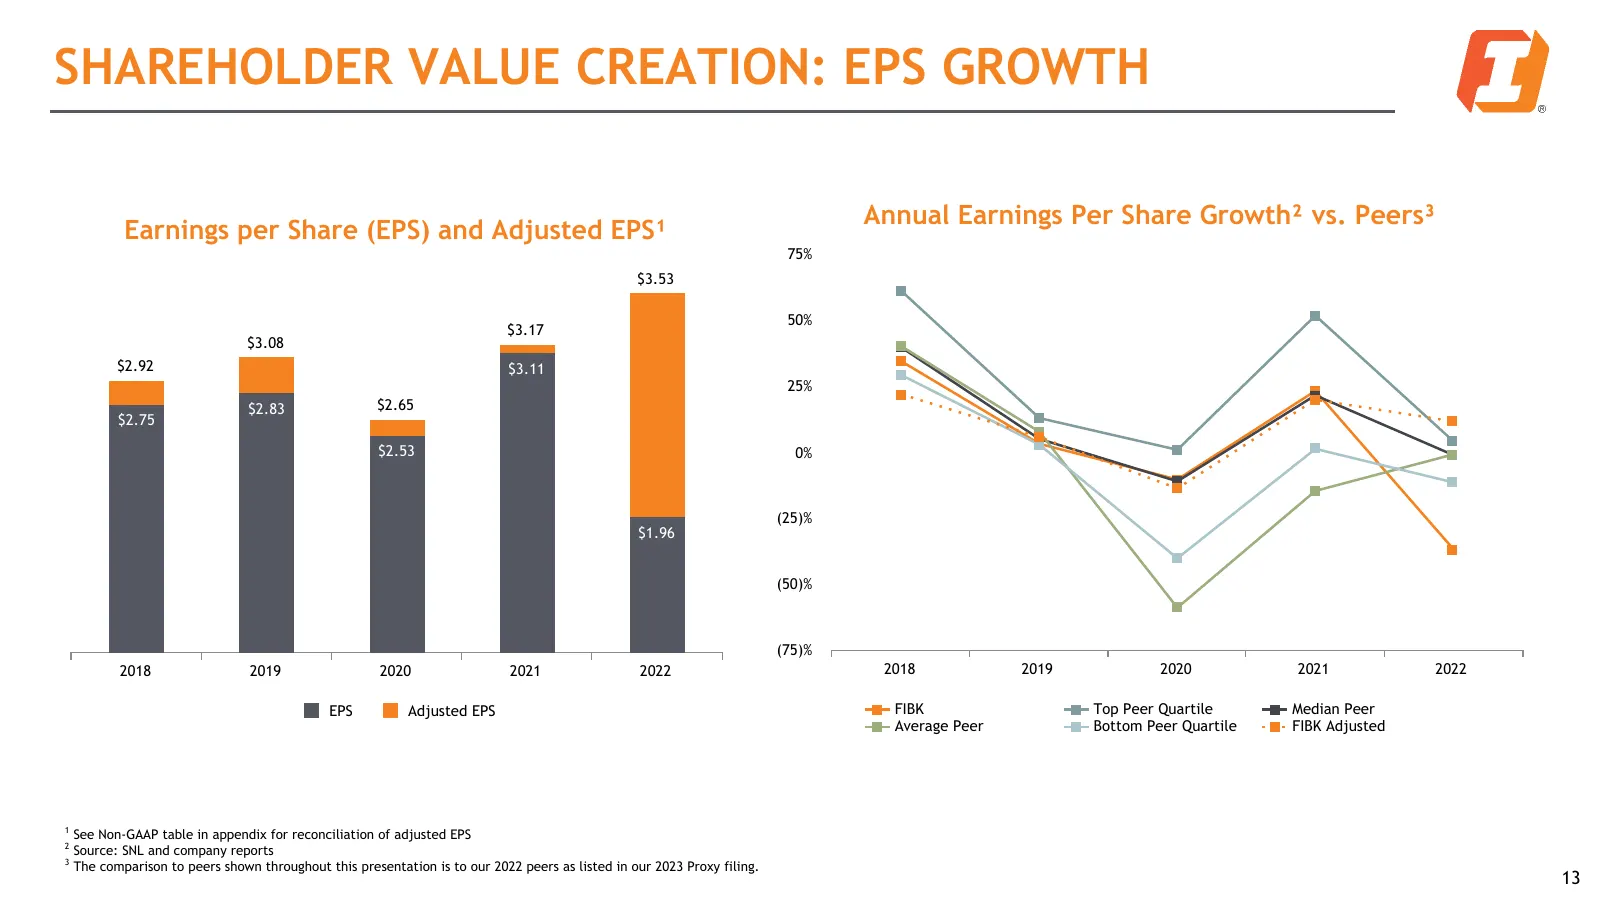
Slide 13: Shareholder Value Creation: EPS Growth
SHAREHOLDER VALUE CREATION: EPS GROWTH Annual Earnings Per Share Growth² vs. Peers³ Earnings per Share (EPS) and Adjusted EPS¹ 75% $3.53 50% $3.17 $3.08 $2.92 $3.11 25% $2.83 $2.65 $2.75 $2.53 0% (25)% $1.96 (50)% (75)% 2018 2019 2020 2021 2022 2018 2019 2020 2021 2022 EPS Adjusted EPS FIBK Top Peer
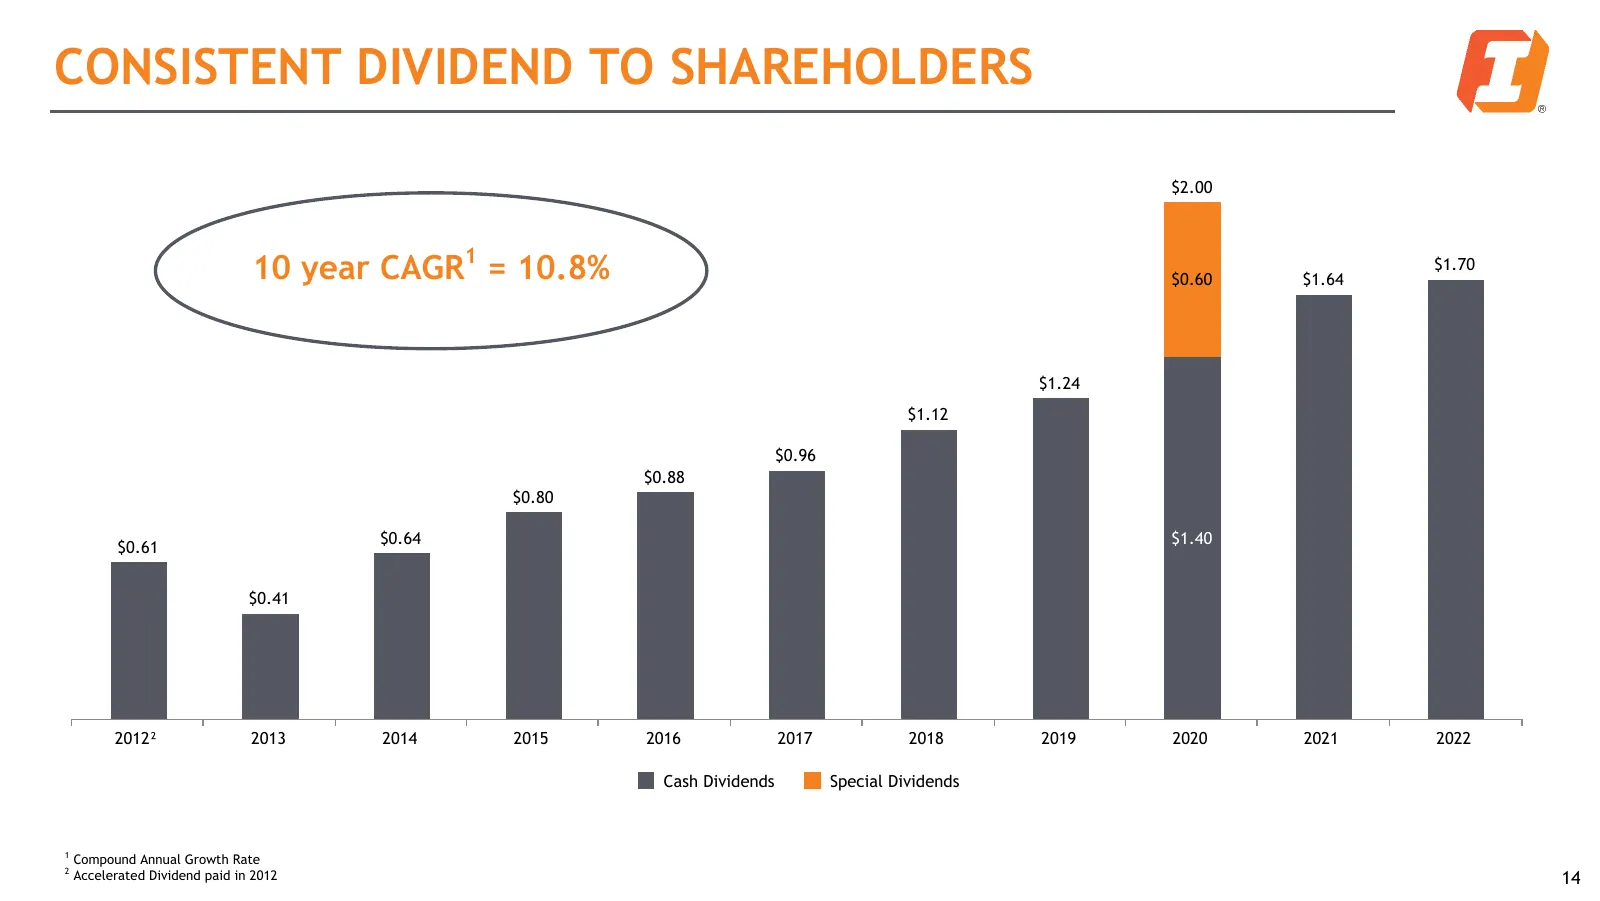
Slide 14: Consistent Dividend to Shareholders
CONSISTENT DIVIDEND TO SHAREHOLDERS $2.00 10 year CAGR1 = 10.8% $0.60 $1.64 $1.70 $1.24 $1.12 $0.96 $0.88 $0.80 $0.64 $1.40 $0.61 $0.41 2012² 2013 2014 2015 2016 2017 2018 2019 2020 2021 2022 Cash Dividends Special Dividends 1 Compound Annual Growth Rate 2 Accelerated Dividend paid in 2012 14
Slide 15: Pre-Provision Net Revenue per Share
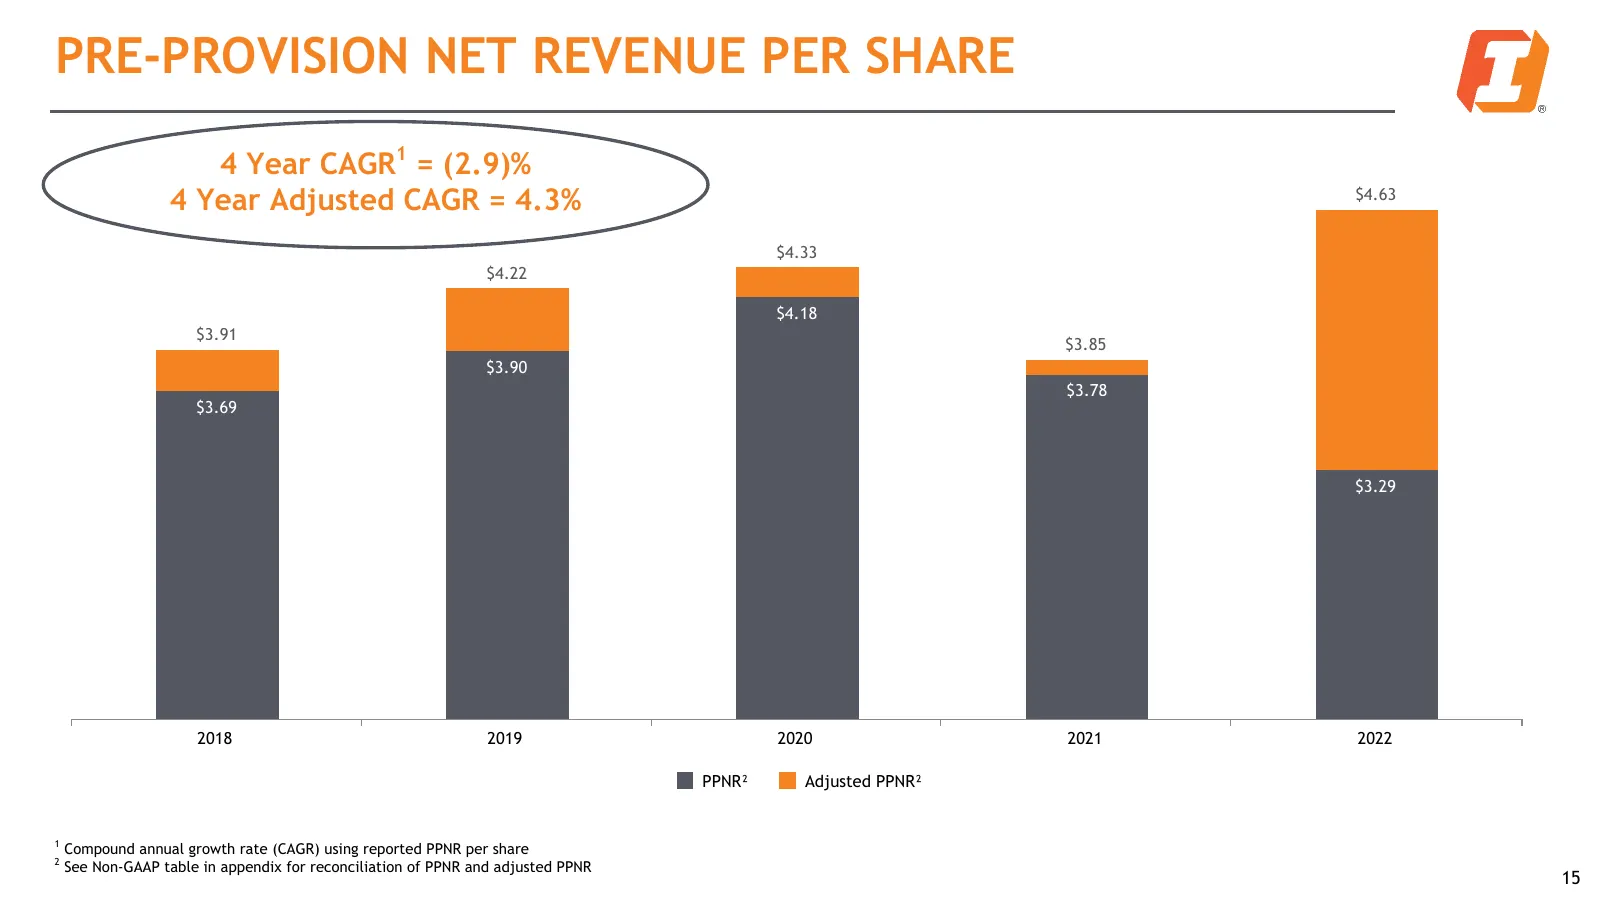
PRE-PROVISION NET REVENUE PER SHARE 4 Year CAGR1 = (2.9)% 4 Year Adjusted CAGR = 4.3% $4.63 $4.33 $4.22 $4.18 $3.91 $3.85 $3.90 $3.78 $3.69 $3.29 2018 2019 2020 2021 2022 PPNR² Adjusted PPNR² 1 Compound annual growth rate (CAGR) using reported PPNR per share 2 See Non-GAAP table in appendix for reco
Slide 16: 2022 Total Shareholder Return - FIBK vs Indices/Peers
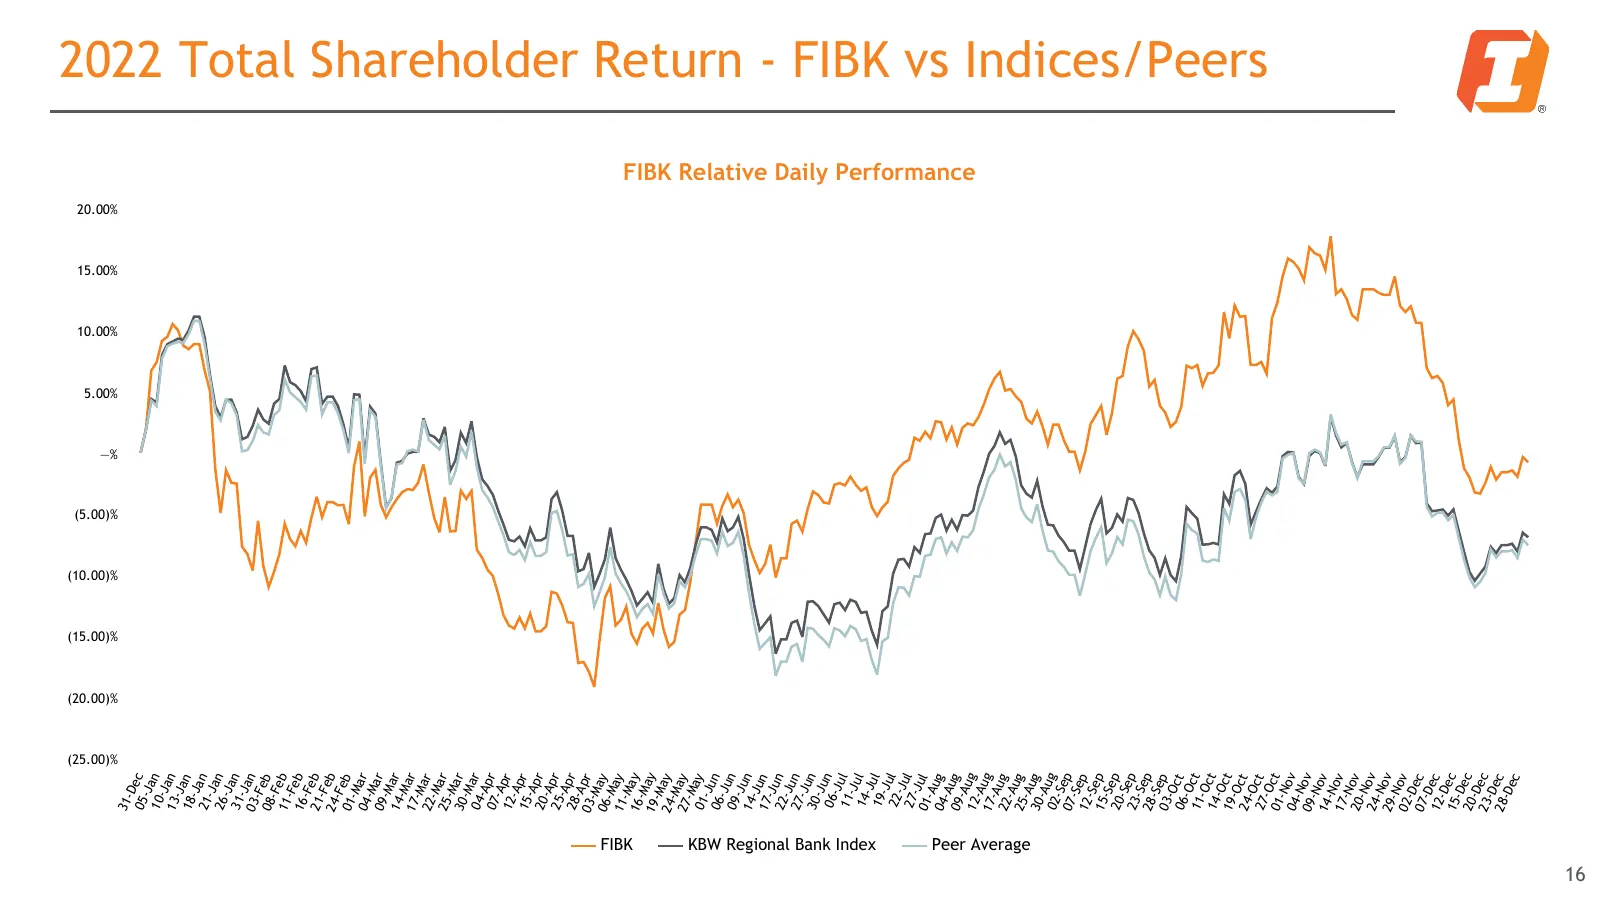
—% 5.00% 10.00% 15.00% 20.00% (25.00)% (20.00)% (15.00)% (10.00)% (5.00)% 31- D 05- ec J 10- an J 13- an J 18- an J 21- an J 26- an J 31- an J 03- an F 08- eb F 11- eb F 16- eb F 21- eb F 24- eb Feb 01- M 04- ar M 09- ar M 14- ar M 17- ar Ma 22- r M 25- ar M 30- ar M 04- ar A 07- pr A 12- pr A 15- p
Slide 17: Non-GAAP Financial Measures
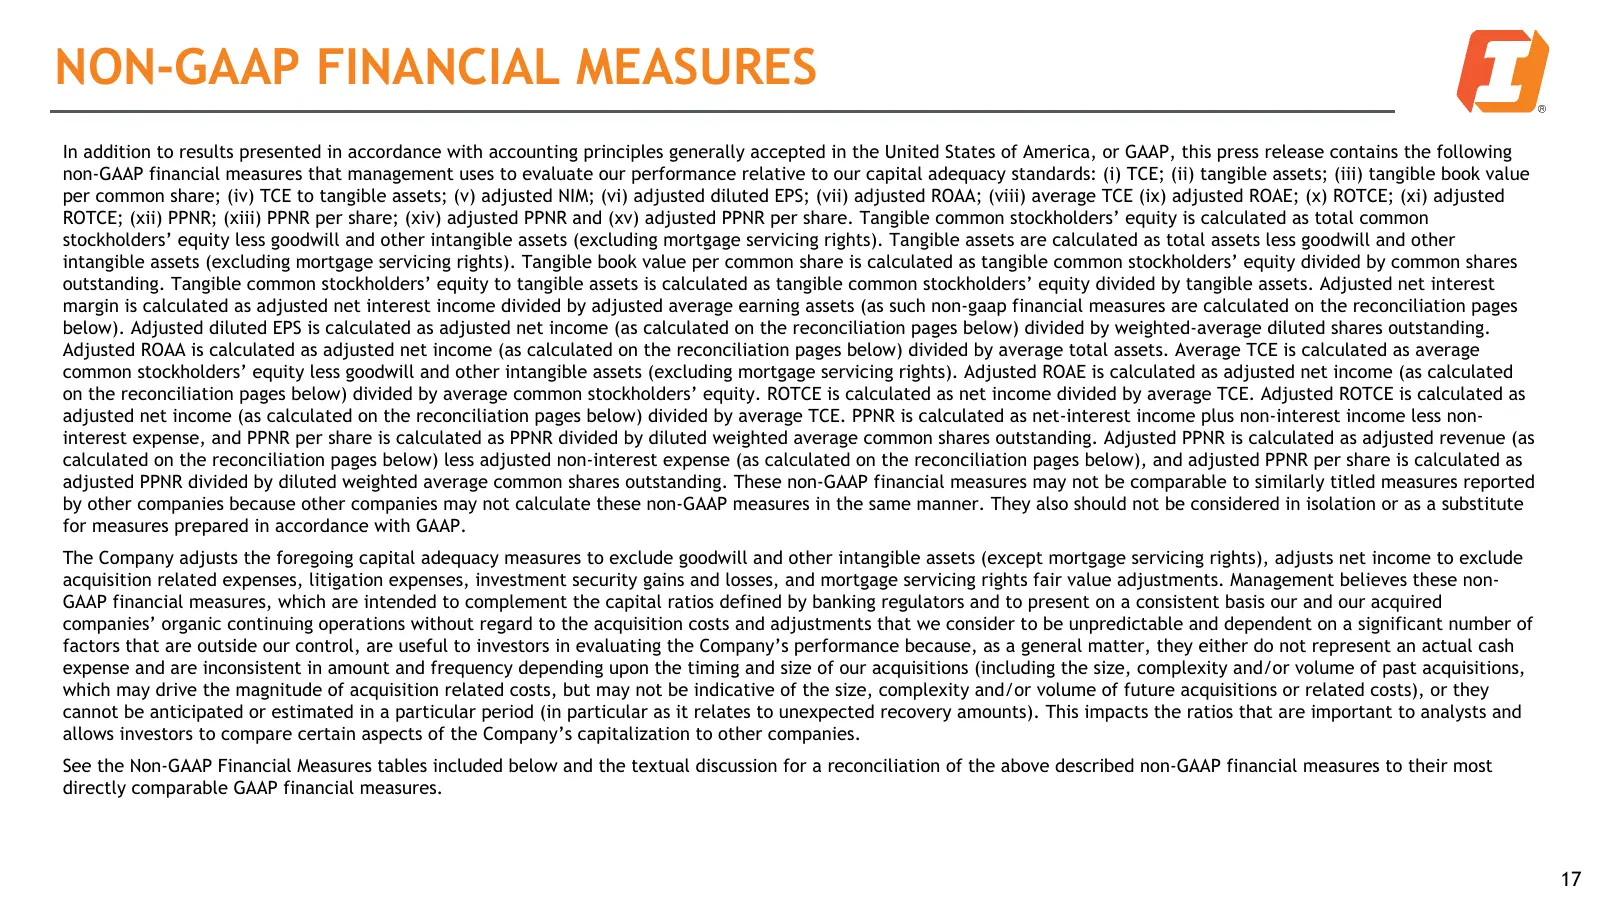
NON-GAAP FINANCIAL MEASURES In addition to results presented in accordance with accounting principles generally accepted in the United States of America, or GAAP, this press release contains the following non-GAAP financial measures that management uses to evaluate our performance relative to our ca
Slide 18: Non-GAAP Reconciliation
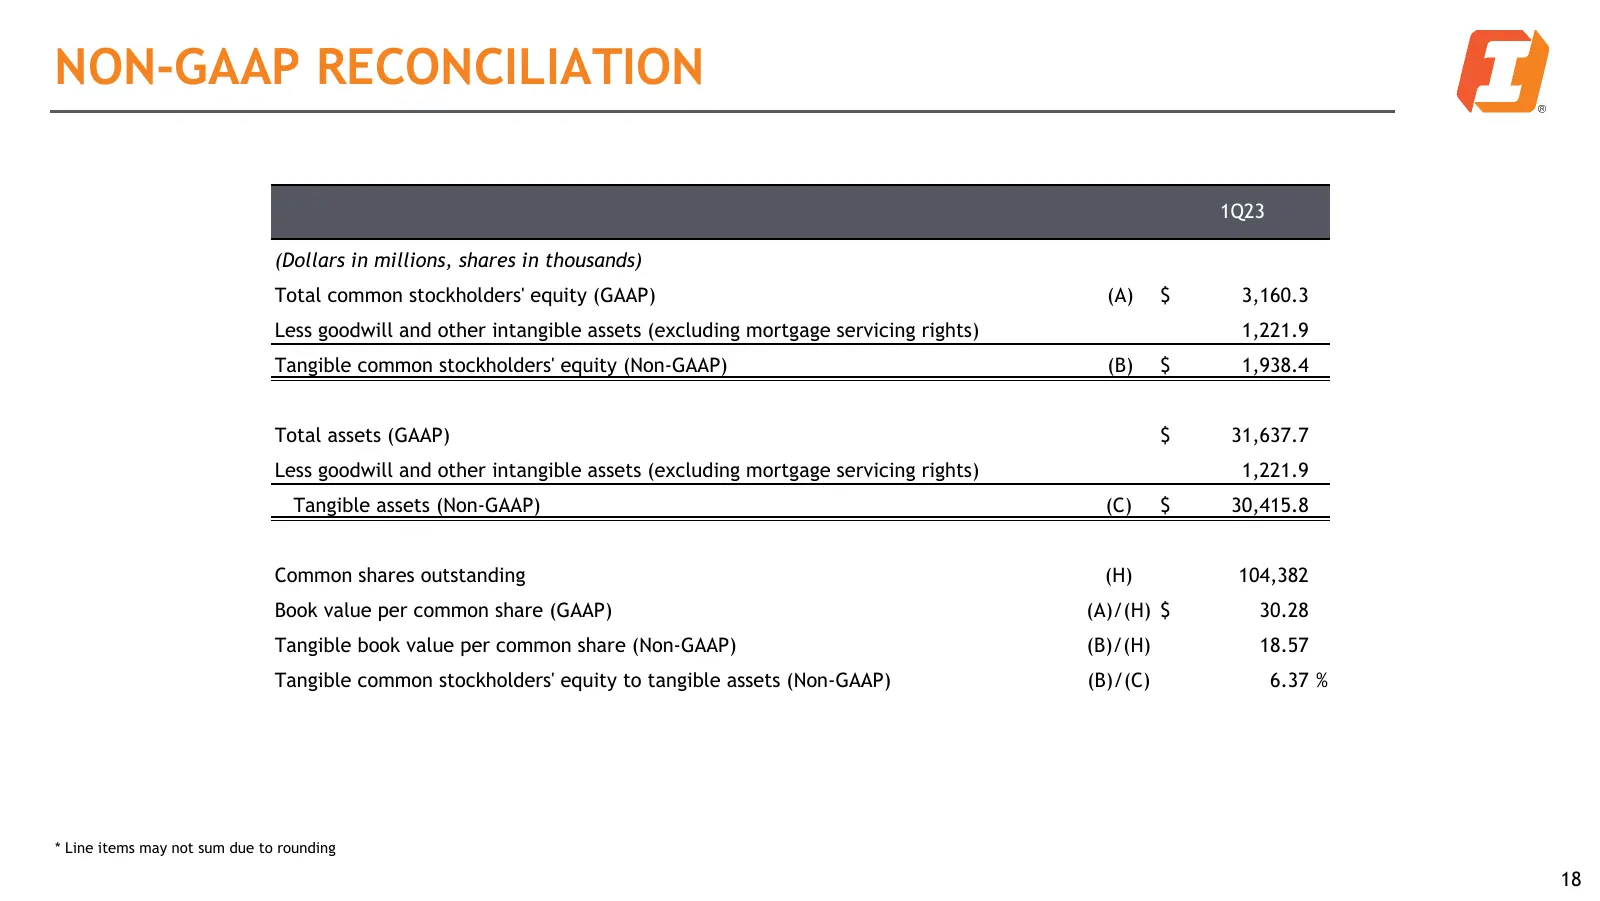
NON-GAAP RECONCILIATION 1Q23 (Dollars in millions, shares in thousands) Total common stockholders' equity (GAAP) (A) $ 3,160.3 Less goodwill and other intangible assets (excluding mortgage servicing rights) 1,221.9 Tangible common stockholders' equity (Non-GAAP) (B) $ 1,938.4 Total assets (GAAP) $ 3
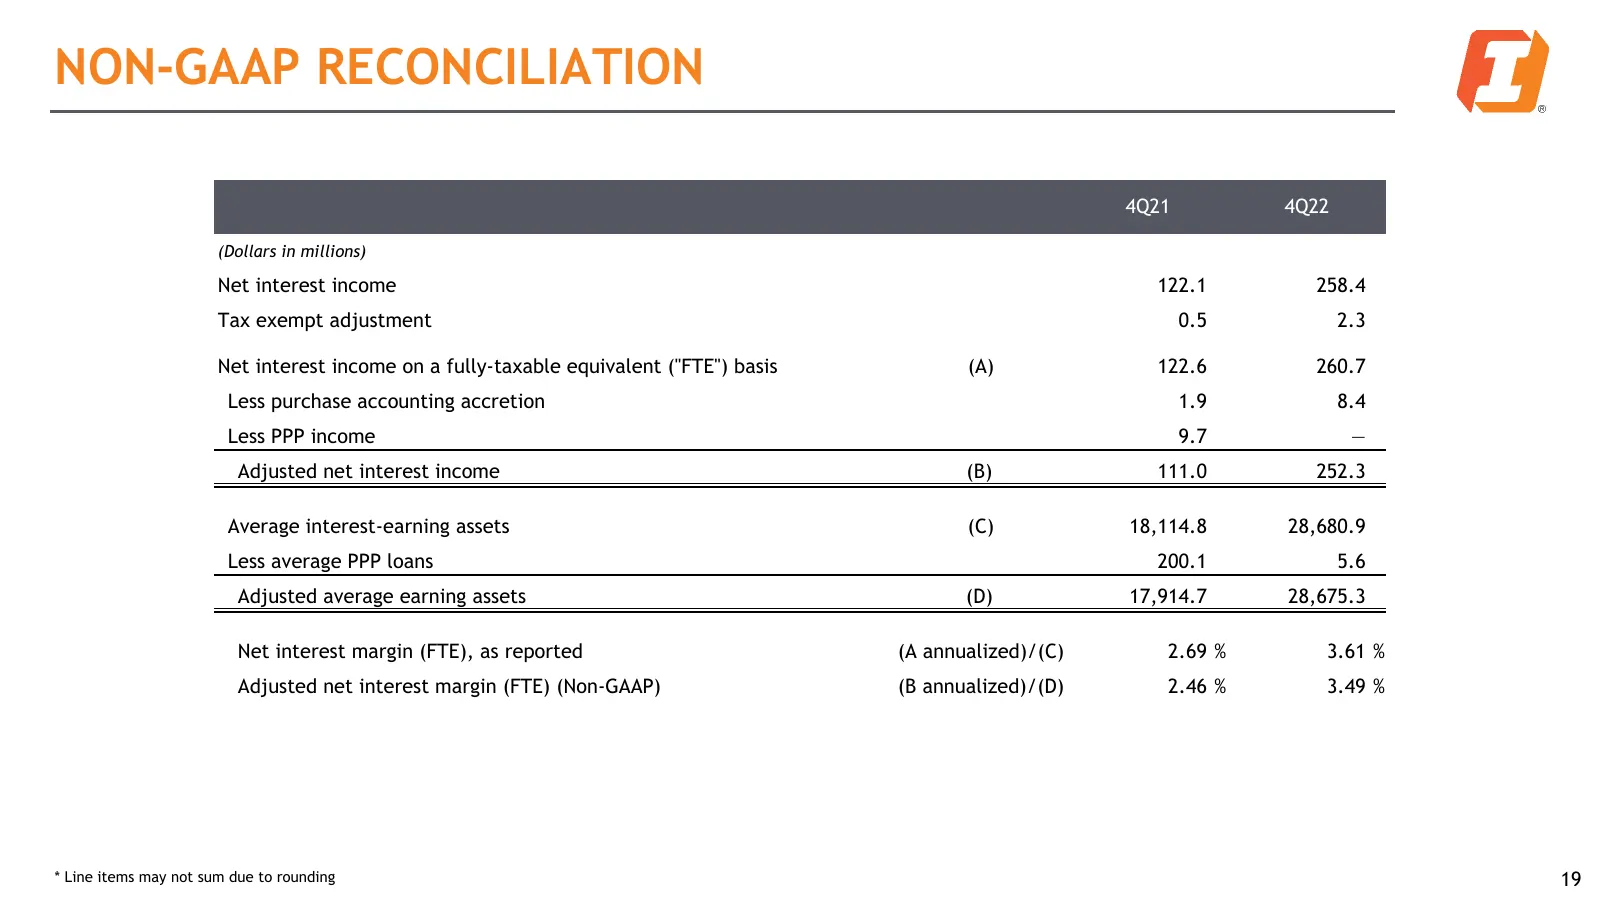
Slide 19: Non-GAAP Reconciliation
NON-GAAP RECONCILIATION 4Q21 4Q22 (Dollars in millions) Net interest income 122.1 258.4 Tax exempt adjustment 0.5 2.3 Net interest income on a fully-taxable equivalent ("FTE") basis (A) 122.6 260.7 Less purchase accounting accretion 1.9 8.4 Less PPP income 9.7 — Adjusted net interest income (B) 111.
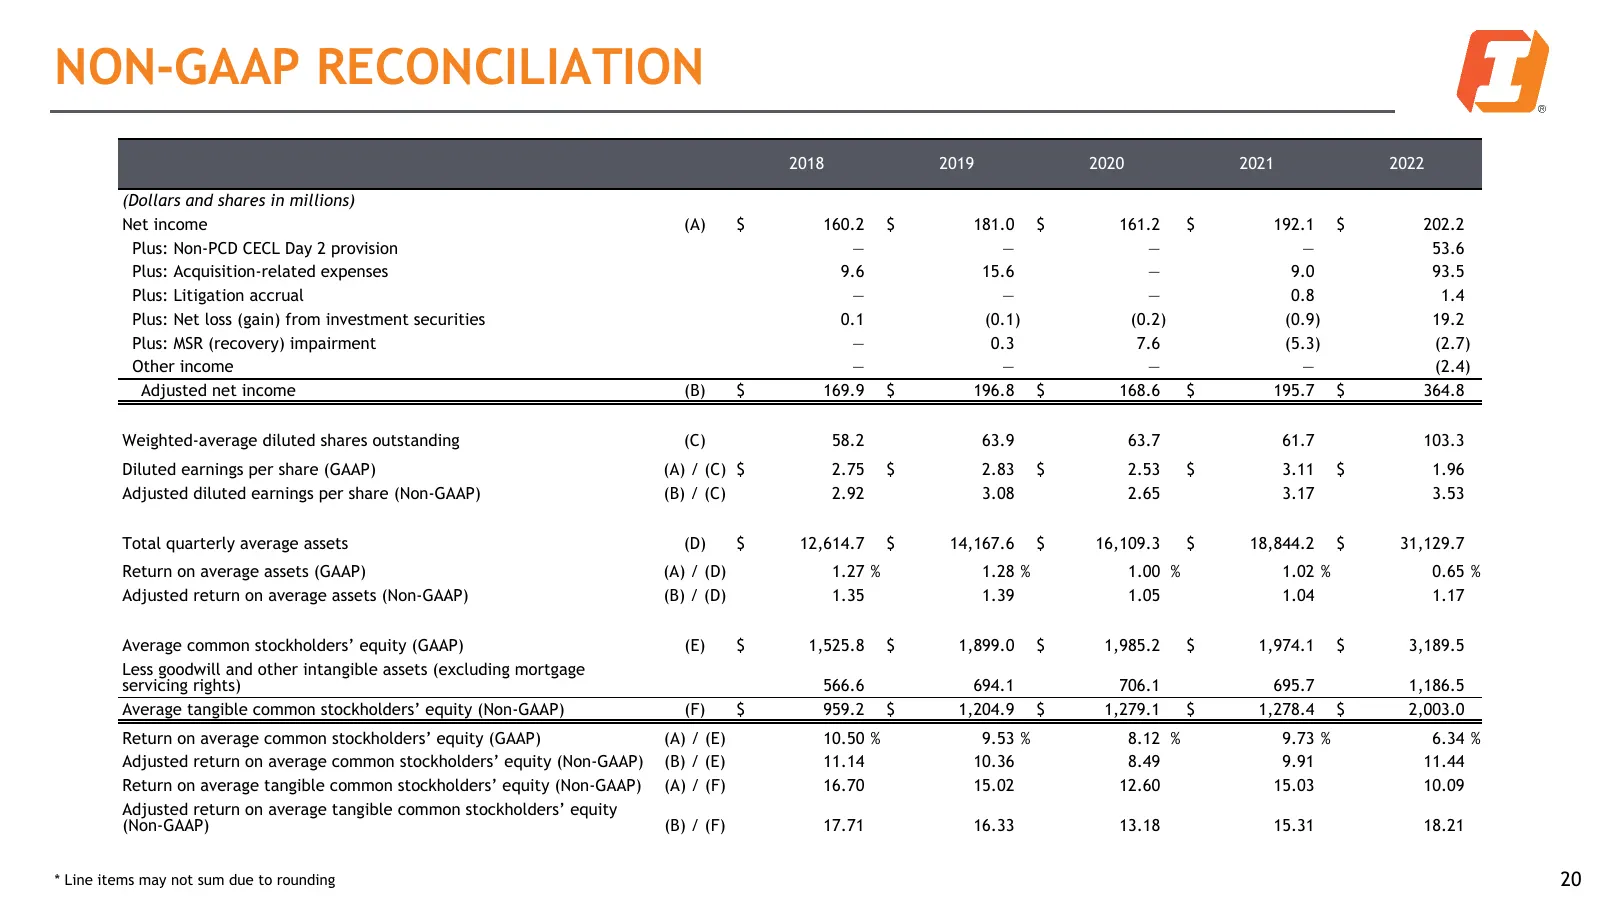
Slide 20: Non-GAAP Reconciliation
NON-GAAP RECONCILIATION 2018 2019 2020 2021 2022 (Dollars and shares in millions) Net income (A) $ 160.2 $ 181.0 $ 161.2 $ 192.1 $ 202.2 Plus: Non-PCD CECL Day 2 provision — — — — 53.6 Plus: Acquisition-related expenses 9.6 15.6 — 9.0 93.5 Plus: Litigation accrual — — — 0.8 1.4 Plus: Net loss (gain)
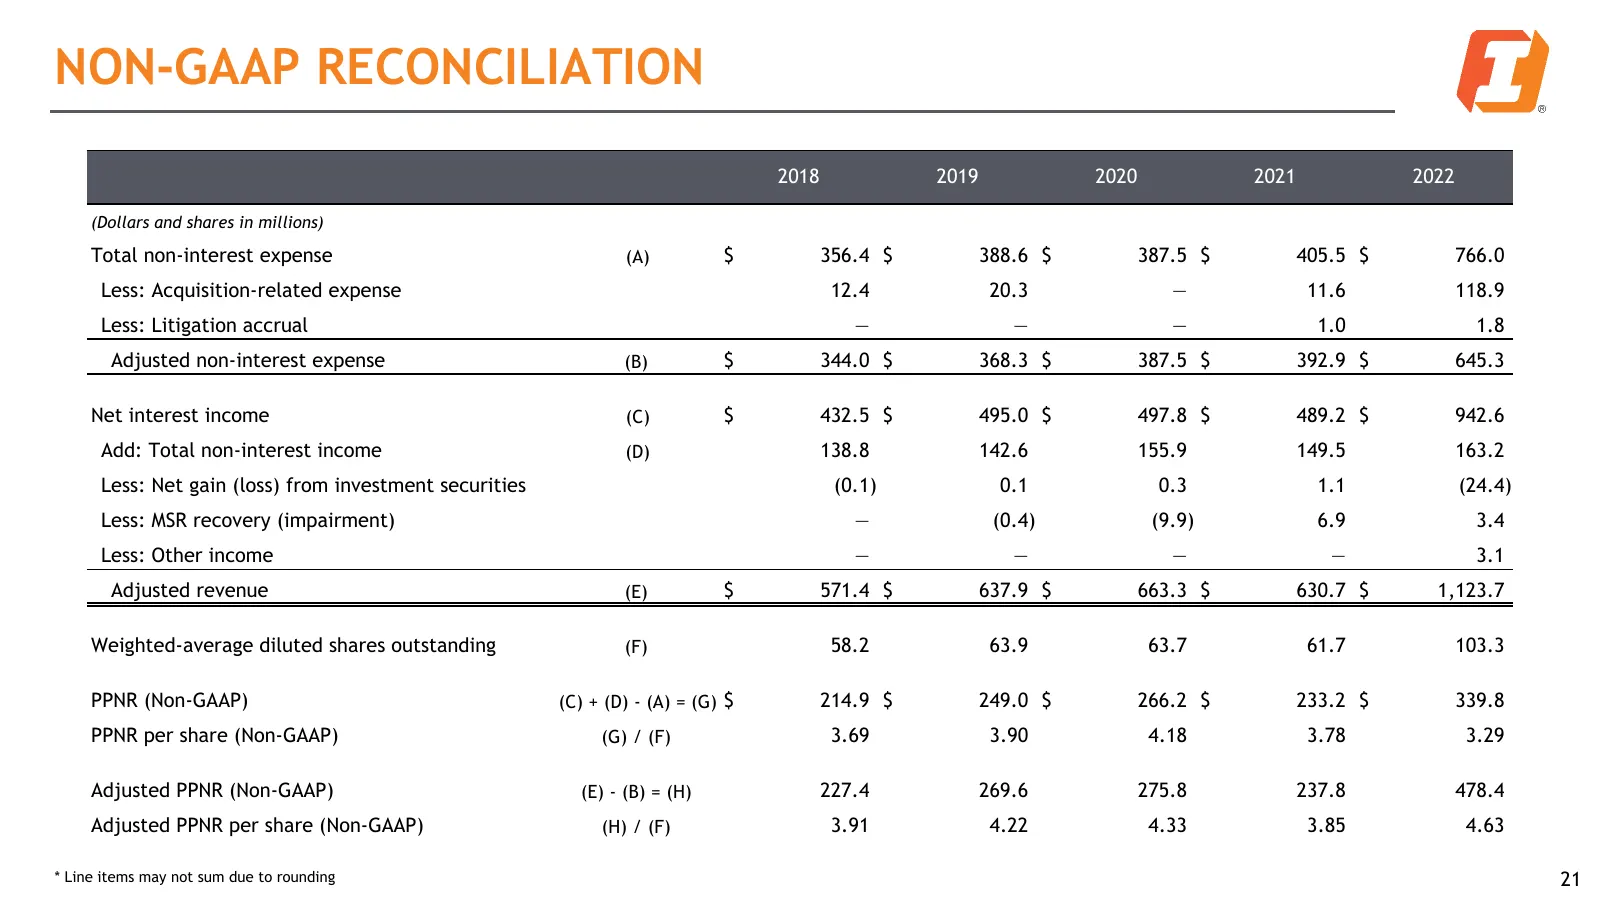
Slide 21: Non-GAAP Reconciliation
NON-GAAP RECONCILIATION 2018 2019 2020 2021 2022 (Dollars and shares in millions) Total non-interest expense (A) $ 356.4 $ 388.6 $ 387.5 $ 405.5 $ 766.0 Less: Acquisition-related expense 12.4 20.3 — 11.6 118.9 Less: Litigation accrual — — — 1.0 1.8 Adjusted non-interest expense (B) $ 344.0 $ 368.3 $
Source: Internet Archive copy of s29.q4cdn.com
More decks from First Interstate BancSystem, Inc.
 Q3 2026 Earnings Presentation21 slides · Oct 22, 2026
 Q2 2026 Earnings Presentation21 slides · Jul 24, 2026
 Q1 2026 Earnings Presentation20 slides · Apr 30, 2026
 Q4 2025 Earnings Presentation21 slides · Jan 29, 2026
 Q3 2025 Earnings Presentation21 slides · Oct 30, 2025
 Q2 2025 Earnings Presentation22 slides · Jul 30, 2025