Bob Evans Farms — Sidoti & Company 2013 Emerging Growth Research Institutional Investor Forum
45 slides from Bob Evans Farms's conference presentation, Mar 18, 2013
Slide 1: Sidoti & Company 2013 Emerging Growth Research Institutional Investor Forum
Steve Davis, Chairman and Chief Executive Officer Paul DeSantis, Chief Financial Officer Scott Taggart, VP, Investor Relations 1 Sidoti & Company 2013 Emerging Growth Research Institutional Investor Forum
Slide 2: Safe Harbor Statement
2 Safe Harbor Statement Under the Private Securities Litigation Reform Act of 1995 Certain statements in this presentation that are not historical facts are forward-looking statements. Forward-looking statements involve various important assumptions, risks and uncertainties. Actual results may diffe
Slide 3: Non-GAAP Financial Measures
3 Non-GAAP Financial Measures The Company uses non-GAAP financial measures within this presentation. These financial measures are used by management to monitor and evaluate the ongoing performance of the Company. The Company believes that the additional measures are useful to investors for financial
Slide 4: Company Fact Sheet Fiscal 2013 Q3
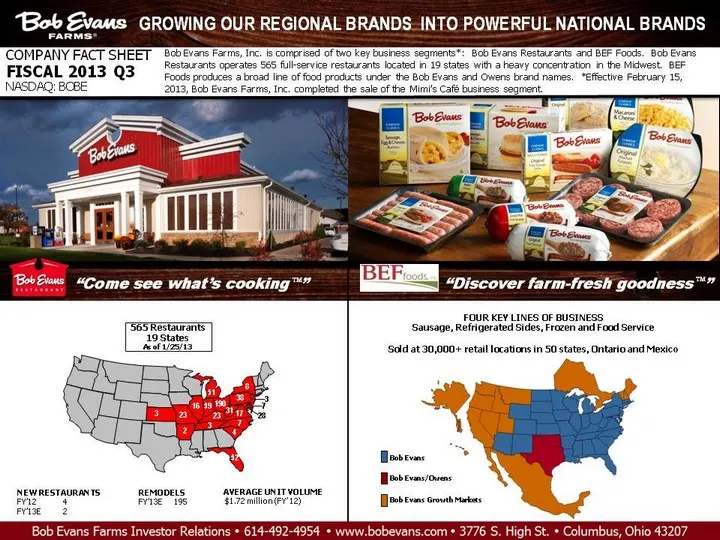
4 GROWING OUR REGIONAL BRANDS INTO POWERFUL NATIONAL BRANDS COMPANY FACT SHEET FISCAL 2013 Q3 NASDAQ: BOBE Bob Evans Farms, Inc. is comprised of two key business segments*: Bob Evans Restaurants and BEF Foods. Bob Evans Restaurants operates 565 full-service restaurants located in 19 states with a he
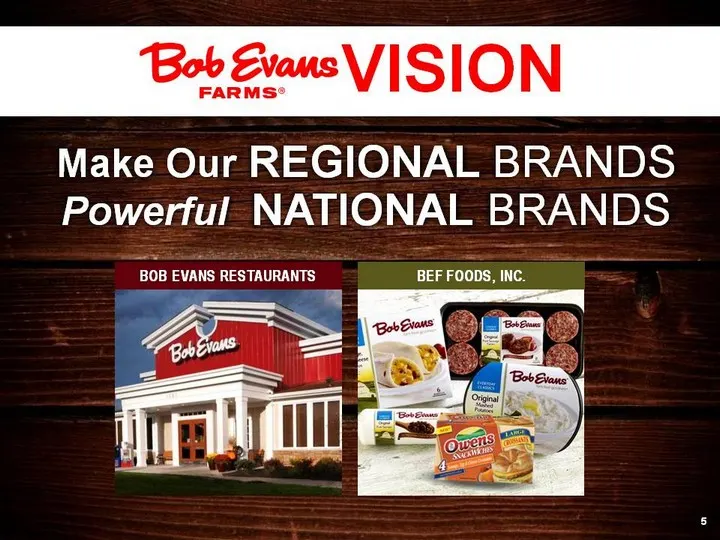
Slide 5: Powerful National Brands Make Our Regional Brands Vision
BOB EVANS RESTAURANTS 5 Powerful NATIONAL BRANDS Make Our REGIONAL BRANDS VISION BEF FOODS, INC.
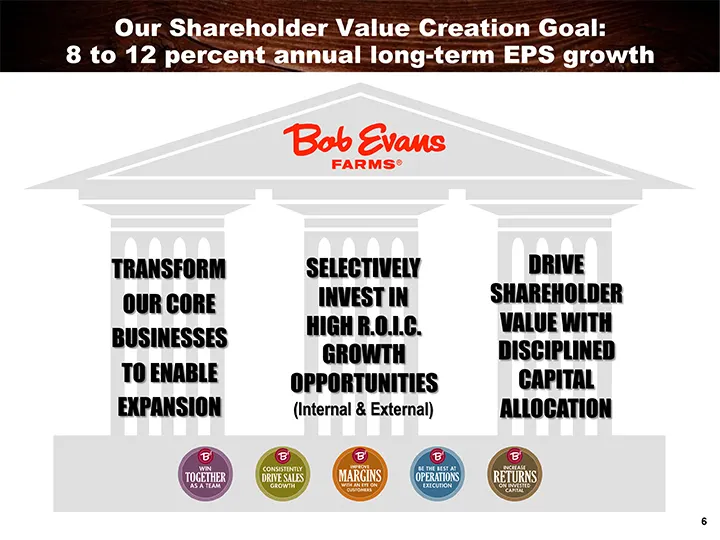
Slide 6: Our Shareholder Value Creation Goal
Our Shareholder Value Creation Goal: 8 to 12 percent annual long-term EPS growth 6 TRANSFORM OUR CORE BUSINESSES TO ENABLE EXPANSION DRIVE SHAREHOLDER VALUE WITH DISCIPLINED CAPITAL ALLOCATION SELECTIVELY INVEST IN HIGH R.O.I.C. GROWTH OPPORTUNITIES (Internal & External)
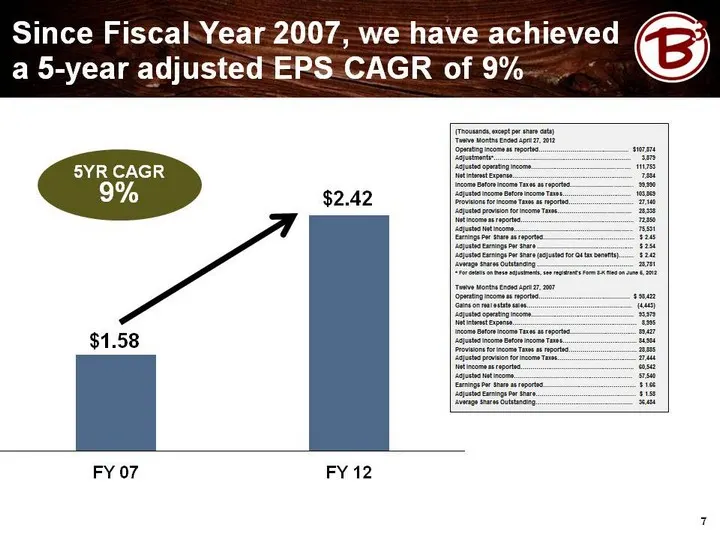
Slide 7: 5-year adjusted EPS CAGR of 9%
Since Fiscal Year 2007, we have achieved a 5-year adjusted EPS CAGR of 9% 5YR CAGR 9% 7
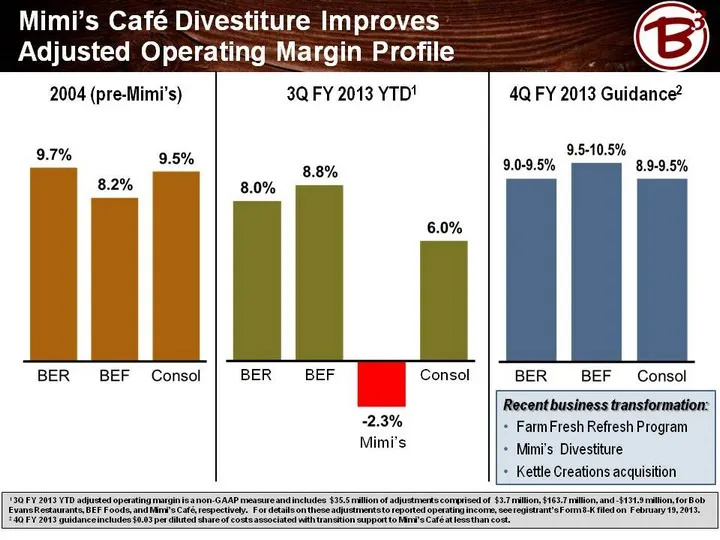
Slide 8: Mimi's Cafe Divestiture Improves Adjusted Operating Margin Profile
Mimi's Cafe Divestiture Improves Adjusted Operating Margin Profile 2004 (pre-Mimi's) 3Q FY 2013 YTD1 4Q FY 2013 Guidance2 Recent business transformation: Farm Fresh Refresh Program Mimi's Divestiture Kettle Creations acquisition 1 3Q FY 2013 YTD adjusted operating margin is a non-GAAP measure and in
Slide 9: Balanced Capital Allocation Drives Shareholder Value
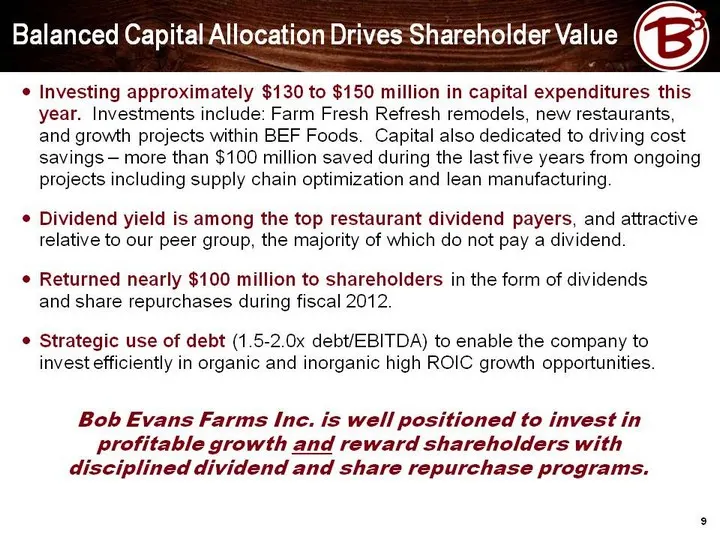
Balanced Capital Allocation Drives Shareholder Value Investing approximately $130 to $150 million in capital expenditures this year. Investments include: Farm Fresh Refresh remodels, new restaurants, and growth projects within BEF Foods. Capital also dedicated to driving cost savings - more than $10
Slide 10: Track Record of Balanced Capital Allocation FY 2008-FY 2012
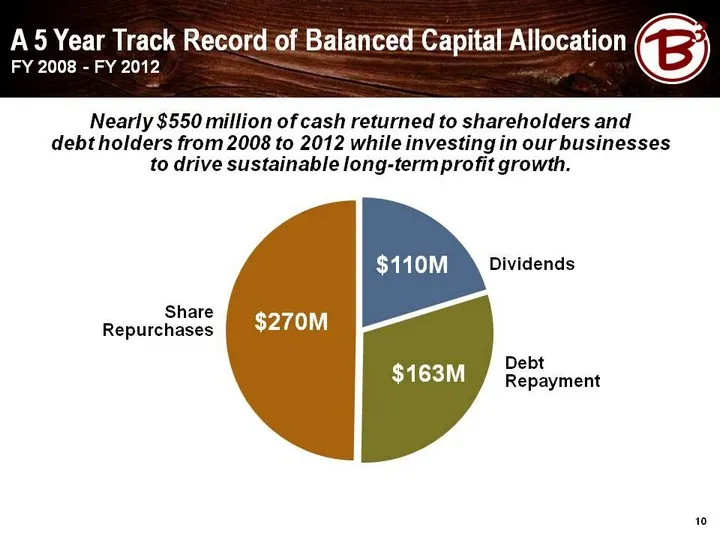
A 5 Year Track Record of Balanced Capital Allocation FY 2008 - FY 2012 Dividends $270M $163M $110M Share Repurchases Debt Repayment 10 Nearly $550 million of cash returned to shareholders and debt holders from 2008 to 2012 while investing in our businesses to drive sustainable long-term profit growt
Slide 11: Annual Dividend Rate: FY 2008 - FY 2013E
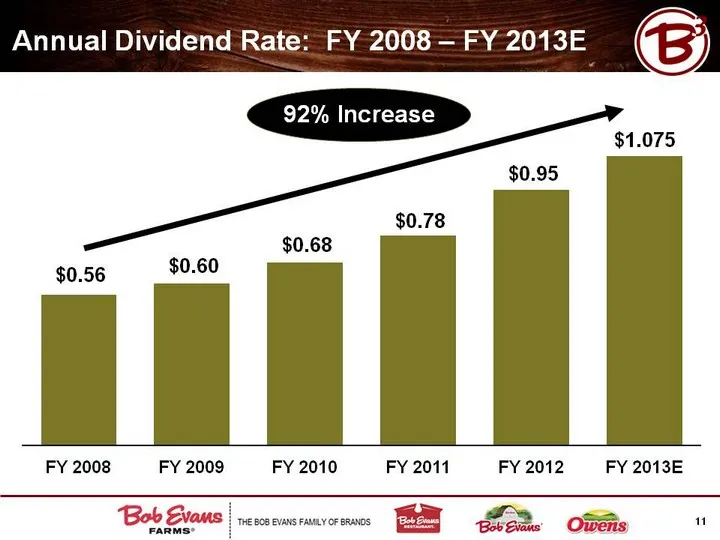
Annual Dividend Rate: FY 2008 - FY 2013E 92% Increase 11
Slide 12: Sales and Profit Growth Strategies
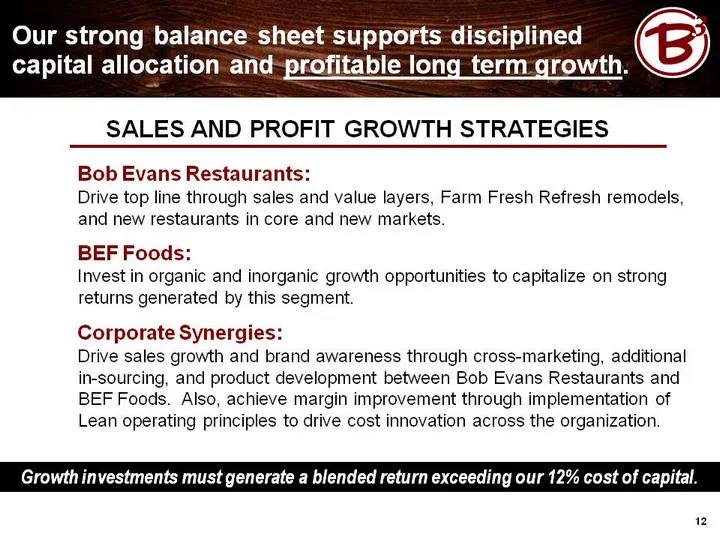
SALES AND PROFIT GROWTH STRATEGIES Bob Evans Restaurants: Drive top line through sales and value layers, Farm Fresh Refresh remodels, and new restaurants in core and new markets. BEF Foods: Invest in organic and inorganic growth opportunities to capitalize on strong returns generated by this segment
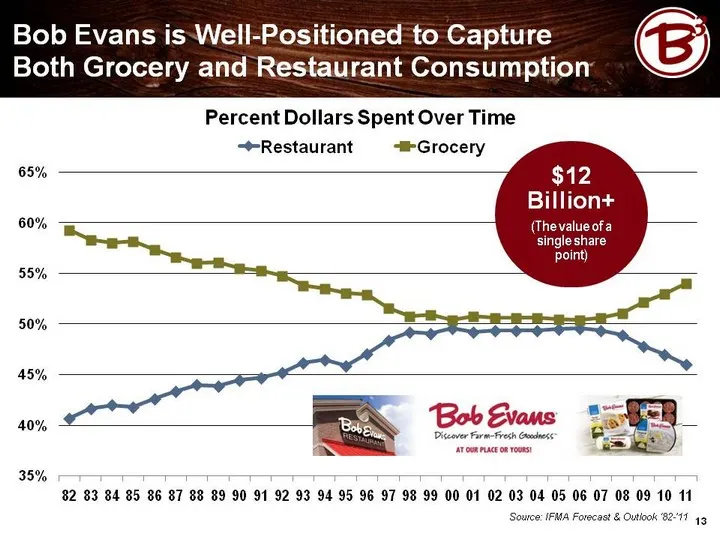
Slide 13: Well-Positioned to Capture Both Grocery and Restaurant Consumption
Source: IFMA Forecast & Outlook '82-'11 Bob Evans is Well-Positioned to Capture Both Grocery and Restaurant Consumption Percent Dollars Spent Over Time 13 $12 Billion+ (The value of a single share point)
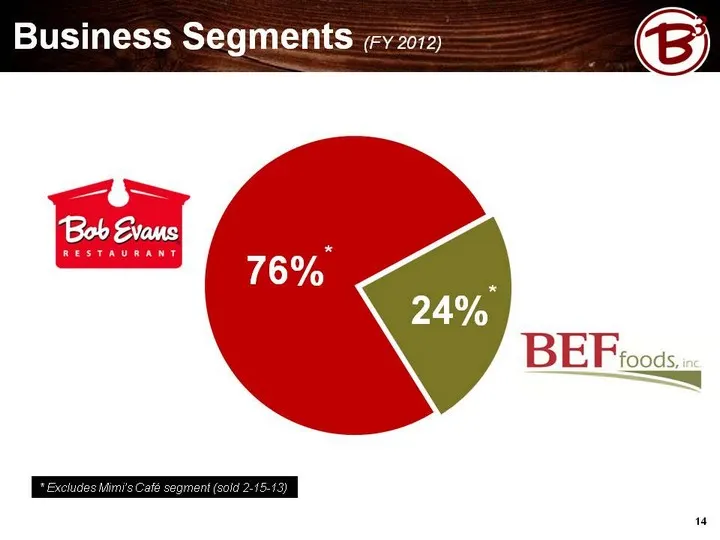
Slide 14: Business Segments (FY 2012)
Business Segments (FY 2012) 14 24%* 76%* * Excludes Mimi's Cafe segment (sold 2-15-13)
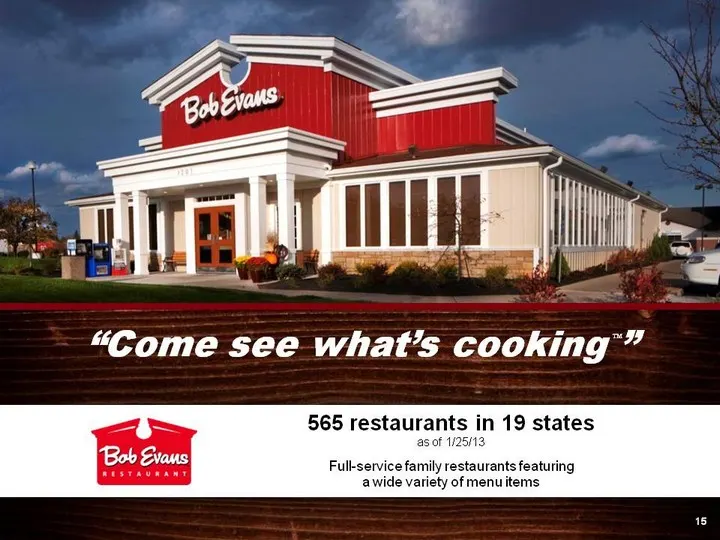
Slide 15: Bob Evans Restaurants
15 "Come see what's cooking " 565 restaurants in 19 states as of 1/25/13 Full-service family restaurants featuring a wide variety of menu items TM
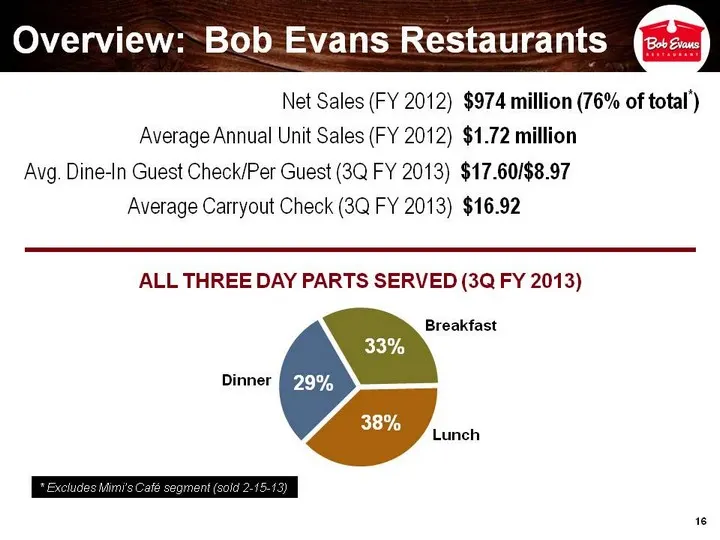
Slide 16: Overview: Bob Evans Restaurants
Net Sales (FY 2012) $974 million (76% of total*) Average Annual Unit Sales (FY 2012) $1.72 million Overview: Bob Evans Restaurants ALL THREE DAY PARTS SERVED (3Q FY 2013) Breakfast Lunch Dinner 16 33% 38% 29% Avg. Dine-In Guest Check/Per Guest (3Q FY 2013) $17.60/$8.97 Average Carryout Check (3Q FY
Slide 17: FY 2013: Vital Few Priorities
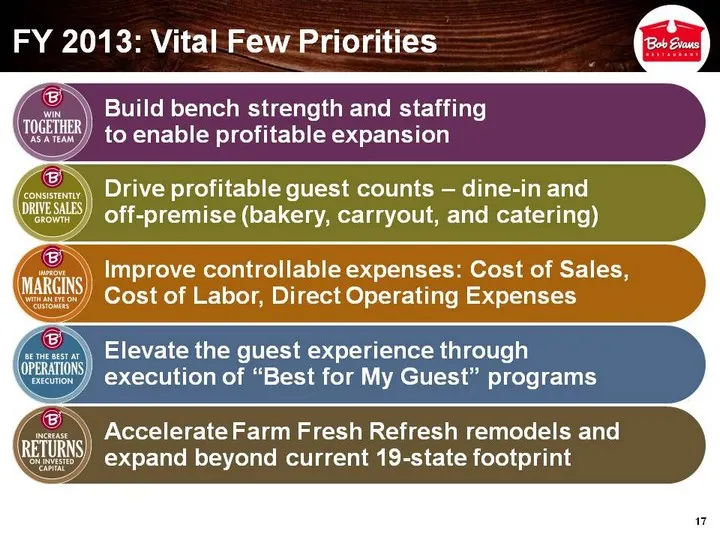
17 Build bench strength and staffing to enable profitable expansion Drive profitable guest counts - dine-in and off-premise (bakery, carryout, and catering) Improve controllable expenses: Cost of Sales, Cost of Labor, Direct Operating Expenses Elevate the guest experience through execution of "Best
Slide 18: Farm Fresh Refresh Remodels: Complete by 2014
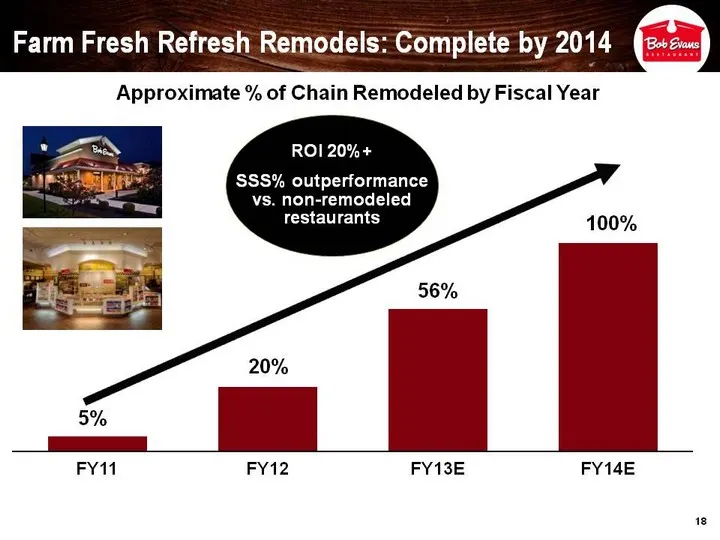
Farm Fresh Refresh Remodels: Complete by 2014 18 Approximate % of Chain Remodeled by Fiscal Year ROI 20%+ SSS% outperformance vs. non-remodeled restaurants
Slide 19: Investing in Remodels to Drive Future Returns
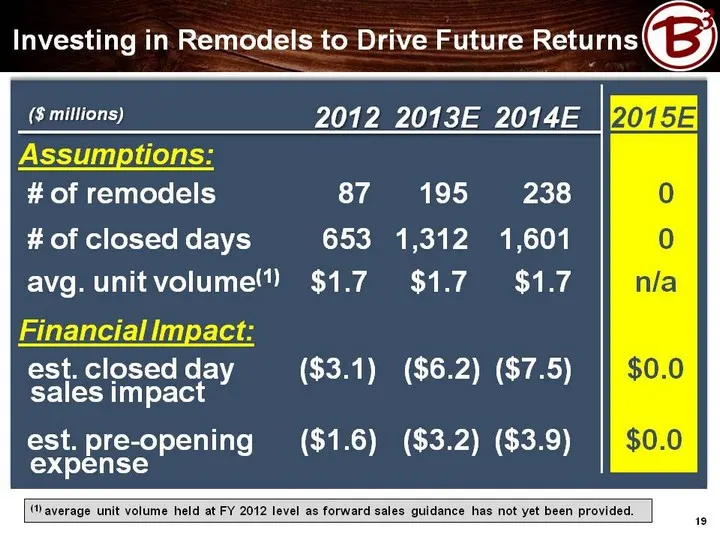
Investing in Remodels to Drive Future Returns 19 2012 2013E 2014E 2015E ($ millions) # of remodels 87 195 238 0 # of closed days 653 1,312 1,601 0 avg. unit volume(1) $1.7 $1.7 $1.7 n/a Financial Impact: Assumptions: est. closed day ($3.1) ($6.2) ($7.5) $0.0 est. pre-opening ($1.6) ($3.2) ($3.9) $0.
Slide 20: New Exterior Design Restaurant Remodels
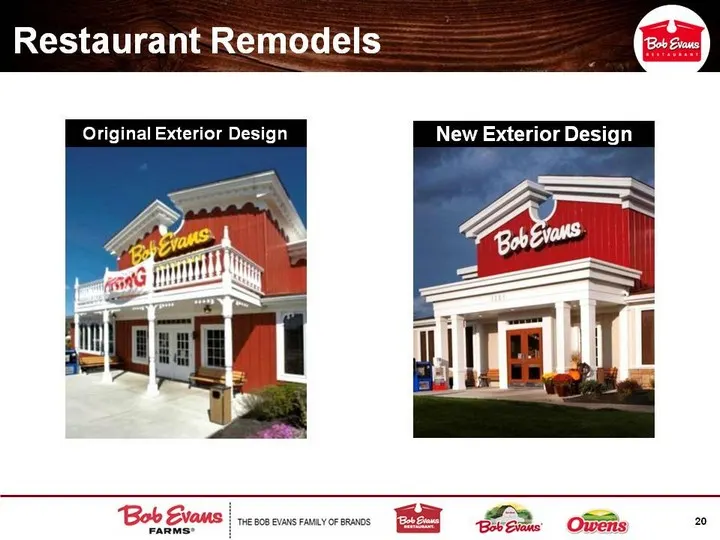
New Exterior Design Restaurant Remodels 20 Original Exterior Design
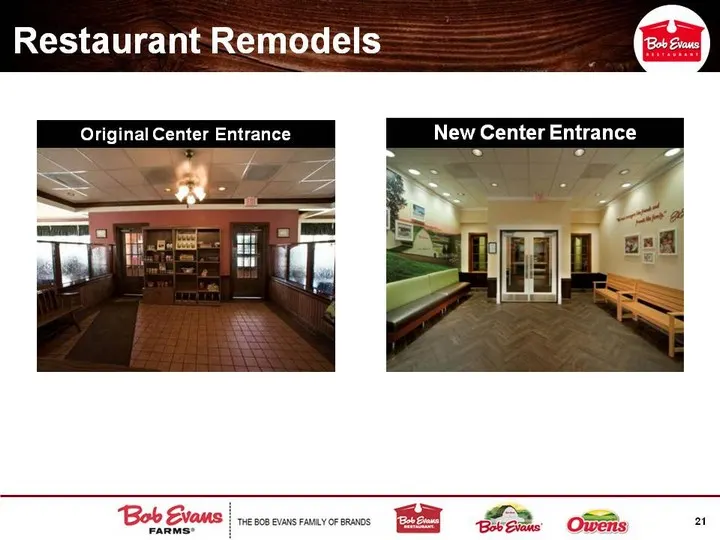
Slide 21: Restaurant Remodels New Center Entrance
Restaurant Remodels 21 New Center Entrance Original Center Entrance
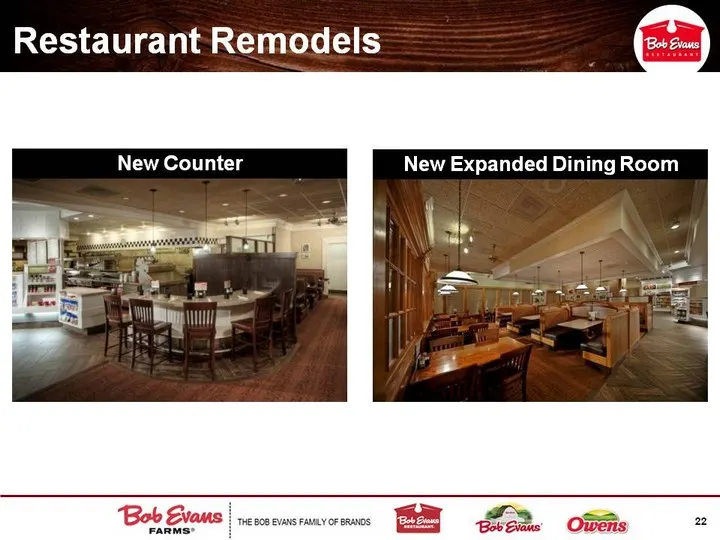
Slide 22: Restaurant Remodels New Expanded Dining Room
Restaurant Remodels 22 New Expanded Dining Room New Counter
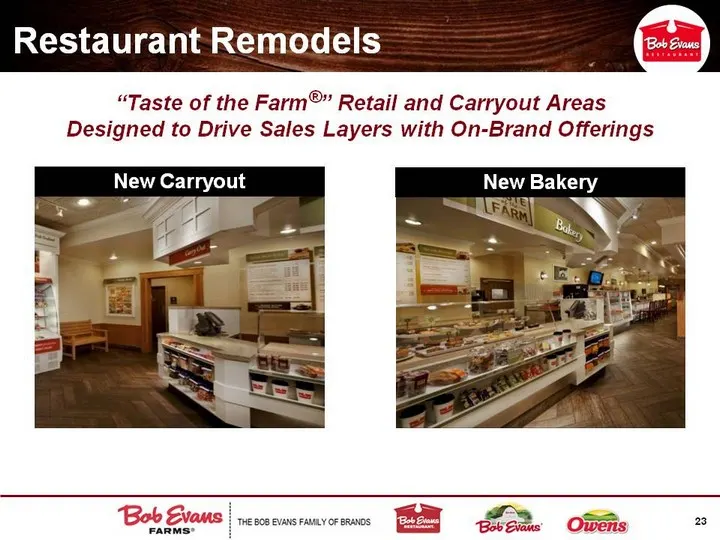
Slide 23: Restaurant Remodels New Bakery and Carryout
Restaurant Remodels 23 New Bakery New Carryout "Taste of the Farm " Retail and Carryout Areas Designed to Drive Sales Layers with On-Brand Offerings (r)
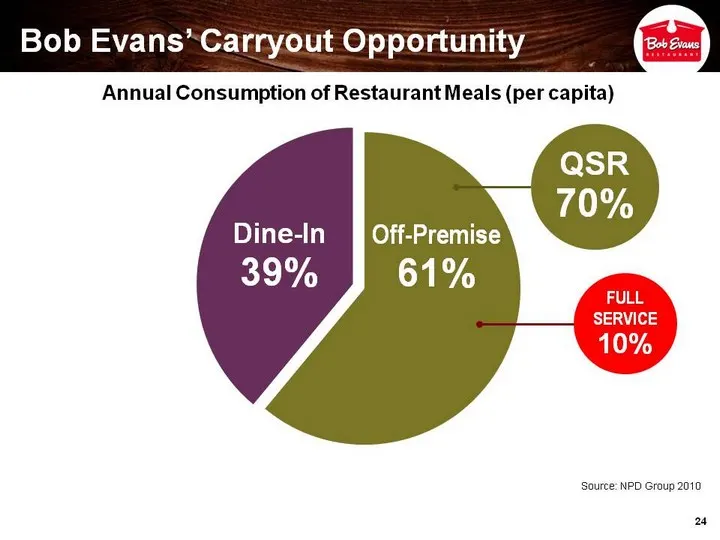
Slide 24: Bob Evans' Carryout Opportunity
Bob Evans' Carryout Opportunity 24 Annual Consumption of Restaurant Meals (per capita) Dine-In 39% Off-Premise 61% QSR 70% FULL SERVICE 10% Source: NPD Group 2010
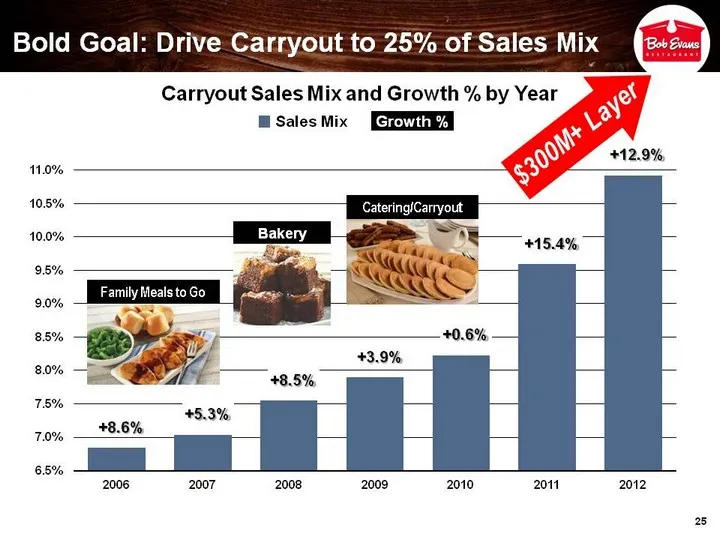
Slide 25: Bold Goal: Drive Carryout to 25% of Sales Mix
Bold Goal: Drive Carryout to 25% of Sales Mix 25 Bakery Family Meals to Go Carryout Sales Mix and Growth % by Year $300M+ Layer Sales Mix Growth % Catering/Carryout
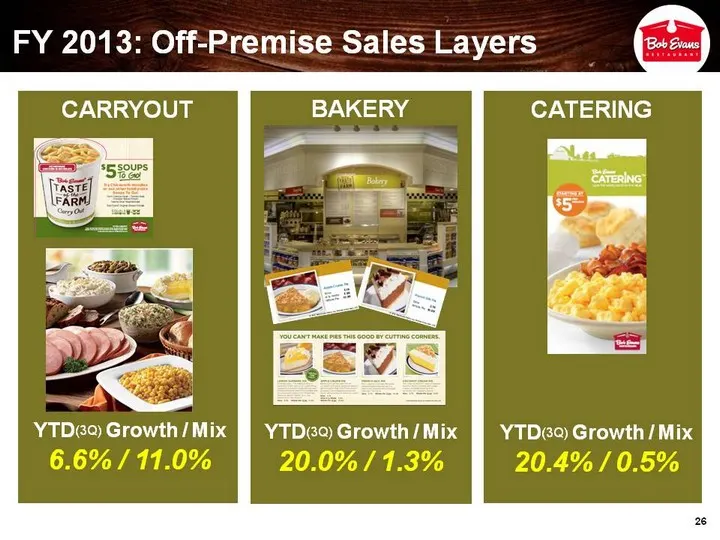
Slide 26: FY 2013: Off-Premise Sales Layers
FY 2013: Off-Premise Sales Layers 26 CATERING YTD(3Q) Growth / Mix 20.4% / 0.5% YTD(3Q) Growth / Mix 6.6% / 11.0% YTD(3Q) Growth / Mix 20.0% / 1.3% BAKERY
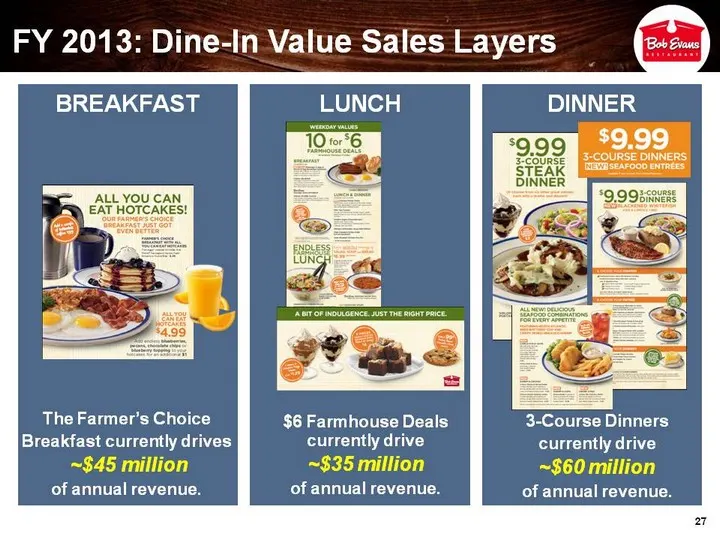
Slide 27: FY 2013: Dine-In Value Sales Layers
FY 2013: Dine-In Value Sales Layers BREAKFAST The Farmer's Choice Breakfast currently drives ~$45 million of annual revenue. LUNCH $6 Farmhouse Deals currently drive ~$35 million of annual revenue. DINNER 3-Course Dinners currently drive ~$60 million of annual revenue. 27
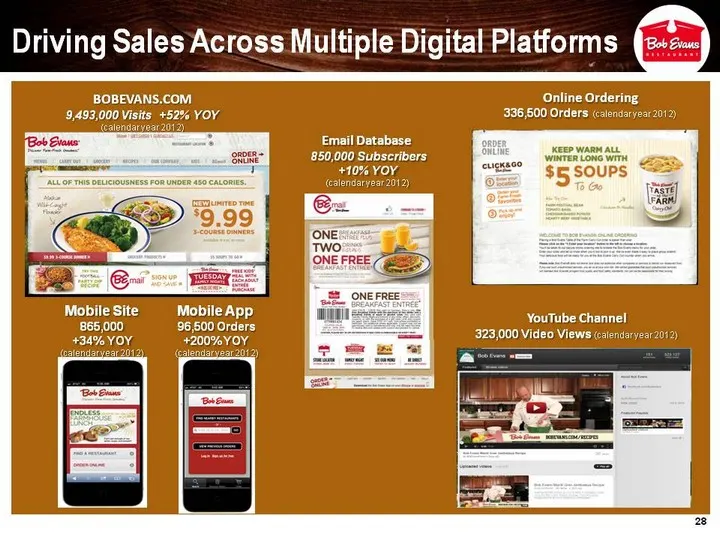
Slide 28: Driving Sales Across Multiple Digital Platforms
28 BOBEVANS.COM 9,493,000 Visits +52% YOY (calendar year 2012) Driving Sales Across Multiple Digital Platforms Online Ordering 336,500 Orders (calendar year 2012) Email Database 850,000 Subscribers +10% YOY (calendar year 2012) Mobile App 96,500 Orders +200% YOY (calendar year 2012) YouTube Channel
Slide 29: Social Media: A Key Component of Our Digital Strategy
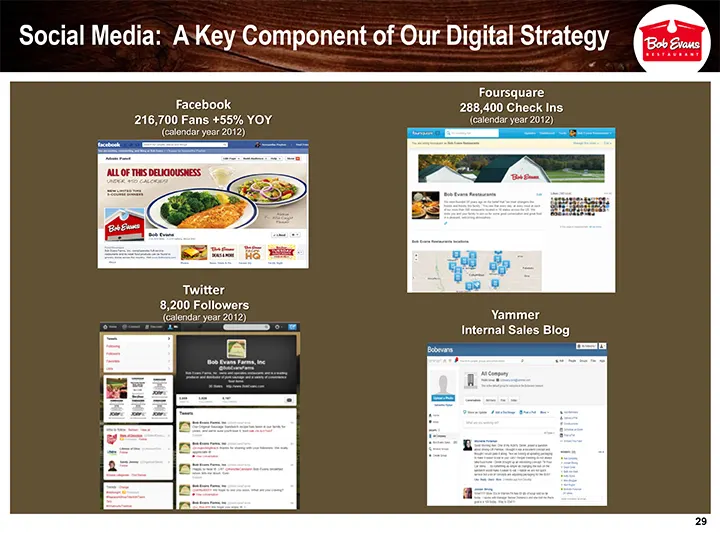
29 Social Media: A Key Component of Our Digital Strategy Facebook 216,700 Fans +55% YOY (calendar year 2012) Twitter 8,200 Followers (calendar year 2012) Foursquare 288,400 Check Ins (calendar year 2012) Yammer Internal Sales Blog
Slide 30: Consistently Driving Guest Satisfaction and Speed of Service
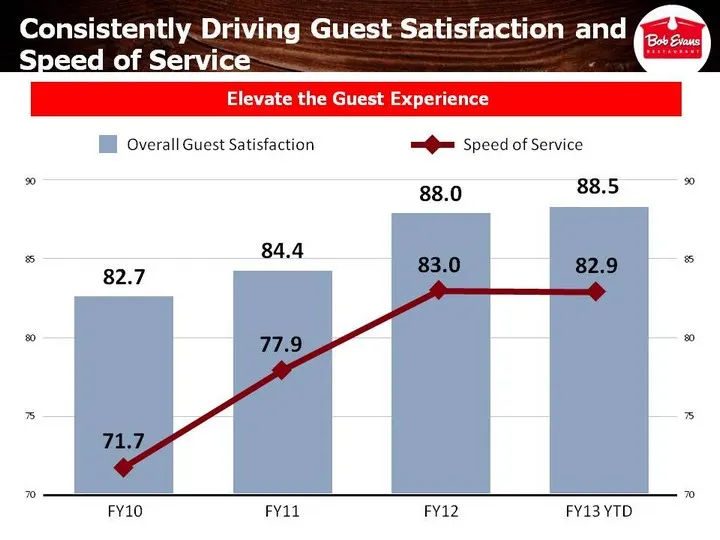
Consistently Driving Guest Satisfaction and Speed of Service 90 85 80 75 70 Overall Guest Satisfaction Speed of Service 90 85 80 75 70 FY10 FY11 FY12 FY13 YTD 82.7 84.4 88.0 88.5 71.7 77.9 83.0 82.9 Elevate the Guest Experience
Slide 31: New Restaurant Opening Strategy
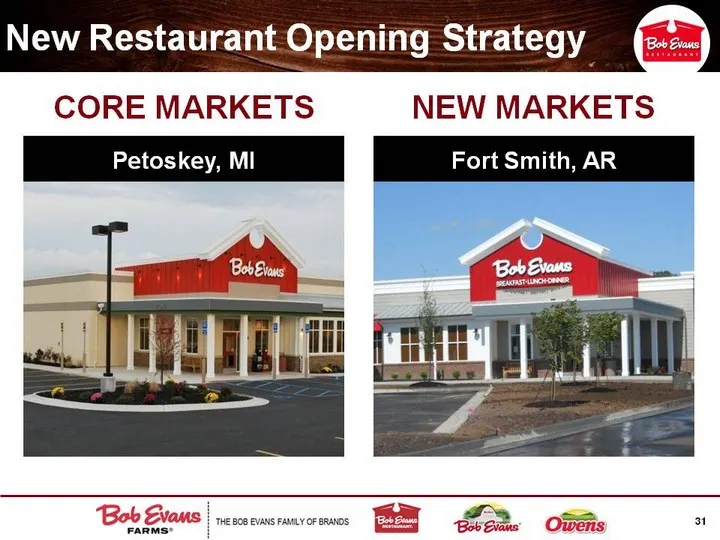
New Restaurant Opening Strategy 31 NEW MARKETS Fort Smith, AR CORE MARKETS Petoskey, MI
Slide 32: BEF Foods: Two Brands, Distinct Geographic Strengths
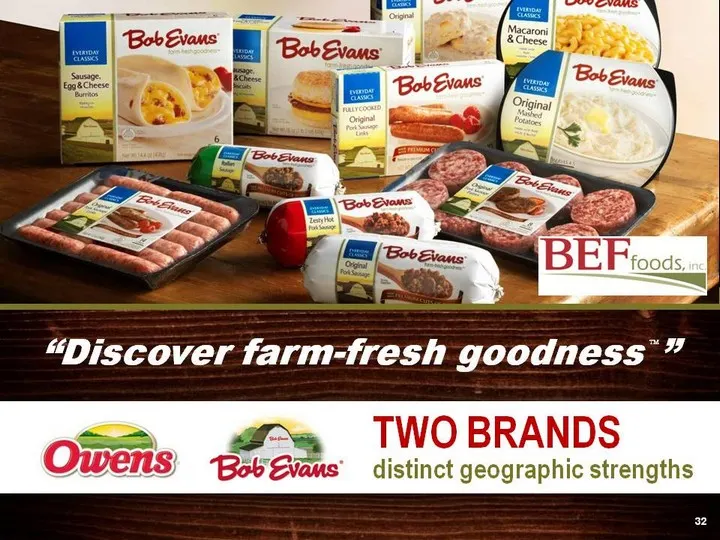
32 "Discover farm-fresh goodness " TWO BRANDS distinct geographic strengths TM
Slide 33: Overview: BEF Foods
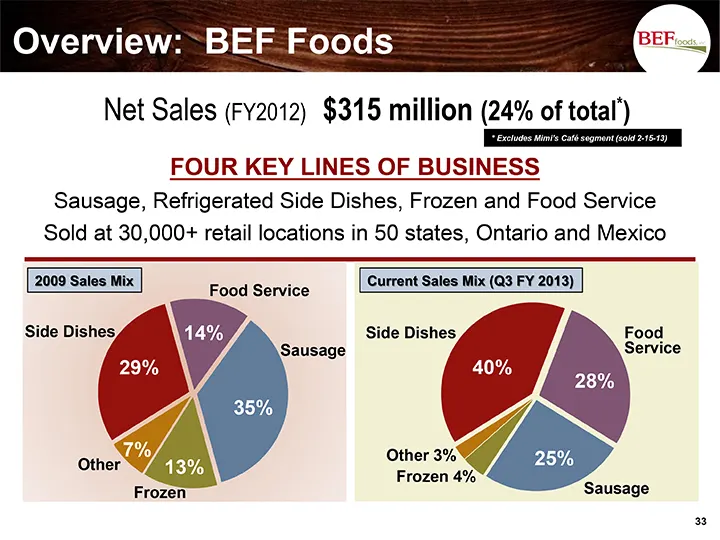
Overview: BEF Foods Net Sales (FY2012) $315 million (24% of total*) 33 FOUR KEY LINES OF BUSINESS Sausage, Refrigerated Side Dishes, Frozen and Food Service Sold at 30,000+ retail locations in 50 states, Ontario and Mexico * Excludes Mimi's Cafe segment (sold 2-15-13) Side Dishes Other 3% Frozen 4%
Slide 34: FY 2013: Vital Few Priorities
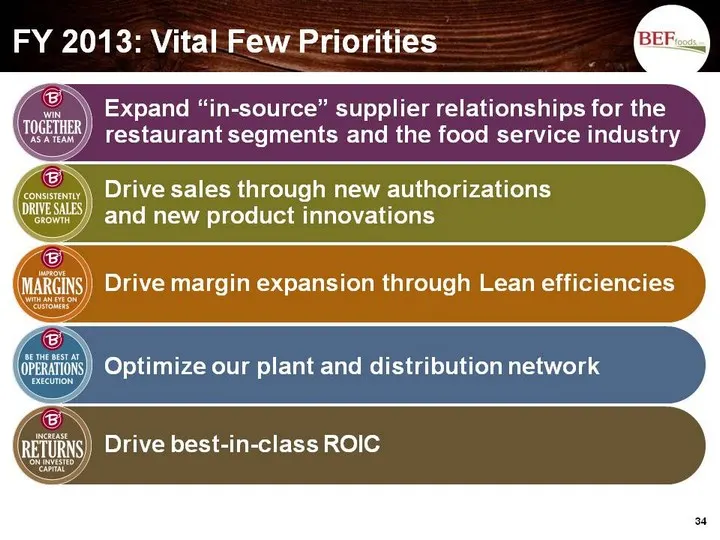
FY 2013: Vital Few Priorities 34 Expand "in-source" supplier relationships for the restaurant segments and the food service industry Drive sales through new authorizations and new product innovations Drive margin expansion through Lean efficiencies Optimize our plant and distribution network Drive b
Slide 35: Number of Grocery Stores Carrying BEF Foods Products
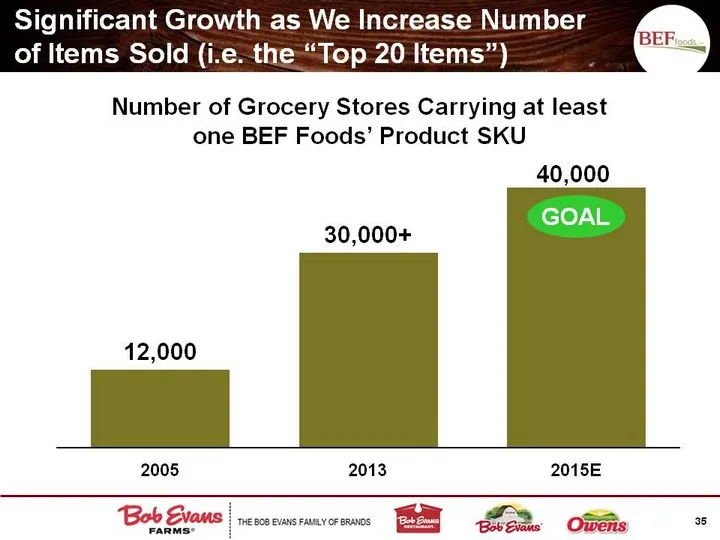
Number of Grocery Stores Carrying at least one BEF Foods' Product SKU 35 GOAL Significant Growth as We Increase Number of Items Sold (i.e. the "Top 20 Items")
Slide 36: Drive to 40,000!
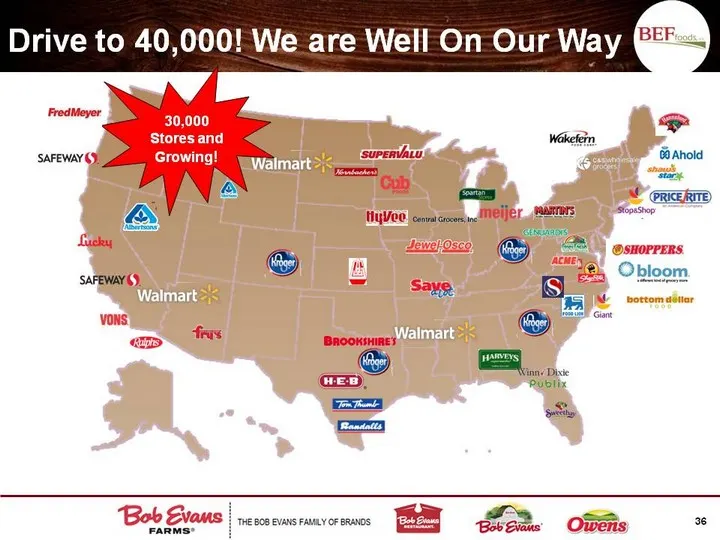
Drive to 40,000! We are Well On Our Way 30,000 Stores and Growing! 36
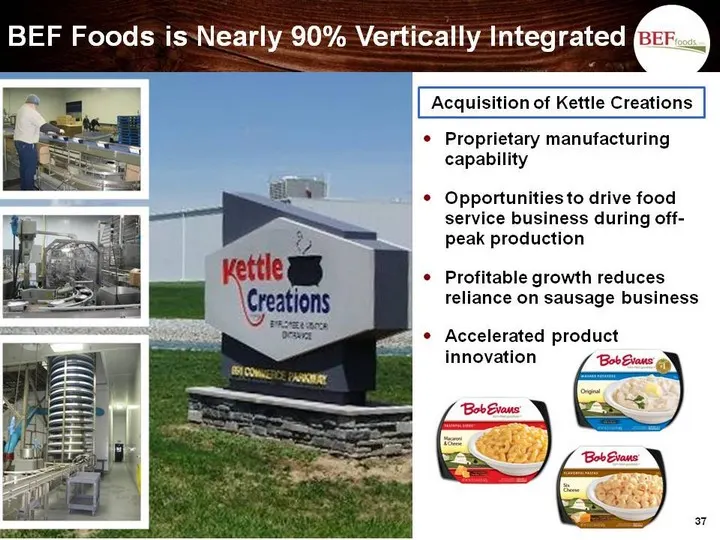
Slide 37: BEF Foods is Nearly 90% Vertically Integrated
BEF Foods is Nearly 90% Vertically Integrated 37 Proprietary manufacturing capability Opportunities to drive food service business during off- peak production Profitable growth reduces reliance on sausage business Accelerated product innovation Acquisition of Kettle Creations
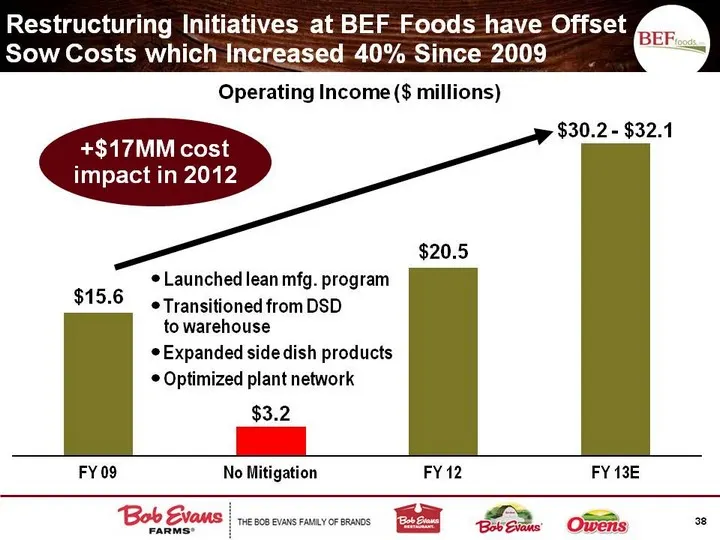
Slide 38: Restructuring Initiatives at BEF Foods Offset Sow Costs
Restructuring Initiatives at BEF Foods have Offset Sow Costs which Increased 40% Since 2009 38 Launched lean mfg. program Transitioned from DSD to warehouse Expanded side dish products Optimized plant network Operating Income ($ millions) +$17MM cost impact in 2012
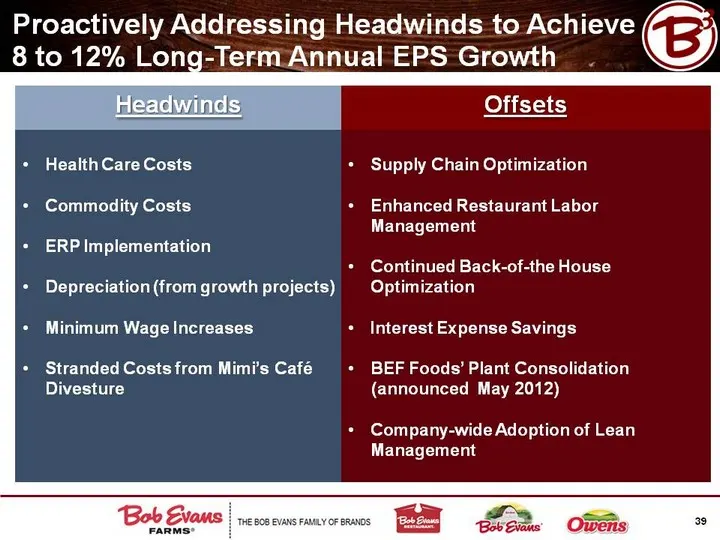
Slide 39: Proactively Addressing Headwinds to Achieve Long-Term EPS Growth
Proactively Addressing Headwinds to Achieve 8 to 12% Long-Term Annual EPS Growth 39 Health Care Costs Commodity Costs ERP Implementation Depreciation (from growth projects) Minimum Wage Increases Stranded Costs from Mimi's Cafe Divesture Headwinds Supply Chain Optimization Enhanced Restaurant Labor
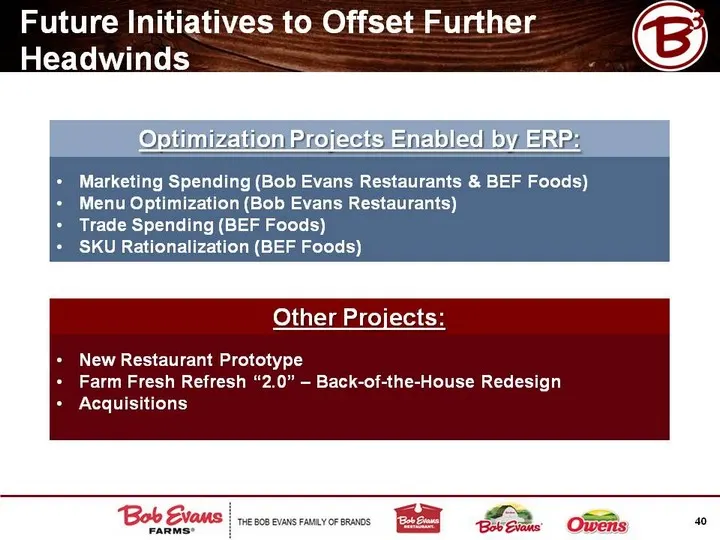
Slide 40: Future Initiatives to Offset Further Headwinds
Future Initiatives to Offset Further Headwinds 40 New Restaurant Prototype Farm Fresh Refresh "2.0" - Back-of-the-House Redesign Acquisitions Other Projects: Marketing Spending (Bob Evans Restaurants & BEF Foods) Menu Optimization (Bob Evans Restaurants) Trade Spending (BEF Foods) SKU Rationalizatio
Slide 41: Sales and Profit Growth Strategies
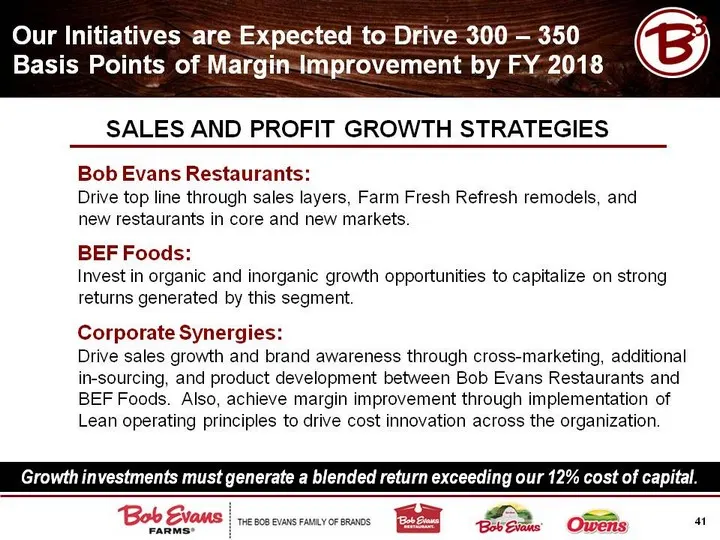
SALES AND PROFIT GROWTH STRATEGIES Bob Evans Restaurants: Drive top line through sales layers, Farm Fresh Refresh remodels, and new restaurants in core and new markets. BEF Foods: Invest in organic and inorganic growth opportunities to capitalize on strong returns generated by this segment. Corporat
Slide 42: 4Q FY 2013 Outlook
4Q FY 2013 Outlook
Slide 43: 4Q FY 2013 Outlook
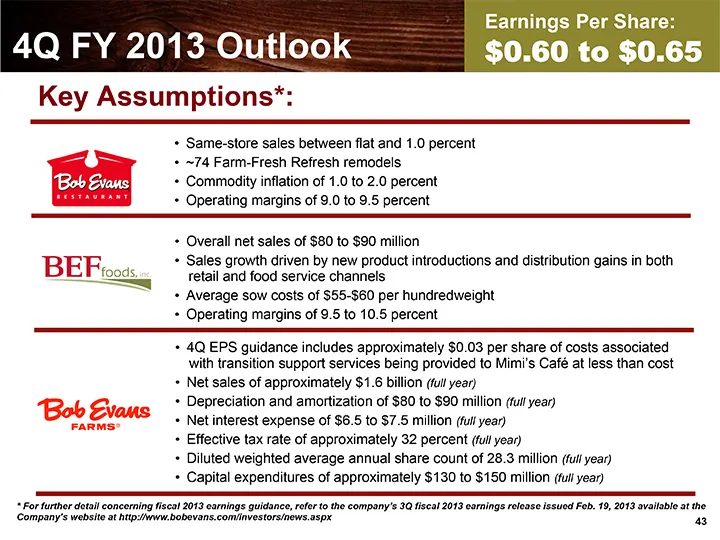
4Q FY 2013 Outlook 43 $0.60 to $0.65 Earnings Per Share: Same-store sales between flat and 1.0 percent ~74 Farm-Fresh Refresh remodels Commodity inflation of 1.0 to 2.0 percent Operating margins of 9.0 to 9.5 percent Key Assumptions*: Overall net sales of $80 to $90 million Sales growth driven by ne
Slide 44: Our Shareholder Value Creation Goal
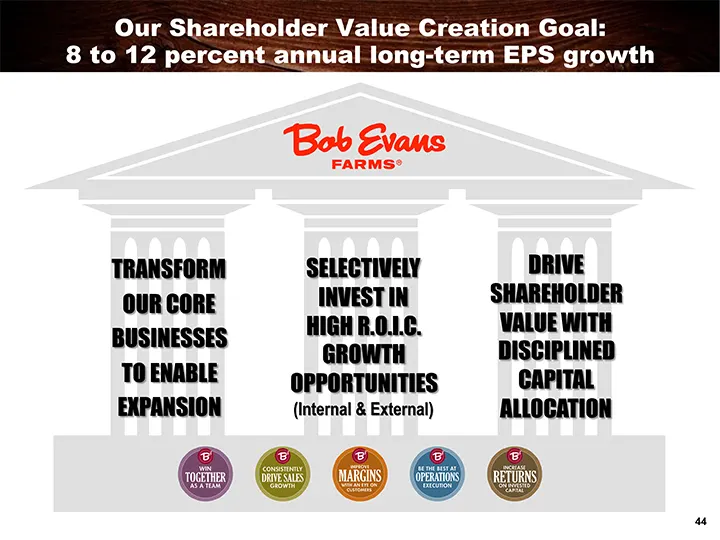
Our Shareholder Value Creation Goal: 8 to 12 percent annual long-term EPS growth 44 TRANSFORM OUR CORE BUSINESSES TO ENABLE EXPANSION DRIVE SHAREHOLDER VALUE WITH DISCIPLINED CAPITAL ALLOCATION SELECTIVELY INVEST IN HIGH R.O.I.C. GROWTH OPPORTUNITIES (Internal & External)
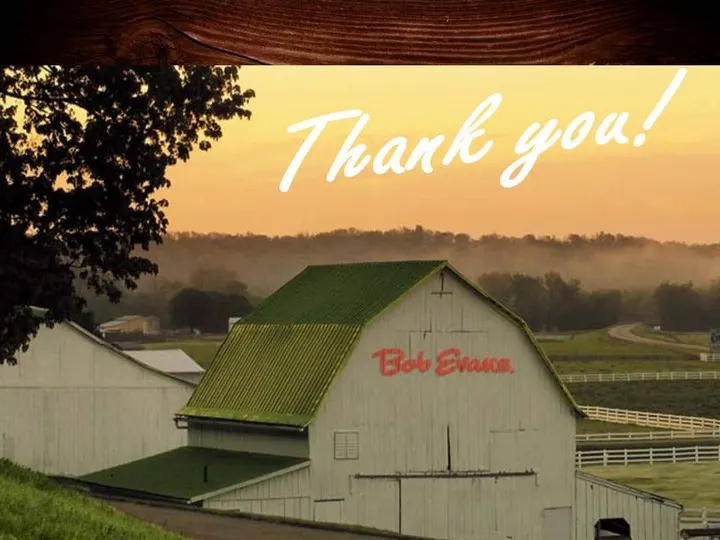
Slide 45: Thank you!
45 Thank you!
Source: SEC EDGAR · 8-K filed Mar 18, 2013
More decks from Bob Evans Farms Inc
 Merger or Acquisition (September 2017)18 slides · Sep 28, 2017
 Merger or Acquisition (September 2017)12 slides · Sep 19, 2017
 Merger or Acquisition (September 2017)17 slides · Sep 19, 2017
 Merger or Acquisition (September 2017)10 slides · Sep 19, 2017
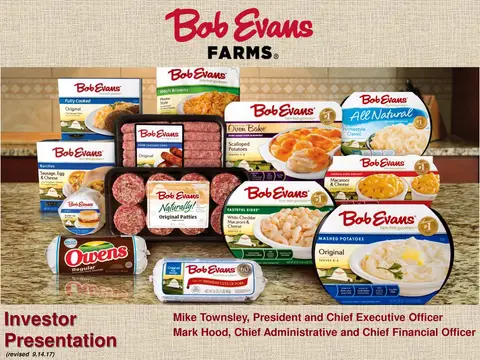 Investor Presentation (September 2017)32 slides · Sep 14, 2017
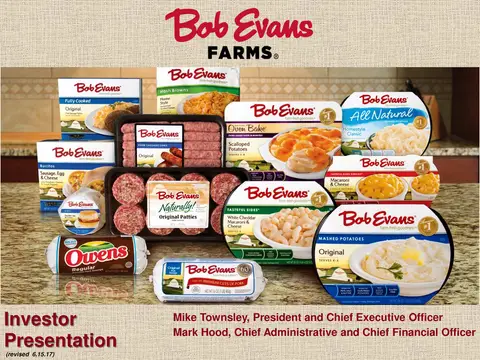 Investor Presentation (June 2017)30 slides · Jun 15, 2017