CH Energy — Q3 2010 Earnings Presentation
35 slides from CH Energy's earnings presentation, Oct 28, 2010

Slide 1
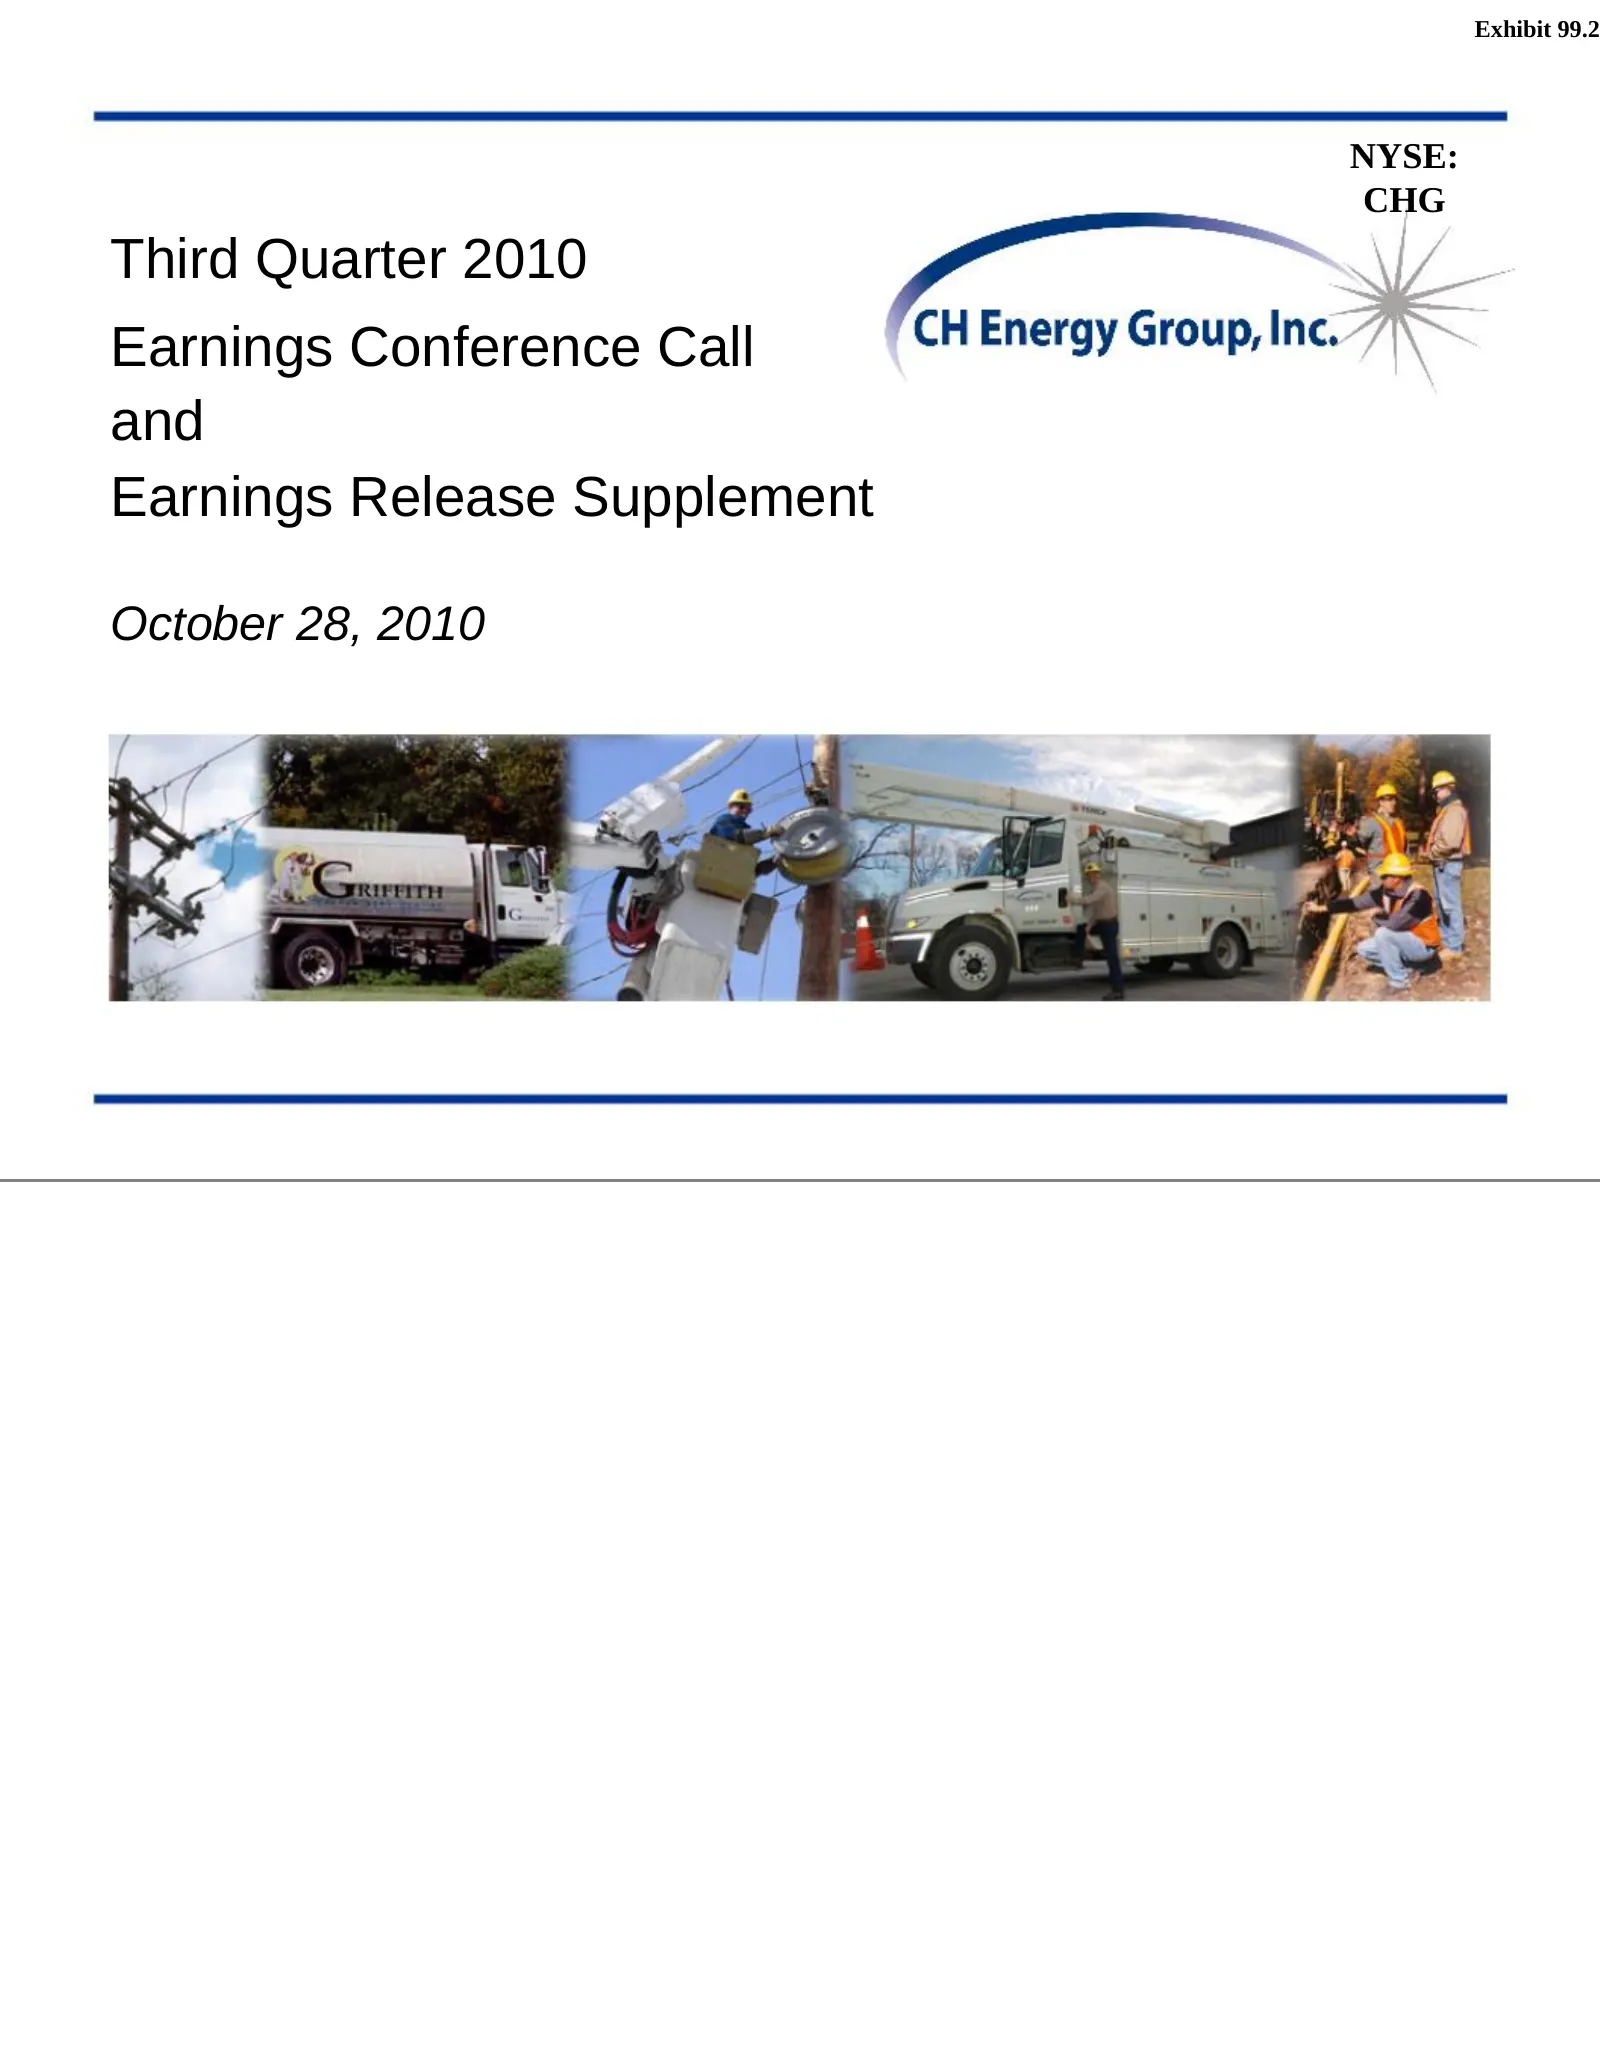
Slide 2: Third Quarter 2010 Earnings Conference Call and Earnings Release Supplement
Exhibit 99.2 NYSE: CHG Third Quarter 2010 Earnings Conference Call and Earnings Release Supplement October 28, 2010
Slide 3: Today's Agenda
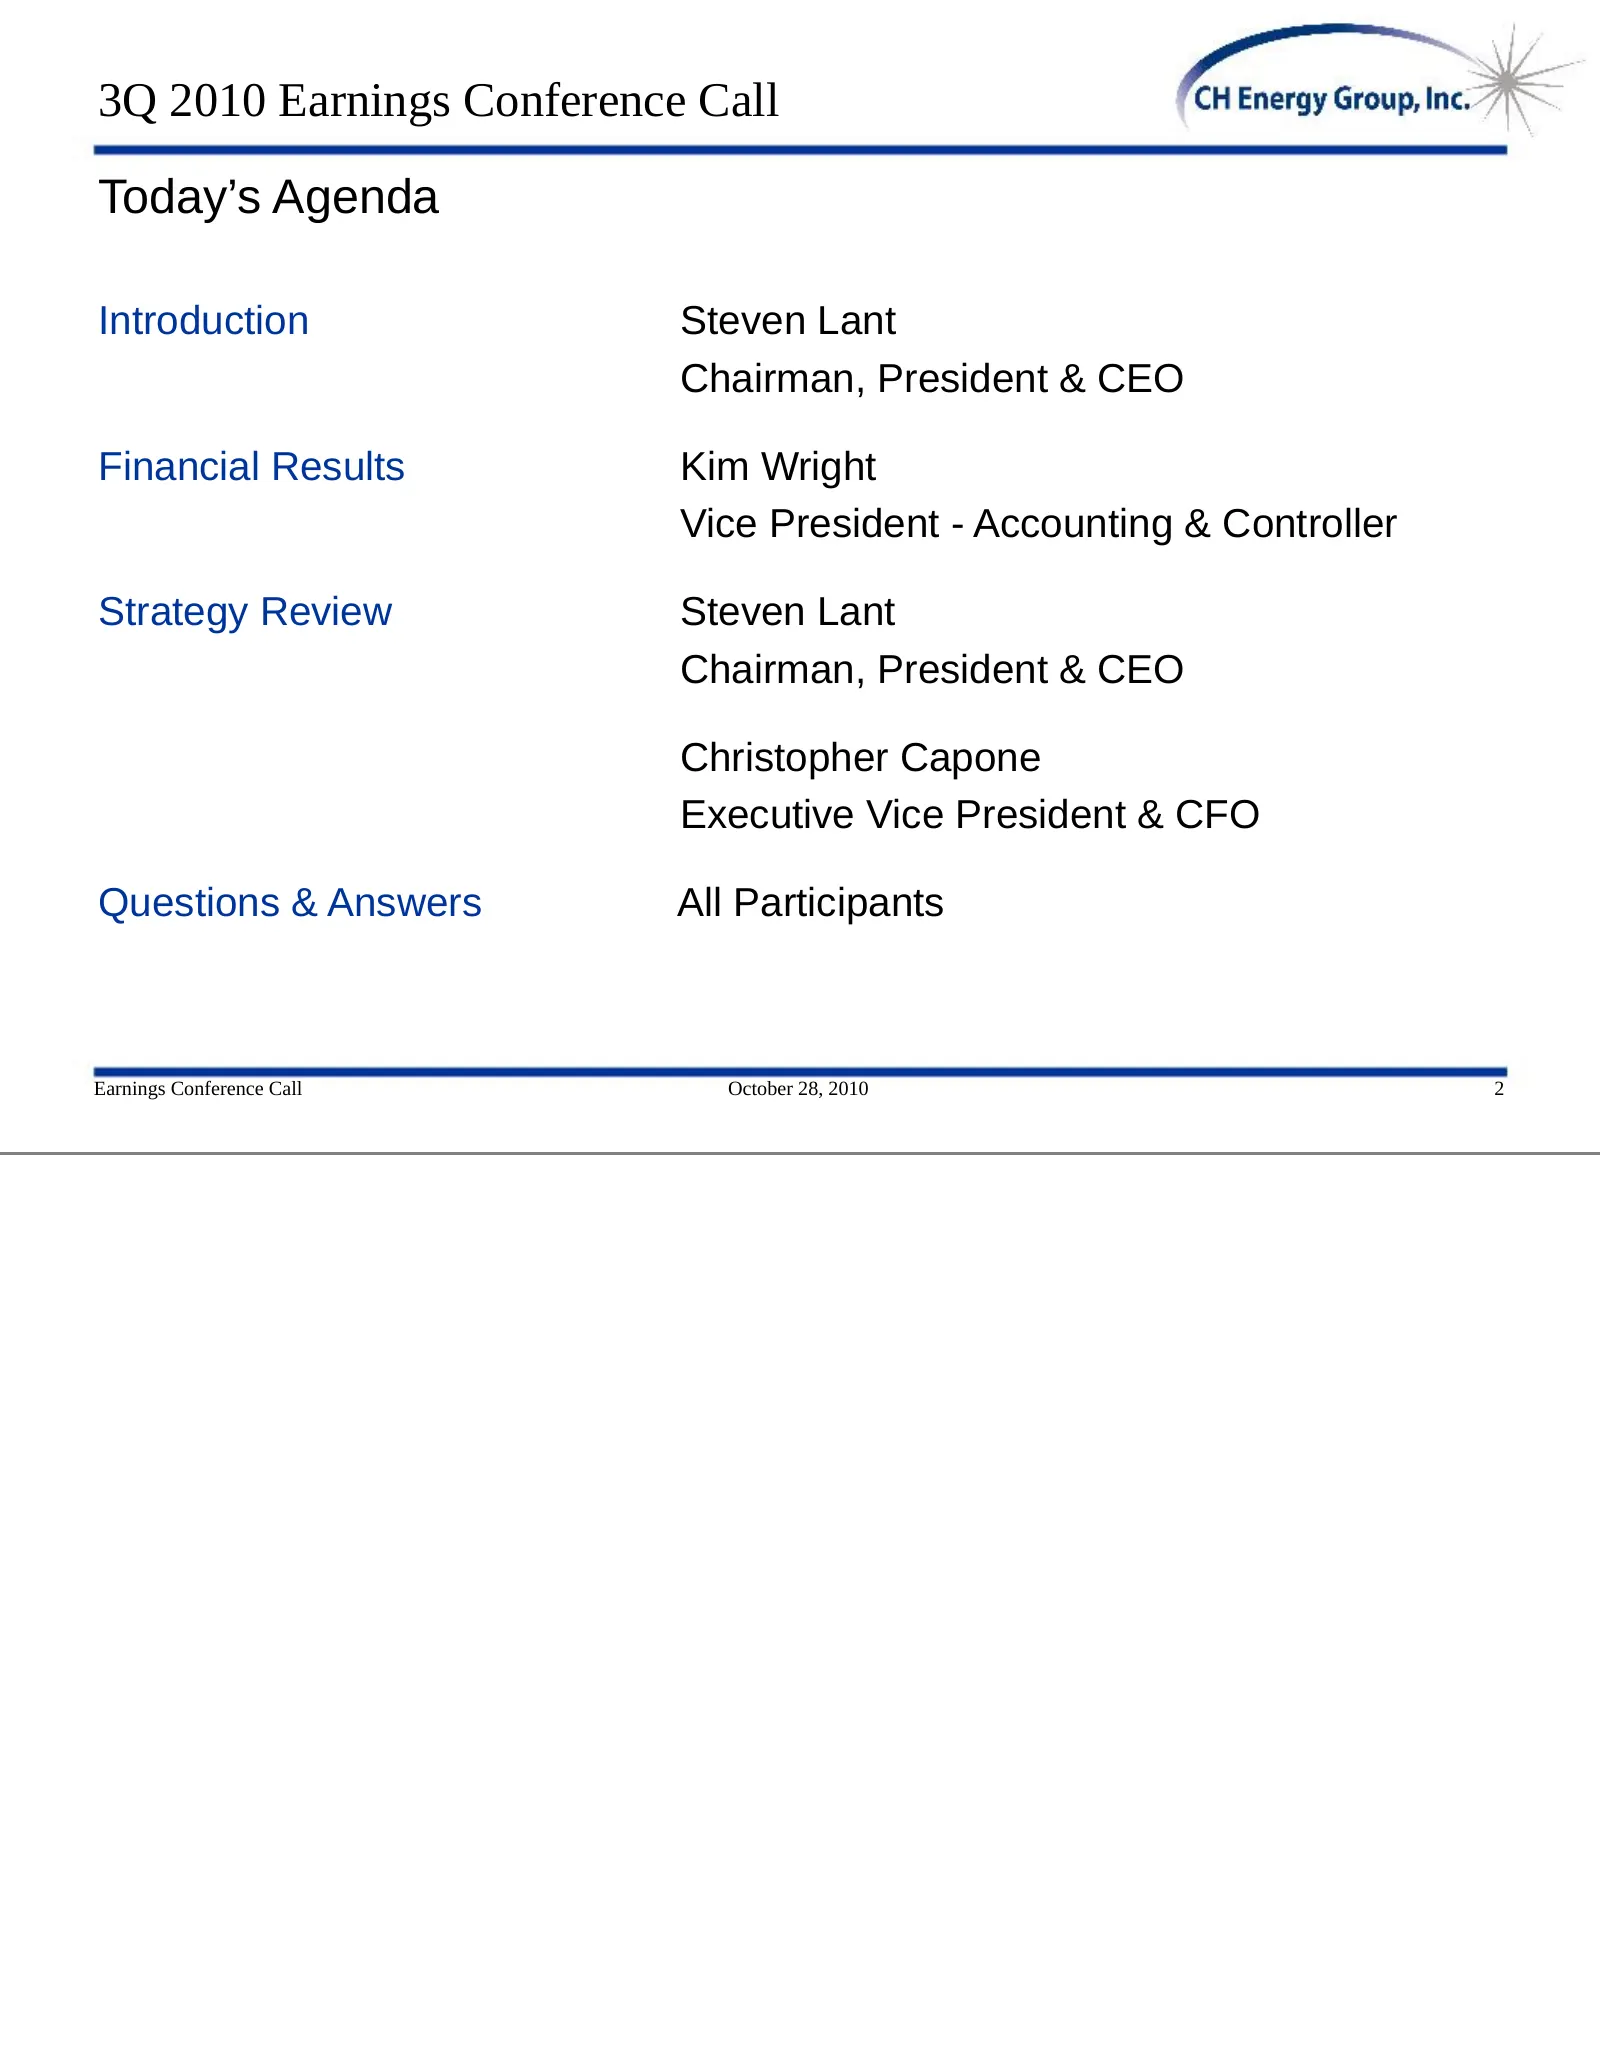
3Q 2010 Earnings Conference Call Today’s Agenda Introduction Steven Lant Chairman, President & CEO Financial Results Kim Wright Vice President - Accounting & Controller Strategy Review Steven Lant Chairman, President & CEO Christopher Capone Executive Vice President & CFO Questions & Answers All Par
Slide 4: Forward-looking Statements
Forward-looking Statements Statements included in this presentation which are not historical in nature are intended to be, and are hereby identified as, “forward-looking statements” for purposes of the safe harbor provided by Section 21E of the Exchange Act. Forward-looking statements may be identif
Slide 5: Introduction: Earnings Per Share for Third Quarter 2010 and Nine Months
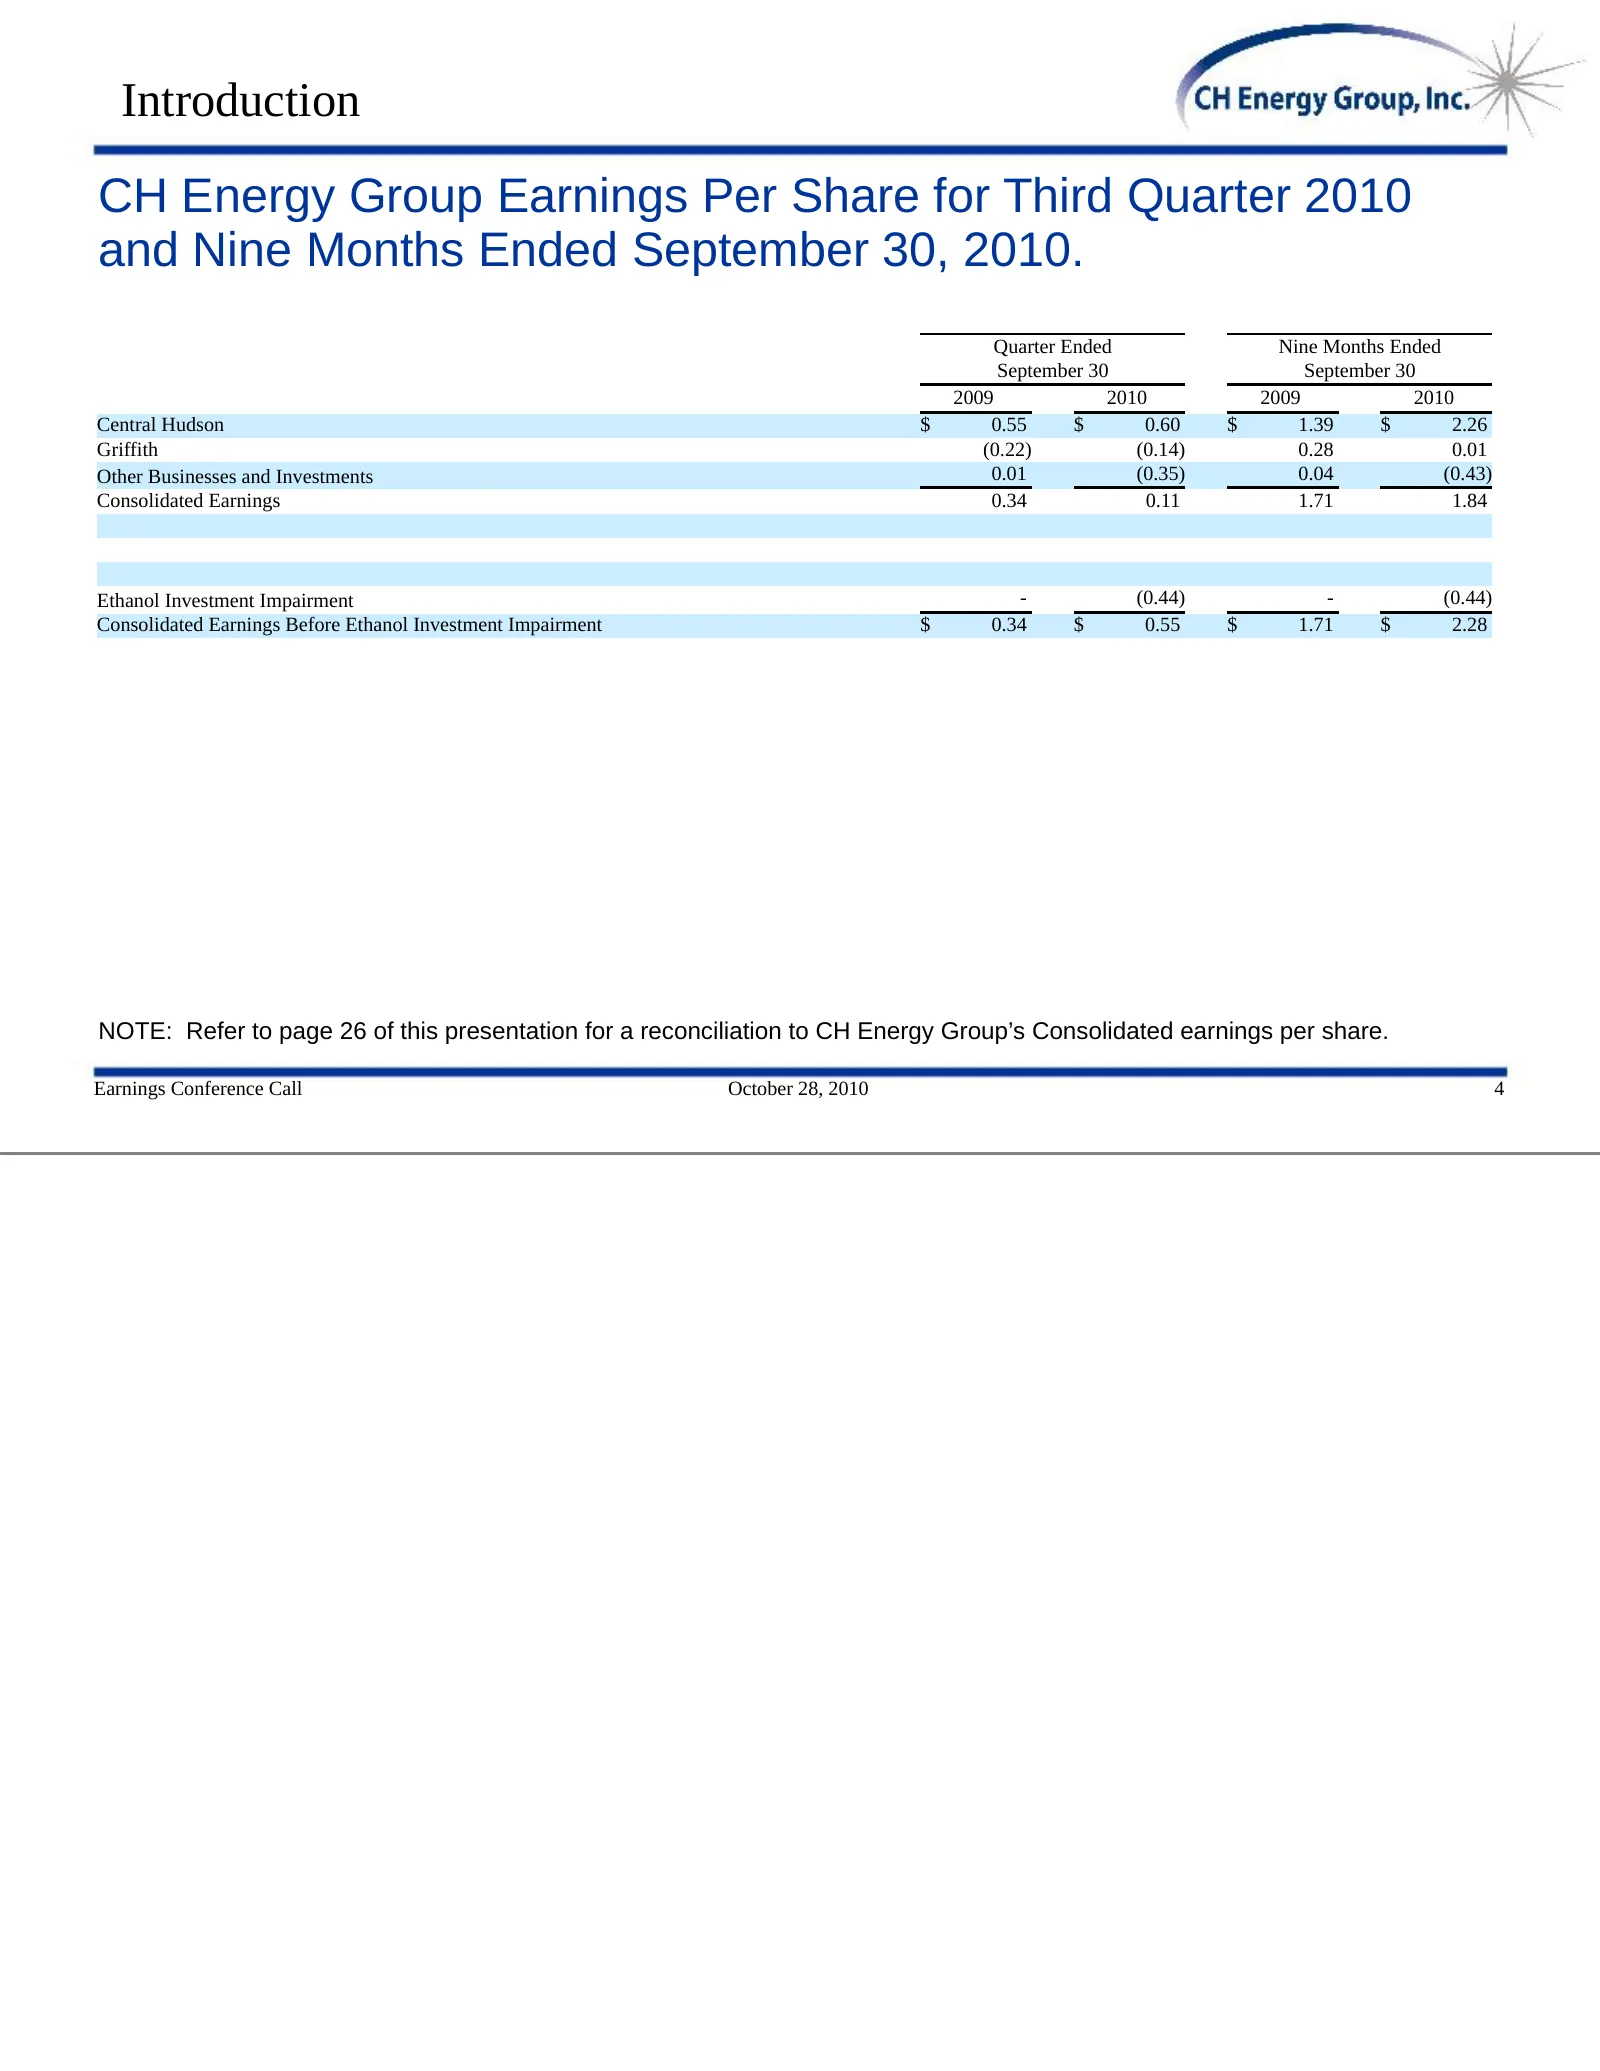
Introduction CH Energy Group Earnings Per Share for Third Quarter 2010 and Nine Months Ended September 30, 2010. Quarter Ended Nine Months Ended September 30 September 30 2009 2010 2009 2010 Central Hudson $ 0.55 $ 0.60 $ 1.39 $ 2.26 Griffith (0.22) (0.14) 0.28 0.01 Other Businesses and Investments
Slide 6: Financial Results - CH Energy Group
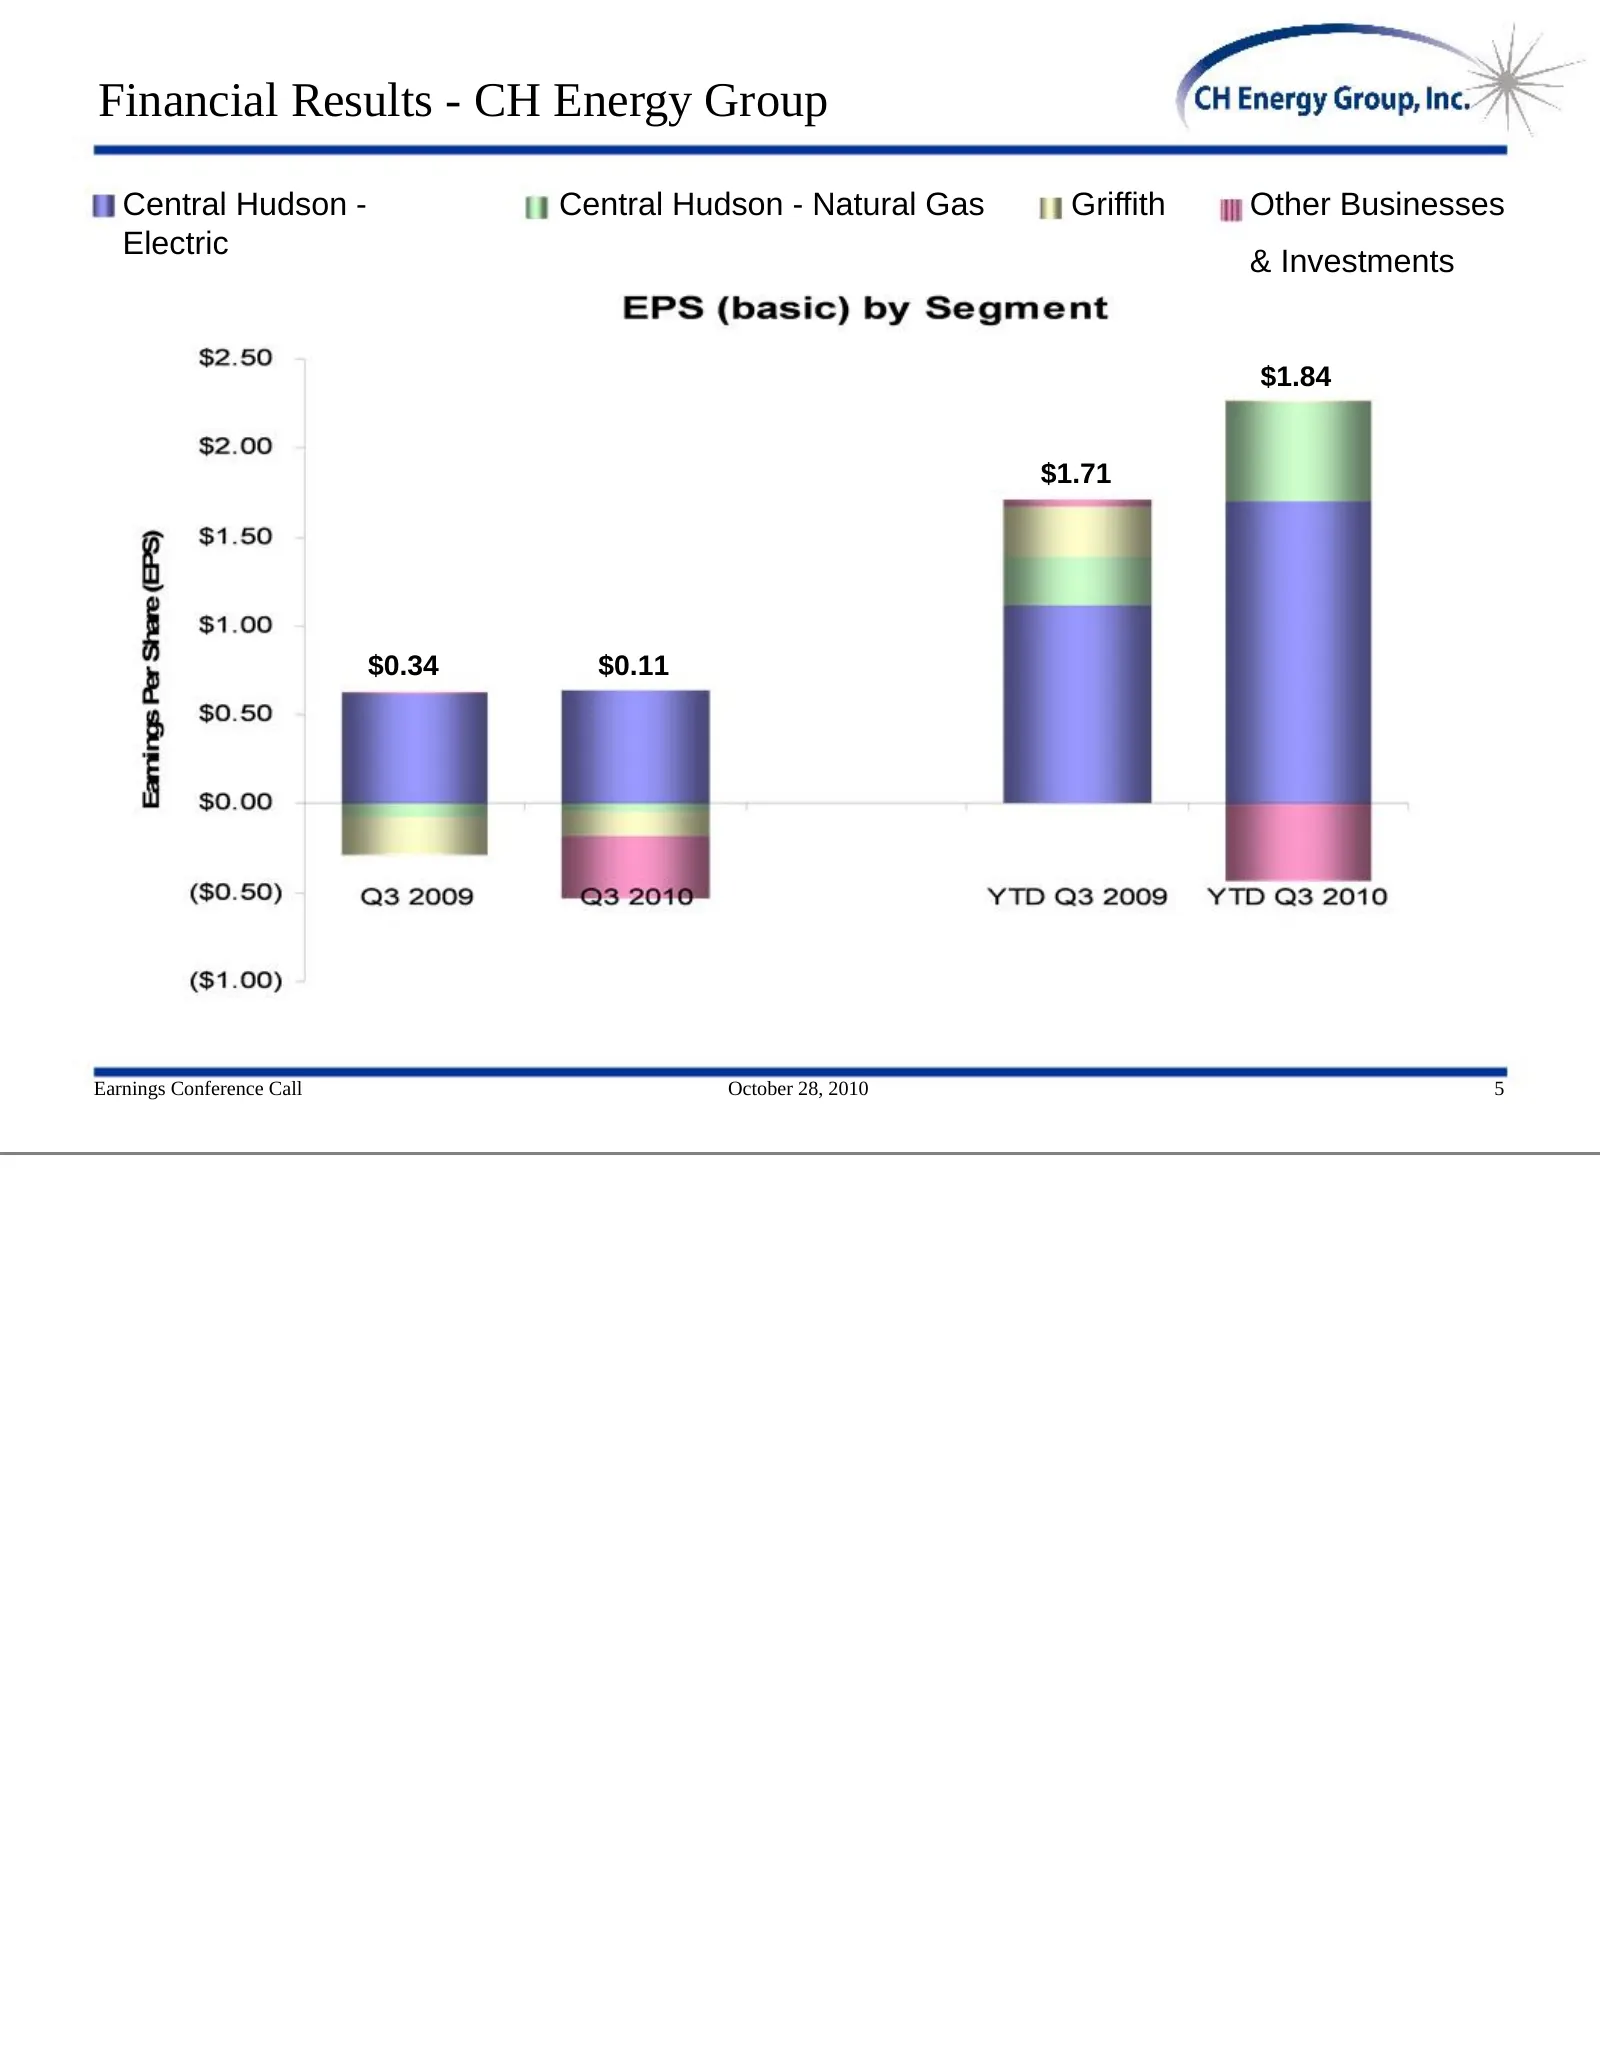
Financial Results - CH Energy Group Central Hudson - Central Hudson - Natural Gas Griffith Other Businesses Electric & Investments $1.84 $1.71 $0.34 $0.11 Earnings Conference Call October 28, 2010 5
Slide 7: Financial Results - Central Hudson
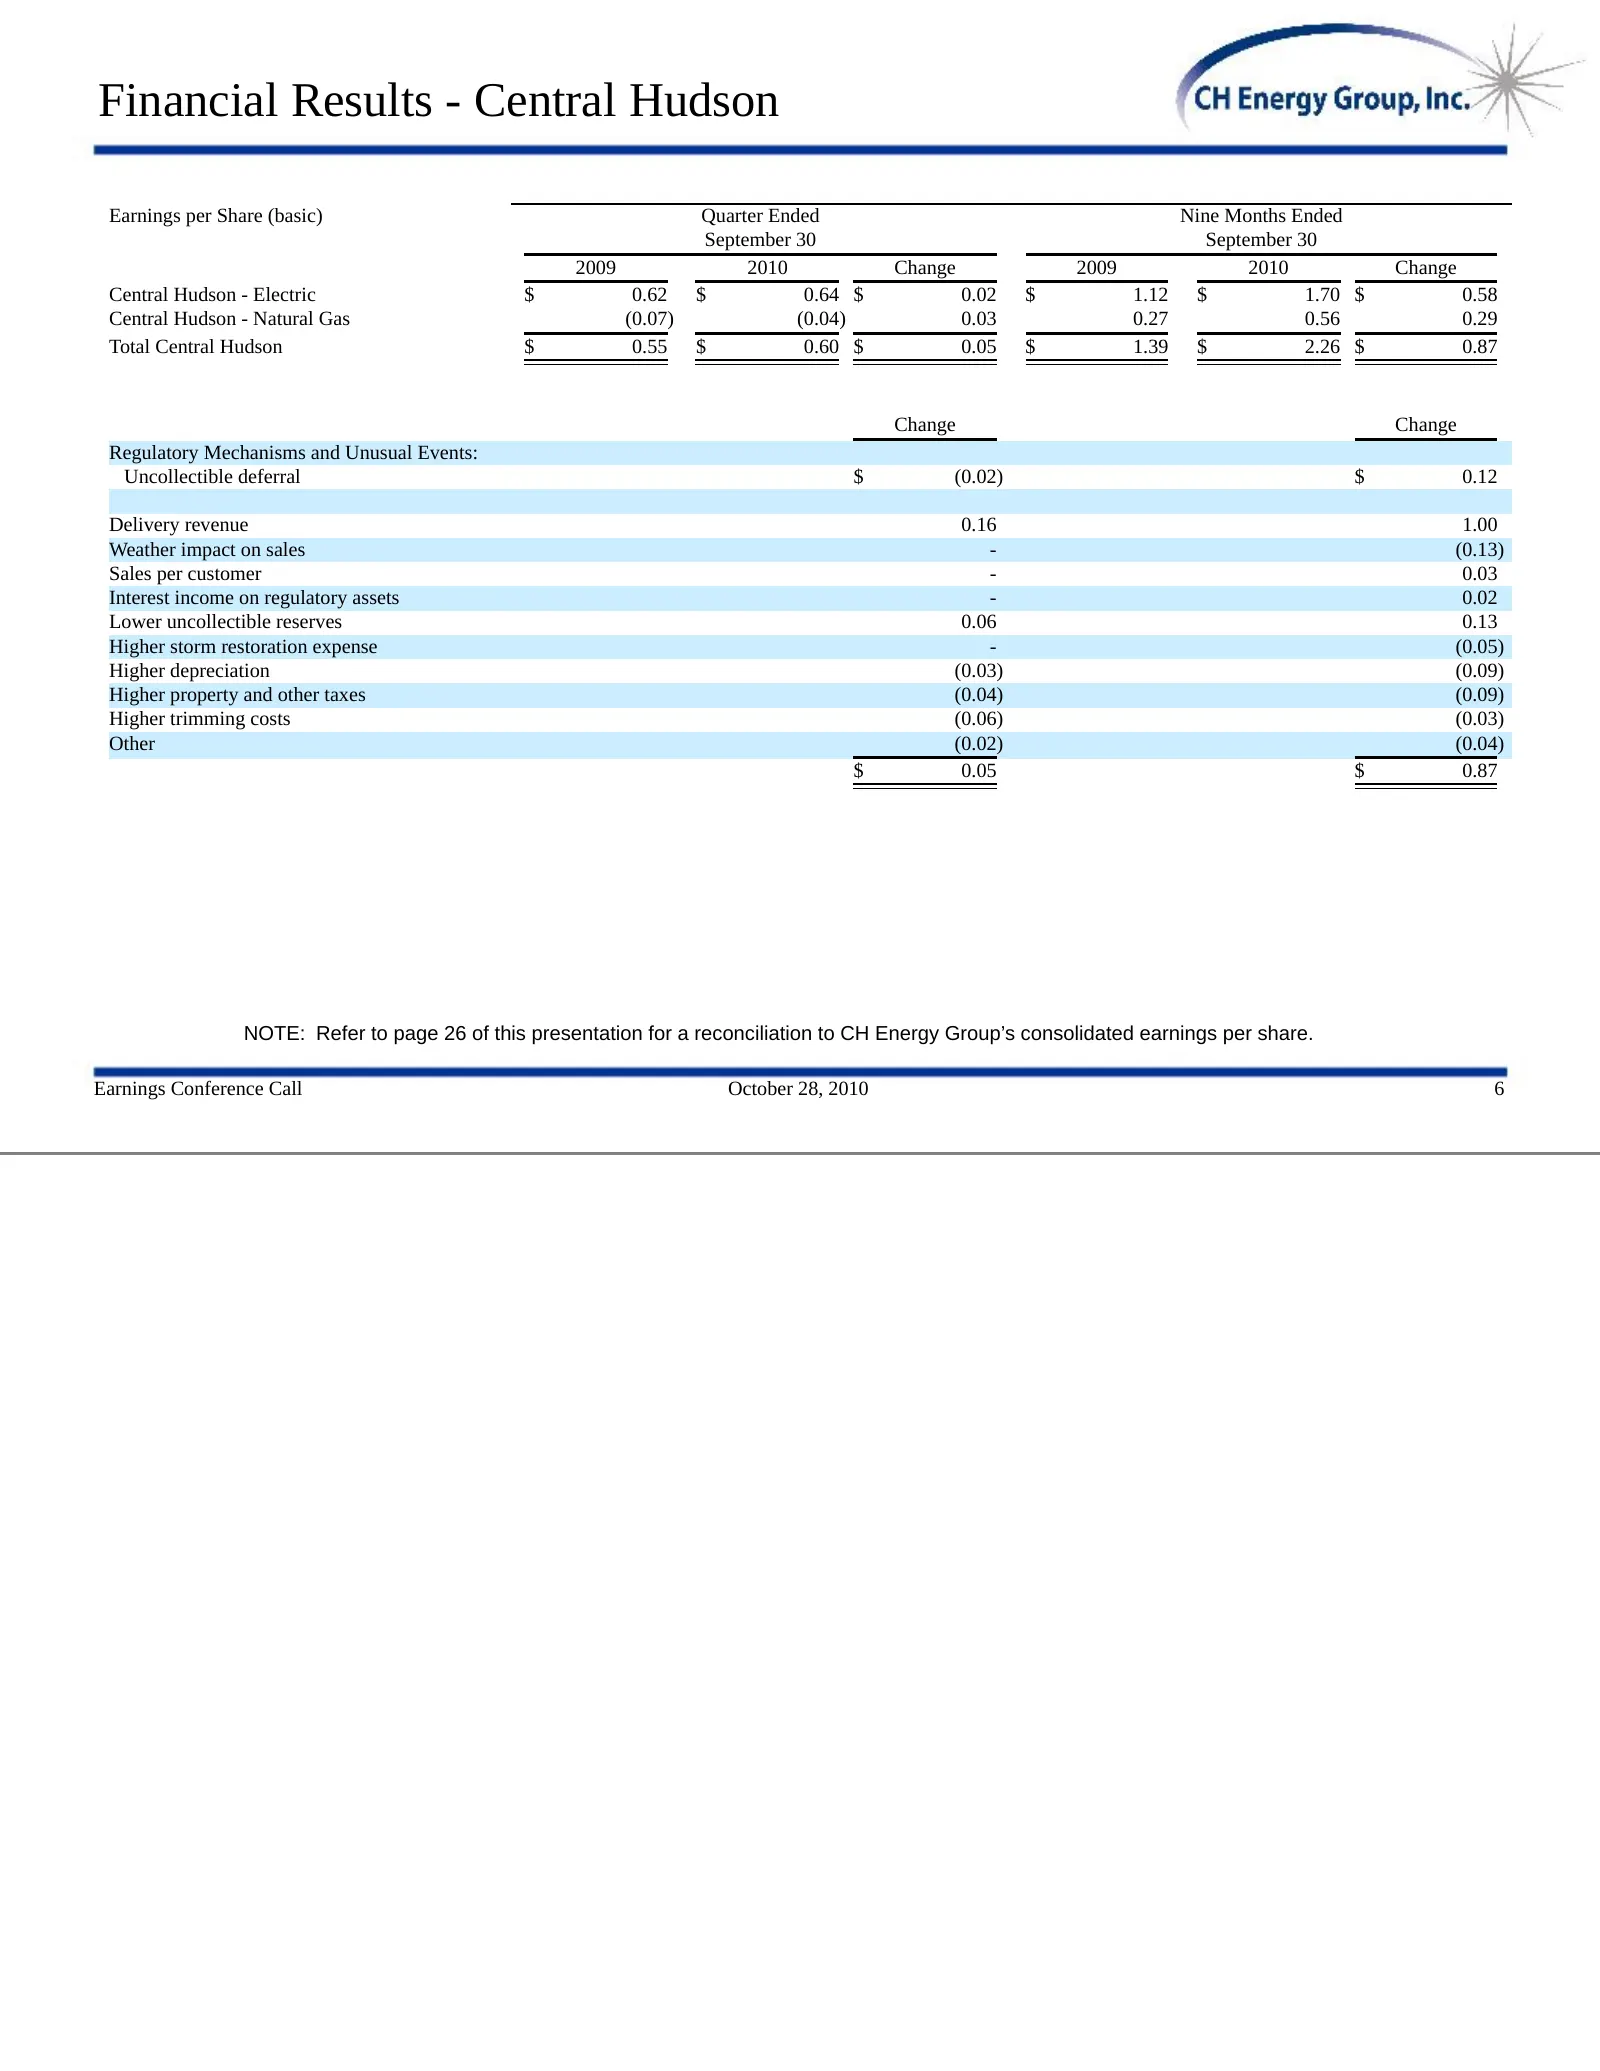
Financial Results - Central Hudson Earnings per Share (basic) Quarter Ended Nine Months Ended September 30 September 30 2009 2010 Change 2009 2010 Change Central Hudson - Electric $ 0.62 $ 0.64 $ 0.02 $ 1.12 $ 1.70 $ 0.58 Central Hudson - Natural Gas (0.07) (0.04) 0.03 0.27 0.56 0.29 Total Central H
Slide 8: Financial Results - Griffith
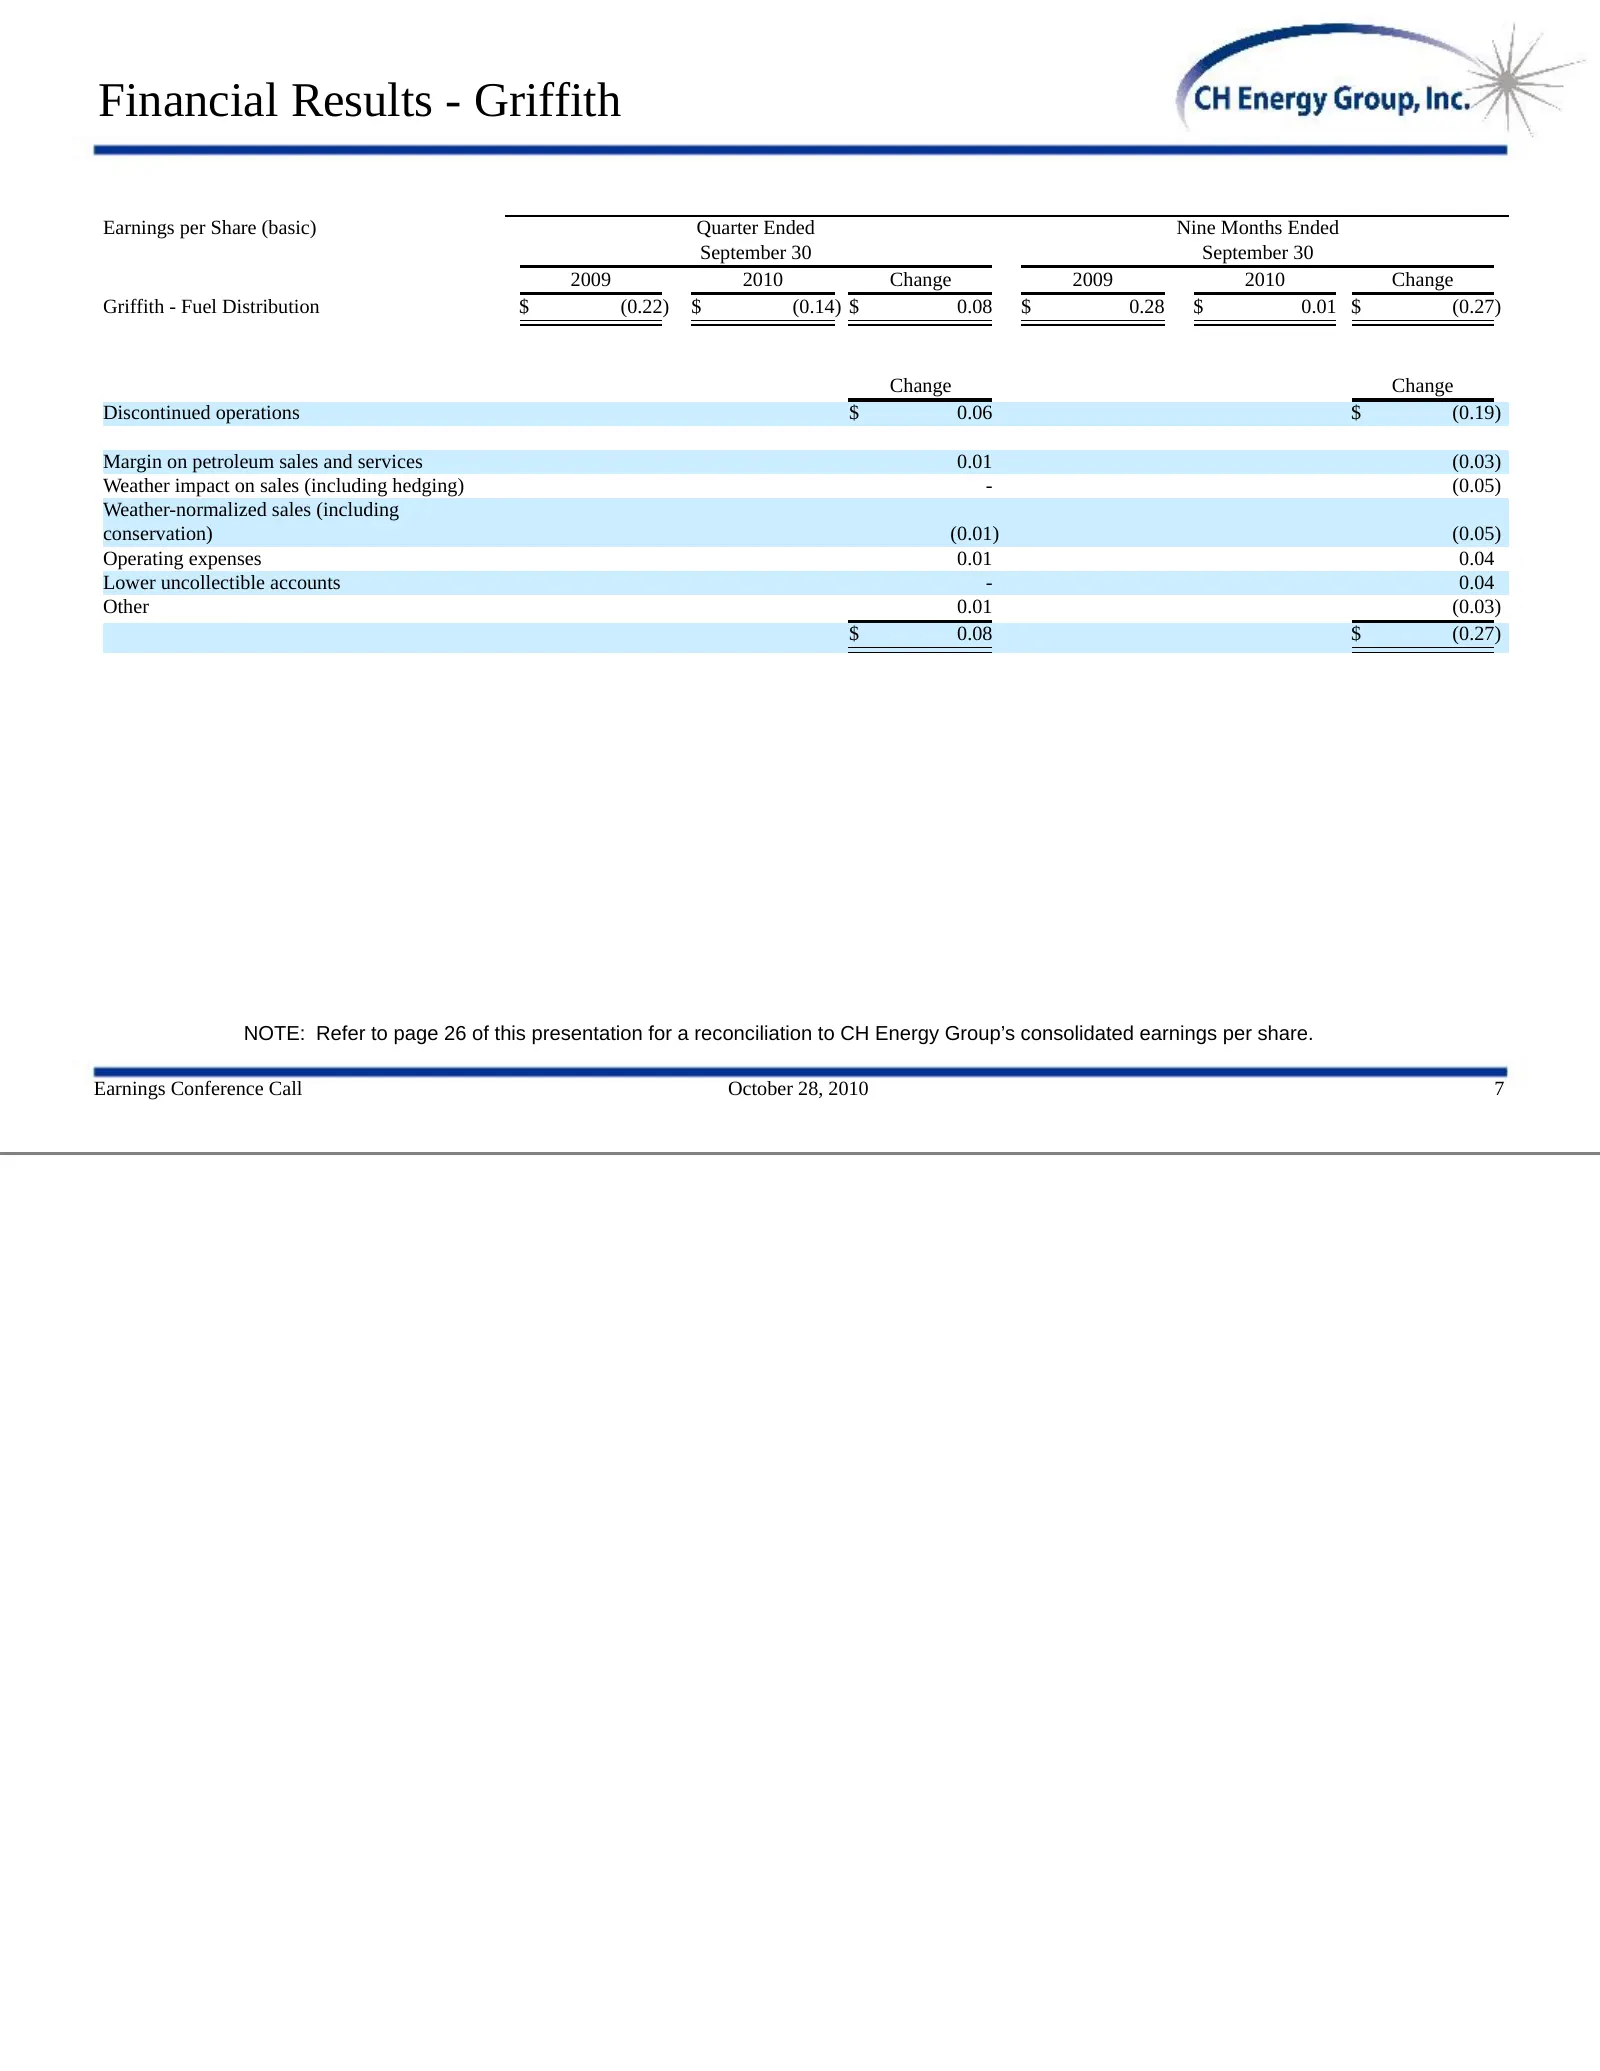
Financial Results - Griffith Earnings per Share (basic) Quarter Ended Nine Months Ended September 30 September 30 2009 2010 Change 2009 2010 Change Griffith - Fuel Distribution $ (0.22) $ (0.14) $ 0.08 $ 0.28 $ 0.01 $ (0.27) Change Change Discontinued operations $ 0.06 $ (0.19) Margin on petroleum s
Slide 9: Financial Results - Other Businesses & Investments
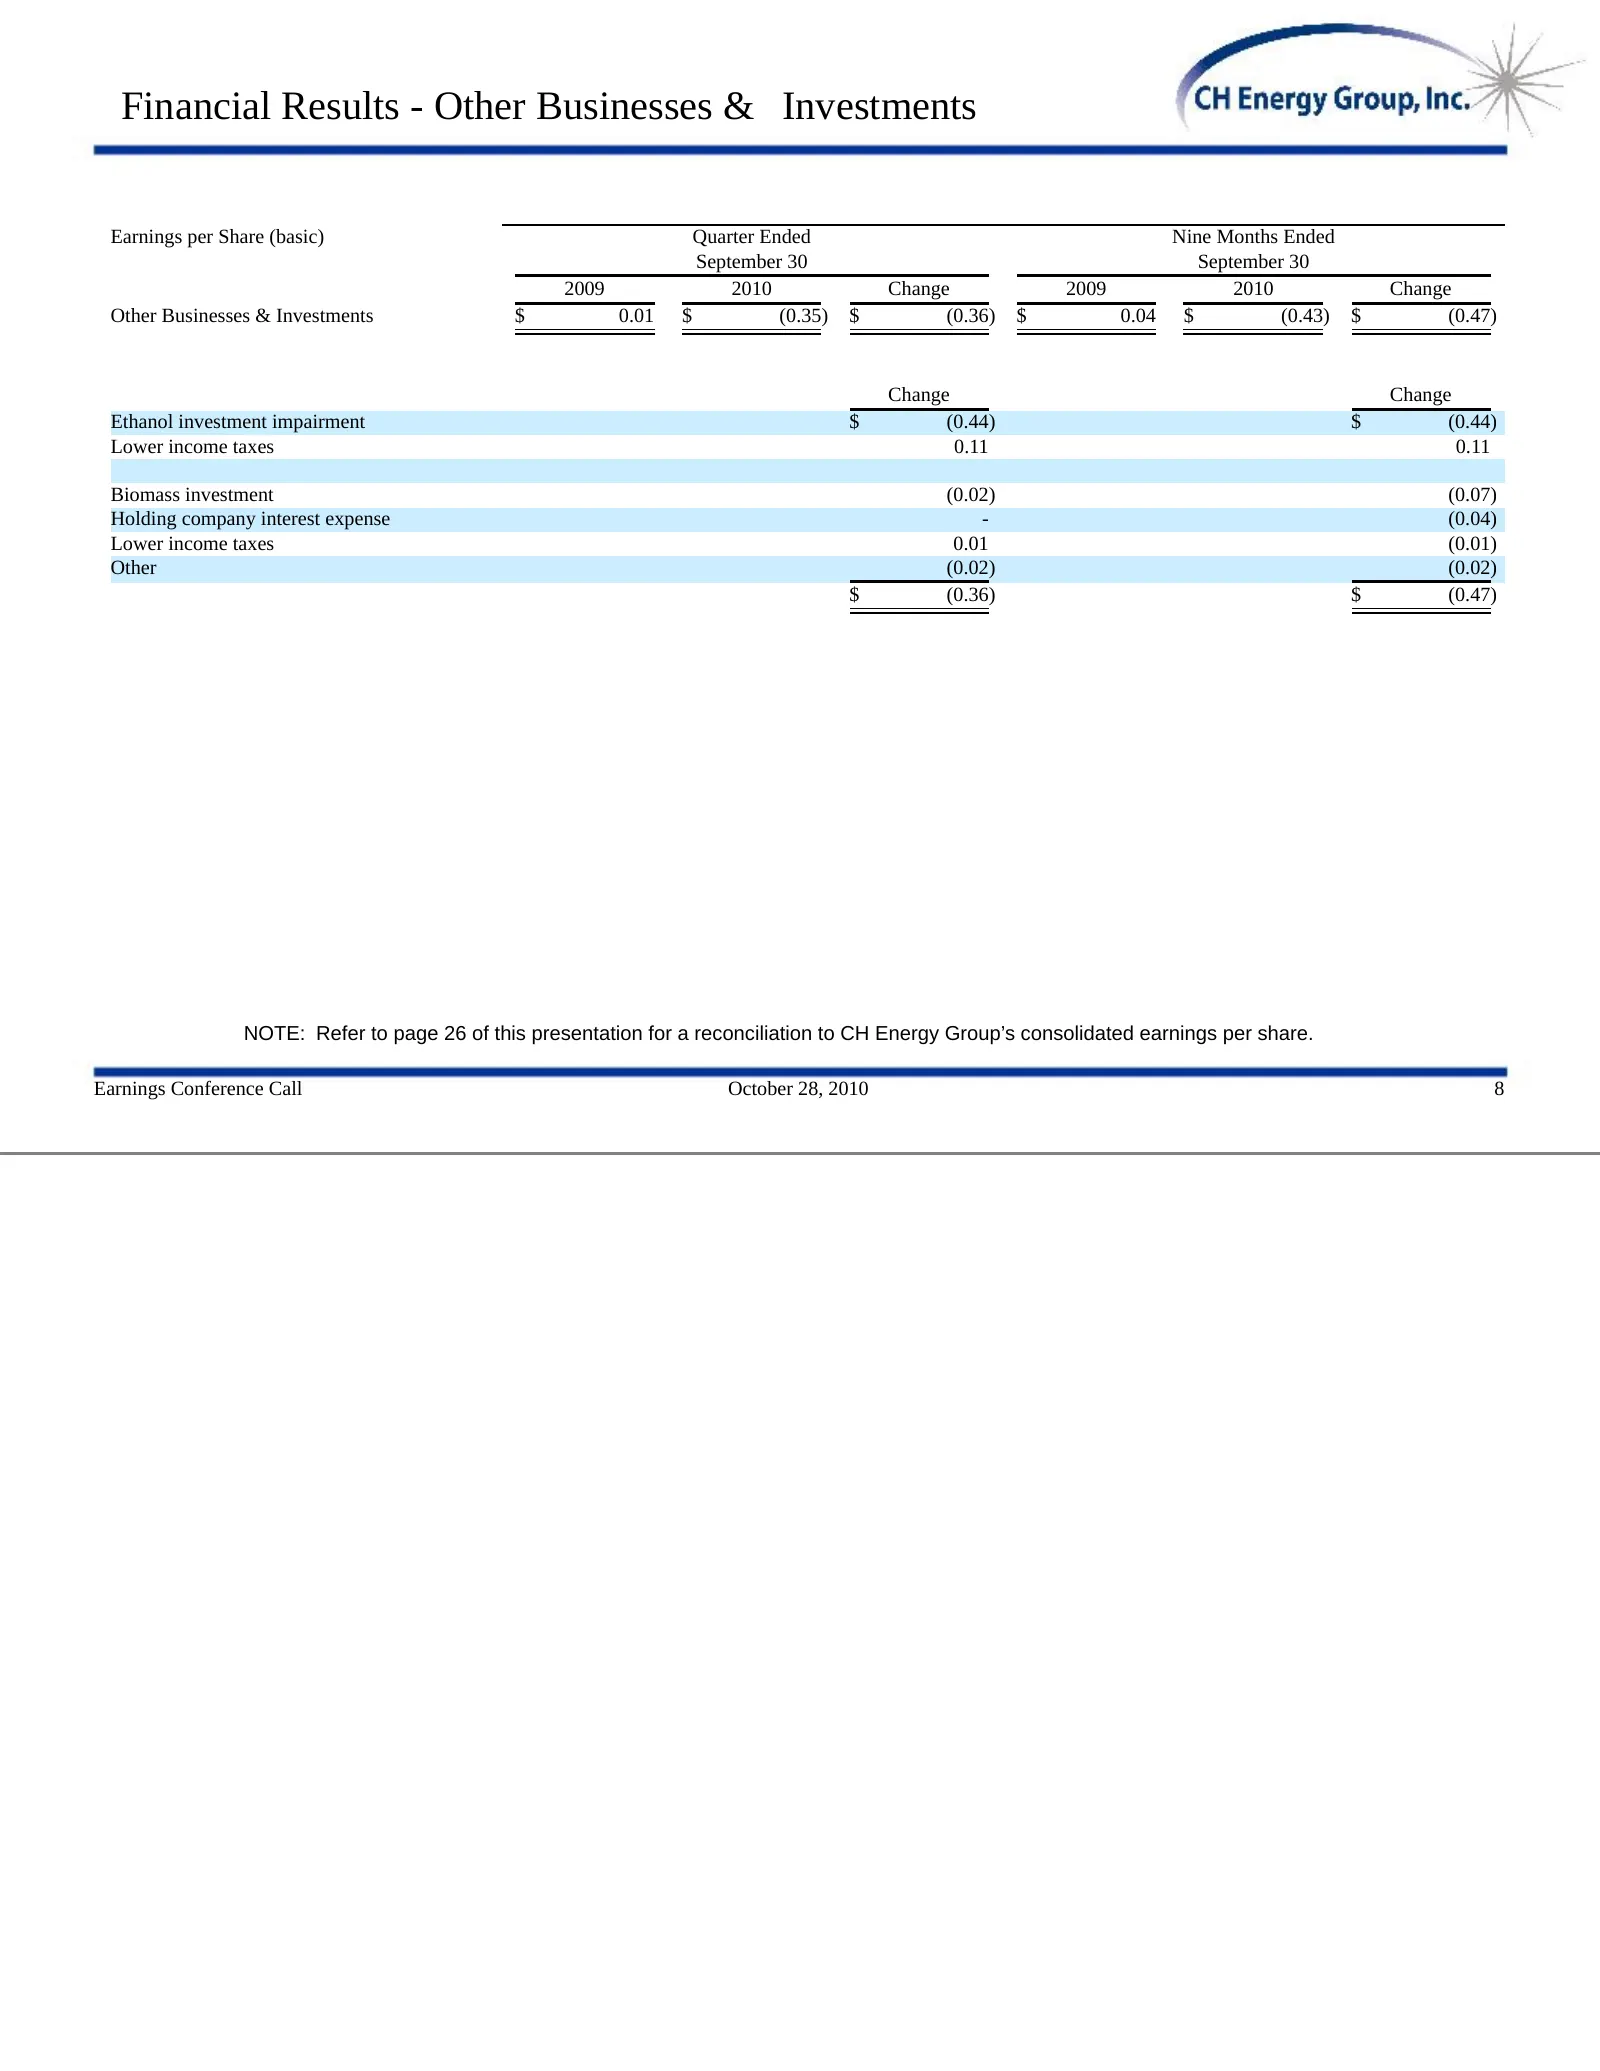
Financial Results - Other Businesses & Investments Earnings per Share (basic) Quarter Ended Nine Months Ended September 30 September 30 2009 2010 Change 2009 2010 Change Other Businesses & Investments $ 0.01 $ (0.35) $ (0.36) $ 0.04 $ (0.43) $ (0.47) Change Change Ethanol investment impairment $ (0.
Slide 10: Shift in Corporate Strategy
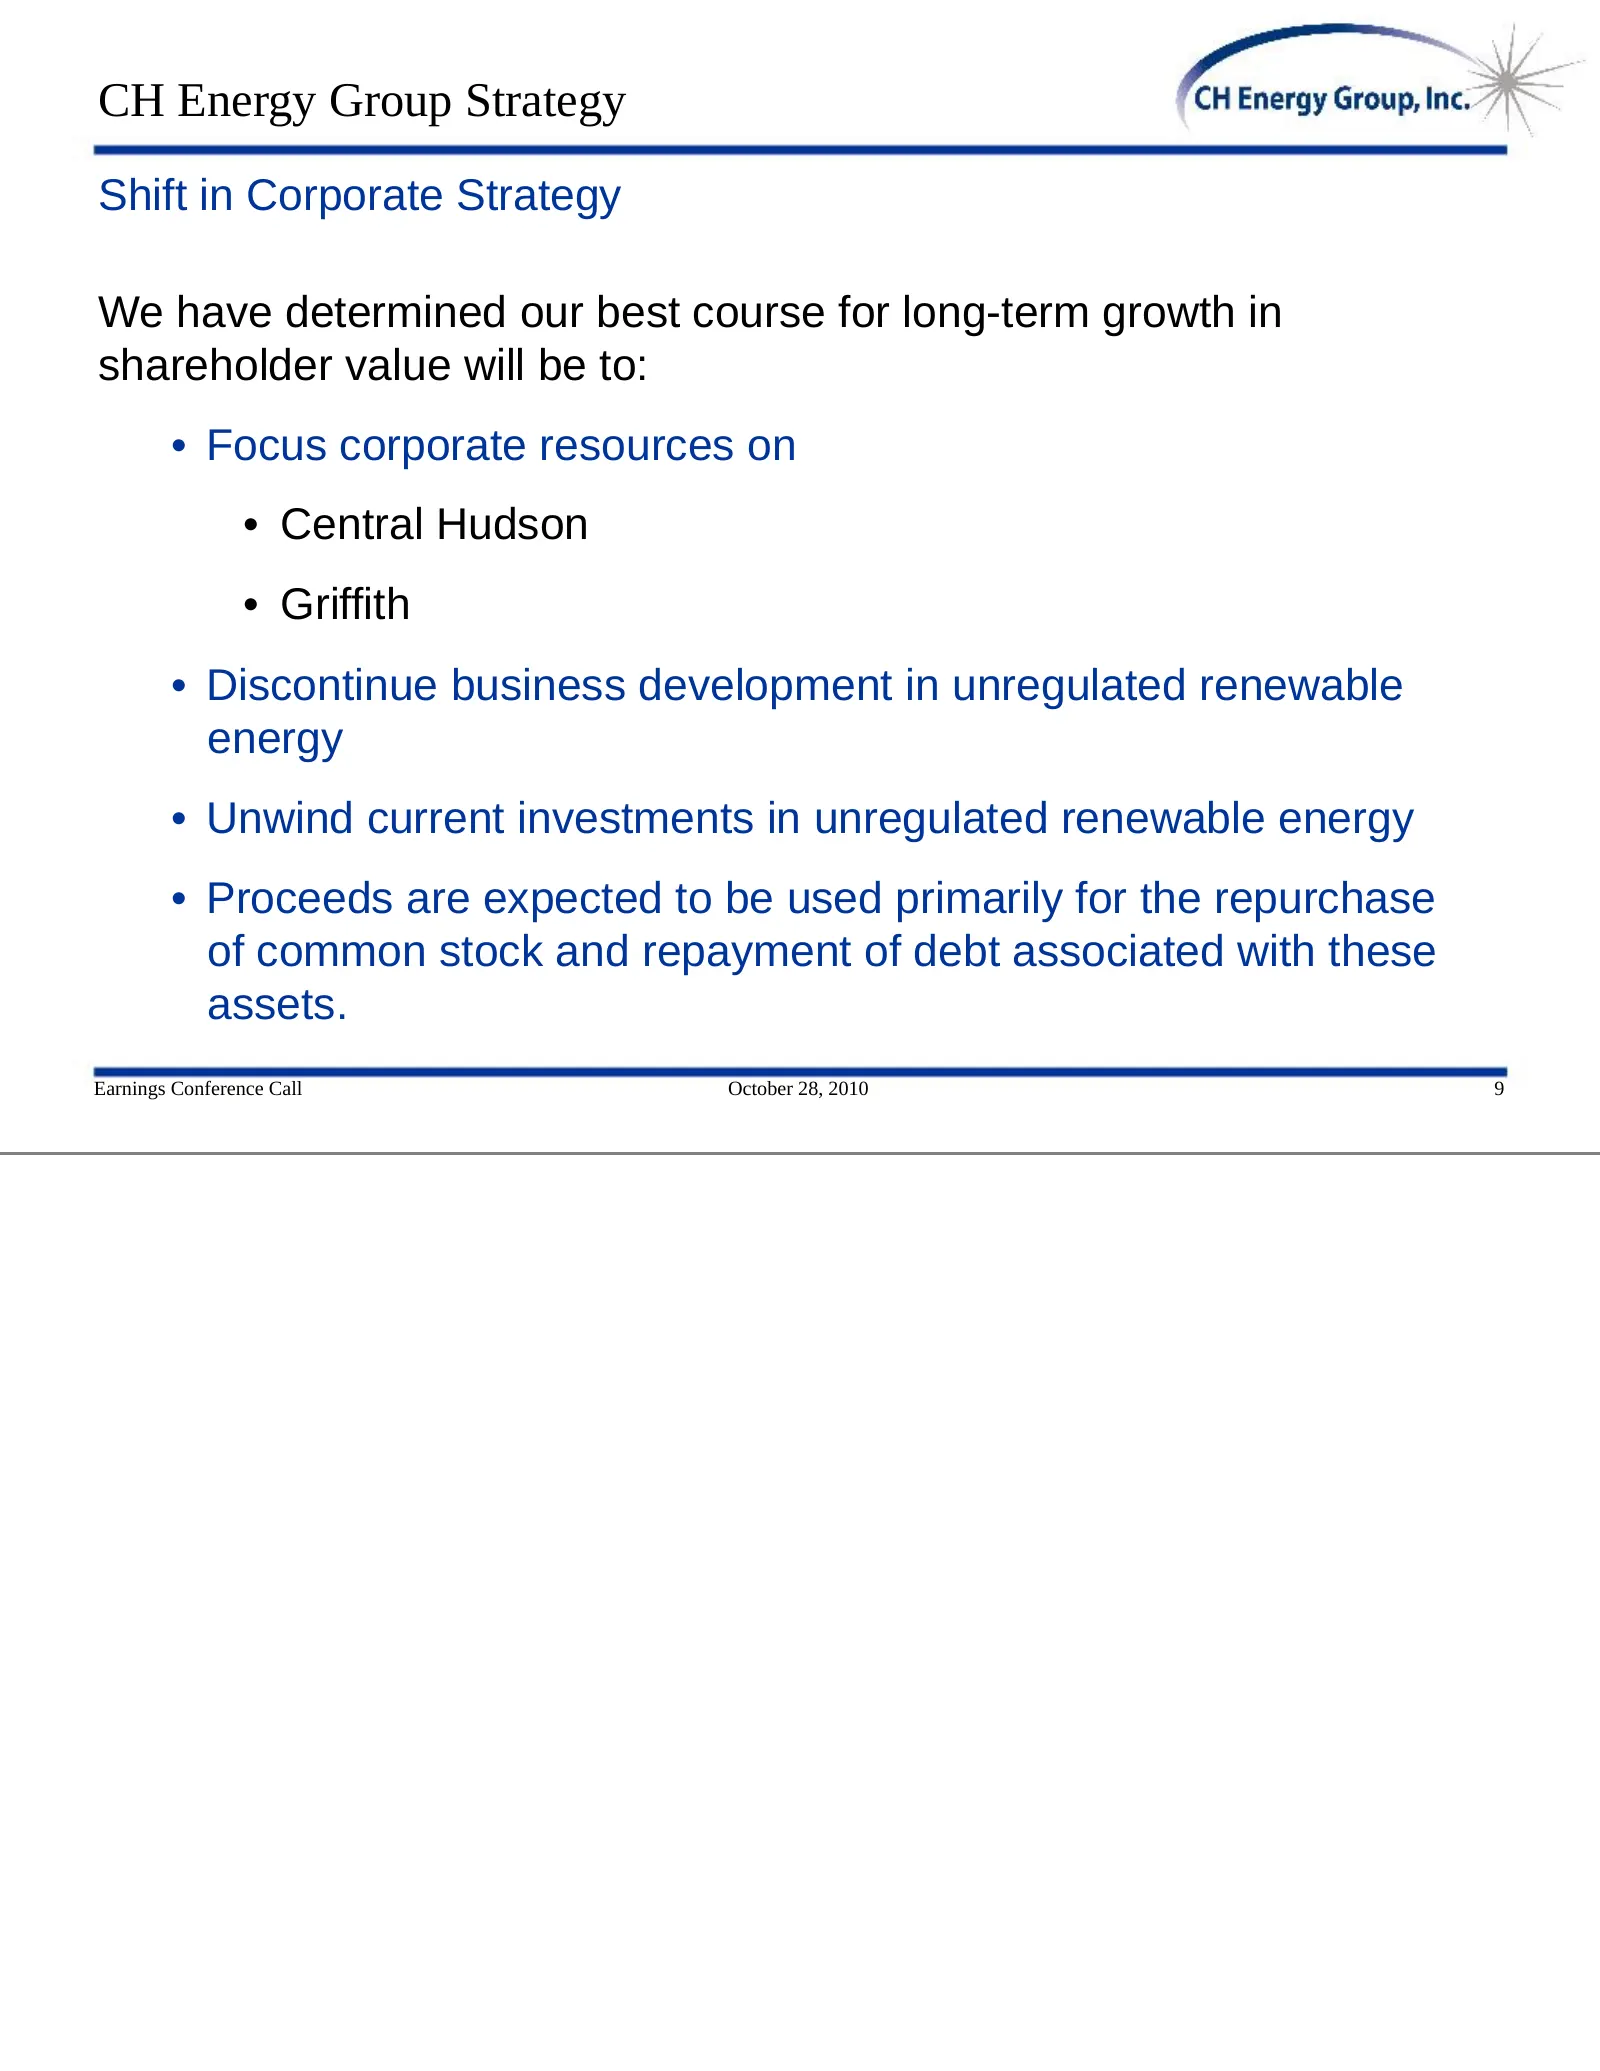
CH Energy Group Strategy Shift in Corporate Strategy We have determined our best course for long-term growth in shareholder value will be to: • Focus corporate resources on • Central Hudson • Griffith • Discontinue business development in unregulated renewable energy • Unwind current investments in
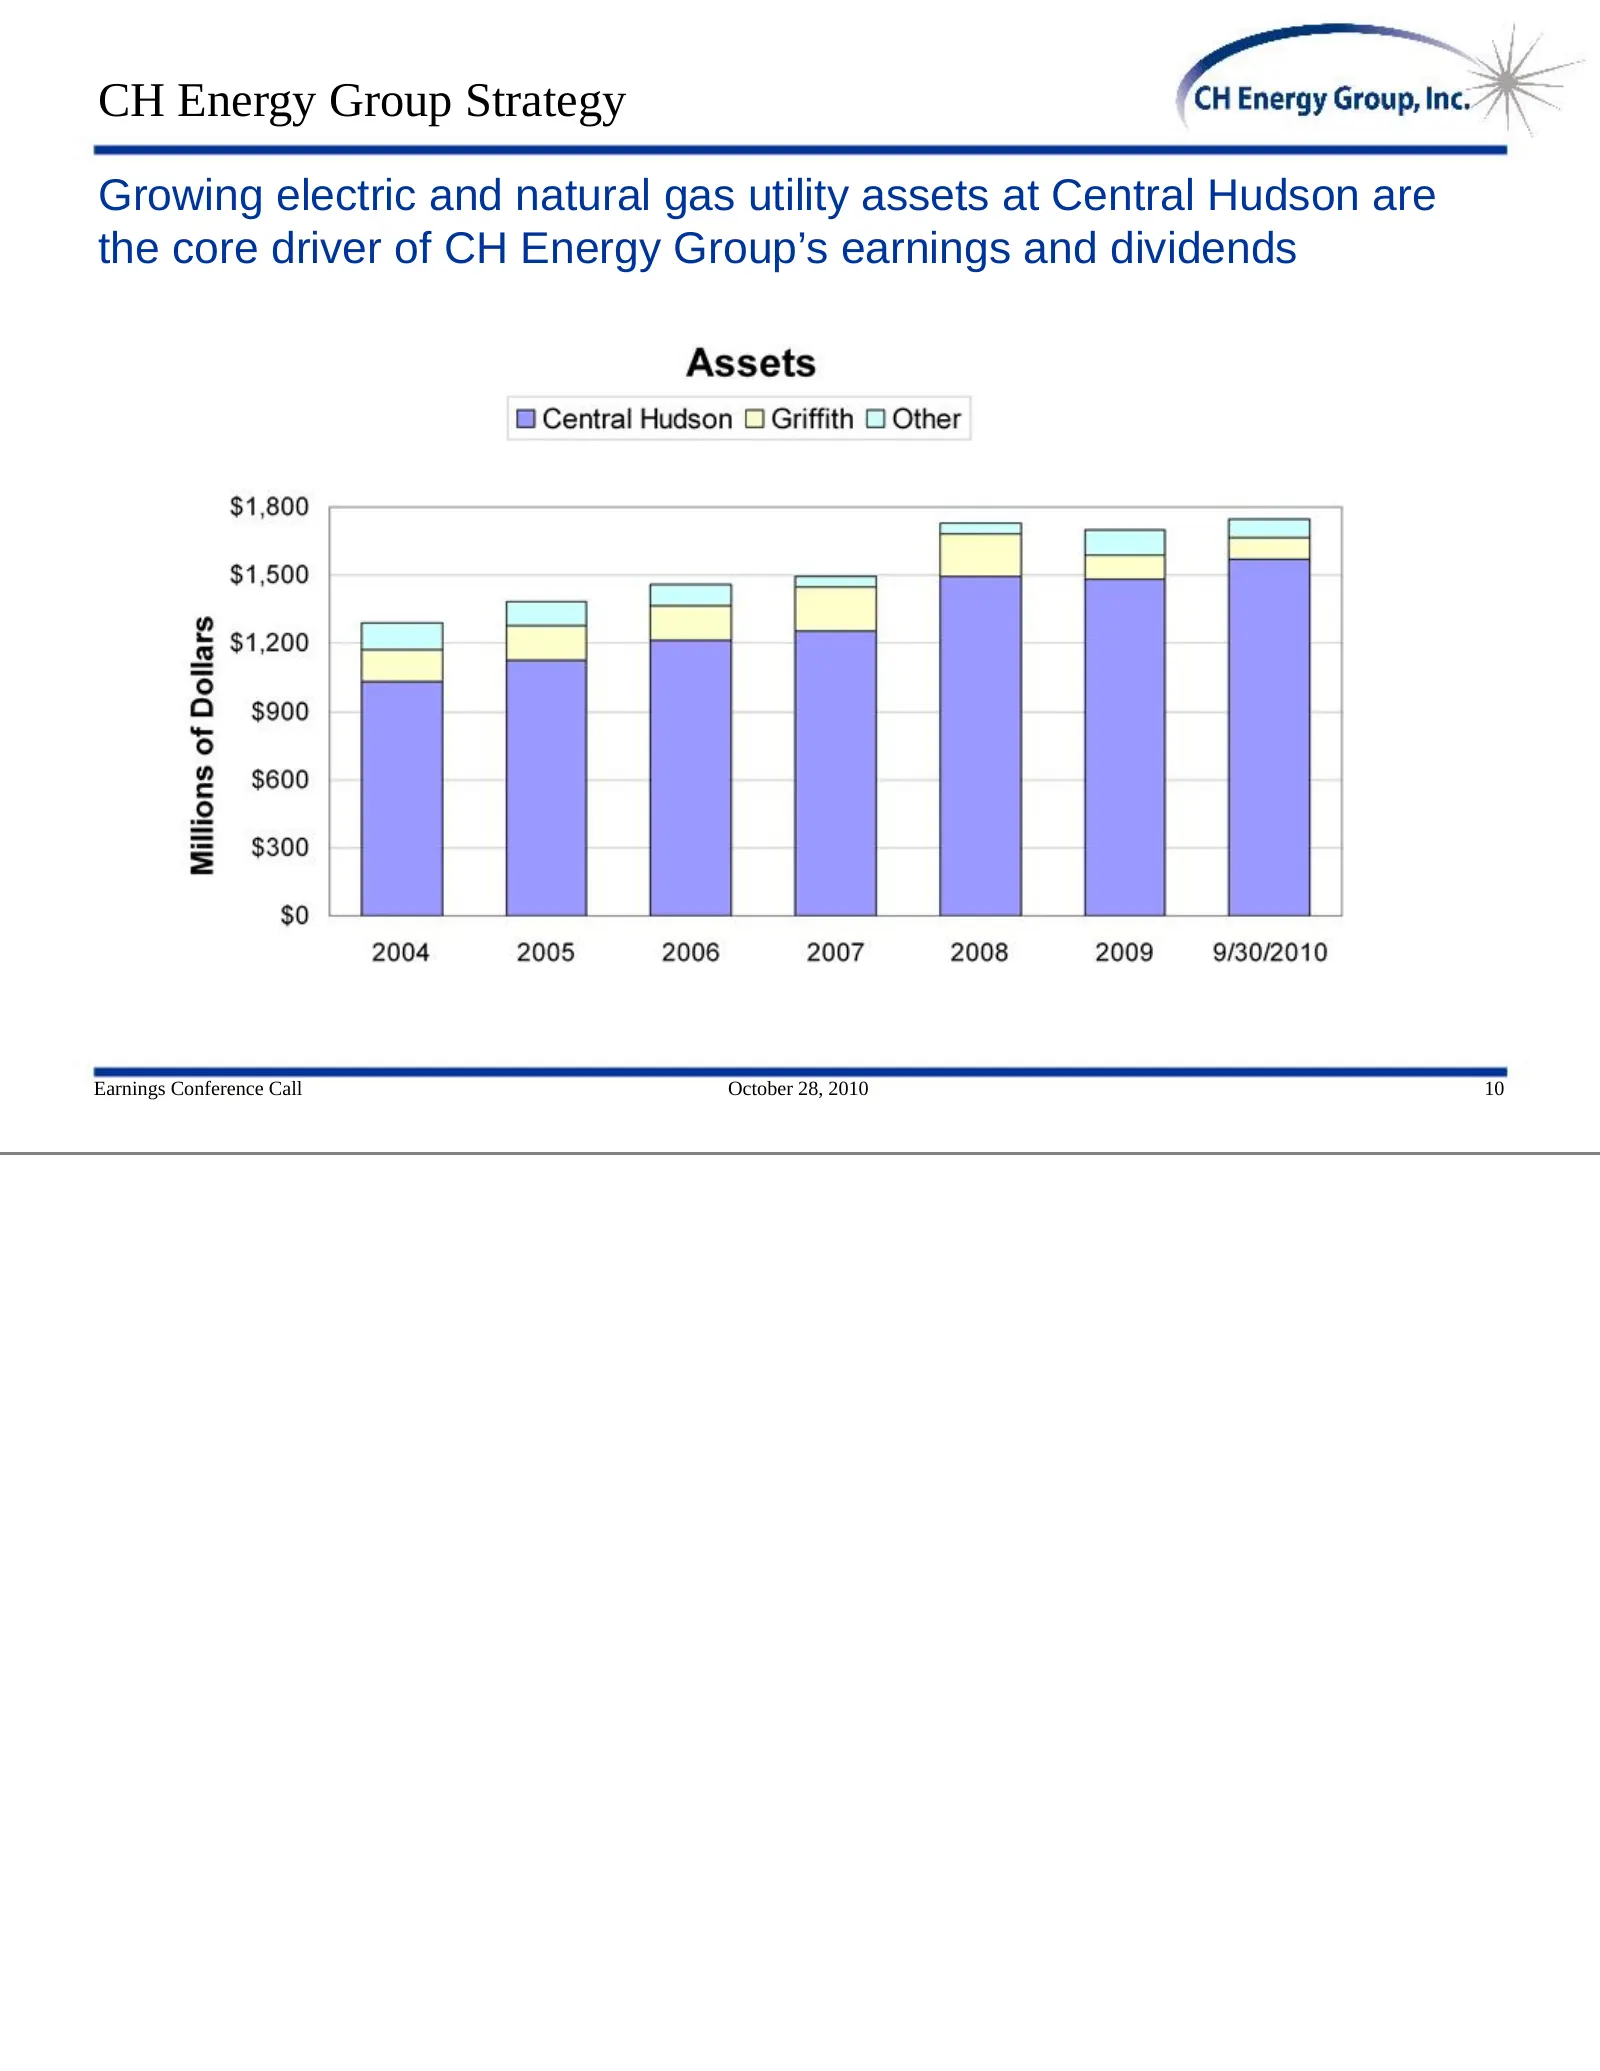
Slide 11: Growing electric and natural gas utility assets at Central Hudson
CH Energy Group Strategy Growing electric and natural gas utility assets at Central Hudson are the core driver of CH Energy Group’s earnings and dividends Earnings Conference Call October 28, 2010 10
Slide 12: Central Hudson Strategy: well positioned for success
Central Hudson Strategy At Central Hudson, we are well positioned for near-term and long- term success. • Strong competencies in safe and efficient utility operations, financial management, risk management, and regulatory affairs • Talented and committed employees • A culture of continuous improveme
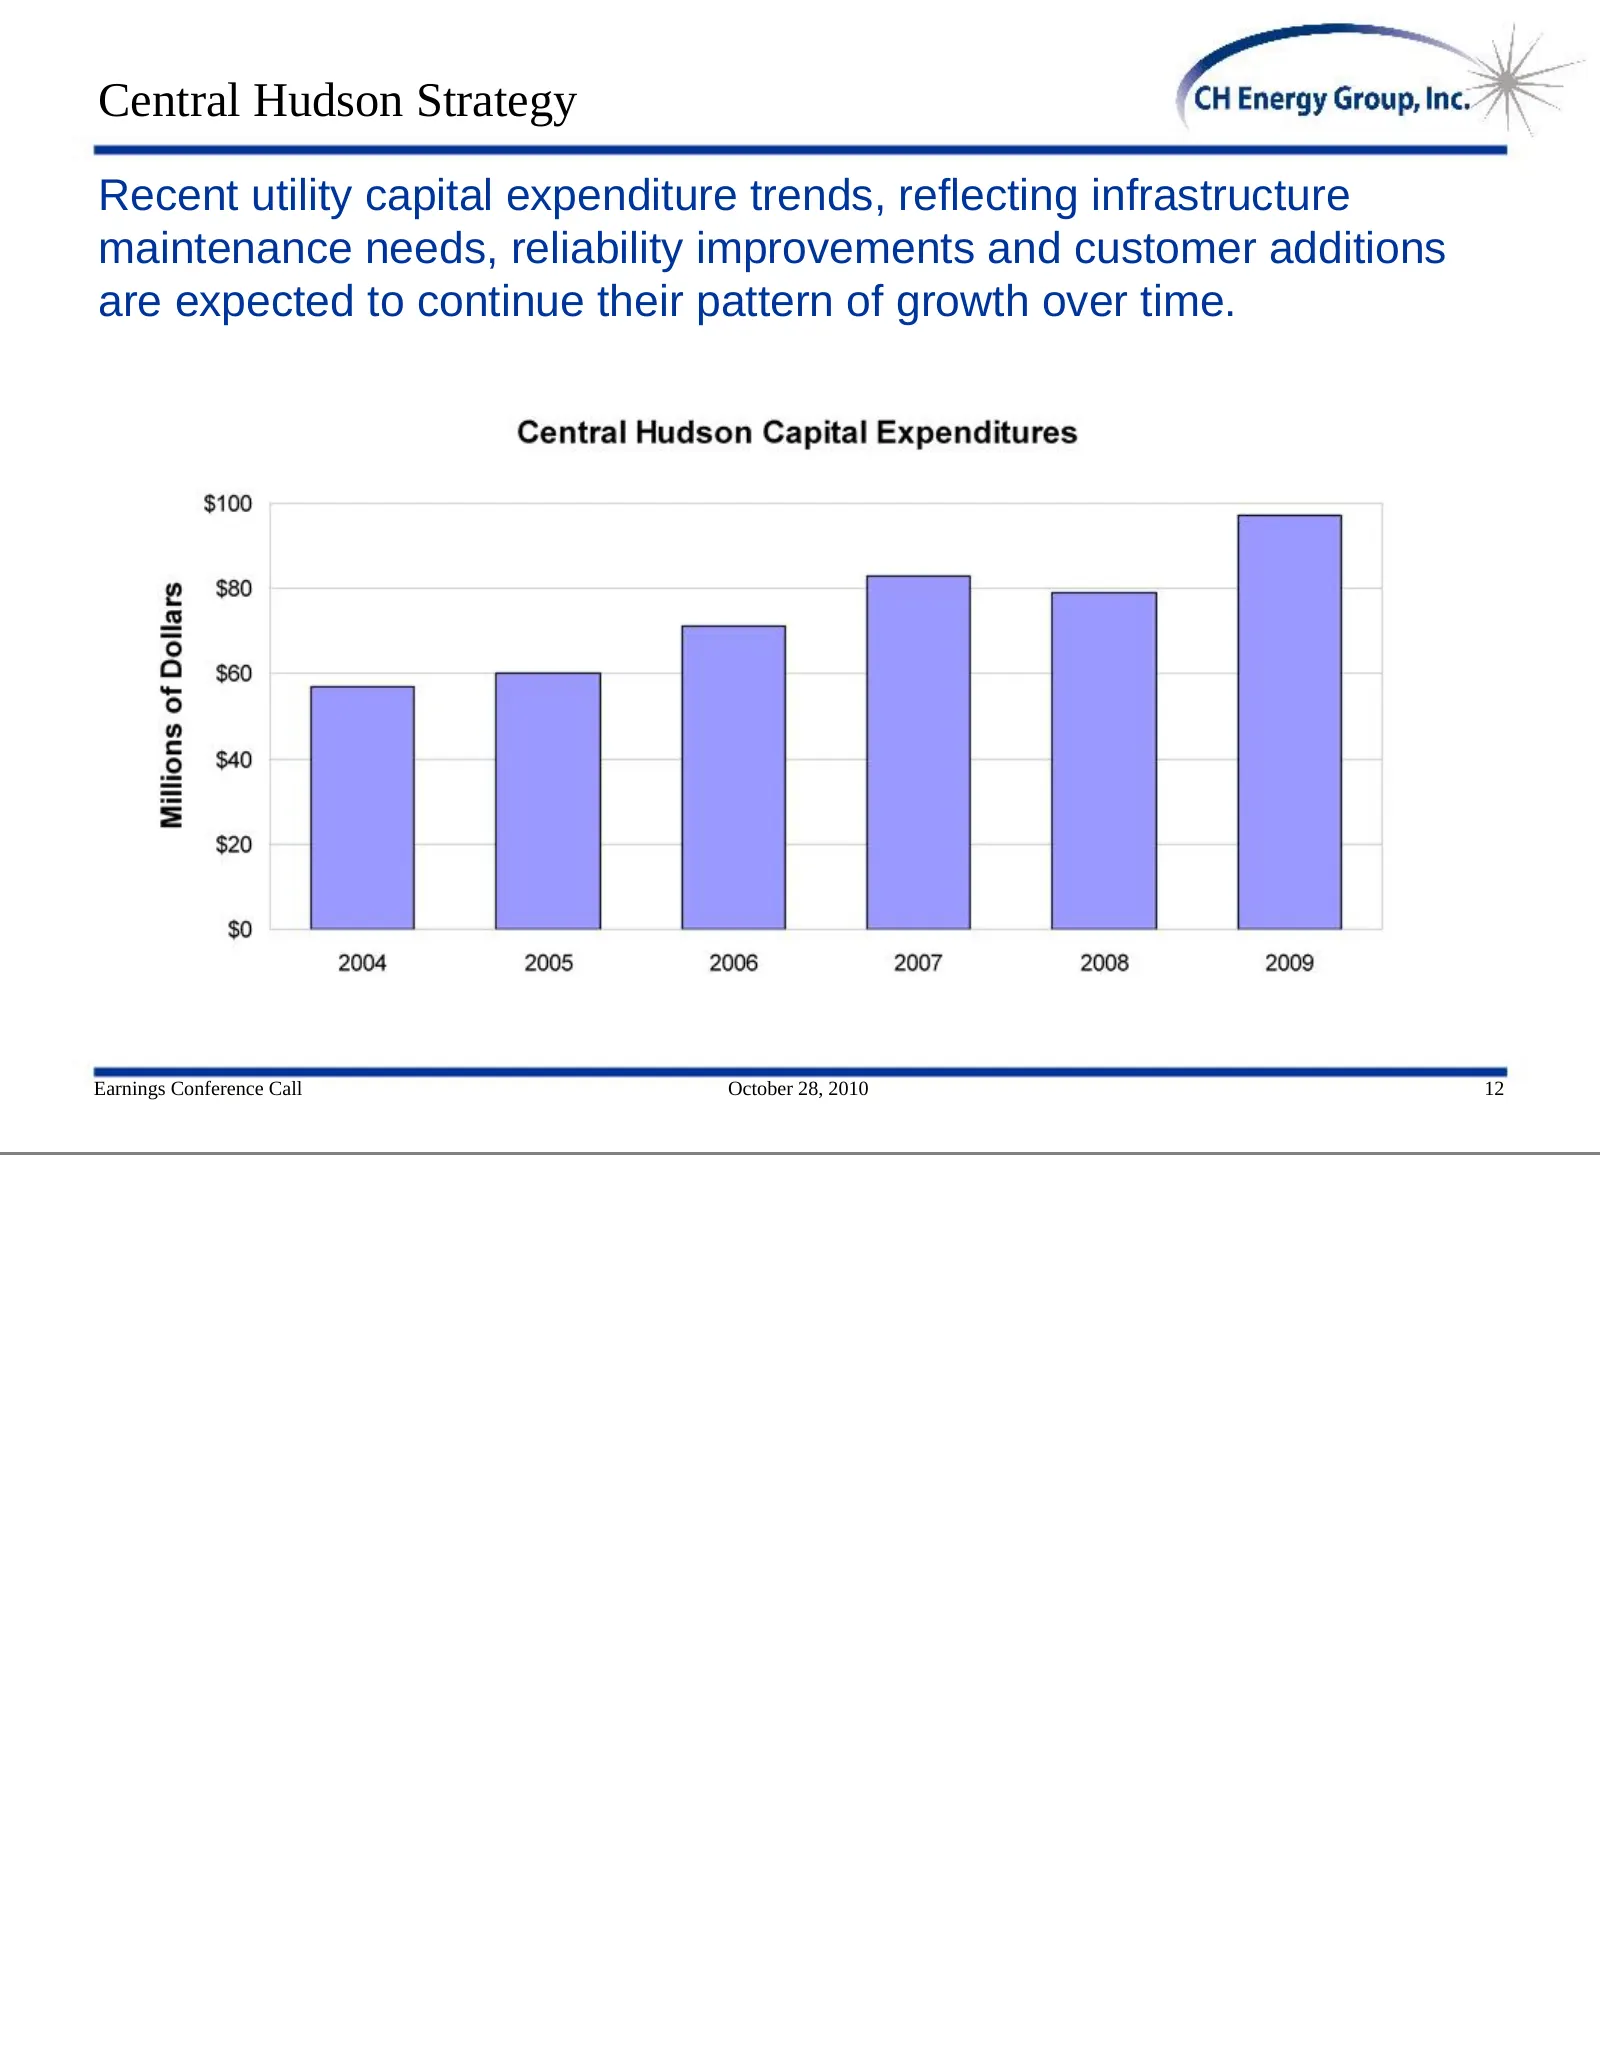
Slide 13: Central Hudson Strategy: utility capital expenditure trends
Central Hudson Strategy Recent utility capital expenditure trends, reflecting infrastructure maintenance needs, reliability improvements and customer additions are expected to continue their pattern of growth over time. Earnings Conference Call October 28, 2010 12
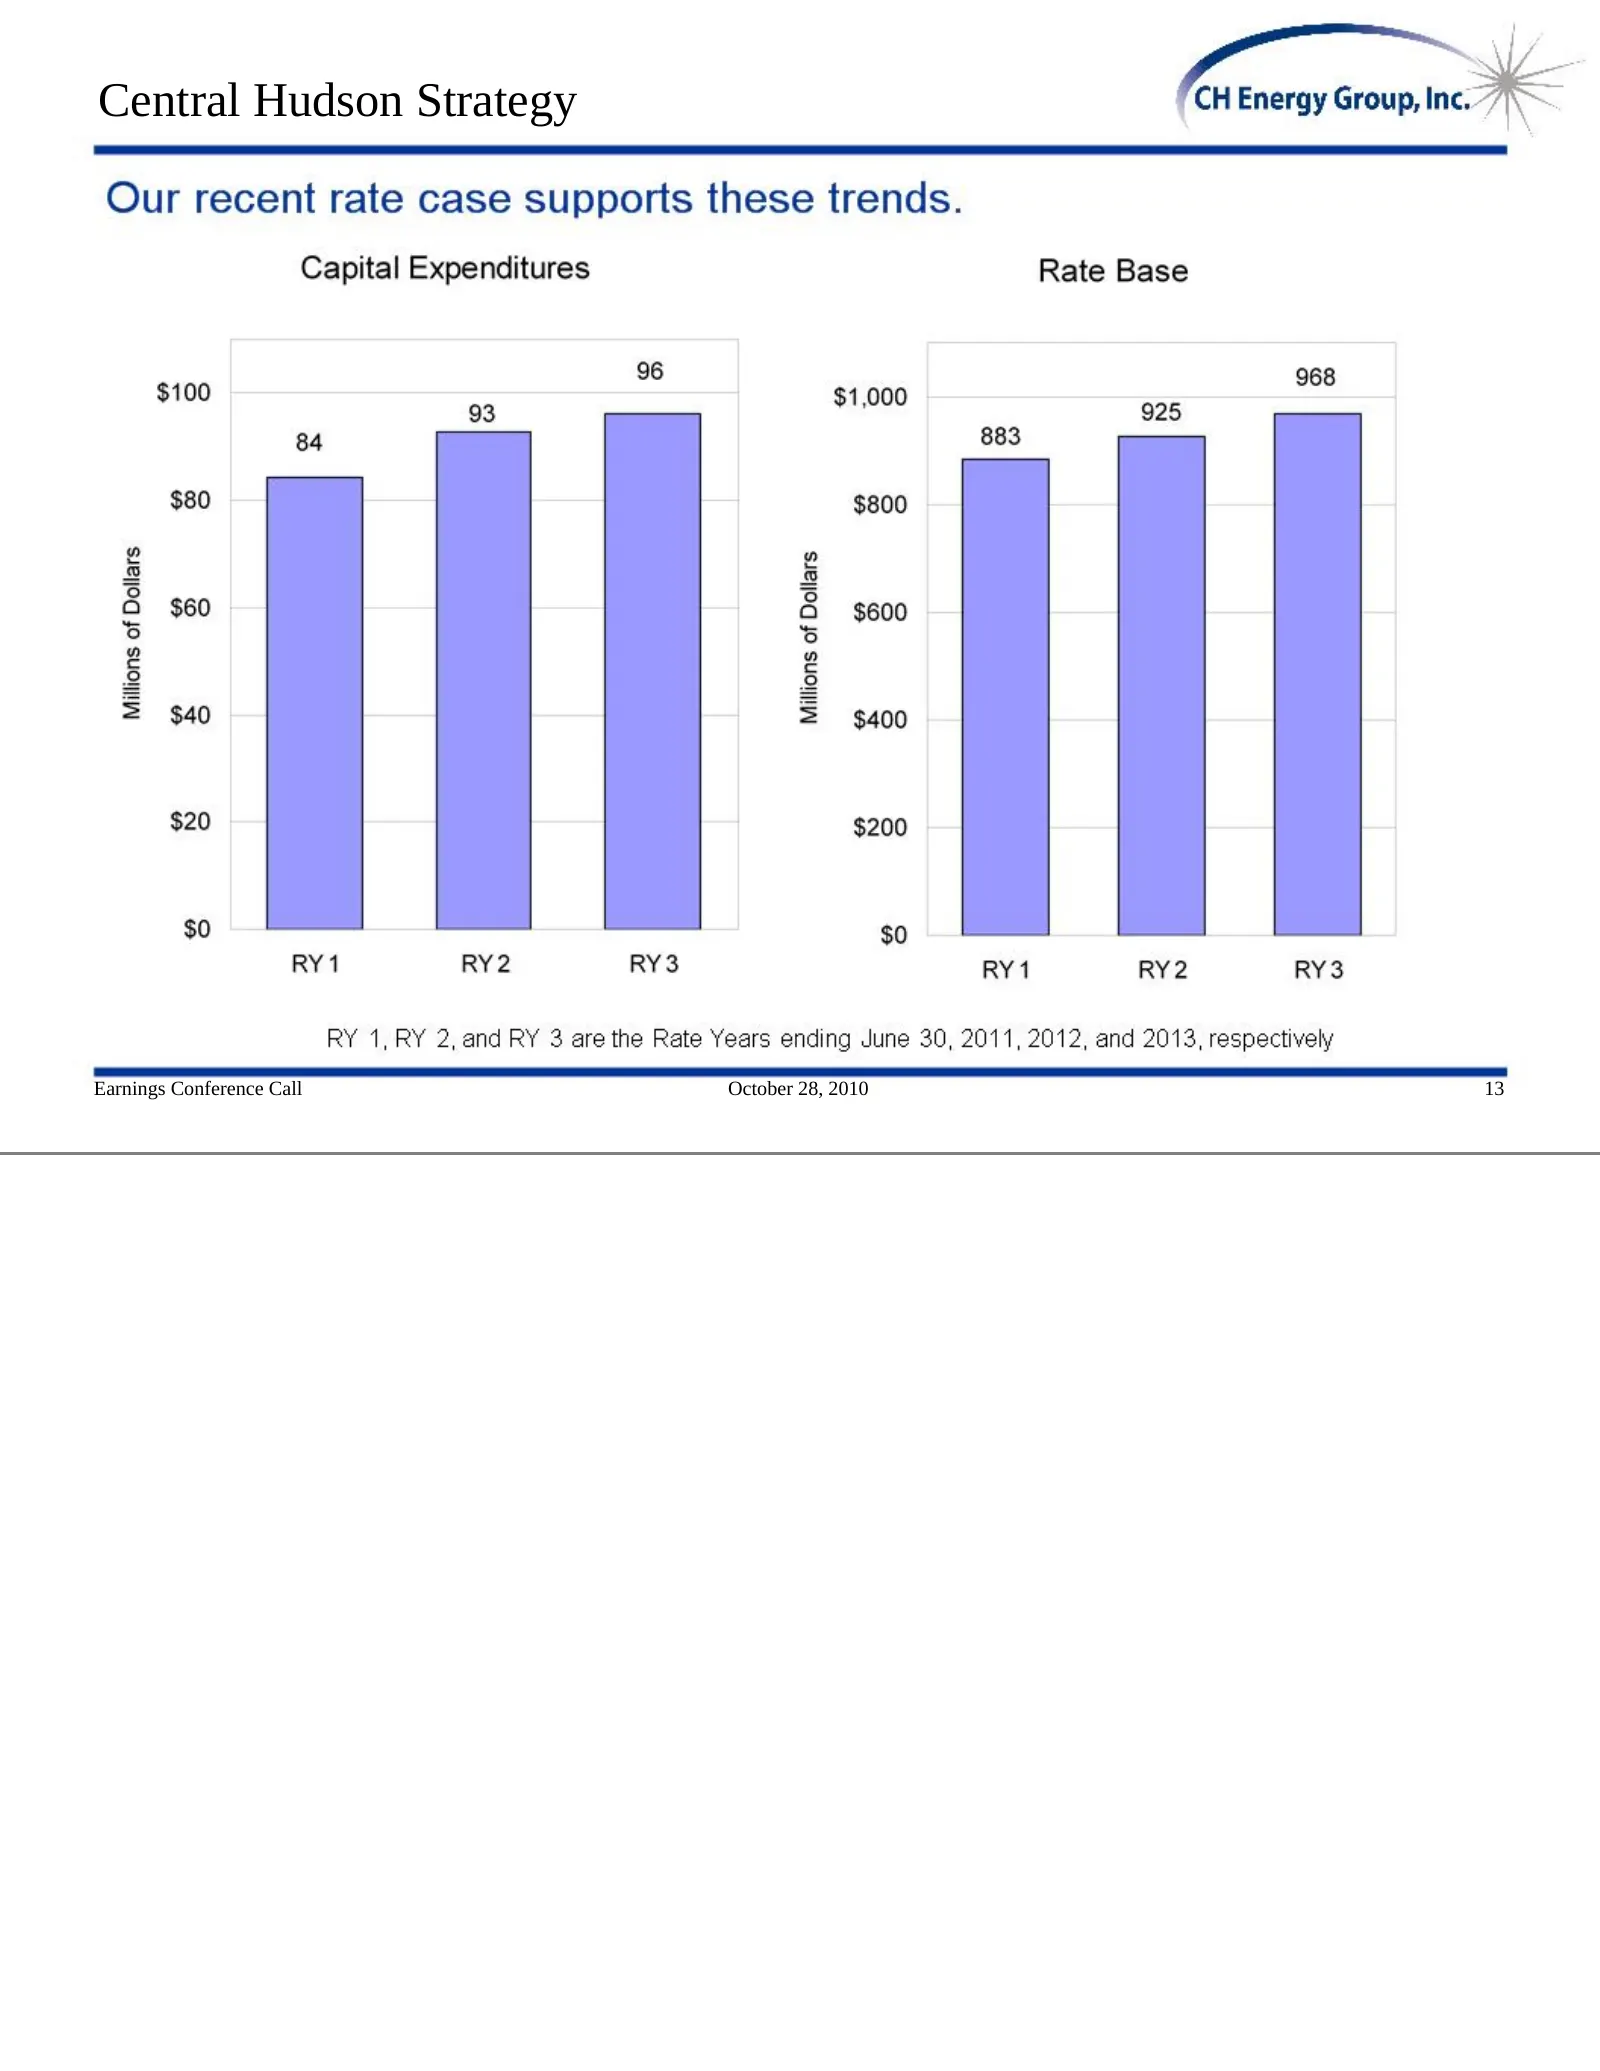
Slide 14: Central Hudson Strategy
Central Hudson Strategy Earnings Conference Call October 28, 2010 13
Slide 15: Practicing continuous improvement in everything we do
Central Hudson Strategy Practicing continuous improvement in everything we do • Company-wide Lean Six Sigma Initiative launched in 2010, working with the Rochester Institute of Technology’s Lean Six Sigma Program. • Data-driven approach to improve business processes, reducing cost, eliminating low-v
Slide 16: Central Hudson expected performance under rate agreement
Central Hudson Strategy Over the three years of the current rate agreement, we expect Central Hudson to perform well under its terms. • Achieve PSC reliability and customer satisfaction targets with no significant penalties • Effective expense management that enables us to achieve the 10% allowed RO
Slide 17: Provide exceptional value to Central Hudson customers
Central Hudson Strategy Provide exceptional value to Central Hudson customers by: • Practicing continuous improvement in everything we do • Investing in T&D infrastructure to maintain the system, enhance reliability, and improve customer satisfaction • Moderating cost pressures that increase custome
Slide 18: Griffith Strategy: shareholder value through improved performance
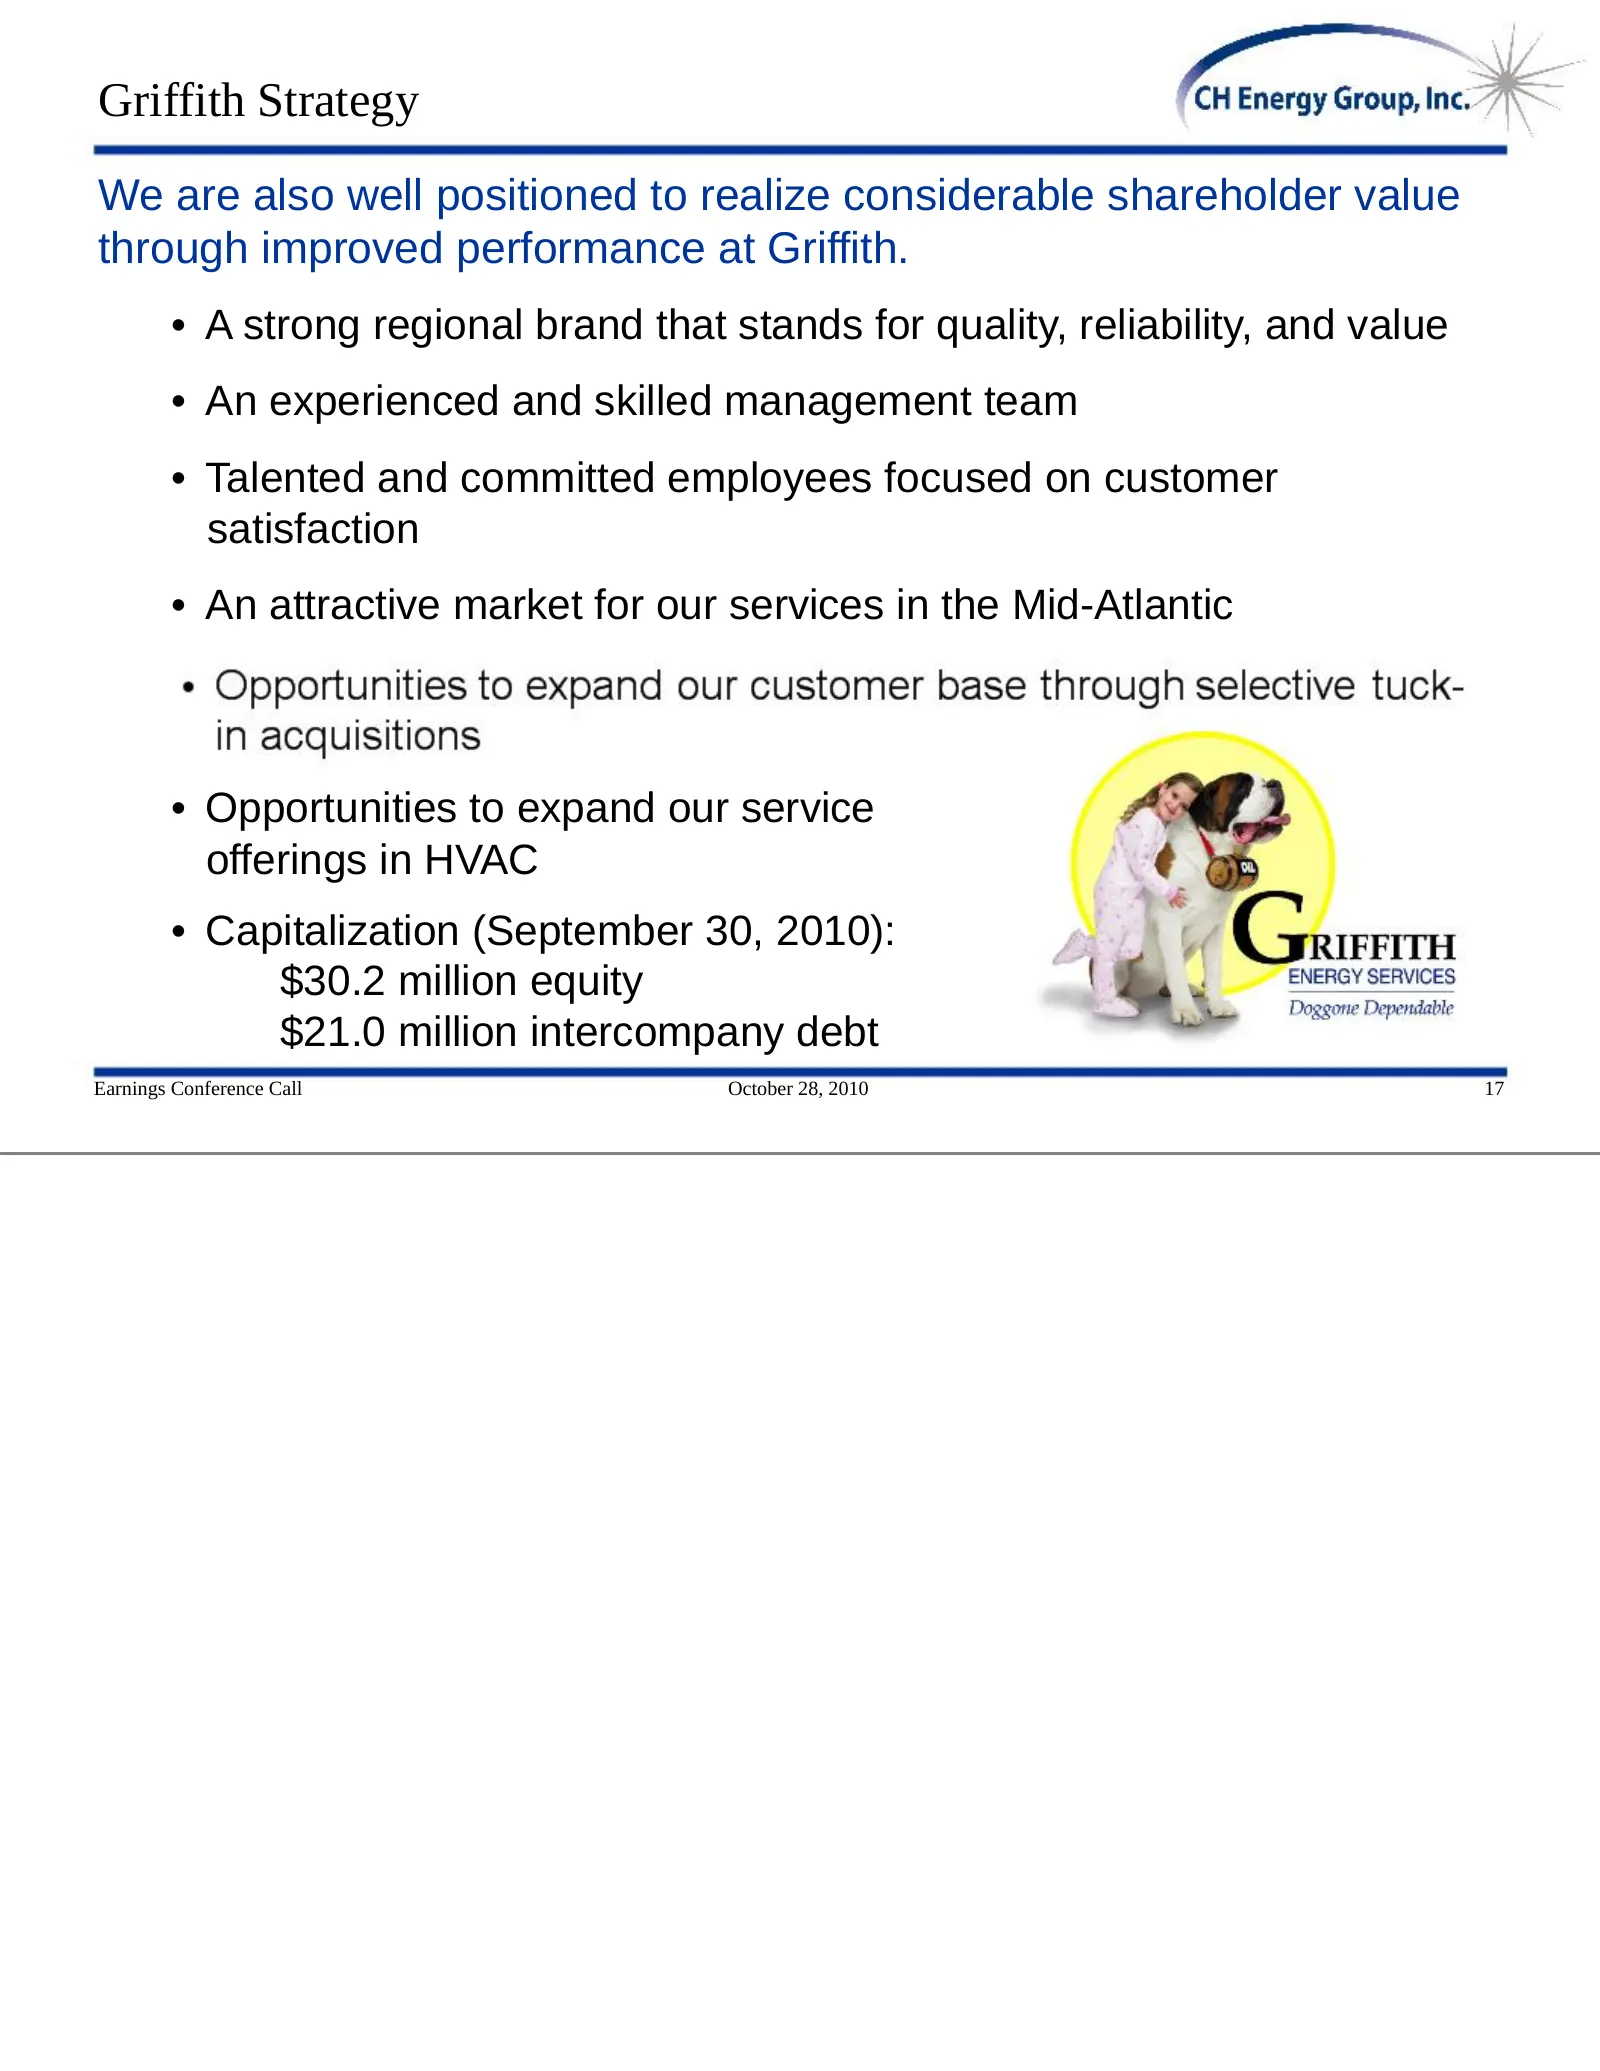
Griffith Strategy We are also well positioned to realize considerable shareholder value through improved performance at Griffith. • A strong regional brand that stands for quality, reliability, and value • An experienced and skilled management team • Talented and committed employees focused on custo
Slide 19: Griffith earnings growth prospects
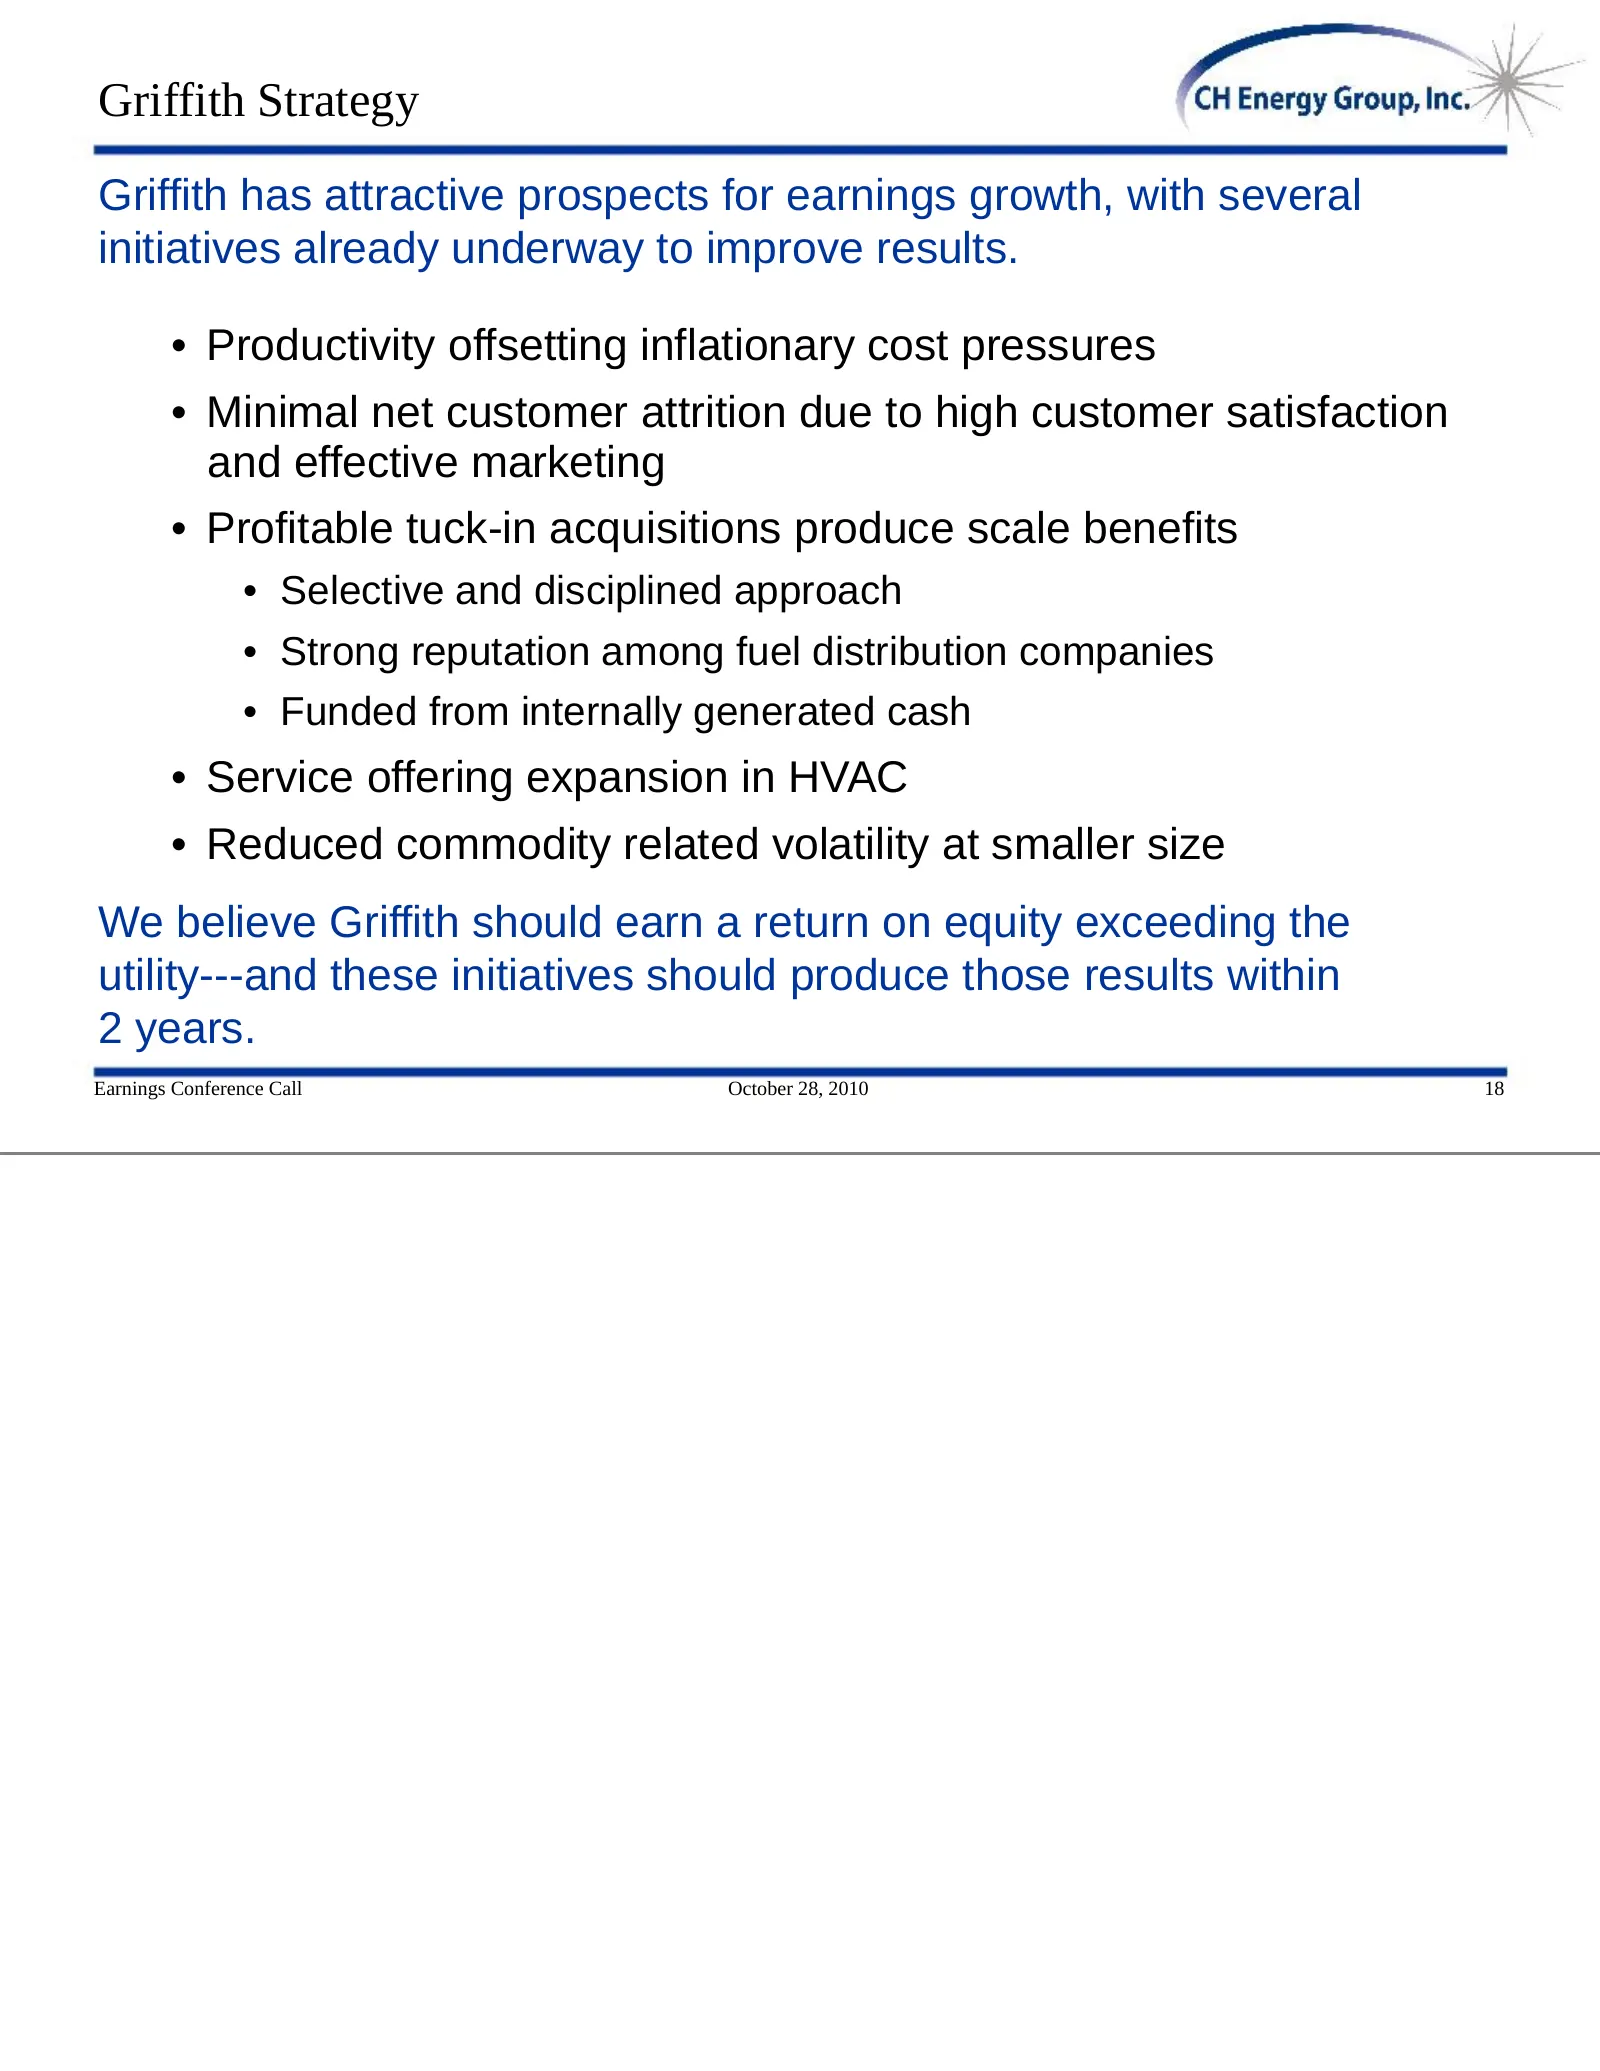
Griffith Strategy Griffith has attractive prospects for earnings growth, with several initiatives already underway to improve results. • Productivity offsetting inflationary cost pressures • Minimal net customer attrition due to high customer satisfaction and effective marketing • Profitable tuck-in
Slide 20: Provide premium service to Griffith customers
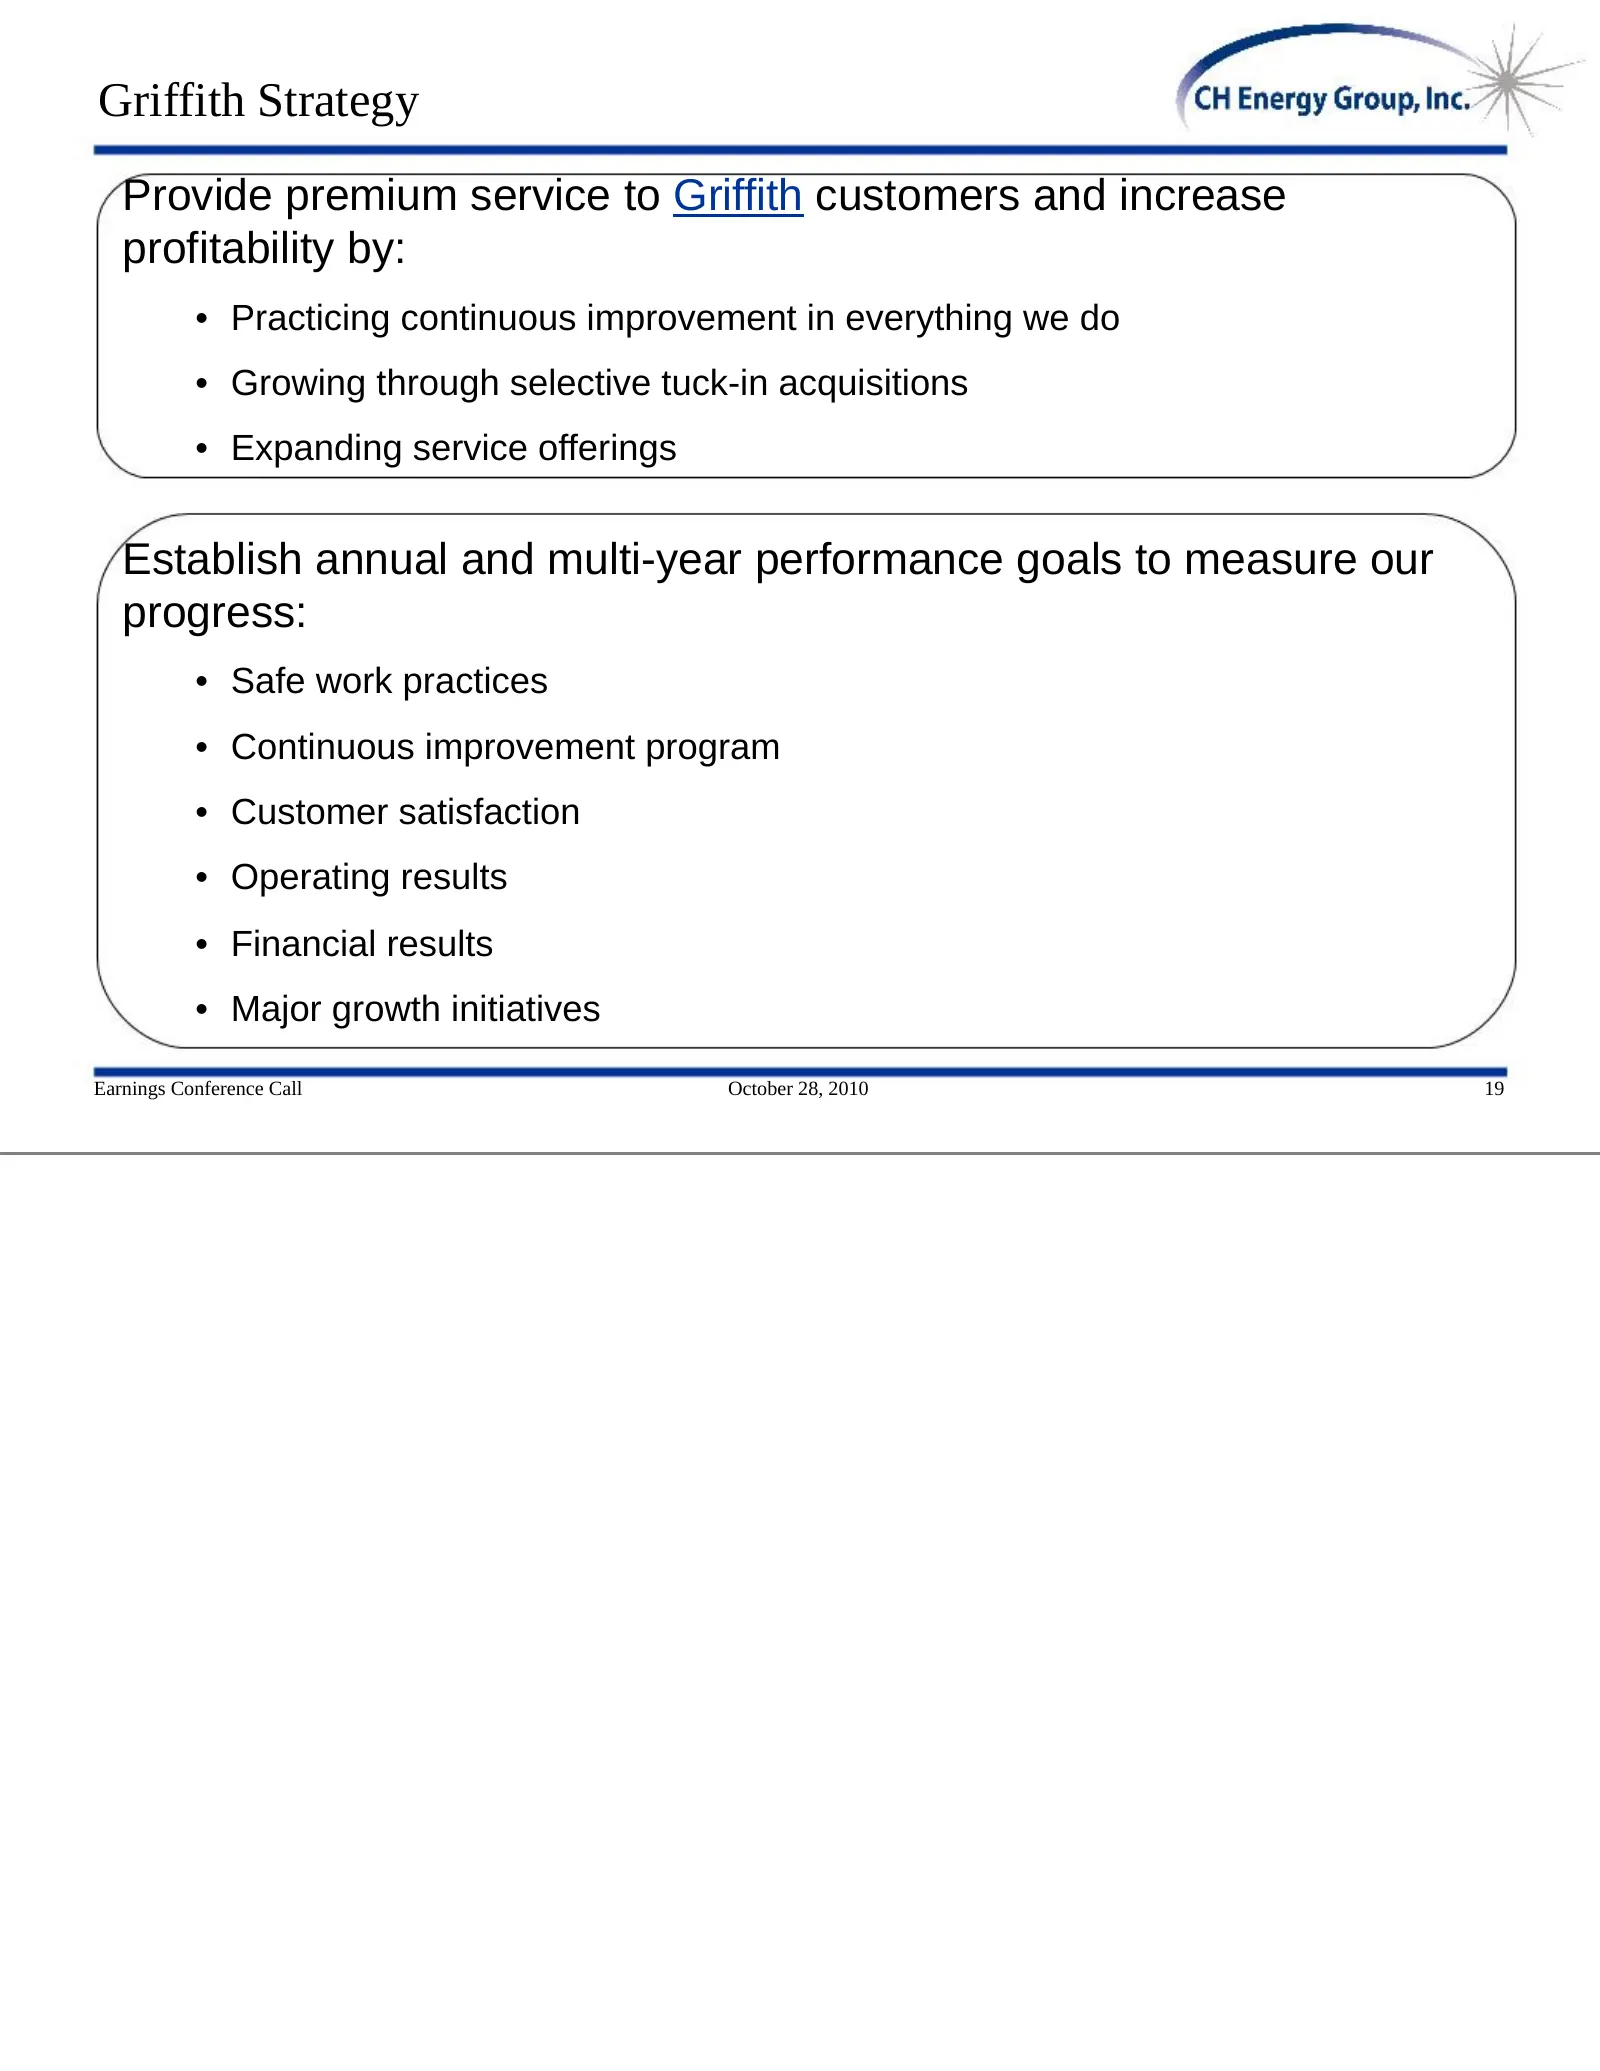
Griffith Strategy Provide premium service to Griffith customers and increase profitability by: • Practicing continuous improvement in everything we do • Growing through selective tuck-in acquisitions • Expanding service offerings Establish annual and multi-year performance goals to measure our progr
Slide 21: Other Businesses and Investments: discontinued business development
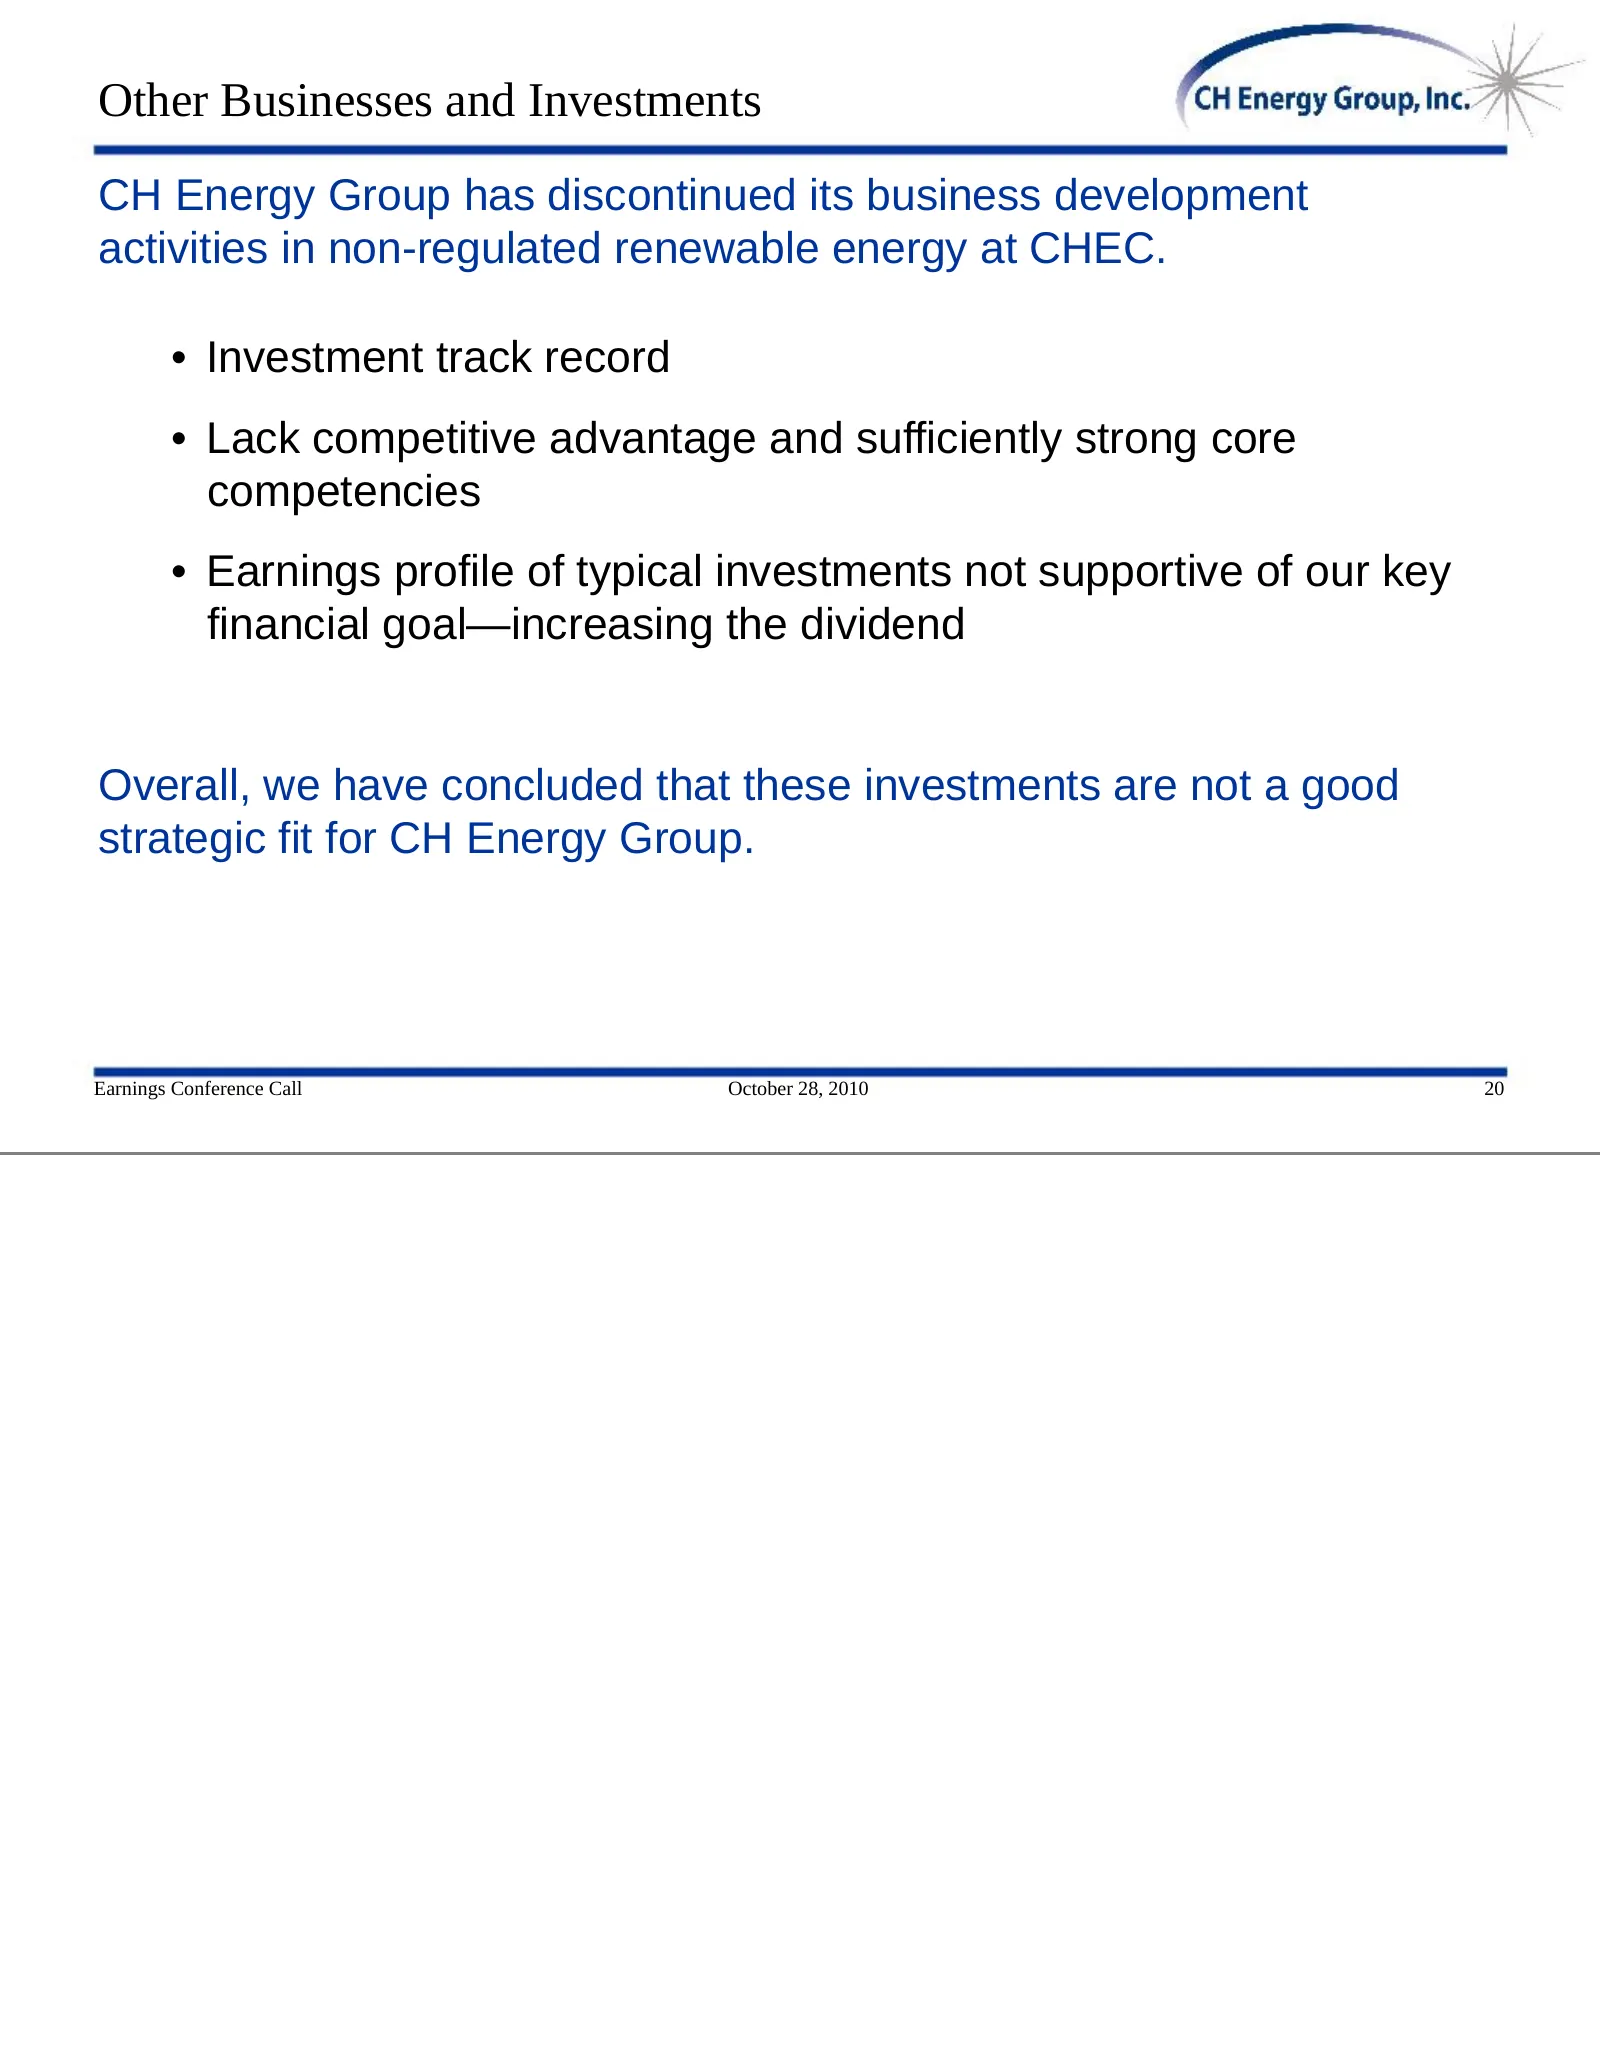
Other Businesses and Investments CH Energy Group has discontinued its business development activities in non-regulated renewable energy at CHEC. • Investment track record • Lack competitive advantage and sufficiently strong core competencies • Earnings profile of typical investments not supportive o
Slide 22: Unwinding non-core investments in unregulated energy production
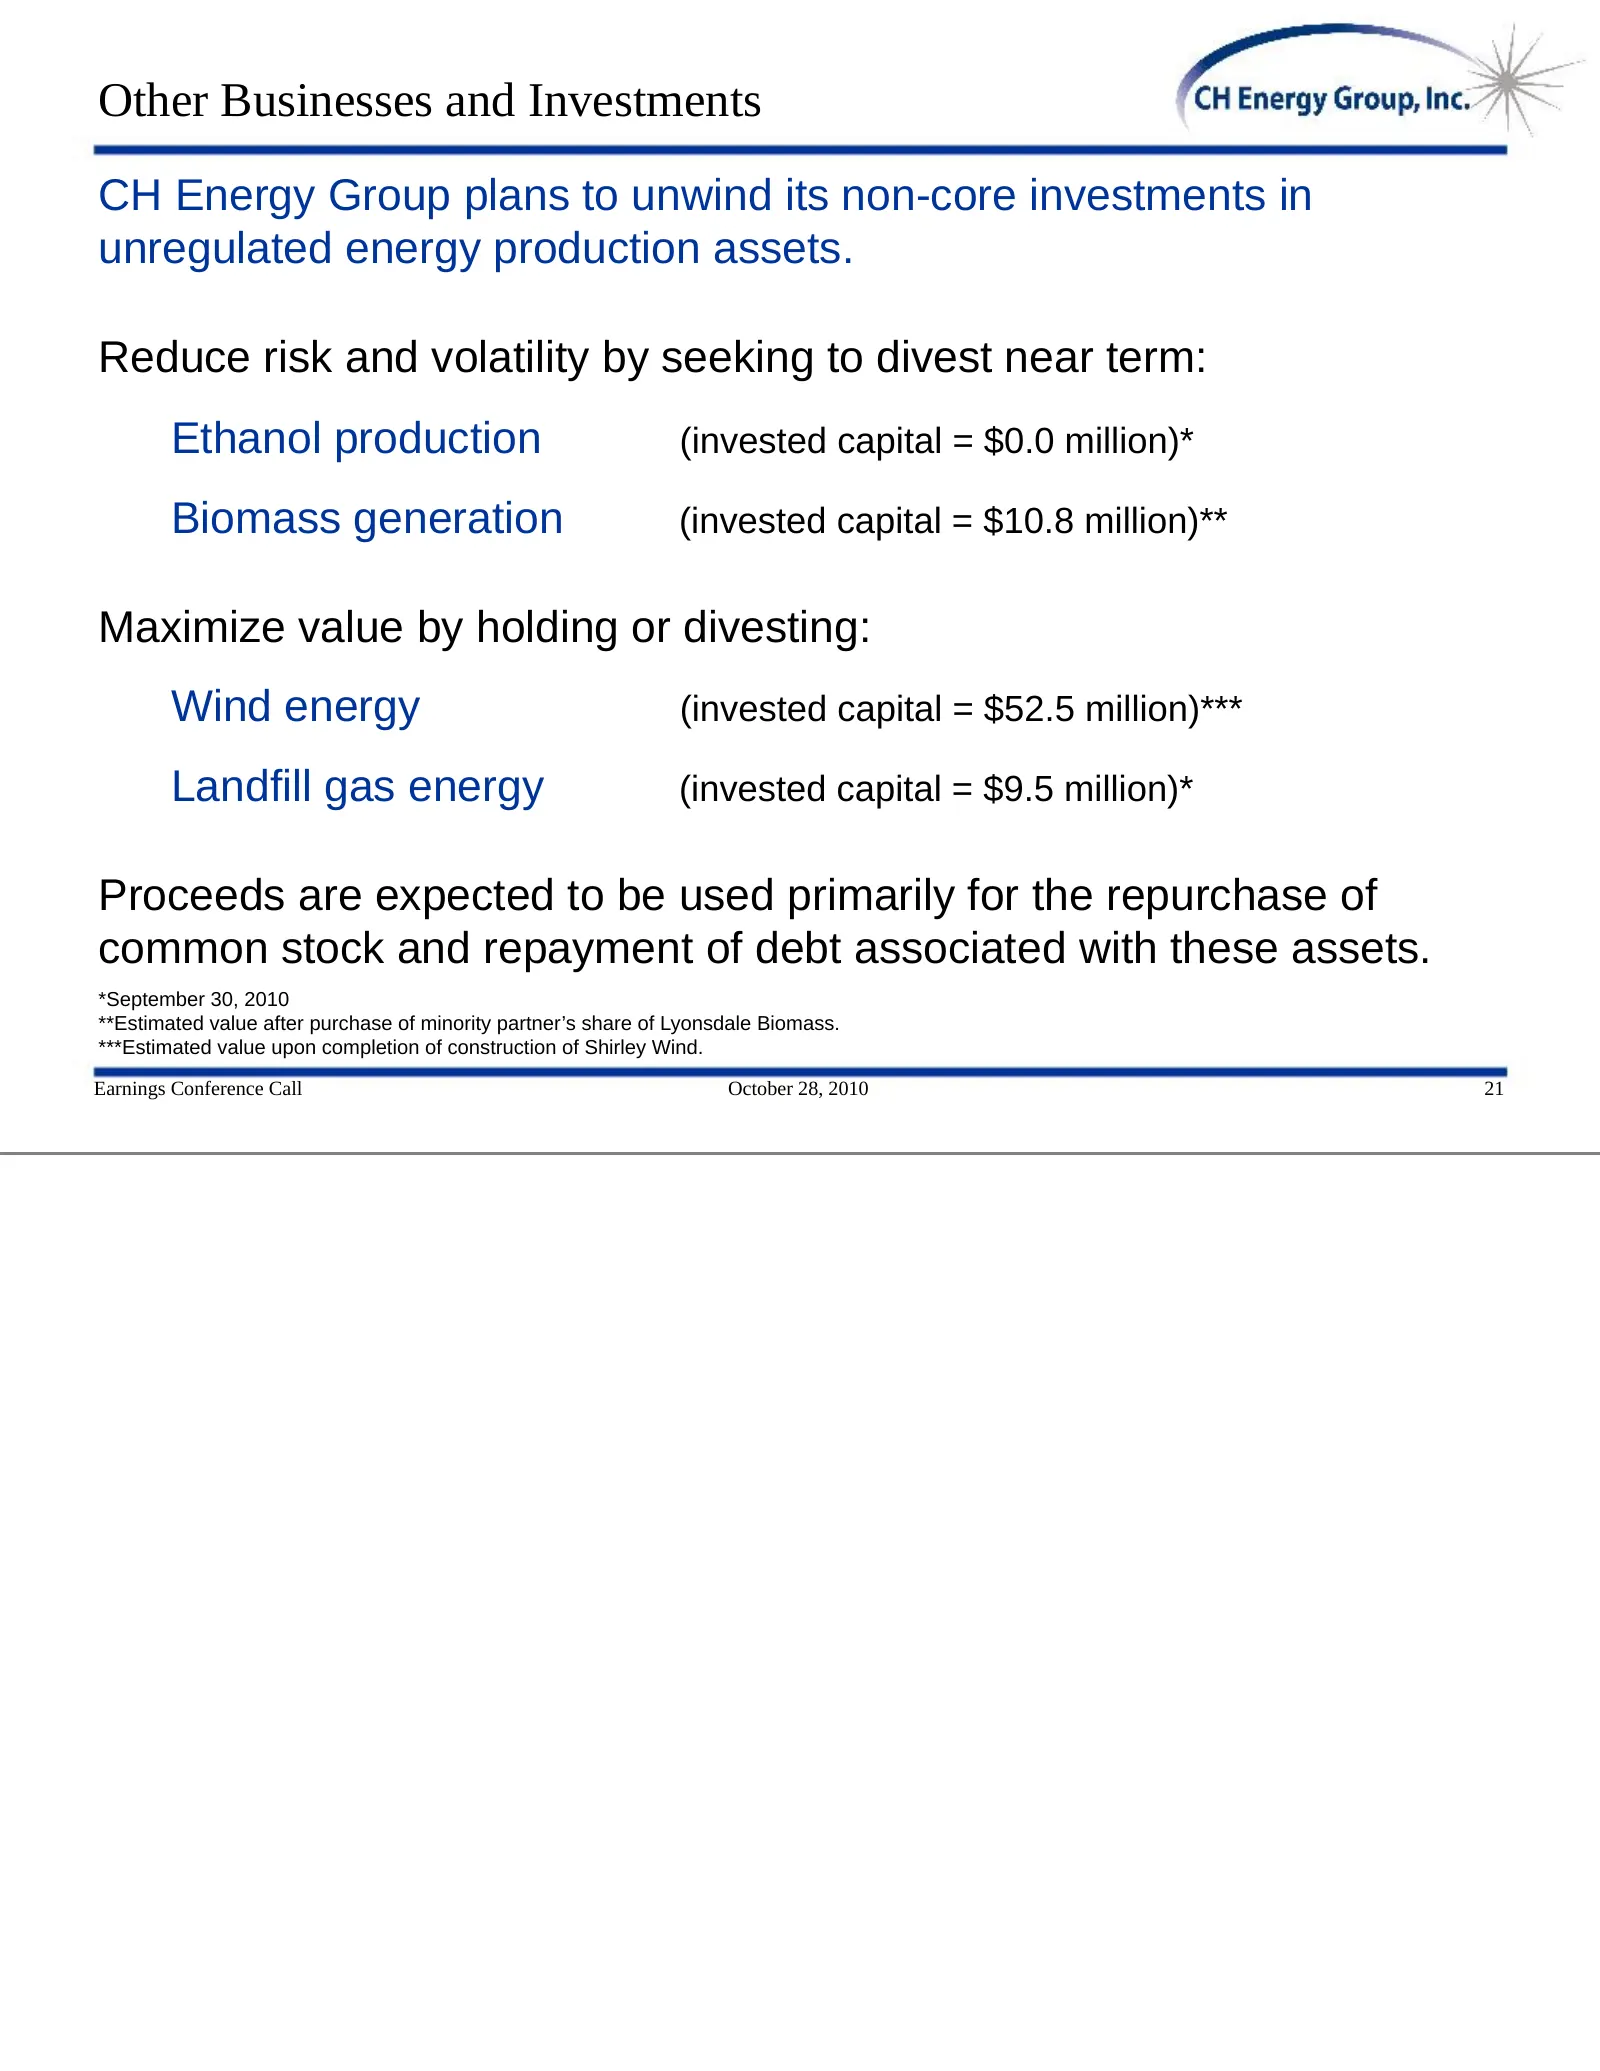
Other Businesses and Investments CH Energy Group plans to unwind its non-core investments in unregulated energy production assets. Reduce risk and volatility by seeking to divest near term: Ethanol production (invested capital = $0.0 million)* Biomass generation (invested capital = $10.8 million)**
Slide 23: Shareholder Value
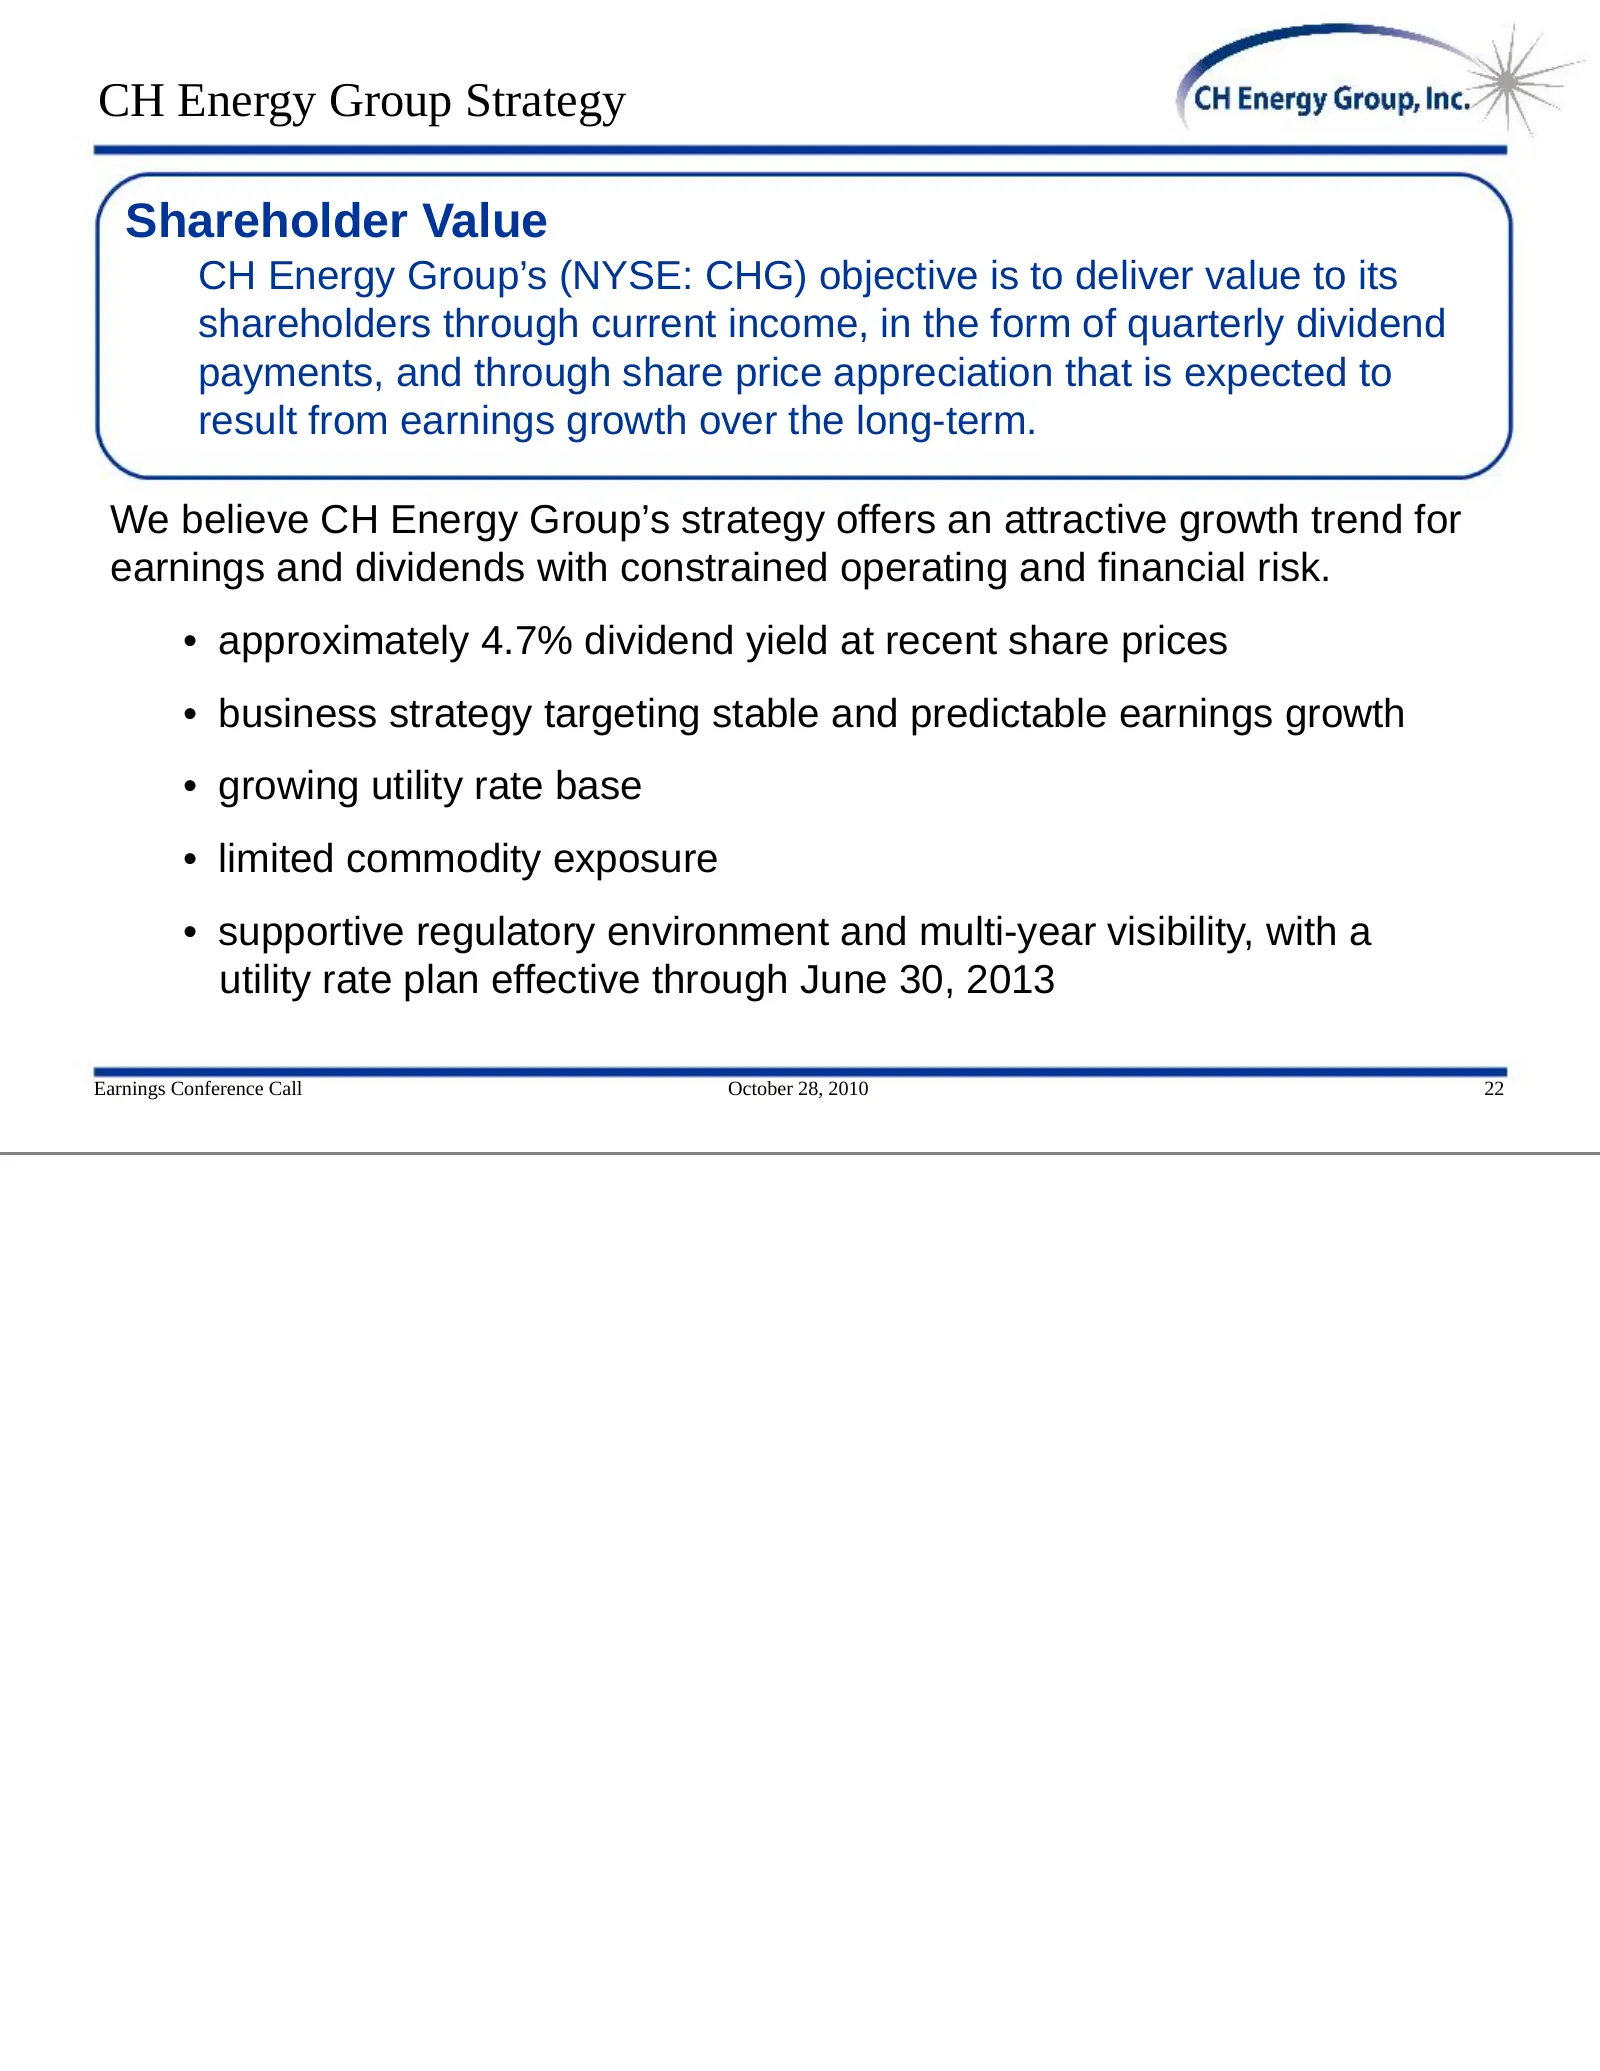
CH Energy Group Strategy Shareholder Value CH Energy Group’s (NYSE: CHG) objective is to deliver value to its shareholders through current income, in the form of quarterly dividend payments, and through share price appreciation that is expected to result from earnings growth over the long-term. We b
Slide 24: Key financial objectives over the next five years
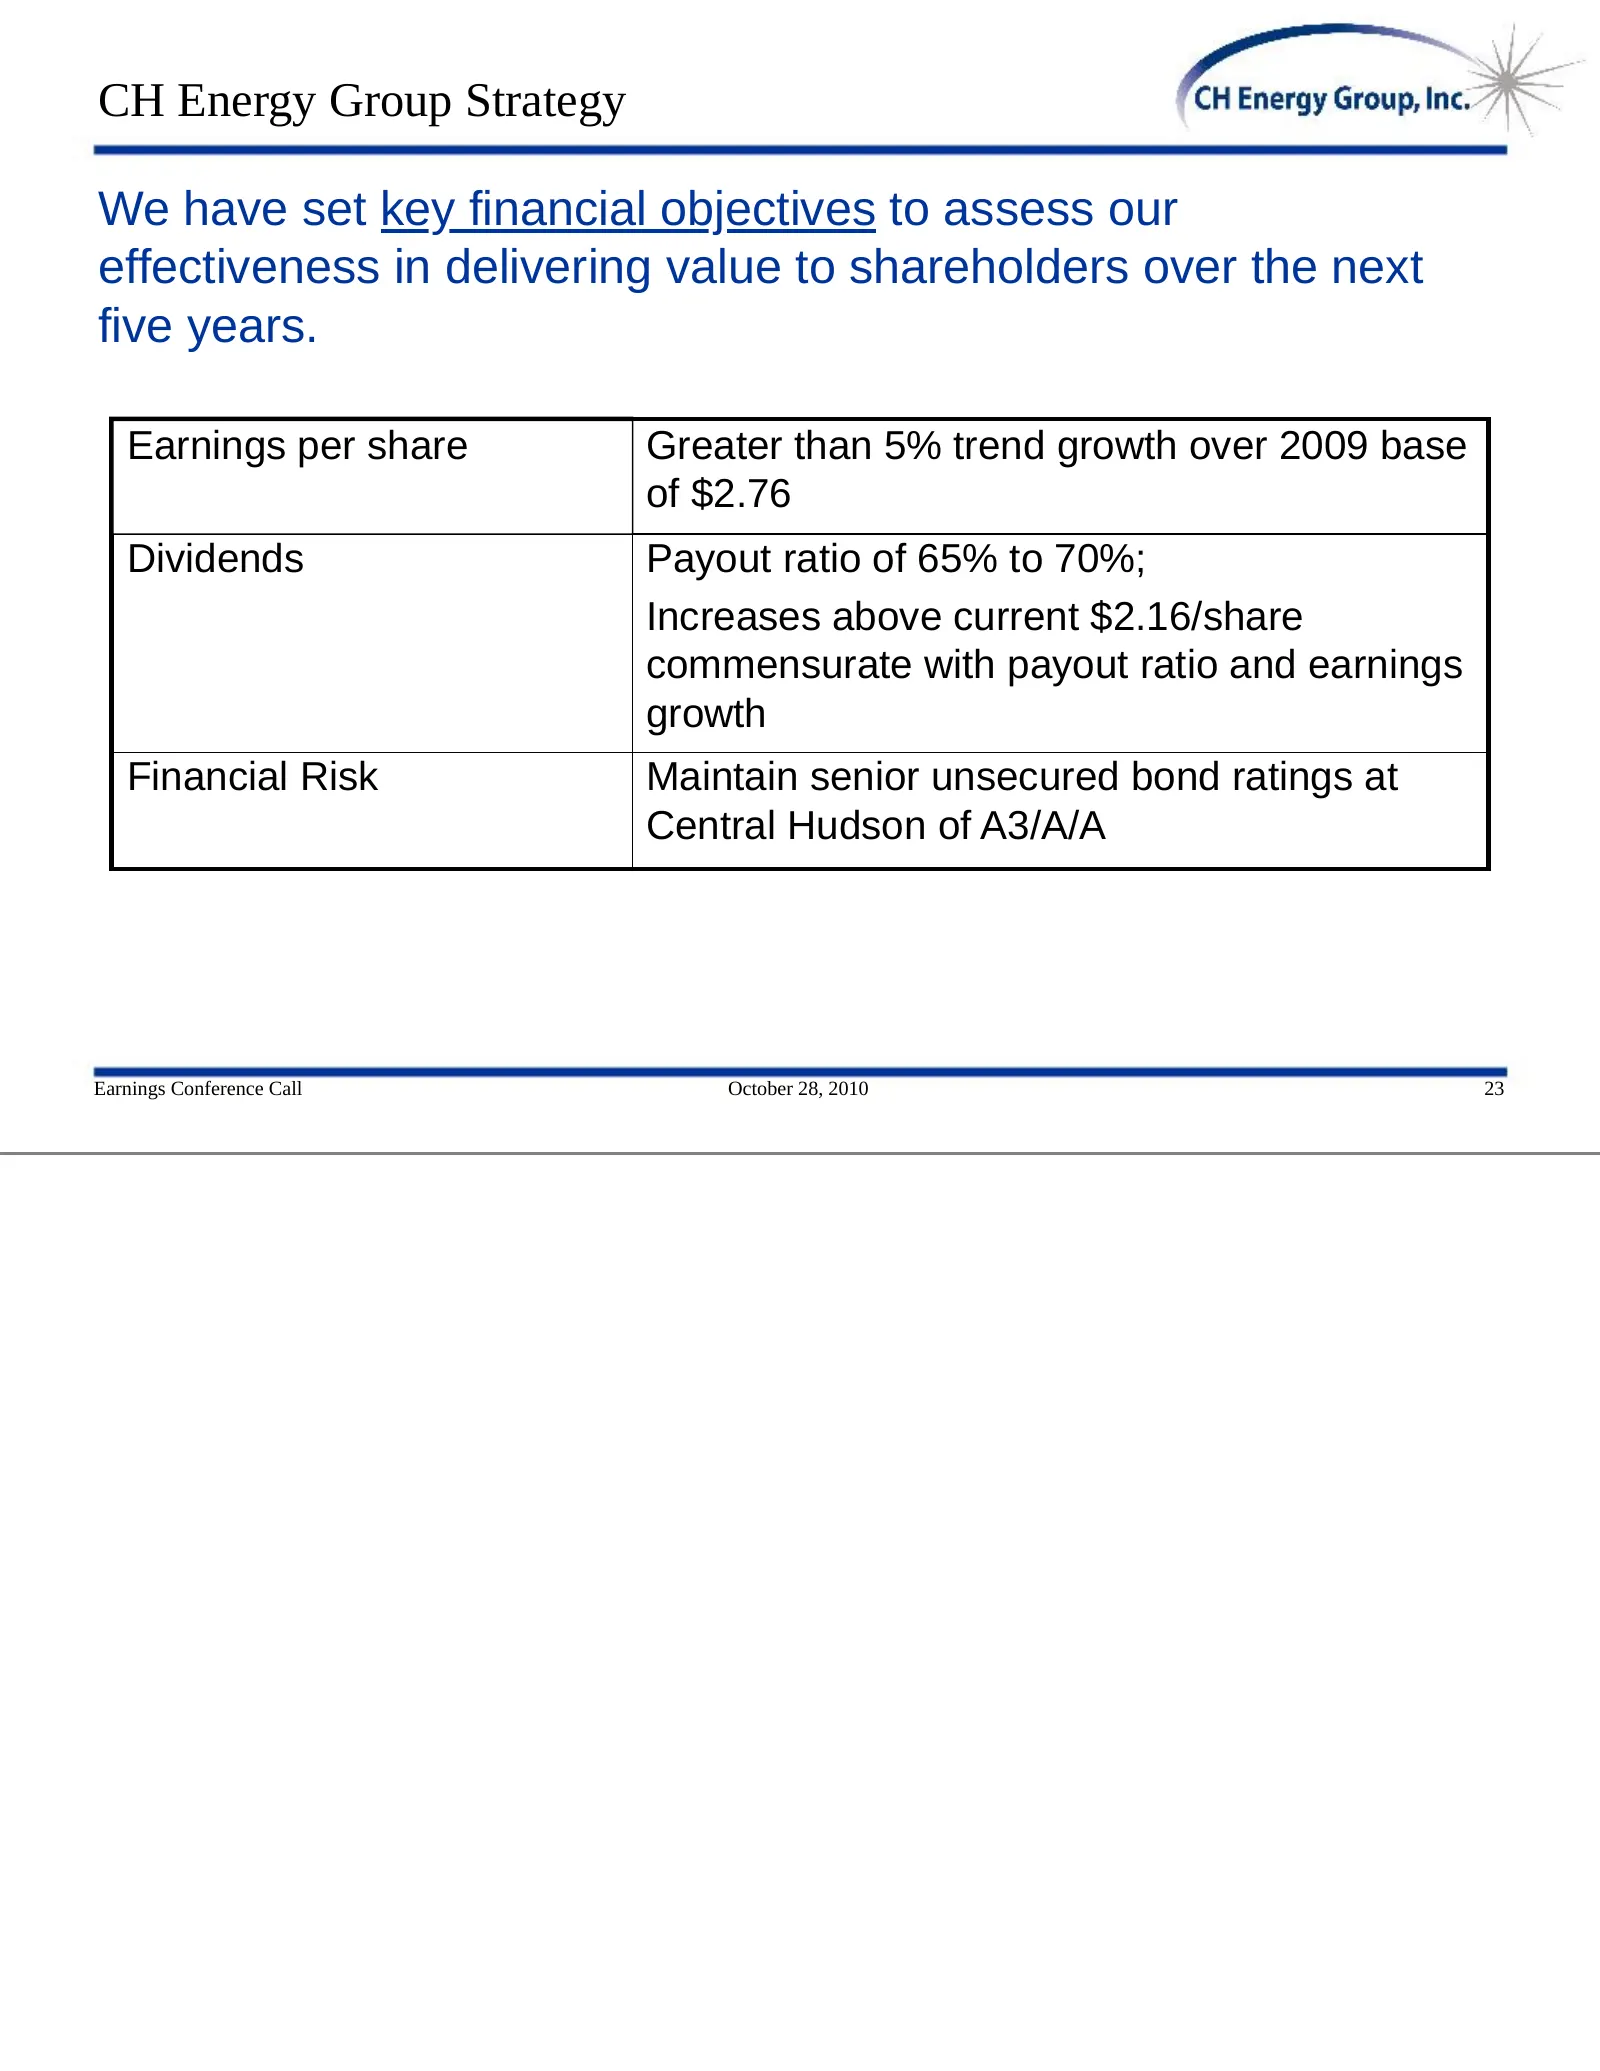
CH Energy Group Strategy We have set key financial objectives to assess our effectiveness in delivering value to shareholders over the next five years. Earnings per share Greater than 5% trend growth over 2009 base of $2.76 Dividends Payout ratio of 65% to 70%; Increases above current $2.16/share co
Slide 25: Questions and Answers
Questions and Answers Steven Lant Chairman, President & CEO Christopher Capone Executive Vice President & CFO Kim Wright Vice President - Accounting & Controller Stacey Renner Treasurer (Investor Contact) Earnings Conference Call October 28, 2010 24
Slide 26: Earnings Release Supplement
Earnings Release Supplement • Segment EPS Reconciliation • Segment Information, Revenue • Segment Information, Net Income • Segment Information, Assets • Selected Operational Information Earnings Conference Call October 28, 2010 25
Slide 27: Financial Results - CH Energy Group
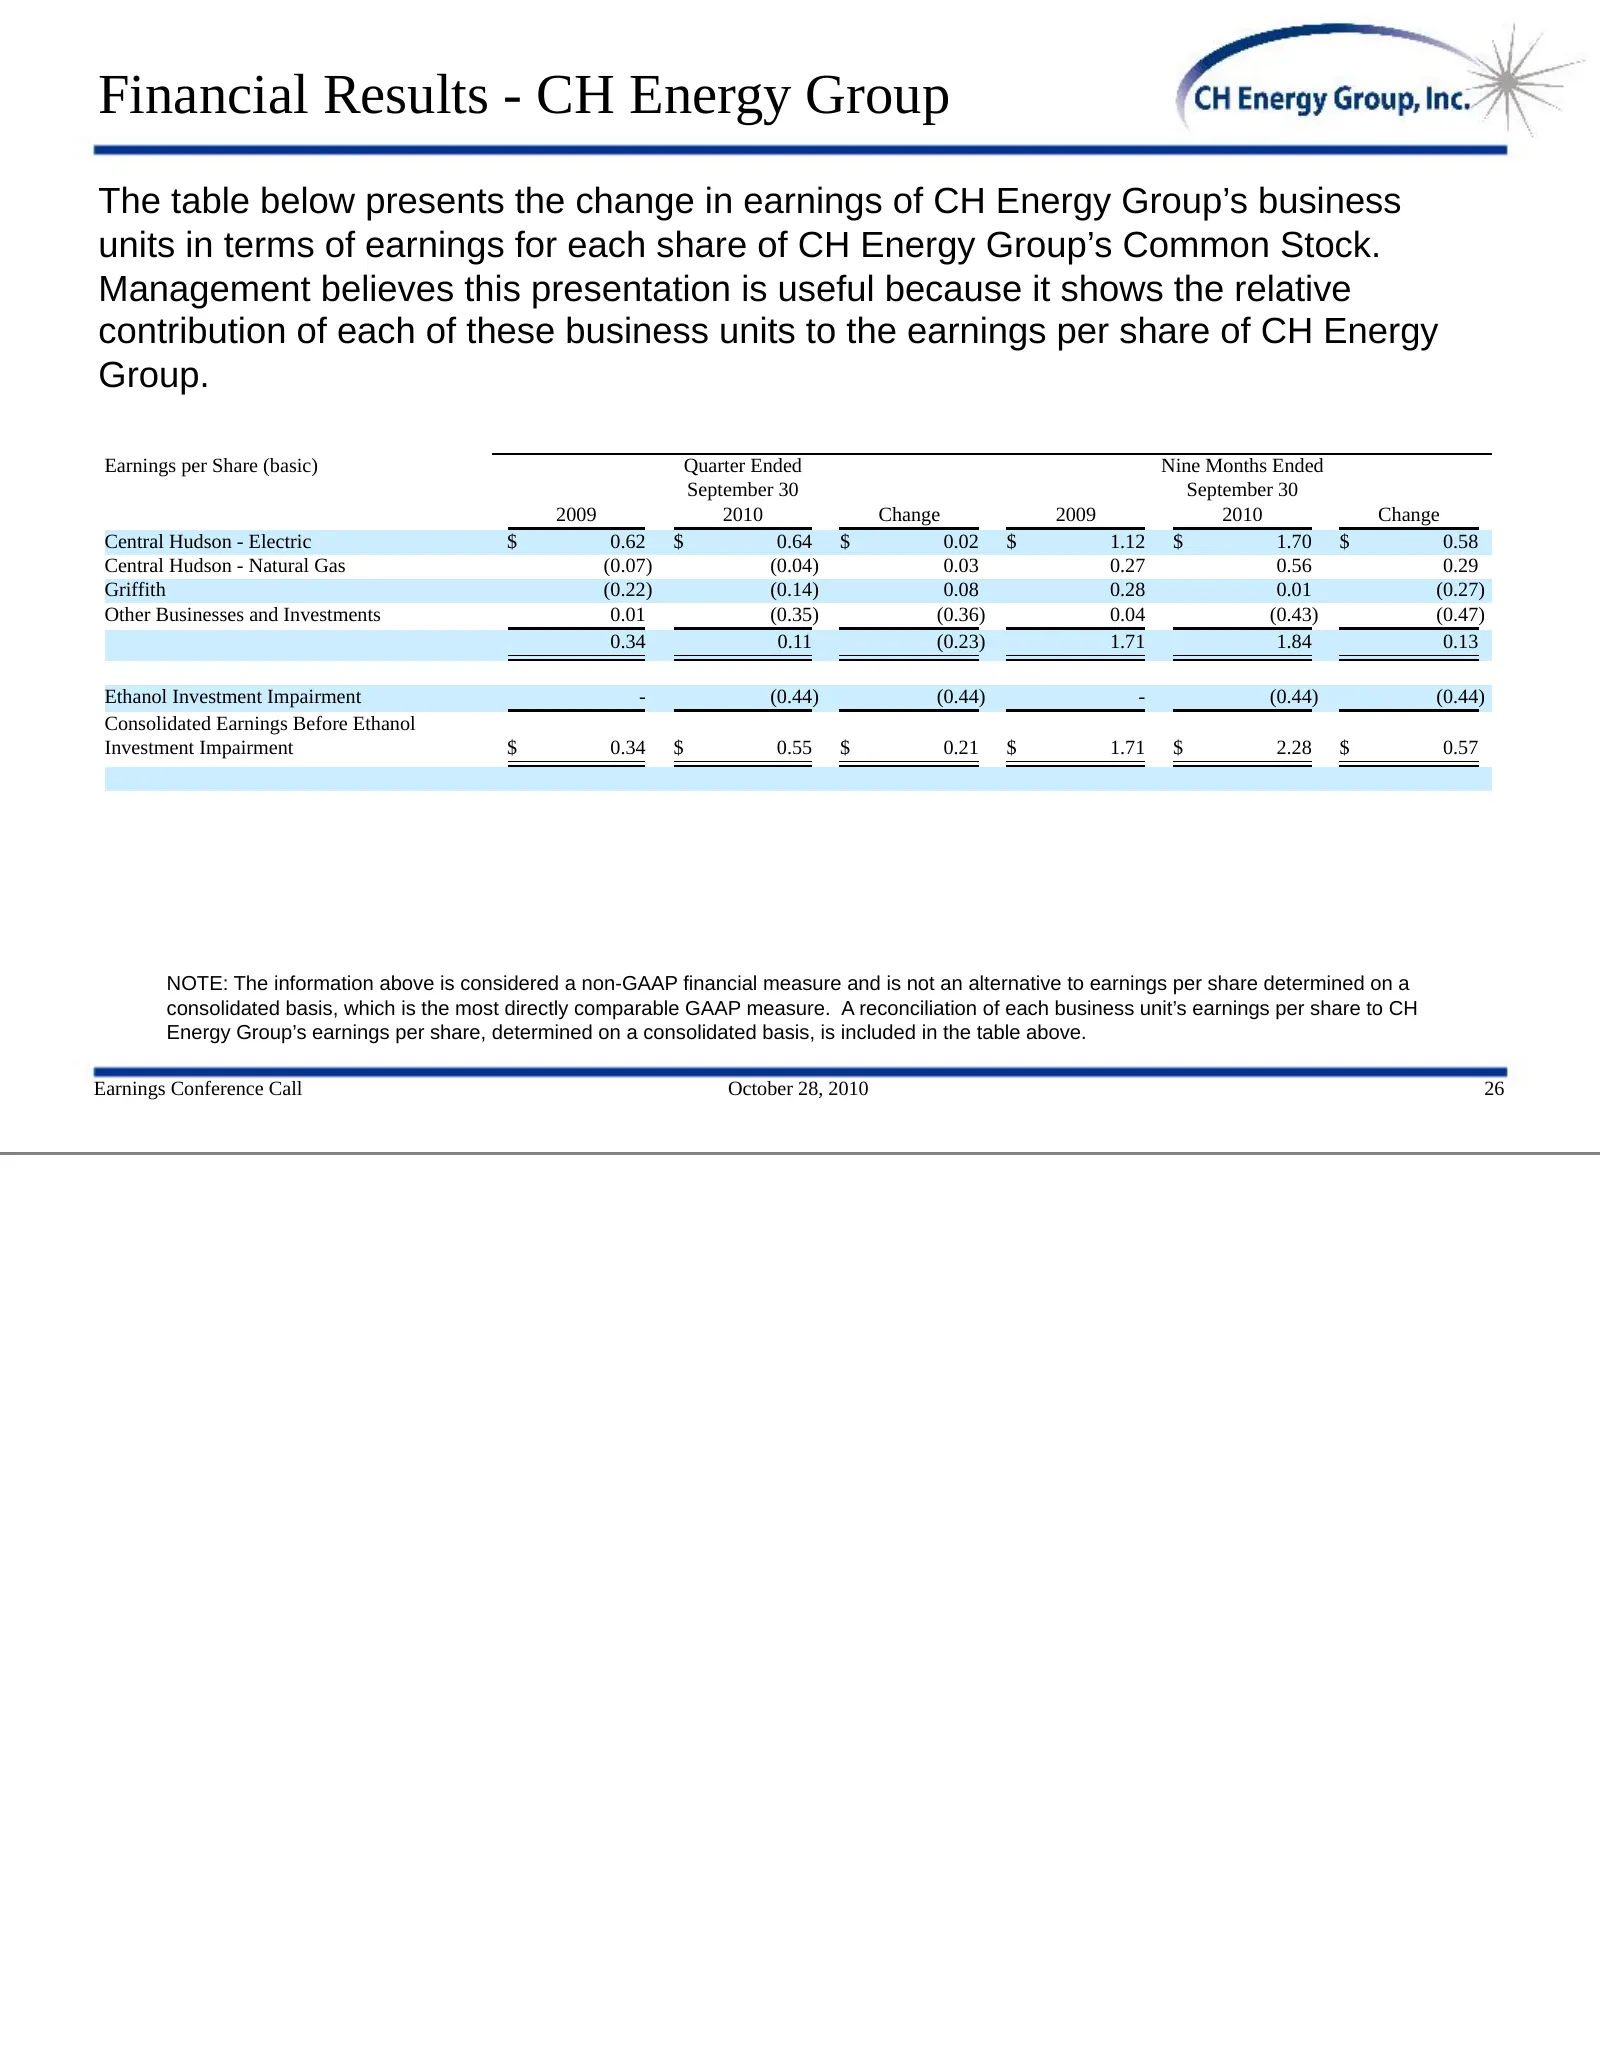
Financial Results - CH Energy Group The table below presents the change in earnings of CH Energy Group’s business units in terms of earnings for each share of CH Energy Group’s Common Stock. Management believes this presentation is useful because it shows the relative contribution of each of these b
Slide 28: Segment Information, Revenue
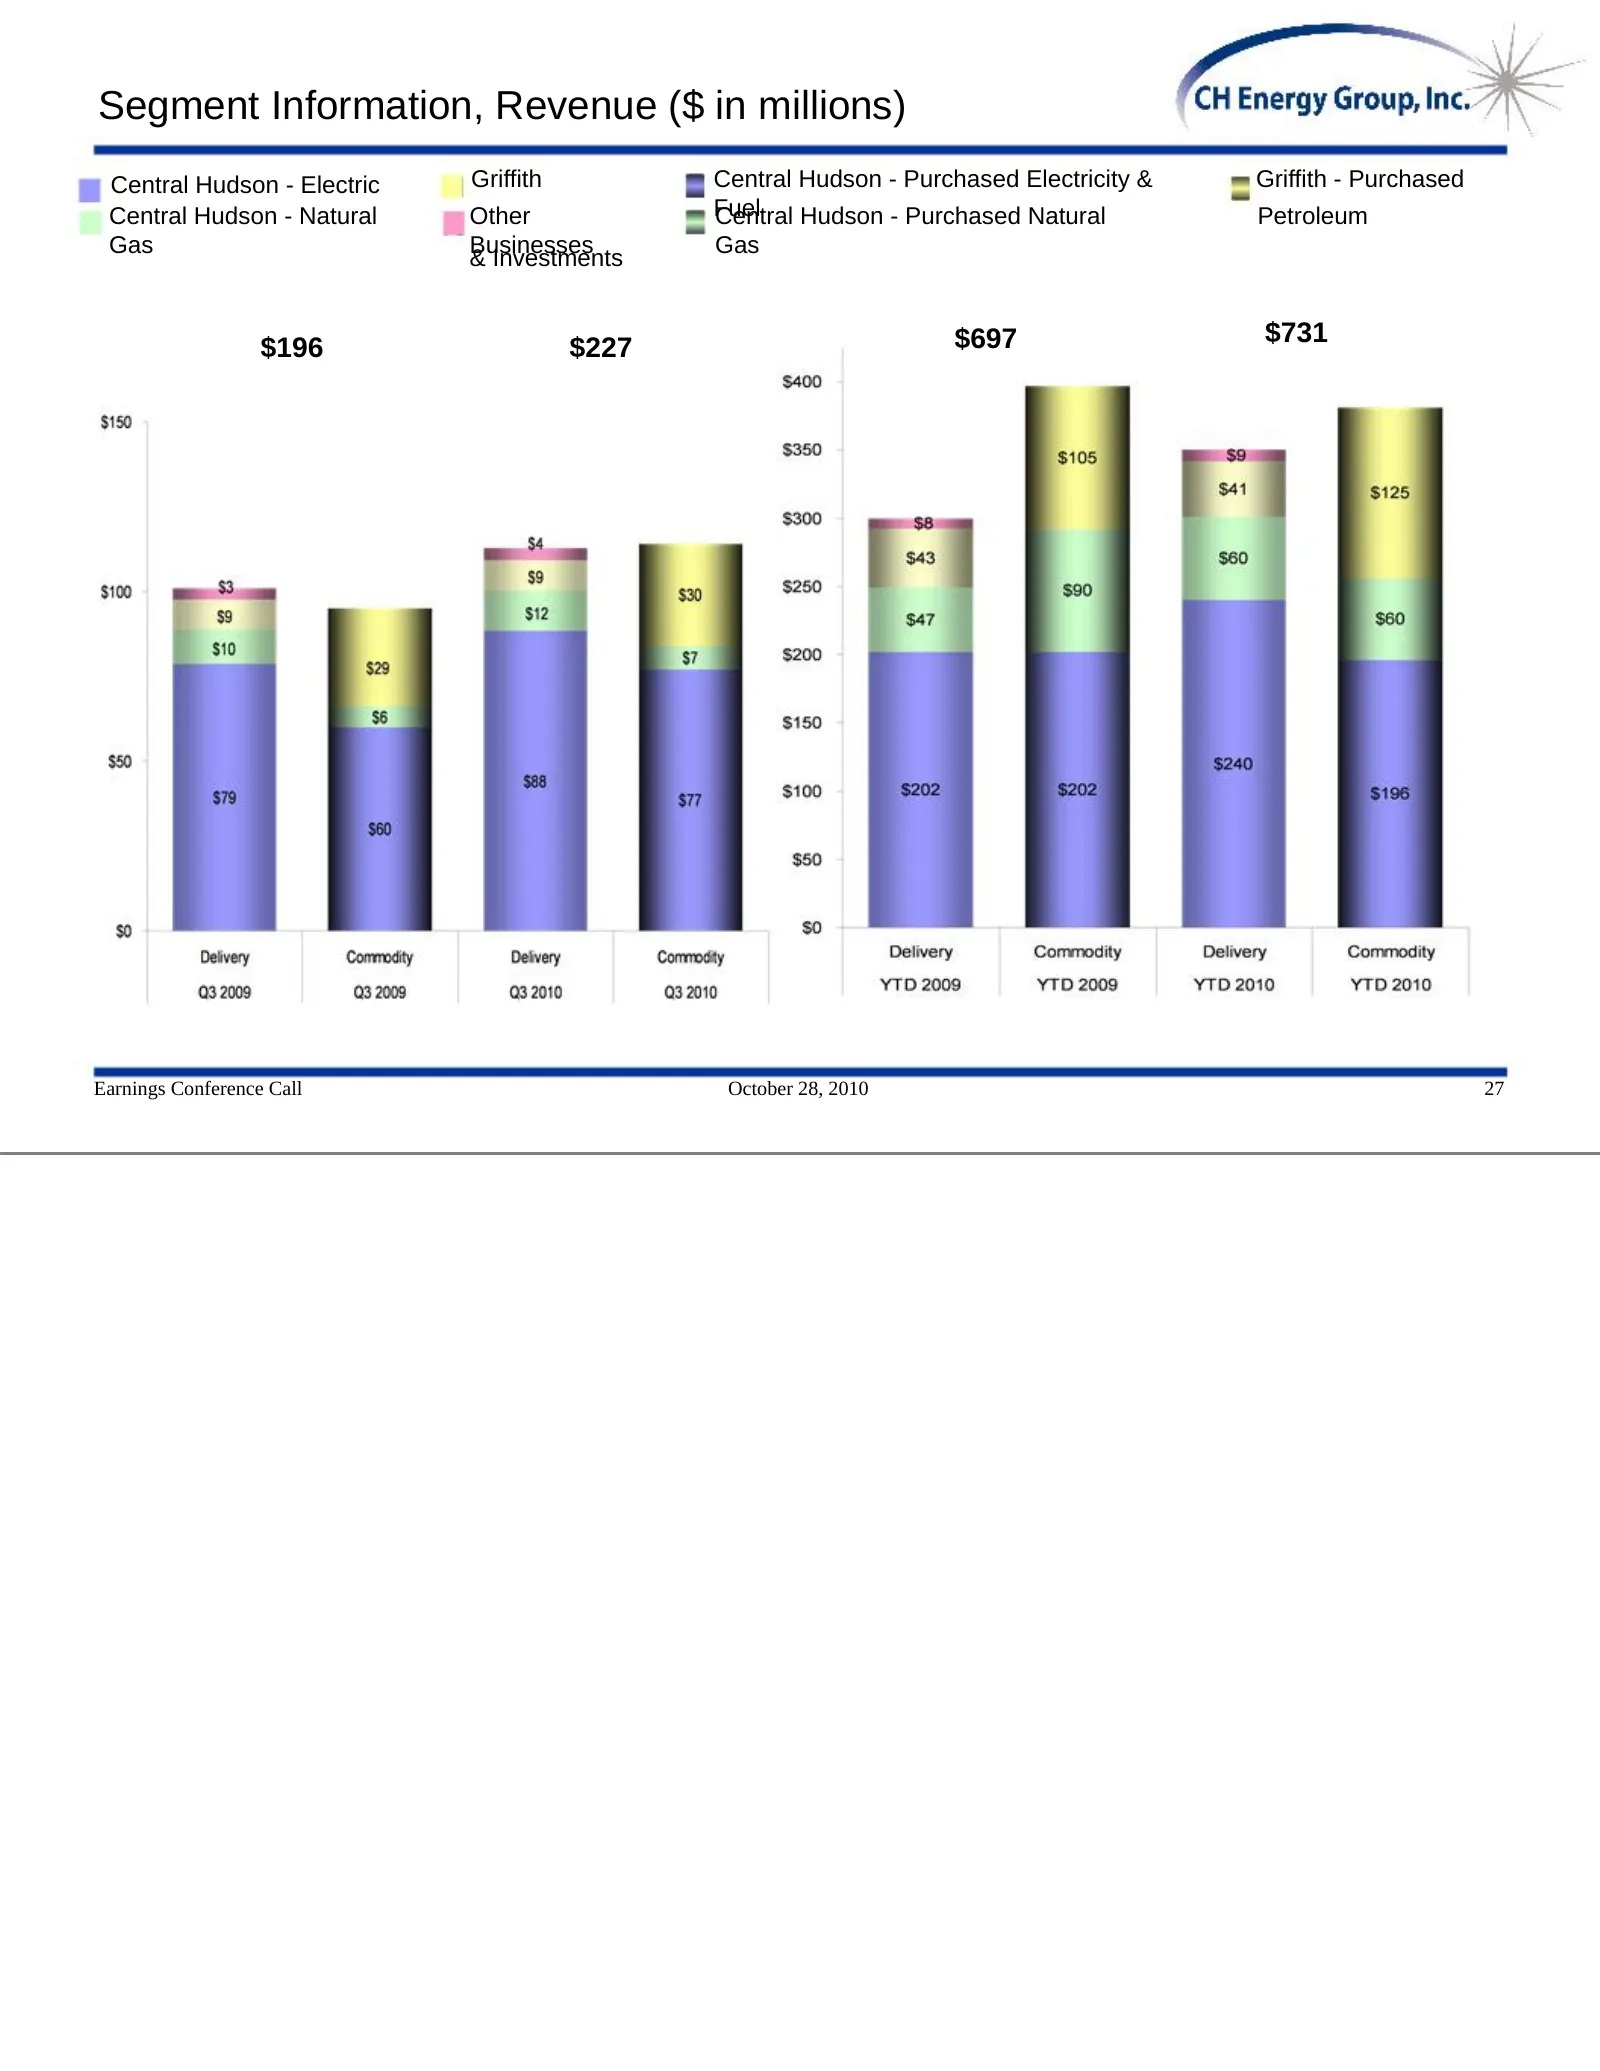
Segment Information, Revenue ($ in millions) Central Hudson - Electric Griffith Central Hudson - Purchased Electricity & Griffith - Purchased Central Hudson - Natural Other Fuel Central Hudson - Purchased Natural Petroleum Gas Businesses Gas & Investments $697 $731 $196 $227 Earnings Conference Call
Slide 29: Segment Information, Net Income
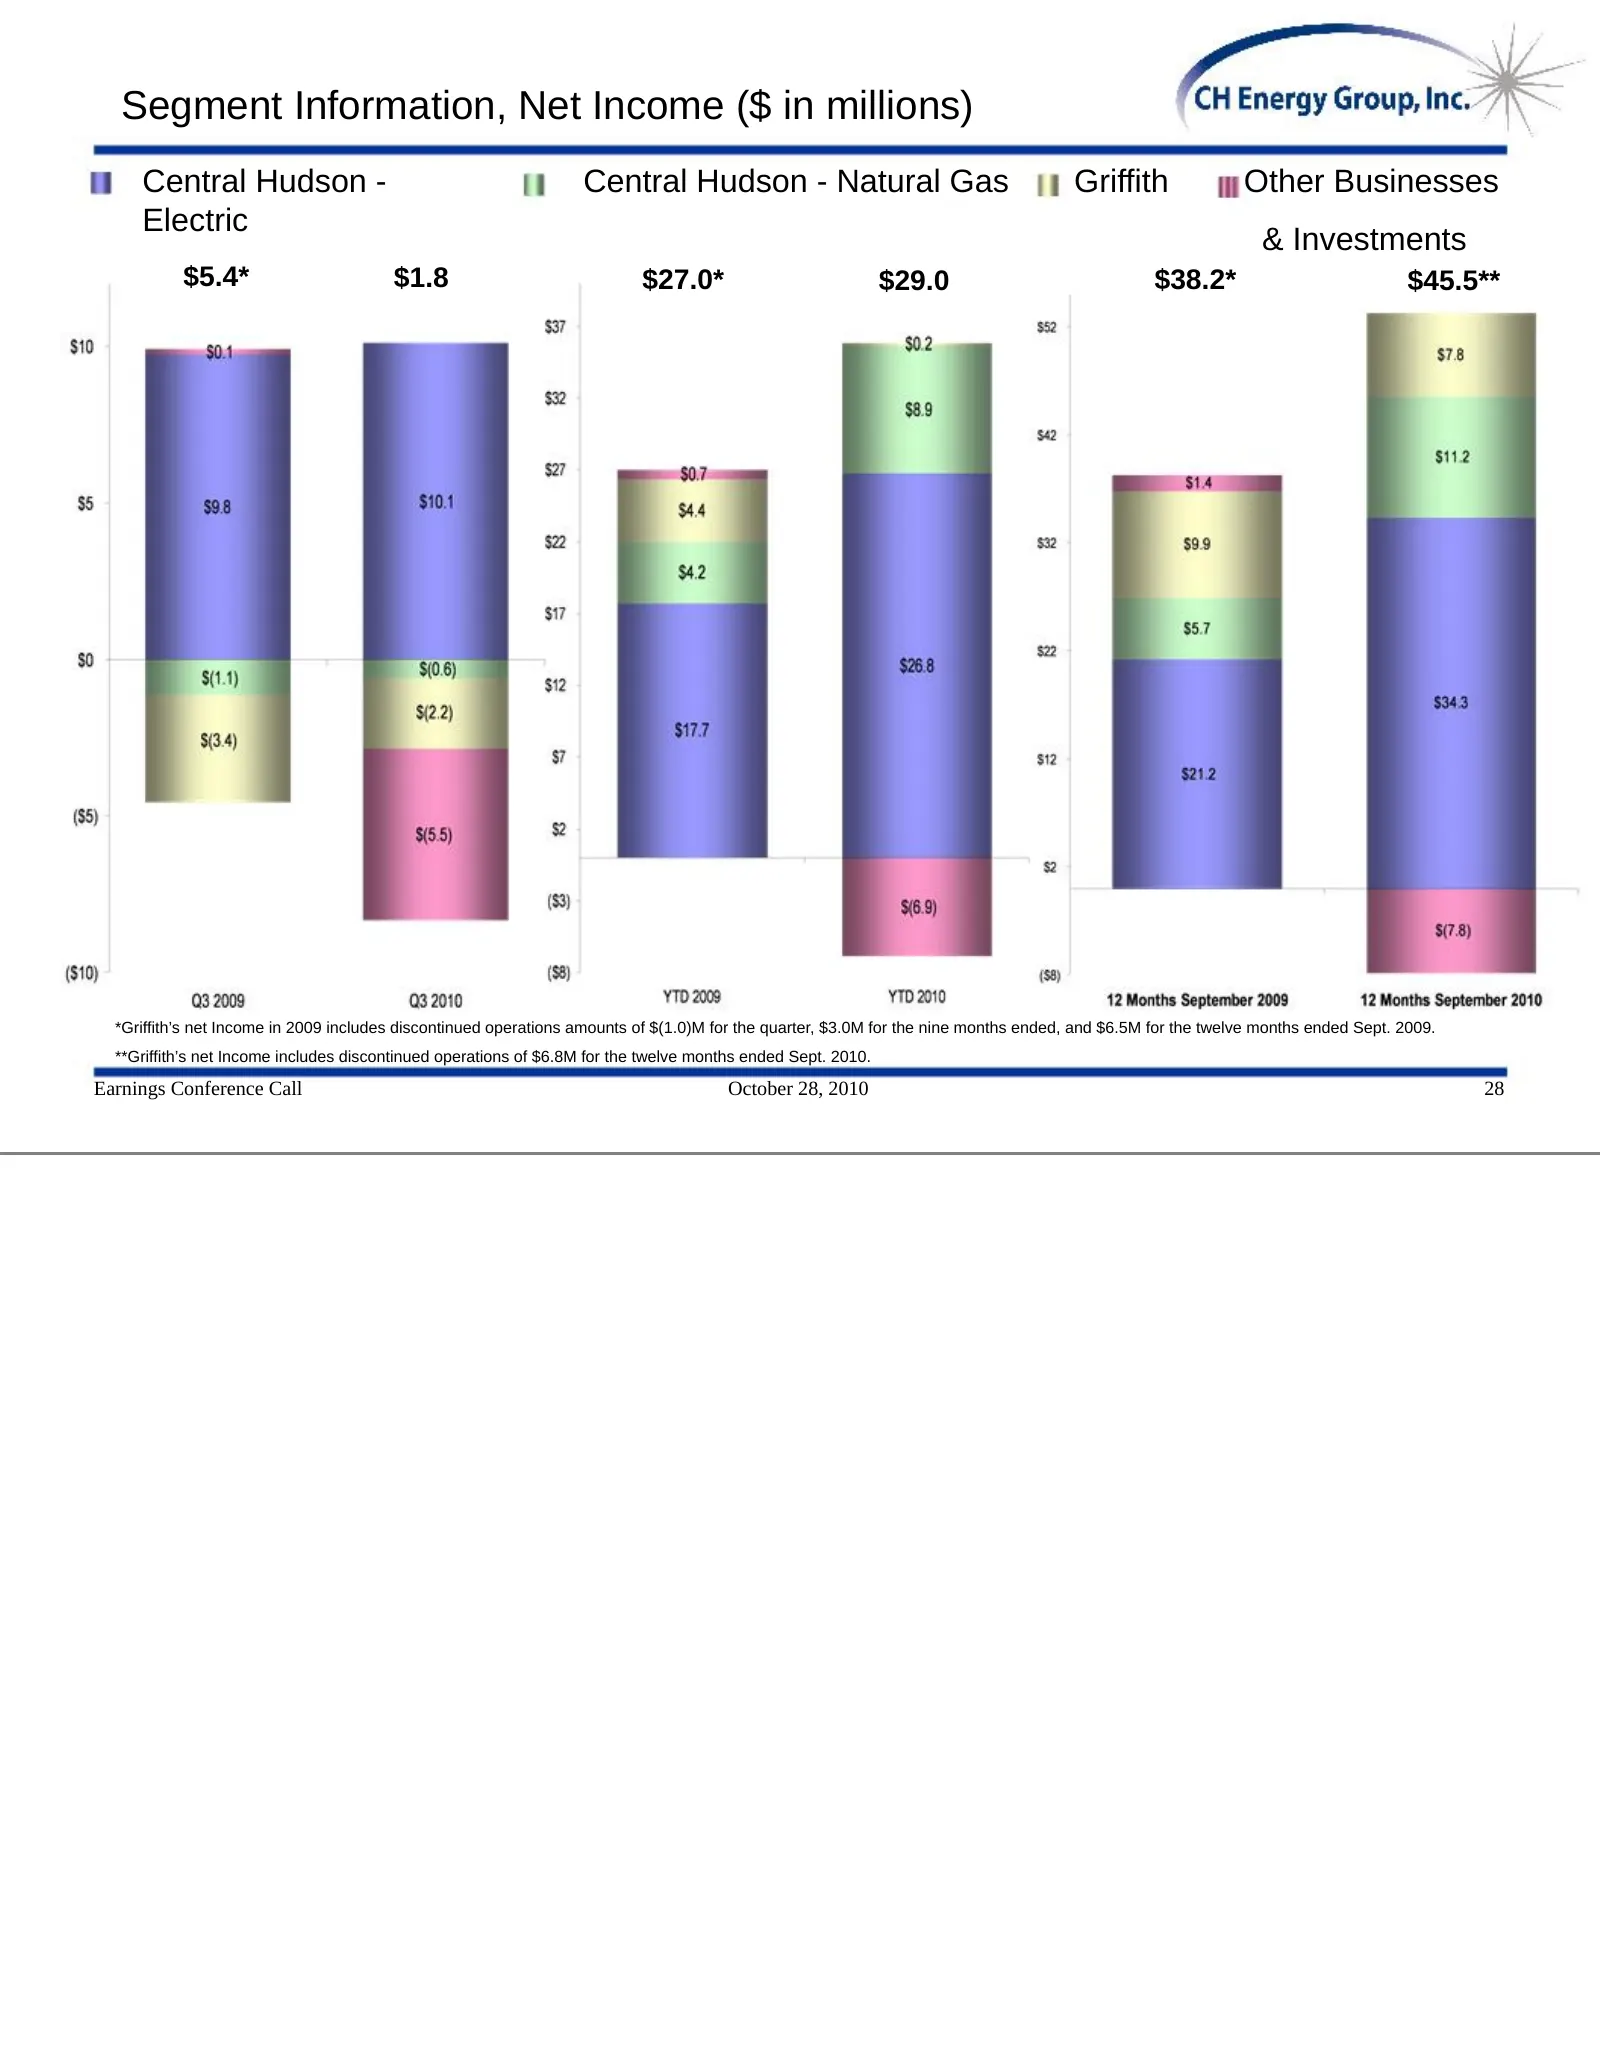
Segment Information, Net Income ($ in millions) Central Hudson - Central Hudson - Natural Gas Griffith Other Businesses Electric & Investments $5.4* $1.8 $27.0* $29.0 $38.2* $45.5** *Griffith’s net Income in 2009 includes discontinued operations amounts of $(1.0)M for the quarter, $3.0M for the nine
Slide 30: Segment Information, Assets
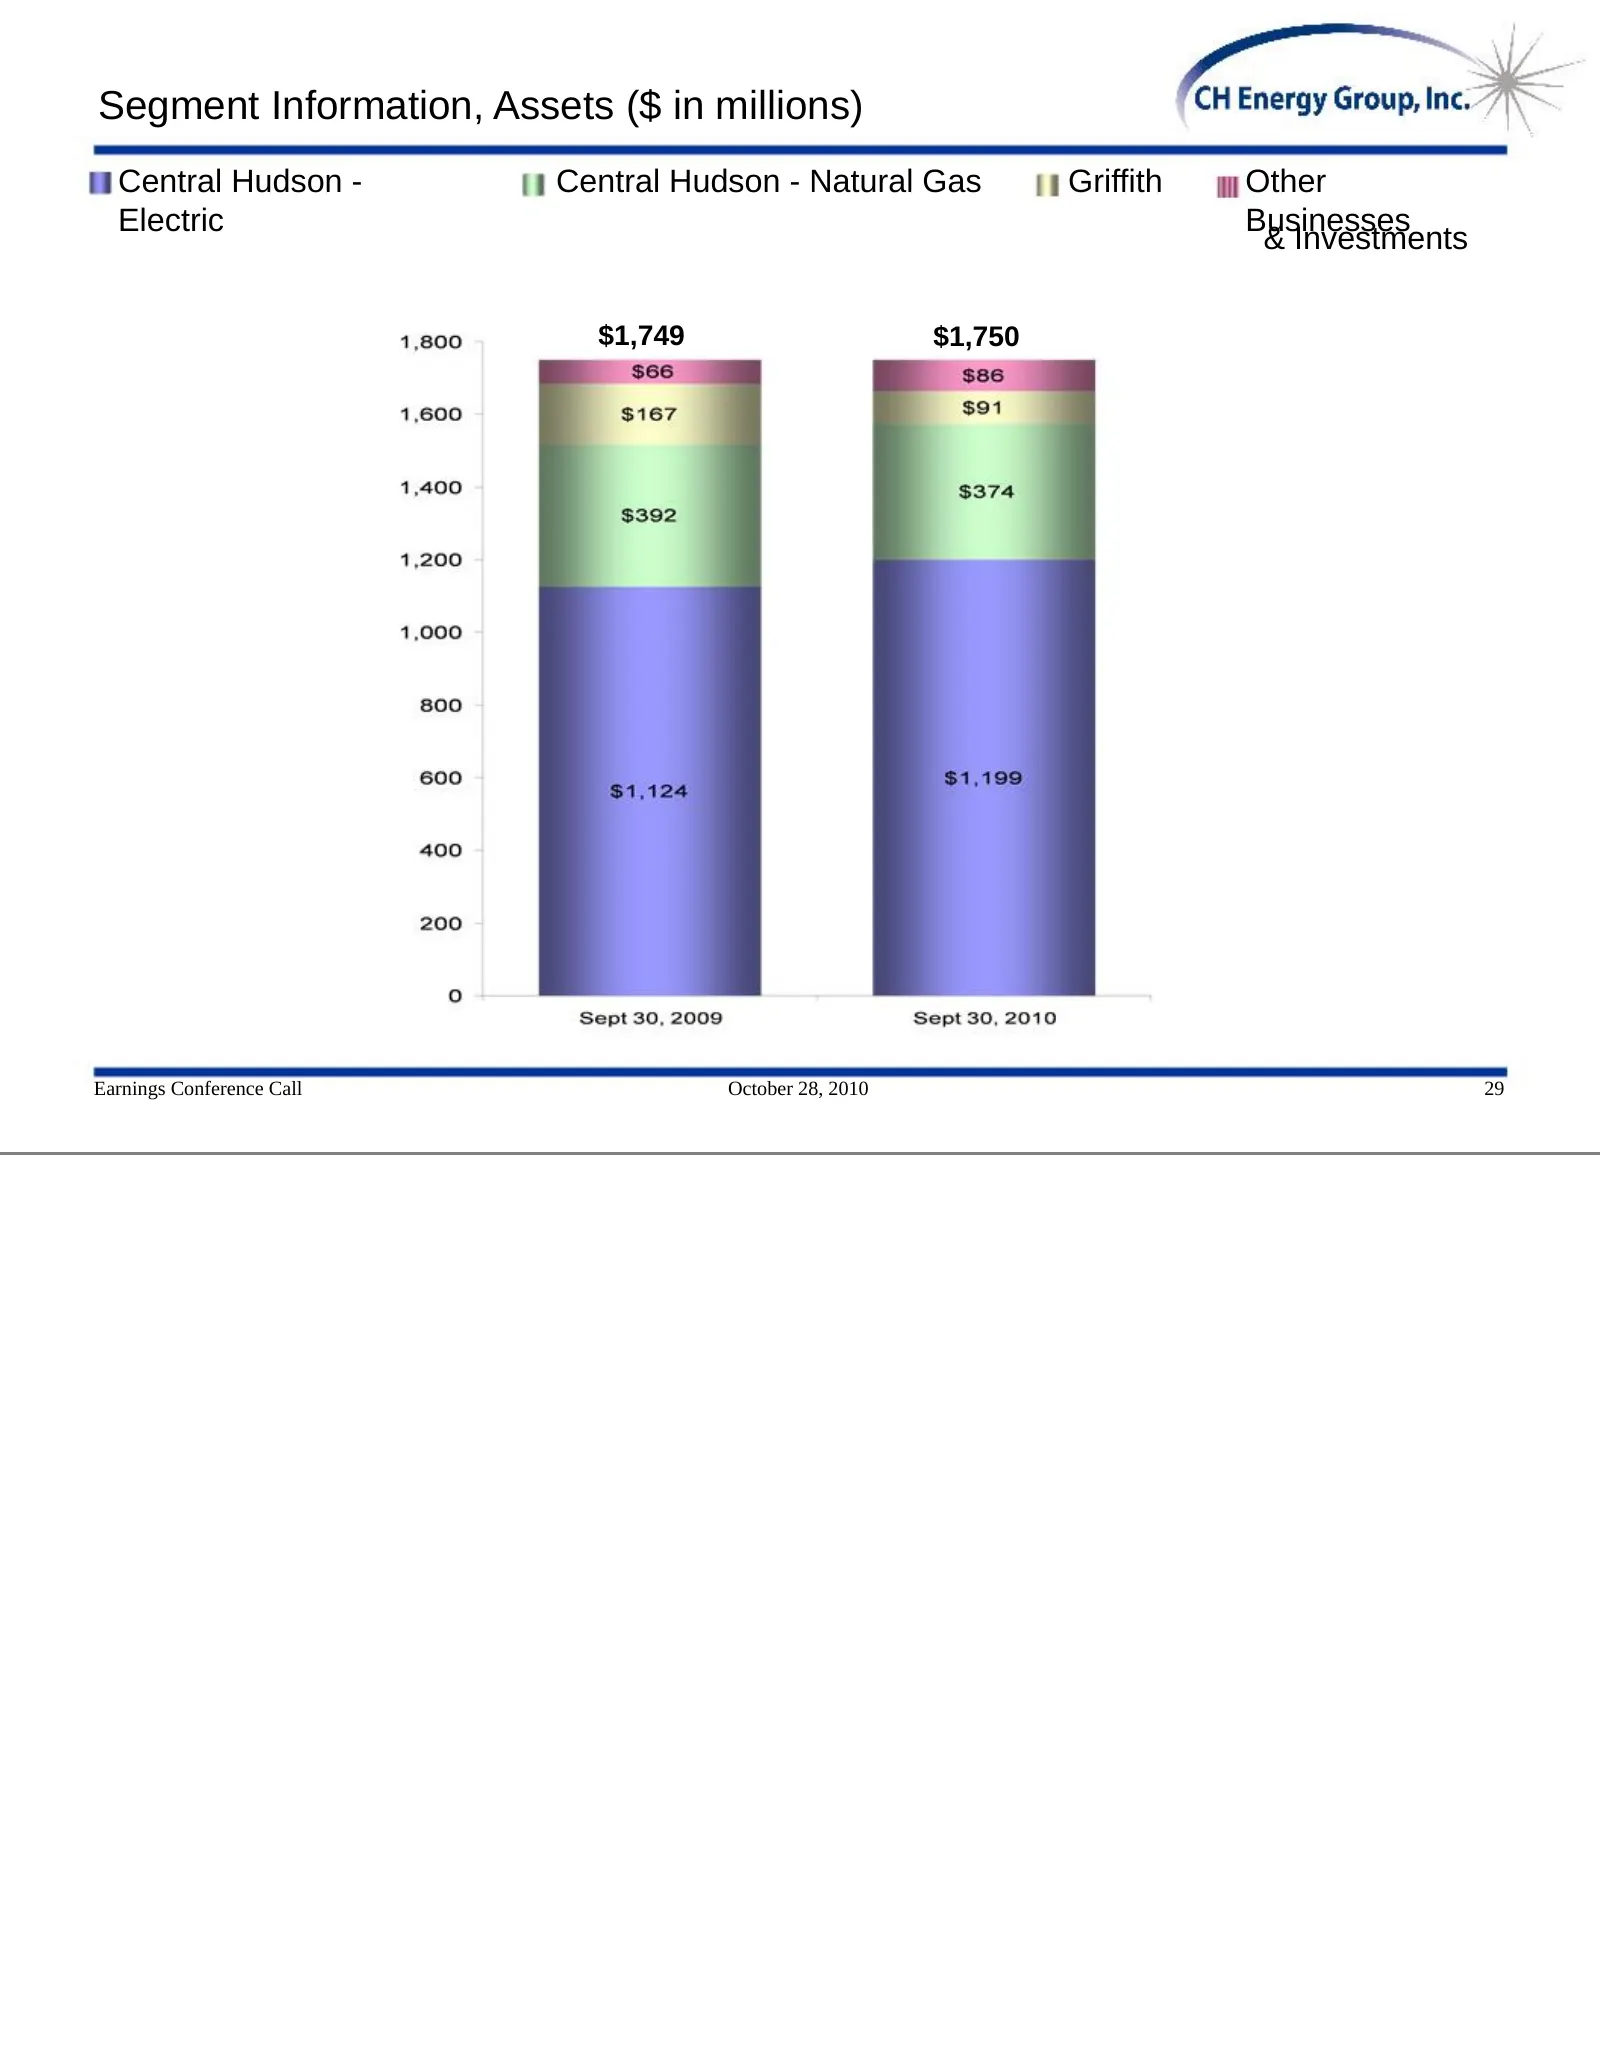
Segment Information, Assets ($ in millions) Central Hudson - Central Hudson - Natural Gas Griffith Other Electric Businesses & Investments $1,749 $1,750 Earnings Conference Call October 28, 2010 29
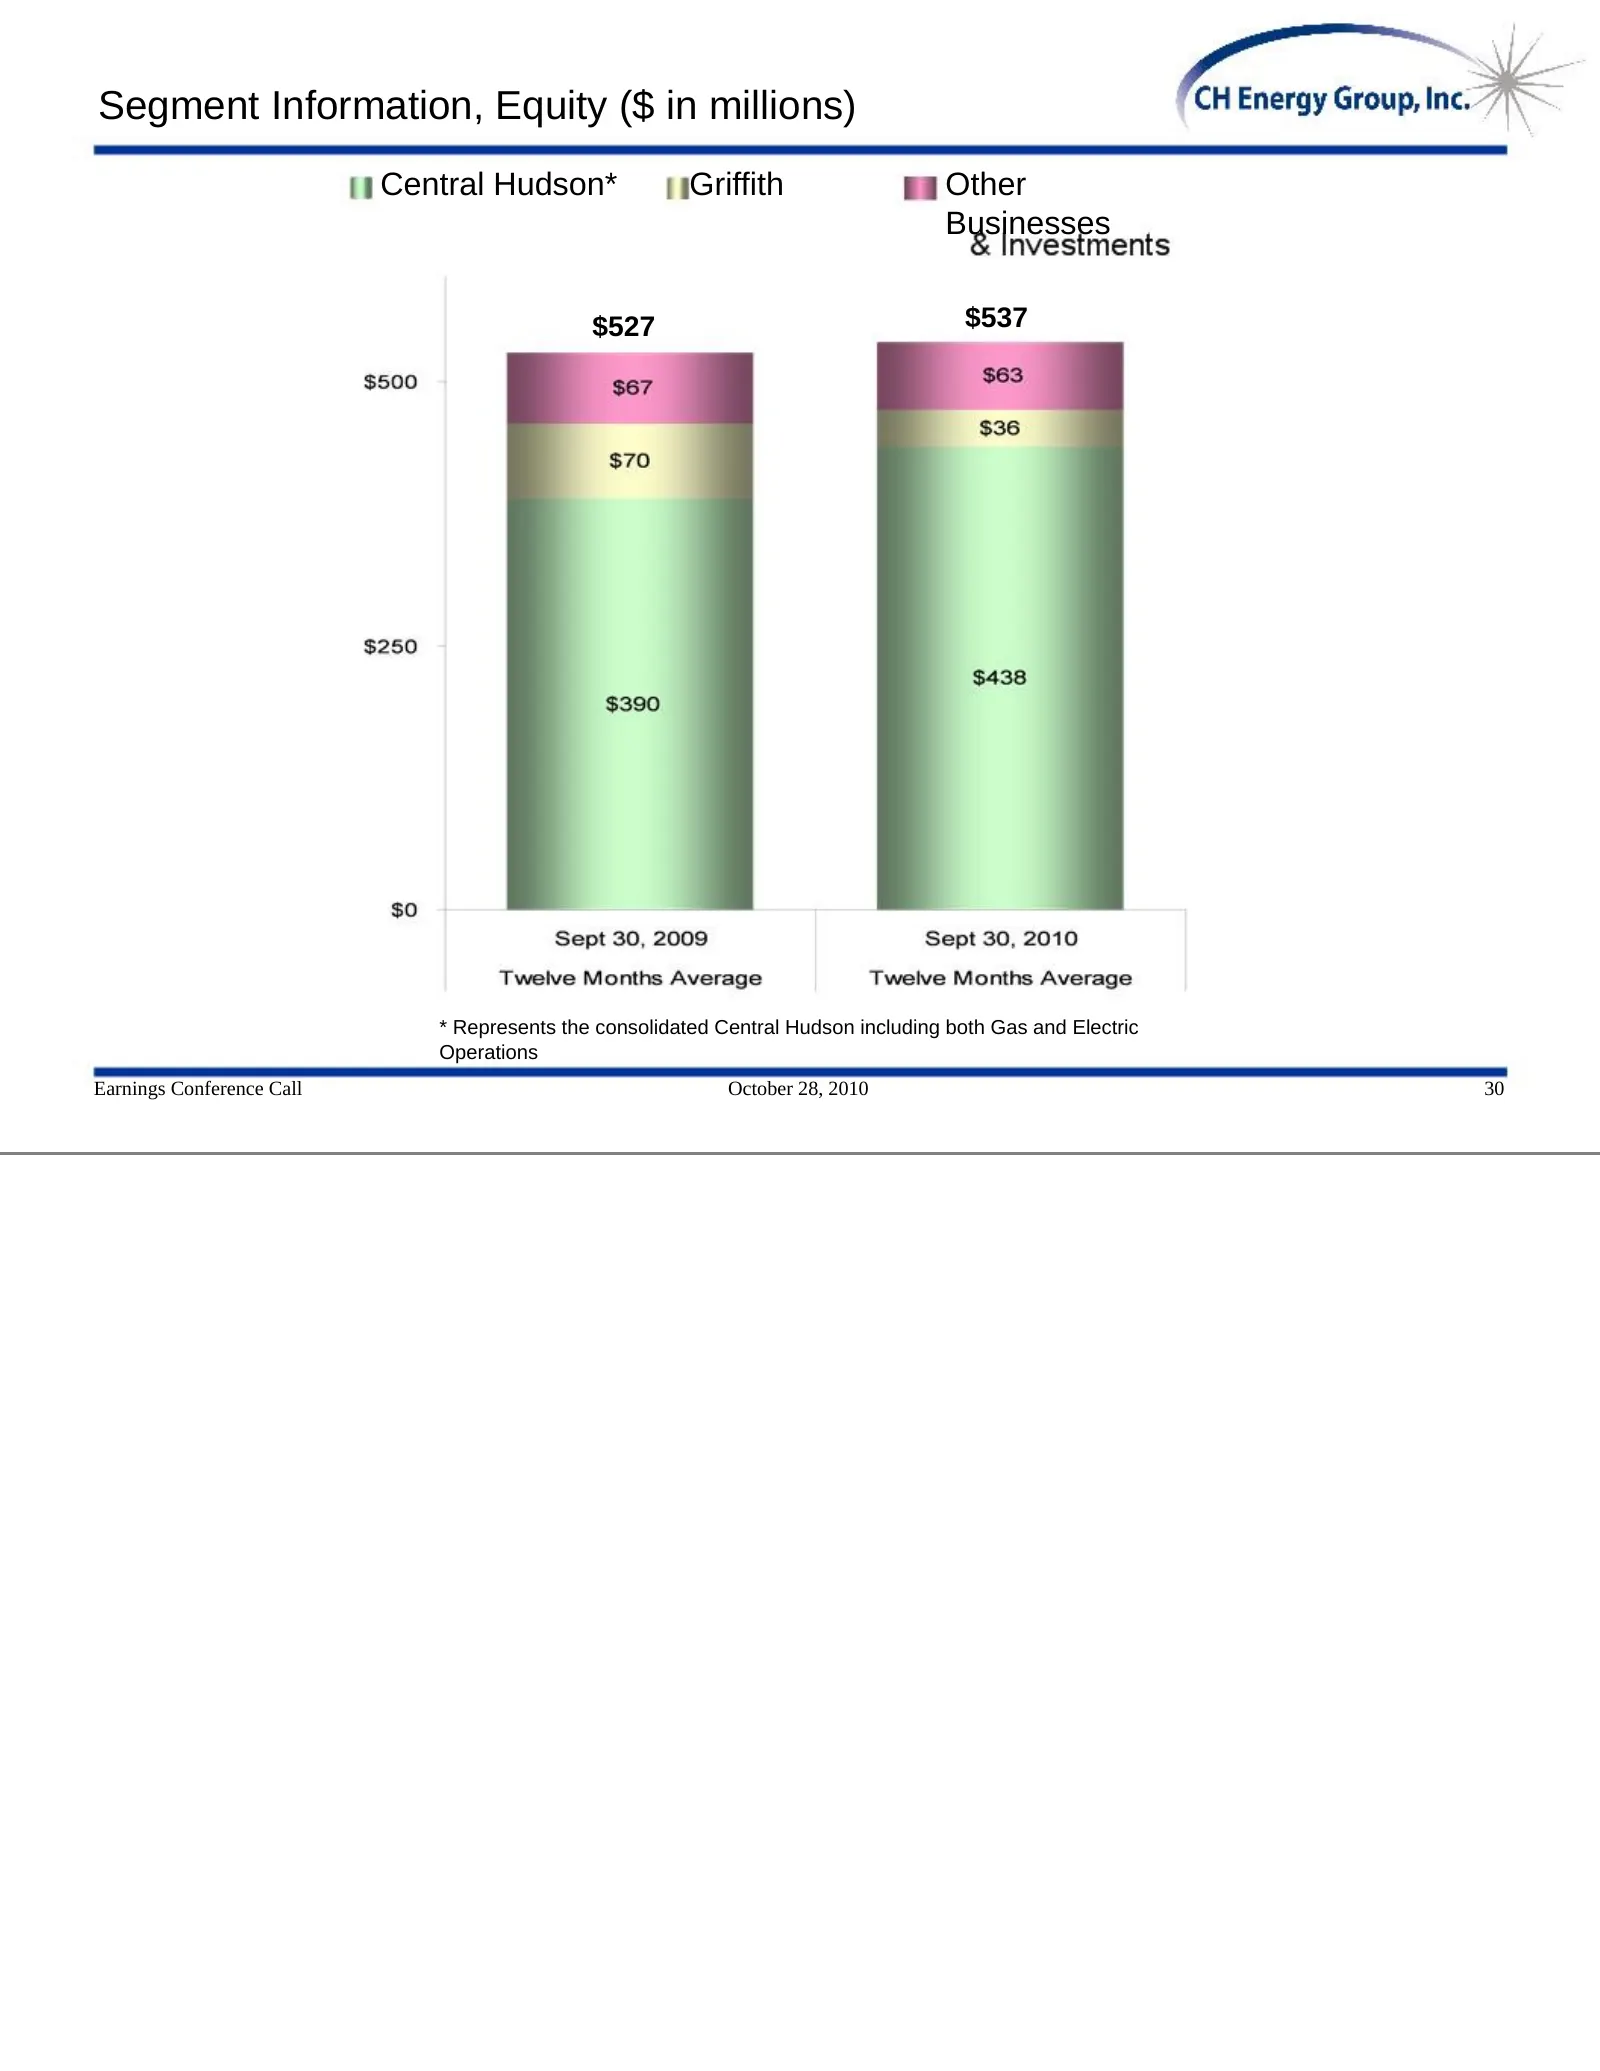
Slide 31: Segment Information, Equity
Segment Information, Equity ($ in millions) Central Hudson* Griffith Other Businesses $527 $537 * Represents the consolidated Central Hudson including both Gas and Electric Operations Earnings Conference Call October 28, 2010 30
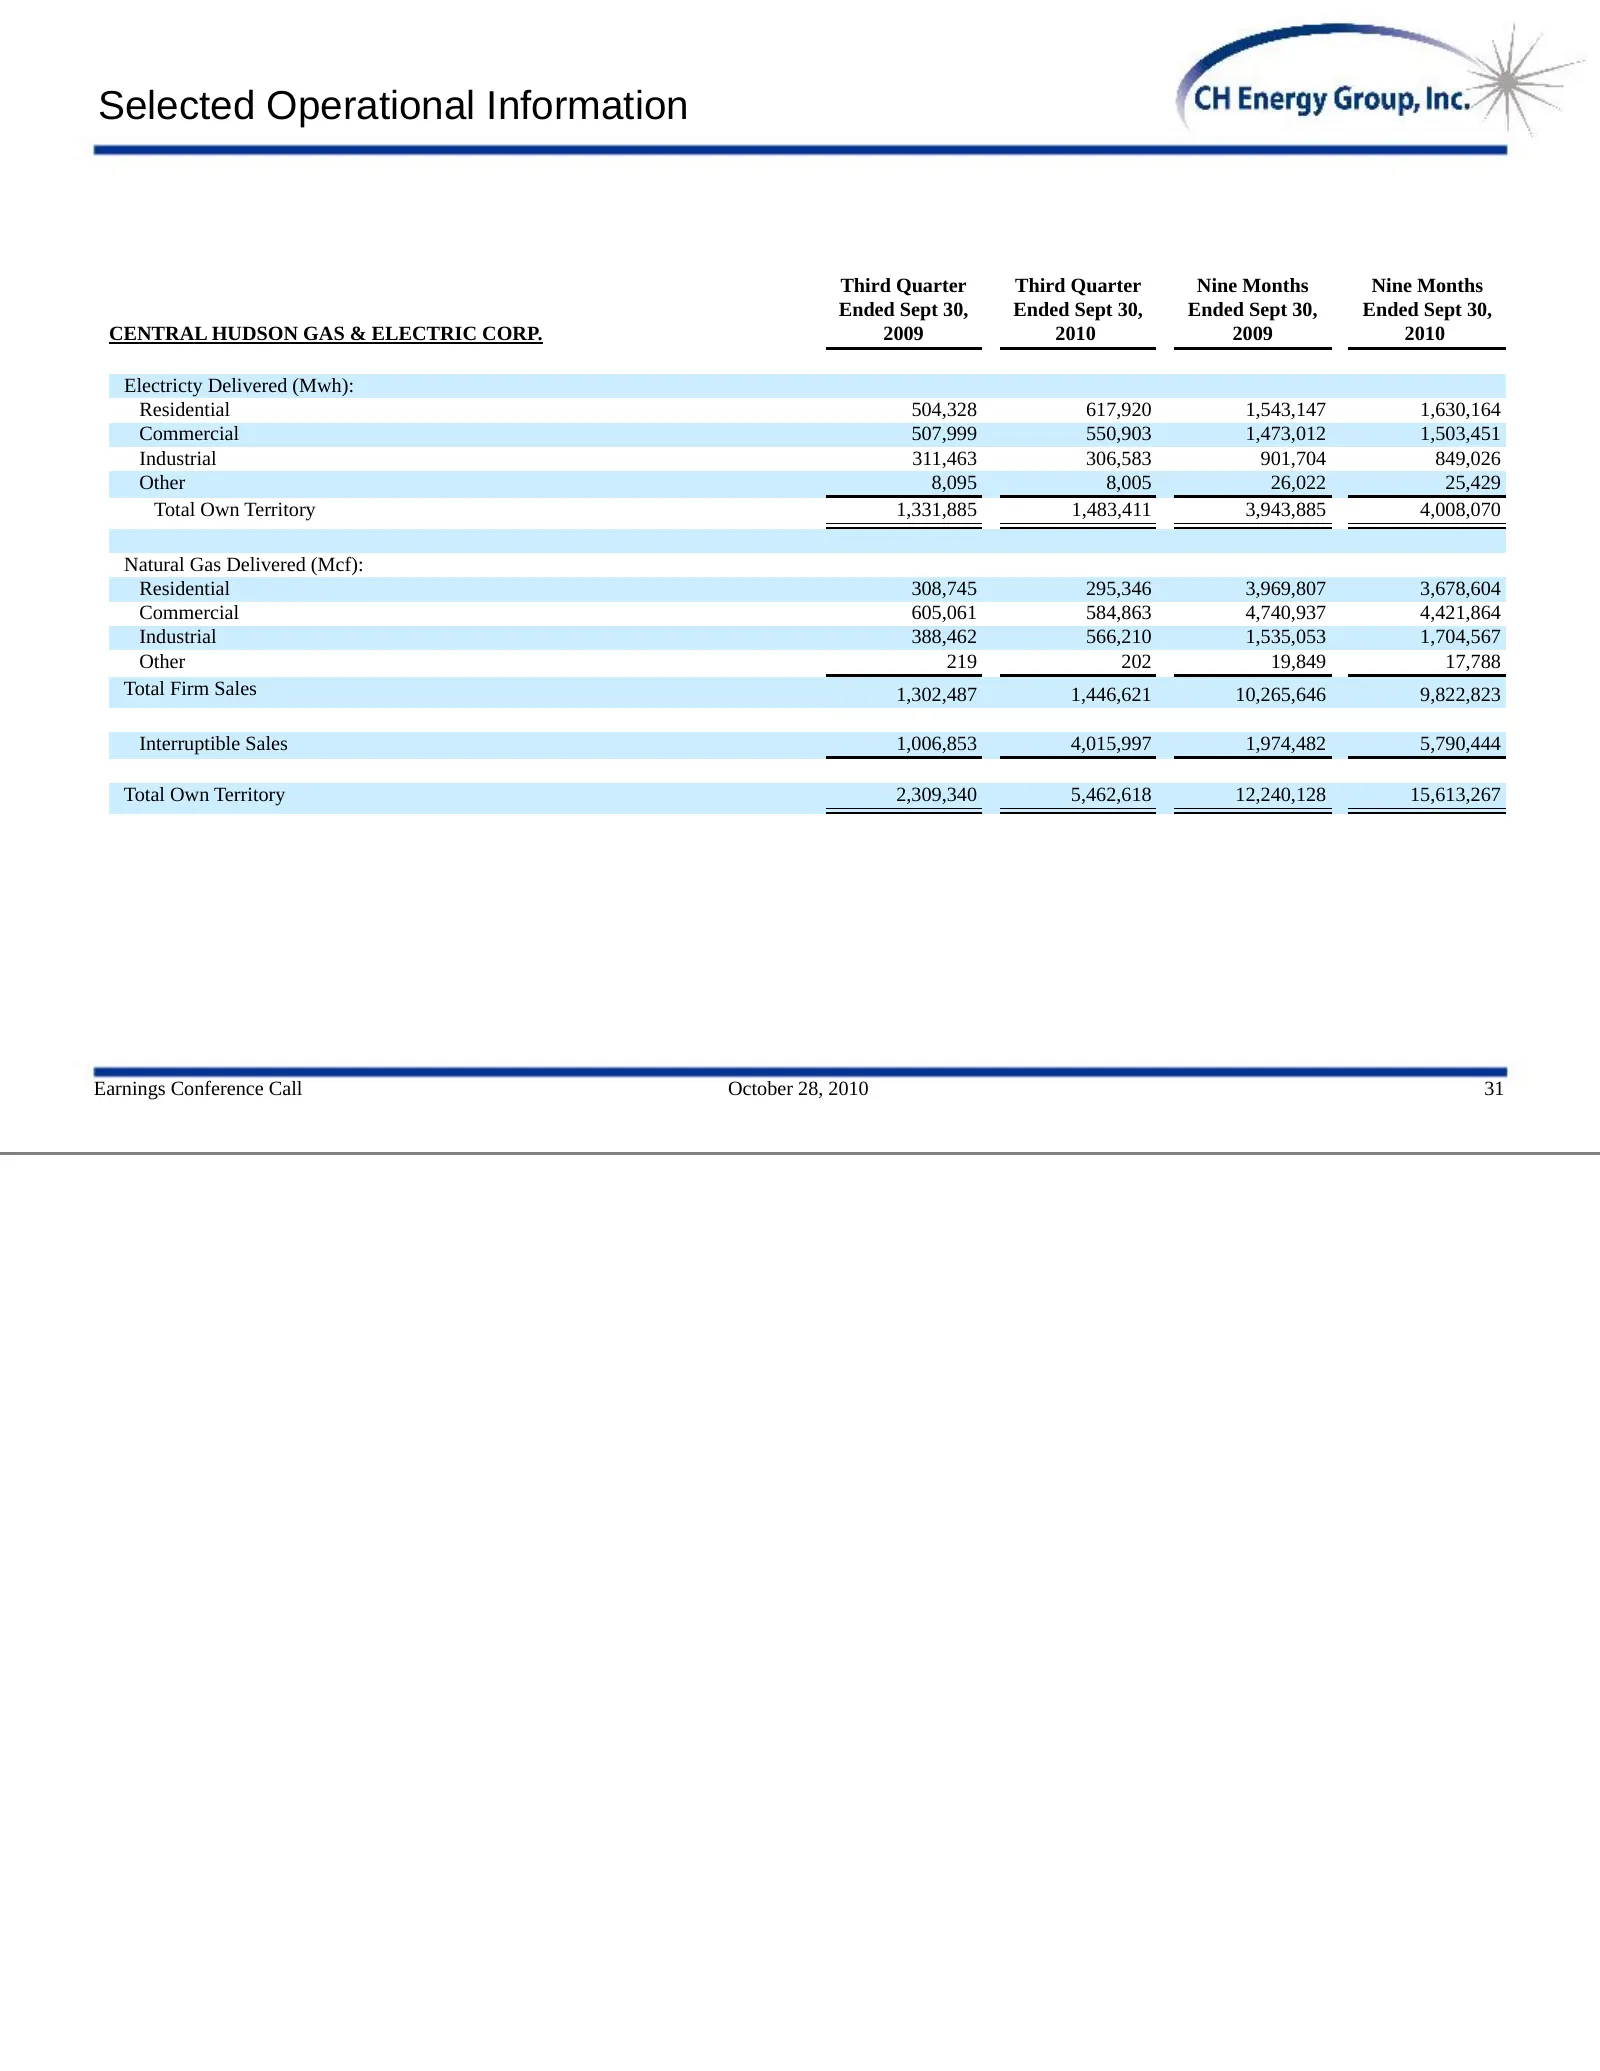
Slide 32: Selected Operational Information
Selected Operational Information Third Quarter Third Quarter Nine Months Nine Months Ended Sept 30, Ended Sept 30, Ended Sept 30, Ended Sept 30, CENTRAL HUDSON GAS & ELECTRIC CORP. 2009 2010 2009 2010 Electricty Delivered (Mwh): Residential 504,328 617,920 1,543,147 1,630,164 Commercial 507,999 550,
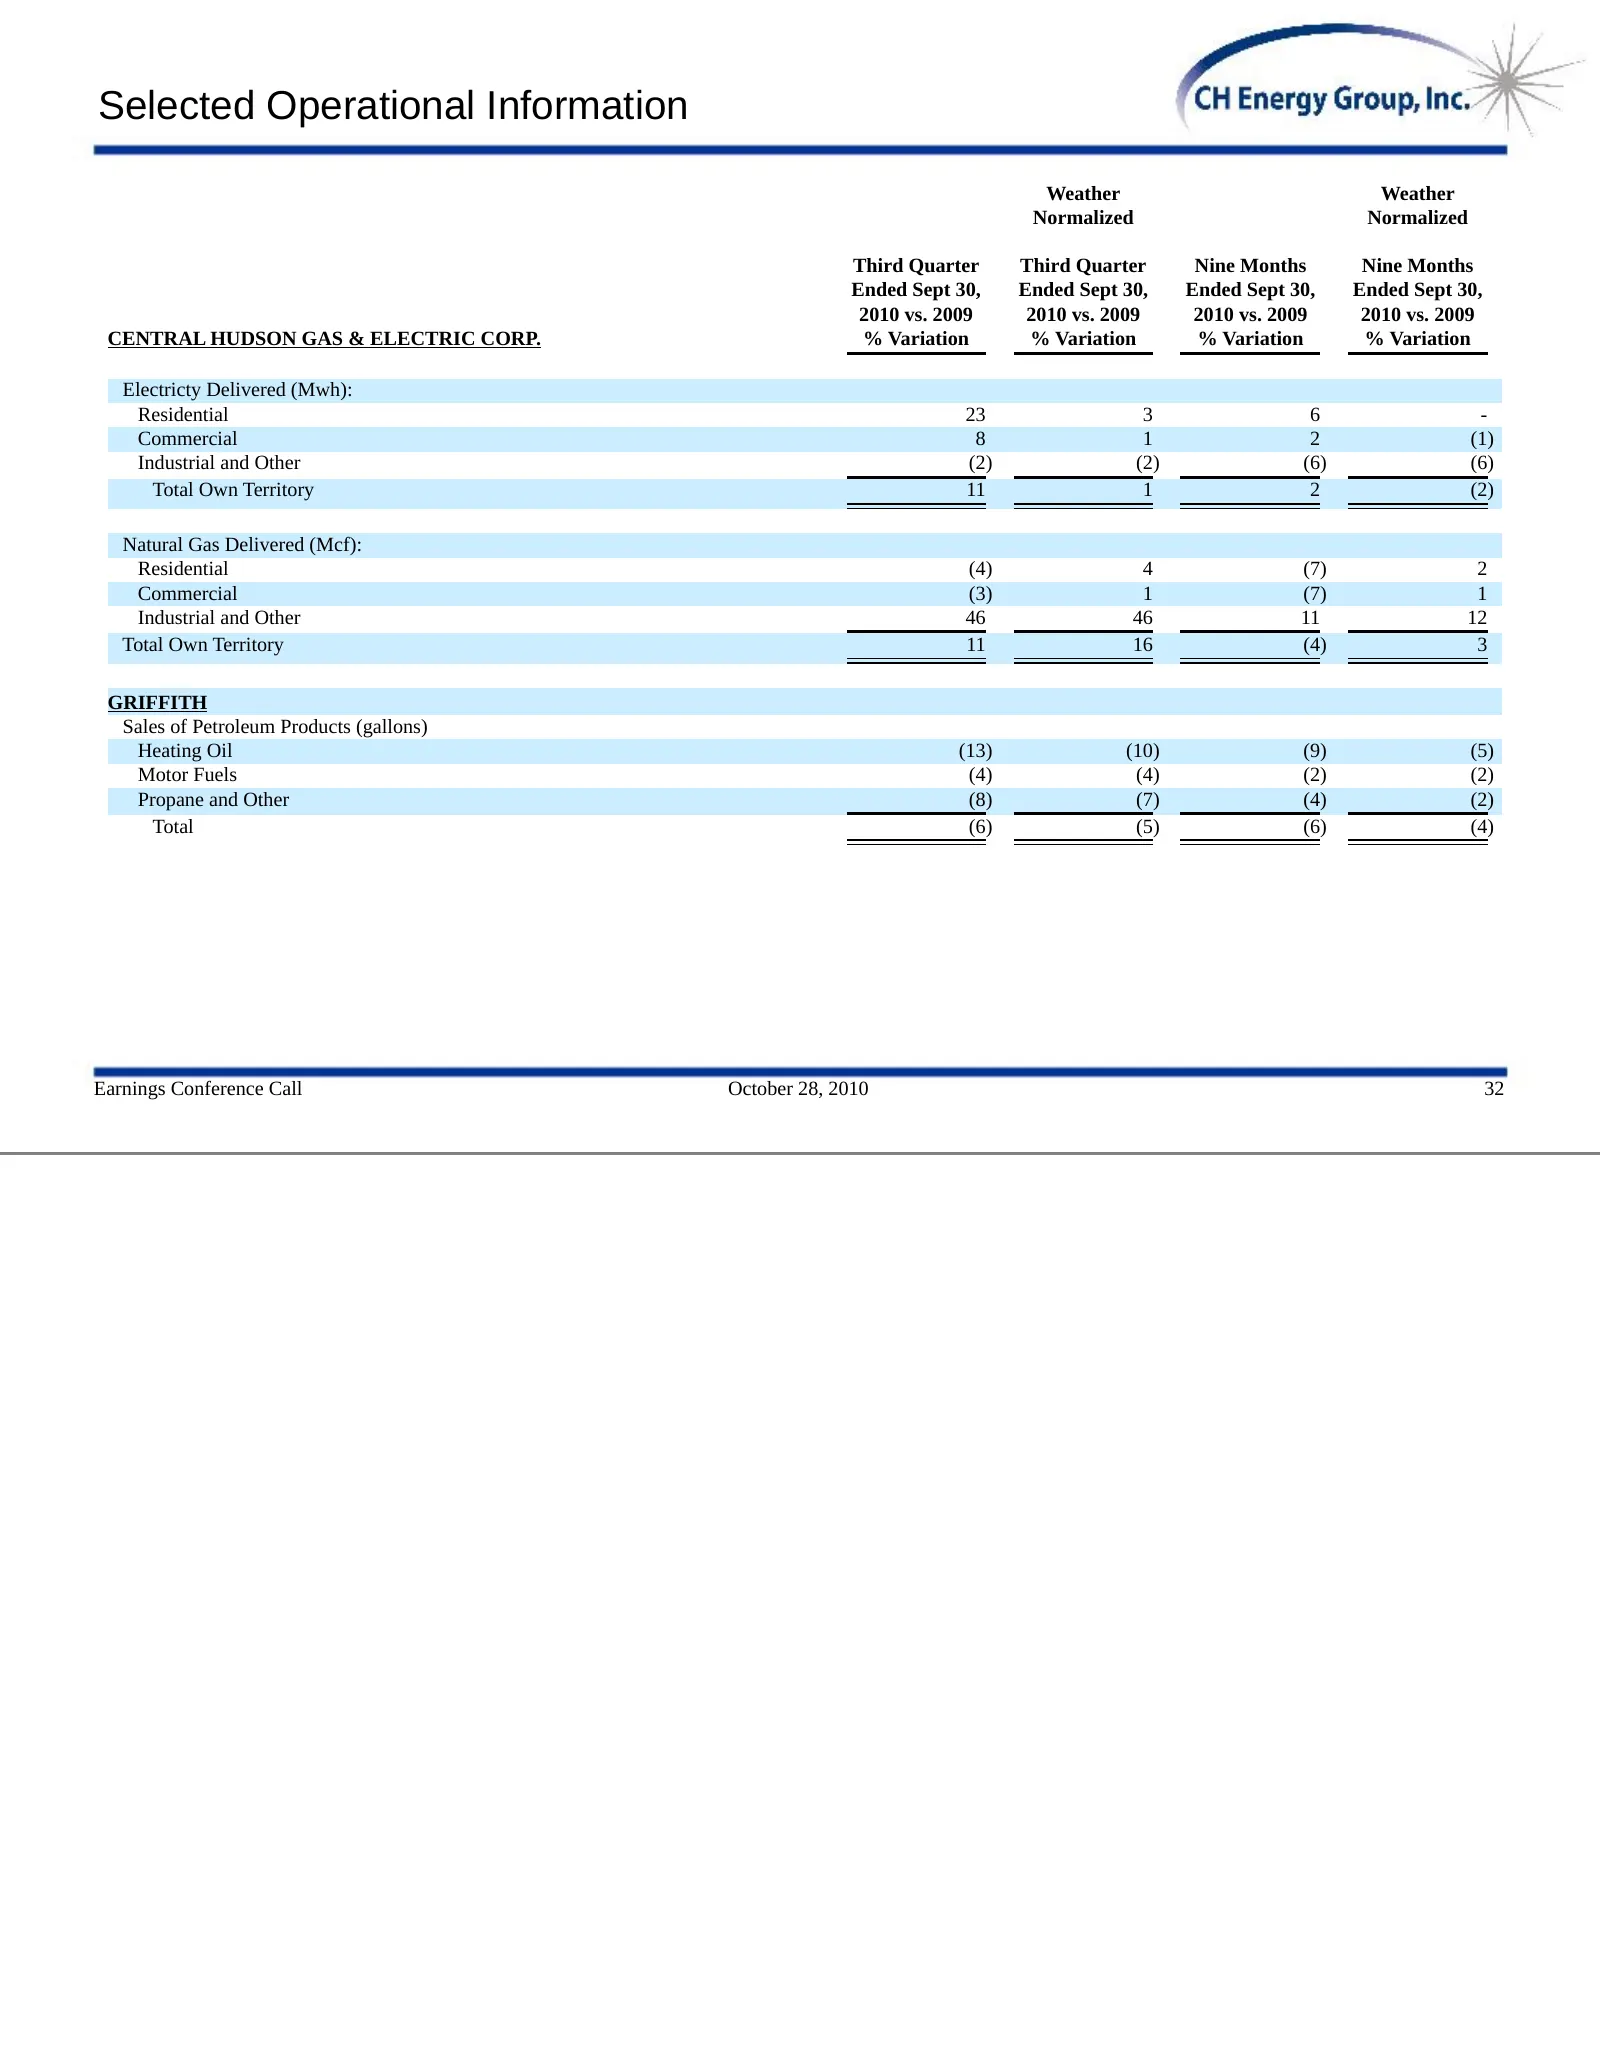
Slide 33: Selected Operational Information
Selected Operational Information Weather Weather Normalized Normalized Third Quarter Third Quarter Nine Months Nine Months Ended Sept 30, Ended Sept 30, Ended Sept 30, Ended Sept 30, 2010 vs. 2009 2010 vs. 2009 2010 vs. 2009 2010 vs. 2009 CENTRAL HUDSON GAS & ELECTRIC CORP. % Variation % Variation %
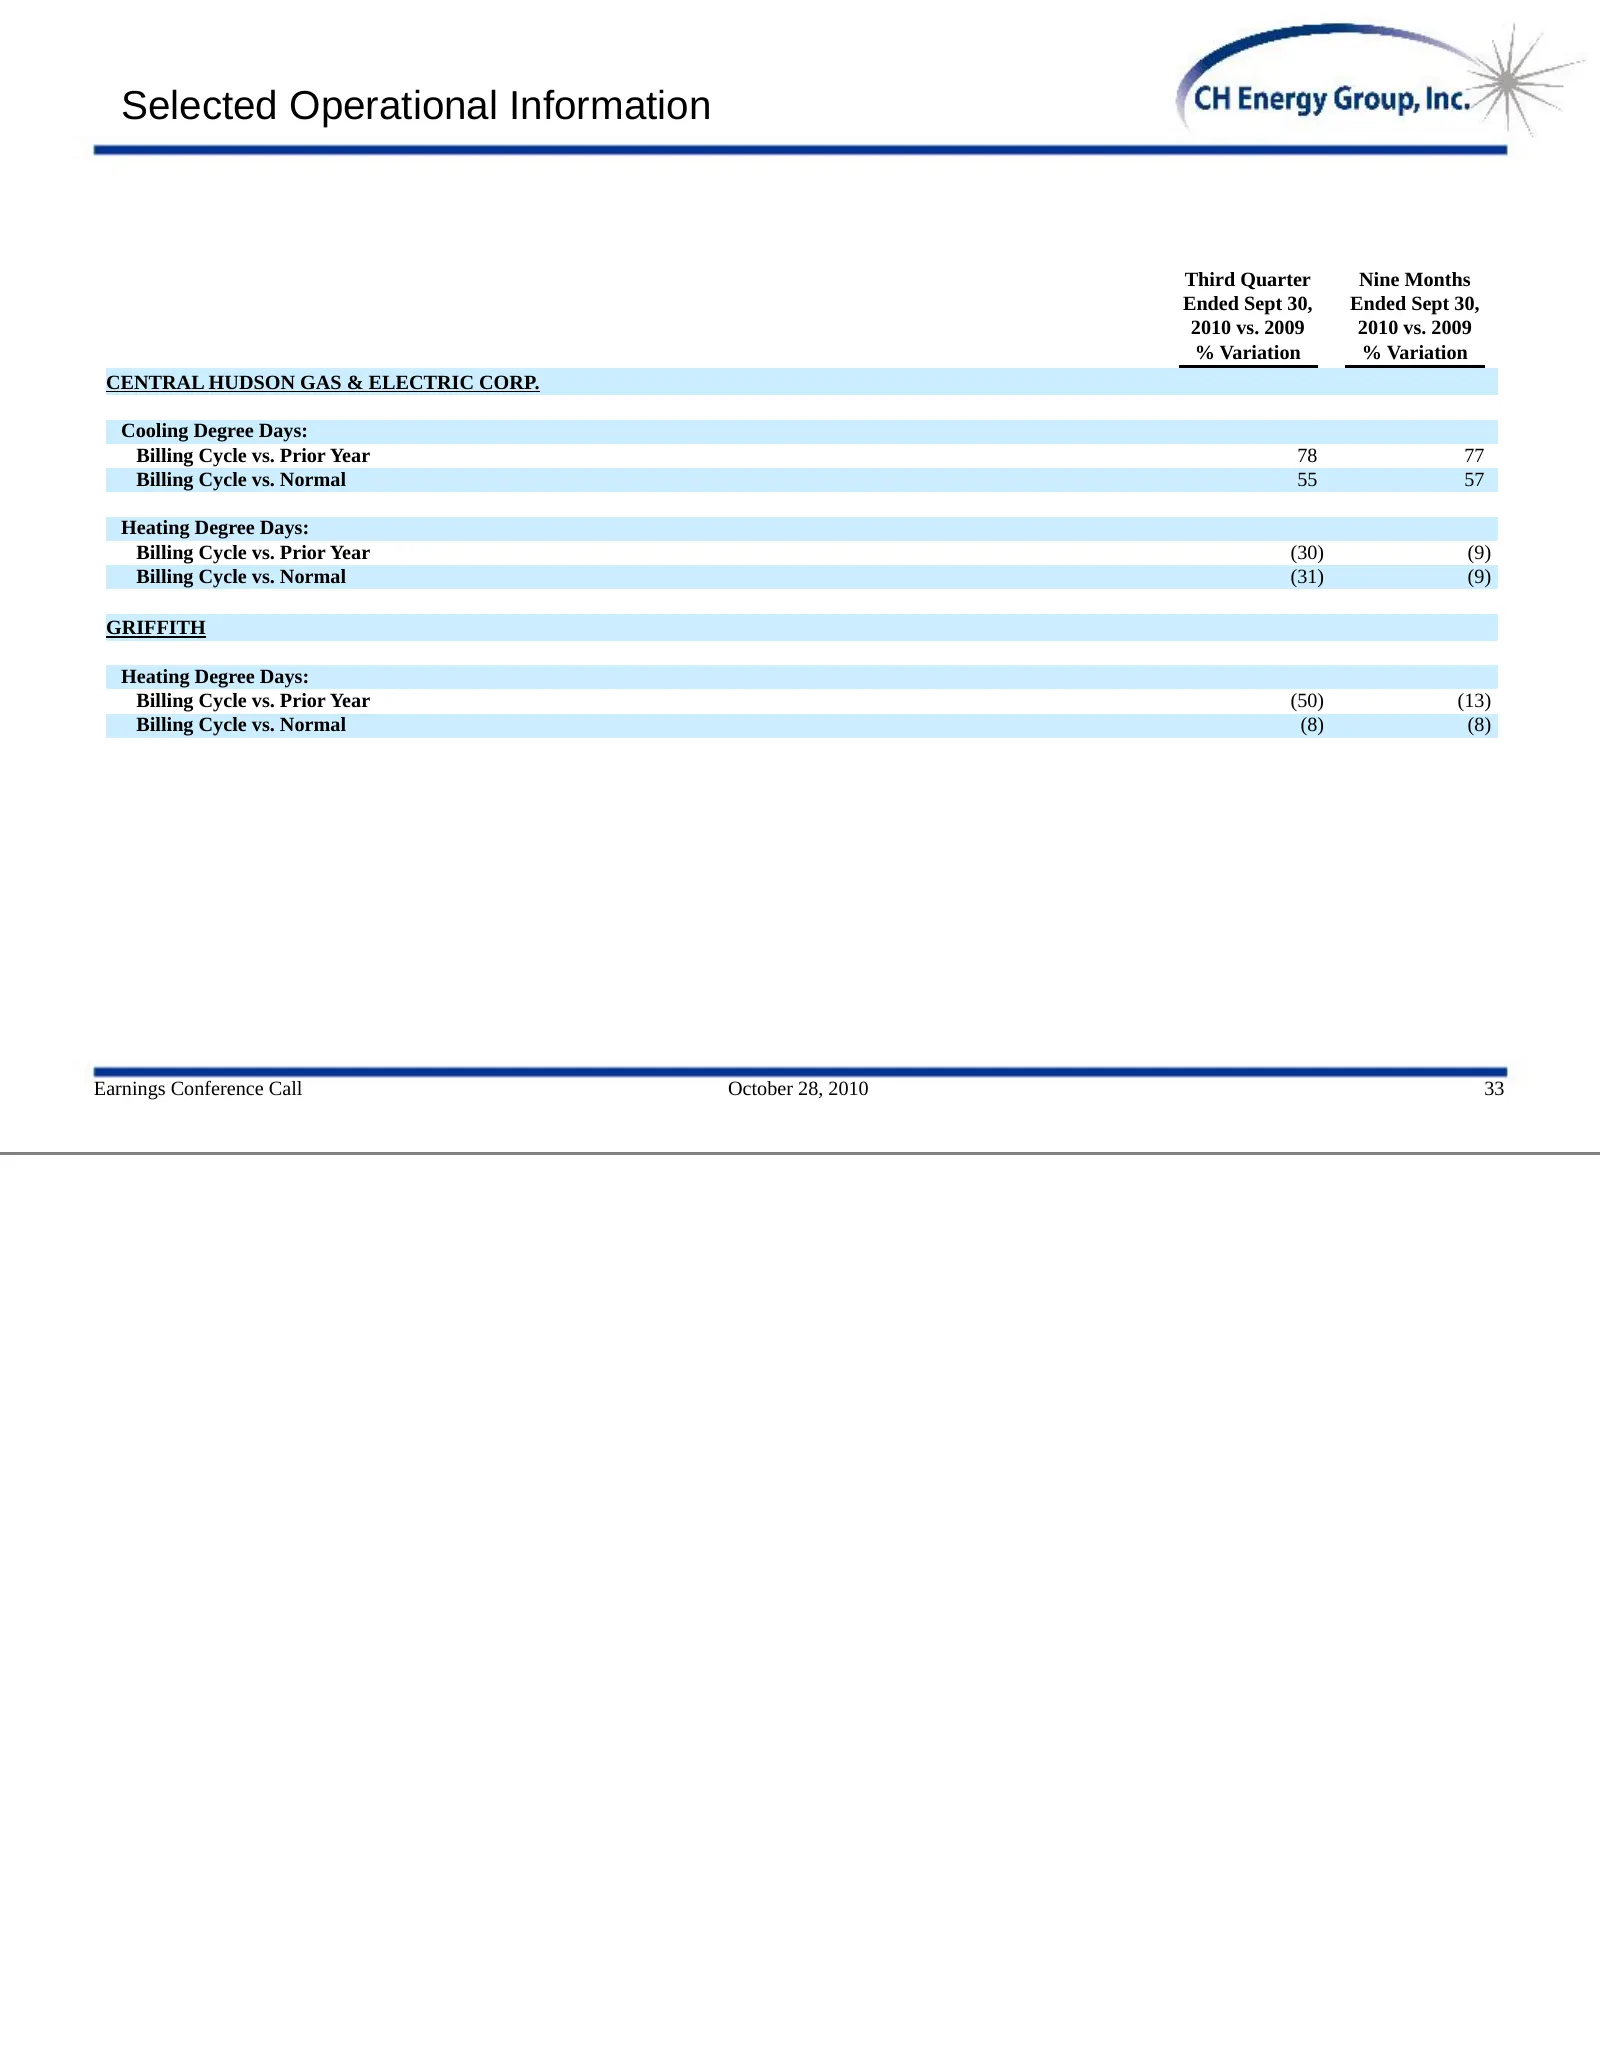
Slide 34: Selected Operational Information
Selected Operational Information Third Quarter Nine Months Ended Sept 30, Ended Sept 30, 2010 vs. 2009 2010 vs. 2009 % Variation % Variation CENTRAL HUDSON GAS & ELECTRIC CORP. Cooling Degree Days: Billing Cycle vs. Prior Year 78 77 Billing Cycle vs. Normal 55 57 Heating Degree Days: Billing Cycle v

Slide 35
Source: SEC EDGAR · 8-K filed Oct 28, 2010