South Jersey Industries — Investor Day (December 2013)
42 slides from South Jersey Industries's investor day presentation, Dec 6, 2013

Slide 1: Analyst Day – New York December 6, 2013
Analyst Day – New York December 6, 2013
Slide 2: Forward-looking statements
Certain statements contained in this presentation may qualify as “forward-looking statements” within the meaning of Section 27A of the Securities Act of 1933 and Section 21E of the Securities Exchange Act of 1934. All statements other than statements of historical fact should be considered forward-l
Slide 3: Highlights
Highlights 3 Recent activities • Dividend increase • Rate case • Organizational announcements
Slide 4: Corporate Goals
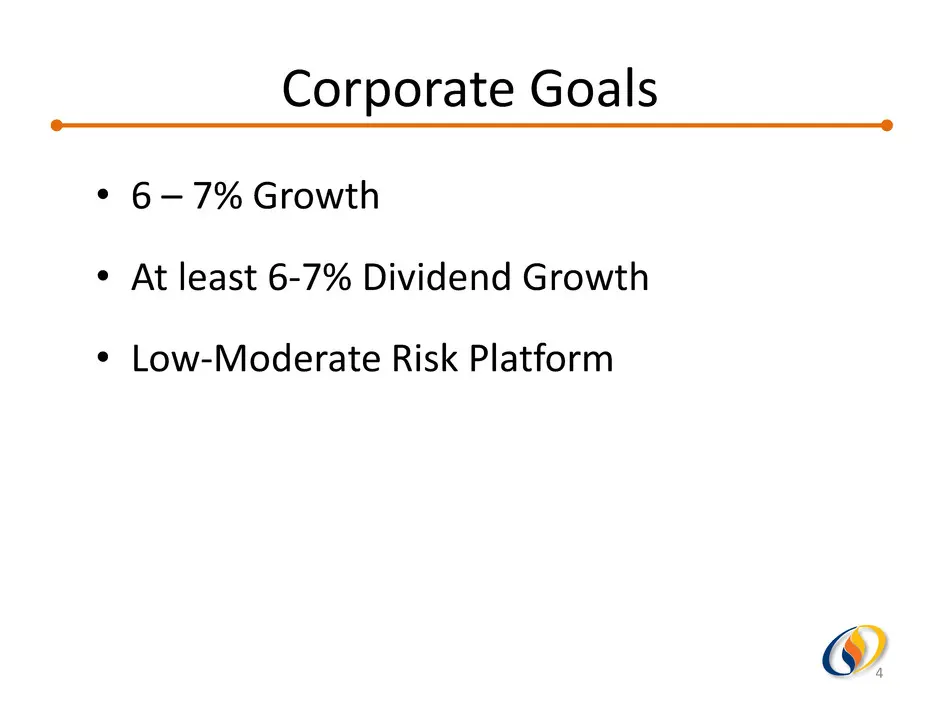
Corporate Goals • 6 – 7% Growth • At least 6-7% Dividend Growth • Low-Moderate Risk Platform 4
Slide 5: The Future of SJI
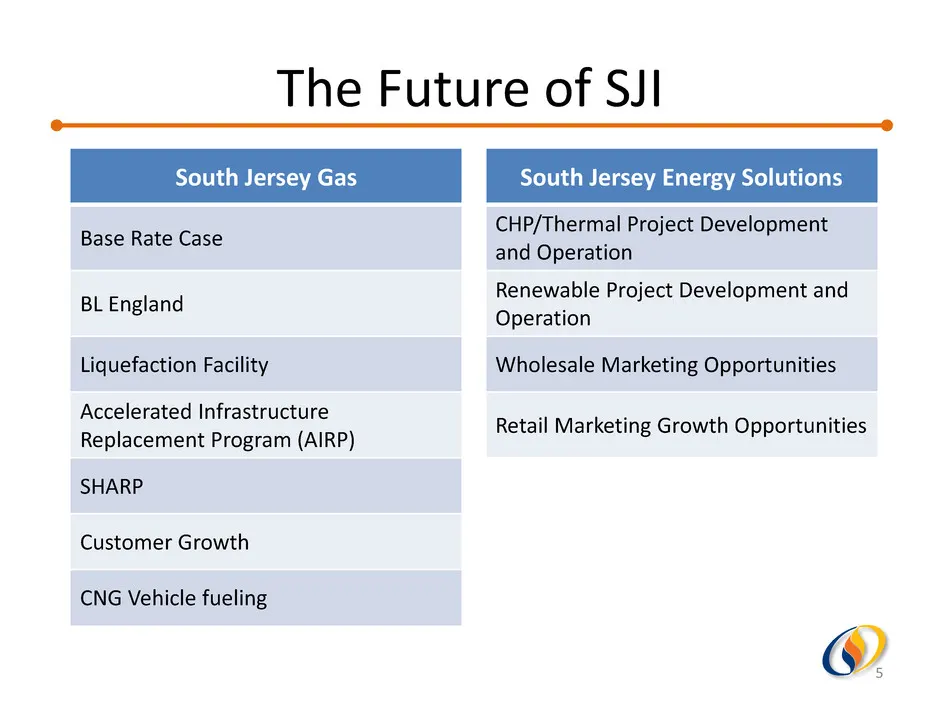
The Future of SJI South Jersey Gas South Jersey Energy Solutions Base Rate Case CHP/Thermal Project Development and Operation BL England Renewable Project Development and Operation Liquefaction Facility Wholesale Marketing Opportunities Accelerated Infrastructure Replacement Program (AIRP) Retail Ma
Slide 6: South Jersey Gas
@ South Jersey Gas
Slide 7: Utility Growth Summary
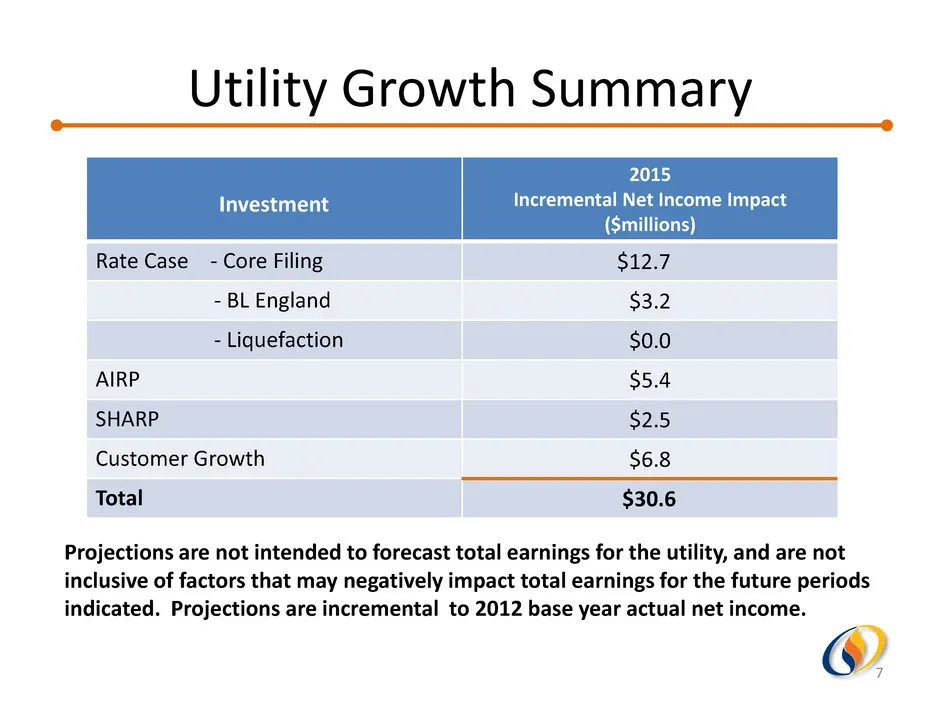
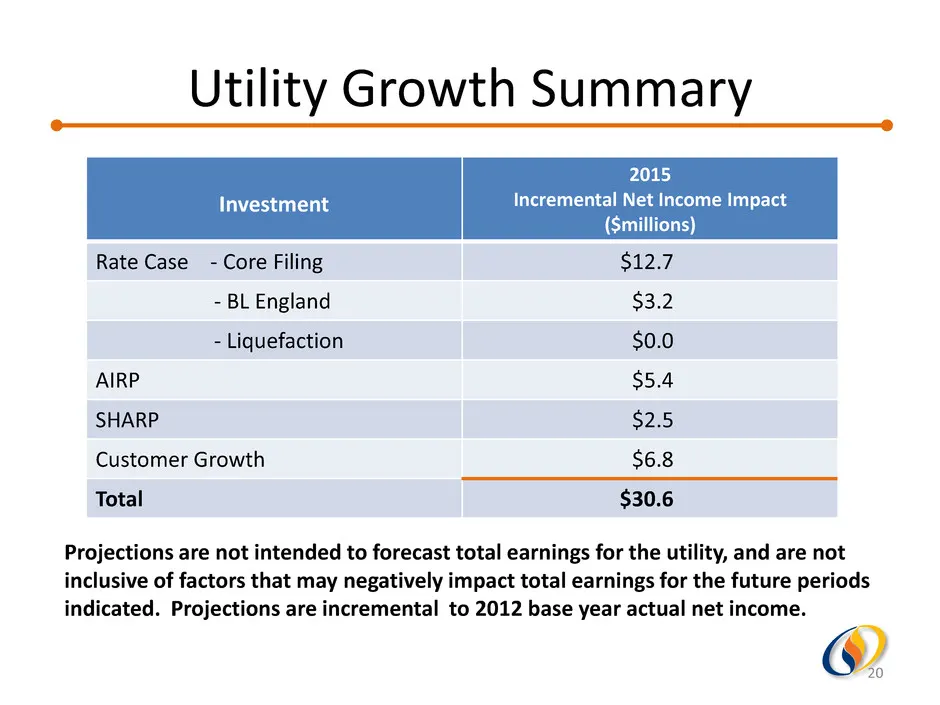
Utility Growth Summary Investment 2015 Incremental Net Income Impact ($millions) Rate Case - Core Filing $12.7 - BL England $3.2 - Liquefaction $0.0 AIRP $5.4 SHARP $2.5 Customer Growth $6.8 Total $30.6 7 Projections are not intended to forecast total earnings for the utility, and are not inclusive
Slide 8: Base Rate Case
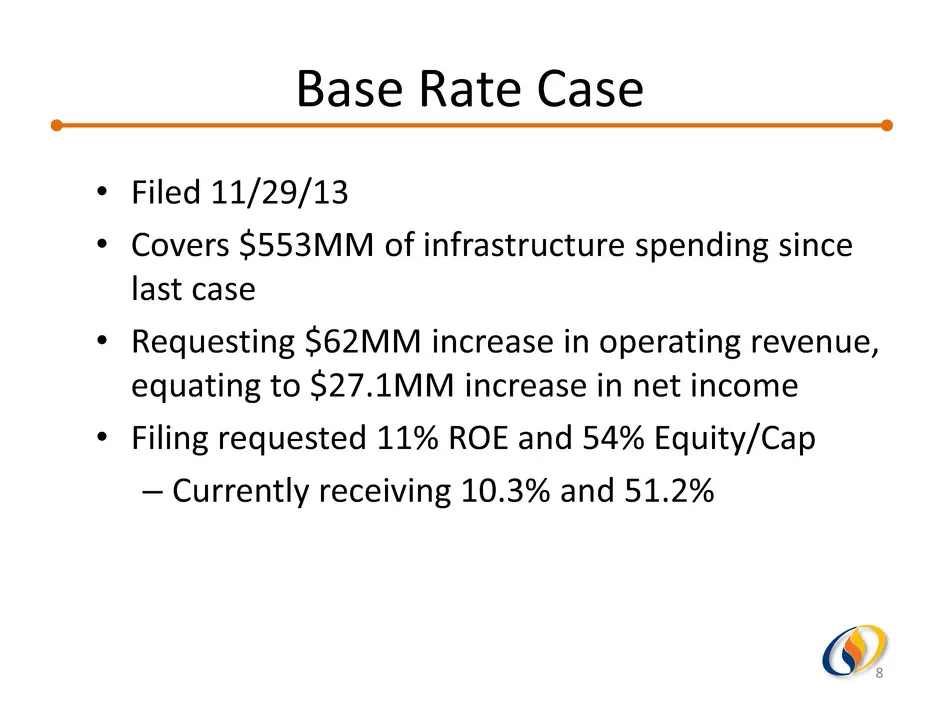
Base Rate Case 8 • Filed 11/29/13 • Covers $553MM of infrastructure spending since last case • Requesting $62MM increase in operating revenue, equating to $27.1MM increase in net income • Filing requested 11% ROE and 54% Equity/Cap – Currently receiving 10.3% and 51.2%
Slide 9: Investment Valuation Methodology
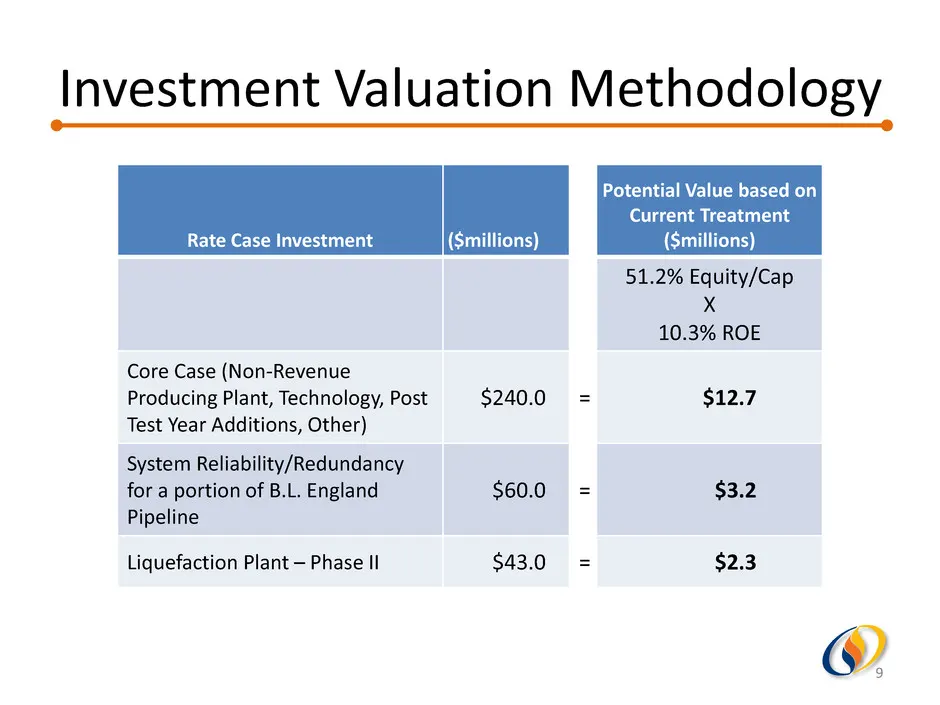
Investment Valuation Methodology Rate Case Investment ($millions) Potential Value based on Current Treatment ($millions) 51.2% Equity/Cap X 10.3% ROE Core Case (Non-Revenue Producing Plant, Technology, Post Test Year Additions, Other) $240.0 = $12.7 System Reliability/Redundancy for a portion of B.L
Slide 10: Utility Investment Initiatives: B.L. England
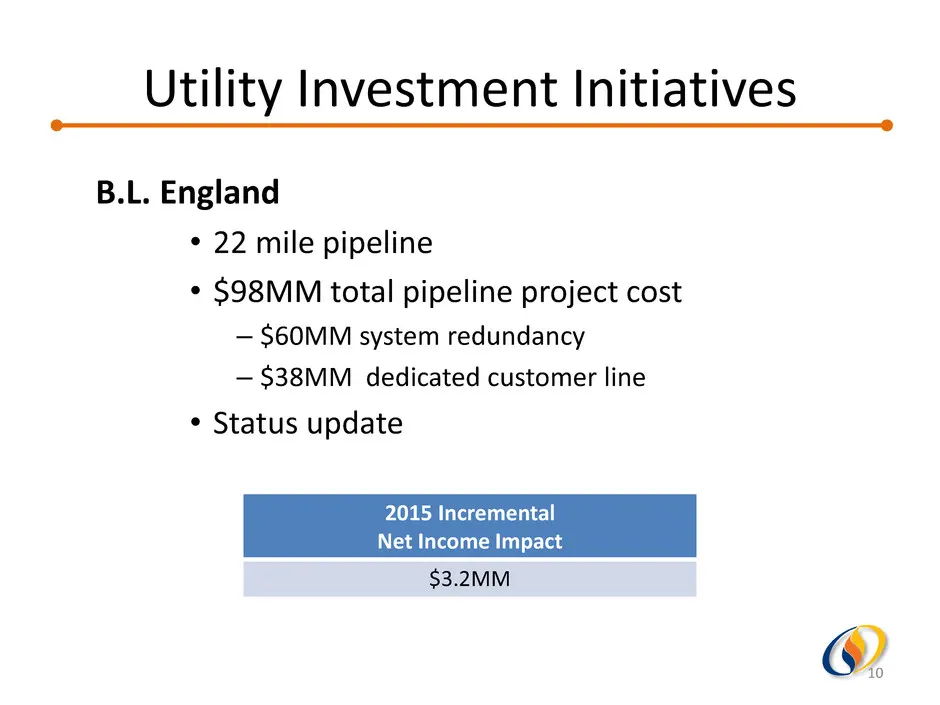
Utility Investment Initiatives B.L. England • 22 mile pipeline • $98MM total pipeline project cost – $60MM system redundancy – $38MM dedicated customer line • Status update 10 2015 Incremental Net Income Impact $3.2MM
Slide 11: Utility Investment Initiatives: Liquefaction
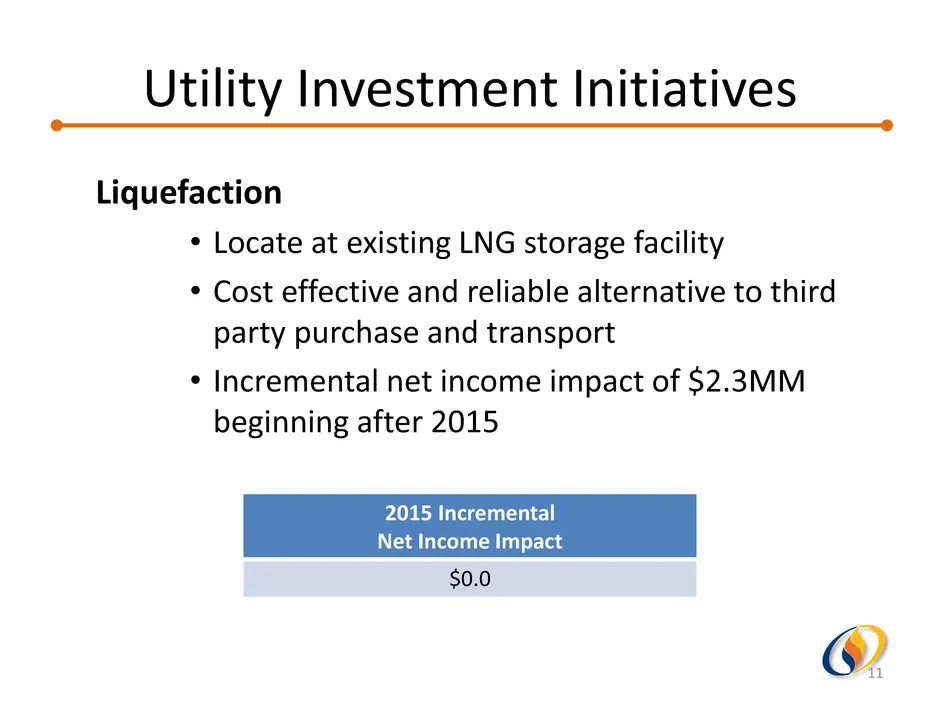
Utility Investment Initiatives Liquefaction • Locate at existing LNG storage facility • Cost effective and reliable alternative to third party purchase and transport • Incremental net income impact of $2.3MM beginning after 2015 11 2015 Incremental Net Income Impact $0.0
Slide 12: Utility Investment Initiatives: AIRP
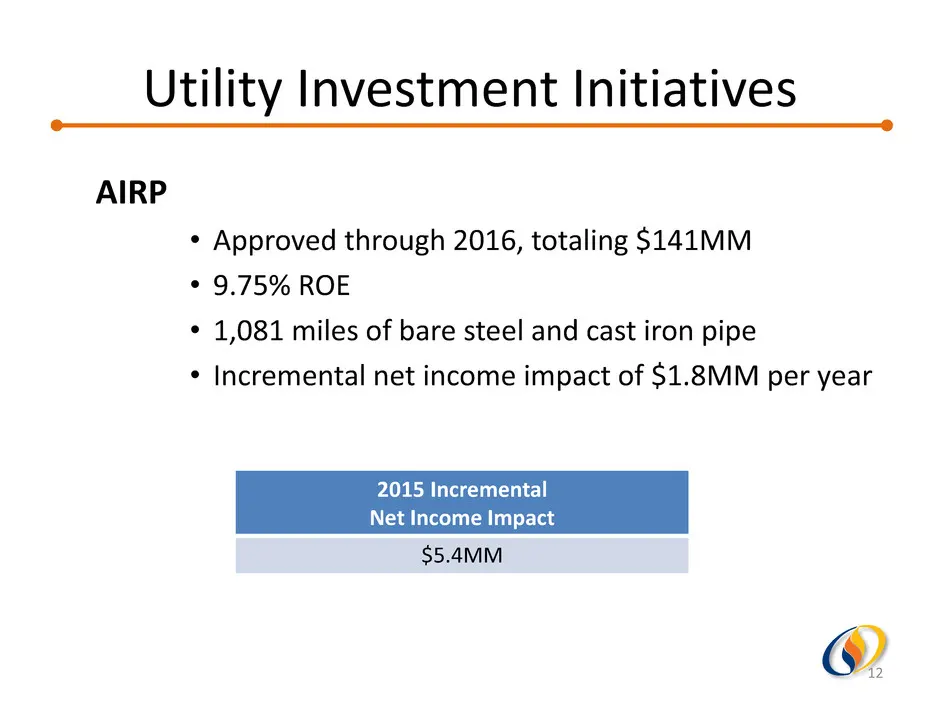
Utility Investment Initiatives AIRP • Approved through 2016, totaling $141MM • 9.75% ROE • 1,081 miles of bare steel and cast iron pipe • Incremental net income impact of $1.8MM per year 12 2015 Incremental Net Income Impact $5.4MM
Slide 13: Utility Investment Initiatives: SHARP
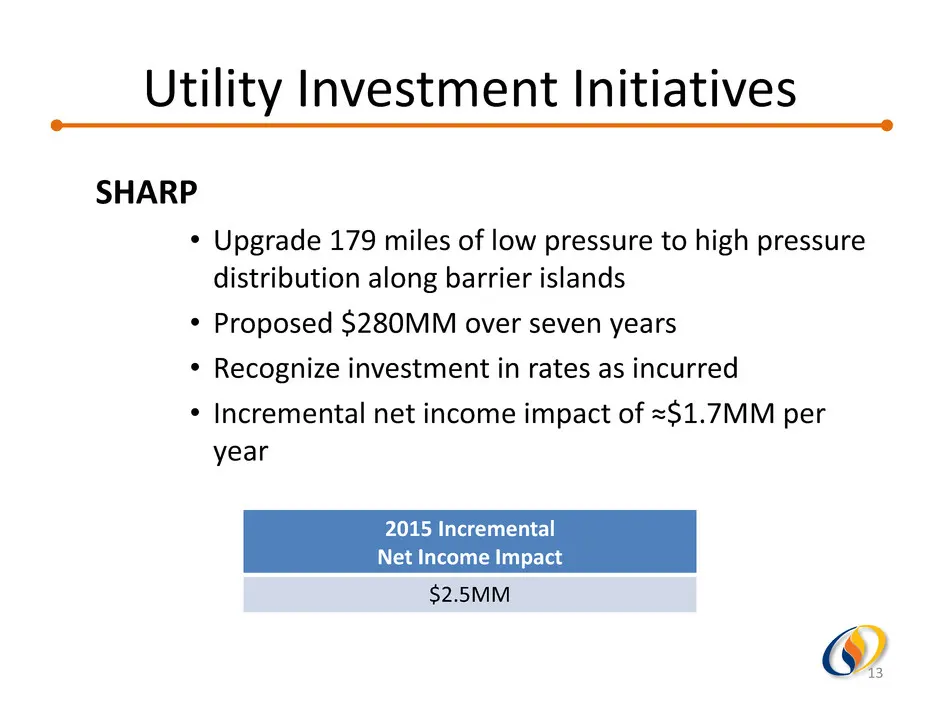
Utility Investment Initiatives SHARP • Upgrade 179 miles of low pressure to high pressure distribution along barrier islands • Proposed $280MM over seven years • Recognize investment in rates as incurred • Incremental net income impact of ≈$1.7MM per year 13 2015 Incremental Net Income Impact $2.5MM
Slide 14: Utility Investment Initiatives: Storm Hardening
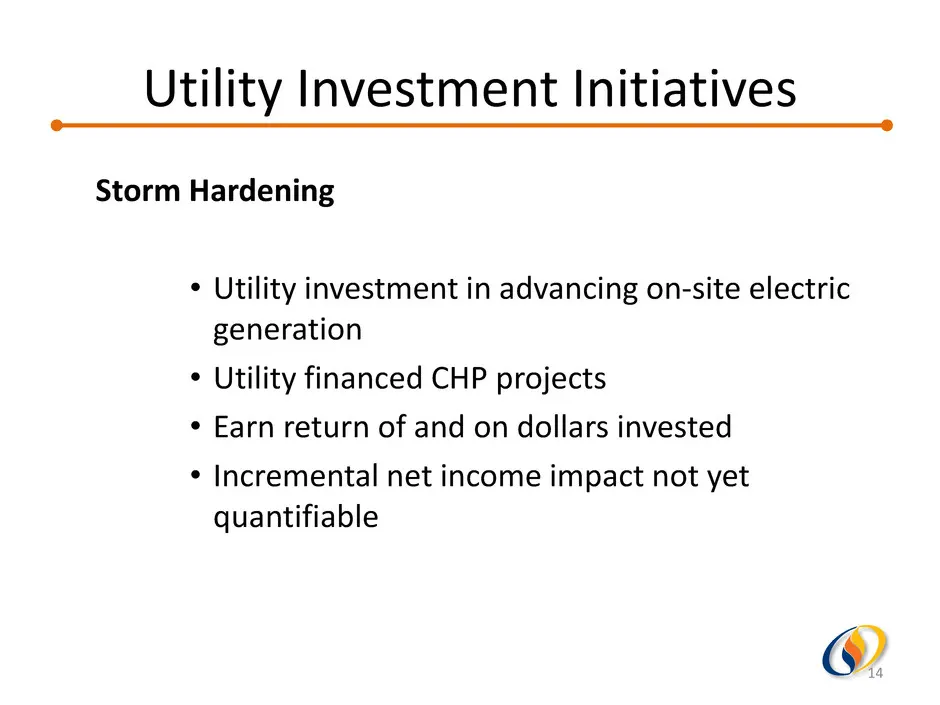
Utility Investment Initiatives Storm Hardening • Utility investment in advancing on-site electric generation • Utility financed CHP projects • Earn return of and on dollars invested • Incremental net income impact not yet quantifiable 14
Slide 15: Customer Margin Growth
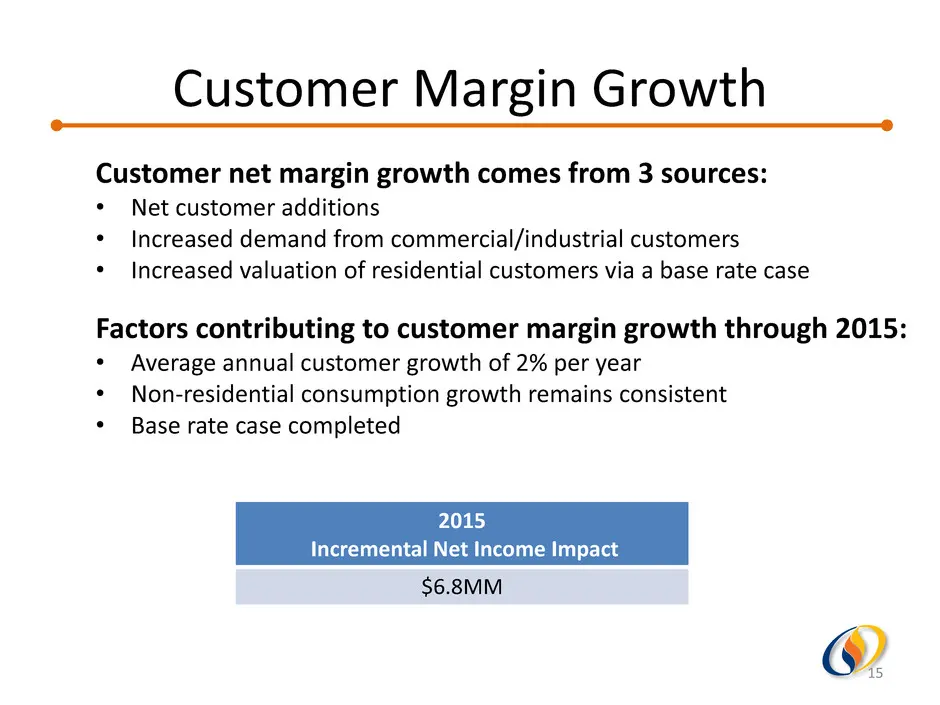
Customer Margin Growth 15 2015 Incremental Net Income Impact $6.8MM Customer net margin growth comes from 3 sources: • Net customer additions • Increased demand from commercial/industrial customers • Increased valuation of residential customers via a base rate case Factors contributing to customer m
Slide 16: SJG Customer Growth History
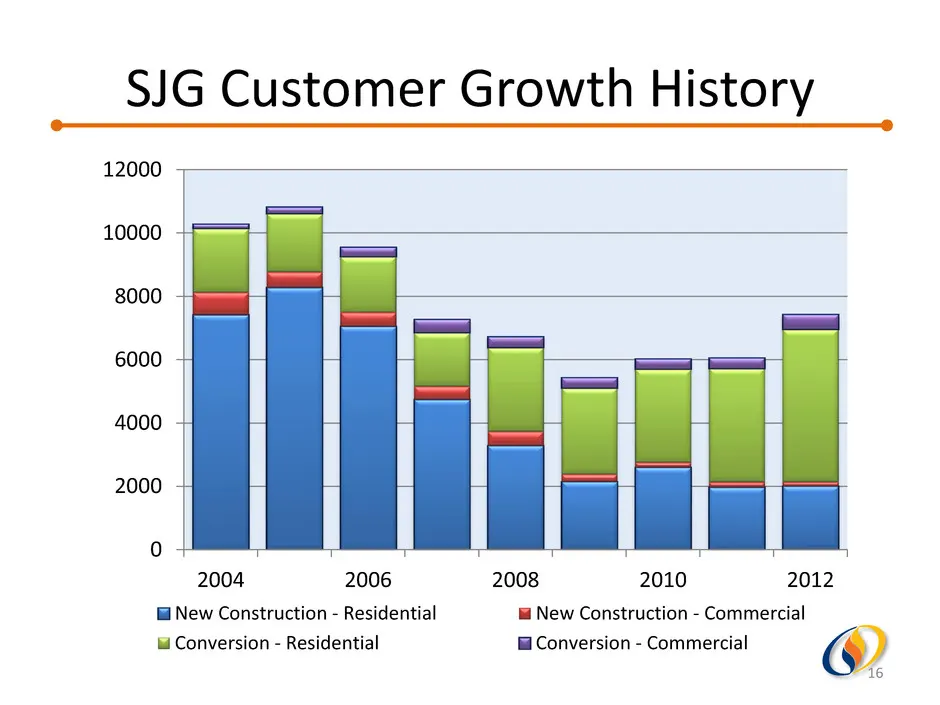
SJG Customer Growth History 0 2000 4000 6000 8000 10000 12000 2004 2006 2008 2010 2012 New Construction - Residential New Construction - Commercial Conversion - Residential Conversion - Commercial 16
Slide 17: Customer Growth: Natural Gas Price Advantage
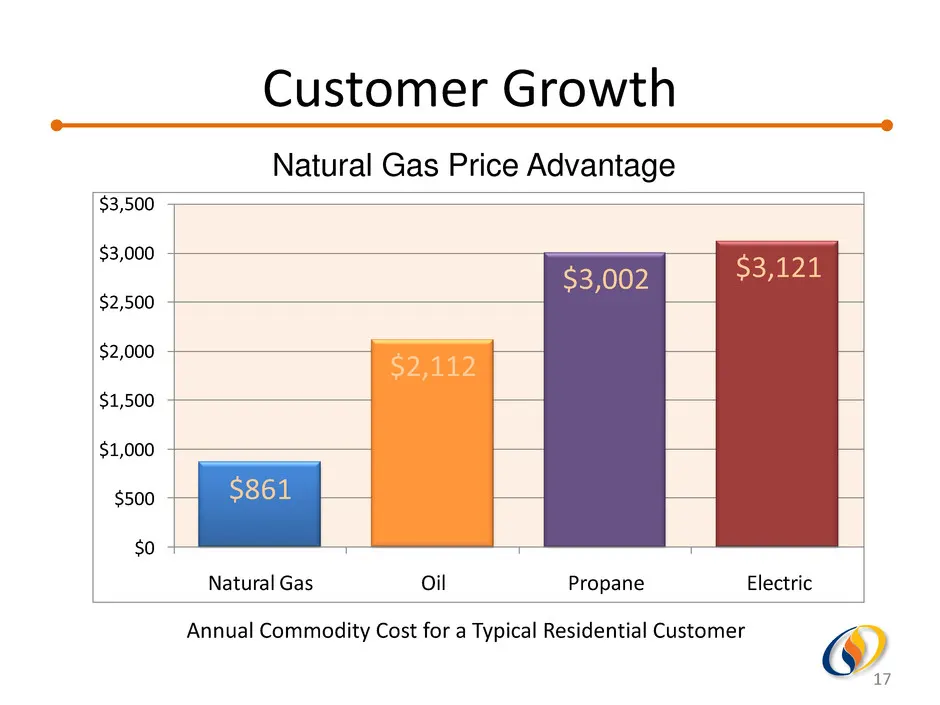
Customer Growth 17 $861 $2,112 $3,002 $3,121 $0 $500 $1,000 $1,500 $2,000 $2,500 $3,000 $3,500 Natural Gas Oil Propane Electric Natural Gas Price Advantage Annual Commodity Cost for a Typical Residential Customer
Slide 18: Customer Growth: Projected Gross Customer Additions
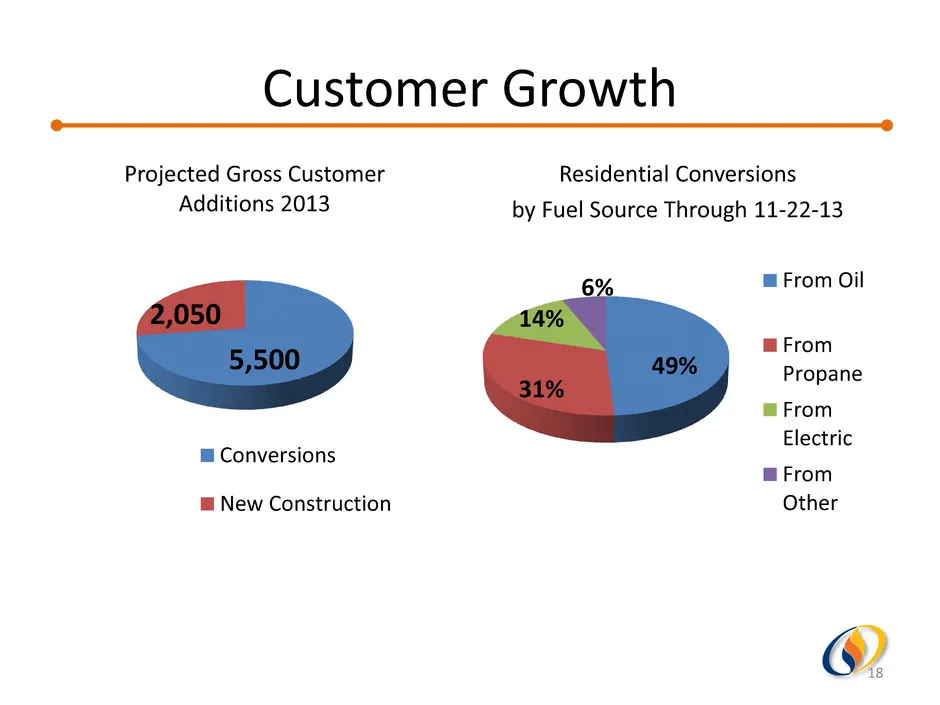
Customer Growth 18 Projected Gross Customer Additions 2013 Conversions New Construction 5,500 2,050 Residential Conversions by Fuel Source Through 11-22-13 From Oil From Propane From Electric From Other 49% 31% 14% 6%
Slide 19: Compressed Natural Gas
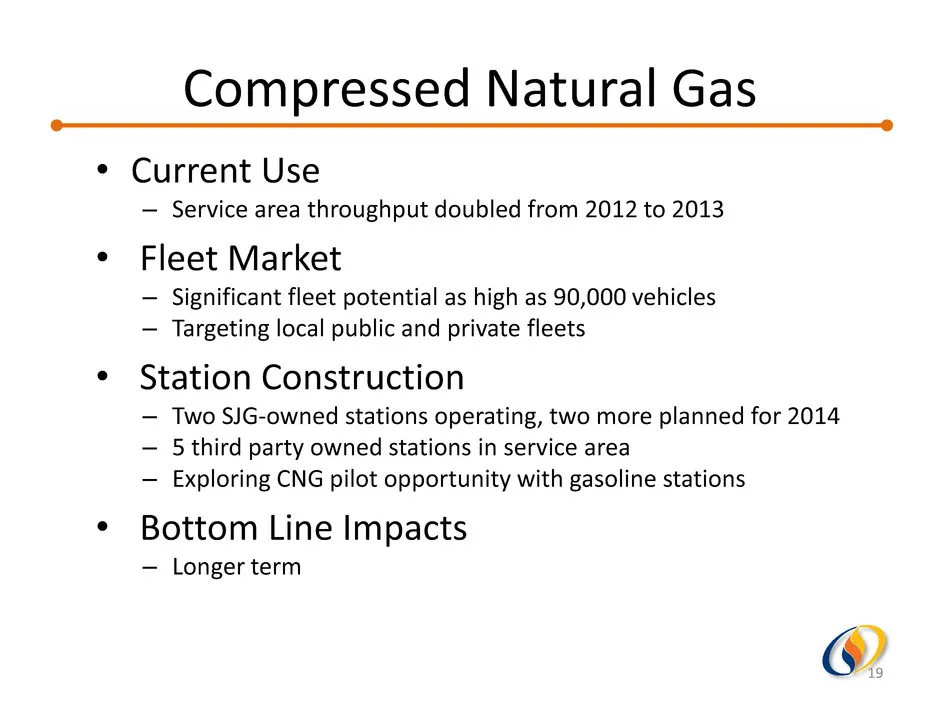
Compressed Natural Gas 19 • Current Use – Service area throughput doubled from 2012 to 2013 • Fleet Market – Significant fleet potential as high as 90,000 vehicles – Targeting local public and private fleets • Station Construction – Two SJG-owned stations operating, two more planned for 2014 – 5 thi
Slide 20: Utility Growth Summary
Utility Growth Summary Investment 2015 Incremental Net Income Impact ($millions) Rate Case - Core Filing $12.7 - BL England $3.2 - Liquefaction $0.0 AIRP $5.4 SHARP $2.5 Customer Growth $6.8 Total $30.6 20 Projections are not intended to forecast total earnings for the utility, and are not inclusive
Slide 21: South Jersey Energy Solutions
@ South Jersey Energy Solutions
Slide 22: Non-Utility Growth Summary
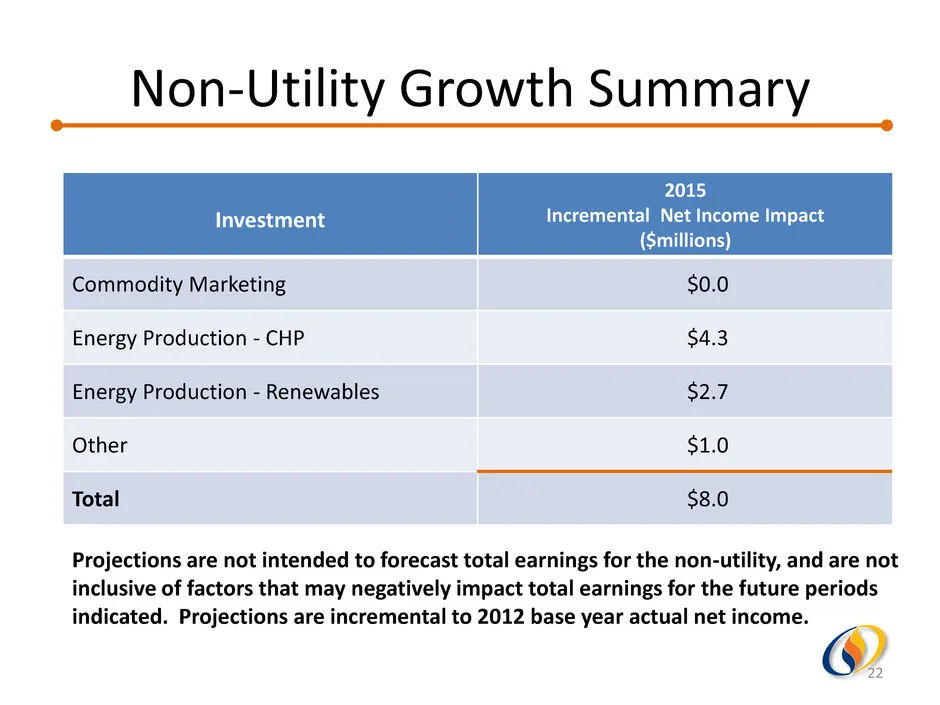
Non-Utility Growth Summary Investment 2015 Incremental Net Income Impact ($millions) Commodity Marketing $0.0 Energy Production - CHP $4.3 Energy Production - Renewables $2.7 Other $1.0 Total $8.0 22 Projections are not intended to forecast total earnings for the non-utility, and are not inclusive o
Slide 23: Commodity Marketing Overview
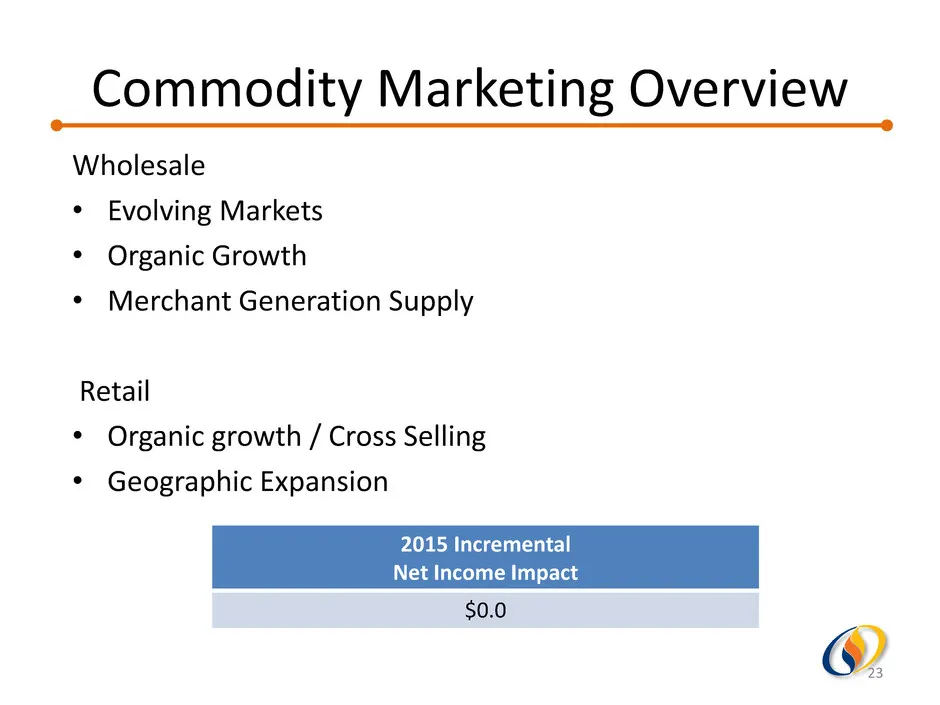
Commodity Marketing Overview 23 2015 Incremental Net Income Impact $0.0 Wholesale • Evolving Markets • Organic Growth • Merchant Generation Supply Retail • Organic growth / Cross Selling • Geographic Expansion
Slide 24: Wholesale
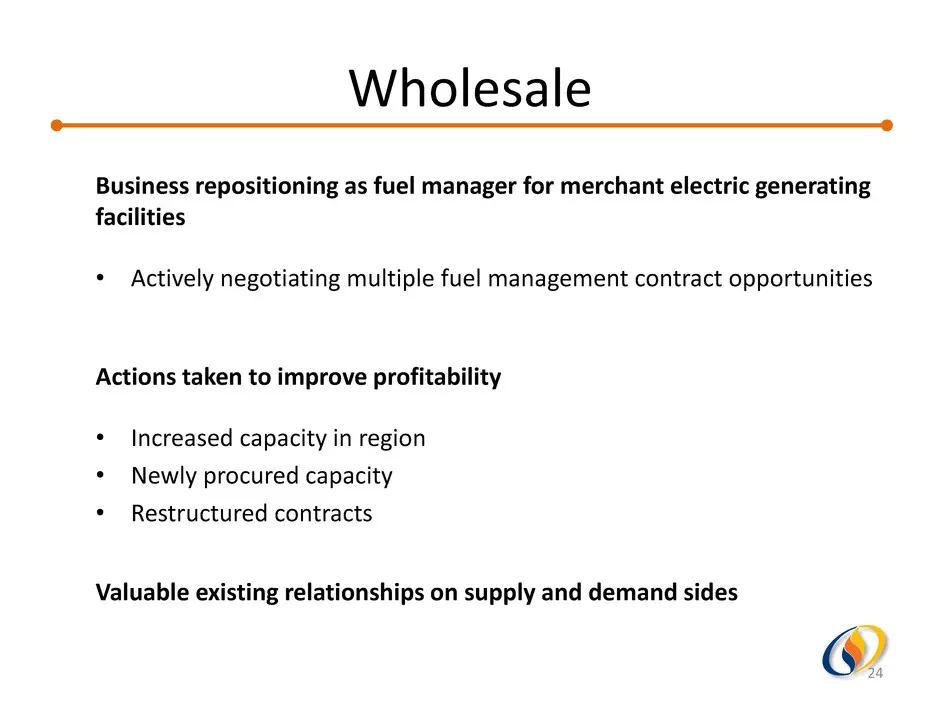
Wholesale 24 Business repositioning as fuel manager for merchant electric generating facilities • Actively negotiating multiple fuel management contract opportunities Actions taken to improve profitability • Increased capacity in region • Newly procured capacity • Restructured contracts Valuable exi
Slide 25: Merchant Generation Contract Components
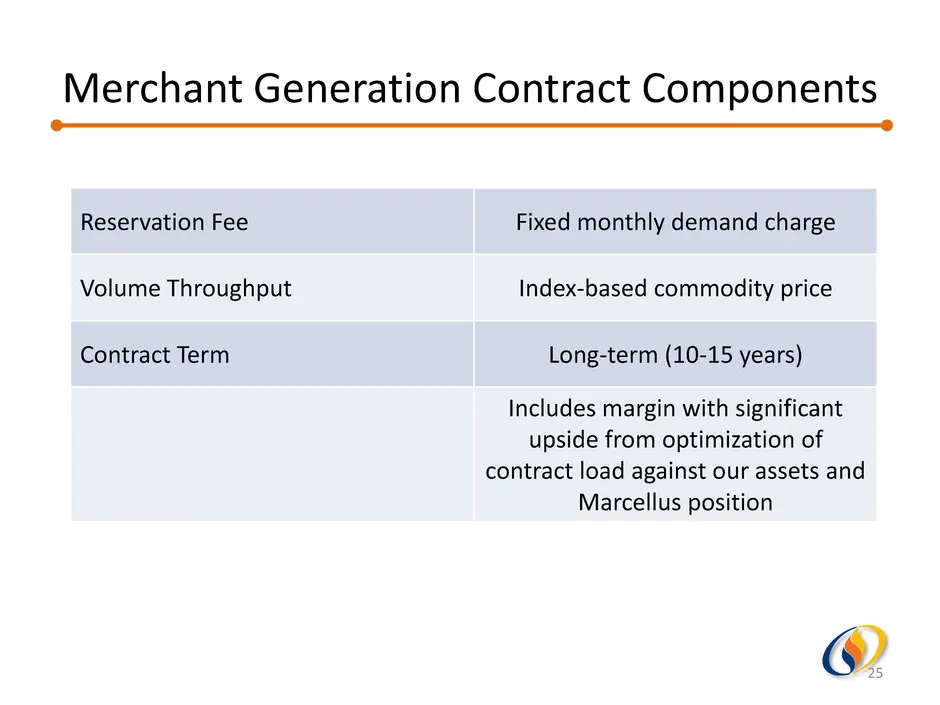
Merchant Generation Contract Components Reservation Fee Fixed monthly demand charge Volume Throughput Index-based commodity price Contract Term Long-term (10-15 years) Includes margin with significant upside from optimization of contract load against our assets and Marcellus position 25
Slide 26: Retail
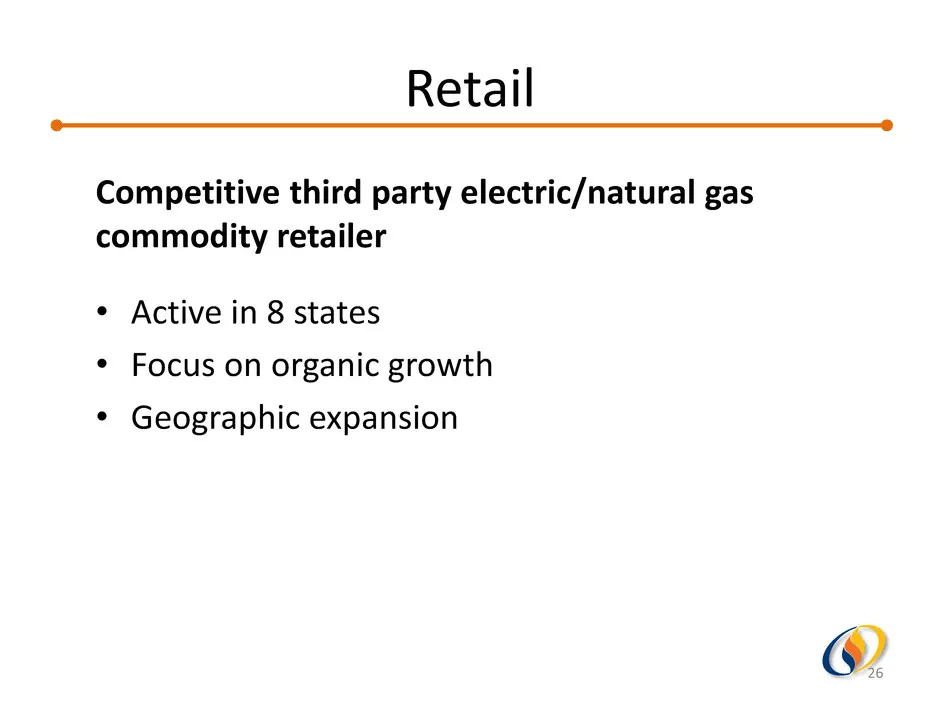
Retail 26 Competitive third party electric/natural gas commodity retailer • Active in 8 states • Focus on organic growth • Geographic expansion
Slide 27: Marcellus Shale
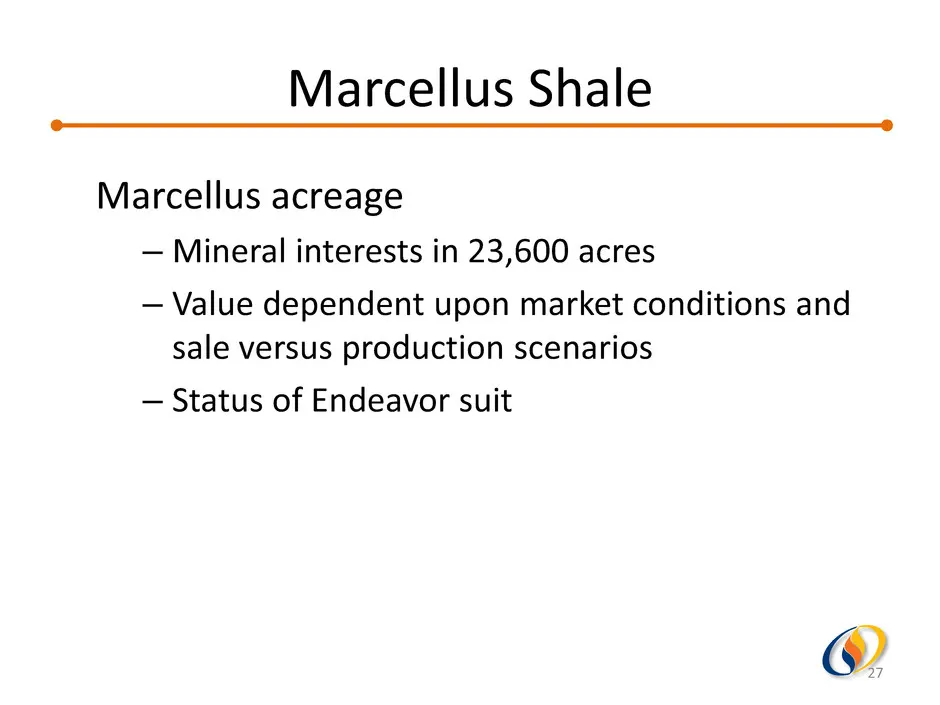
Marcellus Shale 27 Marcellus acreage –Mineral interests in 23,600 acres – Value dependent upon market conditions and sale versus production scenarios – Status of Endeavor suit
Slide 28: Energy Production
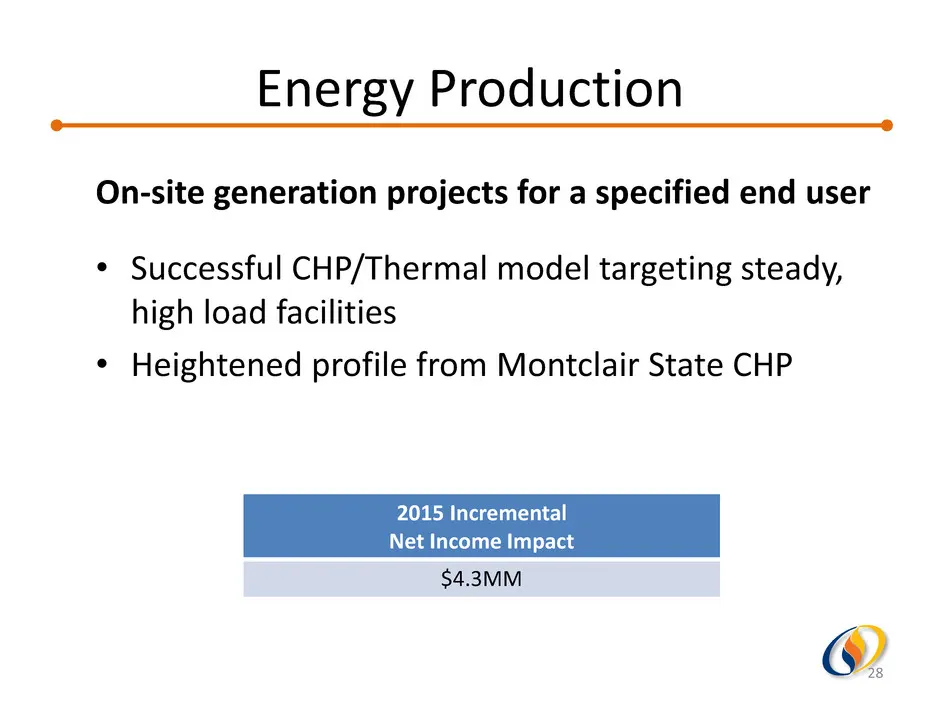
Energy Production 28 2015 Incremental Net Income Impact $4.3MM On-site generation projects for a specified end user • Successful CHP/Thermal model targeting steady, high load facilities • Heightened profile from Montclair State CHP
Slide 29: CHP/Thermal Projects Existing Queue
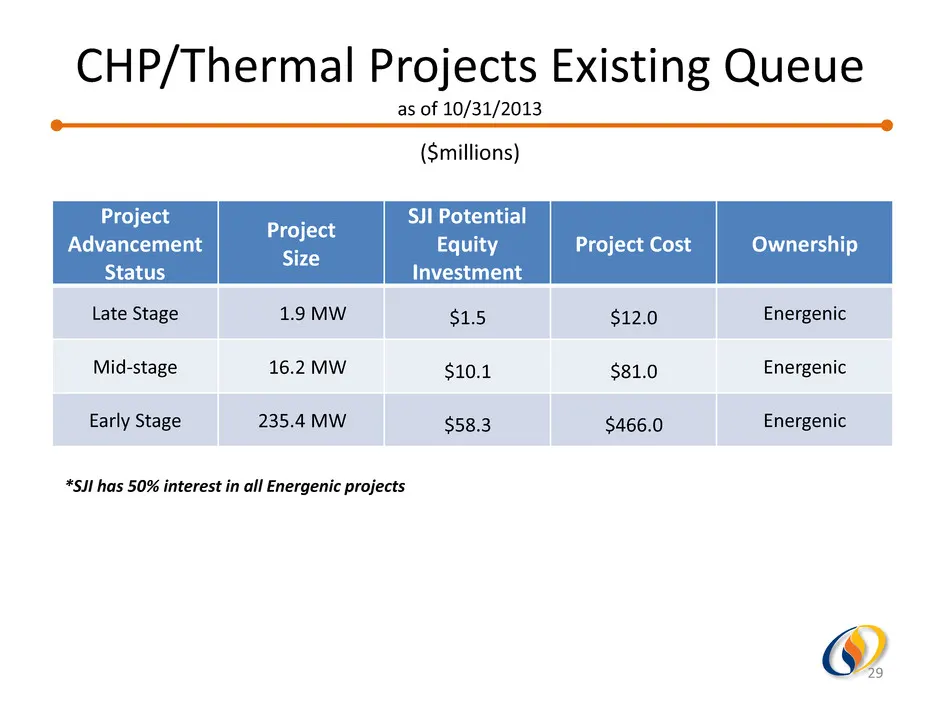
CHP/Thermal Projects Existing Queue as of 10/31/2013 29 *SJI has 50% interest in all Energenic projects ($millions) Project Advancement Status Project Size SJI Potential Equity Investment Project Cost Ownership Late Stage 1.9 MW $1.5 $12.0 Energenic Mid-stage 16.2 MW $10.1 $81.0 Energenic Early Stag
Slide 30: CHP/Thermal Projects Potential Universe
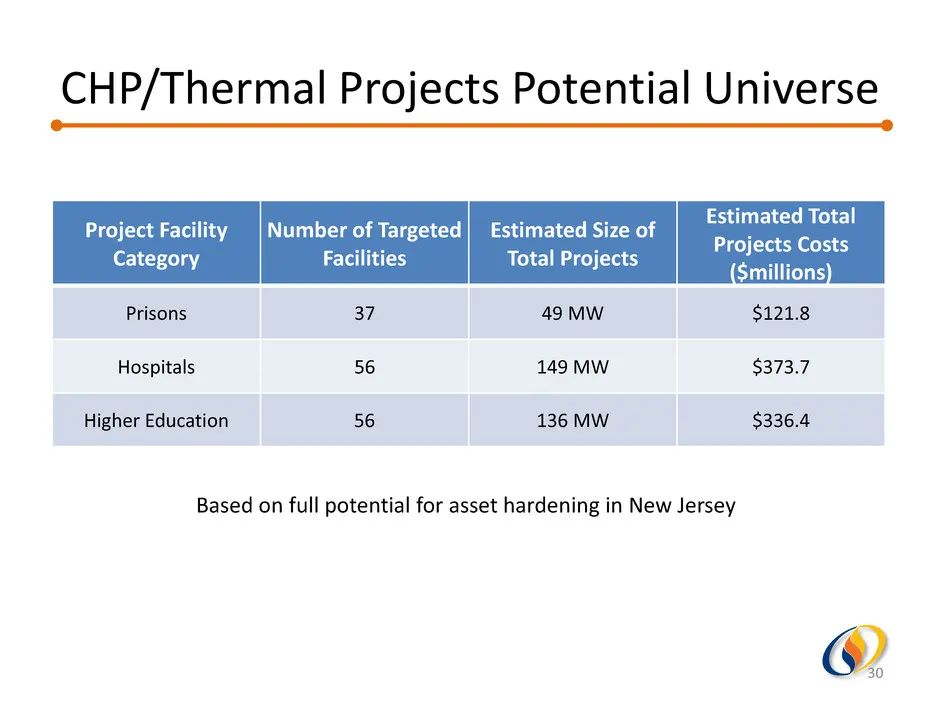
CHP/Thermal Projects Potential Universe 30 Based on full potential for asset hardening in New Jersey Project Facility Category Number of Targeted Facilities Estimated Size of Total Projects Estimated Total Projects Costs ($millions) Prisons 37 49 MW $121.8 Hospitals 56 149 MW $373.7 Higher Education
Slide 31: Renewables
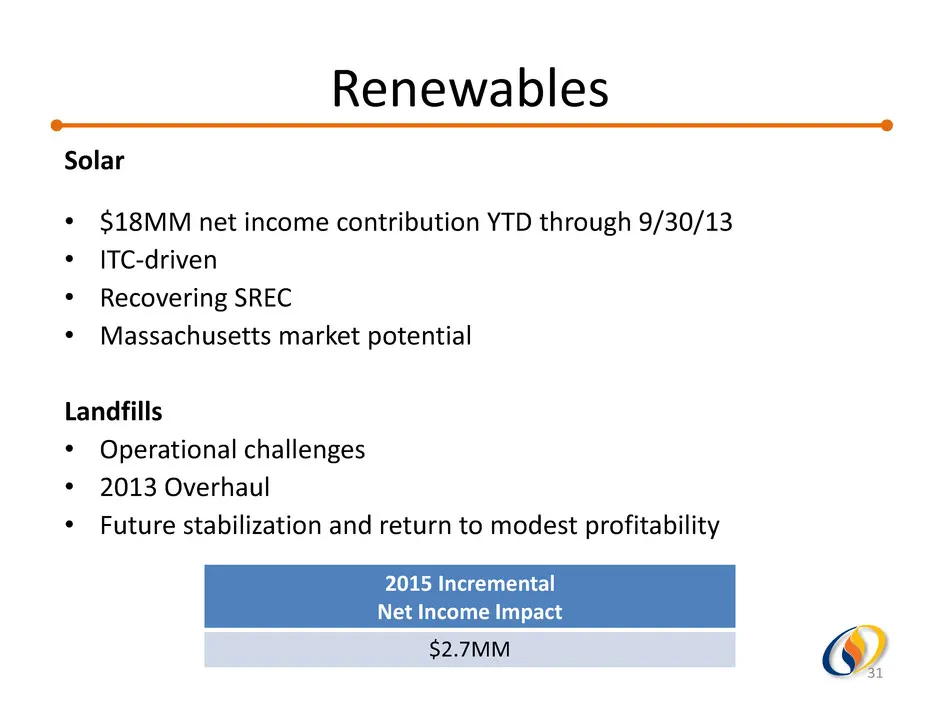
Renewables 31 2015 Incremental Net Income Impact $2.7MM Solar • $18MM net income contribution YTD through 9/30/13 • ITC-driven • Recovering SREC • Massachusetts market potential Landfills • Operational challenges • 2013 Overhaul • Future stabilization and return to modest profitability
Slide 32: Solar Markets
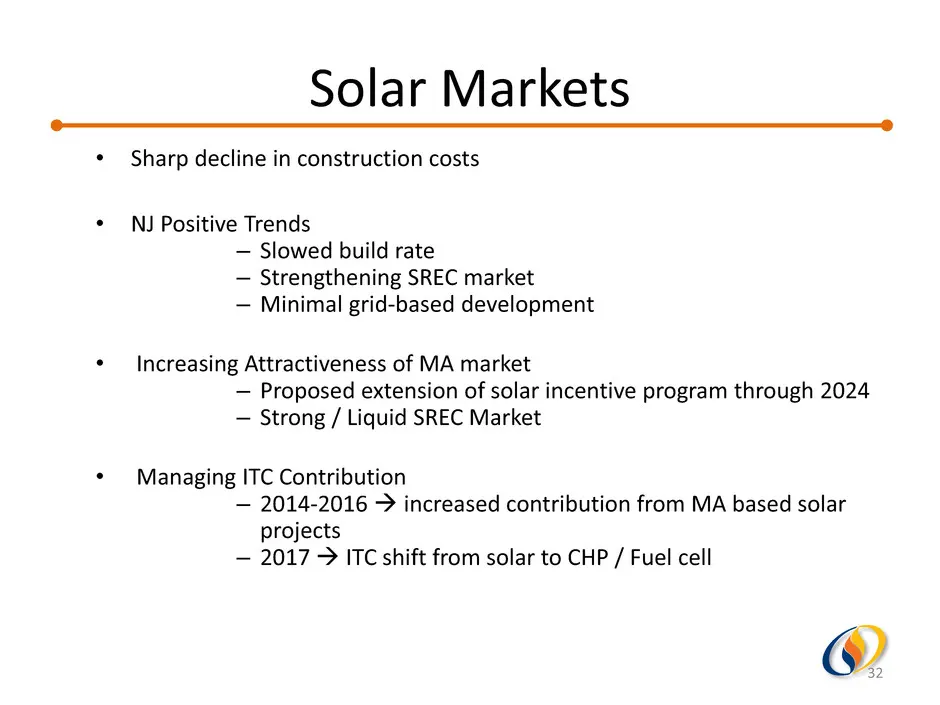
Solar Markets 32 • Sharp decline in construction costs • NJ Positive Trends – Slowed build rate – Strengthening SREC market – Minimal grid-based development • Increasing Attractiveness of MA market – Proposed extension of solar incentive program through 2024 – Strong / Liquid SREC Market • Managing
Slide 33: Impact of Solar Legislation
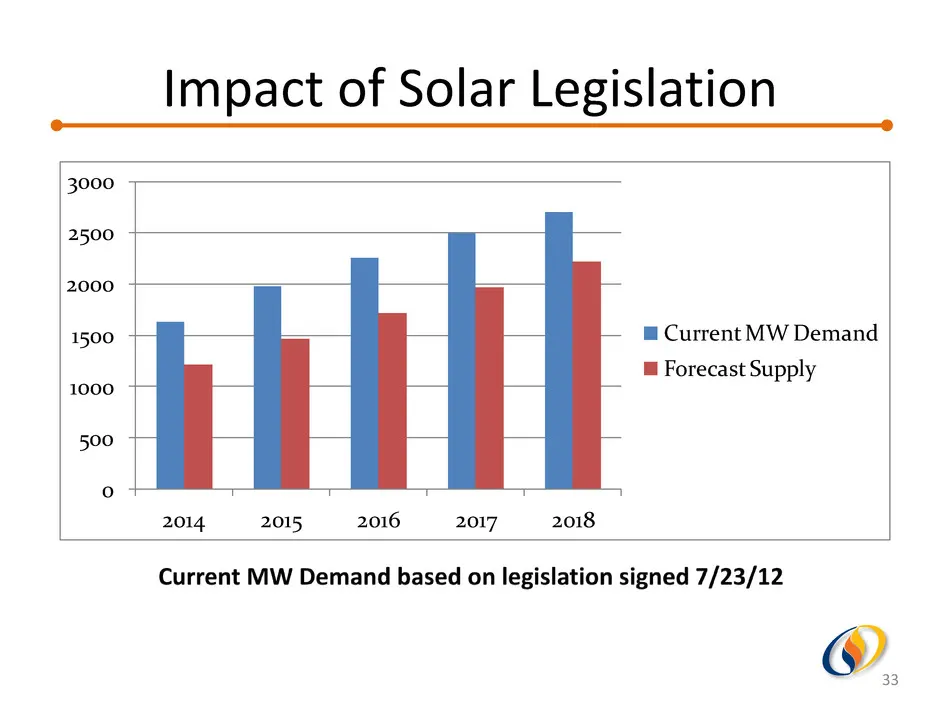
Impact of Solar Legislation 33 0 500 1000 1500 2000 2500 3000 2014 2015 2016 2017 2018 Current MW Demand Forecast Supply
Slide 34: Non-Utility Growth Summary
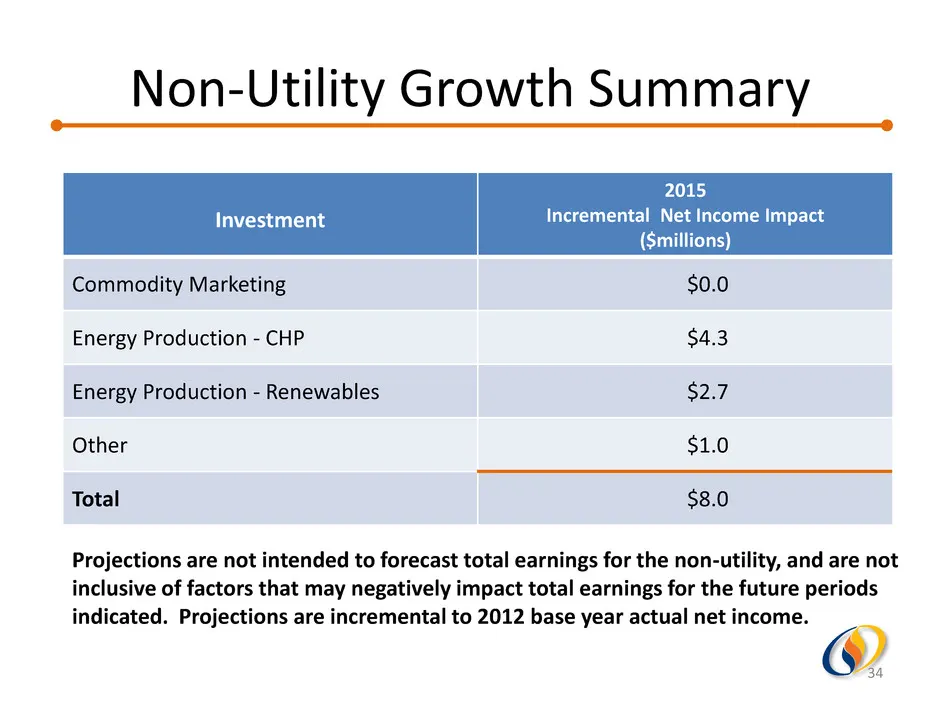
Non-Utility Growth Summary Investment 2015 Incremental Net Income Impact ($millions) Commodity Marketing $0.0 Energy Production - CHP $4.3 Energy Production - Renewables $2.7 Other $1.0 Total $8.0 34 Projections are not intended to forecast total earnings for the non-utility, and are not inclusive o

Slide 35: South Jersey Industries: Financial Structure
South Jersey Industries Financial Structure
Slide 36: Credit Ratings
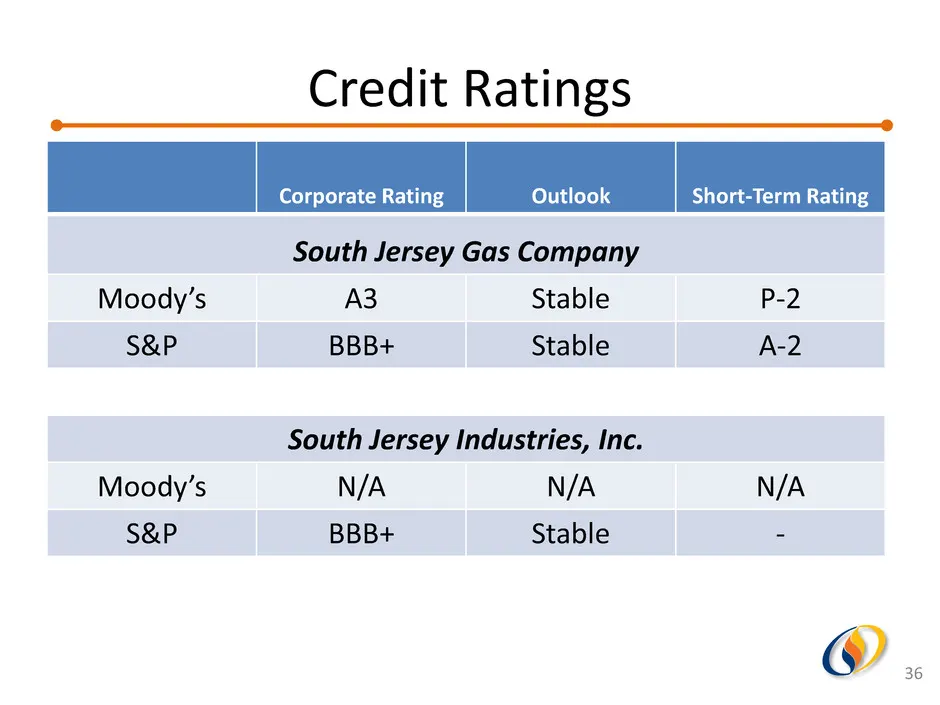
Credit Ratings 36 Corporate Rating Outlook Short-Term Rating South Jersey Gas Company Moody’s A3 Stable P-2 S&P BBB+ Stable A-2 South Jersey Industries, Inc. Moody’s N/A N/A N/A S&P BBB+ Stable -
Slide 37: Liquidity & Capitalization
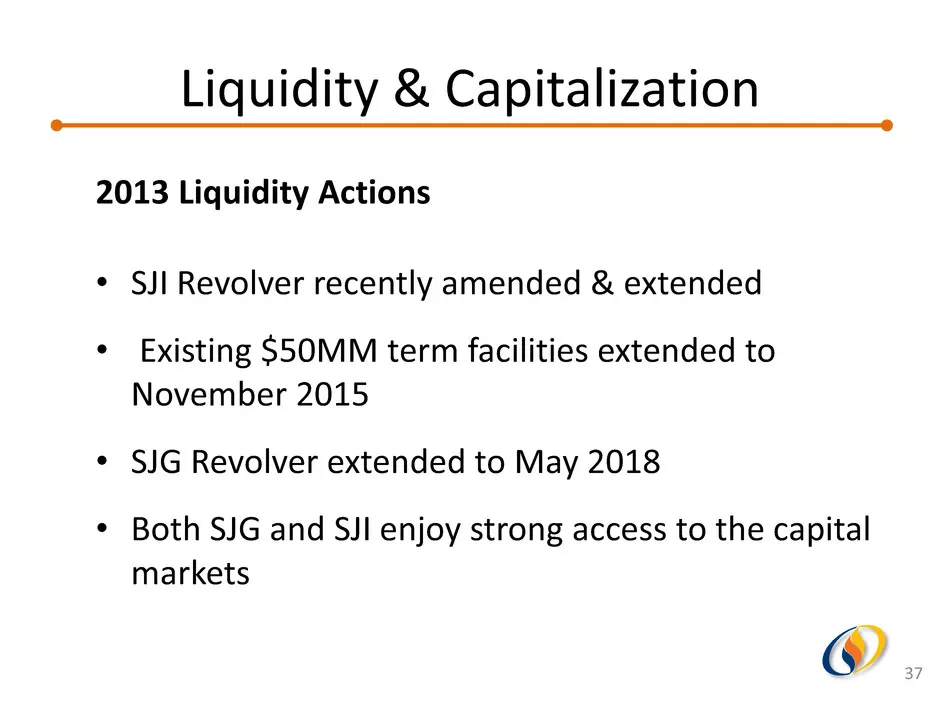
Liquidity & Capitalization 37 2013 Liquidity Actions • SJI Revolver recently amended & extended • Existing $50MM term facilities extended to November 2015 • SJG Revolver extended to May 2018 • Both SJG and SJI enjoy strong access to the capital markets
Slide 38: Economic Impact of Tax Benefits
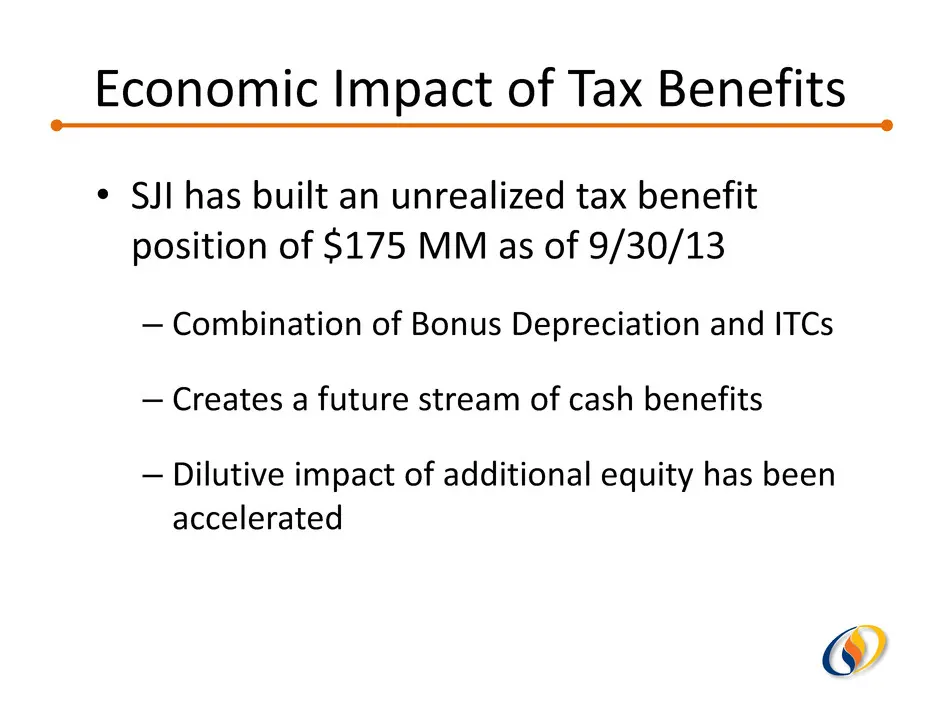
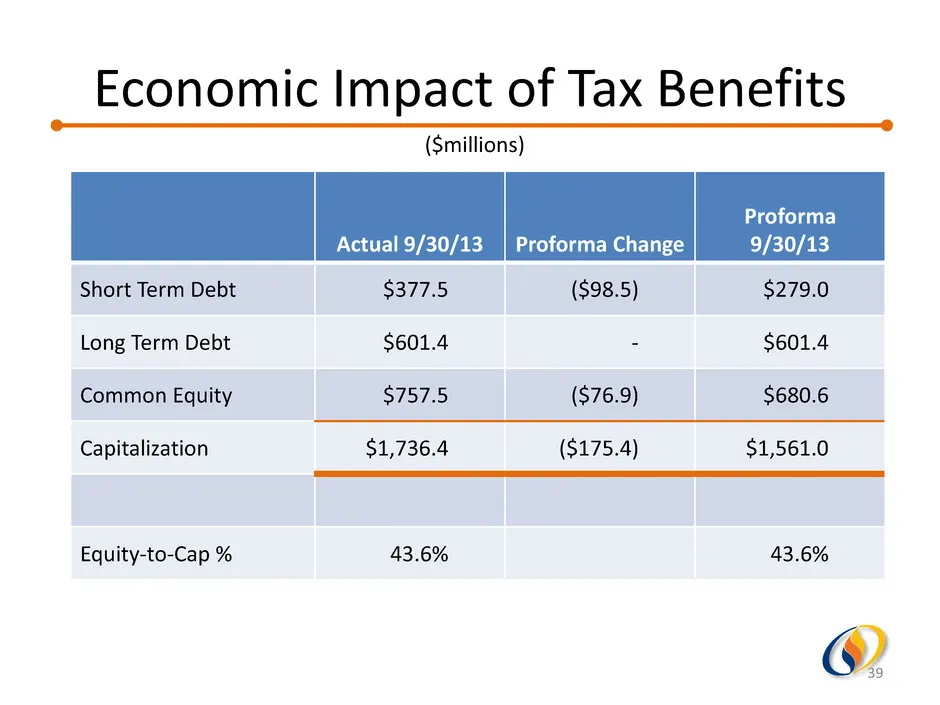
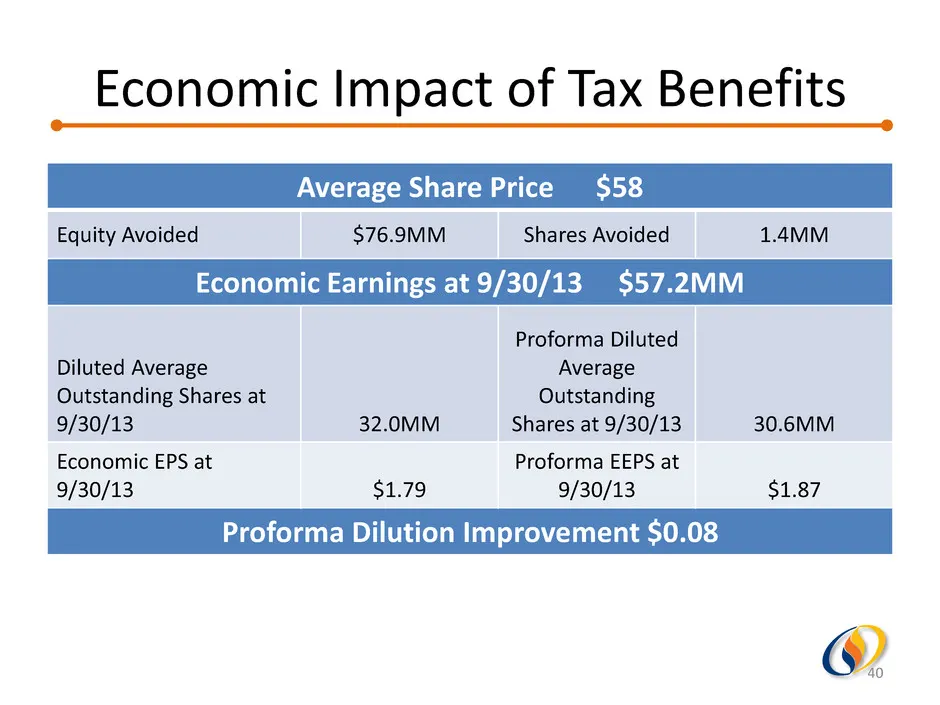
Economic Impact of Tax Benefits • SJI has built an unrealized tax benefit position of $175 MM as of 9/30/13 – Combination of Bonus Depreciation and ITCs – Creates a future stream of cash benefits – Dilutive impact of additional equity has been accelerated
Slide 39: Economic Impact of Tax Benefits
Economic Impact of Tax Benefits 39 Actual 9/30/13 Proforma Change Proforma 9/30/13 Short Term Debt $377.5 ($98.5) $279.0 Long Term Debt $601.4 - $601.4 Common Equity $757.5 ($76.9) $680.6 Capitalization $1,736.4 ($175.4) $1,561.0 Equity-to-Cap % 43.6% 43.6% ($millions)
Slide 40: Economic Impact of Tax Benefits
Economic Impact of Tax Benefits 40 Average Share Price $58 Equity Avoided $76.9MM Shares Avoided 1.4MM Economic Earnings at 9/30/13 $57.2MM Diluted Average Outstanding Shares at 9/30/13 32.0MM Proforma Diluted Average Outstanding Shares at 9/30/13 30.6MM Economic EPS at 9/30/13 $1.79 Proforma EEPS a
Slide 41: Business Update
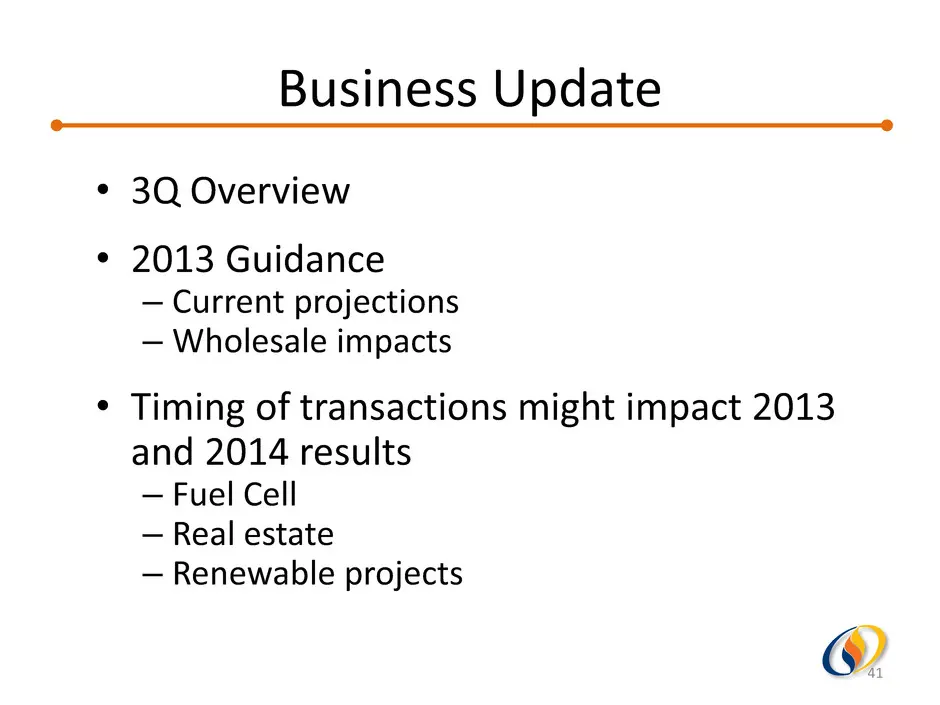
Business Update 41 • 3Q Overview • 2013 Guidance – Current projections – Wholesale impacts • Timing of transactions might impact 2013 and 2014 results – Fuel Cell – Real estate – Renewable projects
Slide 42: SJI Growth Opportunities
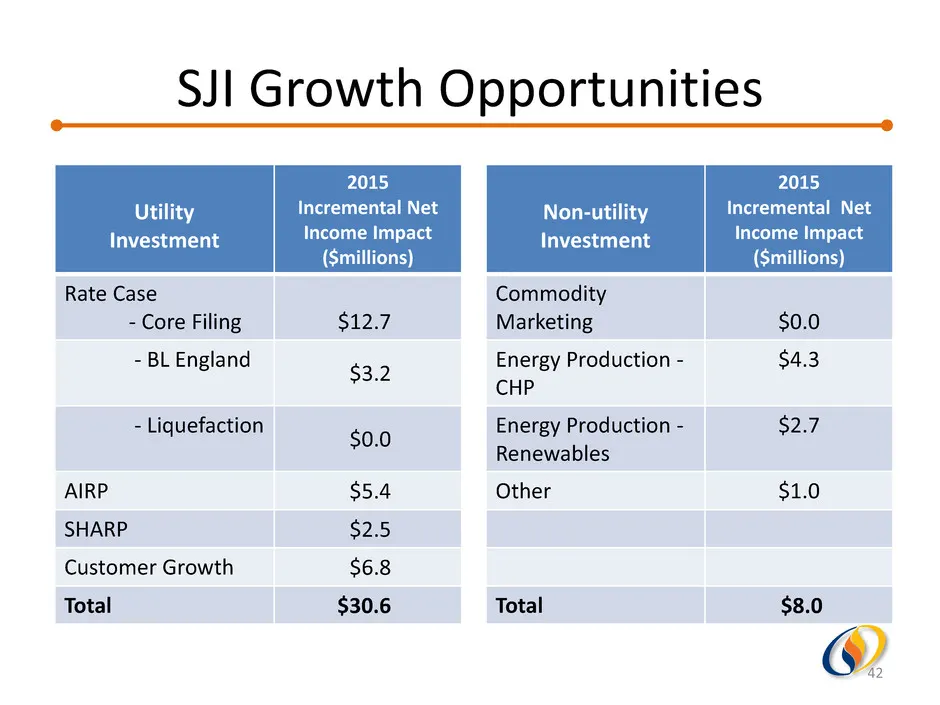
SJI Growth Opportunities Utility Investment 2015 Incremental Net Income Impact ($millions) Non-utility Investment 2015 Incremental Net Income Impact ($millions) Rate Case - Core Filing $12.7 Commodity Marketing $0.0 - BL England $3.2 Energy Production - CHP $4.3 - Liquefaction $0.0 Energy Production
Source: SEC EDGAR · 8-K filed Dec 6, 2013
More decks from South Jersey Industries Inc
 FY2021 Earnings Presentation29 slides · Feb 24, 2022
 Q3 2021 Earnings Presentation31 slides · Nov 3, 2021
 Q2 2021 Earnings Presentation31 slides · Aug 4, 2021
 Investor Day (May 2021)88 slides · May 6, 2021
 FY2020 Earnings Presentation31 slides · Feb 24, 2021
 Q3 2020 Earnings Presentation37 slides · Nov 4, 2020