Flutter Entertainment plc · NYSE:FLUT
Flutter Entertainment — Paddy Power Betfair — FY2017 Earnings Presentation
29 slides from Flutter Entertainment's earnings presentation, 2018

Slide 1: Paddy Power Betfair plc 2017 Prelim Results
Paddy Power Betfair plc 2017 Prelim Results
Slide 2: Overview
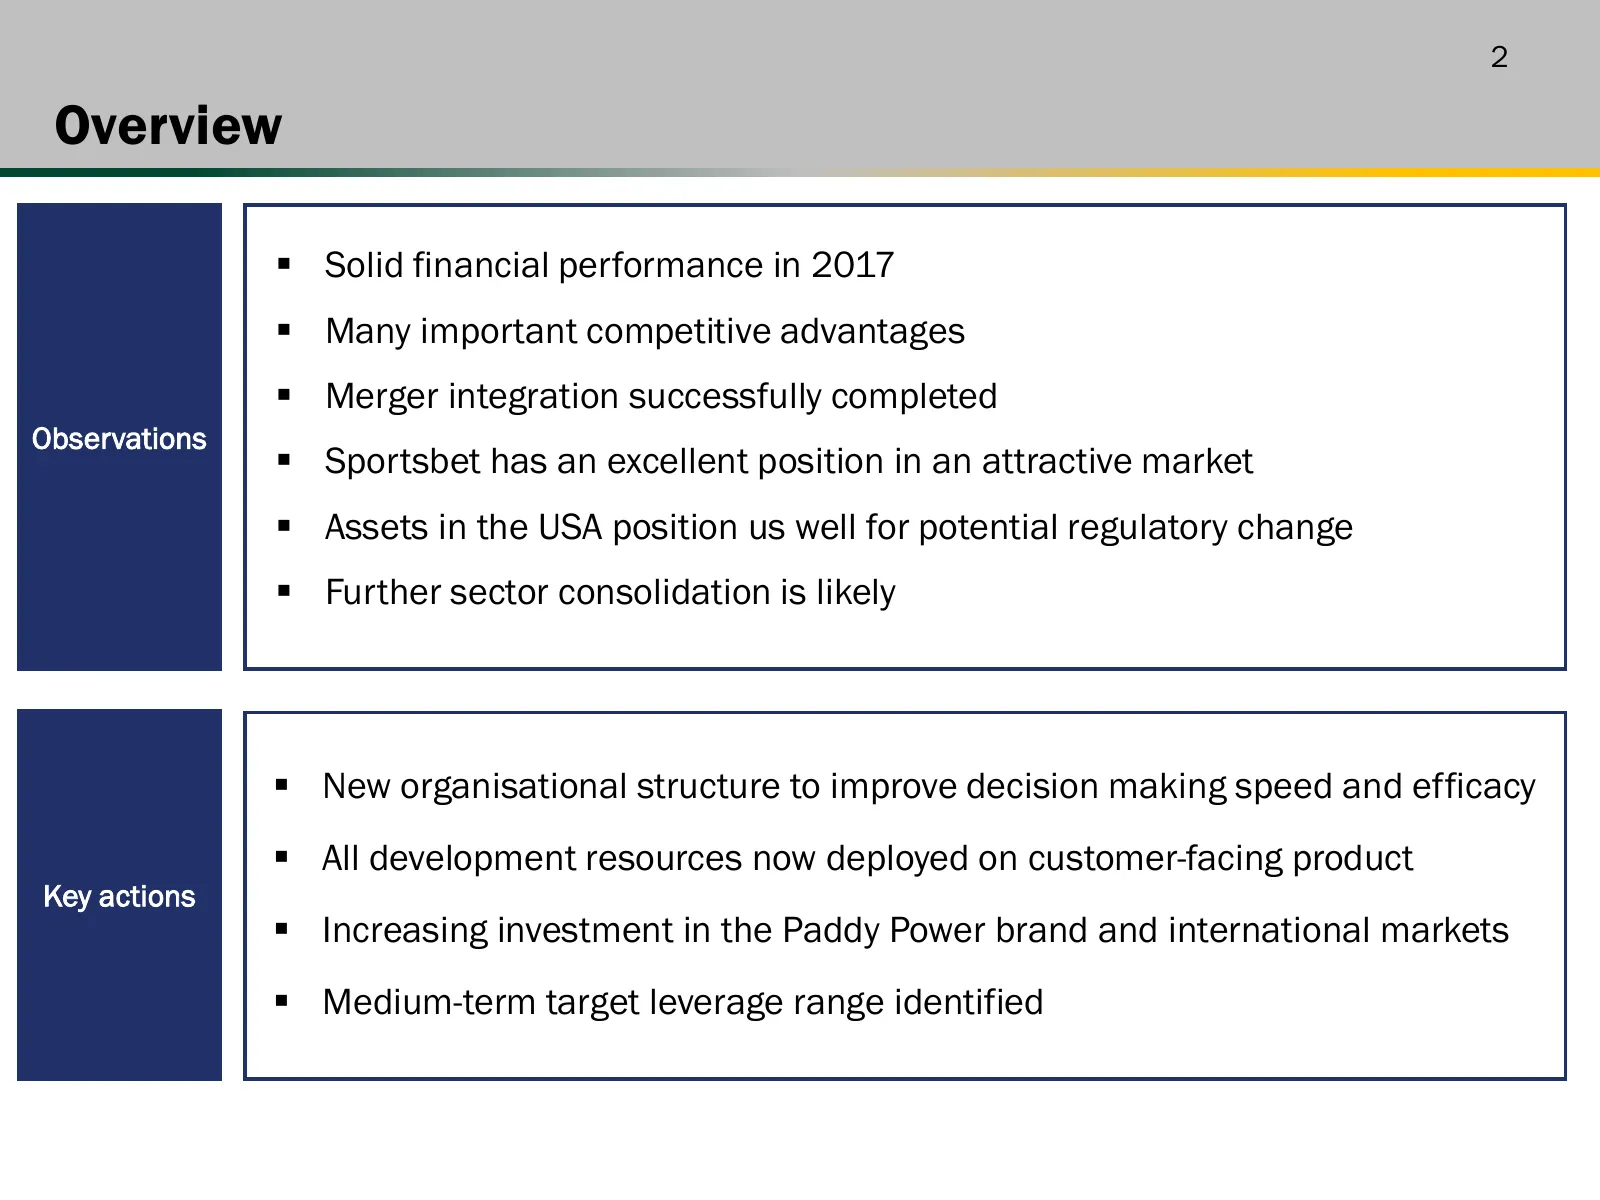
2 Overview Solid financial performance in 2017 Many important competitive advantages Merger integration successfully completed Observations Sportsbet has an excellent position in an attractive market Assets in the USA position us well for potential regulatory change Further sector consol
Slide 3: Financial & Operating Review
Financial & Operating Review
Slide 4: Financial highlights
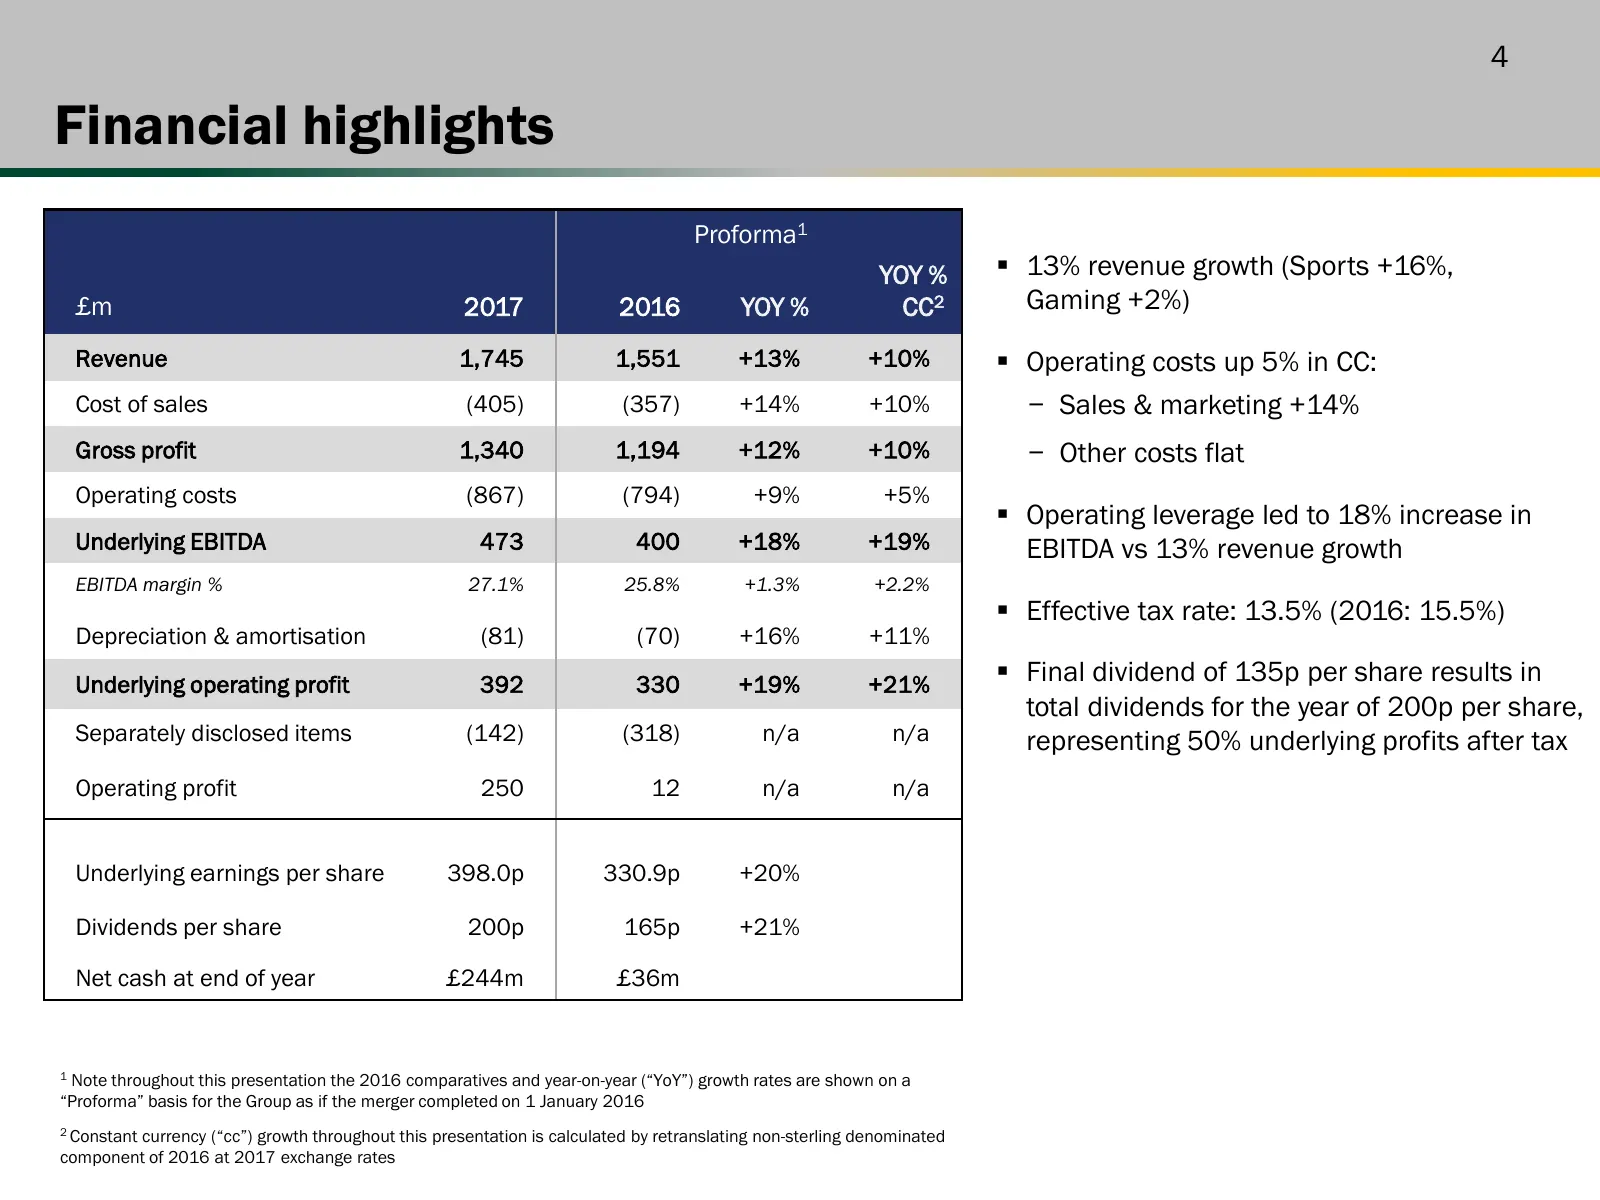
4 Financial highlights Proforma1 YOY % 13% revenue growth (Sports +16%, £m 2017 2016 YOY % CC2 Gaming +2%) Revenue 1,745 1,551 +13% +10% Operating costs up 5% in CC: Cost of sales (405) (357) +14% +10% − Sales & marketing +14% Gross profit 1,340 1,194 +12% +10% − Other costs flat Operating costs
Slide 5: Group EBITDA bridge
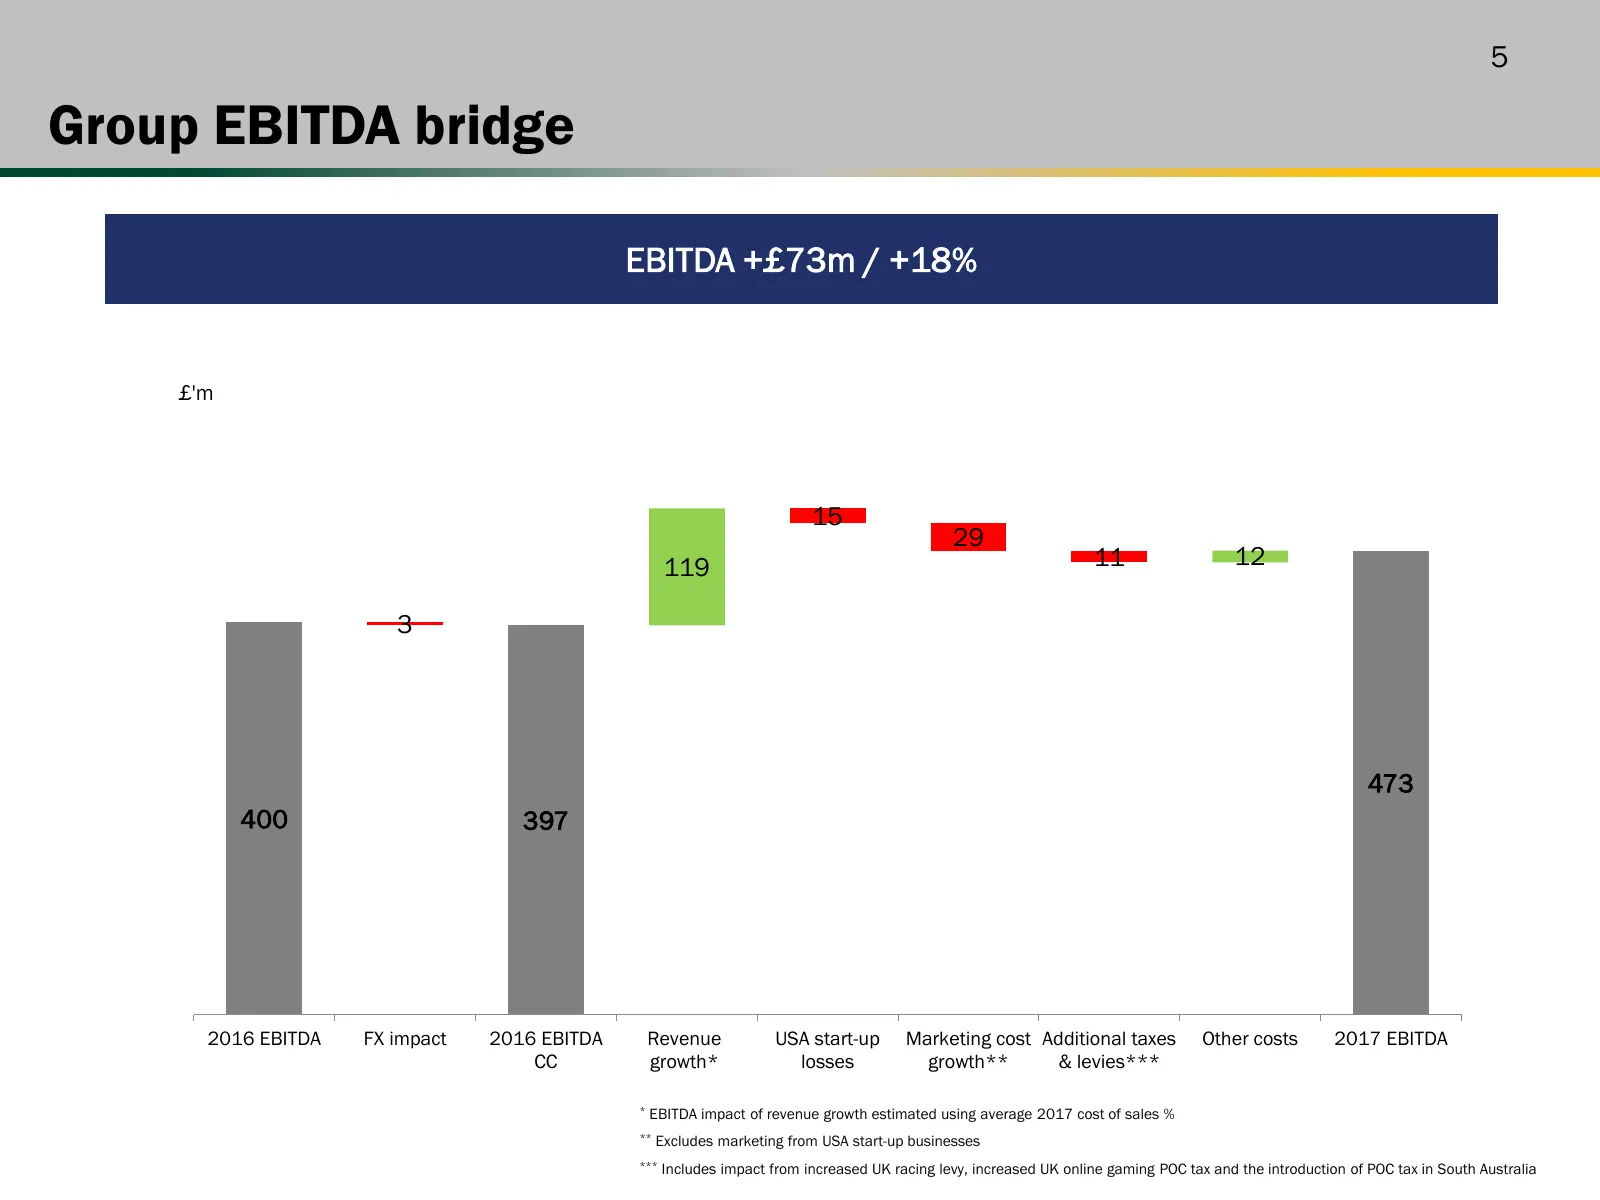
5 Group EBITDA bridge EBITDA +£73m / +18% £'m 15 29 119 11 12 3 473 400 397 2016 EBITDA FX impact 2016 EBITDA Revenue USA start-up Marketing cost Additional taxes Other costs 2017 EBITDA CC growth* losses growth** & levies*** * EBITDA impact of revenue growth estimated using average 2017 cost of sal
Slide 6: Online
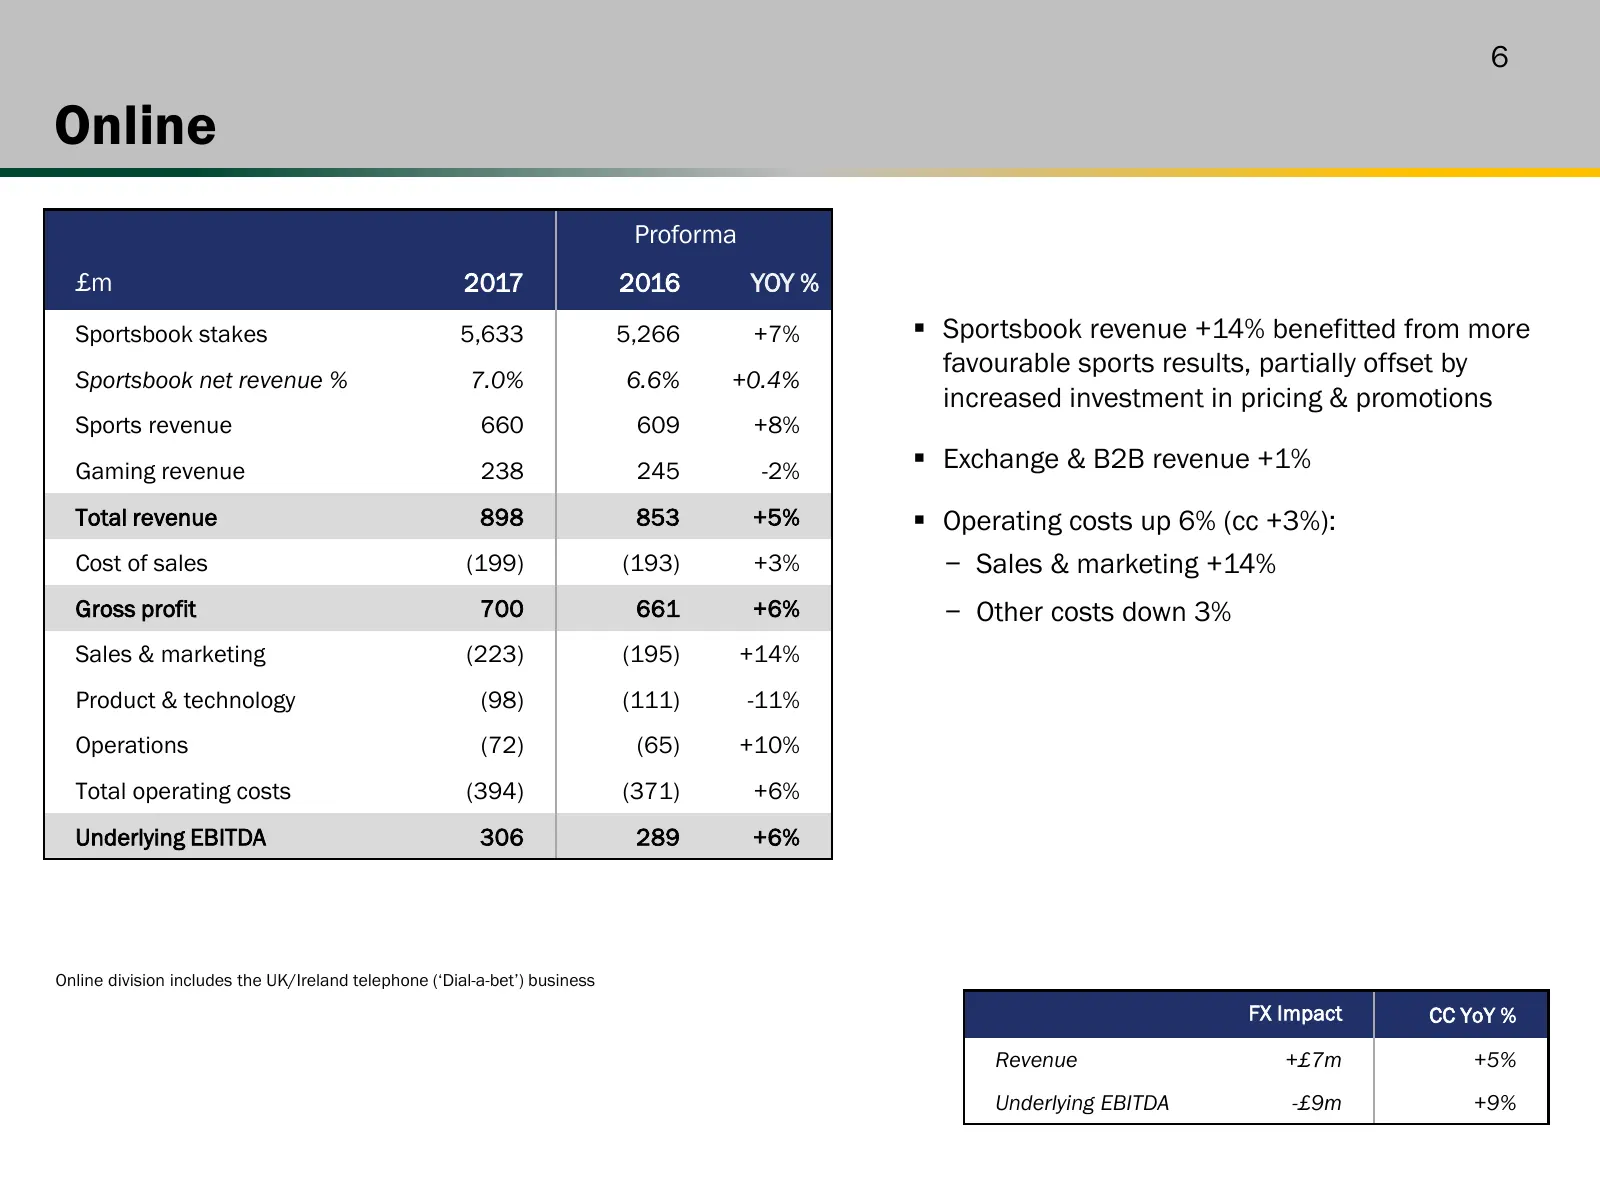
6 Online Proforma £m 2017 2016 YOY % Sportsbook stakes 5,633 5,266 +7% Sportsbook revenue +14% benefitted from more favourable sports results, partially offset by Sportsbook net revenue % 7.0% 6.6% +0.4% increased investment in pricing & promotions Sports revenue 660 609 +8% Gaming revenue 238 245
Slide 7: Australia
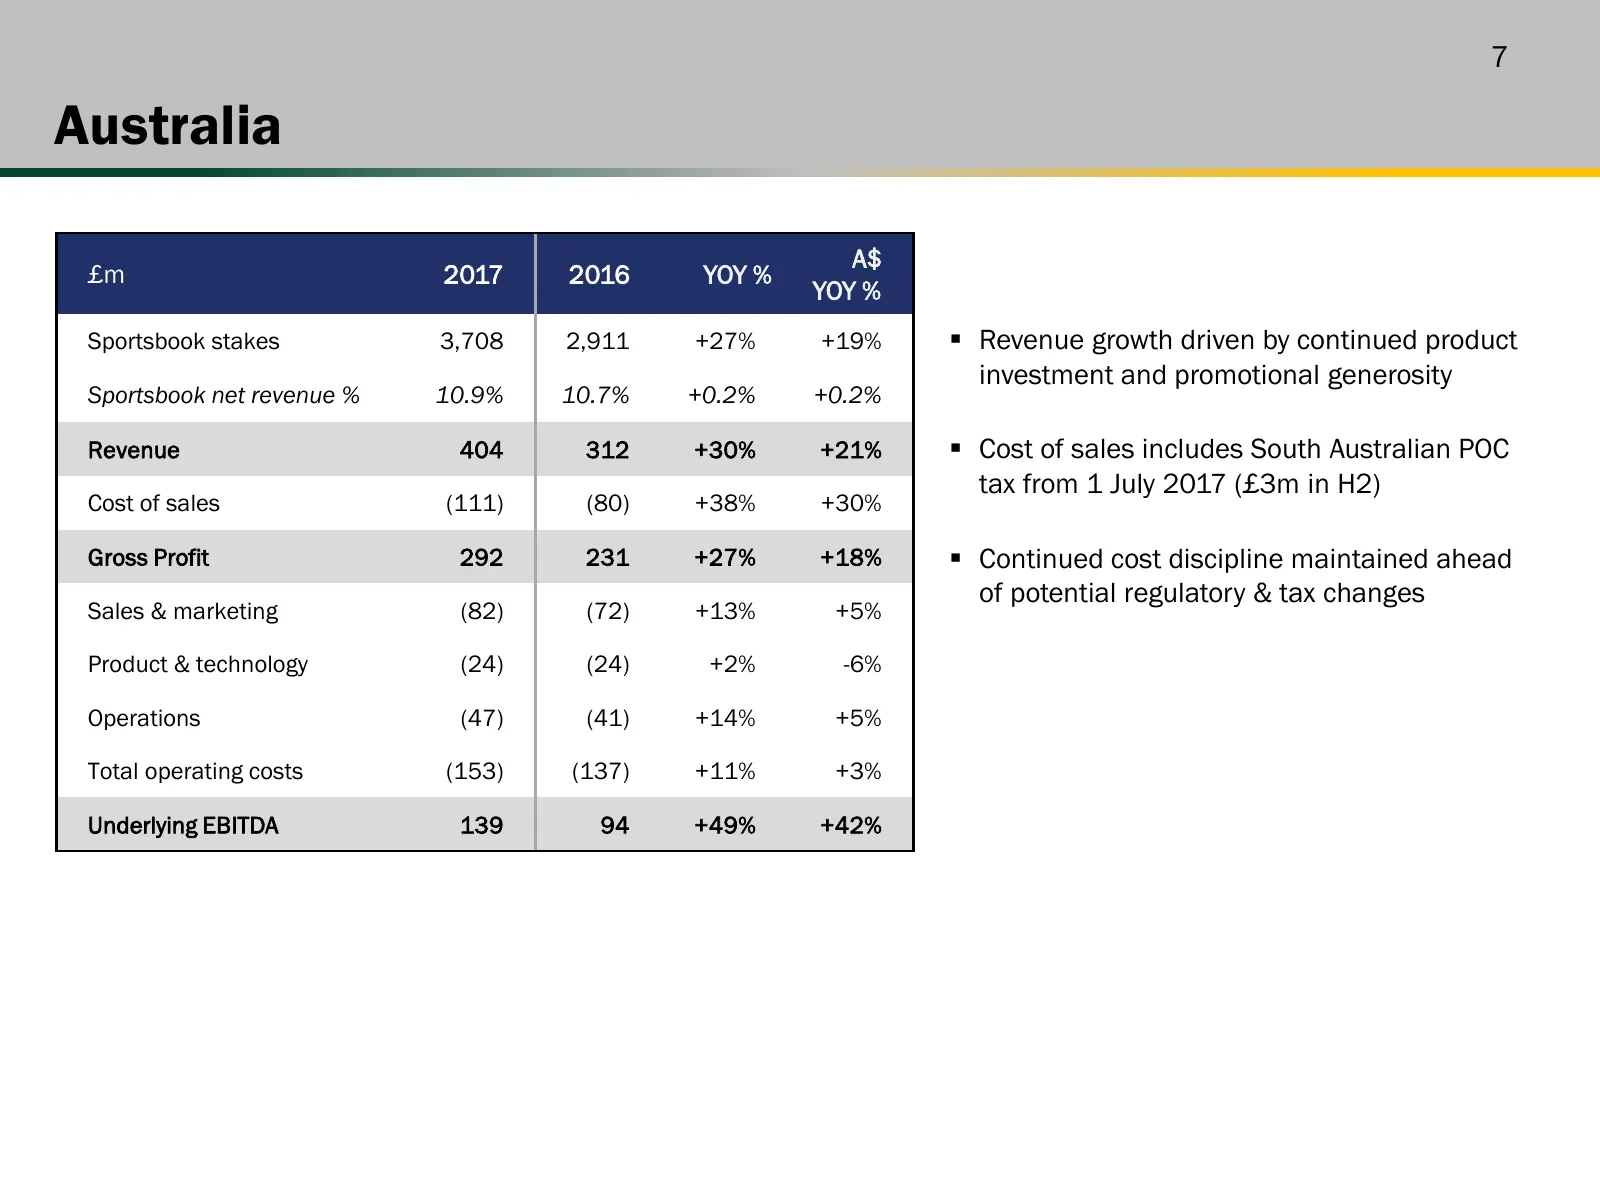
7 Australia A$ £m 2017 2016 YOY % YOY % Sportsbook stakes 3,708 2,911 +27% +19% Revenue growth driven by continued product investment and promotional generosity Sportsbook net revenue % 10.9% 10.7% +0.2% +0.2% Revenue 404 312 +30% +21% Cost of sales includes South Australian POC tax from 1 July
Slide 8: Retail
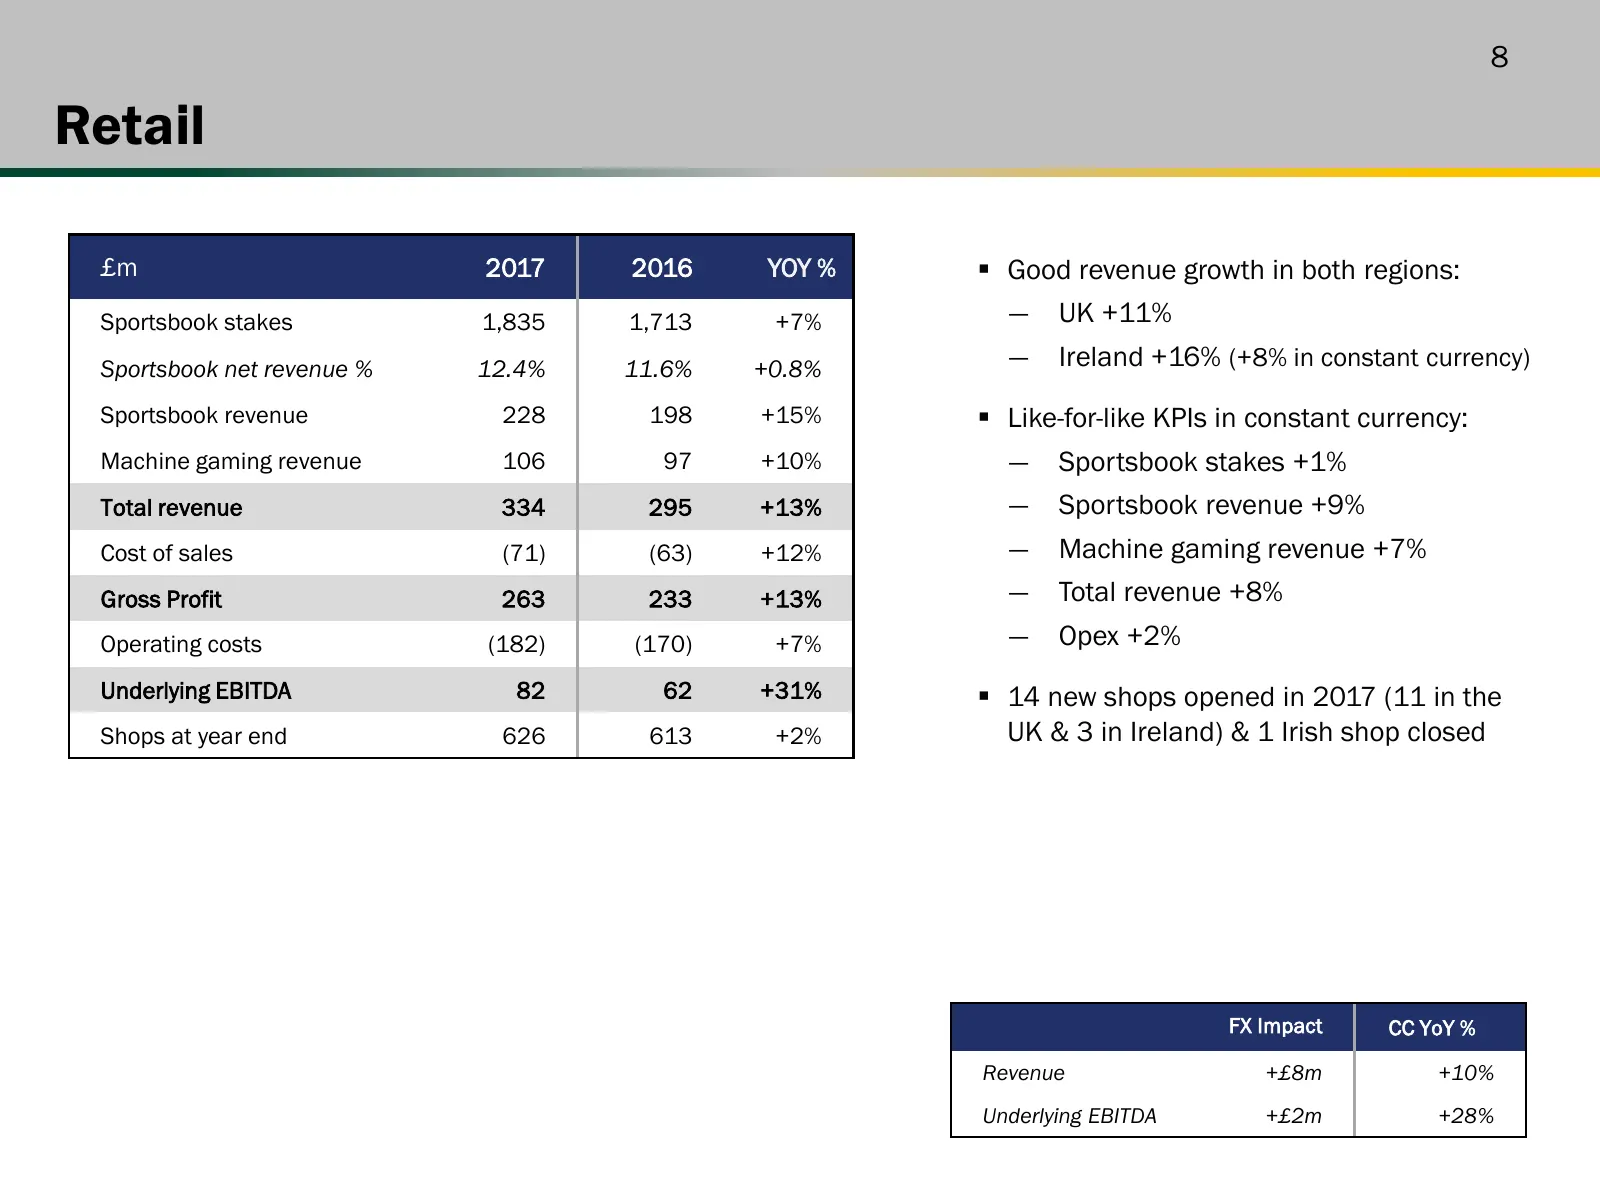
8 Retail £m 2017 2016 YOY % Good revenue growth in both regions: Sportsbook stakes 1,835 1,713 +7% ― UK +11% Sportsbook net revenue % 12.4% 11.6% +0.8% ― Ireland +16% (+8% in constant currency) Sportsbook revenue 228 198 +15% Like-for-like KPIs in constant currency: Machine gaming revenue 106 97
Slide 9: US
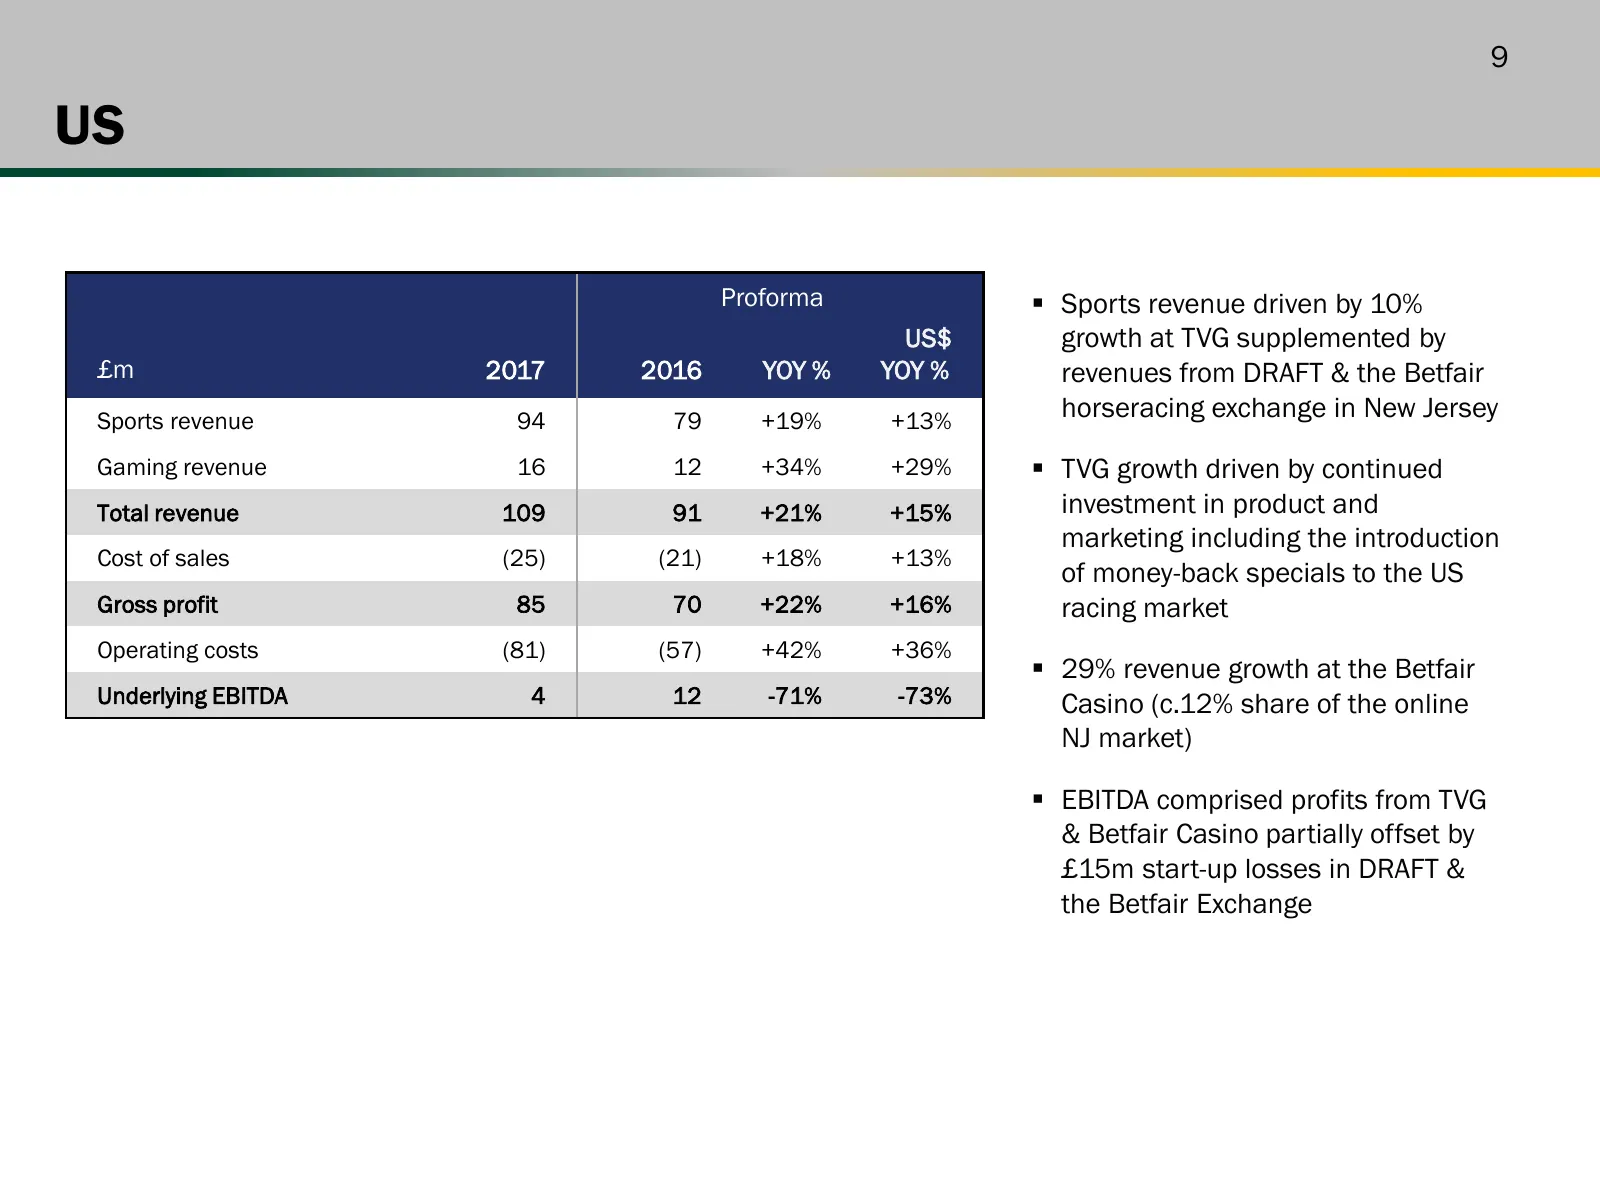
9 US Proforma Sports revenue driven by 10% US$ growth at TVG supplemented by £m 2017 2016 YOY % YOY % revenues from DRAFT & the Betfair Sports revenue 94 79 +19% +13% horseracing exchange in New Jersey Gaming revenue 16 12 +34% +29% TVG growth driven by continued Total revenue 109 91 +21% +15% i
Slide 10: Cash flow
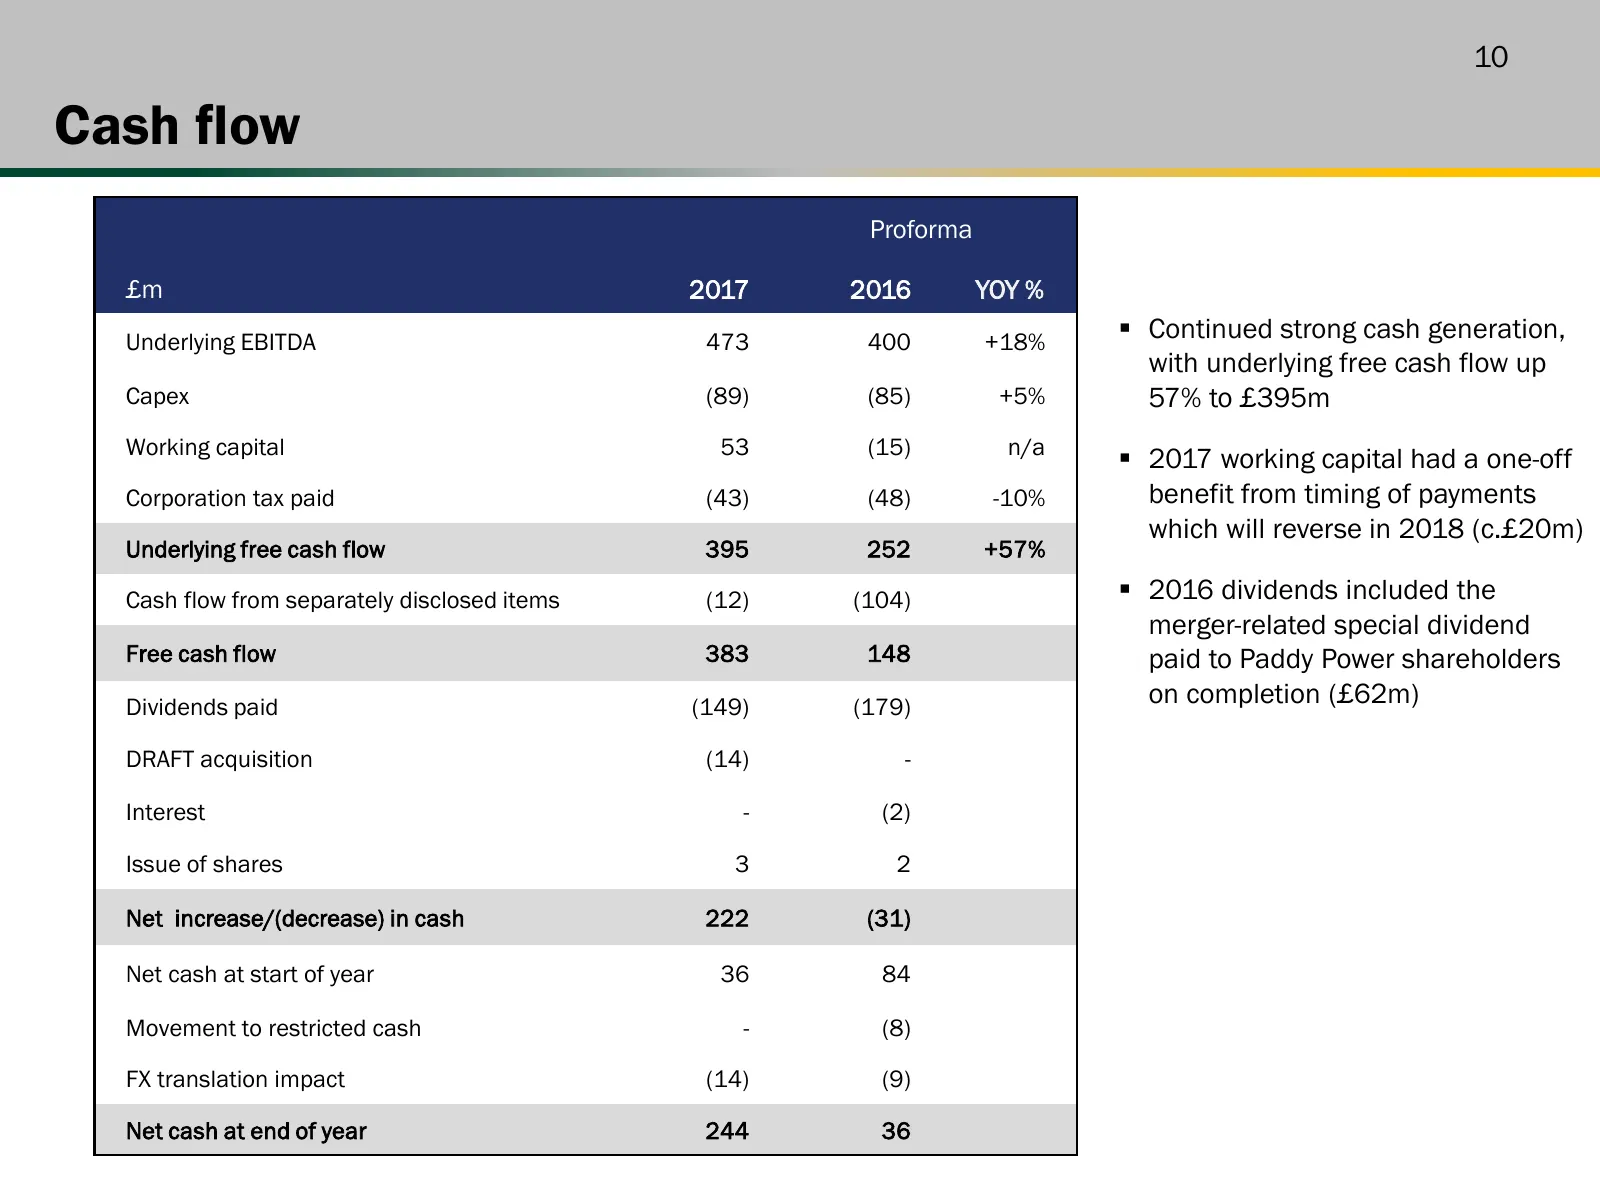
10 Cash flow Proforma £m 2017 2016 YOY % Underlying EBITDA 473 400 +18% Continued strong cash generation, with underlying free cash flow up Capex (89) (85) +5% 57% to £395m Working capital 53 (15) n/a 2017 working capital had a one-off Corporation tax paid (43) (48) -10% benefit from timing of p
Slide 11: Financial guidance
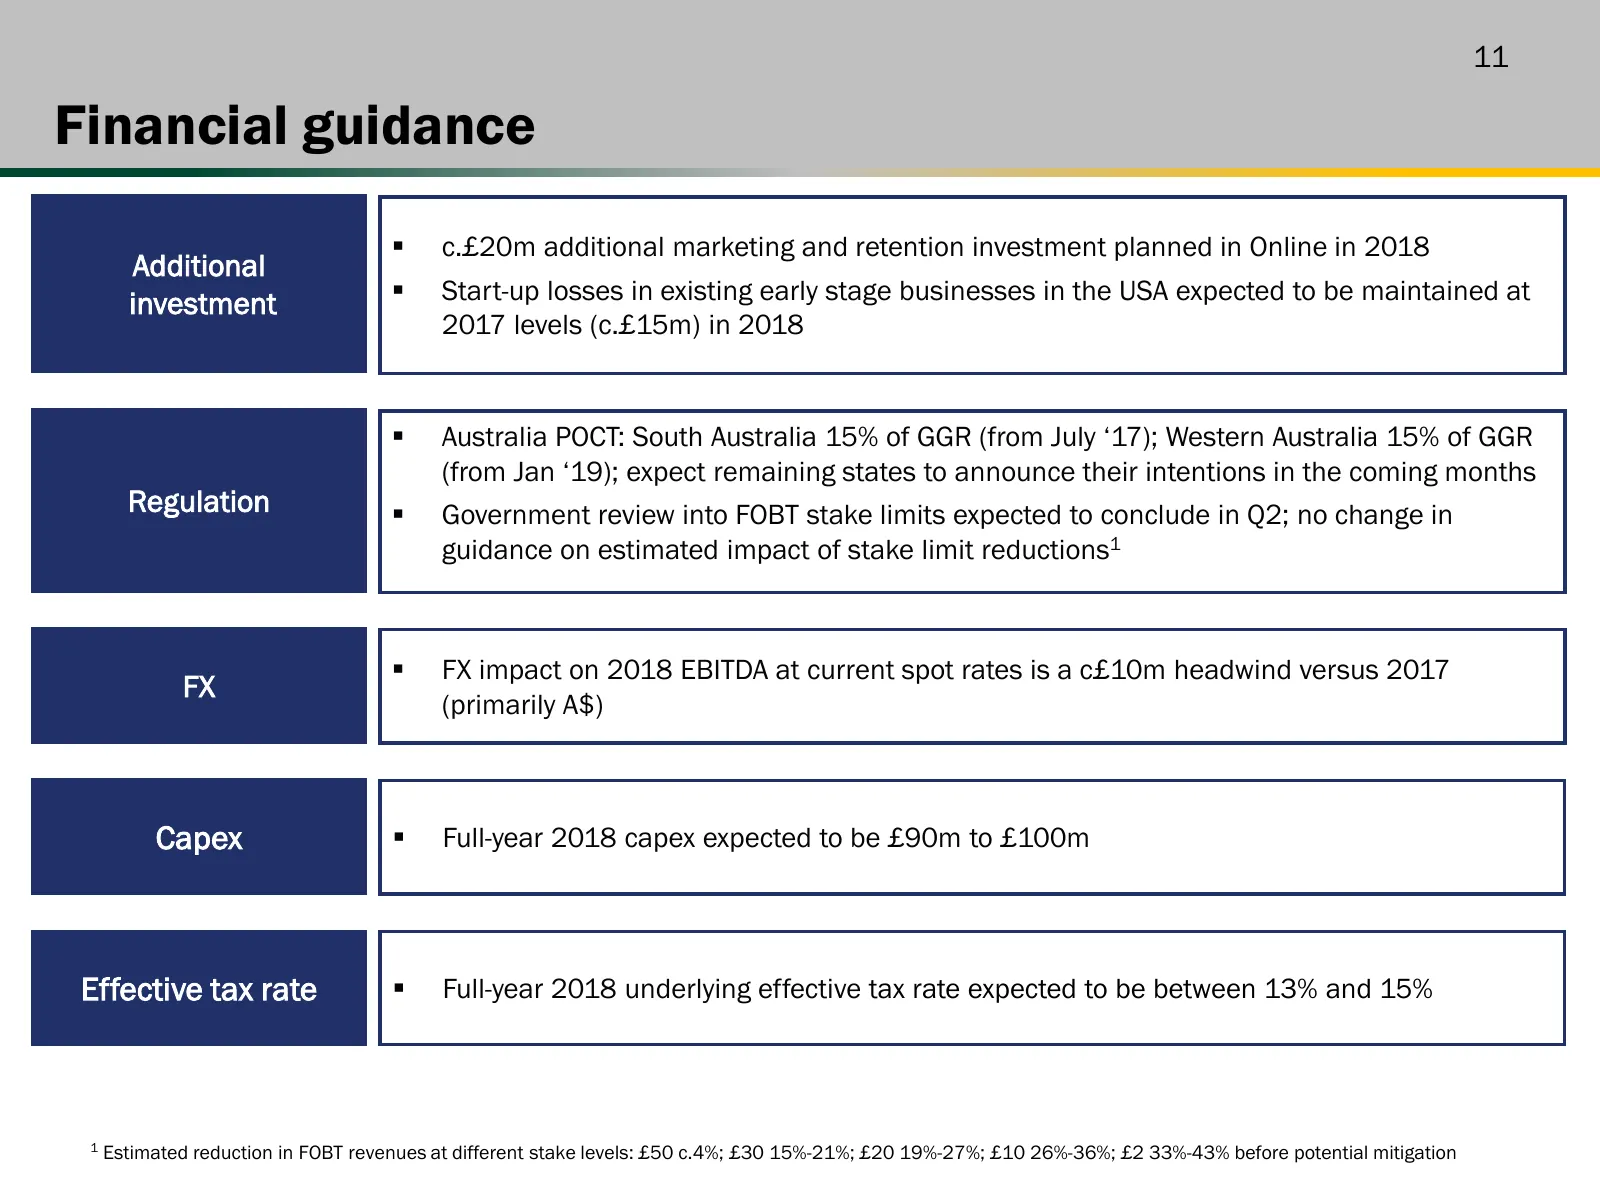
11 Financial guidance c.£20m additional marketing and retention investment planned in Online in 2018 Additional investment Start-up losses in existing early stage businesses in the USA expected to be maintained at 2017 levels (c.£15m) in 2018 Australia POCT: South Australia 15% of GGR (from Ju

Slide 12: Business Review
pETMIR CHASE 2017 WINNER ay
Slide 13: Priorities
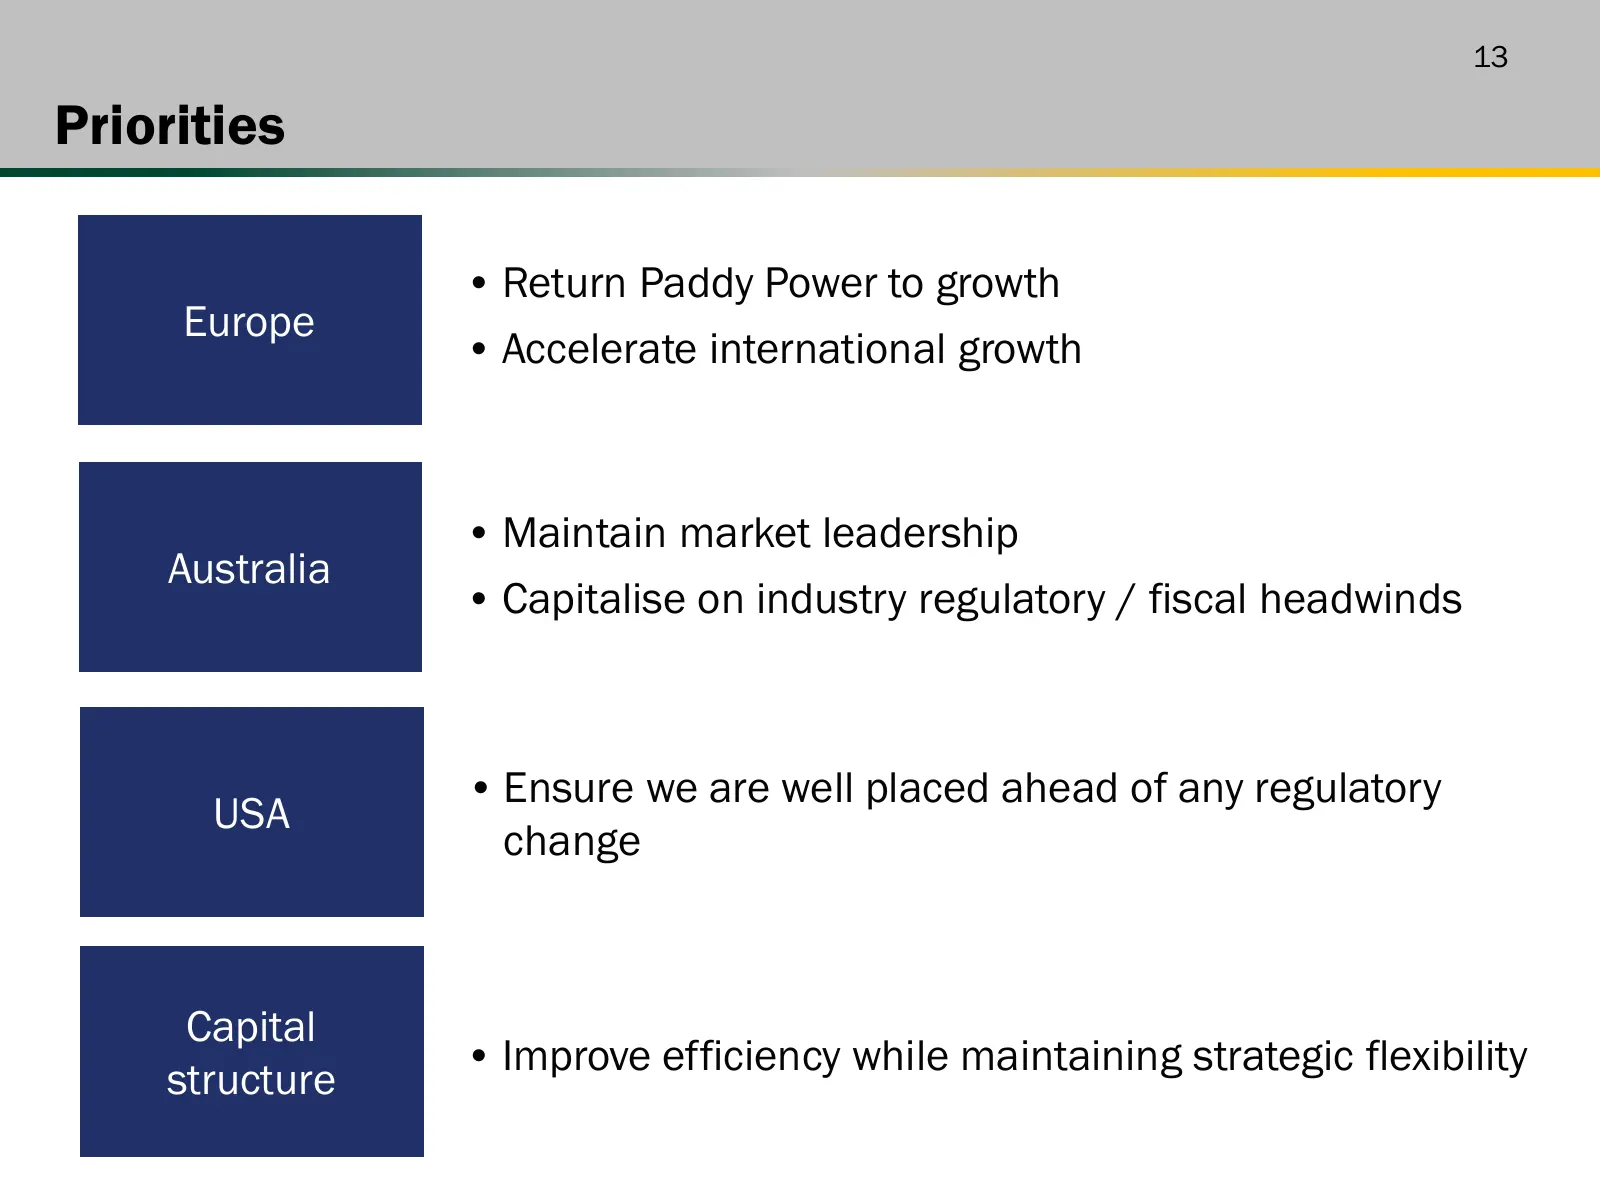
13 Priorities • Return Paddy Power to growth Europe • Accelerate international growth • Maintain market leadership Australia • Capitalise on industry regulatory / fiscal headwinds • Ensure we are well placed ahead of any regulatory USA change Capital • Improve efficiency while maintaining strategic
Slide 14: Betfair sports performing well, Paddy Power losing share
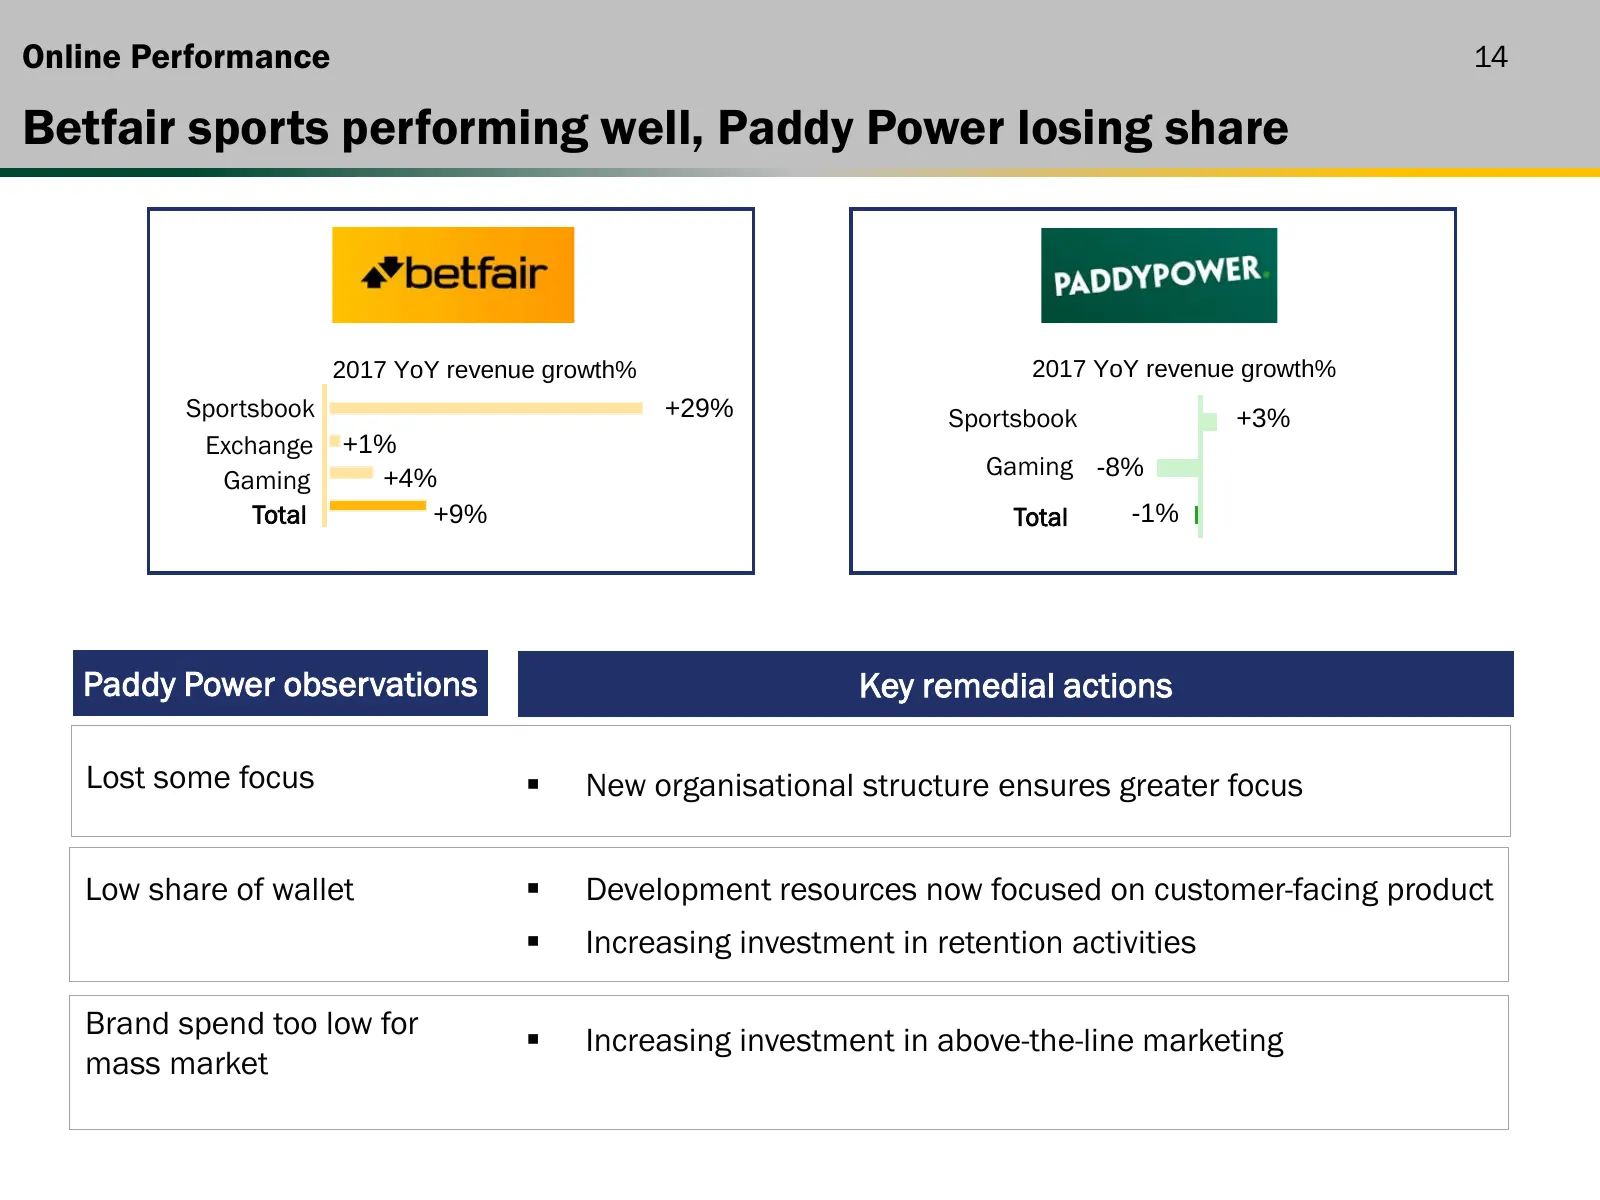
Online Performance 14 Betfair sports performing well, Paddy Power losing share 2017 YoY revenue growth% 2017 YoY revenue growth% Sportsbook +29% Sportsbook +3% Exchange +1% Gaming +4% Gaming -8% Total +9% Total -1% Paddy Power observations Key remedial actions Lost some focus New organisational st
Slide 15: Improved decision making and brand focus
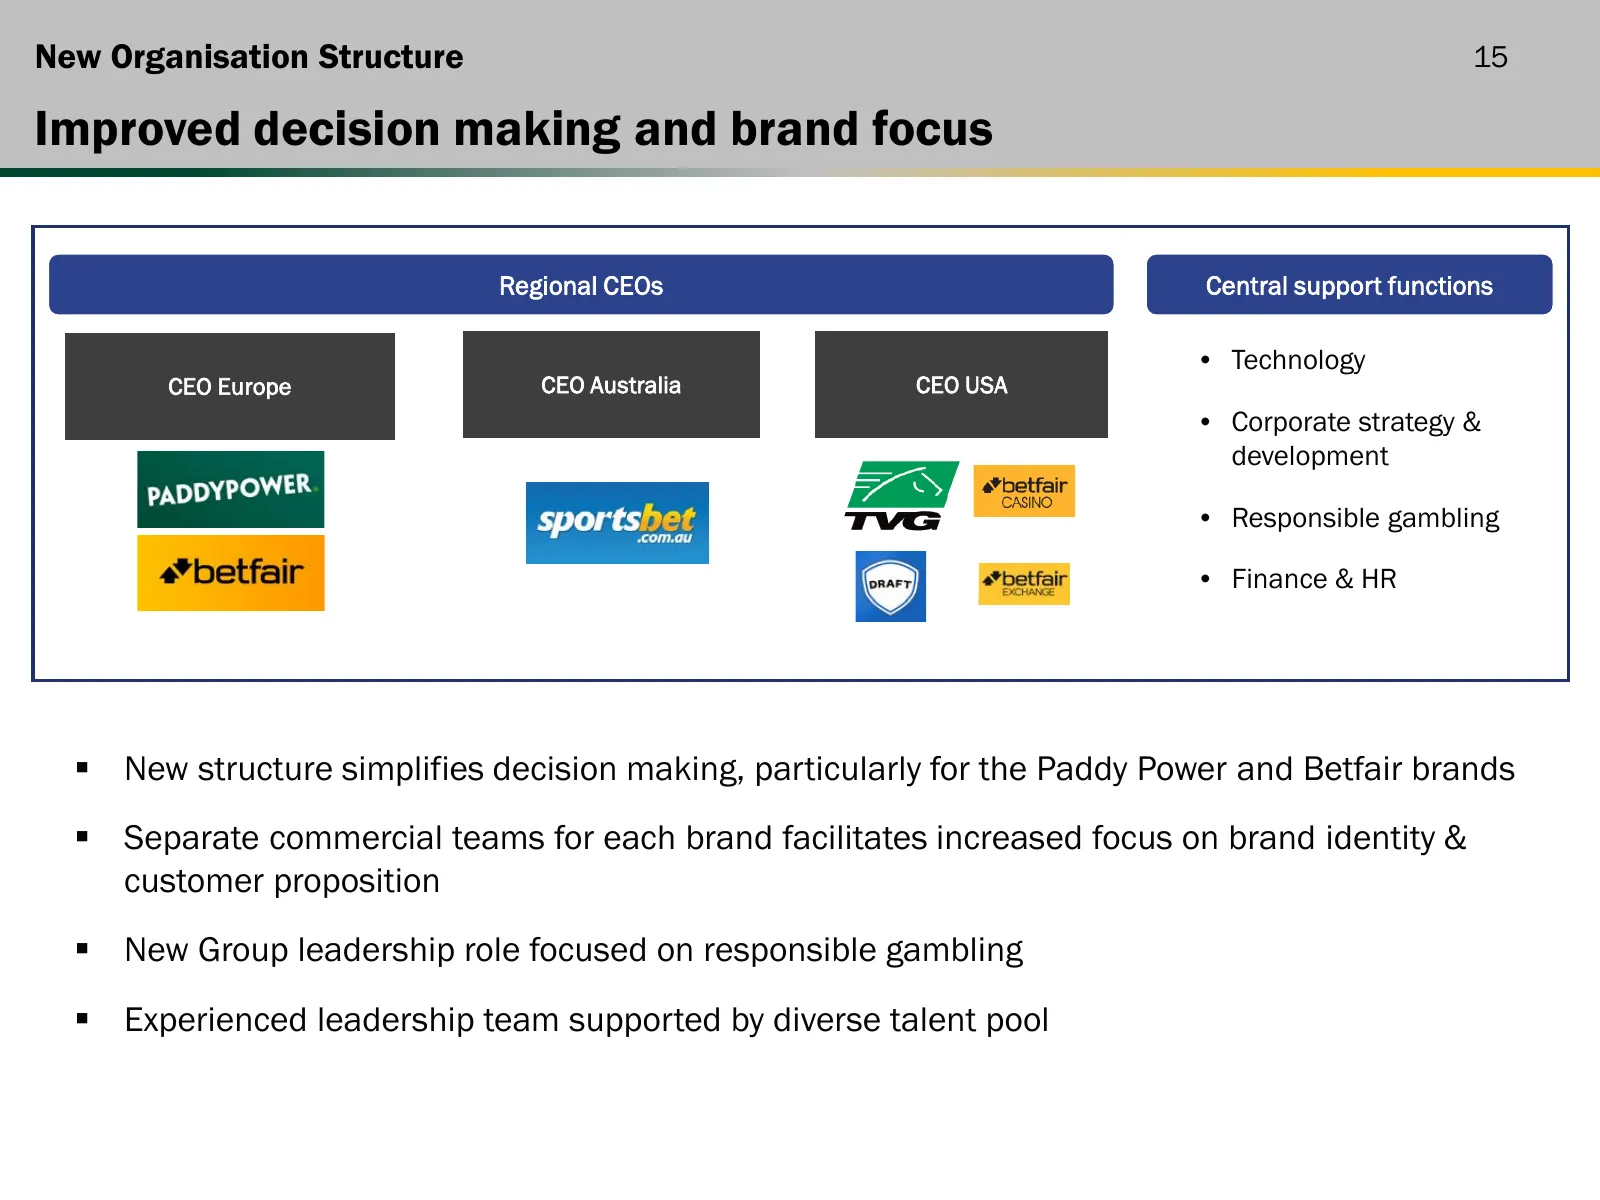
New Organisation Structure 15 Improved decision making and brand focus Regional CEOs Central support functions • Technology CEO Europe CEO Australia CEO USA • Corporate strategy & development • Responsible gambling • Finance & HR New structure simplifies decision making, particularly for the Paddy
Slide 16: Substantial resources now deployed on customer-facing product
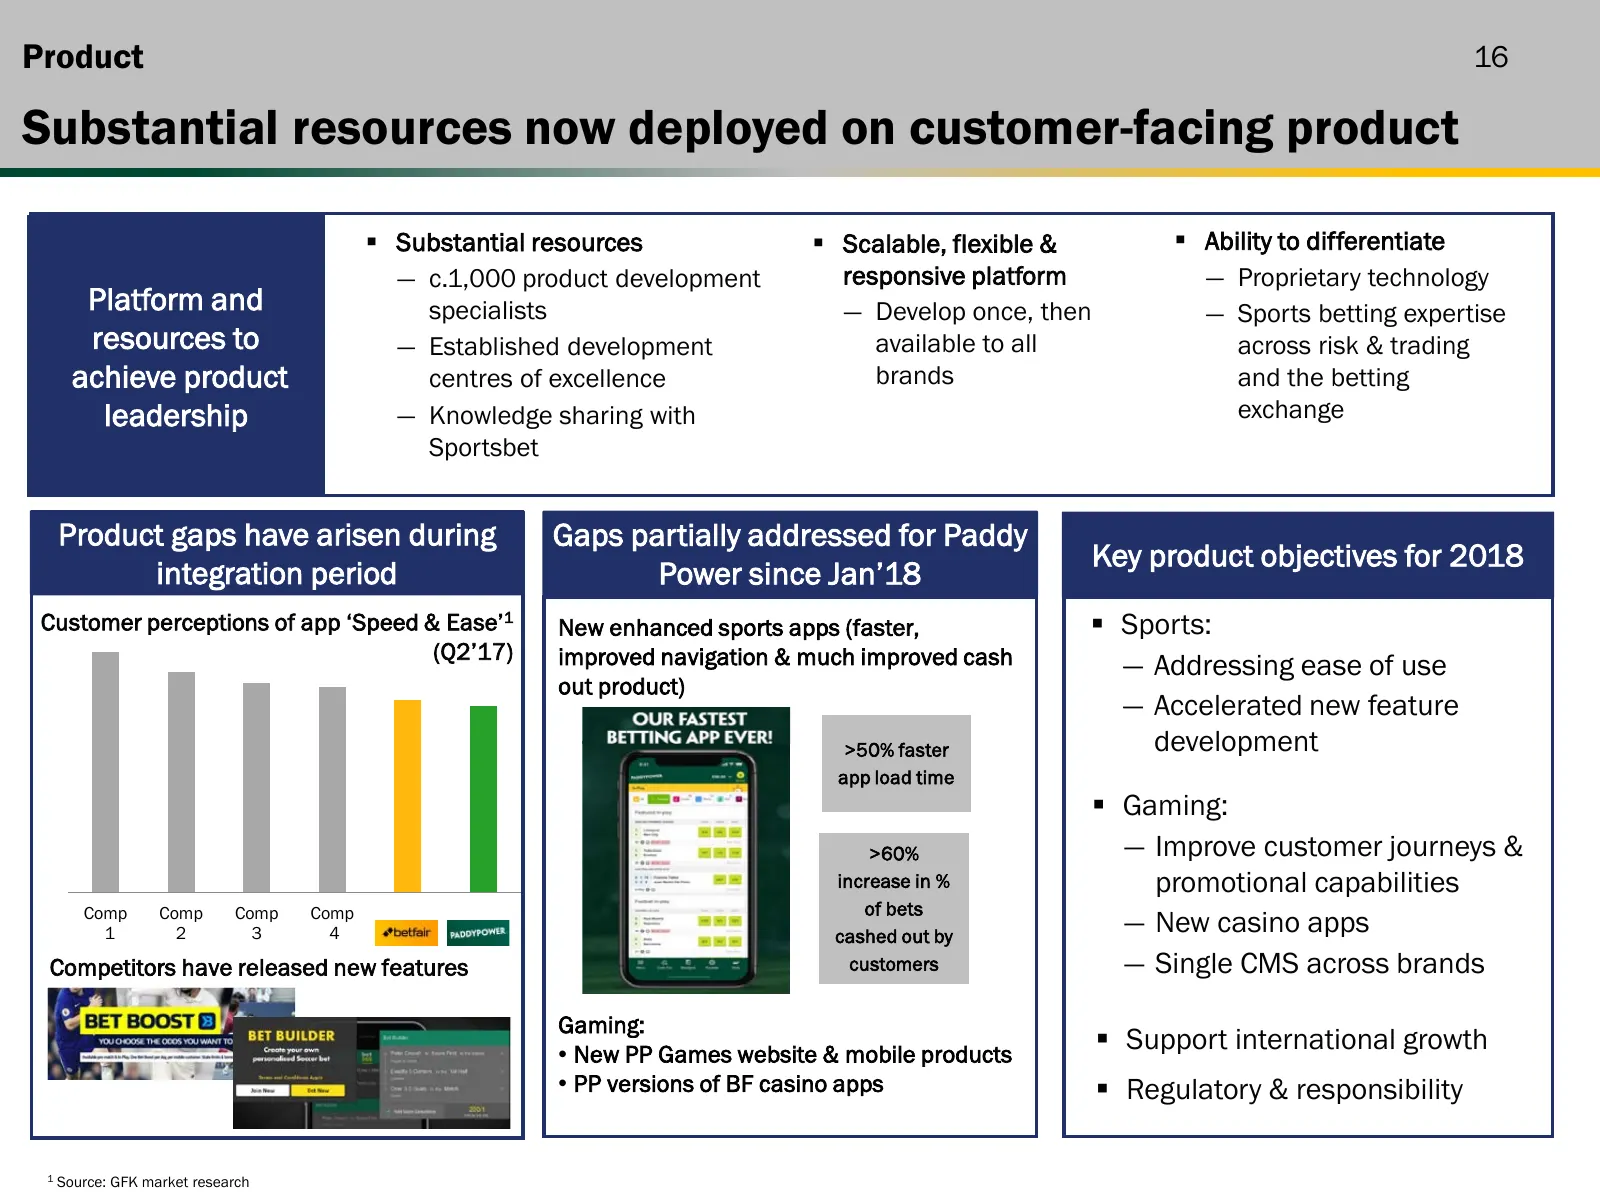
Product 16 Substantial resources now deployed on customer-facing product Substantial resources Scalable, flexible & Ability to differentiate ― c.1,000 product development responsive platform ― Proprietary technology Platform and specialists ― Develop once, then ― Sports betting expertise resou
Slide 17: Increasing spend to drive greater share of customer wallets
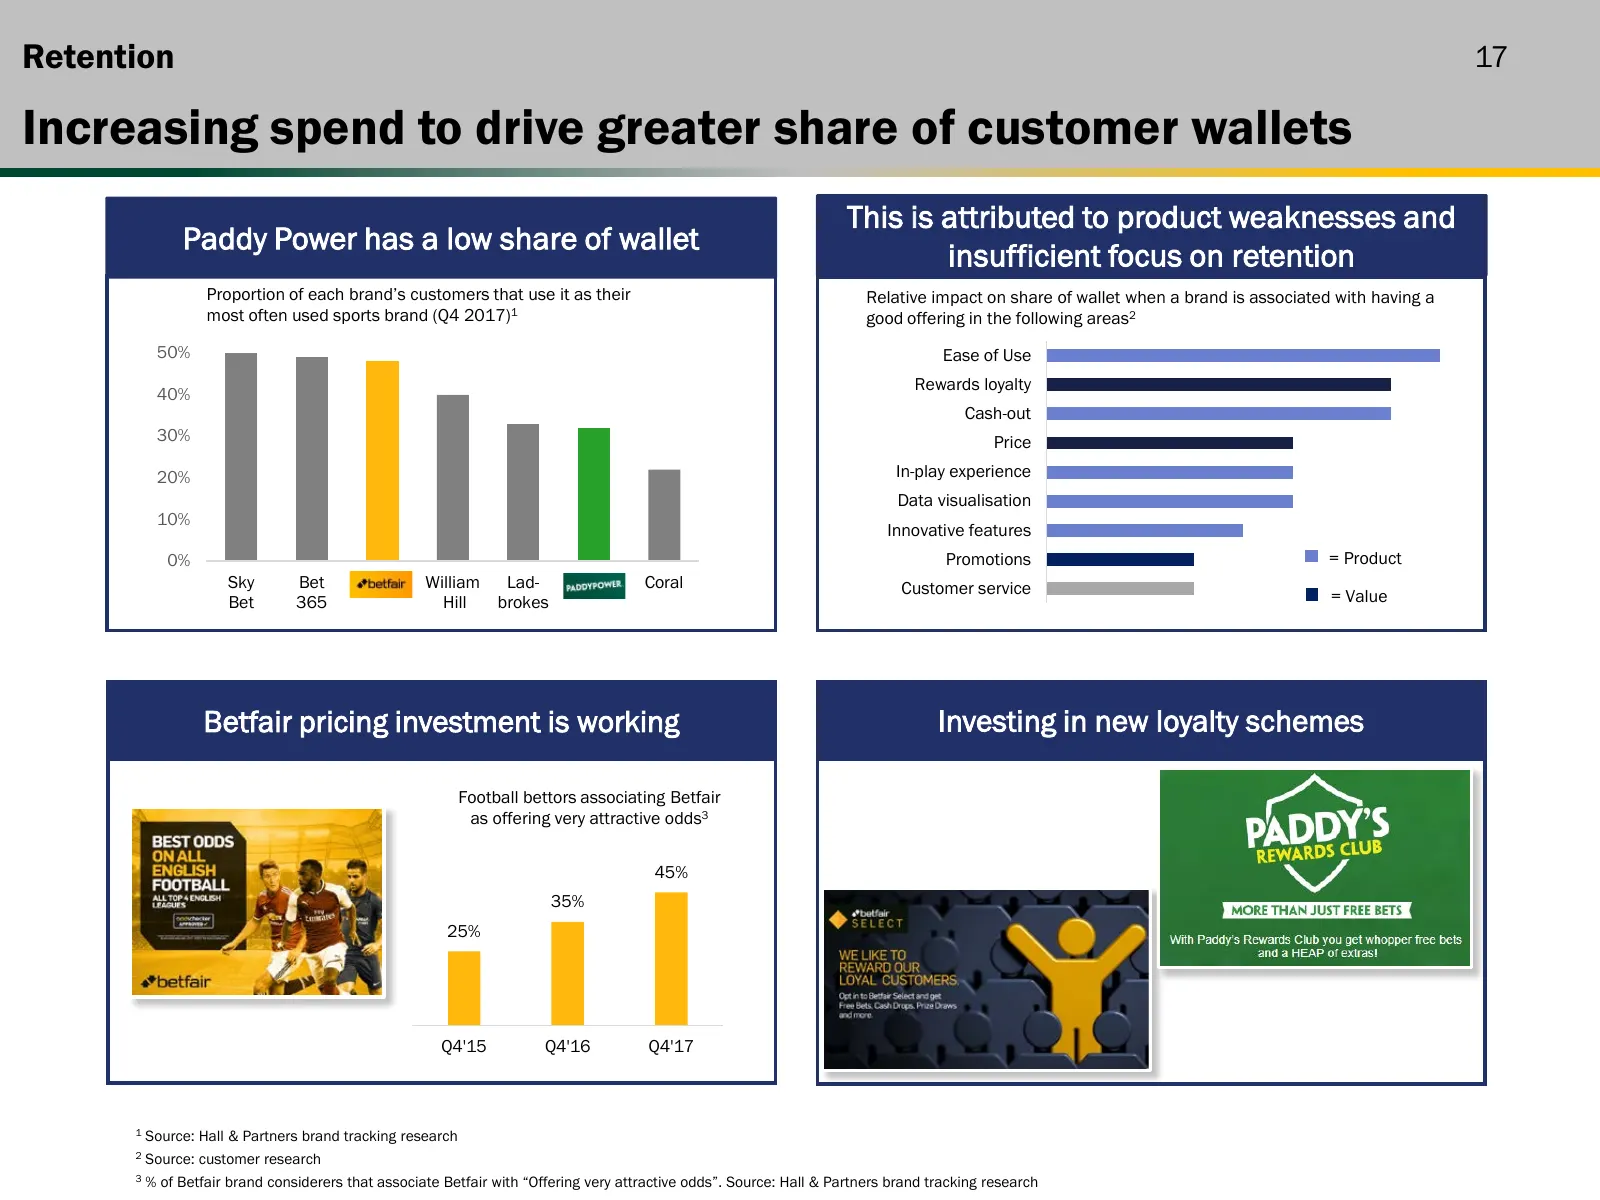
Retention 17 Increasing spend to drive greater share of customer wallets This is attributed to product weaknesses and Paddy Power has a low share of wallet insufficient focus on retention Proportion of each brand’s customers that use it as their Relative impact on share of wallet when a brand is ass
Slide 18: Paddy Power targeting mass-market; Betfair targeting core bettors
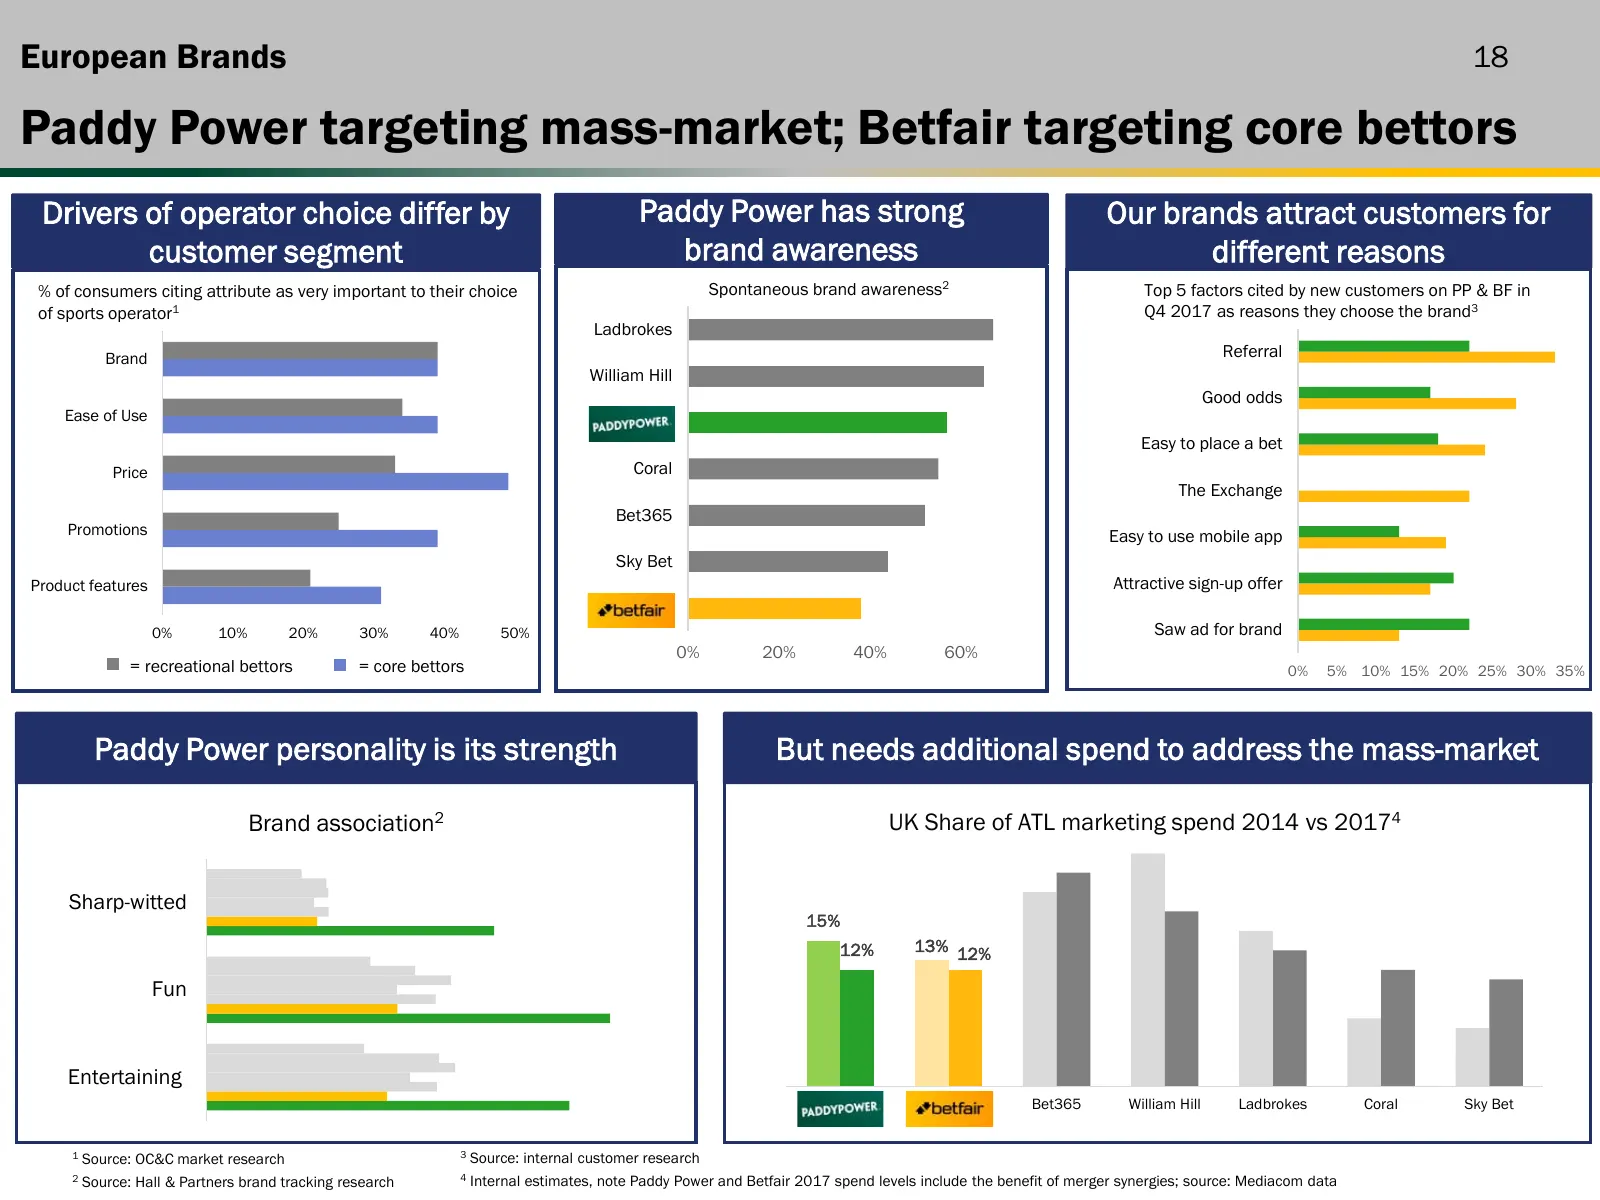
European Brands 18 Paddy Power targeting mass-market; Betfair targeting core bettors Drivers of operator choice differ by Paddy Power has strong Our brands attract customers for customer segment brand awareness different reasons % of consumers citing attribute as very important to their choice Spont
Slide 19: Brand strategy refined, supported with extra c.£20m investment
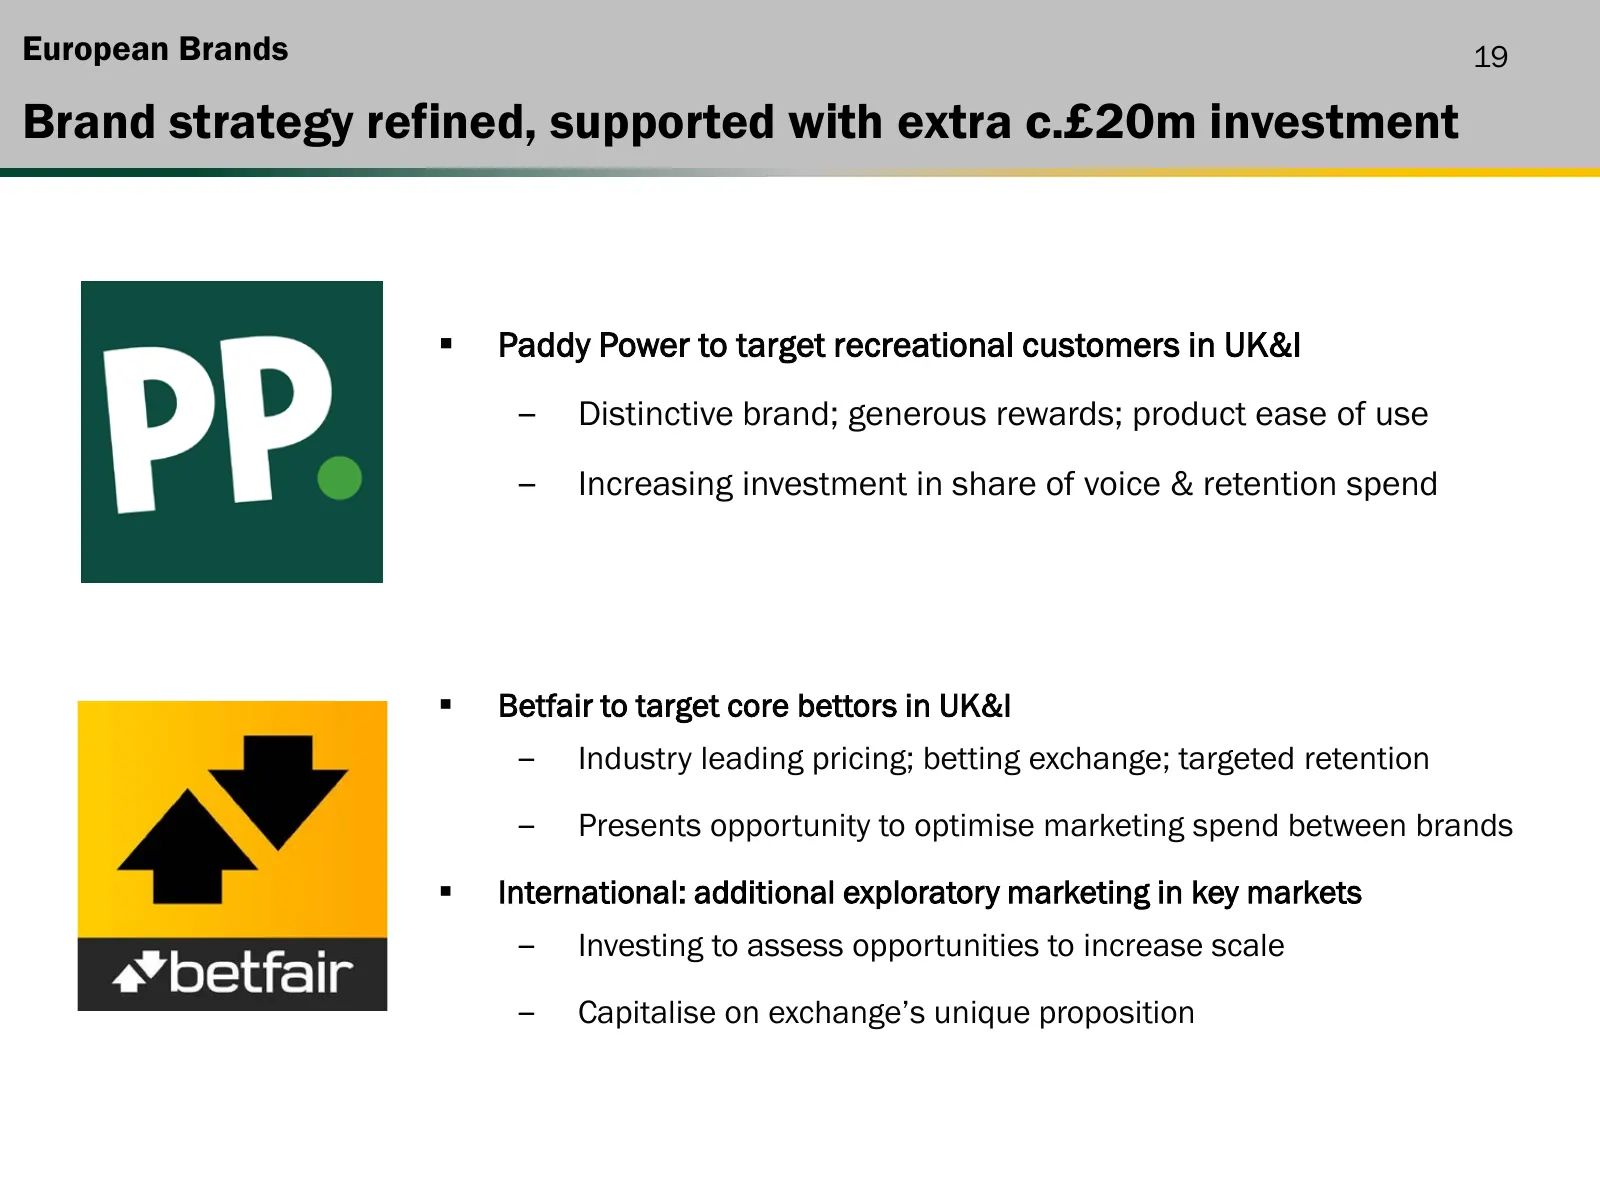
European Brands 19 Brand strategy refined, supported with extra c.£20m investment Paddy Power to target recreational customers in UK&I ‒ Distinctive brand; generous rewards; product ease of use ‒ Increasing investment in share of voice & retention spend Betfair to target core bettors in UK&I ‒ I
Slide 20: Continuing to invest in our leading proposition to take share
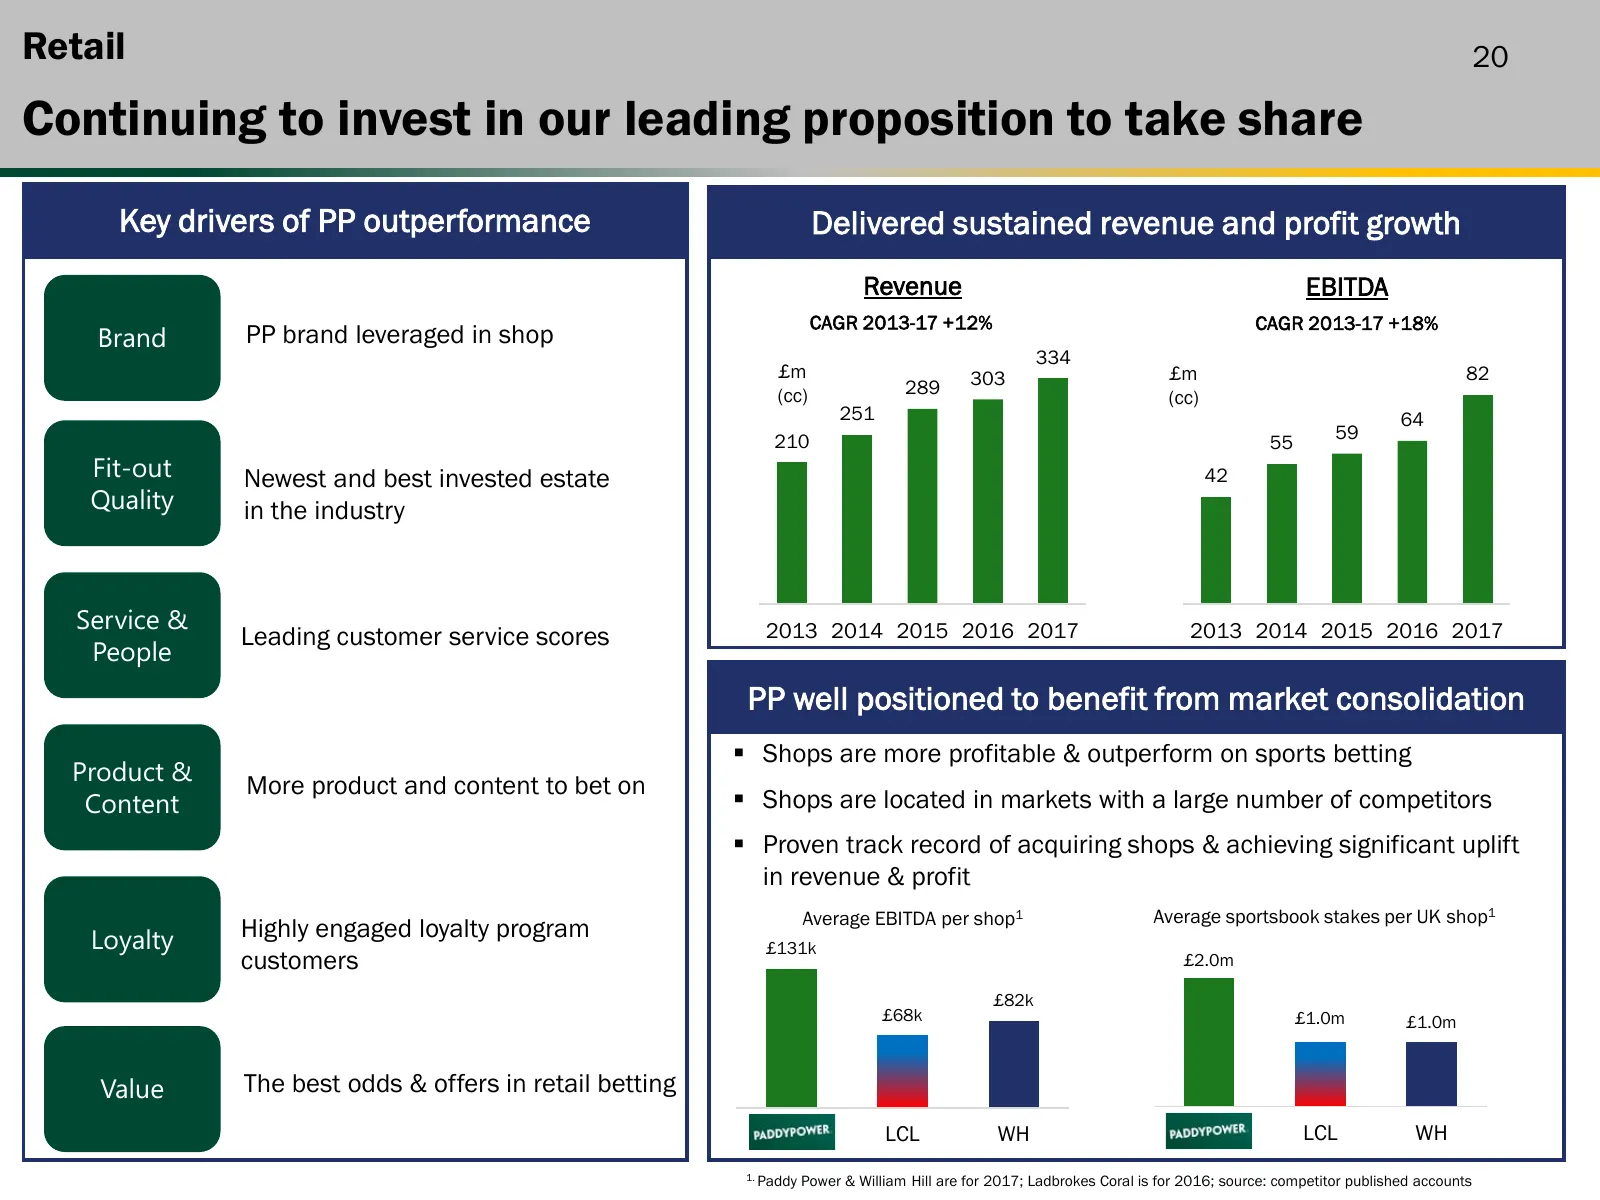
Retail 20 Continuing to invest in our leading proposition to take share Key drivers of PP outperformance Delivered sustained revenue and profit growth Revenue EBITDA CAGR 2013-17 +12% CAGR 2013-17 +18% Brand PP brand leveraged in shop 334 £m 303 £m 82 (cc) 289 (cc) 251 64 210 59 55 Fit-out Newest an
Slide 21: Strong position ahead of increased taxes
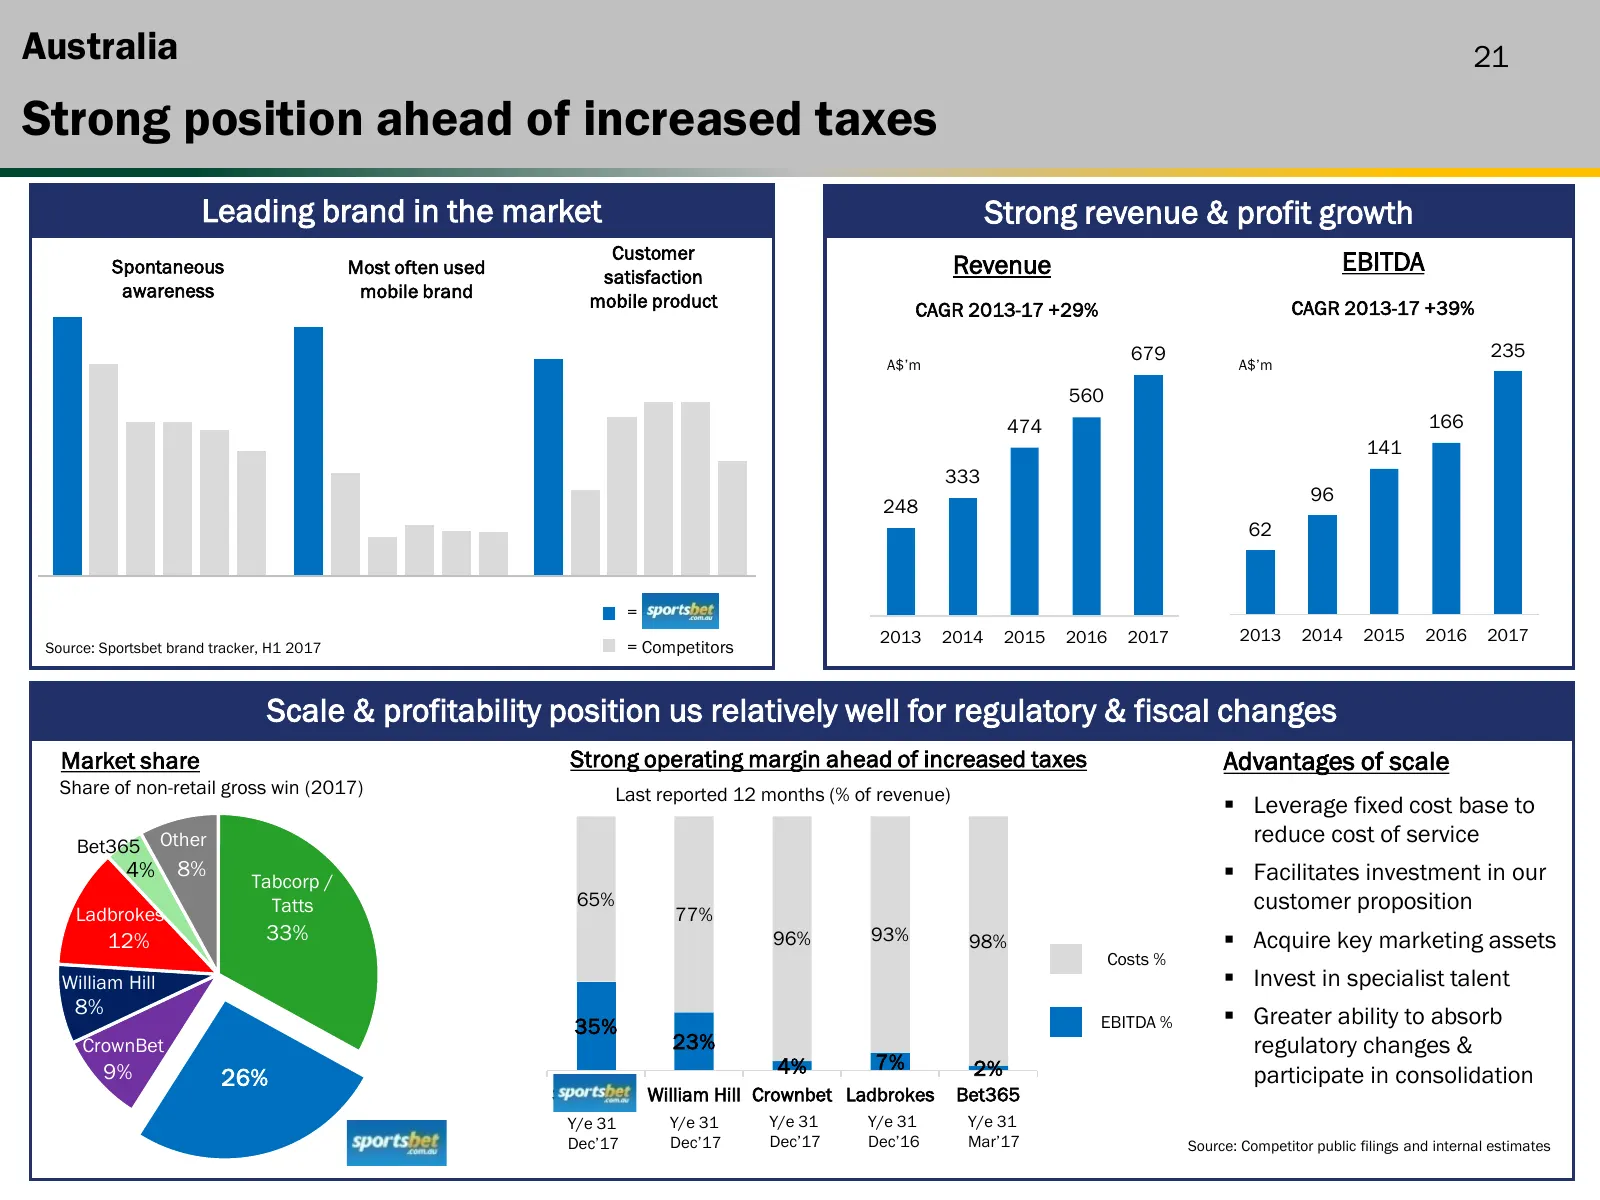
Australia 21 Strong position ahead of increased taxes Leading brand in the market Strong revenue & profit growth Customer Spontaneous Most often used satisfaction Revenue EBITDA awareness mobile brand mobile product CAGR 2013-17 +29% CAGR 2013-17 +39% 679 235 A$’m A$’m 560 474 166 141 333 96 248 62
Slide 22: Continued investment in leading proposition
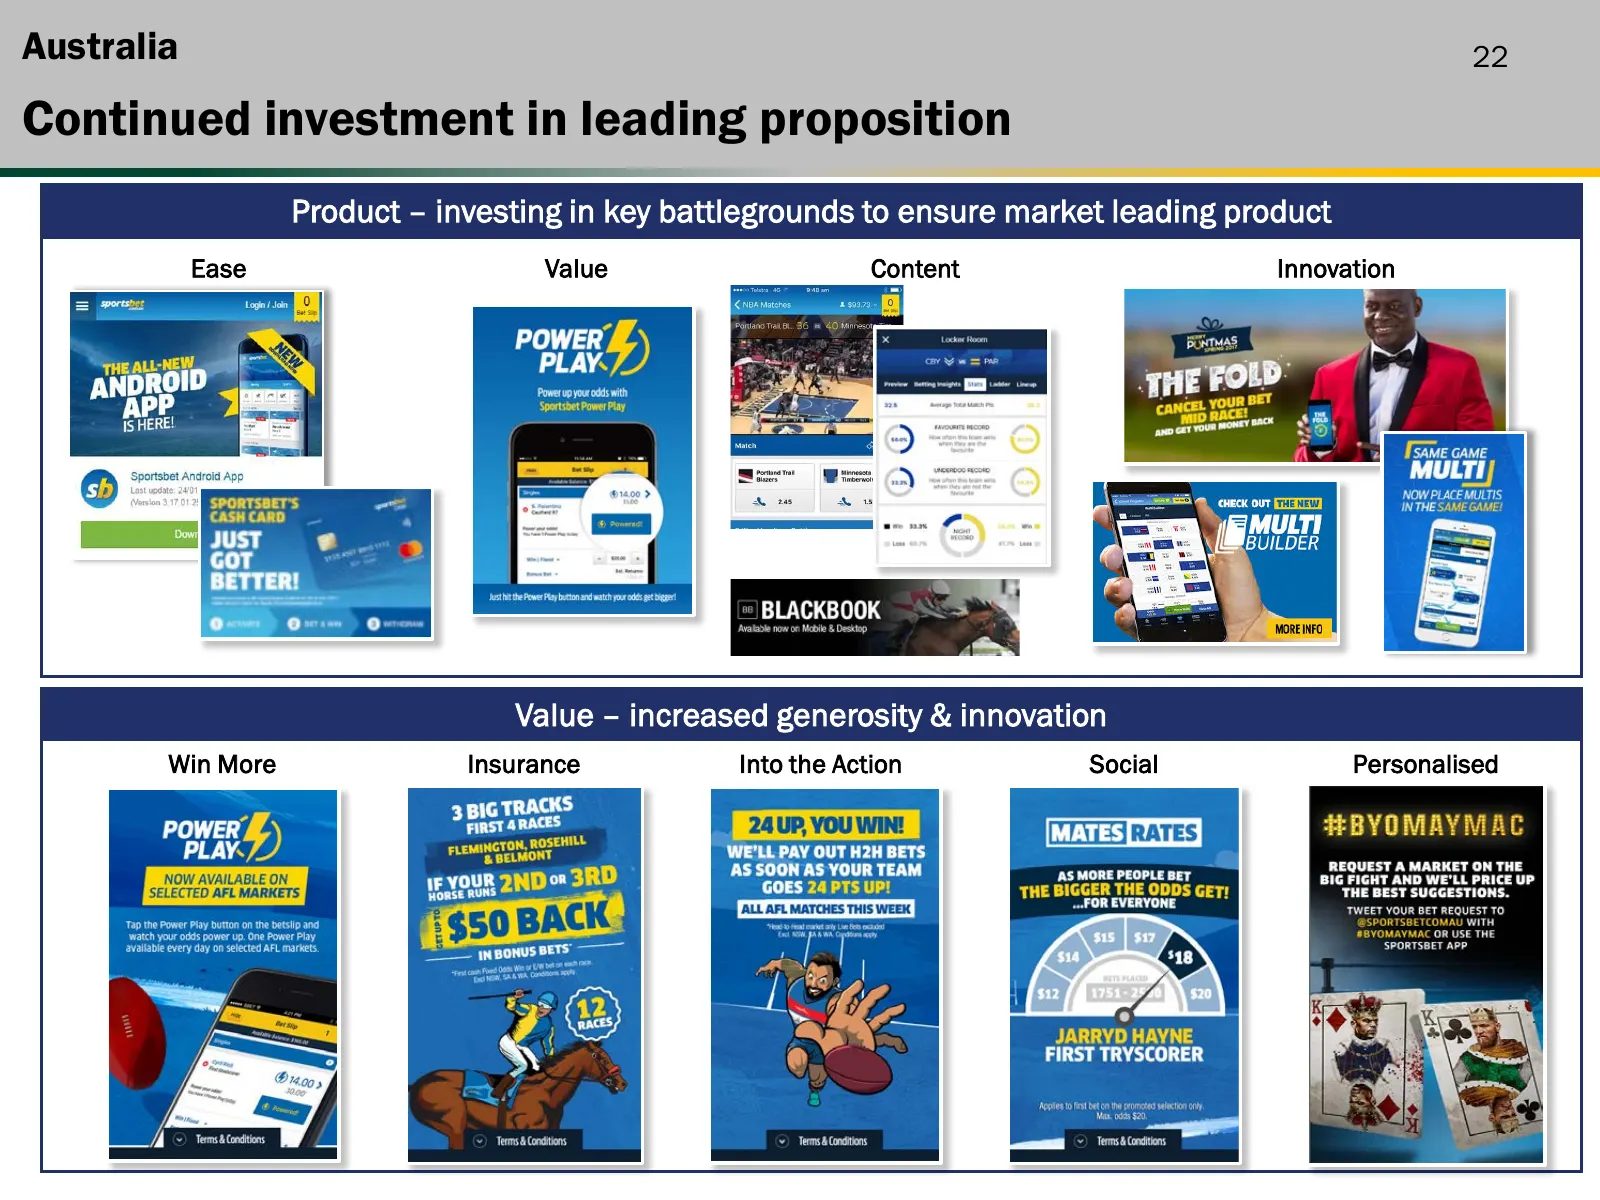
Australia 22 Continued investment in leading proposition Product – investing in key battlegrounds to ensure market leading product Ease Value Content Innovation Value – increased generosity & innovation Win More Insurance Into the Action Social Personalised
Slide 23: Well positioned for potential regulatory developments
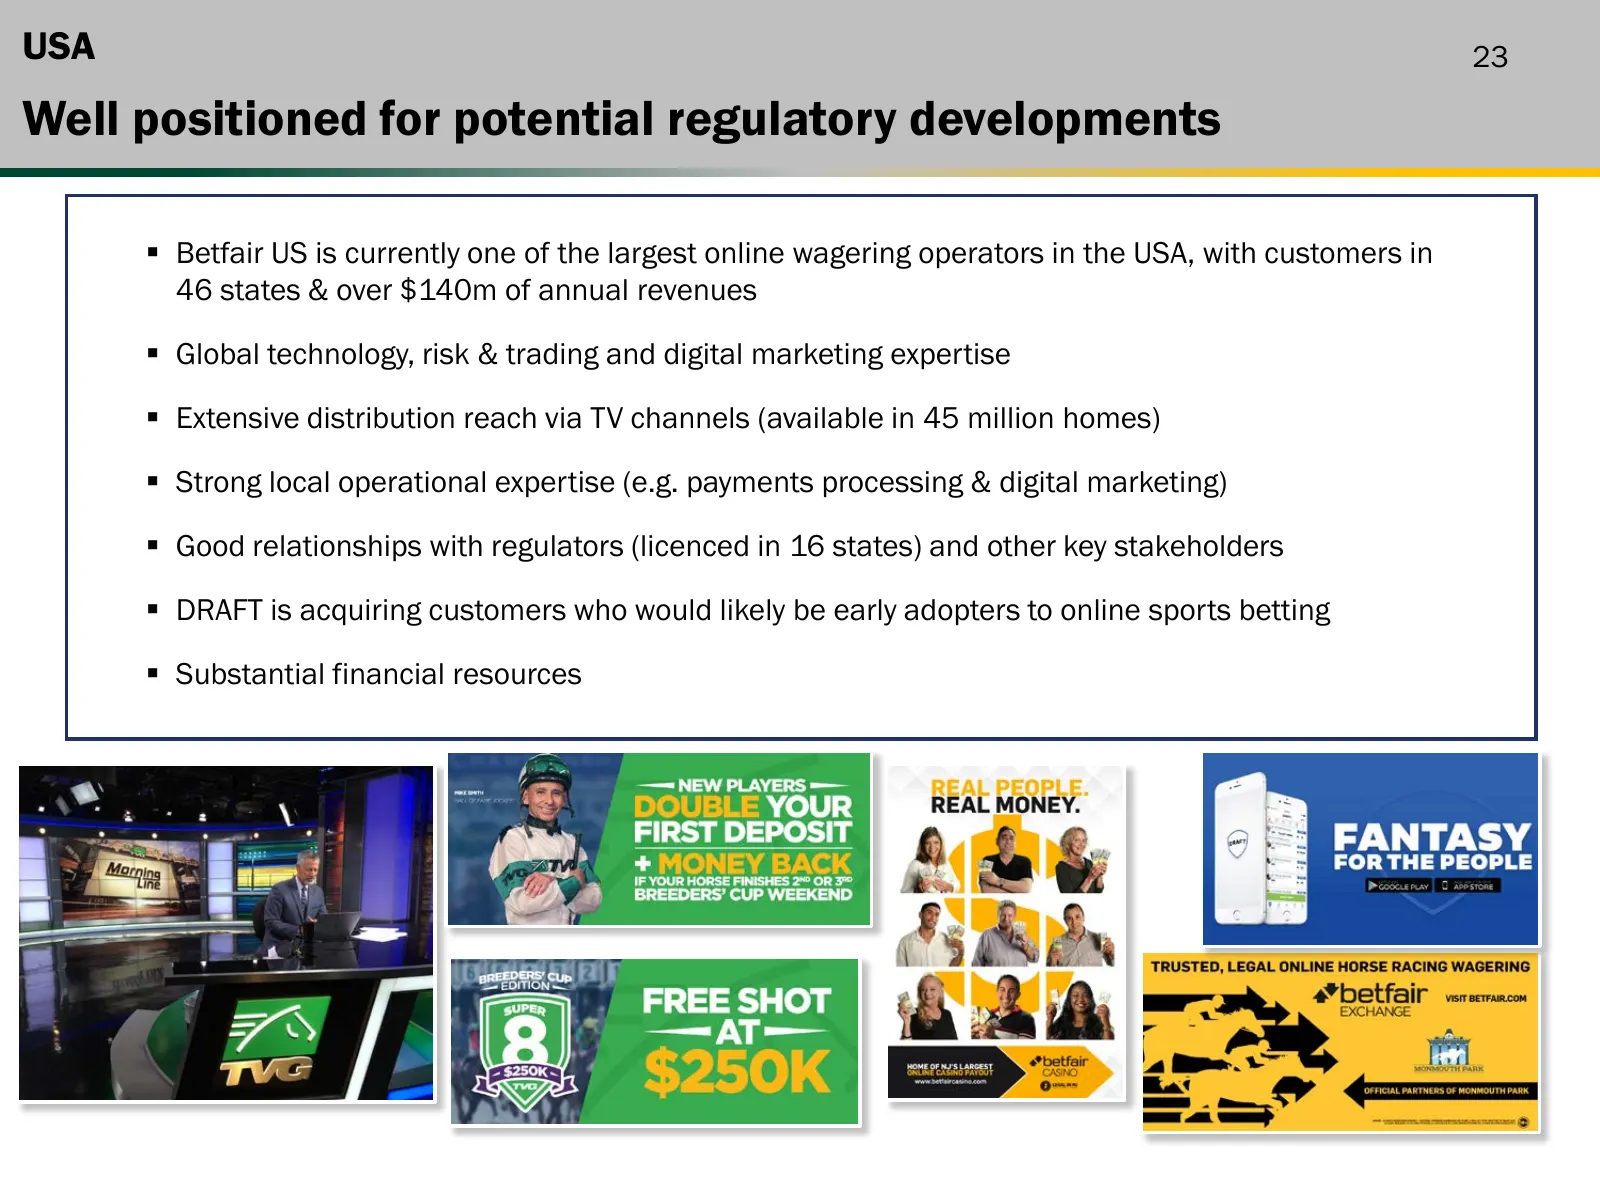
USA 23 Well positioned for potential regulatory developments Betfair US is currently one of the largest online wagering operators in the USA, with customers in 46 states & over $140m of annual revenues Global technology, risk & trading and digital marketing expertise Extensive distribution rea
Slide 24: Improving balance sheet efficiency, maintaining flexibility
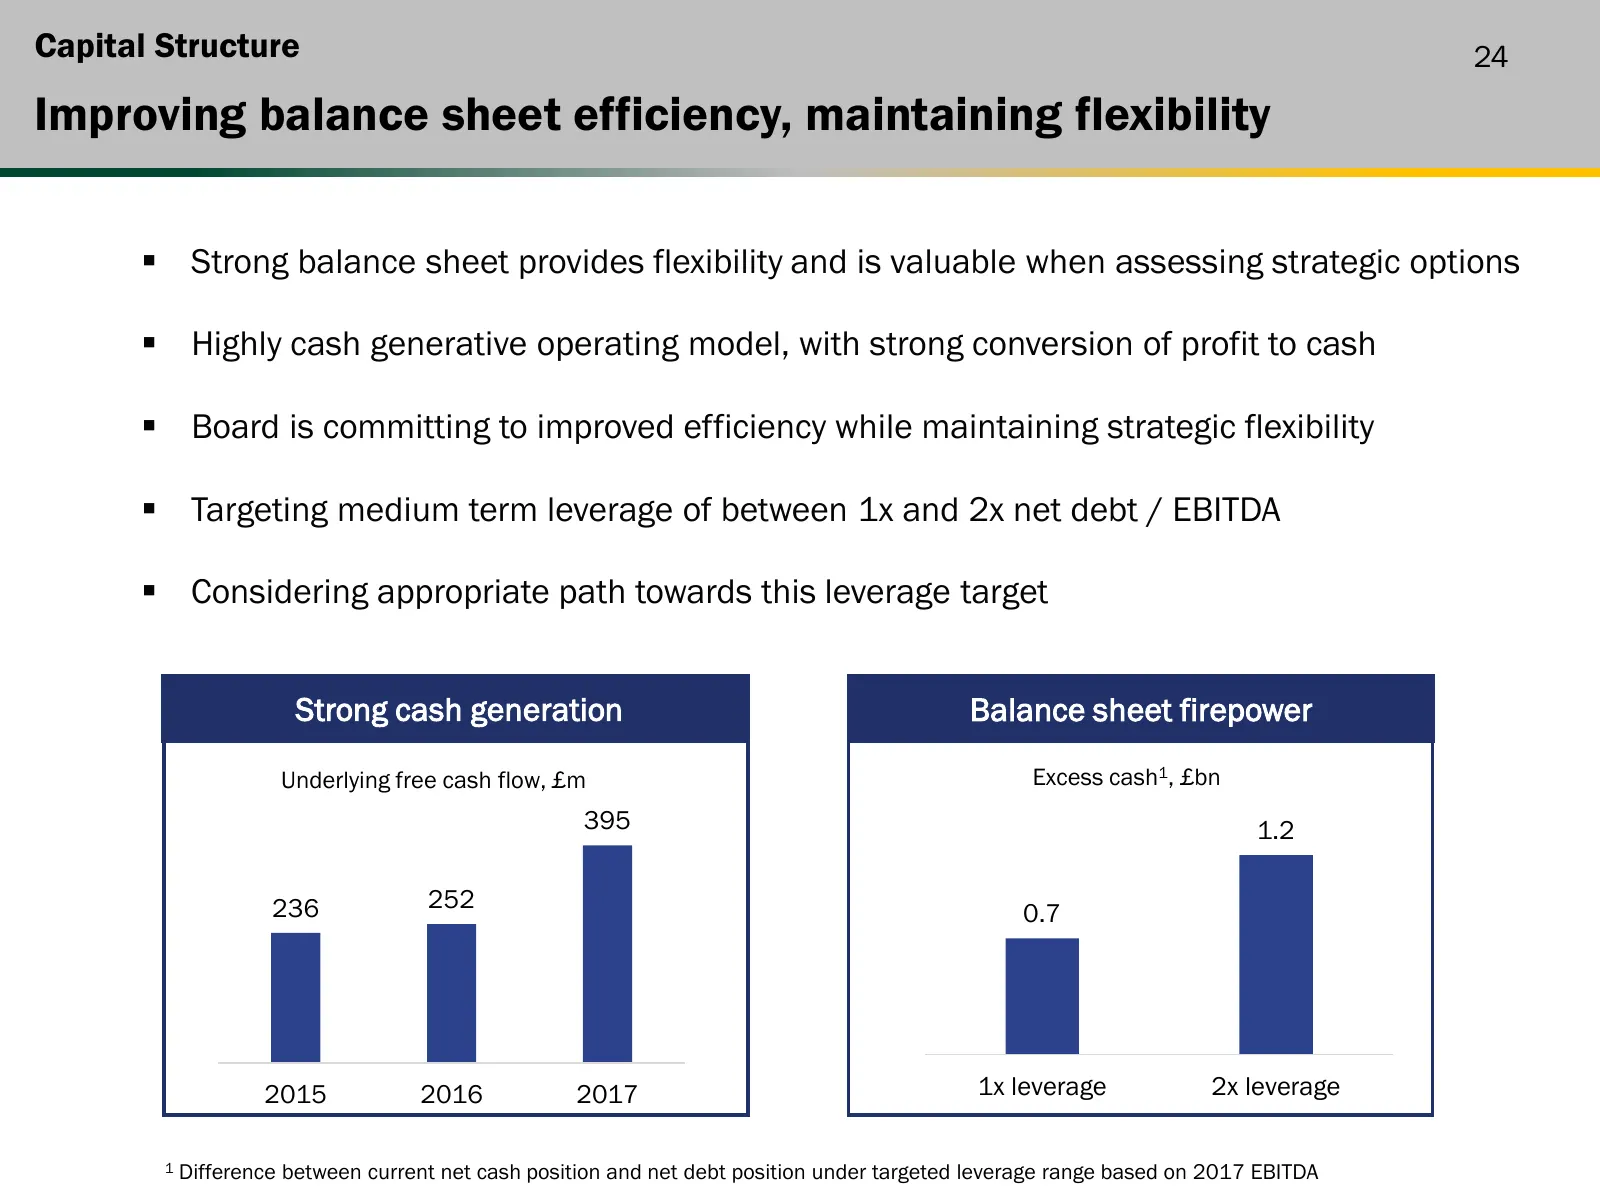
Capital Structure 24 Improving balance sheet efficiency, maintaining flexibility Strong balance sheet provides flexibility and is valuable when assessing strategic options Highly cash generative operating model, with strong conversion of profit to cash Board is committing to improved efficienc
Slide 25: Summary
25 Summary Focused on re-establishing product leadership Increasing marketing and retention investment to support growth Simplified structure helping decision making and focus Short term regulatory headwinds provide opportunities for share gains Strong cash flow and balance sheet provides

Slide 26: Q&A
Q&A

Slide 27: Appendix
Appendix
Slide 28: Divisional overview
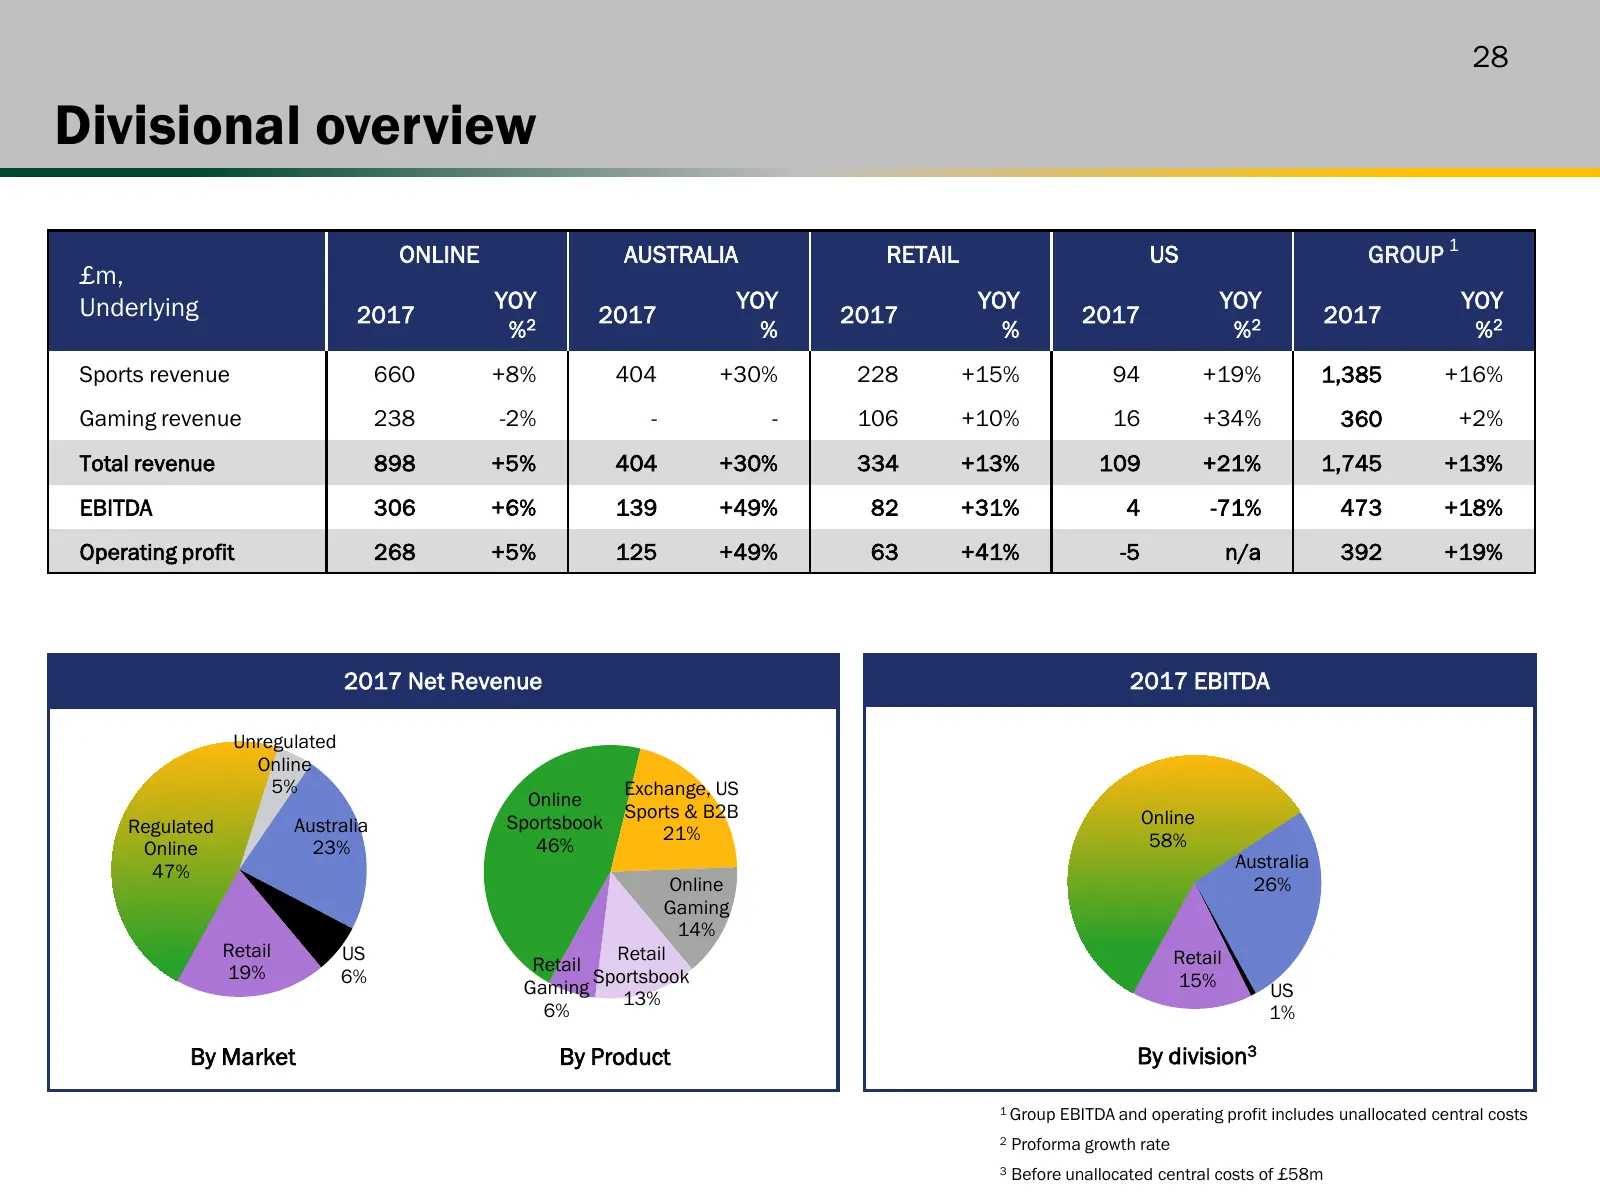
28 Divisional overview ONLINE AUSTRALIA RETAIL US GROUP 1 £m, Underlying YOY YOY YOY YOY YOY 2017 2017 2017 2017 2017 %2 % % %2 %2 Sports revenue 660 +8% 404 +30% 228 +15% 94 +19% 1,385 +16% Gaming revenue 238 -2% - - 106 +10% 16 +34% 360 +2% Total revenue 898 +5% 404 +30% 334 +13% 109 +21% 1,745 +1
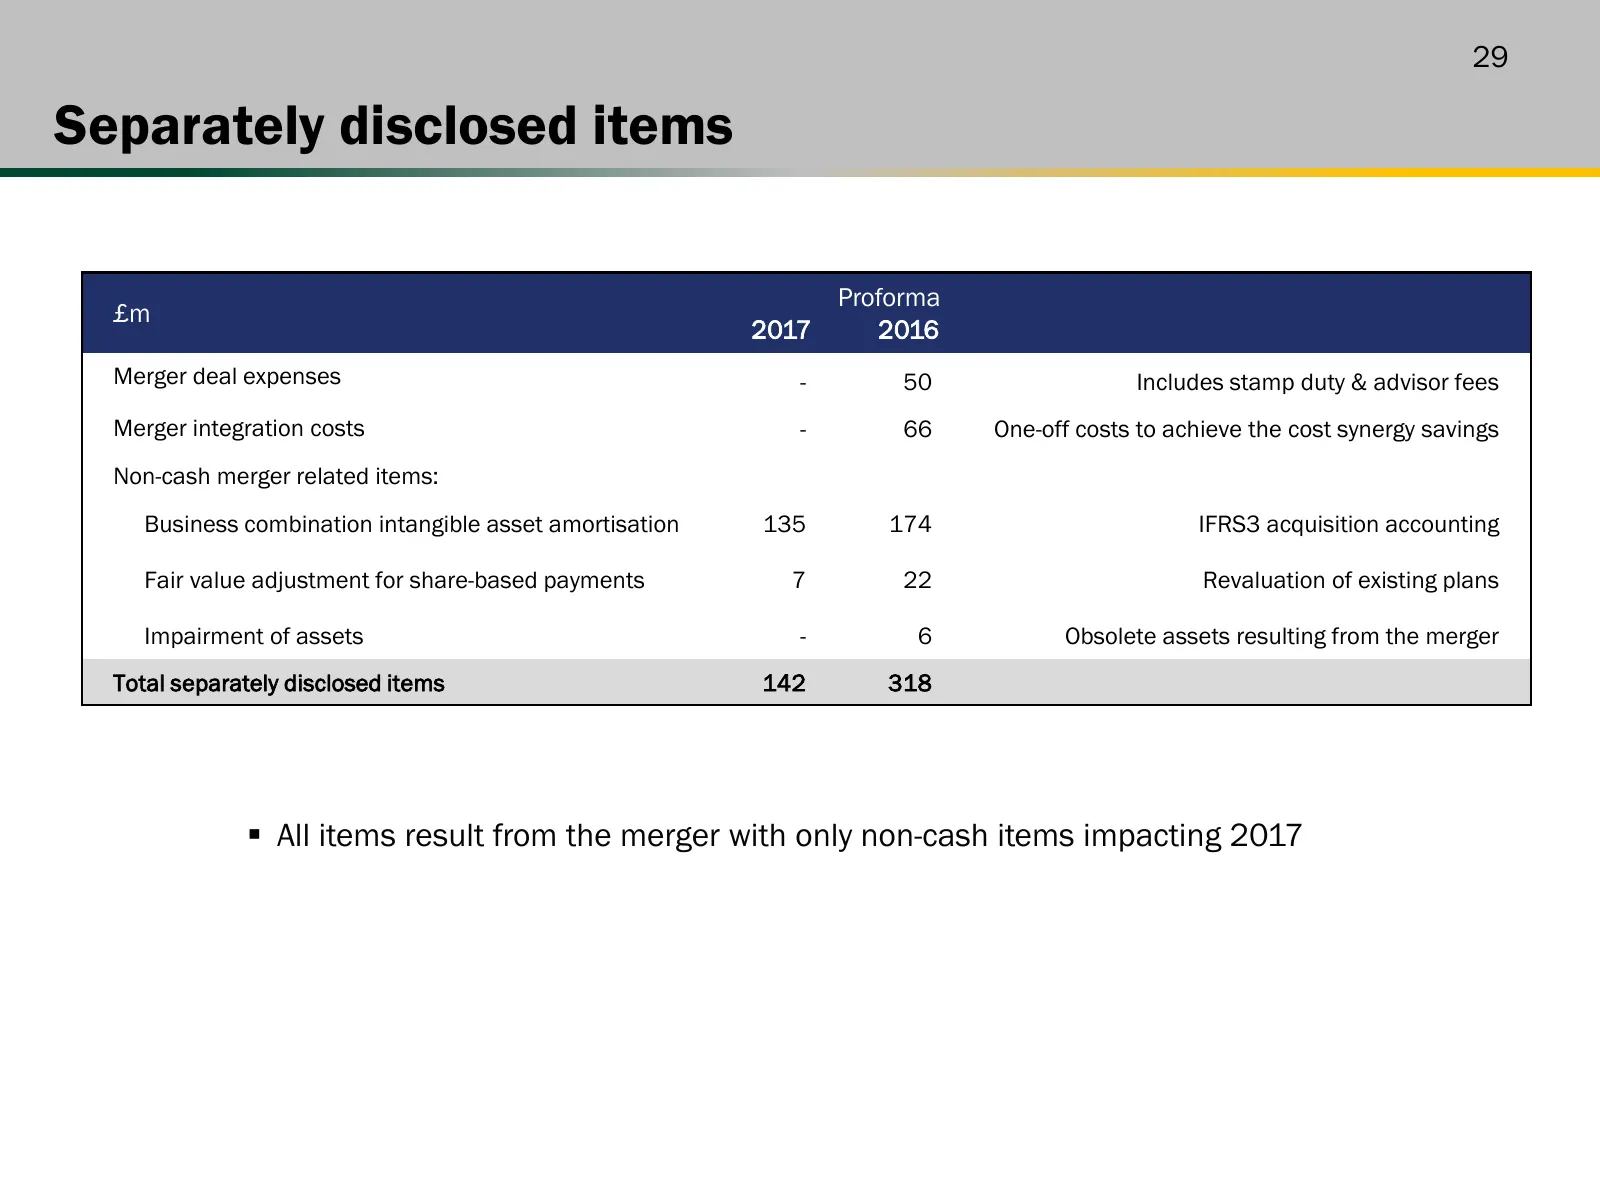
Slide 29: Separately disclosed items
29 Separately disclosed items Proforma £m 2017 2016 Merger deal expenses - 50 Includes stamp duty & advisor fees Merger integration costs - 66 One-off costs to achieve the cost synergy savings Non-cash merger related items: Business combination intangible asset amortisation 135 174 IFRS3 acquisition
Source: Internet Archive copy of flutter.com
More decks from Flutter Entertainment plc
 Q3 2026 Earnings Presentation15 slides · Nov 4, 2026
 Q2 2026 Earnings Presentation14 slides · Aug 5, 2026
 Investor Day (September 2024)152 slides · Sep 25, 2024
 Q2 2024 Earnings Presentation20 slides · Aug 13, 2024
 Q1 2024 Earnings Presentation20 slides · May 14, 2024
 FY2023 Earnings Presentation36 slides · Mar 26, 2024