Ascom Holding AG · SIX:ASCN
Ascom — FY2022 Earnings Presentation
43 slides from Ascom's earnings presentation, Mar 7, 2023
Slide 1: 2022 Financial Results Media Conference
Shape Focus to perform 2022 Financial Results Media Conference March 7, 2023 FYR 2022 Conference | 07 MARCH | ©2023 ASCOM 1

Slide 2: Welcome
Welcome Daniel Lack, Company Secretary FYR 2022 Conference | 07 MARCH | ©2023 ASCOM 2
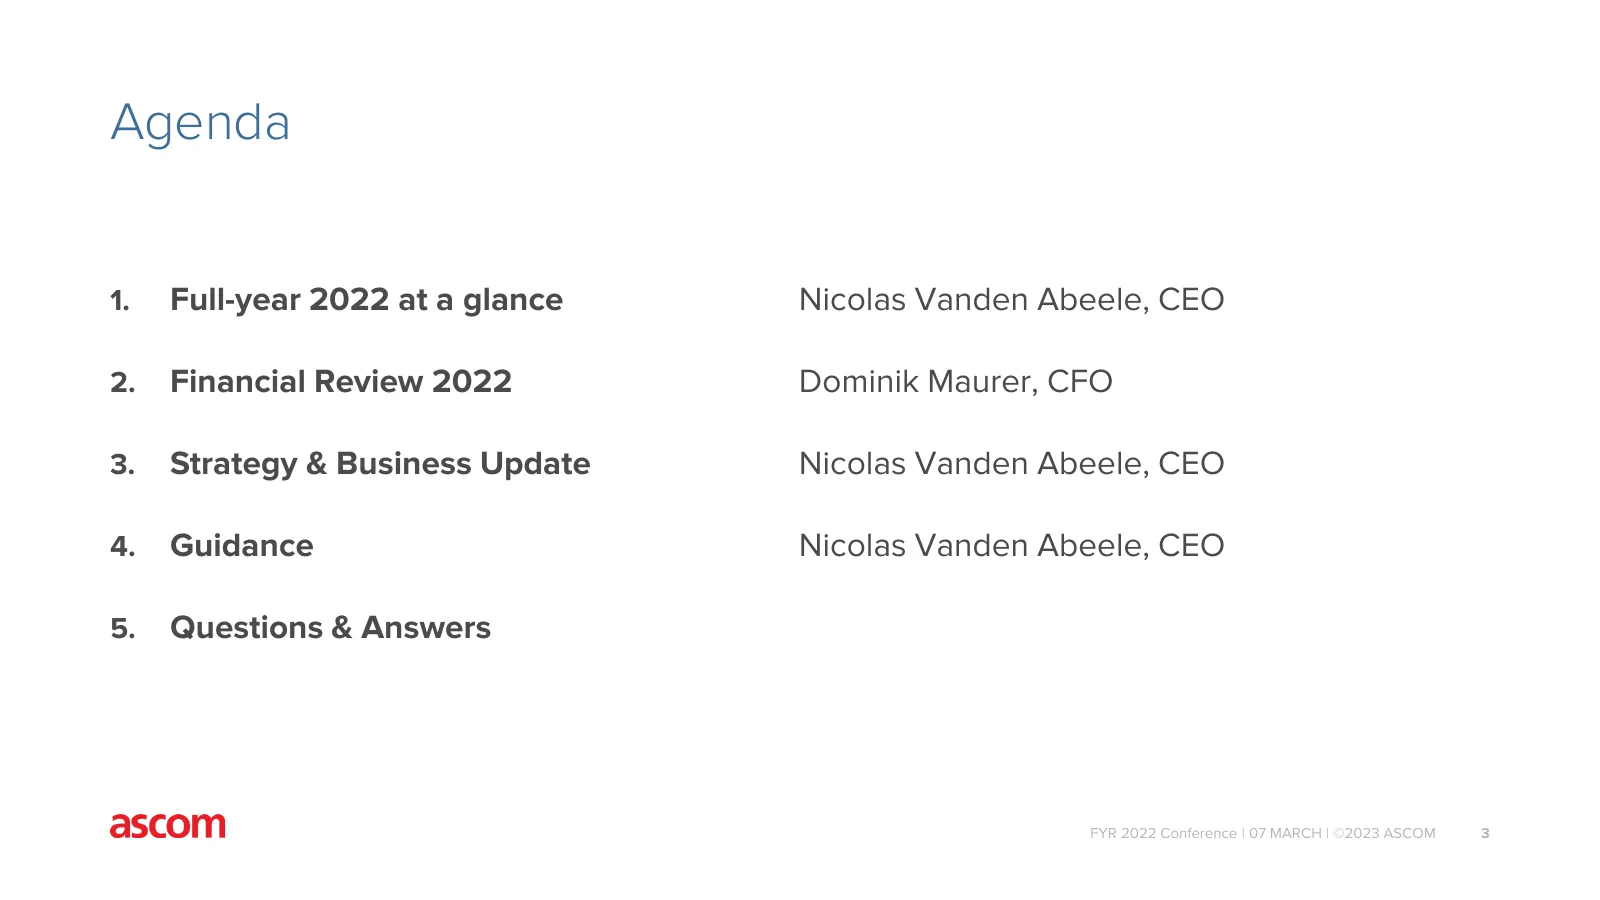
Slide 3: Agenda
Agenda 1. Full-year 2022 at a glance Nicolas Vanden Abeele, CEO 2. Financial Review 2022 Dominik Maurer, CFO 3. Strategy & Business Update Nicolas Vanden Abeele, CEO 4. Guidance Nicolas Vanden Abeele, CEO 5. Questions & Answers FYR 2022 Conference | 07 MARCH | ©2023 ASCOM 3
Slide 4: Full-year 2022 at a glance
Full-year 2022 at a glance Nicolas Vanden Abeele, CEO FYR 2022 Conference | 07 MARCH | ©2023 ASCOM 4
Slide 5: Full-year 2022 at a glance
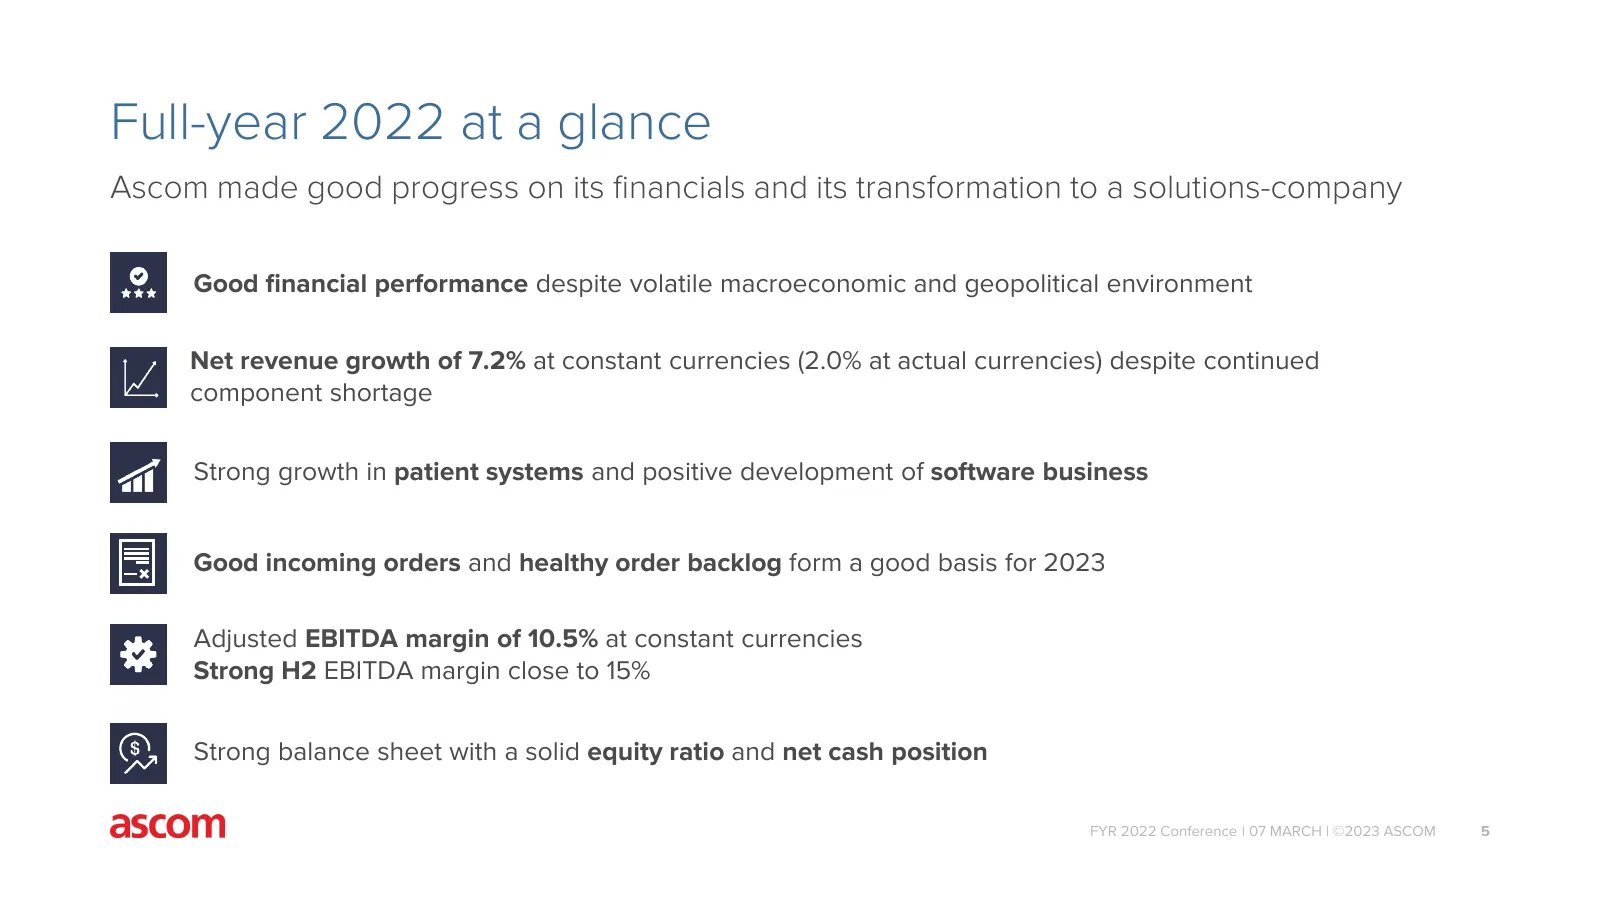
Full-year 2022 at a glance Ascom made good progress on its financials and its transformation to a solutions-company Good financial performance despite volatile macroeconomic and geopolitical environment Net revenue growth of 7.2% at constant currencies (2.0% at actual currencies) despite continued c
Slide 6: 2022 Highlights
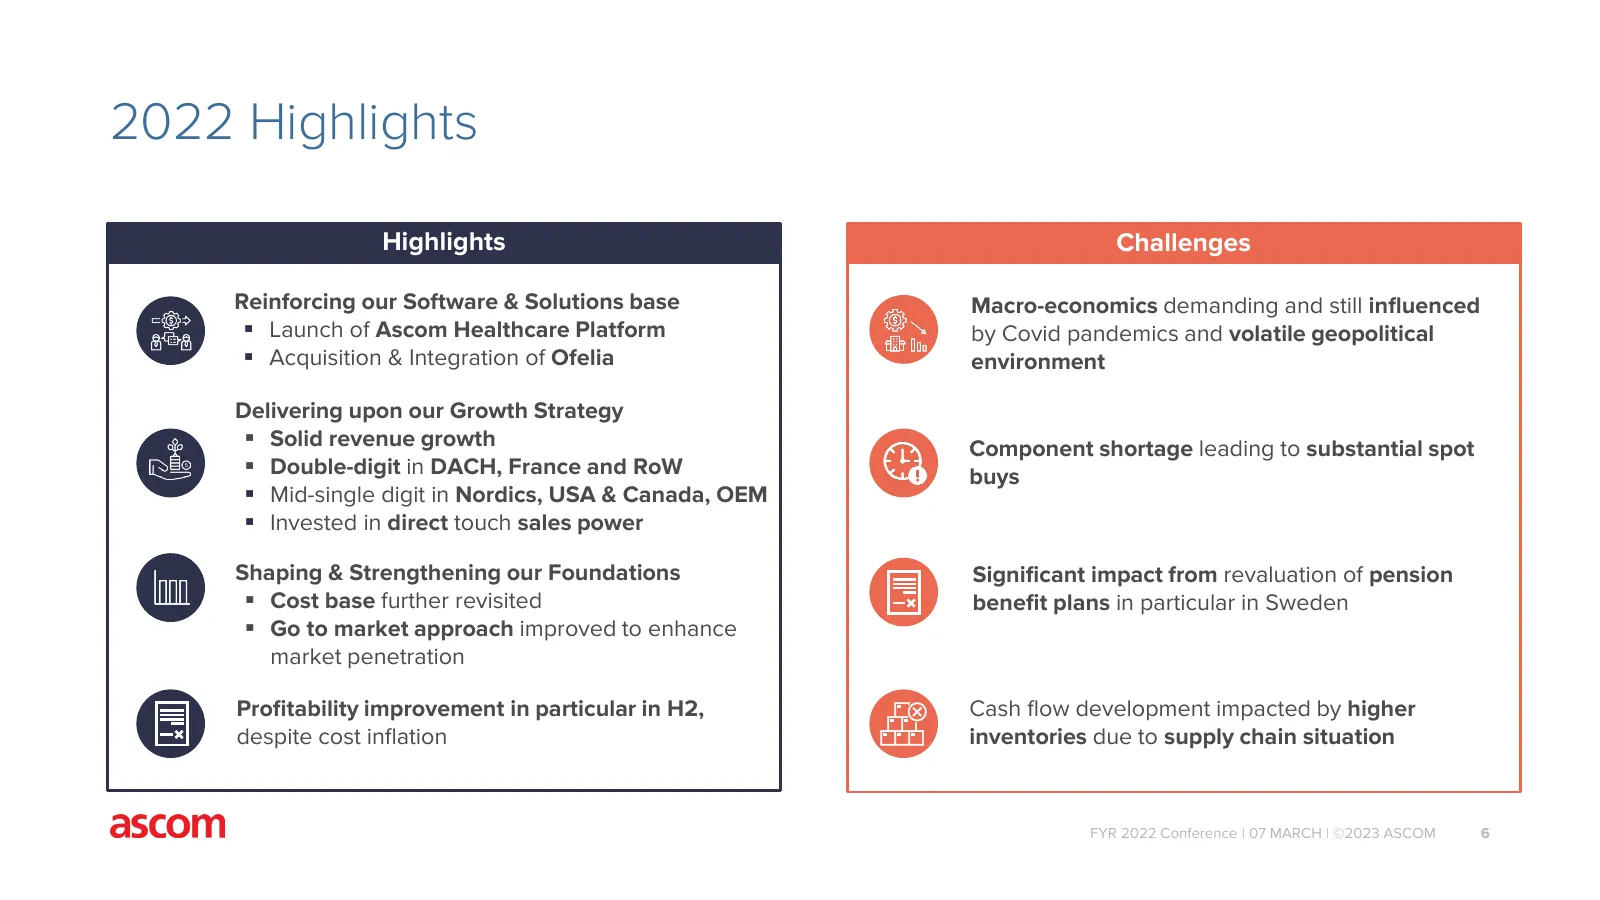
2022 Highlights Highlights Challenges Reinforcing our Software & Solutions base Macro-economics demanding and still influenced Launch of Ascom Healthcare Platform by Covid pandemics and volatile geopolitical Acquisition & Integration of Ofelia environment Delivering upon our Growth Strategy So
Slide 7: 2022 Highlights: Good progress on financials
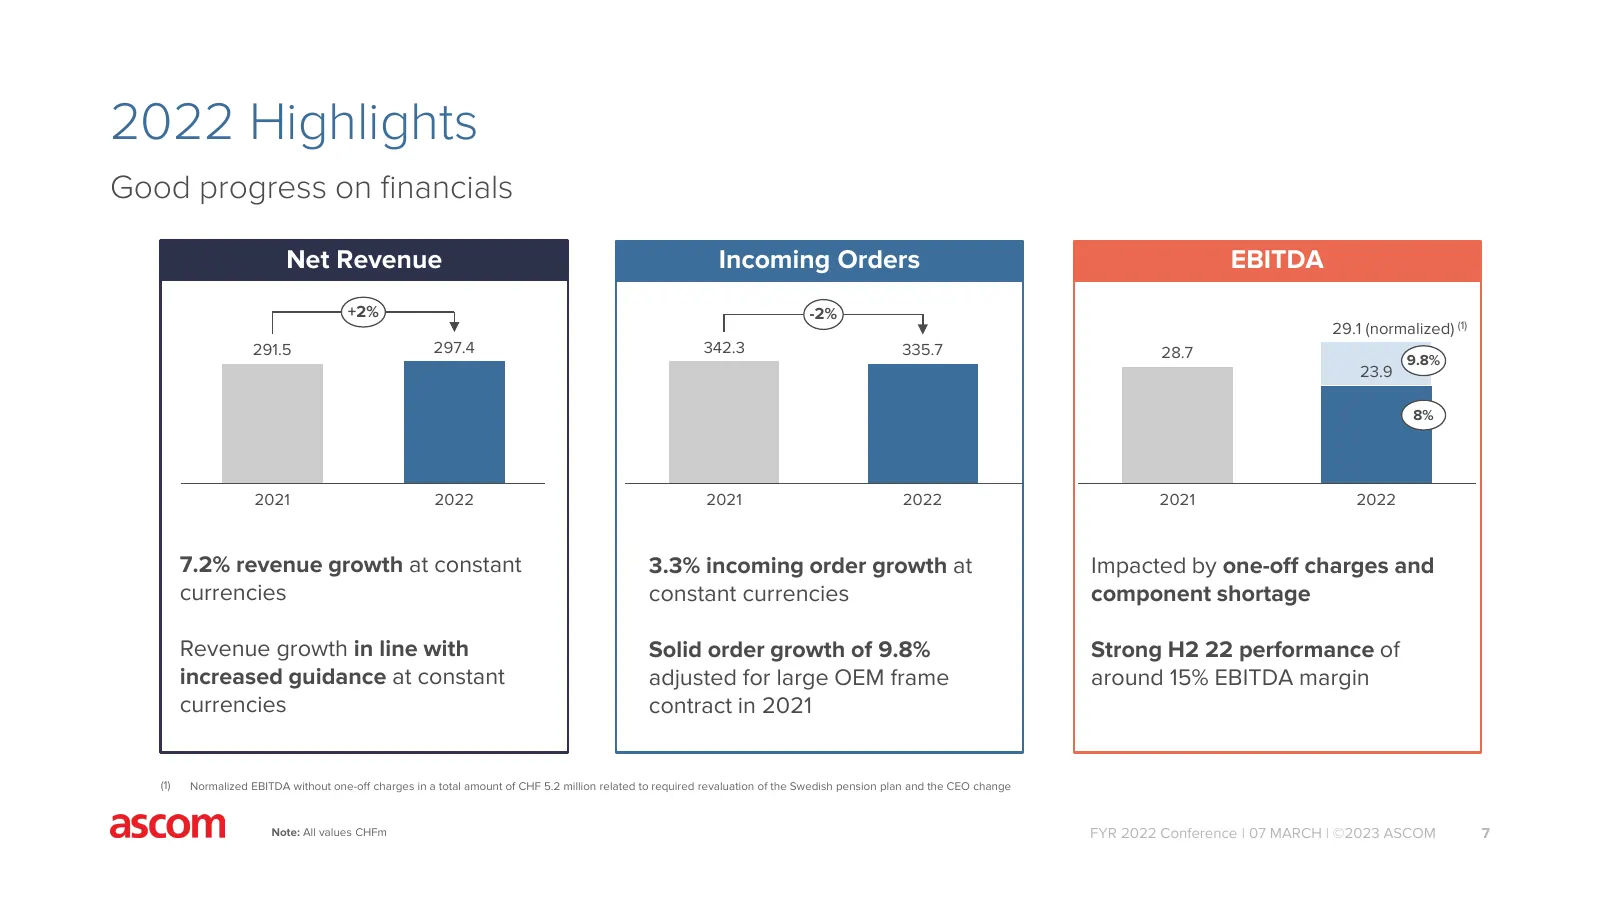
2022 Highlights Good progress on financials Net Revenue Incoming Orders EBITDA +2% -2% 29.1 (normalized) (1) 291.5 297.4 342.3 335.7 28.7 9.8% 23.9 8% 2021 2022 2021 2022 2021 2022 7.2% revenue growth at constant 3.3% incoming order growth at Impacted by one-off charges and currencies constant curre
Slide 8: Elevating our market impact & success in 2022
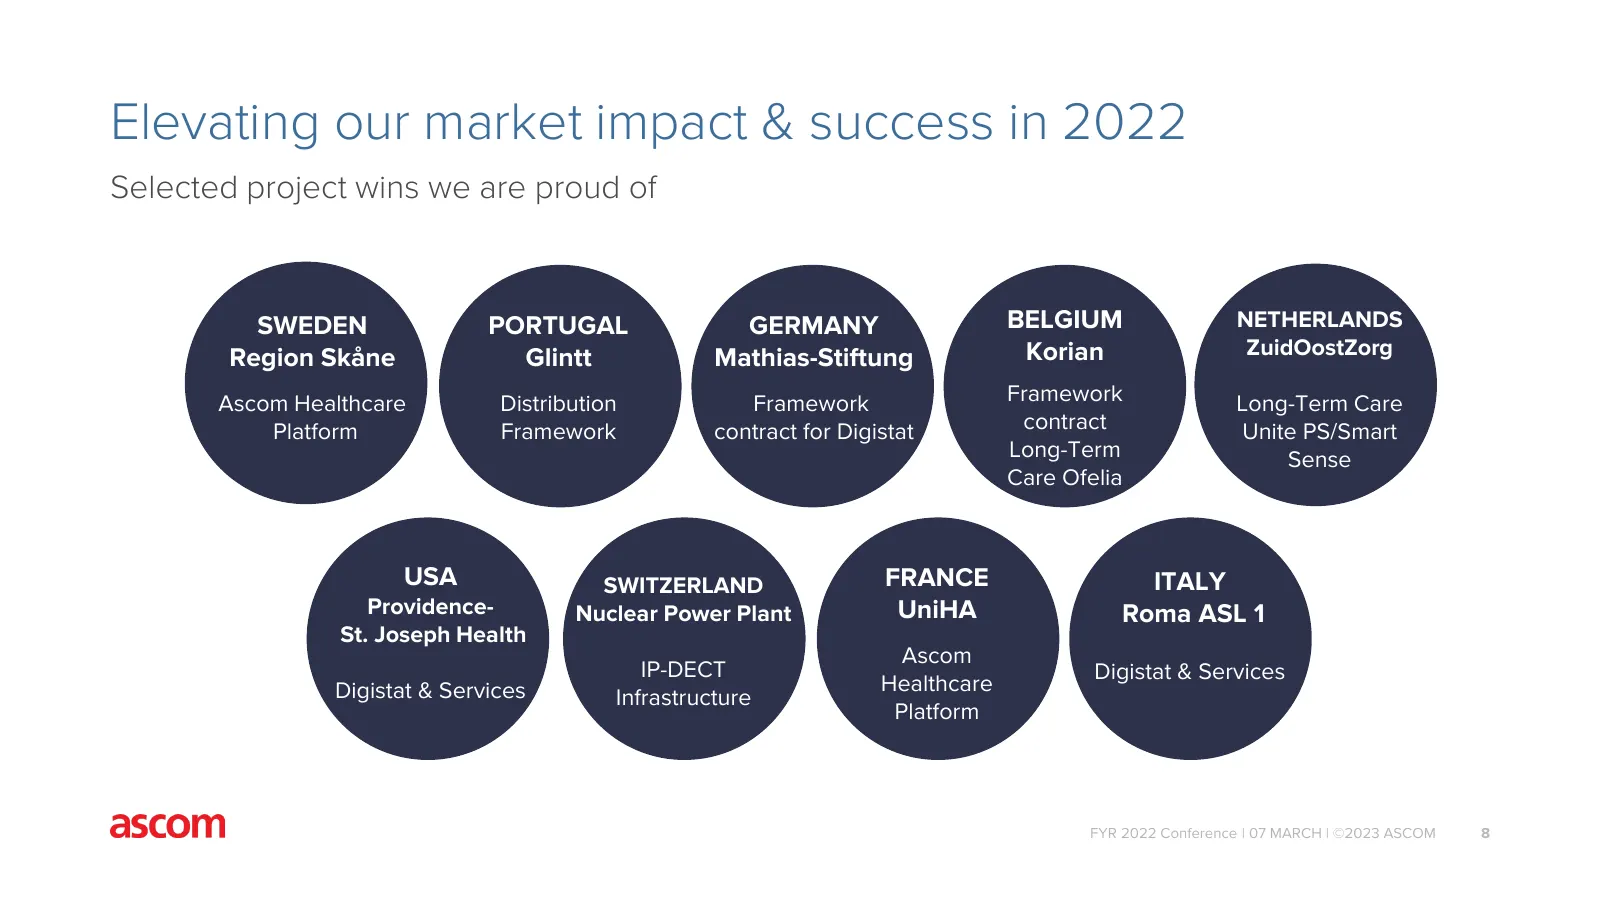
Elevating our market impact & success in 2022 Selected project wins we are proud of SWEDEN PORTUGAL GERMANY BELGIUM NETHERLANDS ASIA ?? Region Skåne Glintt Mathias-Stiftung Korian ZuidOostZorg Mahsa Ascom Healthcare Distribution Framework Framework Specialist Long-Term Care Platform Framework contra
Slide 9: Financial Review 2022
Financial Review 2022 Dominik Maurer, CFO FYR 2022 Conference | 07 MARCH | ©2023 ASCOM 9
Slide 10: FY 2022 Key Figures (at actual rates)
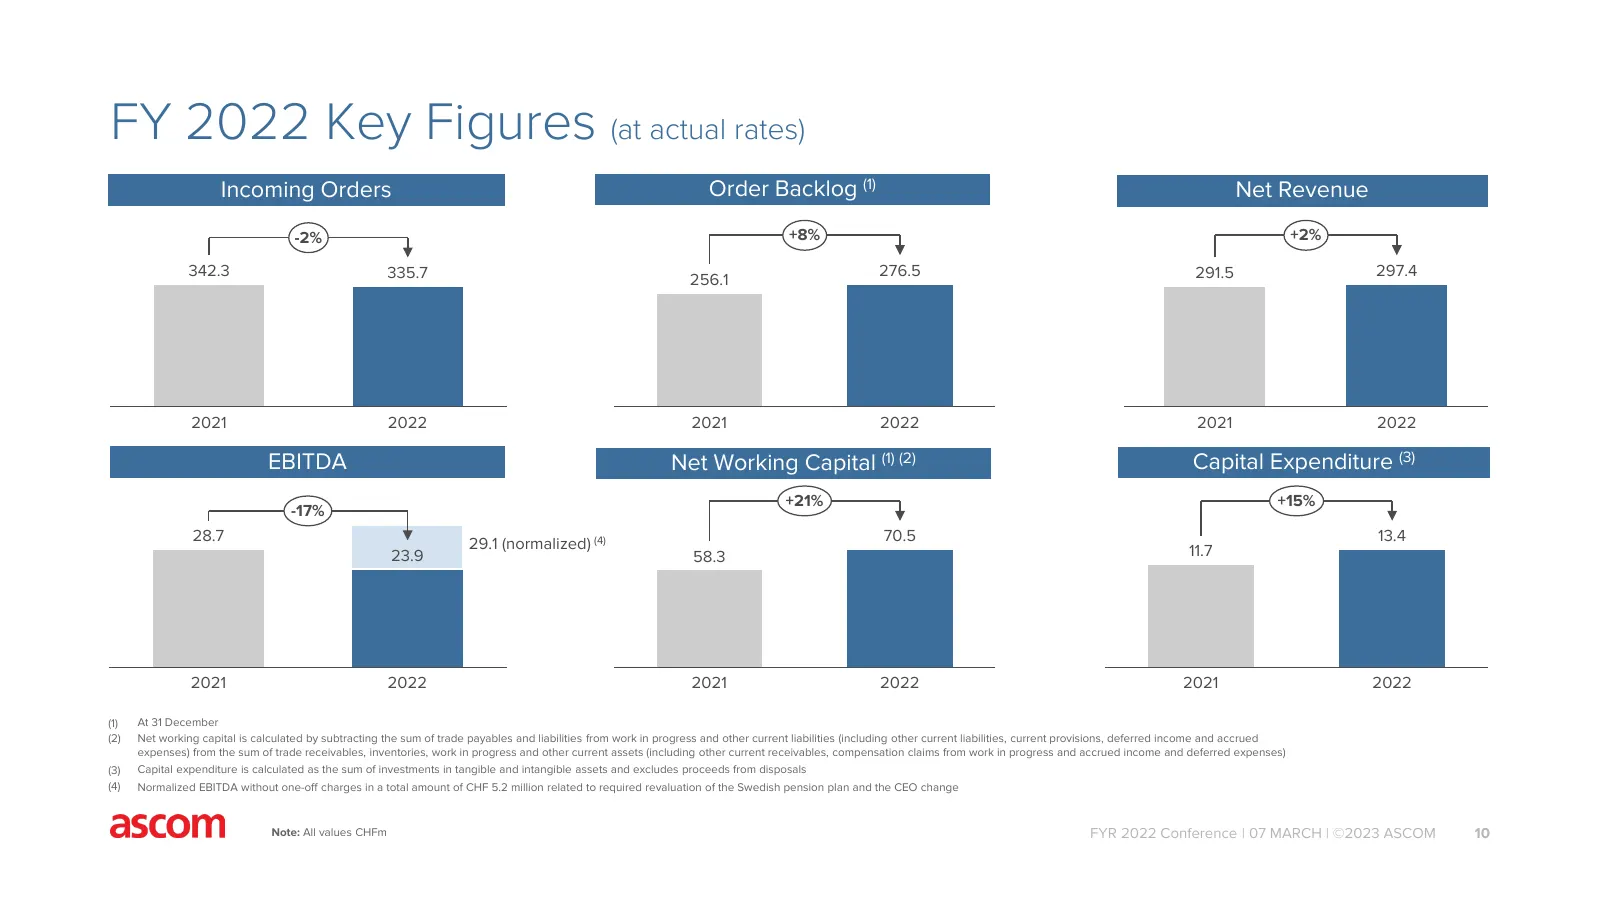
FY 2022 Key Figures (at actual rates) Incoming Orders Order Backlog (1) Net Revenue -2% +8% +2% 342.3 335.7 276.5 291.5 297.4 256.1 2021 2022 2021 2022 2021 2022 EBITDA Net Working Capital (1) (2) Capital Expenditure (3) +21% +15% -17% 28.7 29.1 (normalized) (4) 70.5 13.4 23.9 58.3 11.7 2021 2022 20
Slide 11: Incoming Orders increased by 3.3% (at constant currencies)
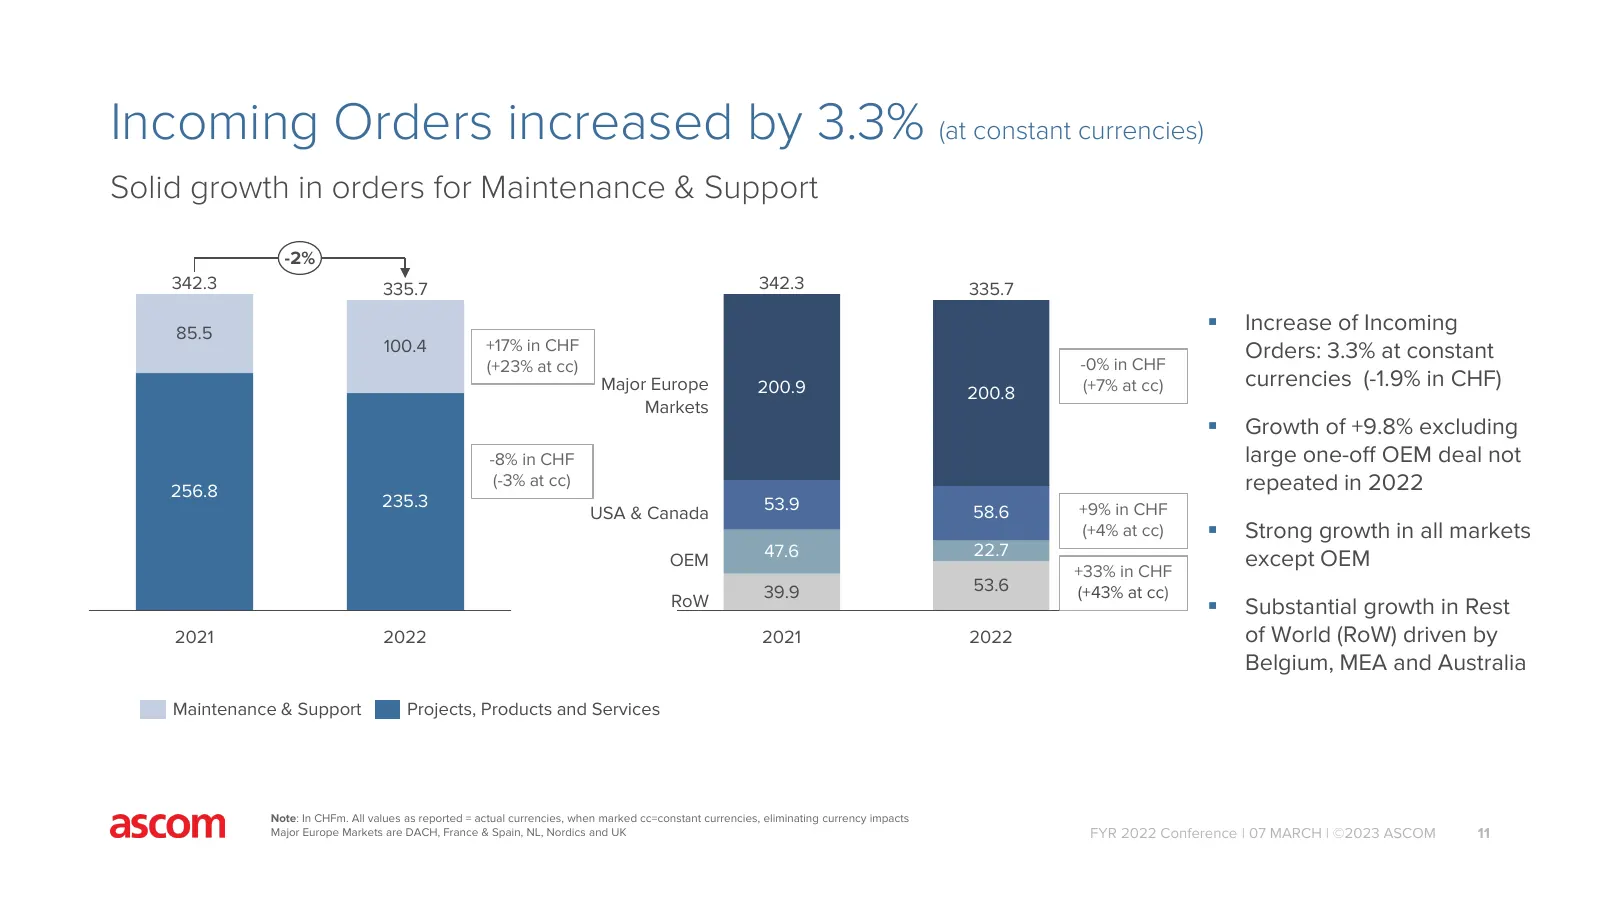
Incoming Orders increased by 3.3% (at constant currencies) Solid growth in orders for Maintenance & Support -2% 342.3 335.7 342.3 335.7 85.5 Increase of Incoming 100.4 +17% in CHF Orders: 3.3% at constant (+23% at cc) -0% in CHF Major Europe 200.9 (+7% at cc) currencies (-1.9% in CHF) 200.8 Market
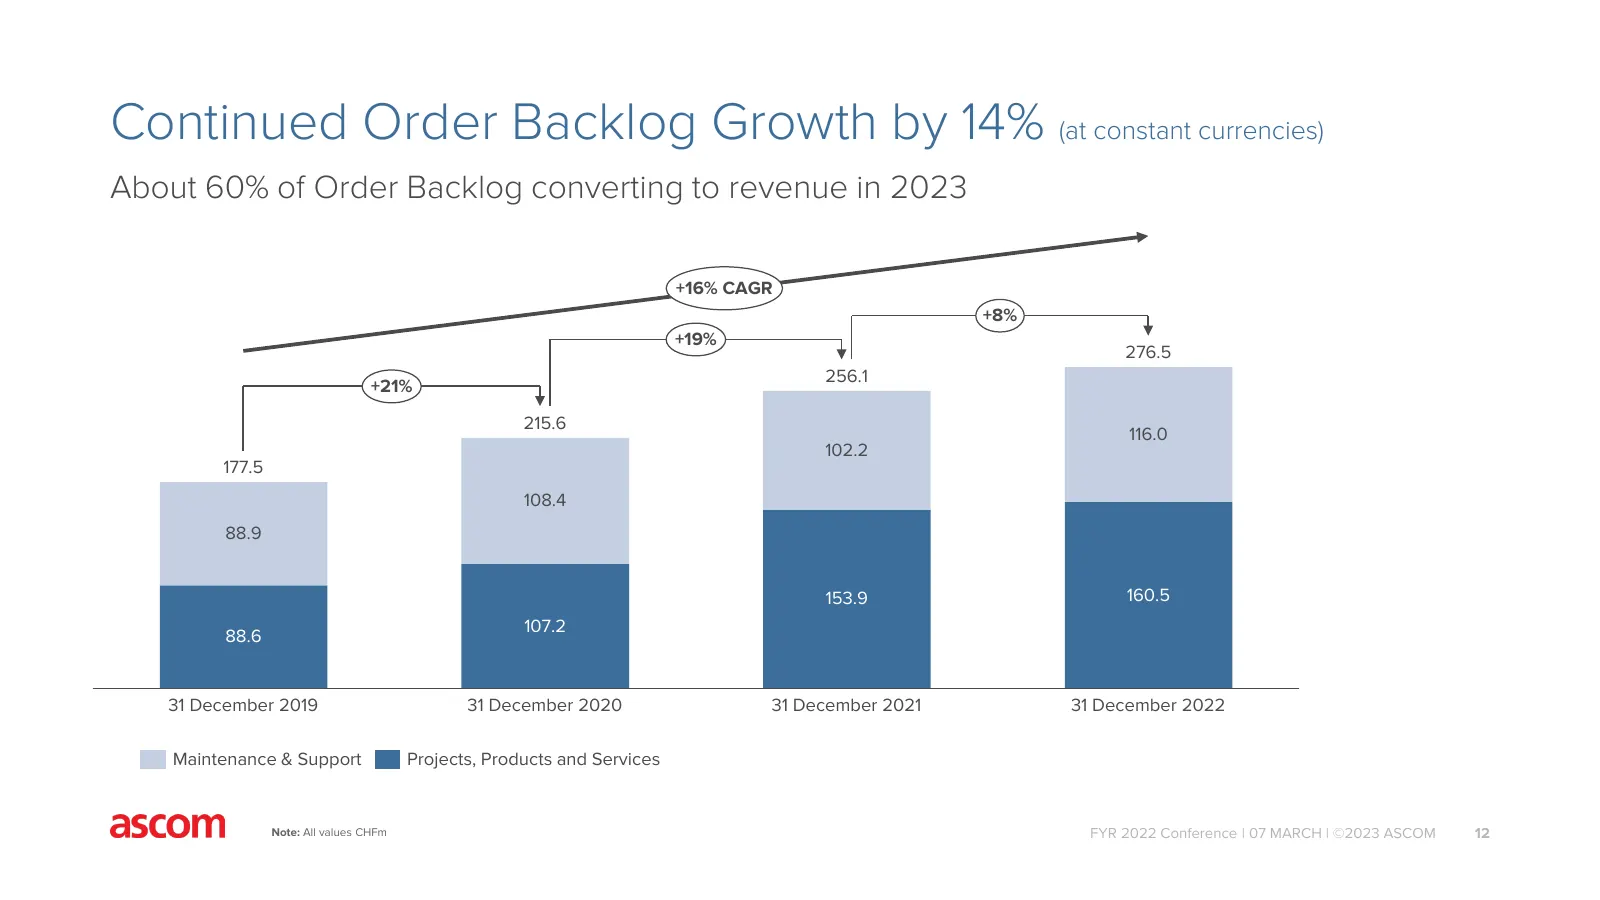
Slide 12: Continued Order Backlog Growth by 14% (at constant currencies)
Continued Order Backlog Growth by 14% (at constant currencies) About 60% of Order Backlog converting to revenue in 2023 +16% CAGR +8% +19% 276.5 256.1 +21% 215.6 116.0 102.2 177.5 108.4 88.9 153.9 160.5 107.2 88.6 31 December 2019 31 December 2020 31 December 2021 31 December 2022 Maintenance & Supp
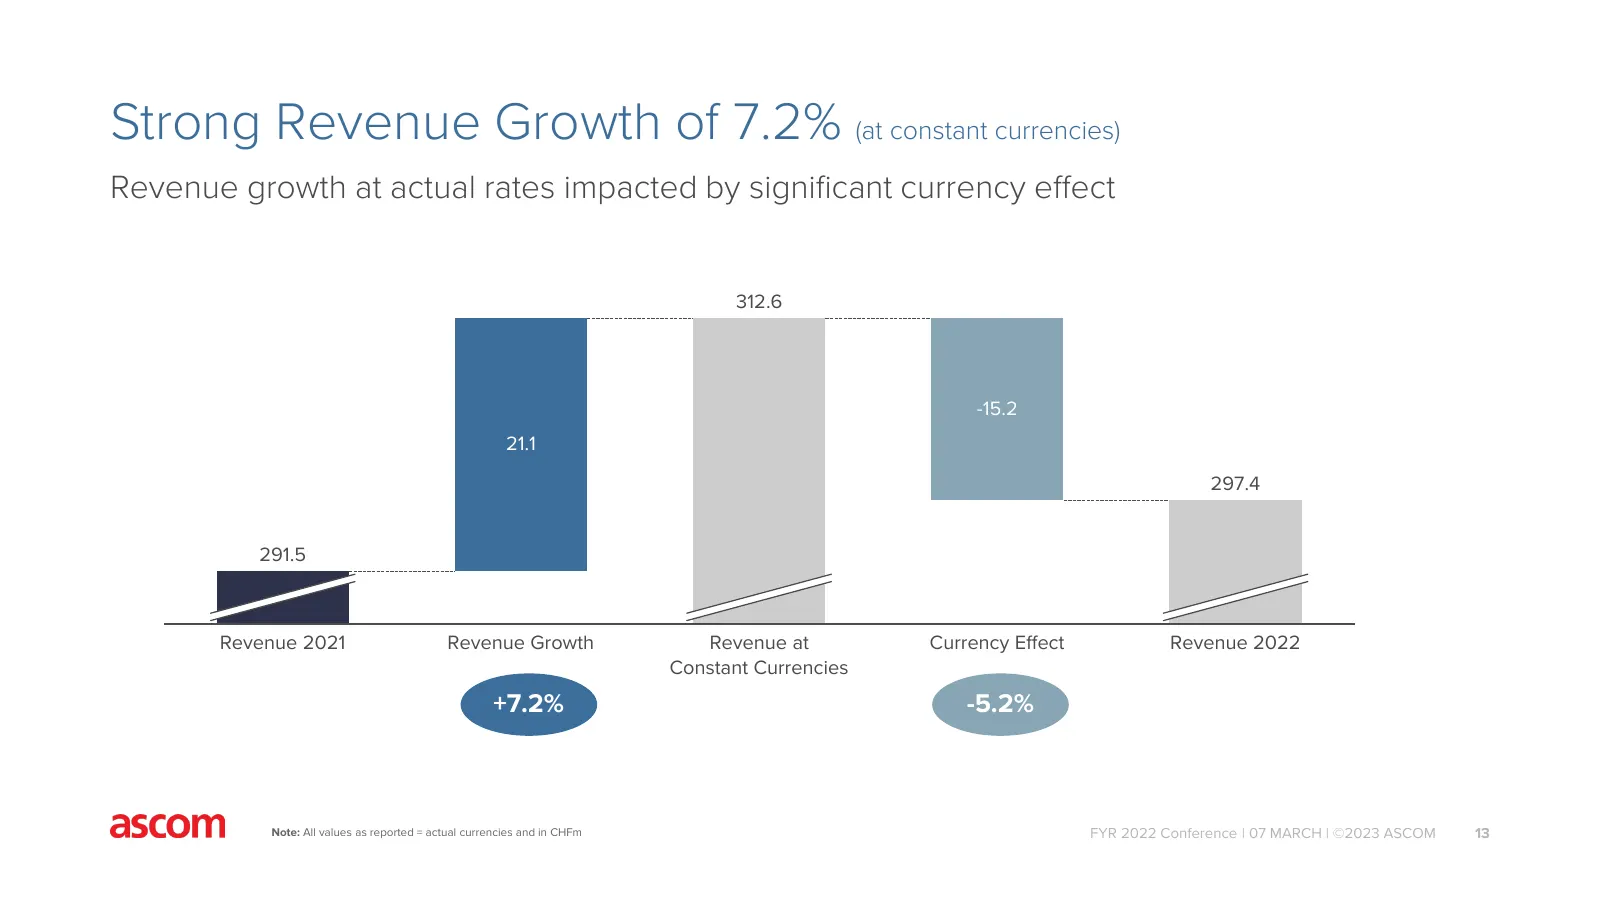
Slide 13: Strong Revenue Growth of 7.2% (at constant currencies)
Strong Revenue Growth of 7.2% (at constant currencies) Revenue growth at actual rates impacted by significant currency effect 312.6 -15.2 21.1 297.4 291.5 Revenue 2021 Revenue Growth Revenue at Currency Effect Revenue 2022 Constant Currencies +7.2% -5.2% Note: All values as reported = actual currenc
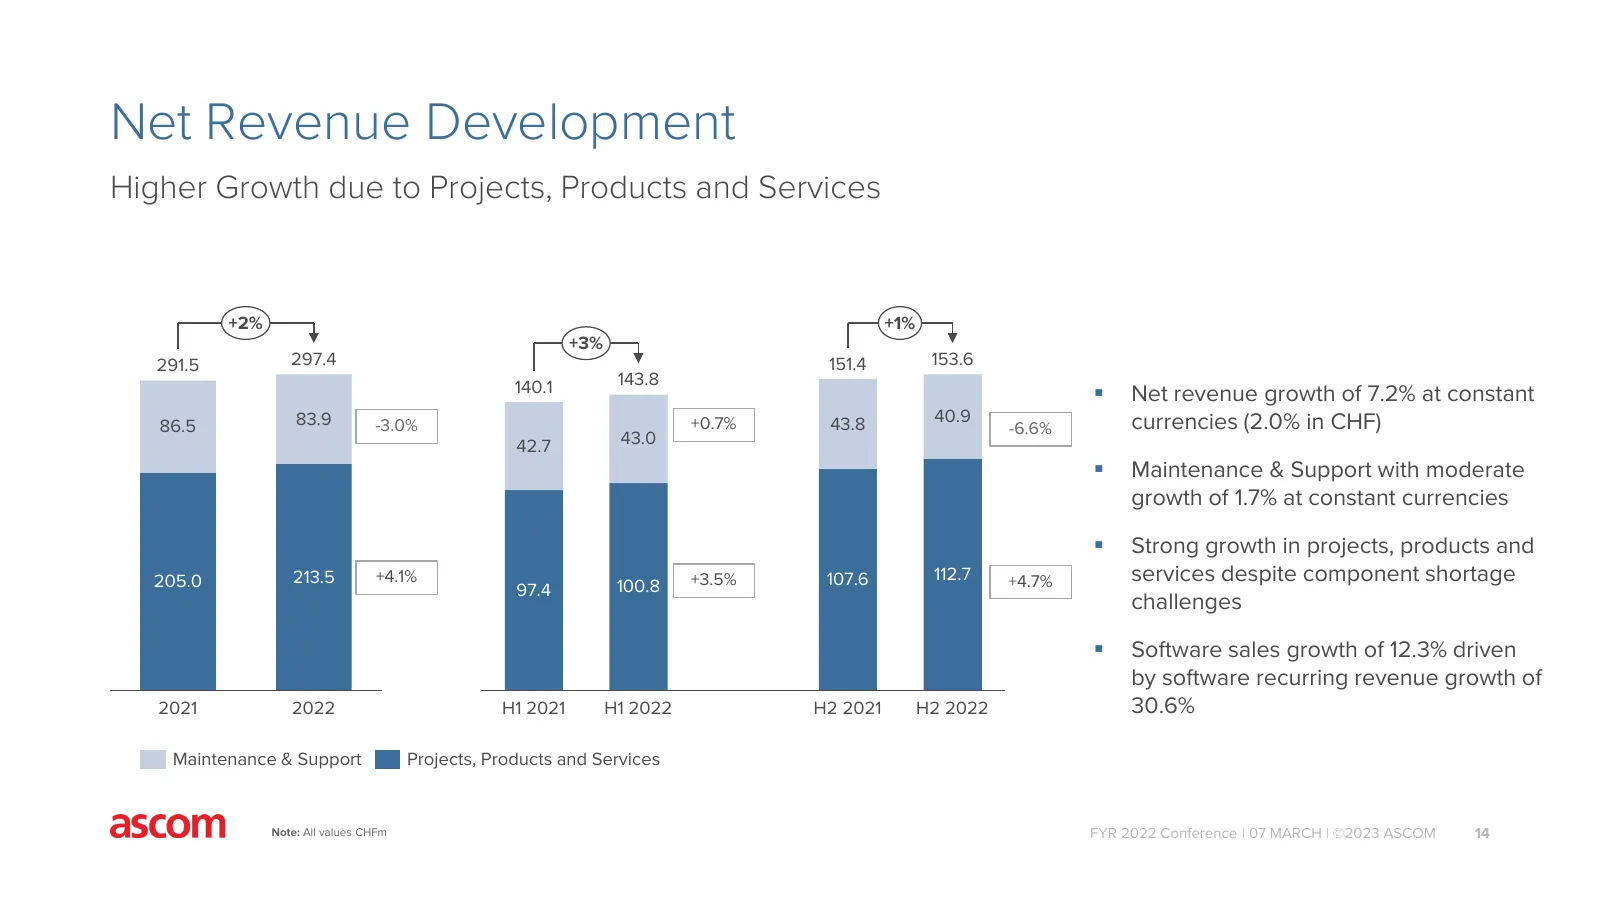
Slide 14: Net Revenue Development
Net Revenue Development Higher Growth due to Projects, Products and Services +2% +1% +3% 291.5 297.4 151.4 153.6 140.1 143.8 Net revenue growth of 7.2% at constant 83.9 -3.0% +0.7% 43.8 40.9 currencies (2.0% in CHF) 86.5 -6.6% 42.7 43.0 Maintenance & Support with moderate growth of 1.7% at const
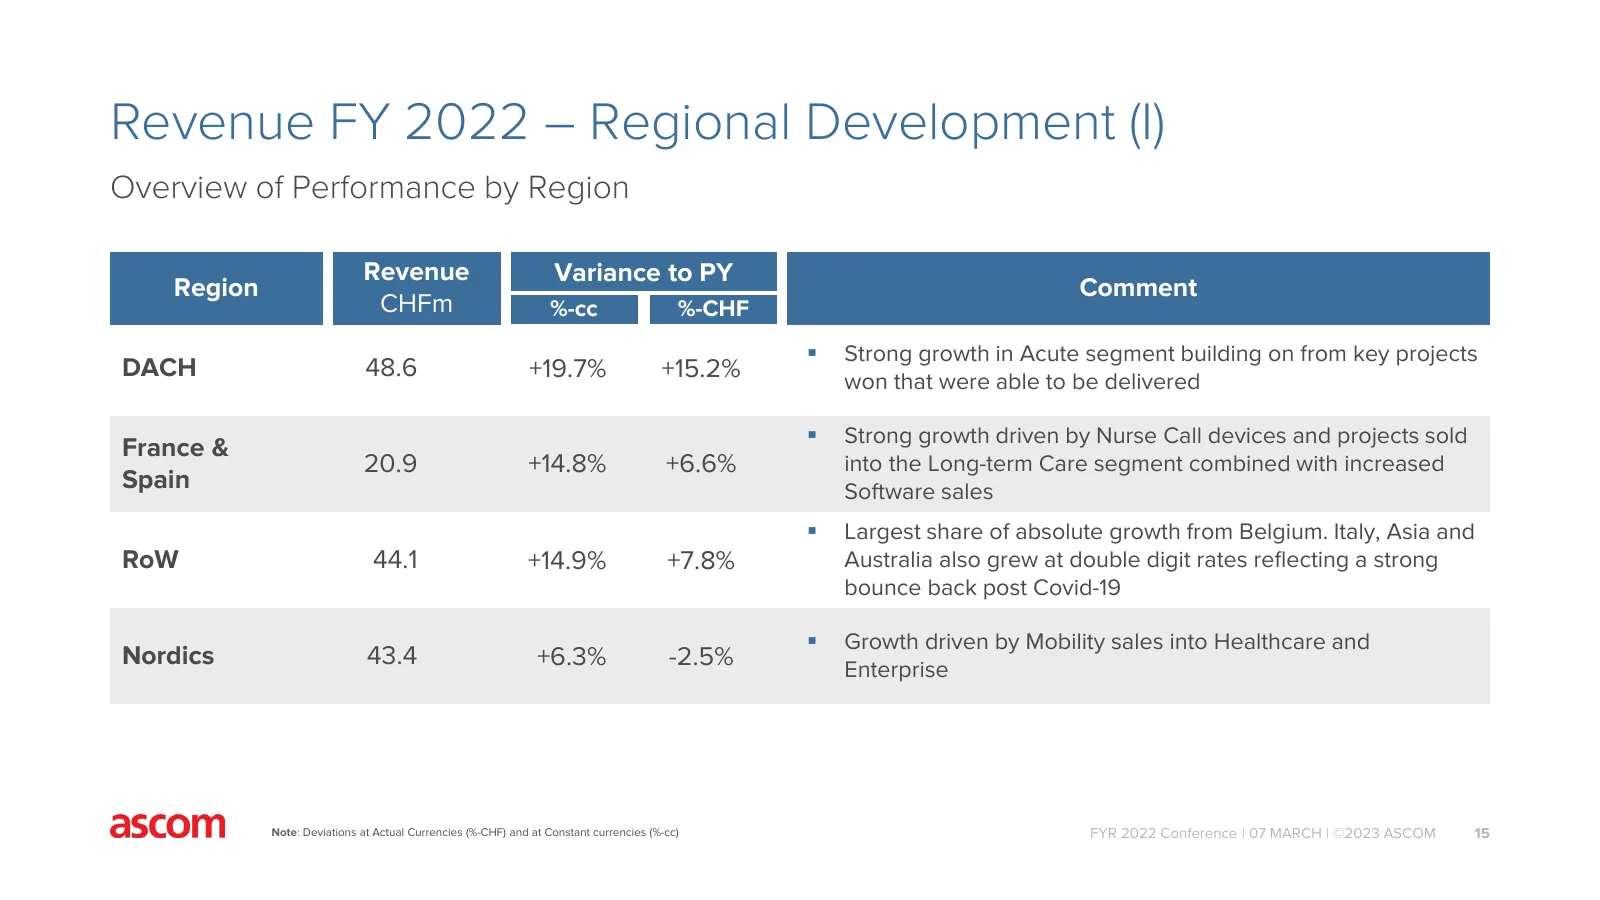
Slide 15: Revenue FY 2022 – Regional Development (I)
Revenue FY 2022 – Regional Development (I) Overview of Performance by Region Revenue Variance to PY Region Comment CHFm %-cc %-CHF Strong growth in Acute segment building on from key projects DACH 48.6 +19.7% +15.2% won that were able to be delivered Strong growth driven by Nurse Call devices an
Slide 16: Revenue FY 2022 – Regional Development (II)
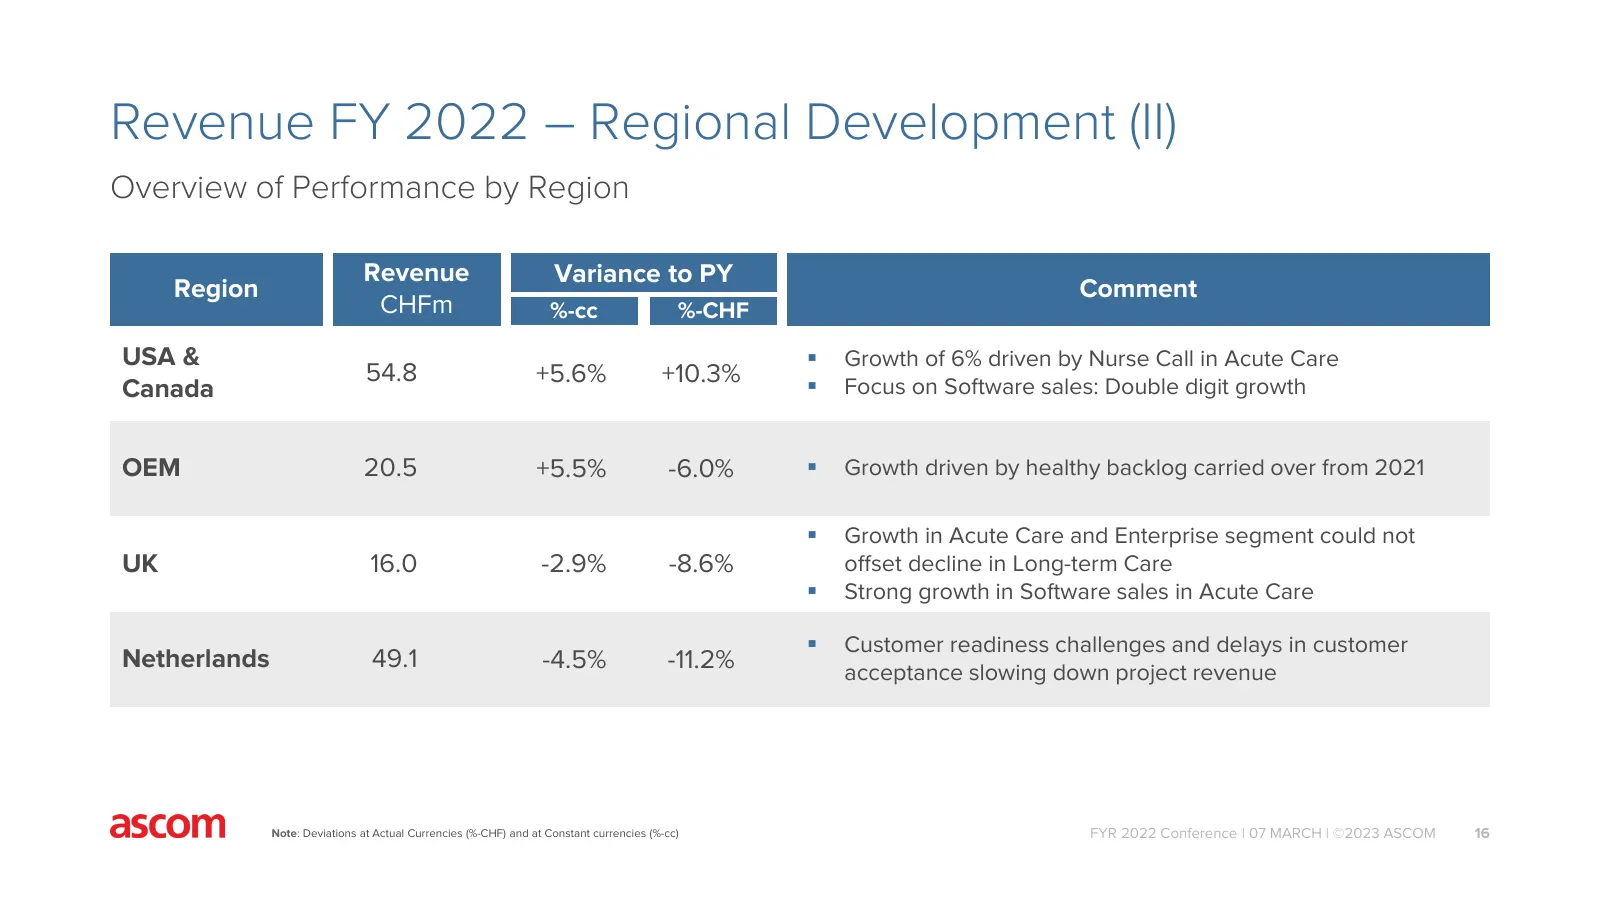
Revenue FY 2022 – Regional Development (II) Overview of Performance by Region Revenue Variance to PY Region Comment CHFm %-cc %-CHF USA & Growth of 6% driven by Nurse Call in Acute Care 54.8 +5.6% +10.3% Focus on Software sales: Double digit growth Canada OEM 20.5 +5.5% -6.0% Growth driven by
Slide 17: EBITDA and Gross Profit Bridge
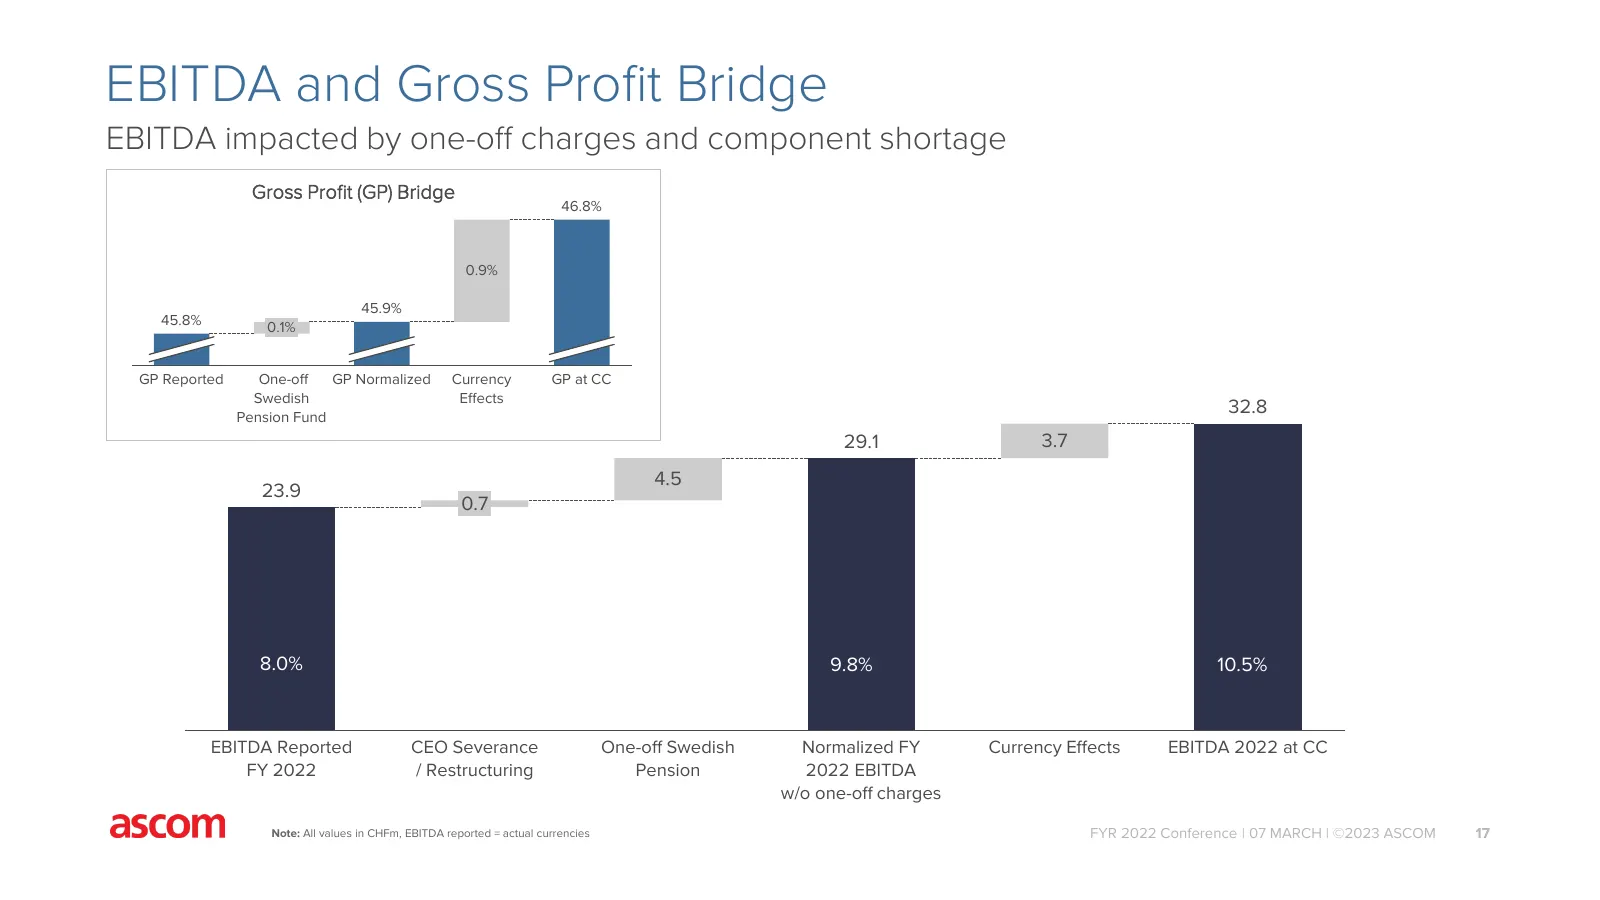
EBITDA and Gross Profit Bridge EBITDA impacted by one-off charges and component shortage Gross Profit (GP) Bridge 46.8% 0.9% 45.9% 45.8% 0.1% GP Reported One-off GP Normalized Currency GP at CC Swedish Effects Pension Fund 32.8 29.1 3.7 4.5 23.9 0.7 8.0% 9.8% 10.5% EBITDA Reported CEO Severance One-
Slide 18: FY 2022 P&L
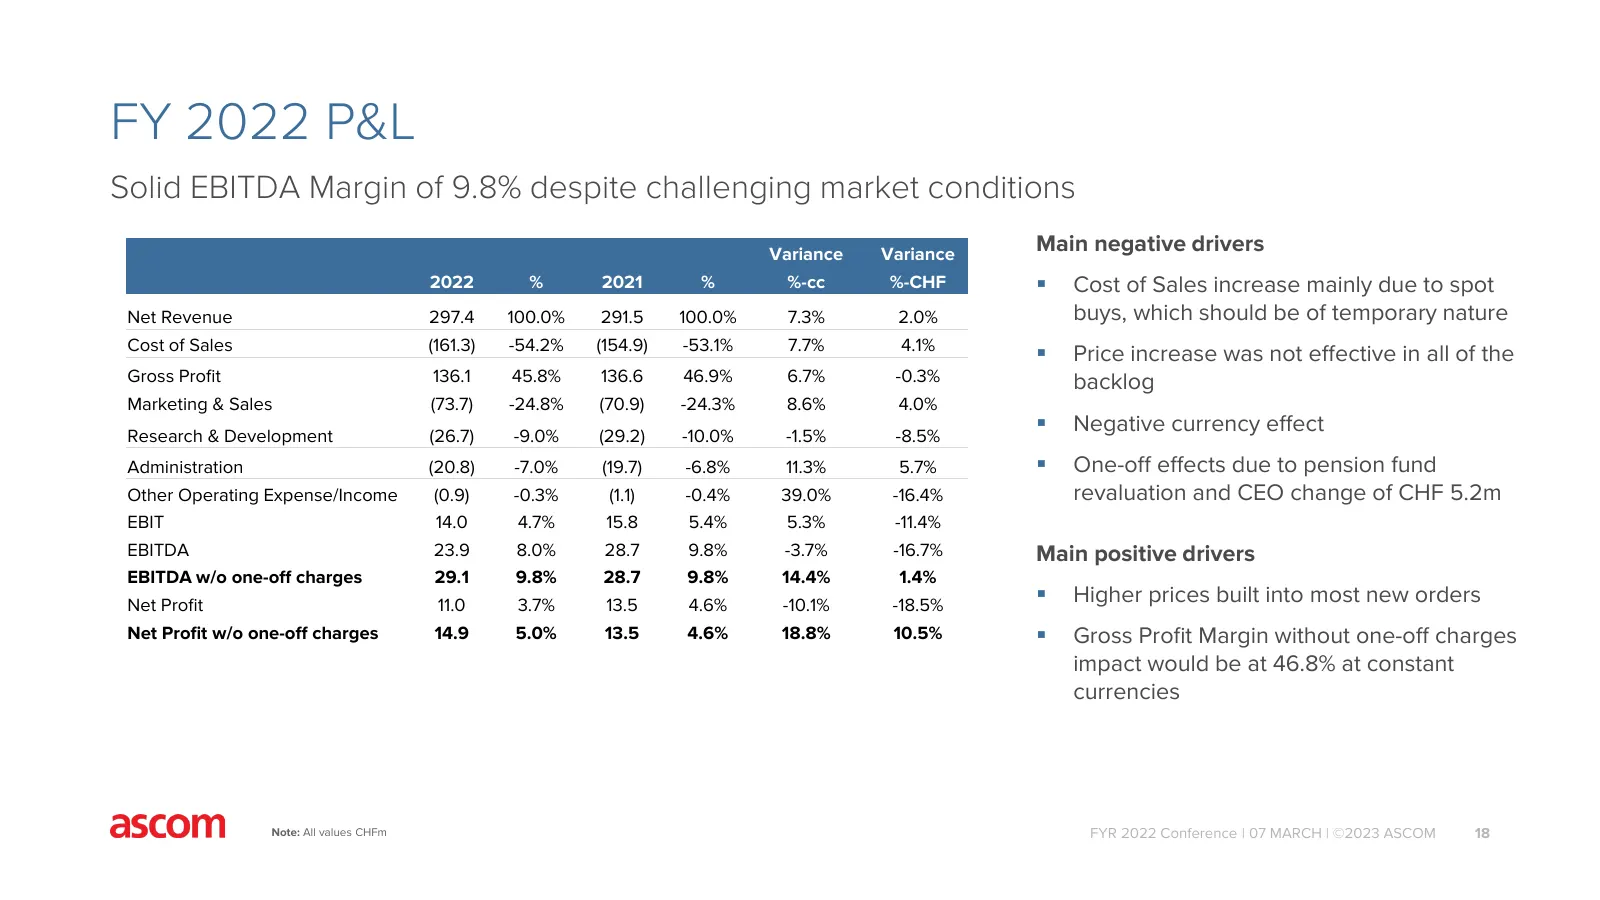
FY 2022 P&L Solid EBITDA Margin of 9.8% despite challenging market conditions Variance Variance Main negative drivers 2022 % 2021 % %-cc %-CHF Cost of Sales increase mainly due to spot Net Revenue 297.4 100.0% 291.5 100.0% 7.3% 2.0% buys, which should be of temporary nature Cost of Sales (161.3) -
Slide 19: CAPEX
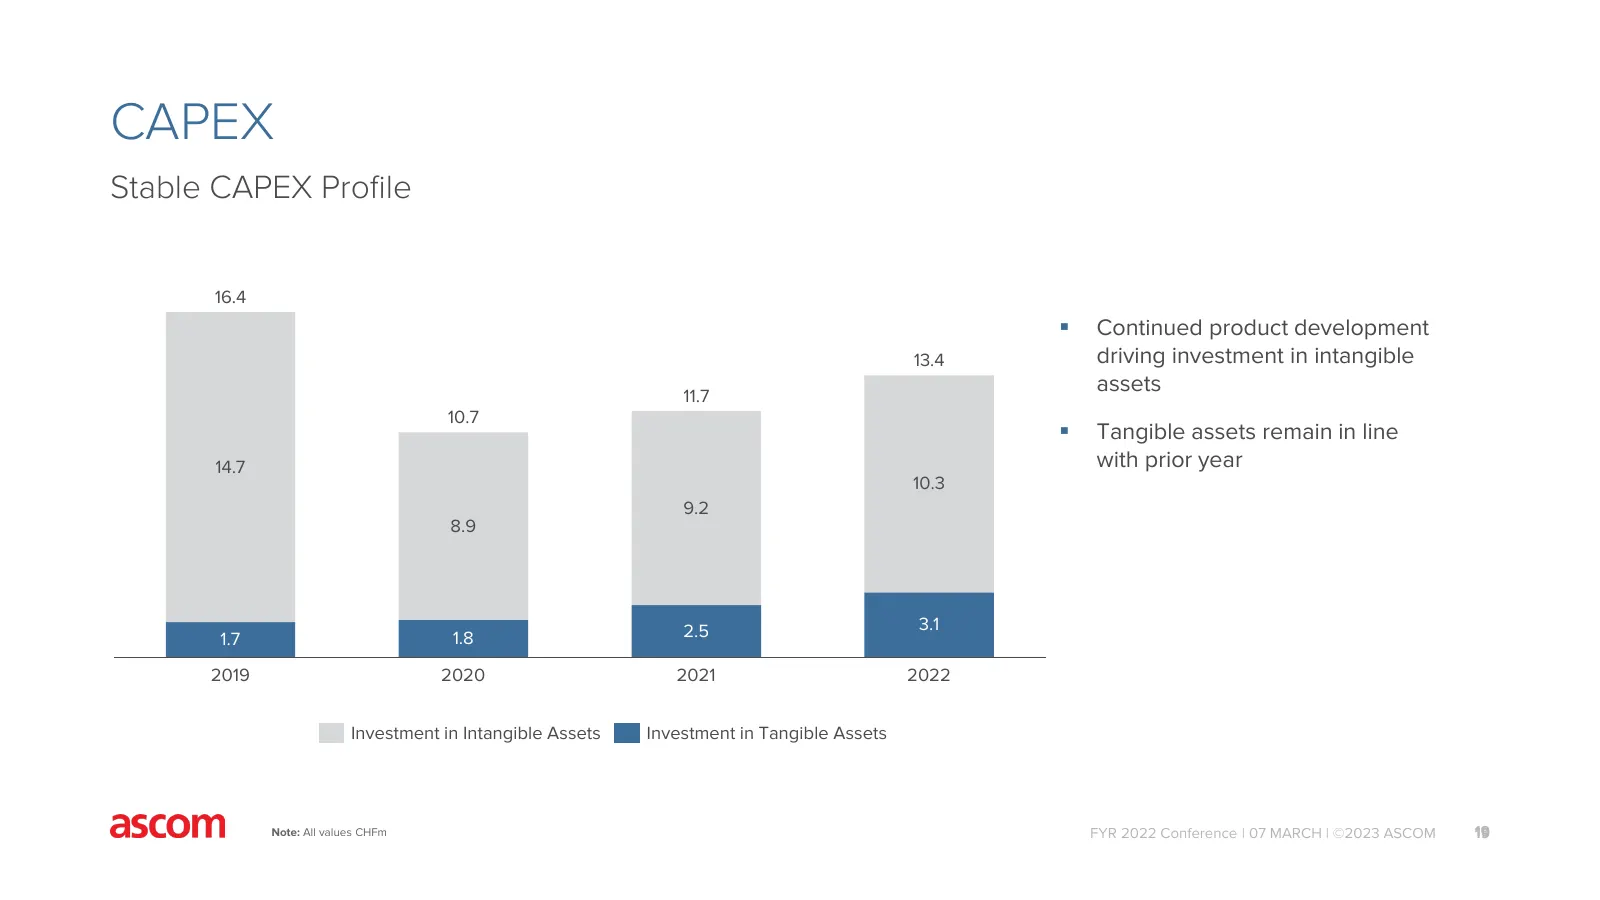
CAPEX Stable CAPEX Profile 16.4 Continued product development 13.4 driving investment in intangible 11.7 assets 10.7 Tangible assets remain in line 14.7 with prior year 10.3 9.2 8.9 2.5 3.1 1.7 1.8 2019 2020 2021 2022 Investment in Intangible Assets Investment in Tangible Assets Note: All values
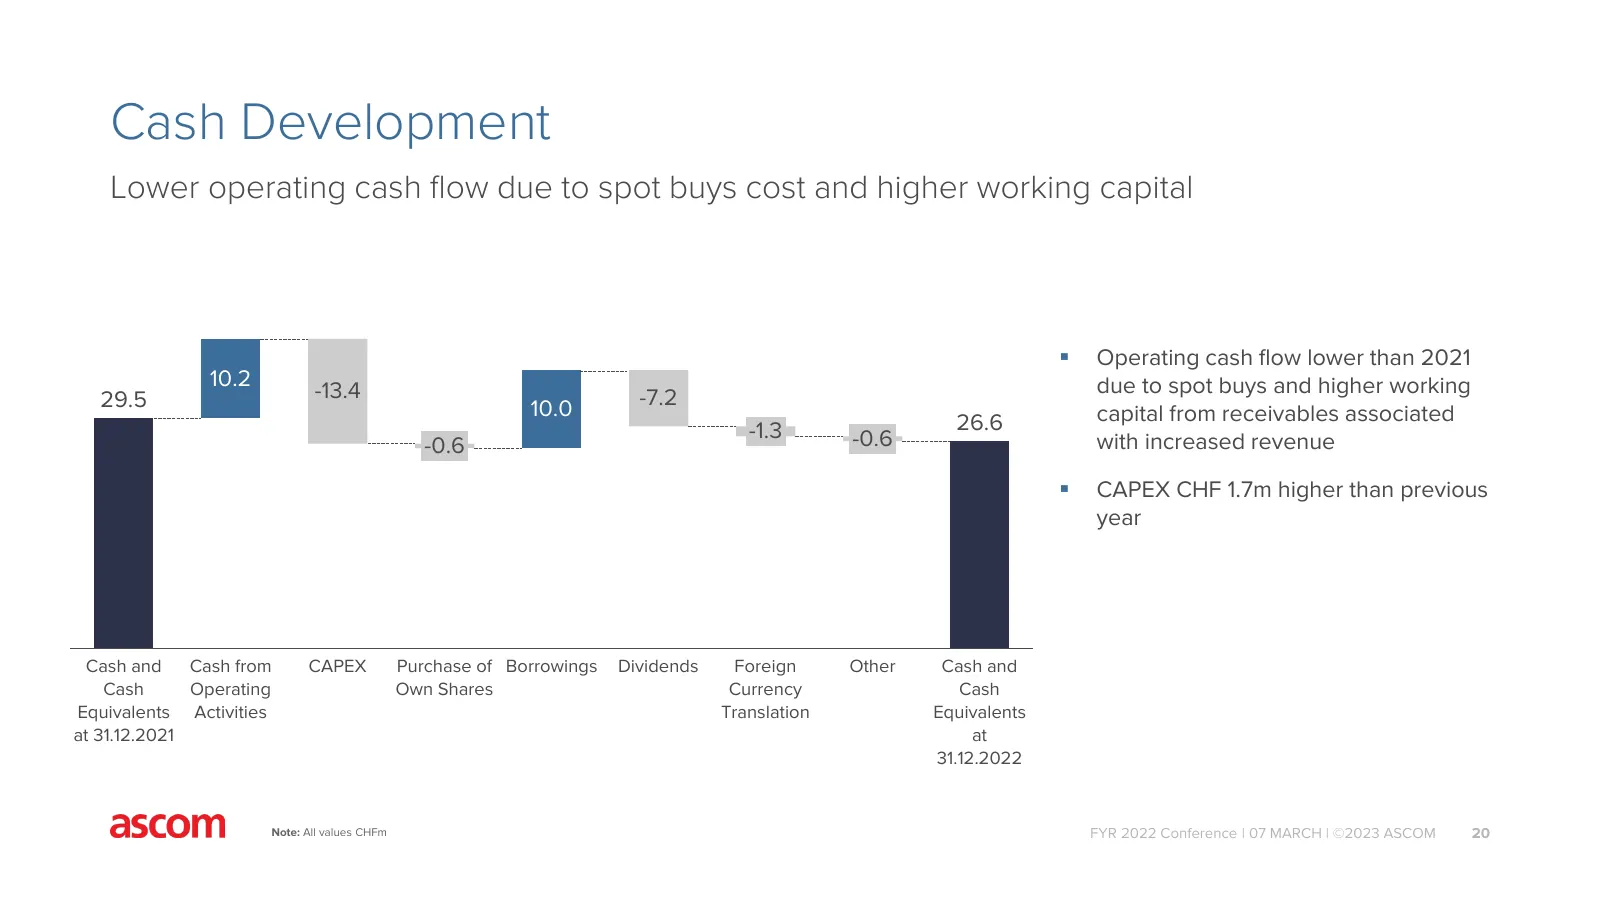
Slide 20: Cash Development
Cash Development Lower operating cash flow due to spot buys cost and higher working capital Operating cash flow lower than 2021 10.2 due to spot buys and higher working 29.5 -13.4 -7.2 10.0 capital from receivables associated -1.3 26.6 -0.6 -0.6 with increased revenue CAPEX CHF 1.7m higher than
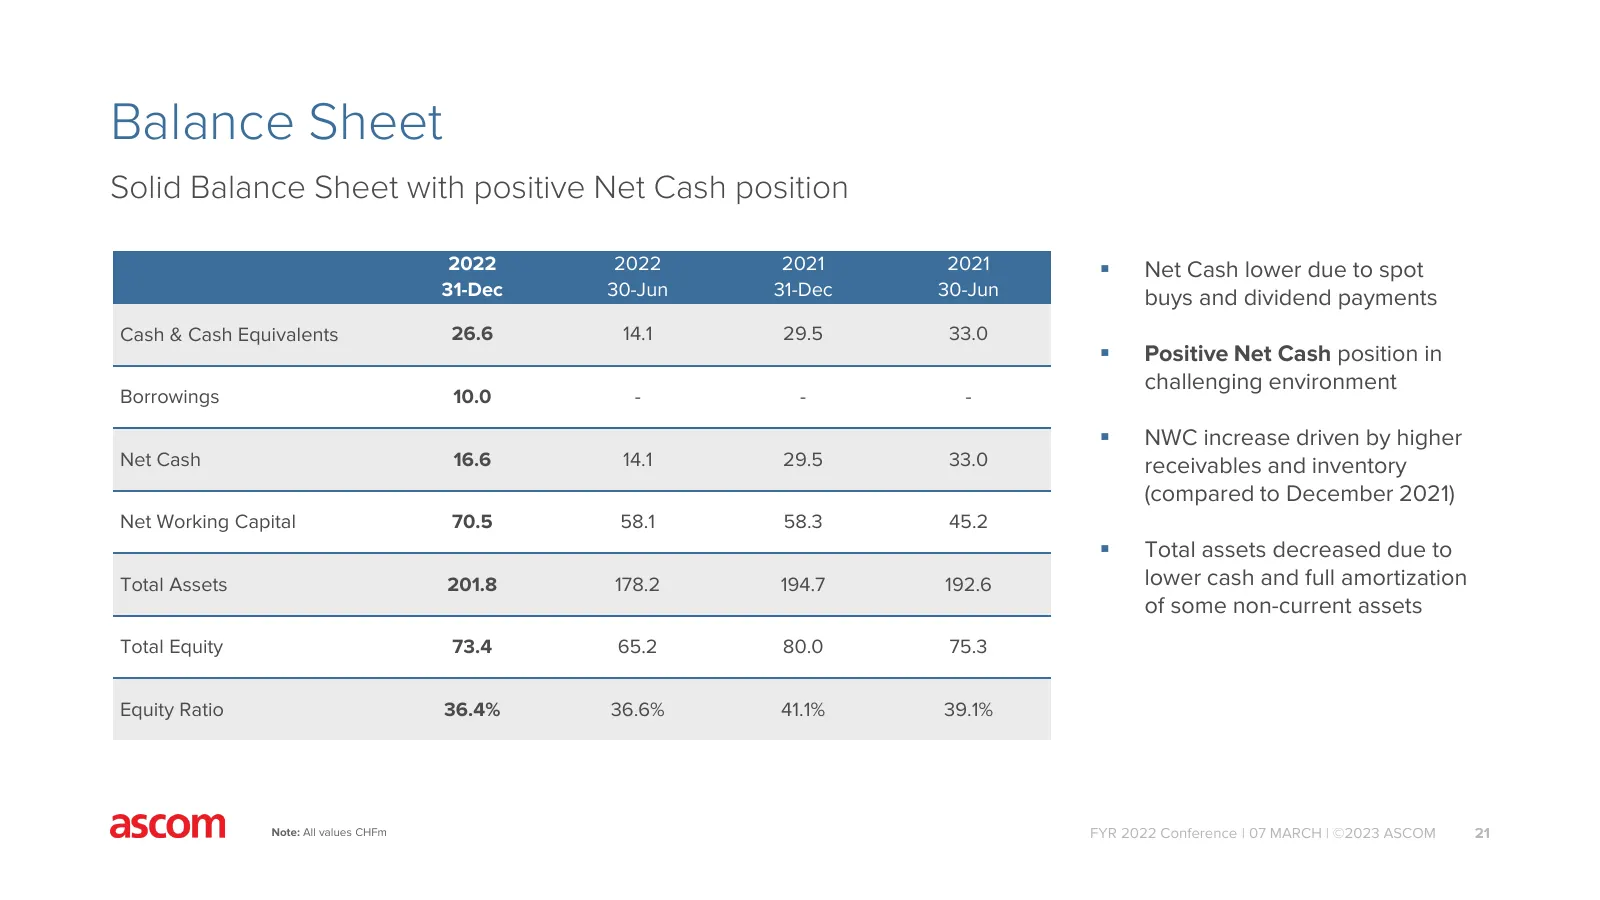
Slide 21: Balance Sheet
Balance Sheet Solid Balance Sheet with positive Net Cash position 2022 2022 2021 2021 Net Cash lower due to spot 31-Dec 30-Jun 31-Dec 30-Jun buys and dividend payments Cash & Cash Equivalents 26.6 14.1 29.5 33.0 Positive Net Cash position in challenging environment Borrowings 10.0 - - - NWC in
Slide 22: Strategy & Business Update
Strategy & Business Update Nicolas Vanden Abeele, CEO FYR 2022 Conference | 07 MARCH | ©2023 ASCOM 22
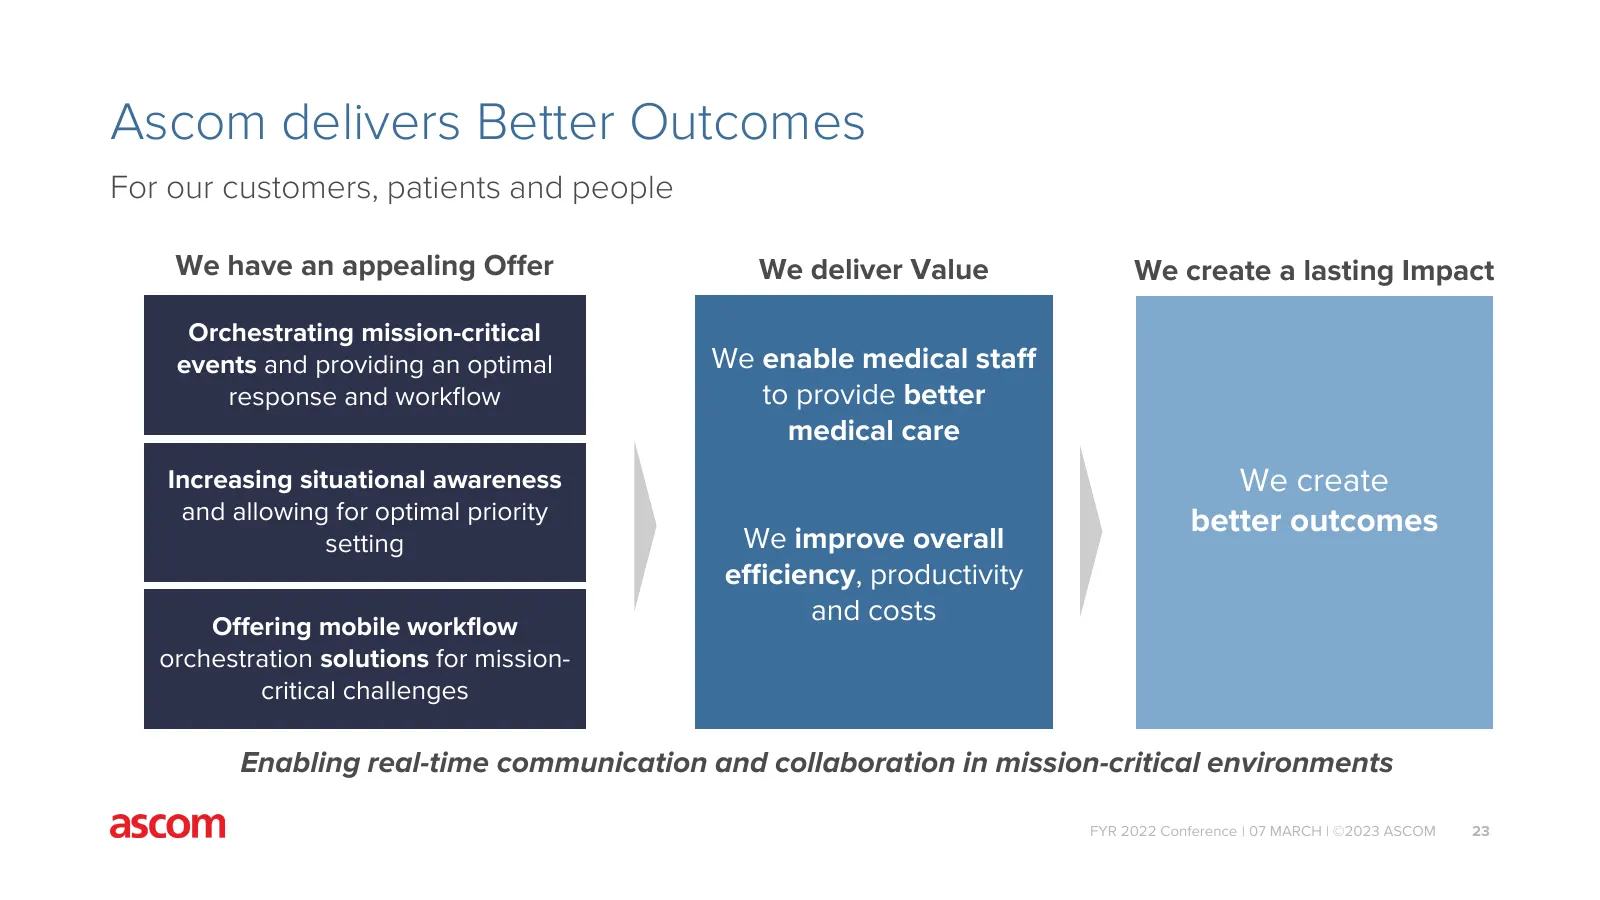
Slide 23: Ascom delivers Better Outcomes
Ascom delivers Better Outcomes For our customers, patients and people We have an appealing Offer We deliver Value We create a lasting Impact Orchestrating mission-critical events and providing an optimal We enable medical staff response and workflow to provide better medical care Increasing situatio
Slide 24: Mega-trends reshaping the Healthcare Industry
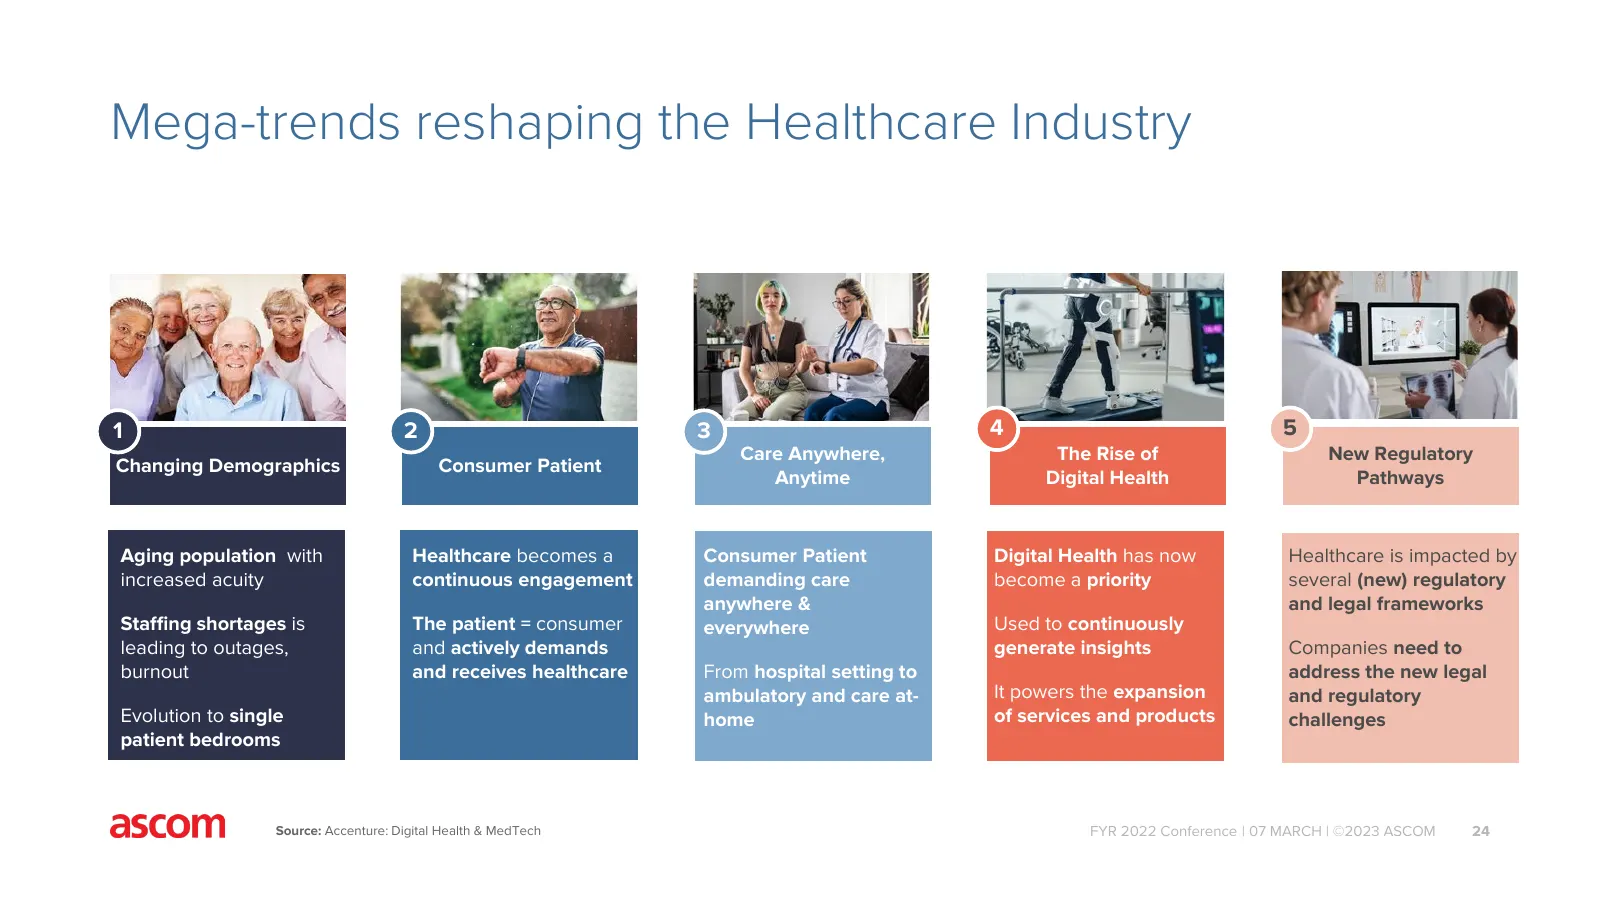
Mega-trends reshaping the Healthcare Industry 1 2 3 4 5 Care Anywhere, The Rise of New Regulatory Changing Demographics Consumer Patient Anytime Digital Health Pathways Aging population with Healthcare becomes a Consumer Patient Digital Health has now Healthcare is impacted by increased acuity conti
Slide 25: Ascom helps solve real customer pain-points
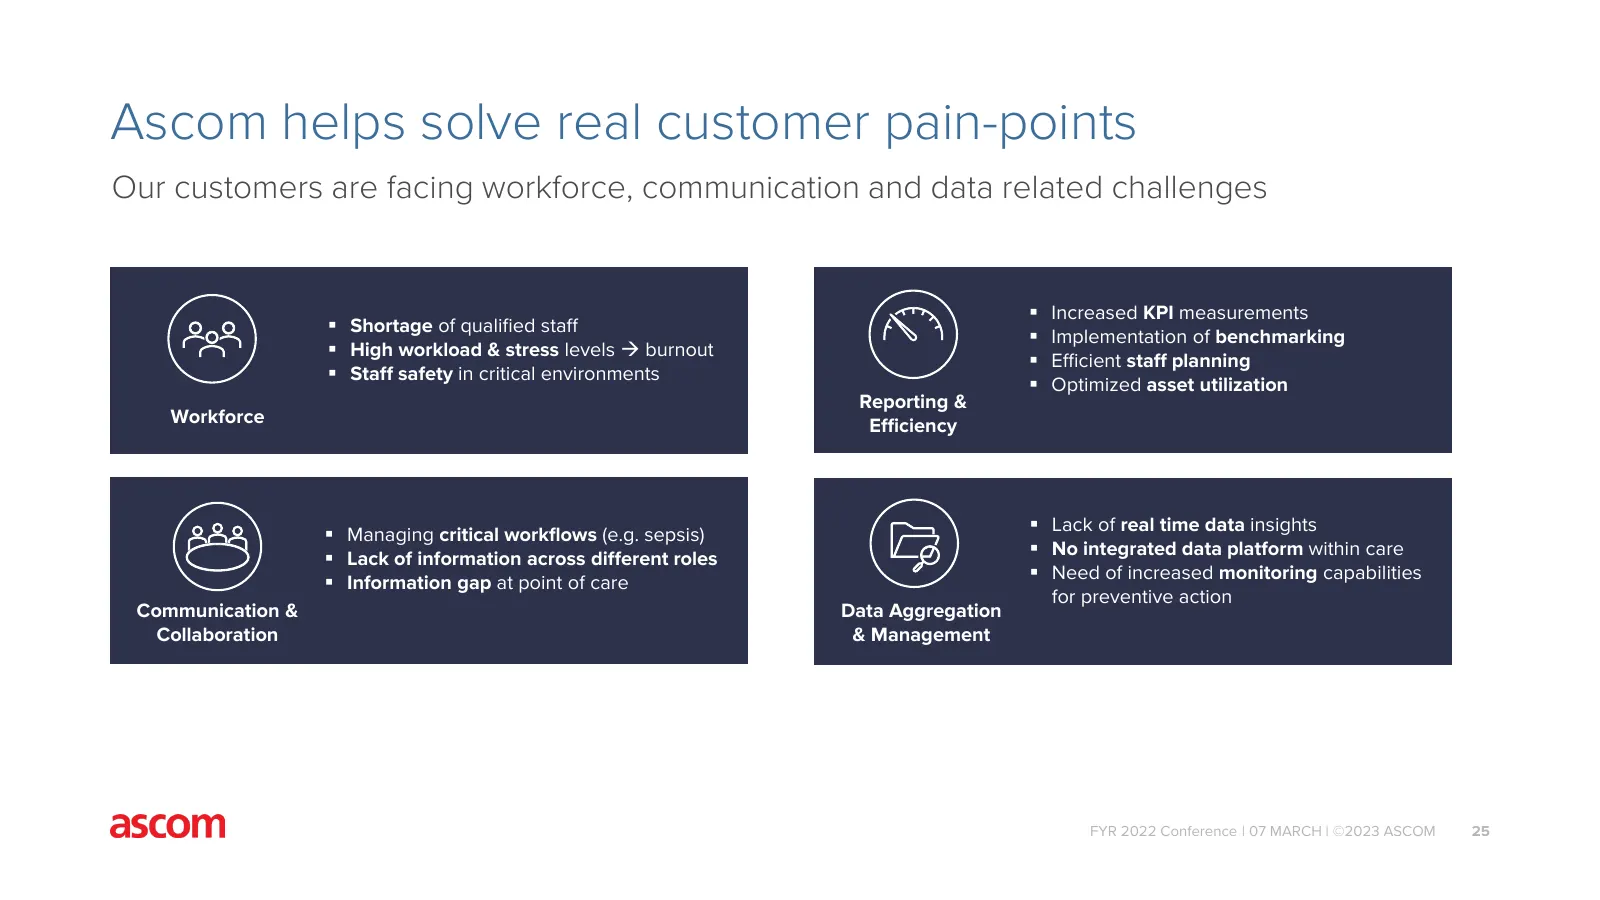
Ascom helps solve real customer pain-points Our customers are facing workforce, communication and data related challenges Increased KPI measurements Shortage of qualified staff Implementation of benchmarking High workload & stress levels burnout Efficient staff planning Staff safety in
Slide 26: Ambition to become the leading «enabling platform»
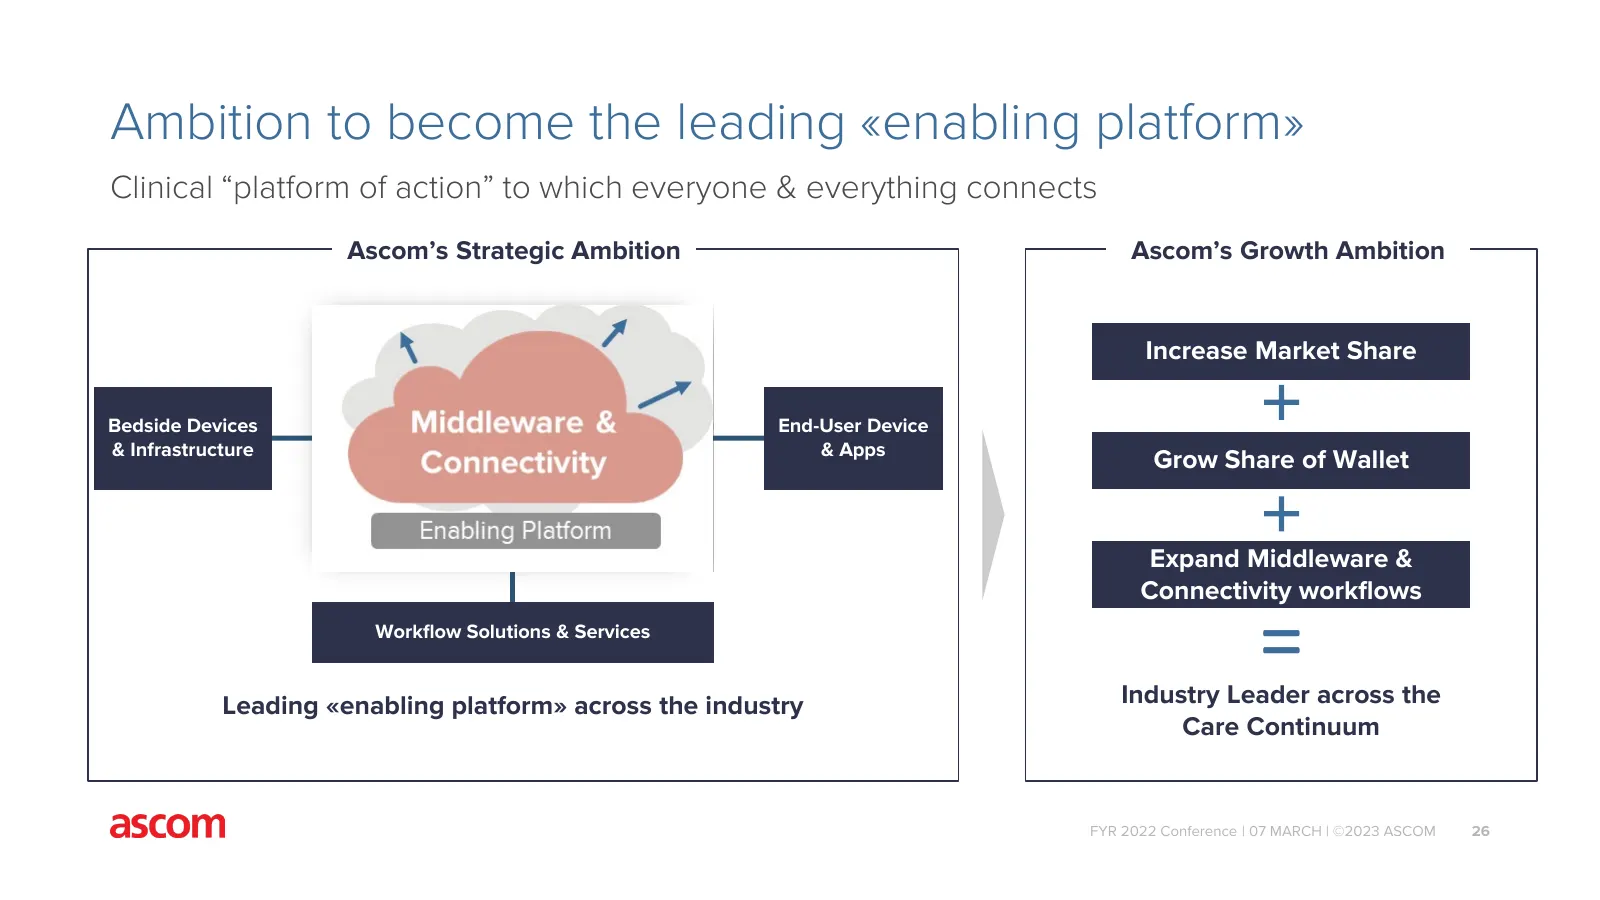
Ambition to become the leading «enabling platform» Clinical “platform of action” to which everyone & everything connects Ascom’s Strategic Ambition Ascom’s Growth Ambition Increase Market Share Bedside Devices End-User Device & Infrastructure & Apps Grow Share of Wallet Expand Middleware & = Connect
Slide 27: Ambition to become the leading «enabling platform»
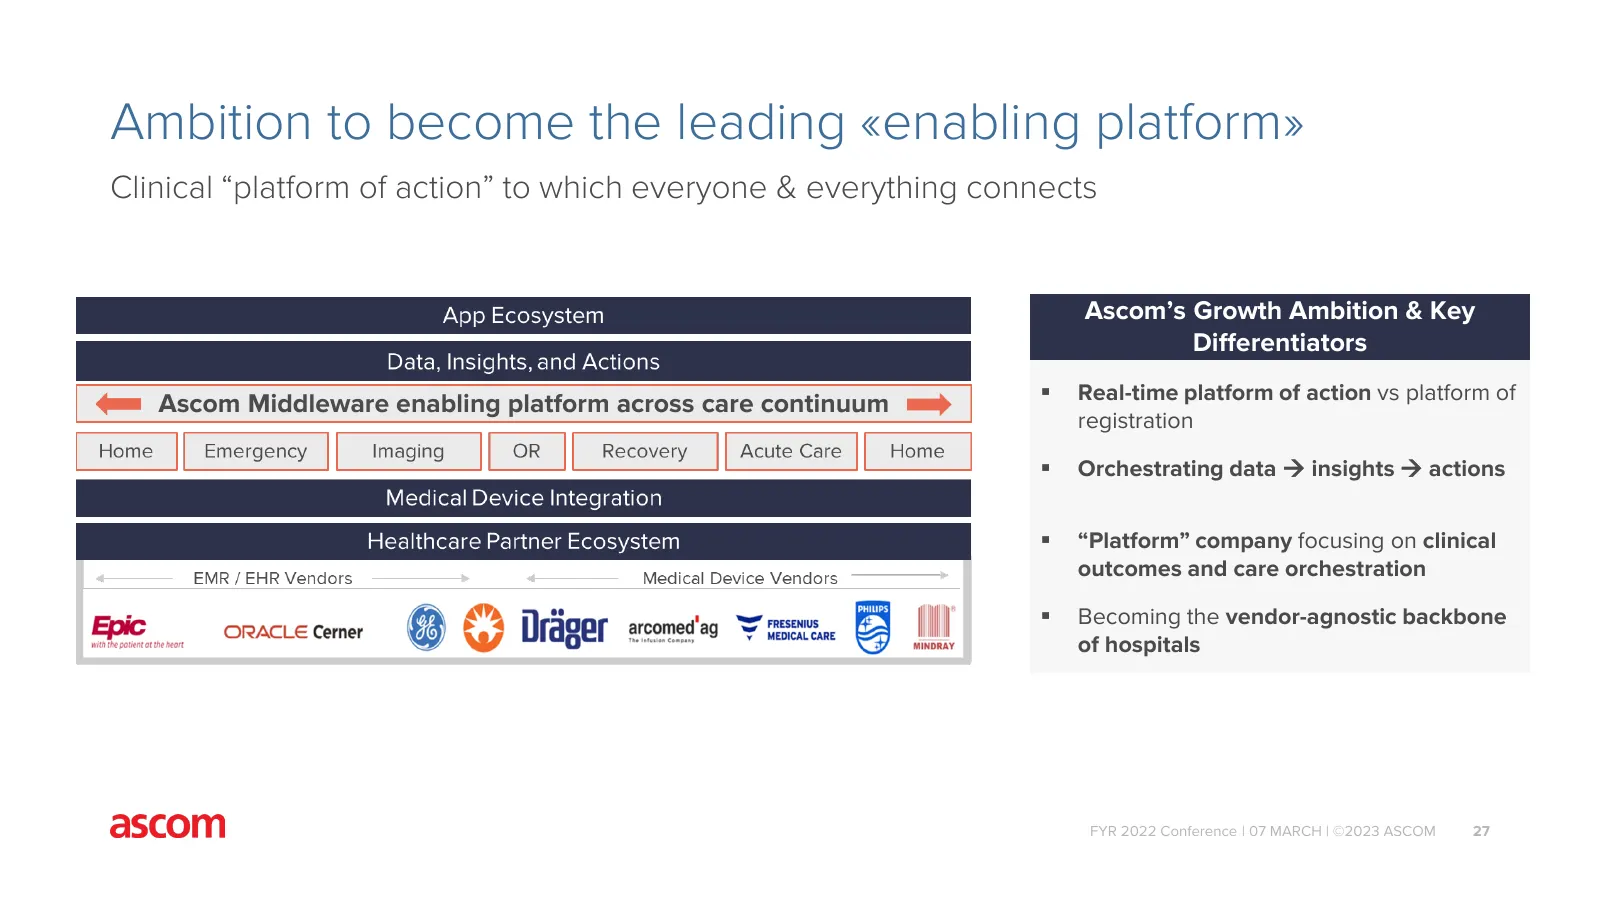
Ambition to become the leading «enabling platform» Clinical “platform of action” to which everyone & everything connects Ascom’s Growth Ambition & Key Differentiators Real-time platform of action vs platform of Ascom Middleware enabling platform across care continuum registration Orchestrating d
Slide 28: Executing on our Transformation Journey
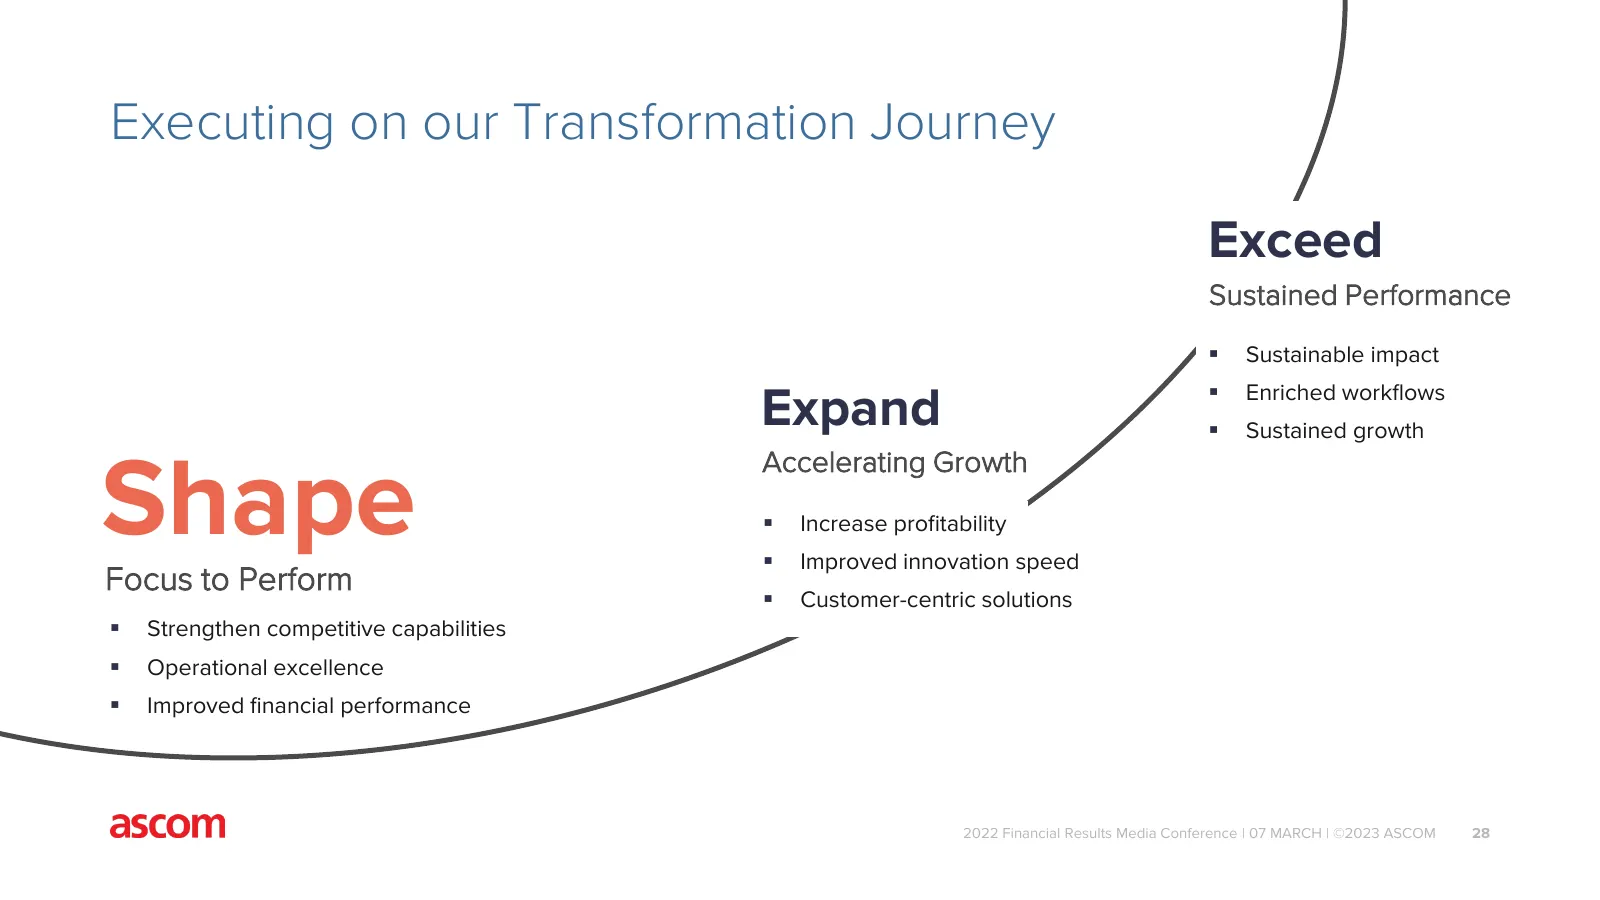
Executing on our Transformation Journey Exceed Sustained Performance Sustainable impact Expand Enriched workflows Sustained growth Shape Accelerating Growth Increase profitability Improved innovation speed Focus to Perform Customer-centric solutions Strengthen competitive capabilities
Slide 29: Our 4 strategic growth pillars
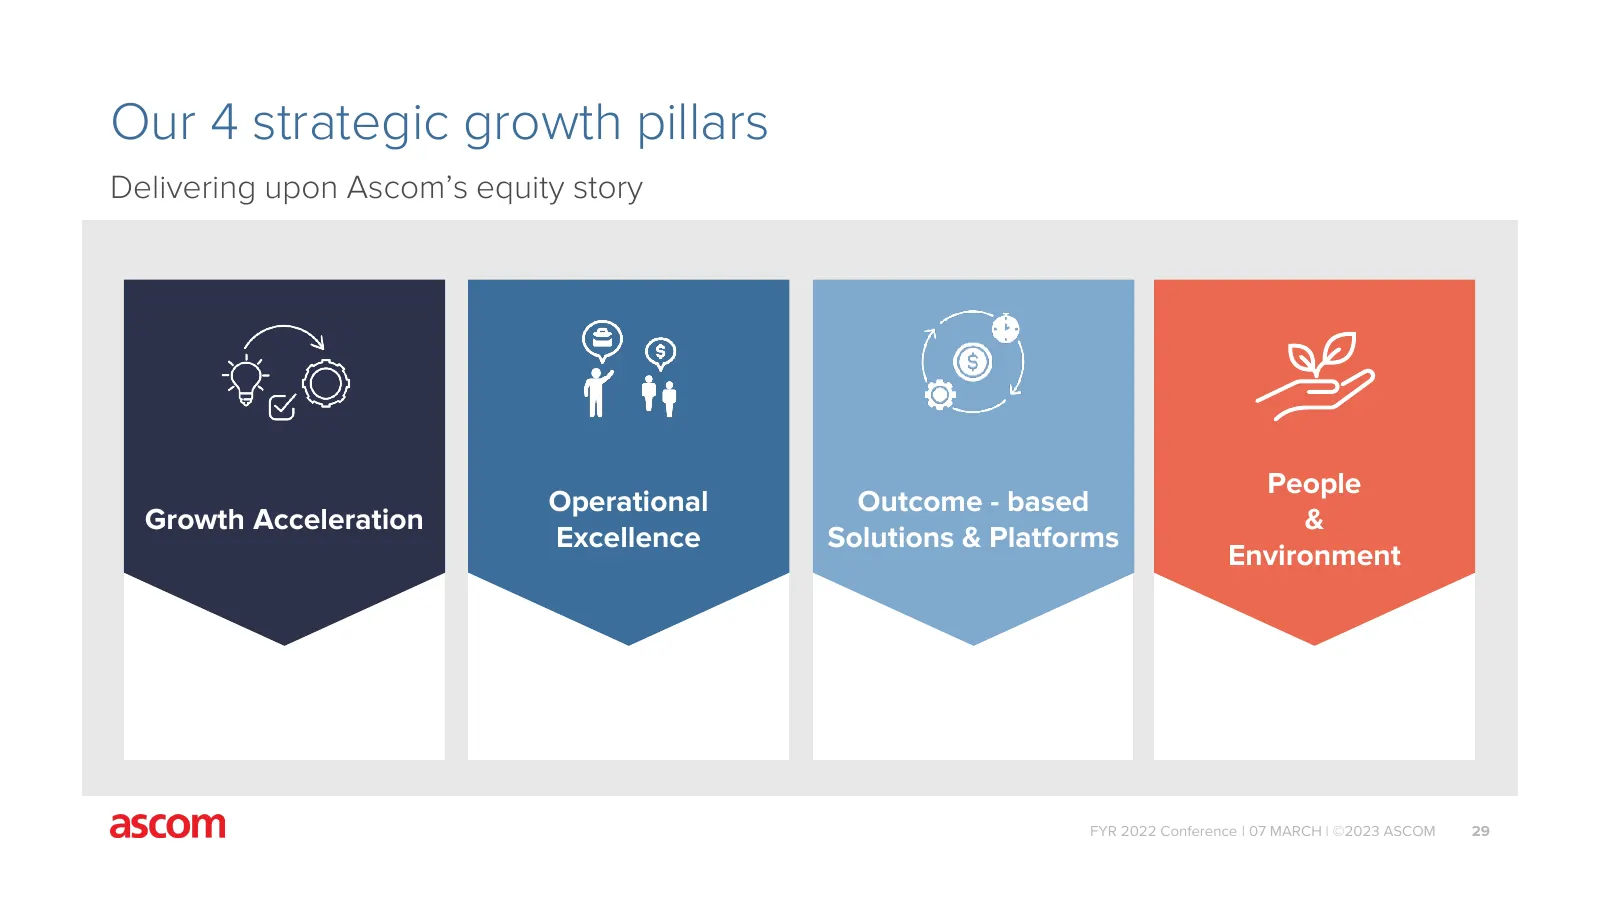
Our 4 strategic growth pillars Delivering upon Ascom’s equity story People Operational Outcome - based Growth Acceleration & Excellence Solutions & Platforms Environment FYR 2022 Conference | 07 MARCH | ©2023 ASCOM 29
Slide 30: Growth Acceleration
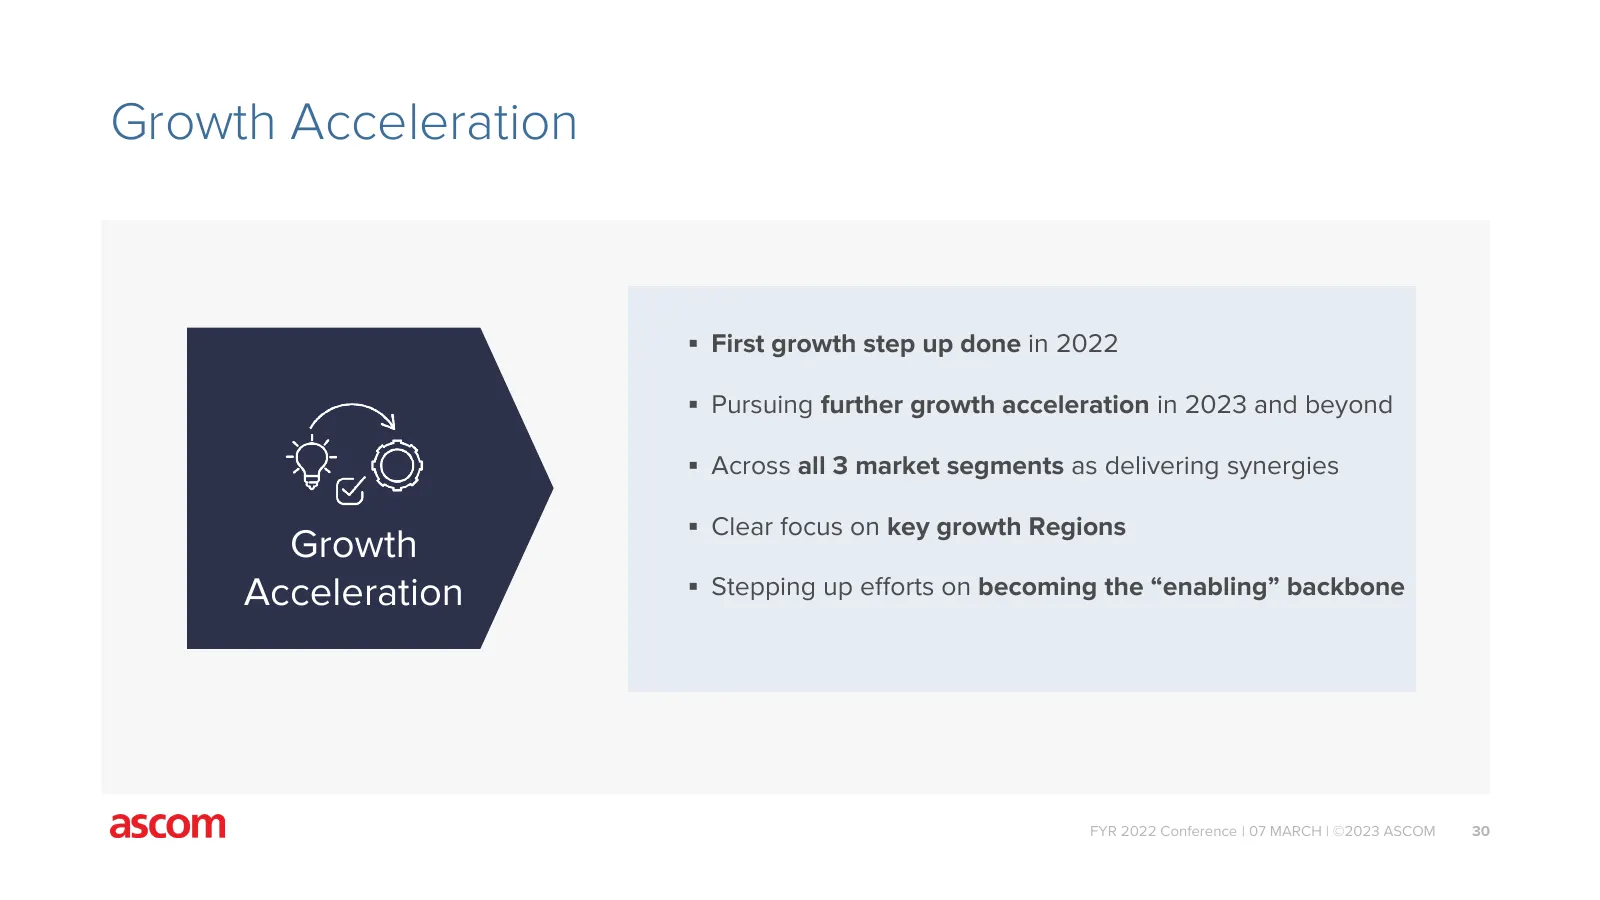
Growth Acceleration First growth step up done in 2022 Pursuing further growth acceleration in 2023 and beyond Across all 3 market segments as delivering synergies Clear focus on key growth Regions Growth Acceleration Stepping up efforts on becoming the “enabling” backbone FYR 2022 Conferen
Slide 31: Growth Acceleration: Stepping up growth & performance in 2023
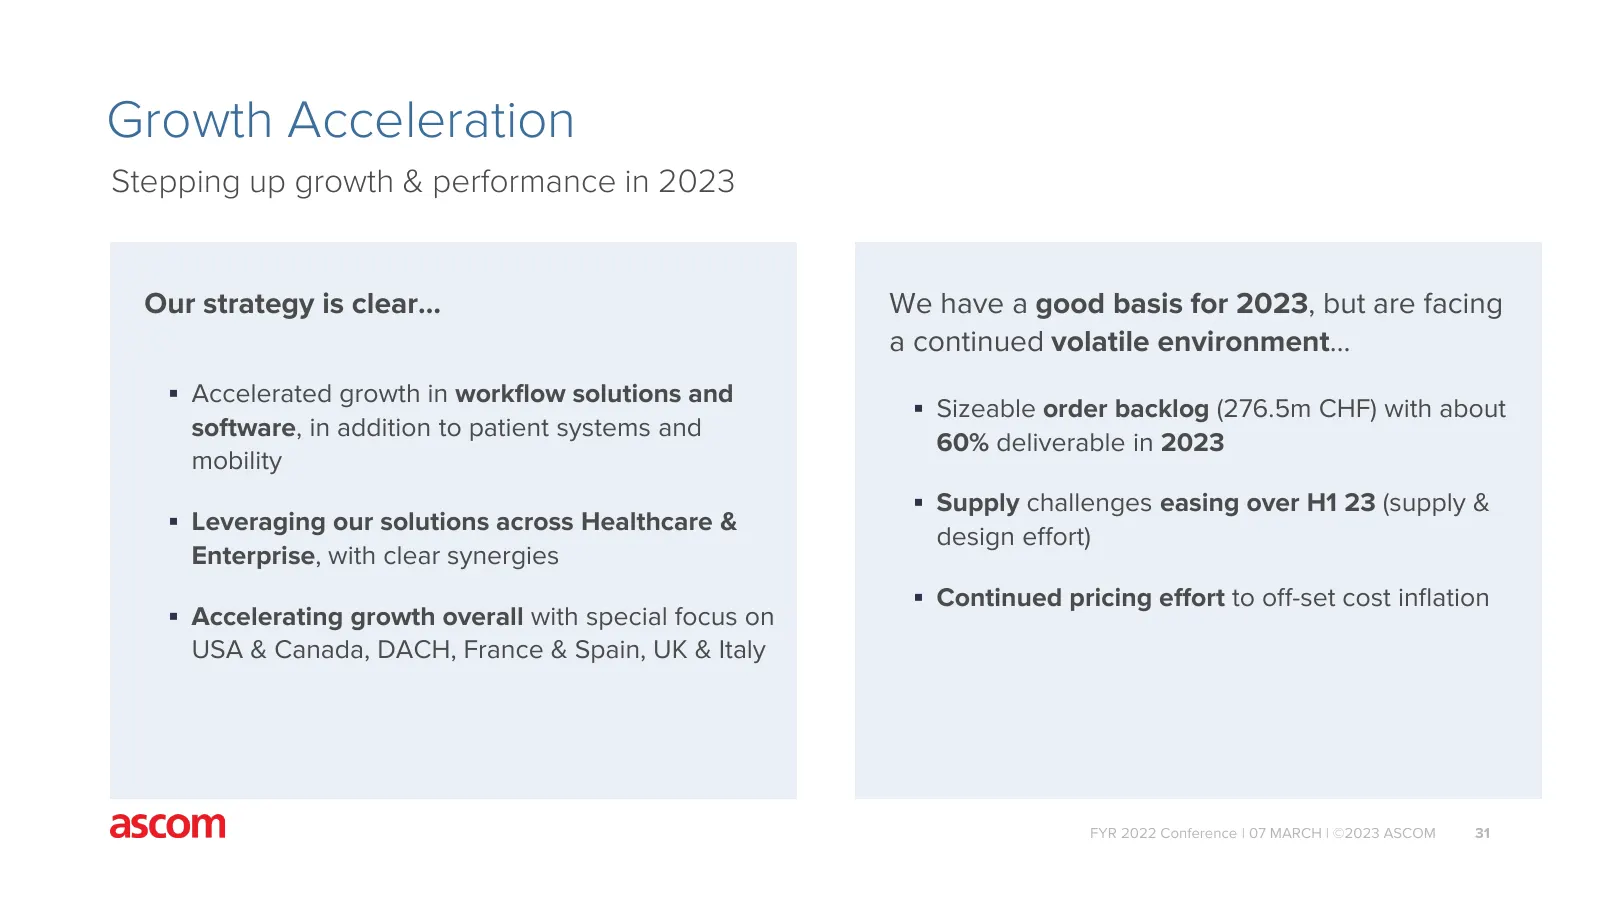
Growth Acceleration Stepping up growth & performance in 2023 Our strategy is clear… We have a good basis for 2023, but are facing a continued volatile environment… Accelerated growth in workflow solutions and Sizeable order backlog (276.5m CHF) with about software, in addition to patient systems
Slide 32: Driving Operational Excellence
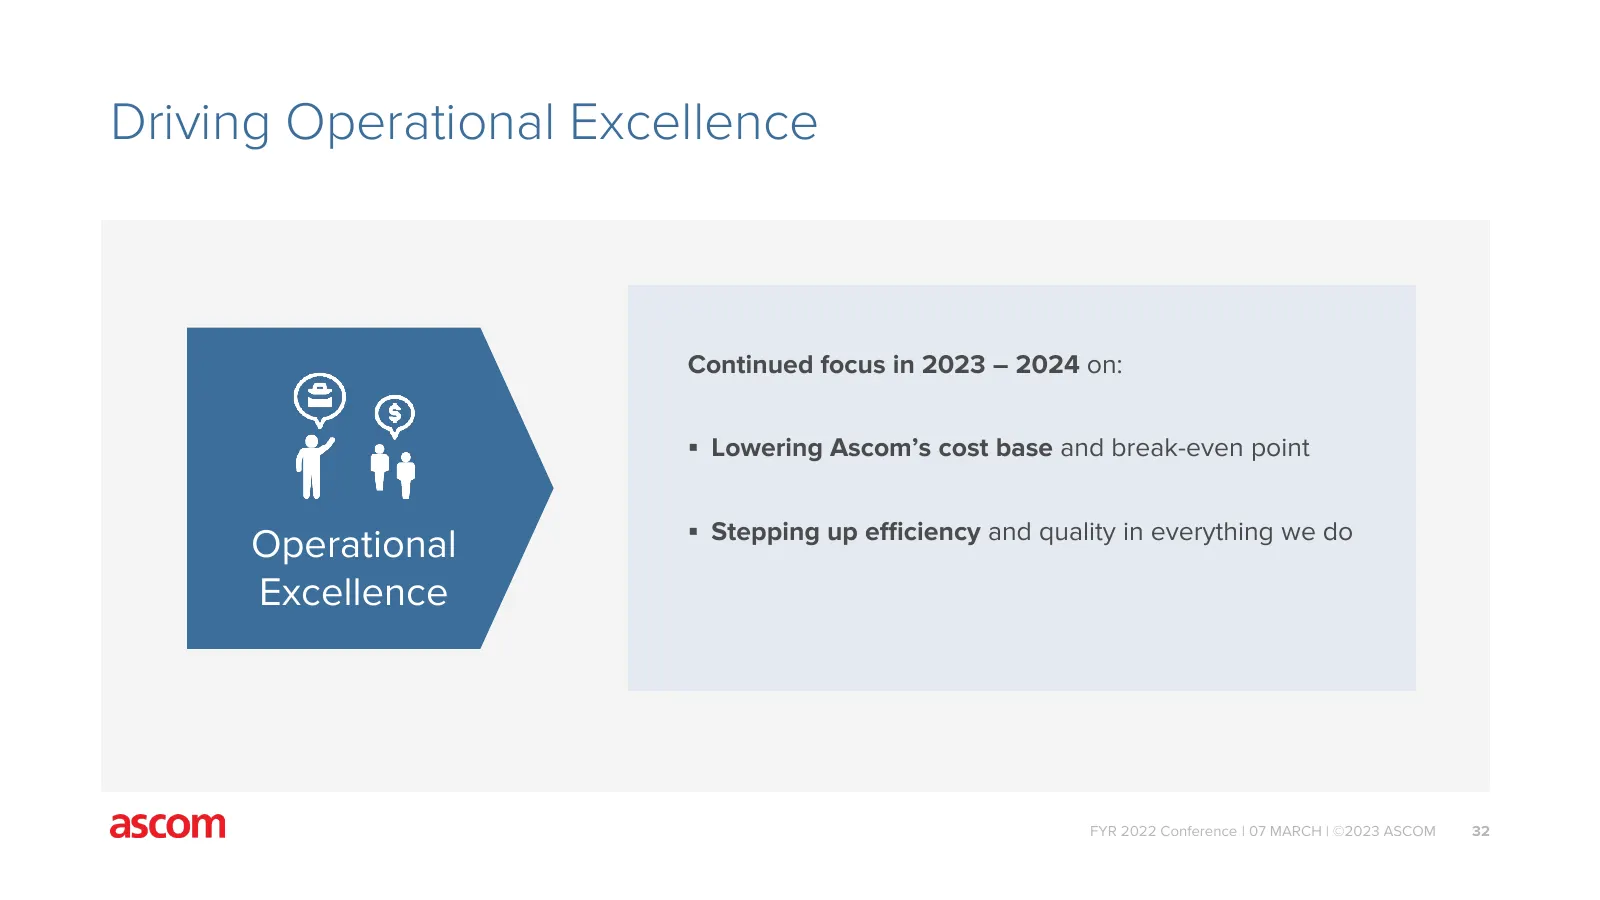
Driving Operational Excellence Continued focus in 2023 – 2024 on: Lowering Ascom’s cost base and break-even point Stepping up efficiency and quality in everything we do Operational Excellence FYR 2022 Conference | 07 MARCH | ©2023 ASCOM 32
Slide 33: Driving Operational Excellence: Shape Up initiative
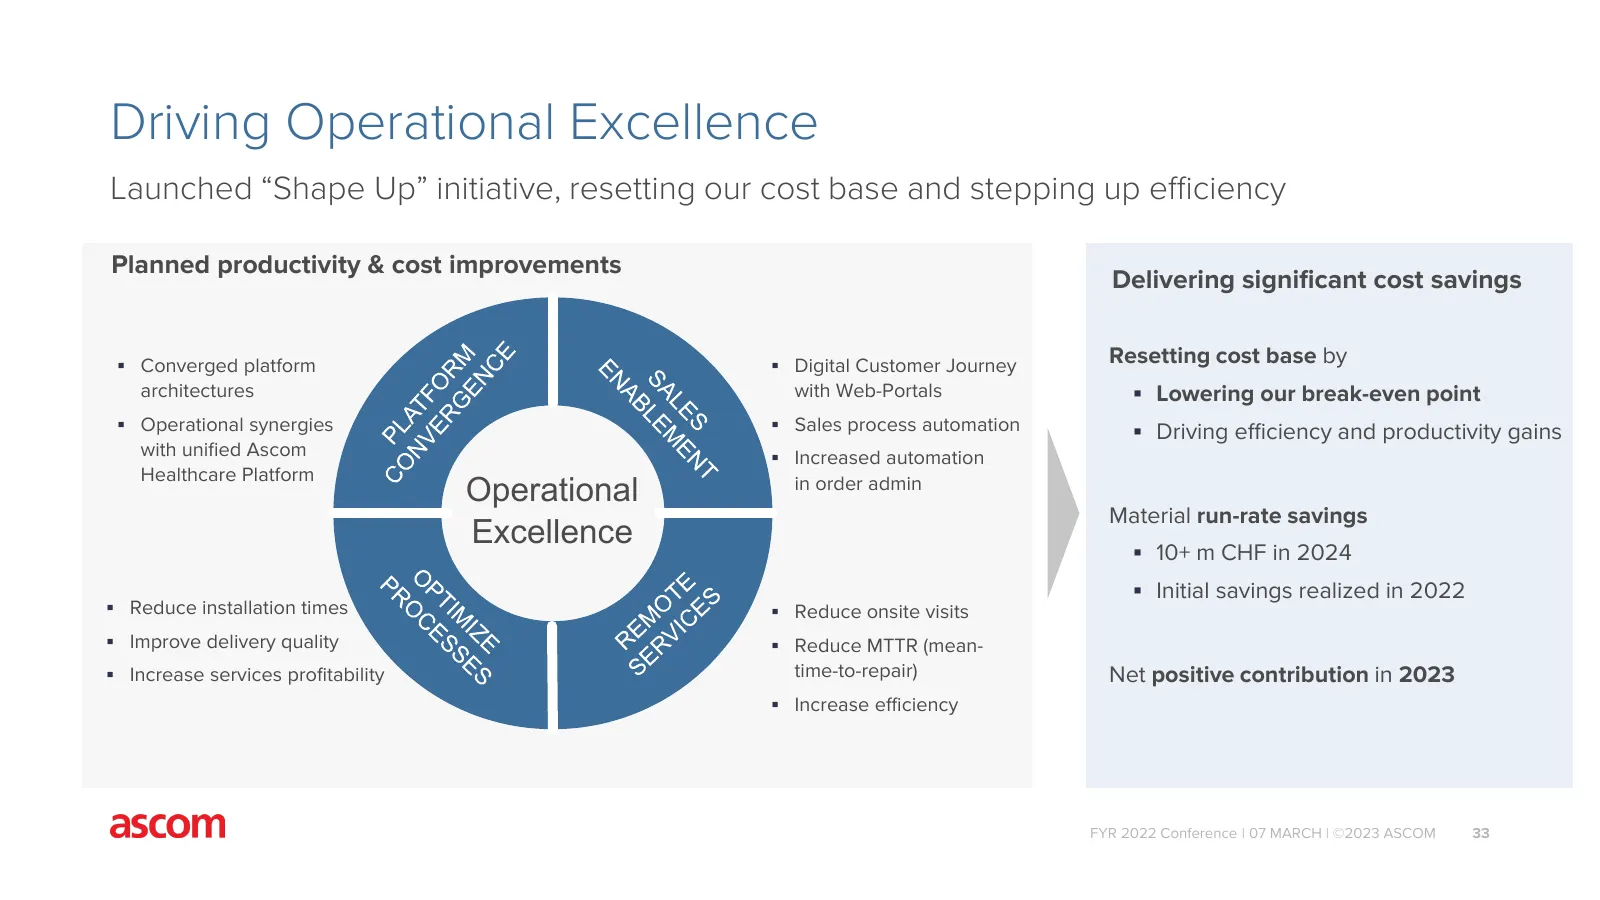
Driving Operational Excellence Launched “Shape Up” initiative, resetting our cost base and stepping up efficiency Planned productivity & cost improvements Delivering significant cost savings Converged platform Digital Customer Journey Resetting cost base by architectures with Web-Portals Lower
Slide 34: Strengthening our Position in Solutions & Software
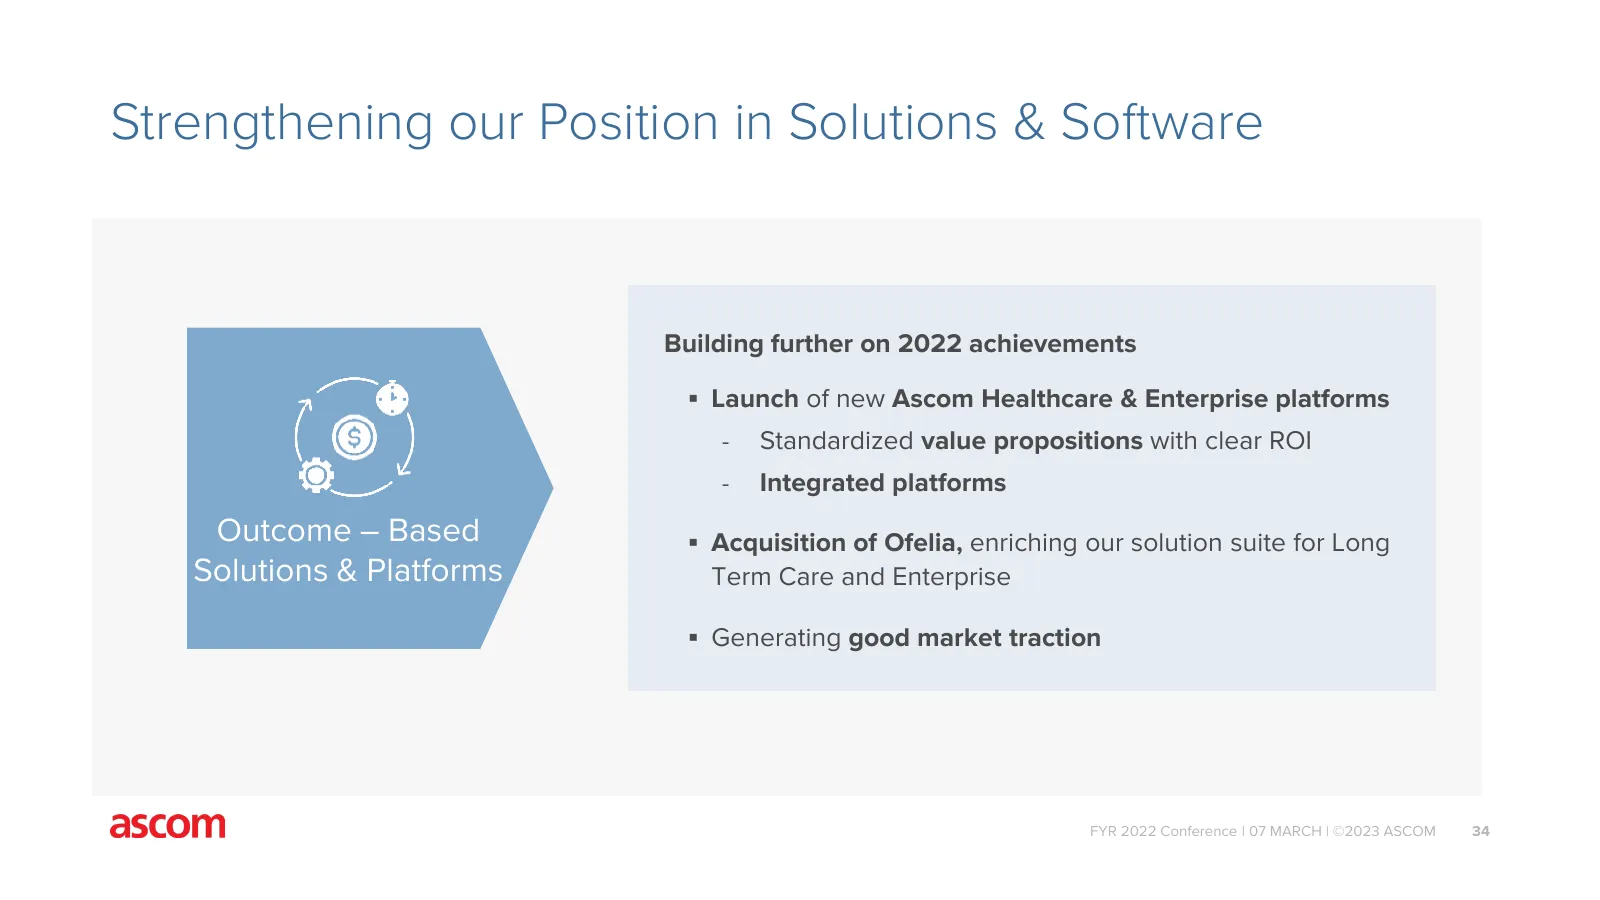
Strengthening our Position in Solutions & Software Building further on 2022 achievements Launch of new Ascom Healthcare & Enterprise platforms - Standardized value propositions with clear ROI - Integrated platforms Outcome – Based Acquisition of Ofelia, enriching our solution suite for Long Solu
Slide 35: Ascom's integrated platforms strengthen our position
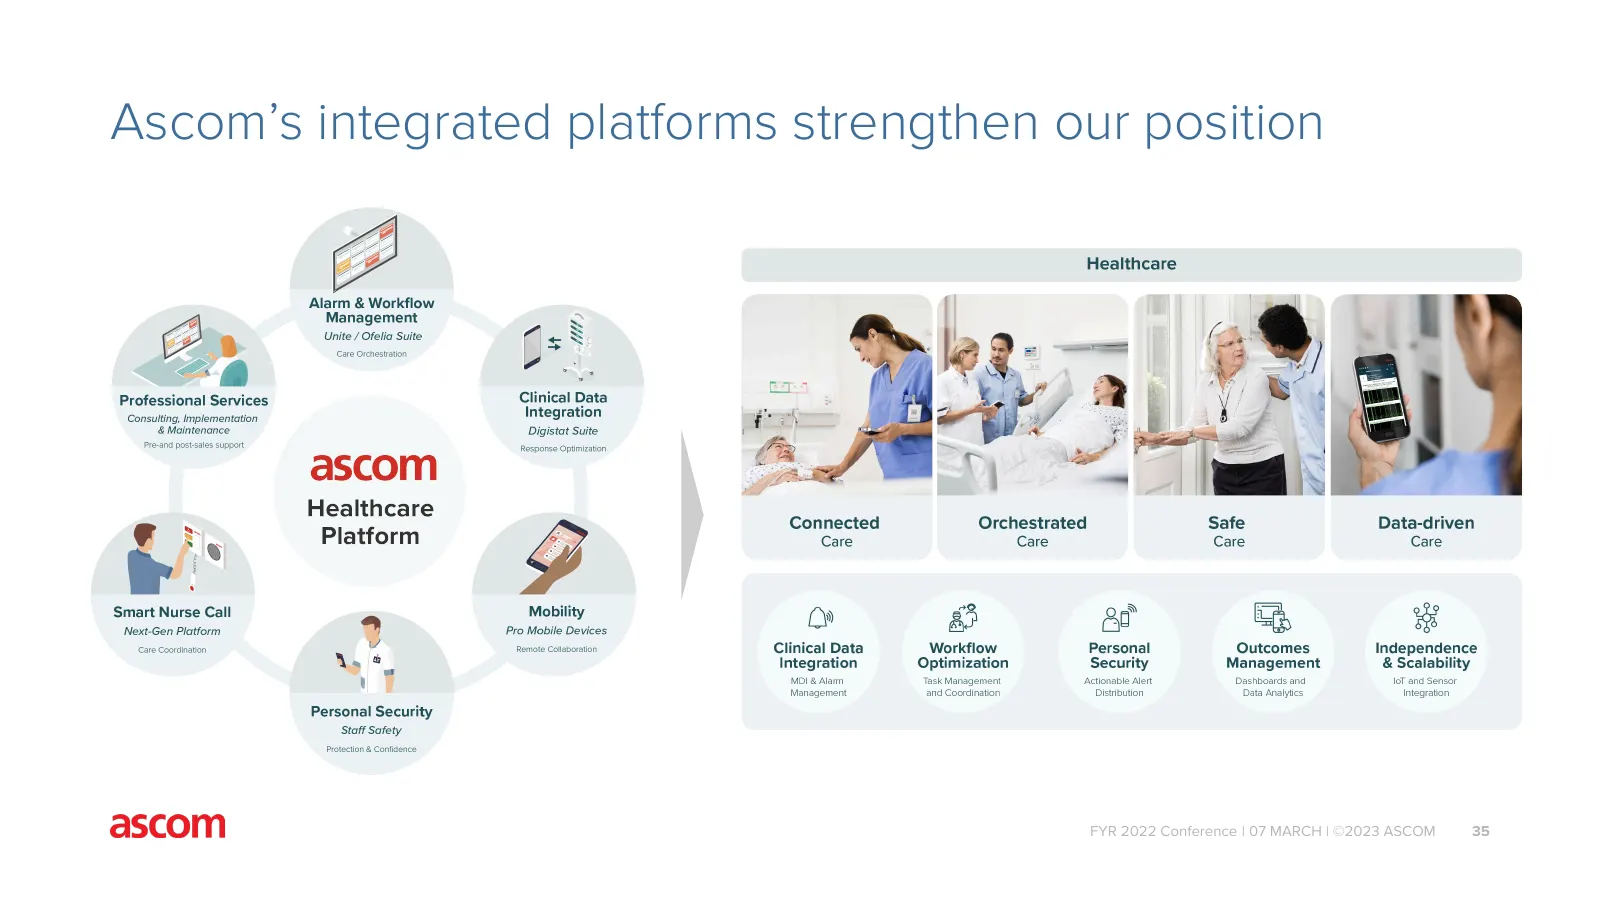
Ascom’s integrated platforms strengthen our position FYR 2022 Conference | 07 MARCH | ©2023 ASCOM 35
Slide 36: Ascom's integrated platforms strengthen our position
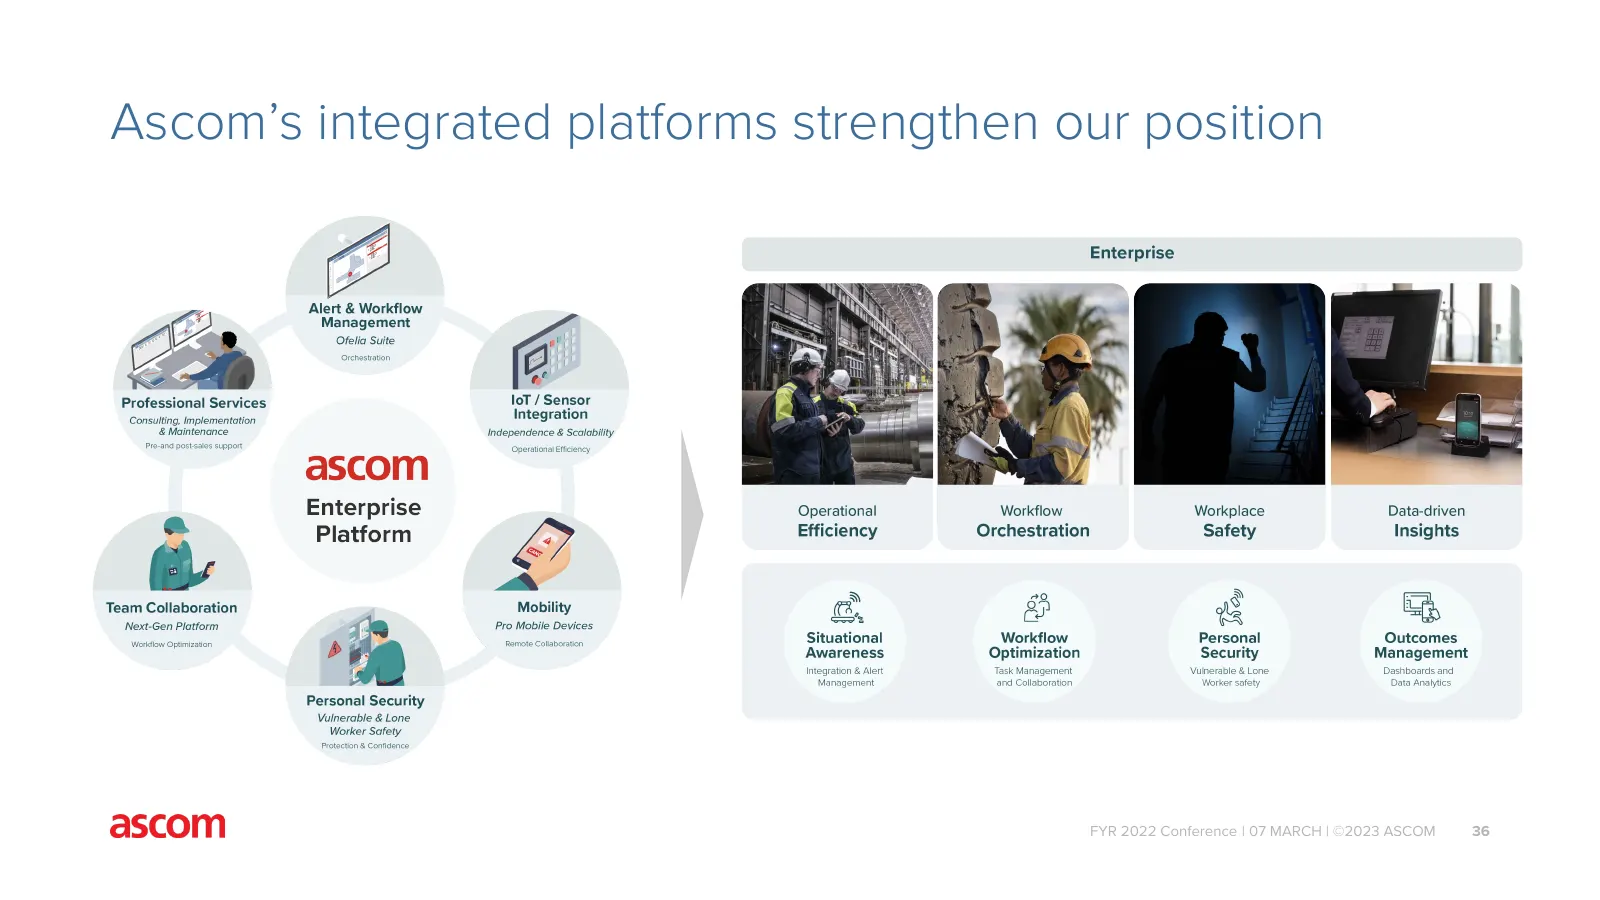
Ascom’s integrated platforms strengthen our position FYR 2022 Conference | 07 MARCH | ©2023 ASCOM 36
Slide 37: Ambitious Targets for Sustainability
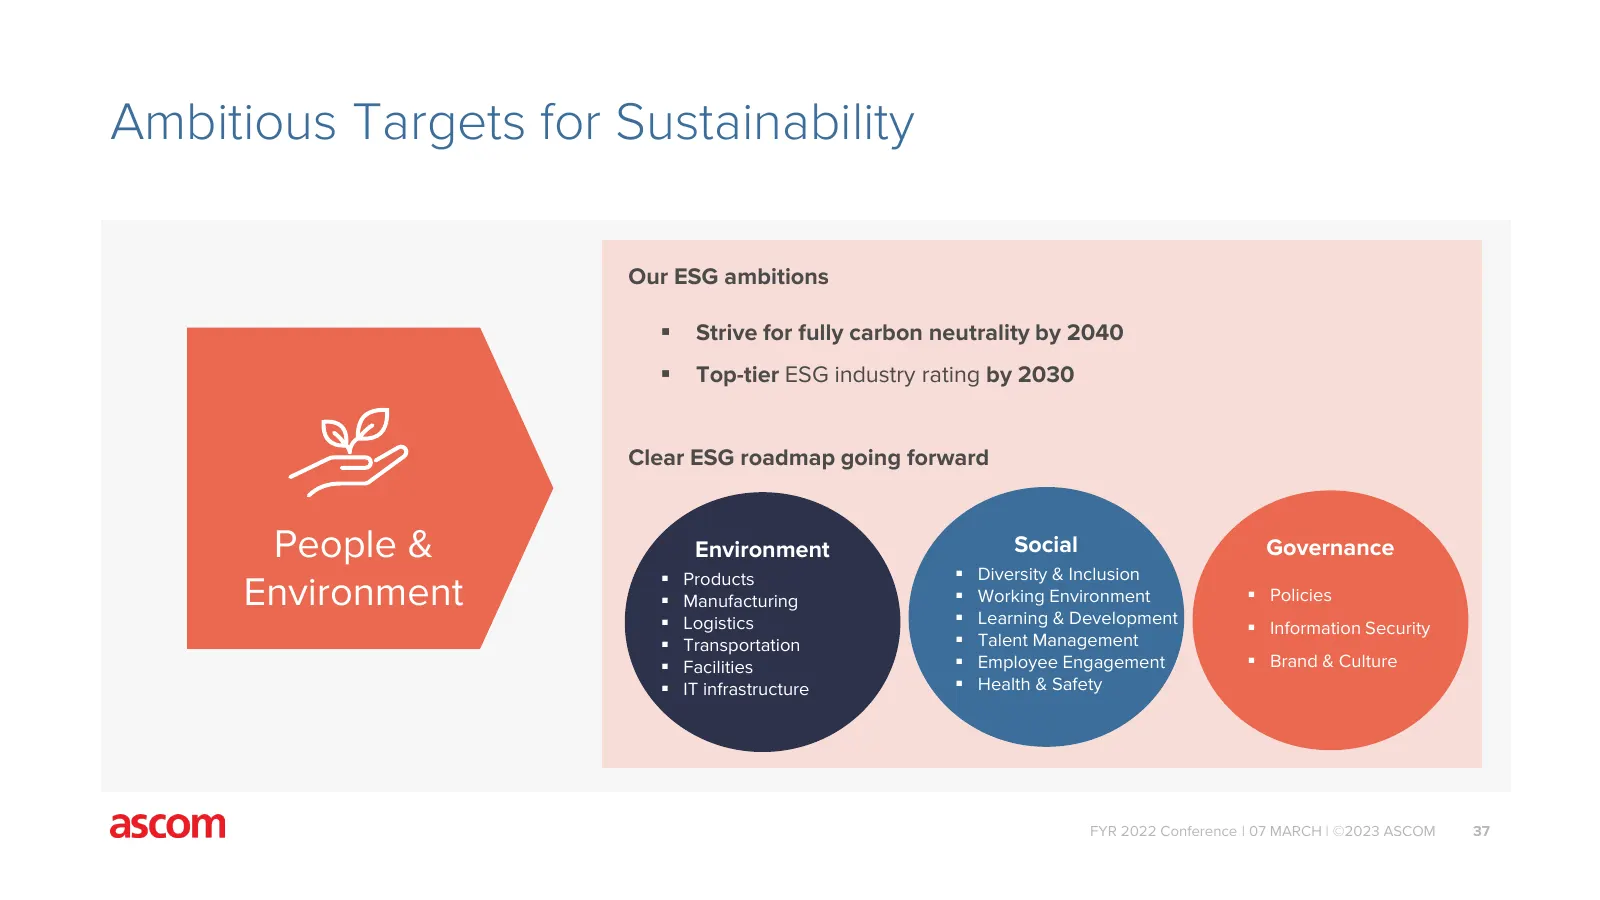
Ambitious Targets for Sustainability Our ESG ambitions Strive for fully carbon neutrality by 2040 Top-tier ESG industry rating by 2030 Clear ESG roadmap going forward People & Environment Social Governance Products Diversity & Inclusion Environment Manufacturing Working Environment Lea

Slide 38: Guidance
Guidance FYR 2022 Conference | 07 MARCH | ©2023 ASCOM 38
Slide 39: Guidance 2023
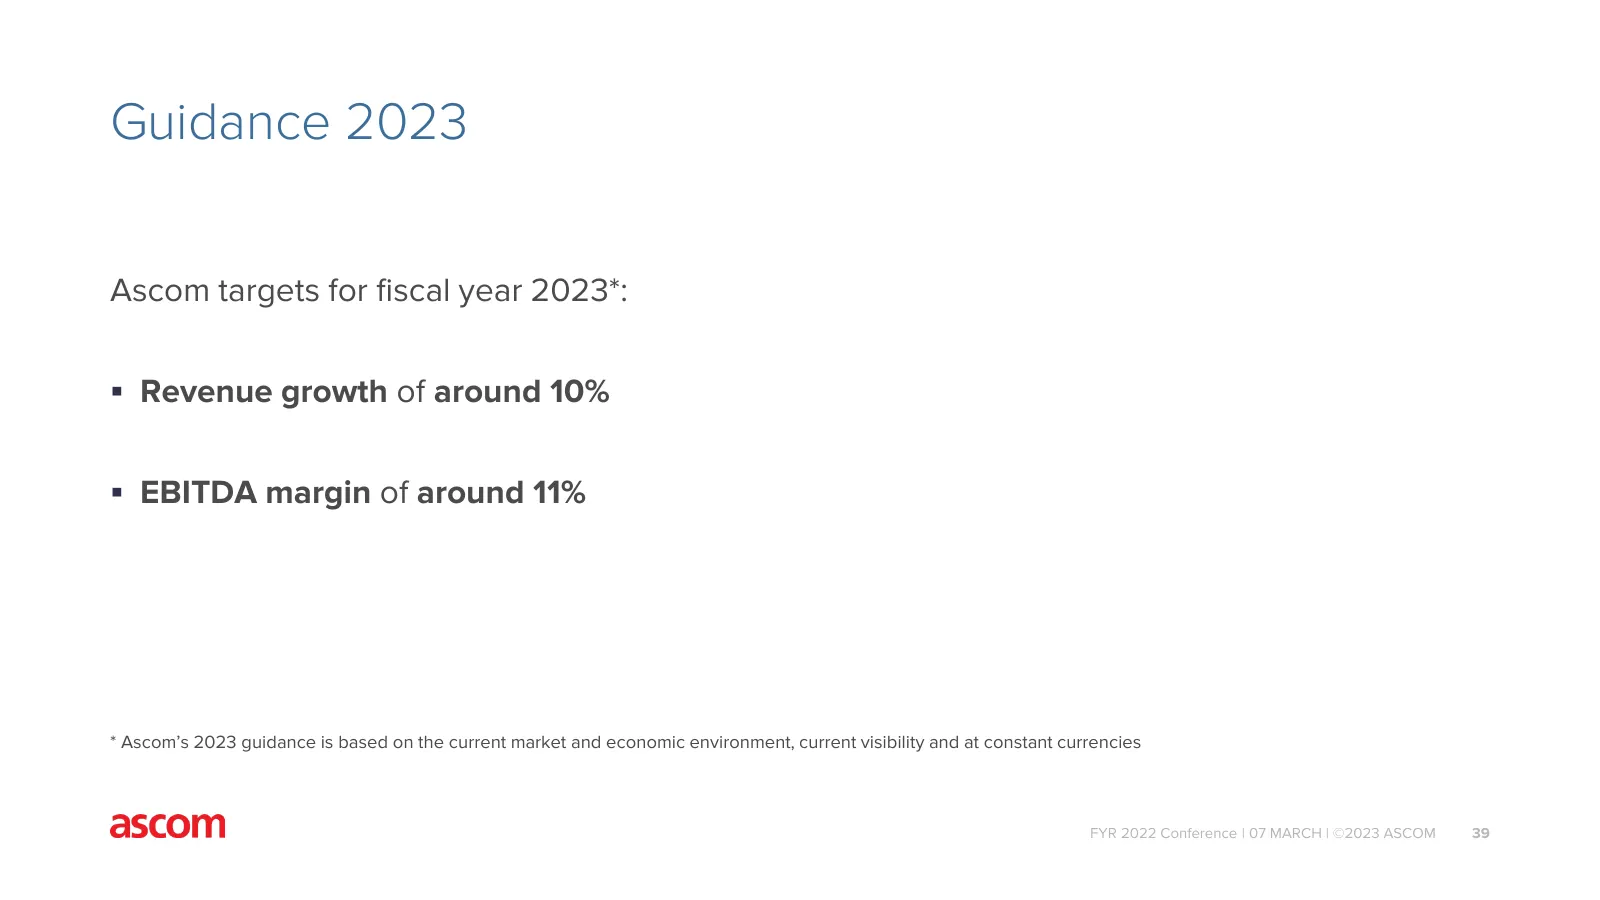
Guidance 2023 Ascom targets for fiscal year 2023*: Revenue growth of around 10% EBITDA margin of around 11% * Ascom’s 2023 guidance is based on the current market and economic environment, current visibility and at constant currencies FYR 2022 Conference | 07 MARCH | ©2023 ASCOM 39
Slide 40: Mid-term Guidance
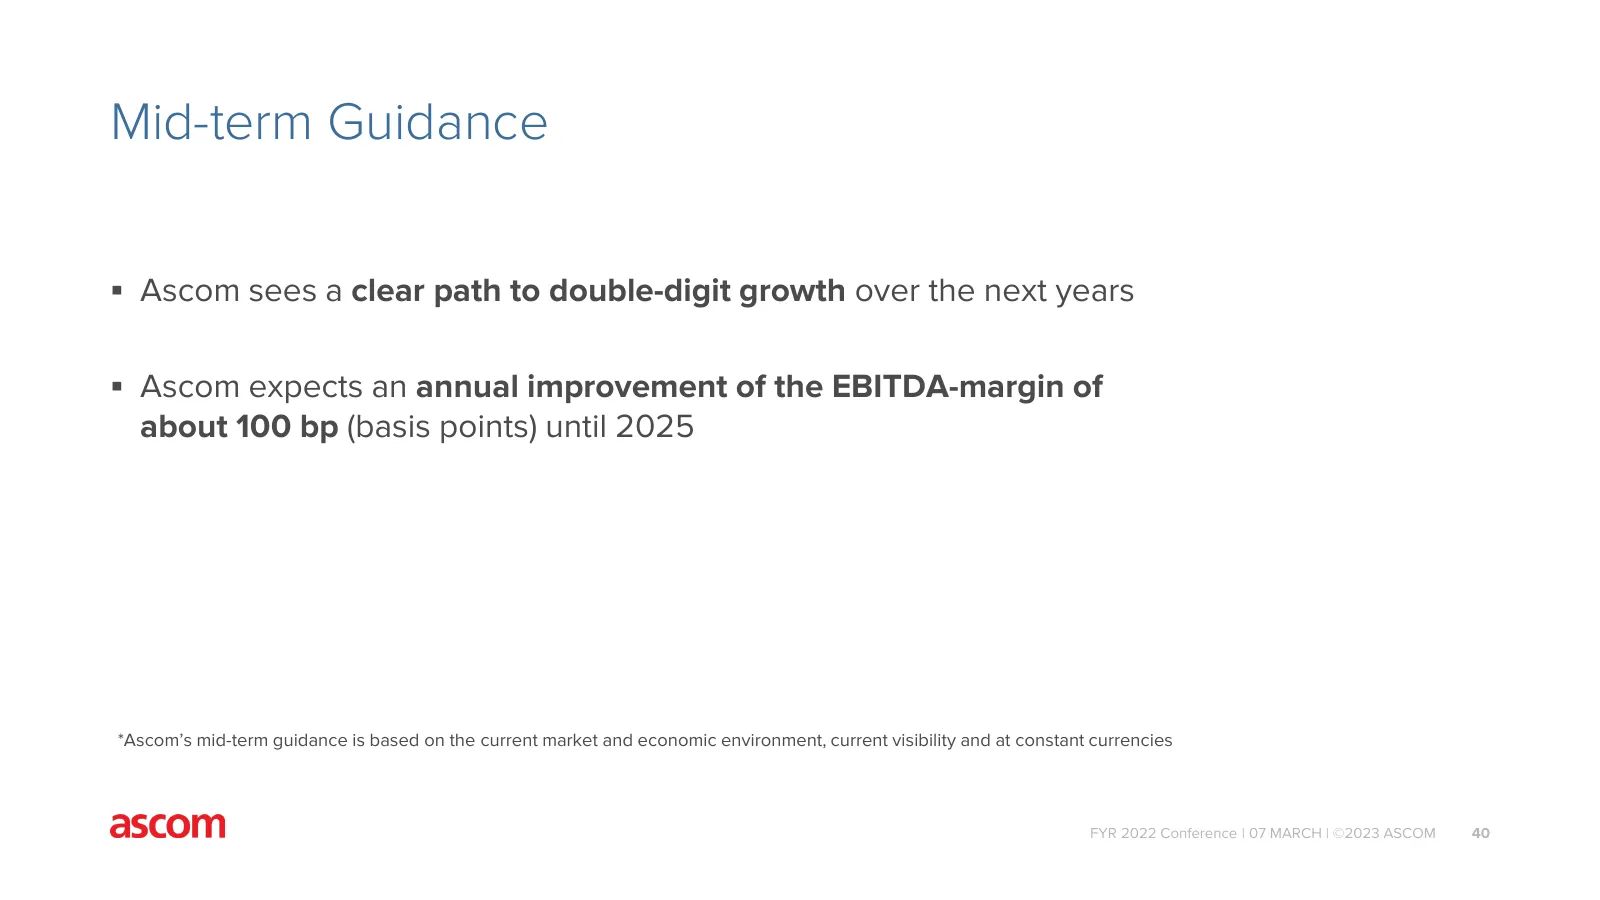
Mid-term Guidance Ascom sees a clear path to double-digit growth over the next years Ascom expects an annual improvement of the EBITDA-margin of about 100 bp (basis points) until 2025 *Ascom’s mid-term guidance is based on the current market and economic environment, current visibility and at co
Slide 41: Proposal to Shareholders for Annual General Meeting 2023
Proposal to Shareholders for Annual General Meeting 2023 Dividend proposal of CHF 20 ct per share All Board members stand for re-election FYR 2022 Conference | 07 MARCH | ©2023 ASCOM 41
Slide 42: Delivering growth & value creation
Delivering growth & value creation Ascom is active in markets with secular growth trends 2022 delivered good progress on our growth & performance ambitions We are confident to deliver the next step in 2023 - Clear growth strategy - Incremental cost & efficiency gains - Increased operating leve

Slide 43: Thank you for your attention Q&A
Thank you for your attention Q&A FYR 2022 Conference | 07 MARCH | ©2023 ASCOM 43
Source: Internet Archive copy of ascom.com