Western Asset Mortgage Capital
Western Asset Mortgage Capital — Q4 2014 Earnings Presentation
13 slides from Western Asset Mortgage Capital's earnings presentation, Feb 27, 2015
Slide 1: Fourth Quarter 2014 Investor Presentation
Fourth Quarter 2014 Investor Presentation February 27, 2015
Slide 2: Safe Harbor Statement
Safe Harbor Statement We make forward-looking statements in this presentation that are subject to risks and uncertainties. These forward-looking statements include information about possible or assumed future results of our business, financial condition, liquidity, results of operations, plans and o
Slide 3: Fourth Quarter Financial Highlights
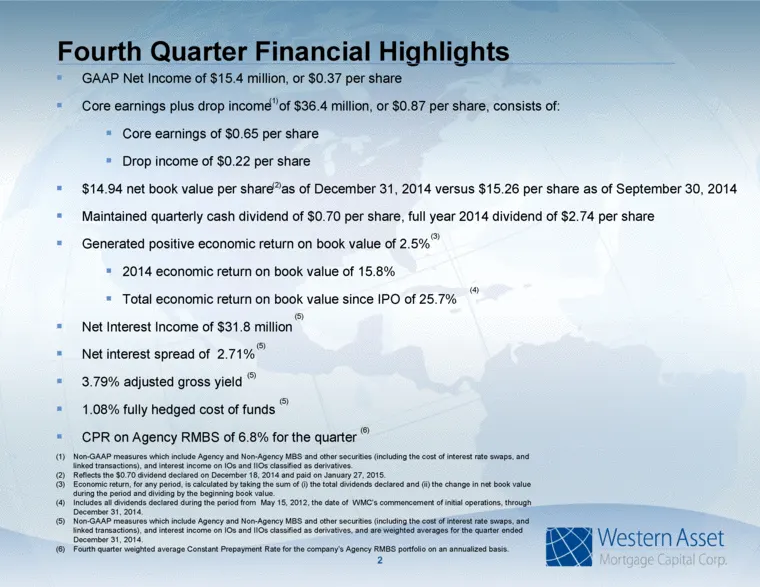
Fourth Quarter Financial Highlights GAAP Net Income of $15.4 million, or $0.37 per share Core earnings plus drop income of $36.4 million, or $0.87 per share, consists of: Core earnings of $0.65 per share Drop income of $0.22 per share $14.94 net book value per share as of December 31, 2014 versus $1
Slide 4: 2014: An Improved Market for Mortgage Assets
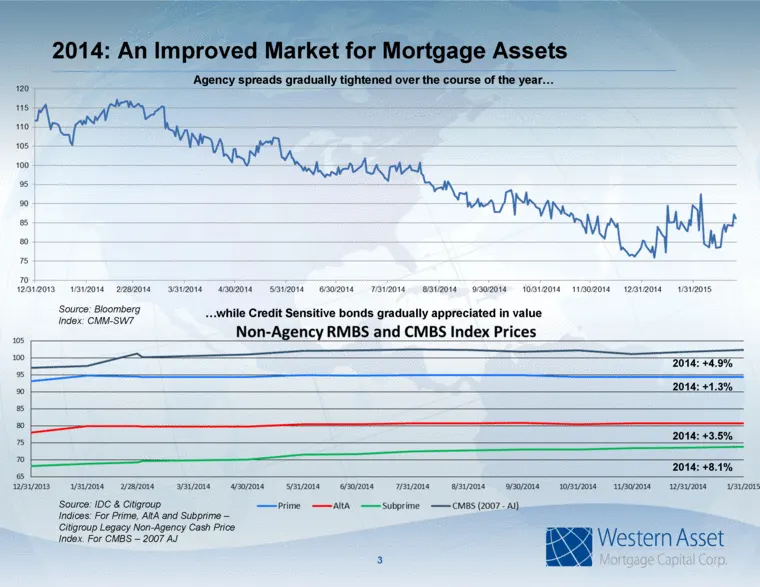
2014: An Improved Market for Mortgage Assets 3 Agency spreads gradually tightened over the course of the year while Credit Sensitive bonds gradually appreciated in value Source: IDC & Citigroup Indices: For Prime, AltA and Subprime – Citigroup Legacy Non-Agency Cash Price Index. For CMBS – 2007 AJ S
Slide 5: Interest Rate Volatility has Recently Increased
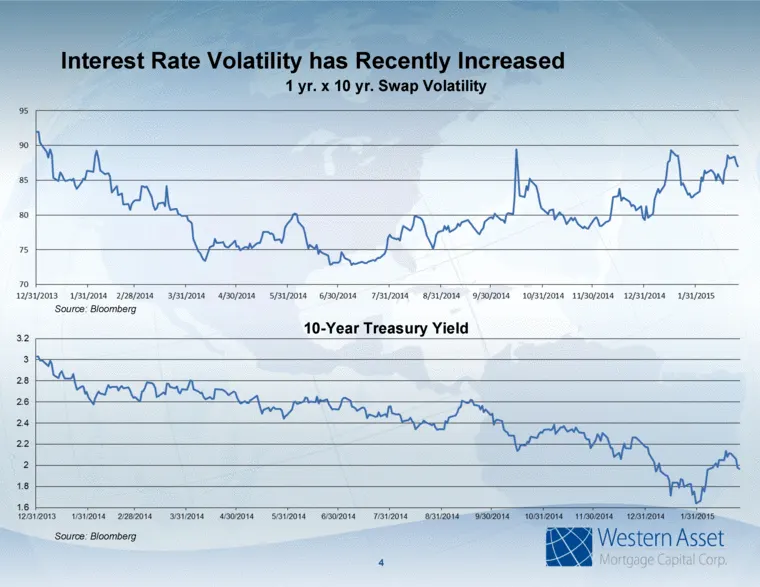
Interest Rate Volatility has Recently Increased 1 yr. x 10 yr. Swap Volatility 4 Source: Bloomberg 10-Year Treasury Yield Source: Bloomberg
Slide 6: Portfolio Composition as of December 31, 2014
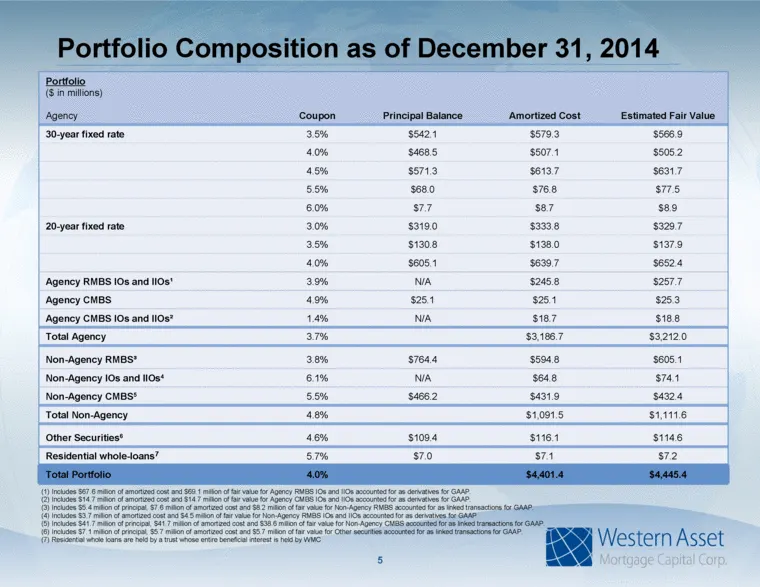
5 Portfolio Composition as of December 31, 2014 Portfolio ($ in millions) Agency Coupon Principal Balance Amortized Cost Estimated Fair Value 30-year fixed rate 3.5% $542.1 $579.3 $566.9 4.0% $468.5 $507.1 $505.2 4.5% $571.3 $613.7 $631.7 5.5% $68.0 $76.8 $77.5 6.0% $7.7 $8.7 $8.9 20-year fixed rate
Slide 7: Portfolio Breakdown as of December 31, 2014
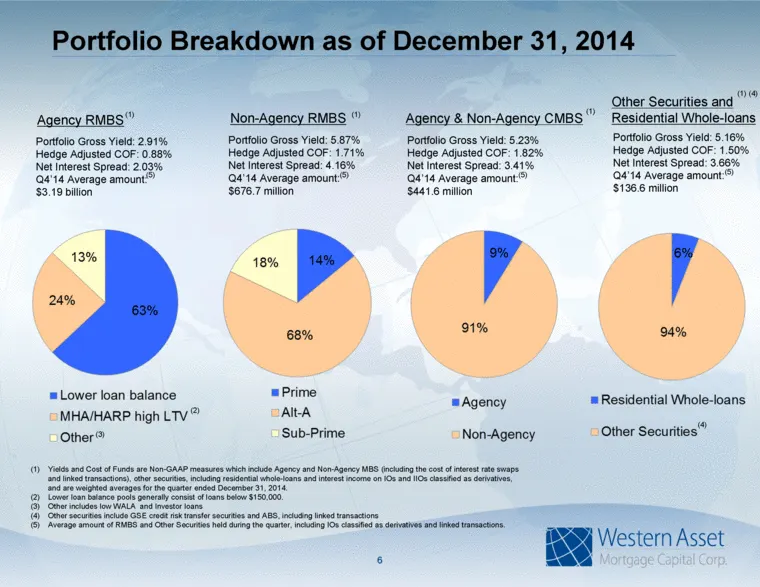
Portfolio Breakdown as of December 31, 2014 6 Agency RMBS Non-Agency RMBS Agency & Non-Agency CMBS Portfolio Gross Yield: 2.91% Hedge Adjusted COF: 0.88% Net Interest Spread: 2.03% Q4’14 Average amount: $3.19 billion Portfolio Gross Yield: 5.87% Hedge Adjusted COF: 1.71% Net Interest Spread: 4.16% Q
Slide 8: Leverage Ratio and Adjusted Leverage
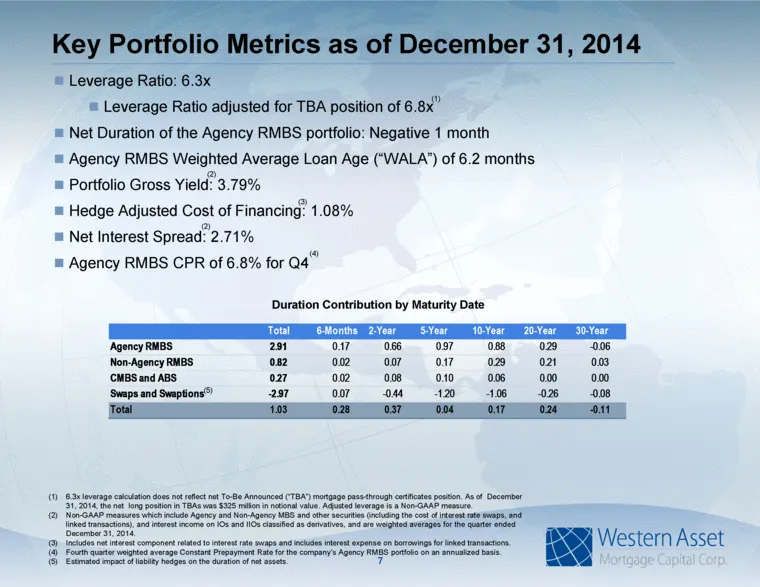
6.3x leverage calculation does not reflect net To-Be Announced (“TBA”) mortgage pass-through certificates position. As of December 31, 2014, the net long position in TBAs was $325 million in notional value. Adjusted leverage is a Non-GAAP measure. Non-GAAP measures which include Agency and Non-Agenc
Slide 9: Financing Summary
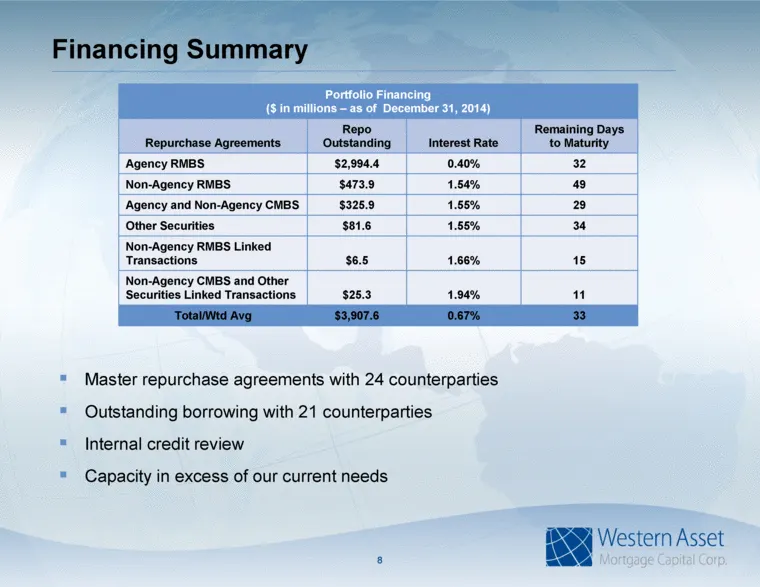
Financing Summary Portfolio Financing ($ in millions – as of December 31, 2014) Repurchase Agreements Repo Outstanding Interest Rate Remaining Days to Maturity Agency RMBS $2,994.4 0.40% 32 Non-Agency RMBS $473.9 1.54% 49 Agency and Non-Agency CMBS $325.9 1.55% 29 Other Securities $81.6 1.55% 34 Non
Slide 10: Hedging Summary
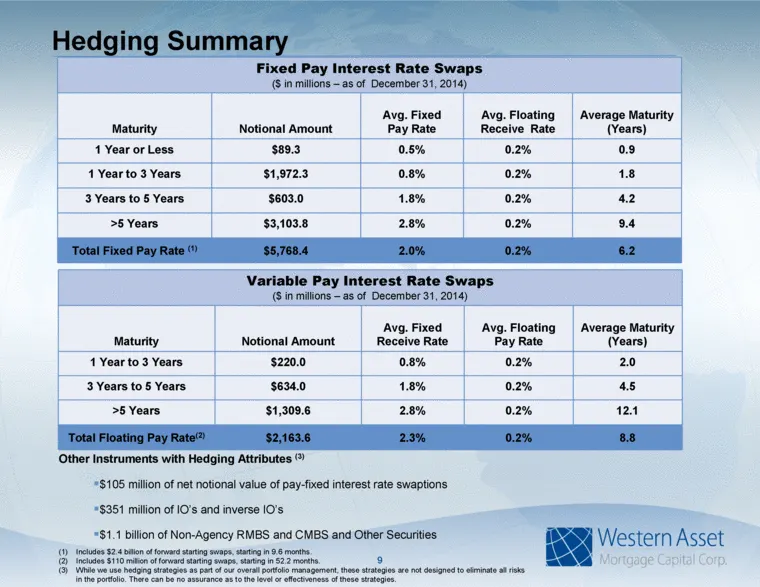
Hedging Summary 9 Includes $2.4 billion of forward starting swaps, starting in 9.6 months. Includes $110 million of forward starting swaps, starting in 52.2 months. While we use hedging strategies as part of our overall portfolio management, these strategies are not designed to eliminate all risks i
Slide 11: Portfolio Strategy and Dynamics
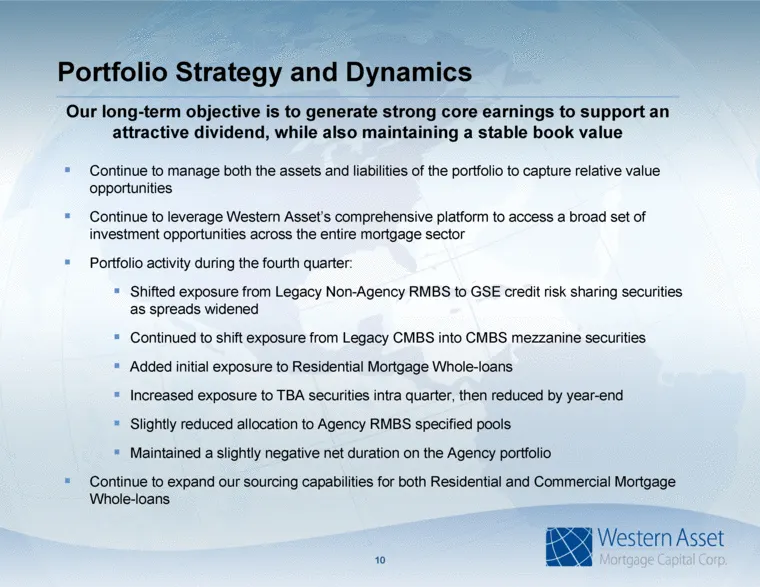
Portfolio Strategy and Dynamics Continue to manage both the assets and liabilities of the portfolio to capture relative value opportunities Continue to leverage Western Asset’s comprehensive platform to access a broad set of investment opportunities across the entire mortgage sector Portfolio activi
Slide 12: Investment Highlights
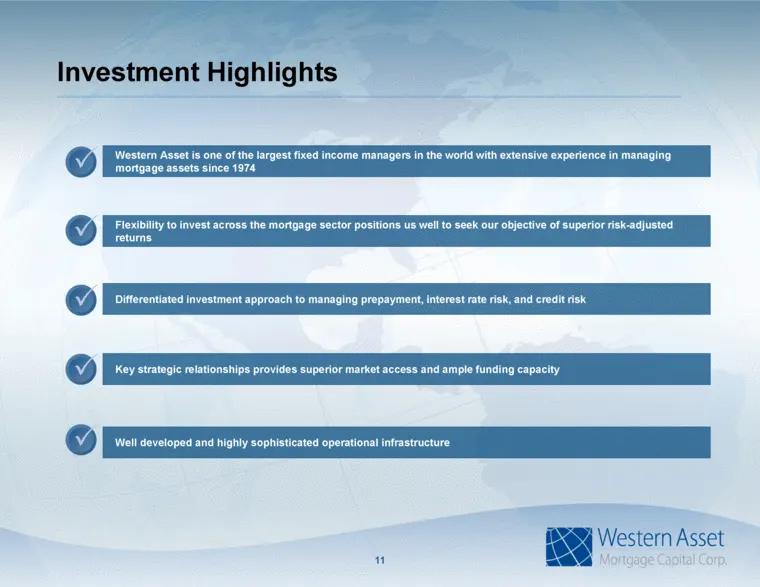
Investment Highlights Western Asset is one of the largest fixed income managers in the world with extensive experience in managing mortgage assets since 1974 Differentiated investment approach to managing prepayment, interest rate risk, and credit risk Flexibility to invest across the mortgage secto
Slide 13: Contact Information
Contact Information 12 Western Asset Mortgage Capital Corporation c/o Financial Profiles, Inc. 11601 Wilshire Blvd., Suite 1920 Los Angeles, CA 90025 www.westernassetmcc.com Investor Relations Contact: Larry Clark Tel: (310) 622-8223 lclark@finprofiles.com
Source: SEC EDGAR · 8-K filed Feb 27, 2015
More decks from Western Asset Mortgage Capital
 Merger or Acquisition (August 2023)9 slides · Aug 9, 2023
 Q2 2023 Earnings Presentation32 slides · Aug 8, 2023
 Merger or Acquisition (July 2023)9 slides · Jul 13, 2023
 Merger or Acquisition (June 2023)16 slides · Jun 28, 2023
 Q1 2023 Earnings Presentation33 slides · May 4, 2023
 Q4 2022 Earnings Presentation34 slides · Mar 2, 2023