Fauquier Bankshares — Shareholder Meeting (May 2009)
33 slides from Fauquier Bankshares's shareholder meeting presentation, May 19, 2009
Slide 1: Annual Shareholders' Meeting
_____________________ FAUQUIER BANKSHARES, INC. ANNUAL SHAREHOLDERS' MEETING Deeply rooted in our community. May 19, 2009
Slide 2: Safe Harbor Statement
Safe Harbor Statement Today's presentations may include forward-looking statements. These statements represent the company's beliefs regarding future events that, by their nature, are uncertain and outside of the company's control. The company's actual results and financial condition may differ, pos
Slide 3: Financial Condition
Financial Condition FAUQUIER BANKSHARES, INC. 3
Slide 4: Management Focus On Growth
Management Focus On Growth 4 FAUQUIER BANKSHARES, INC. Quality Growth Loan Portfolio Core Transaction Deposits Non-Interest Fee Income Wealth Management and Financial Planning
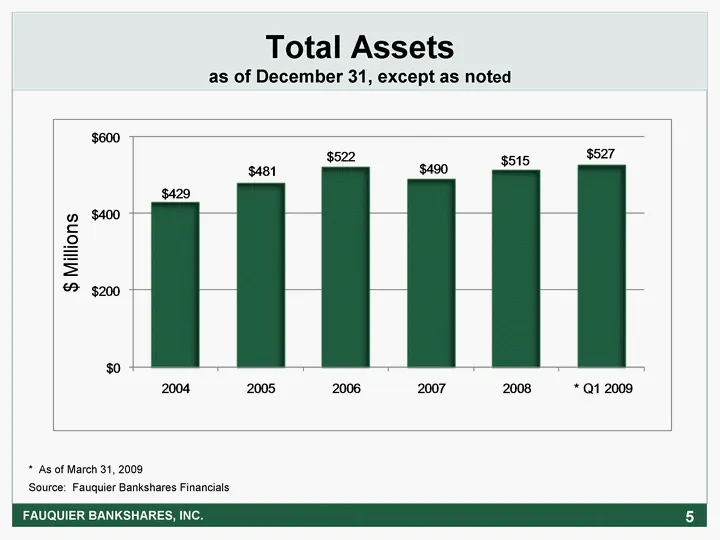
Slide 5: Total Assets
5 Total Assets as of December 31, except as noted FAUQUIER BANKSHARES, INC. Source: Fauquier Bankshares Financials * As of March 31, 2009
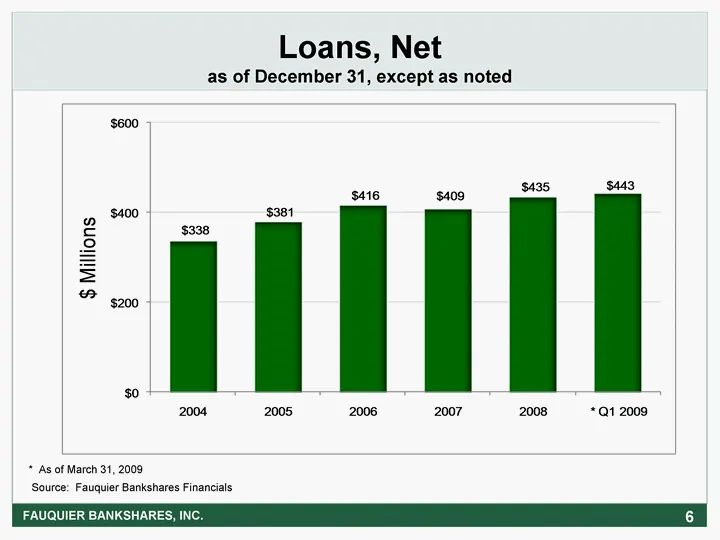
Slide 6: Loans, Net
6 Loans, Net as of December 31, except as noted FAUQUIER BANKSHARES, INC. Source: Fauquier Bankshares Financials * As of March 31, 2009
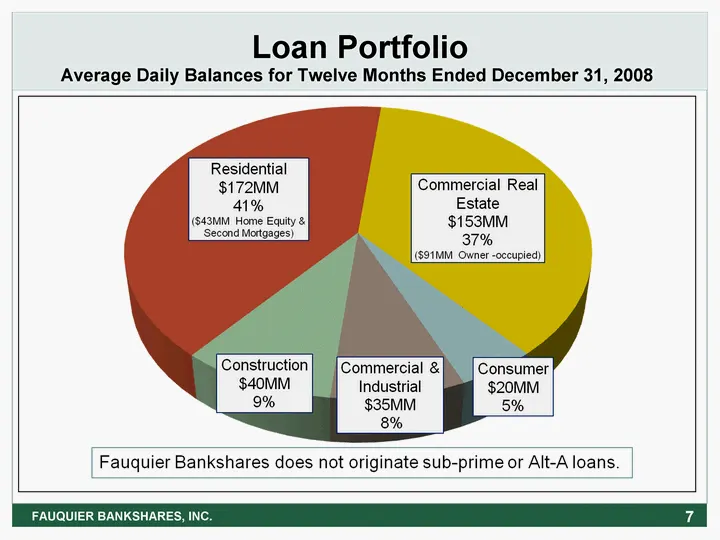
Slide 7: Loan Portfolio
7 Loan Portfolio Loan Portfolio Average Daily Balances for Twelve Months Ended December 31, 2008 FAUQUIER BANKSHARES, INC.
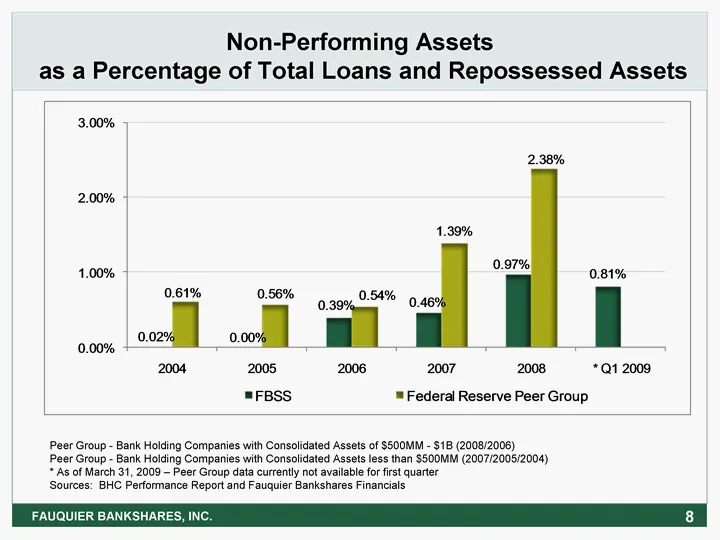
Slide 8: Non-Performing Assets as a Percentage of Total Loans
8 Non-Performing Assets as a Percentage of Total Loans and Repossessed Assets FAUQUIER BANKSHARES, INC. Peer Group - Bank Holding Companies with Consolidated Assets of $500MM - $1B (2008/2006) Peer Group - Bank Holding Companies with Consolidated Assets less than $500MM (2007/2005/2004) * As of Marc
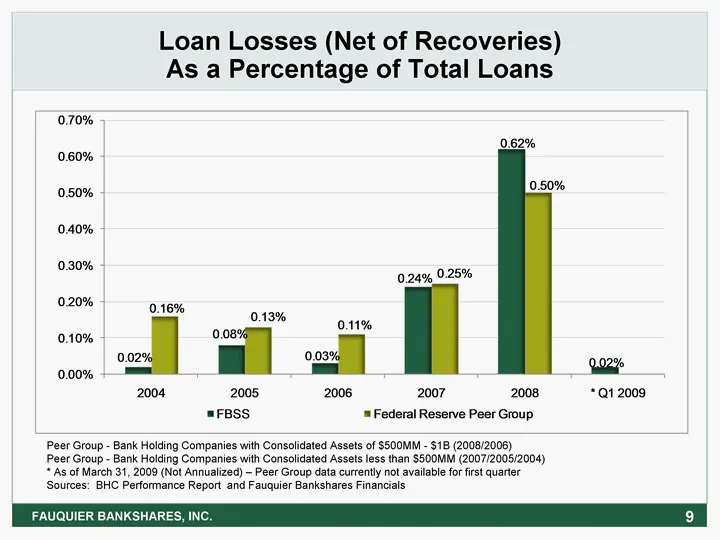
Slide 9: Loan Losses as a Percentage of Total Loans
9 Loan Losses (Net of Recoveries) As a Percentage of Total Loans FAUQUIER BANKSHARES, INC. Peer Group - Bank Holding Companies with Consolidated Assets of $500MM - $1B (2008/2006) Peer Group - Bank Holding Companies with Consolidated Assets less than $500MM (2007/2005/2004) * As of March 31, 2009 (N
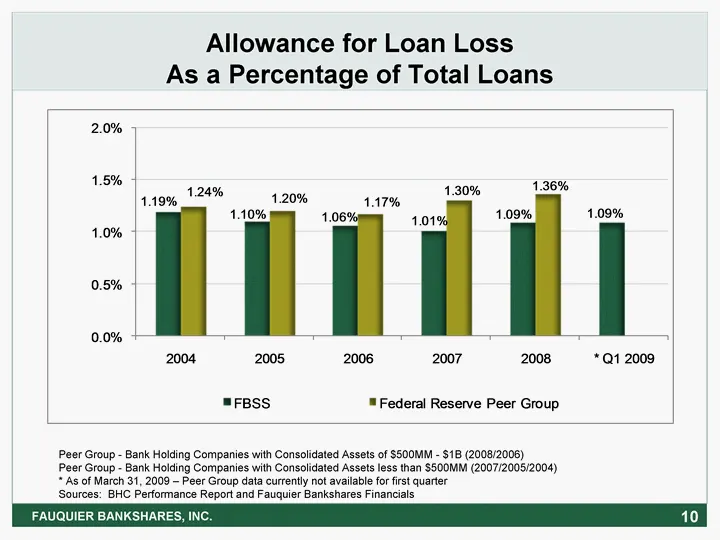
Slide 10: Allowance for Loan Loss as a Percentage of Total Loans
10 Peer Group - Bank Holding Companies with Consolidated Assets of $500MM - $1B (2008/2006) Peer Group - Bank Holding Companies with Consolidated Assets less than $500MM (2007/2005/2004) * As of March 31, 2009 - Peer Group data currently not available for first quarter Sources: BHC Performance Repor
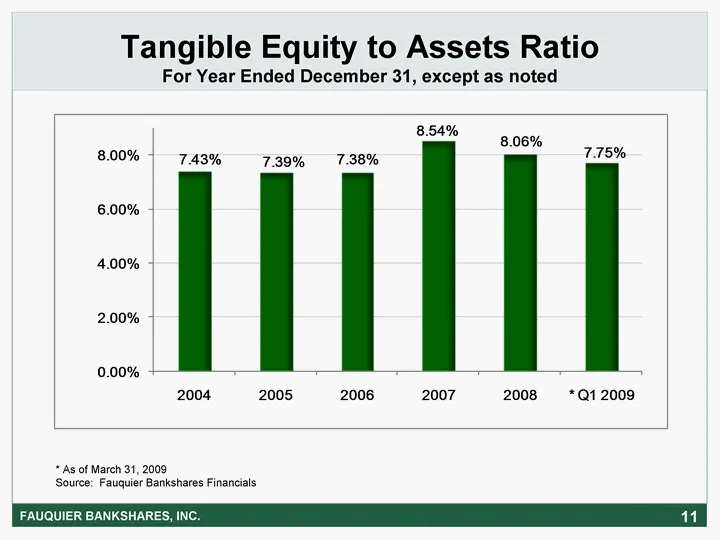
Slide 11: Tangible Equity to Assets Ratio
Tangible Equity to Assets Ratio For Year Ended December 31, except as noted 11 FAUQUIER BANKSHARES, INC. * As of March 31, 2009 Source: Fauquier Bankshares Financials
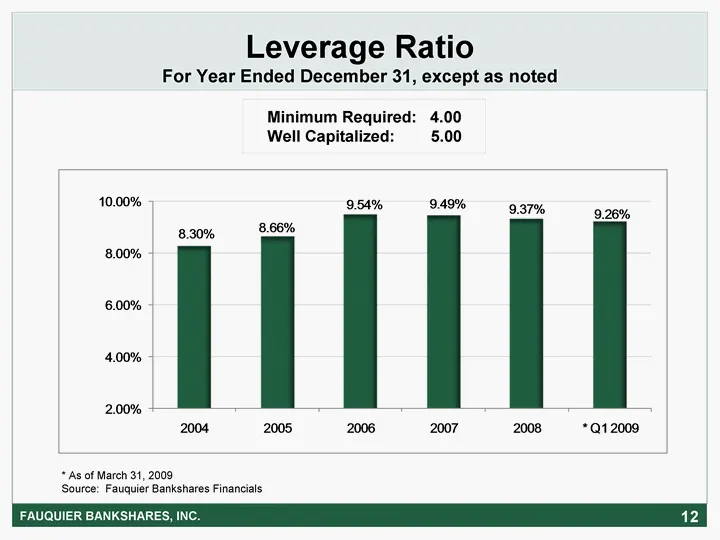
Slide 12: Leverage Ratio
12 Minimum Required: 4.00 Well Capitalized: 5.00 FAUQUIER BANKSHARES, INC. Leverage Ratio For Year Ended December 31, except as noted * As of March 31, 2009 Source: Fauquier Bankshares Financials
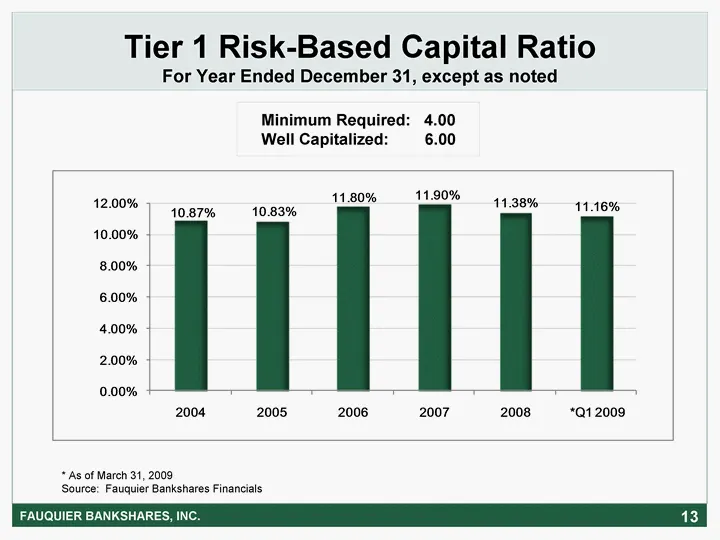
Slide 13: Tier 1 Risk-Based Capital Ratio
13 Tier 1 Risk-Based Capital Ratio For Year Ended December 31, except as noted Minimum Required: 4.00 Well Capitalized: 6.00 FAUQUIER BANKSHARES, INC. * As of March 31, 2009 Source: Fauquier Bankshares Financials
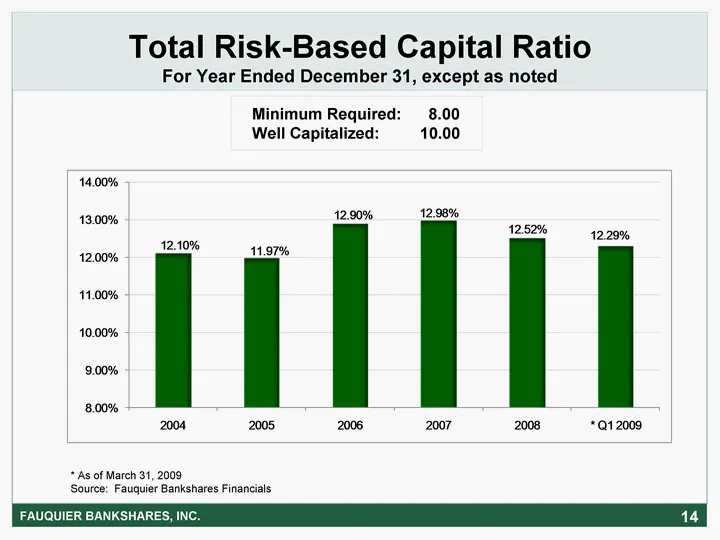
Slide 14: Total Risk-Based Capital Ratio
14 Minimum Required: 8.00 Well Capitalized: 10.00 Total Risk-Based Capital Ratio For Year Ended December 31, except as noted FAUQUIER BANKSHARES, INC. * As of March 31, 2009 Source: Fauquier Bankshares Financials
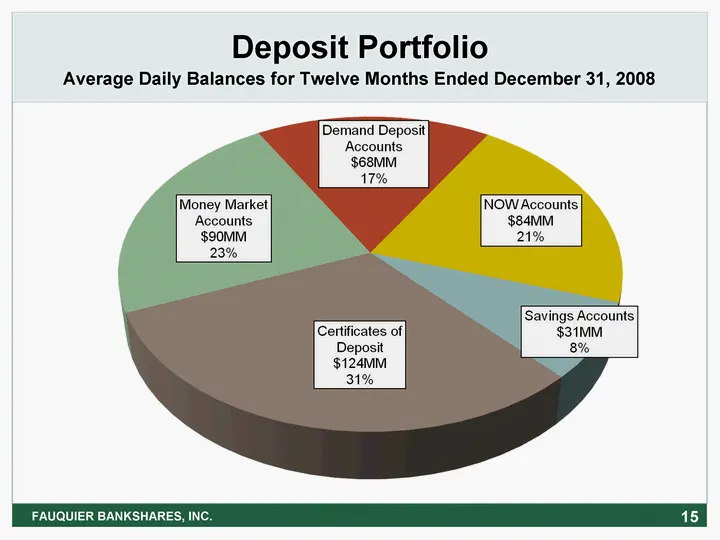
Slide 15: Deposit Portfolio
Deposit Portfolio FAUQUIER BANKSHARES, INC. Average Daily Balances for Twelve Months Ended December 31, 2008 15
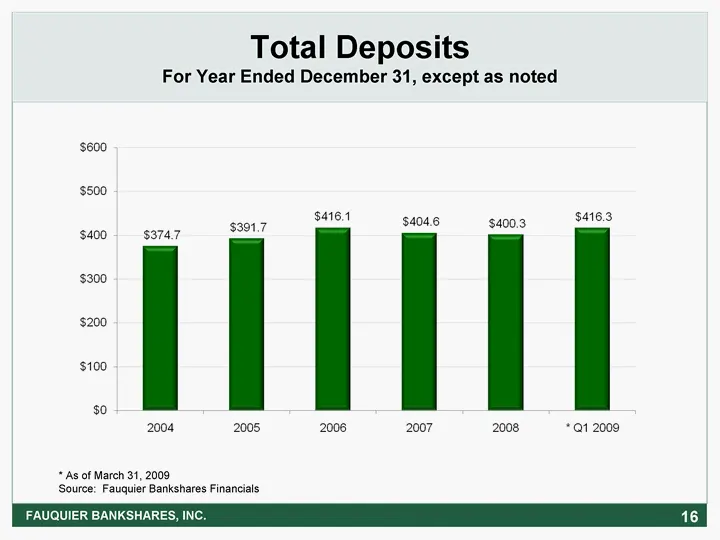
Slide 16: Total Deposits
16 Total Deposits For Year Ended December 31, except as noted FAUQUIER BANKSHARES, INC. * As of March 31, 2009 Source: Fauquier Bankshares Financials
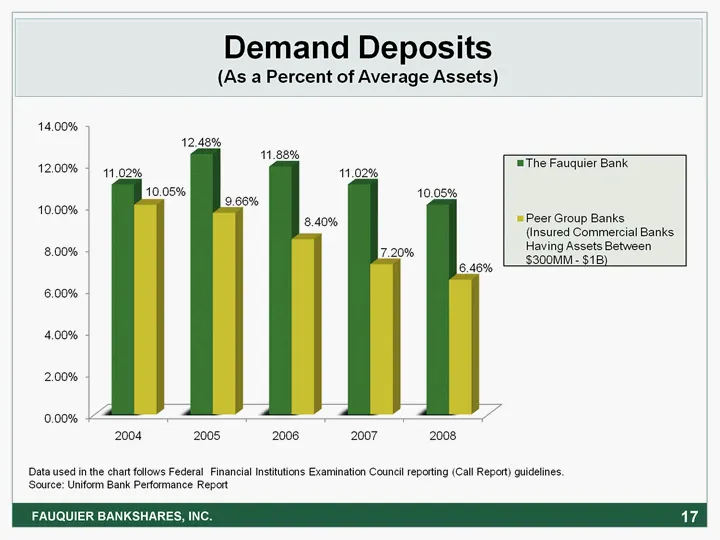
Slide 17: FAUQUIER BANKSHARES, INC. 17
FAUQUIER BANKSHARES, INC. 17
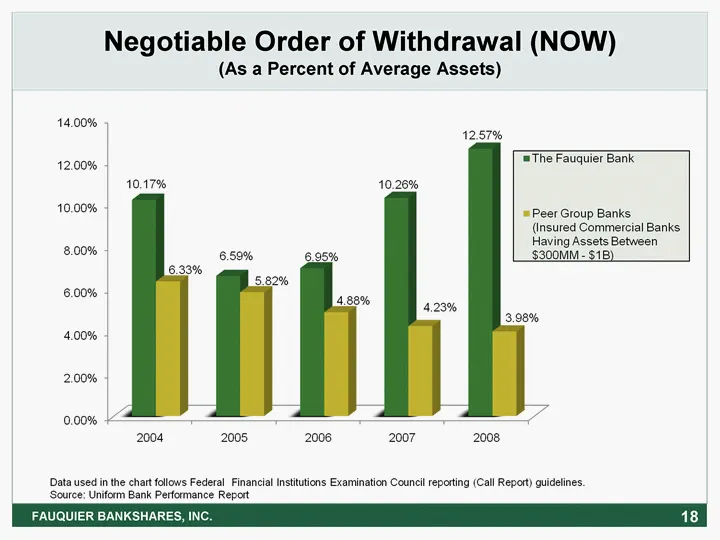
Slide 18: Negotiable Order of Withdrawal (NOW)
Negotiable Order of Withdrawal (NOW) (As a Percent of Average Assets) FAUQUIER BANKSHARES, INC. 18
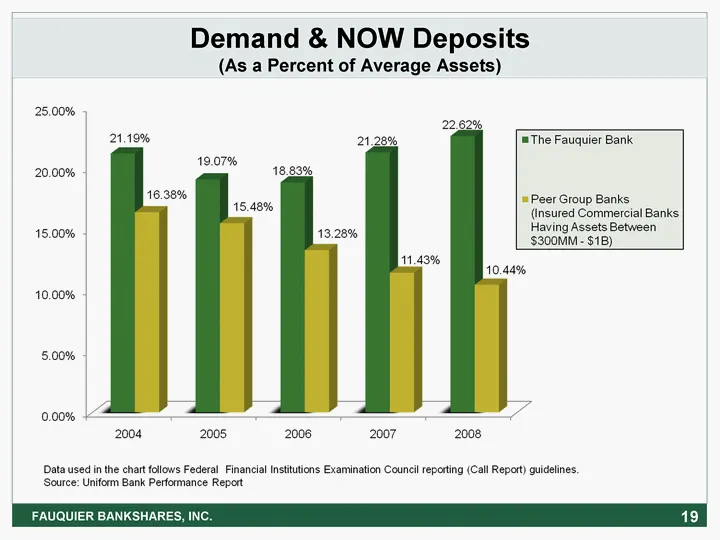
Slide 19: Demand & NOW Deposits
19 Demand & NOW Deposits (As a Percent of Average Assets) FAUQUIER BANKSHARES, INC.
Slide 20: Financial Performance and Goals
Financial Performance and Goals FAUQUIER BANKSHARES, INC. 20
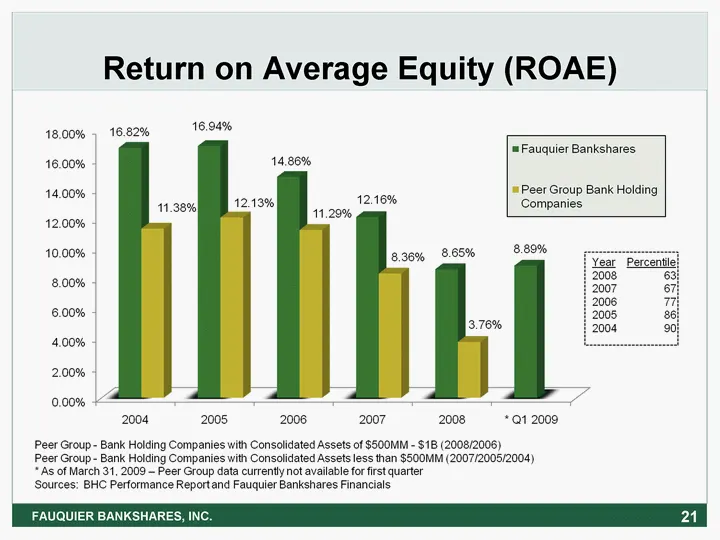
Slide 21: Return on Average Equity (ROAE)
21 Return on Average Equity (ROAE) FAUQUIER BANKSHARES, INC.
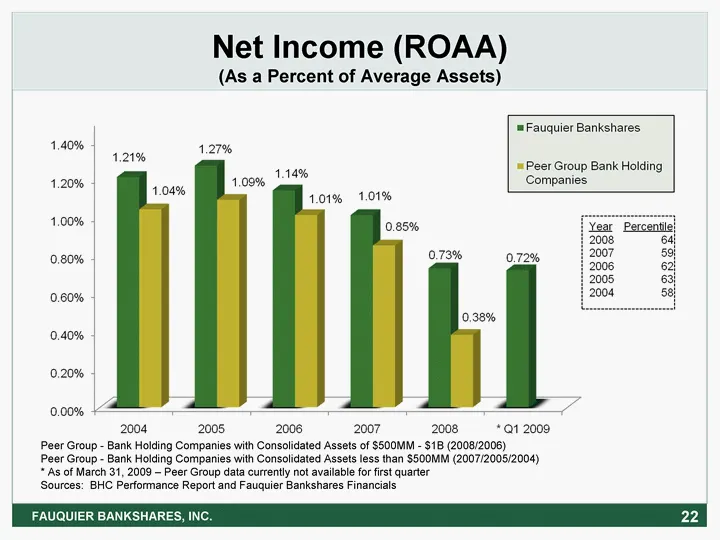
Slide 22: Net Income (ROAA)
22 Net Income (ROAA) (As a Percent of Average Assets) FAUQUIER BANKSHARES, INC. Peer Group - Bank Holding Companies with Consolidated Assets of $500MM - $1B (2008/2006) Peer Group - Bank Holding Companies with Consolidated Assets less than $500MM (2007/2005/2004) * As of March 31, 2009 - Peer Group
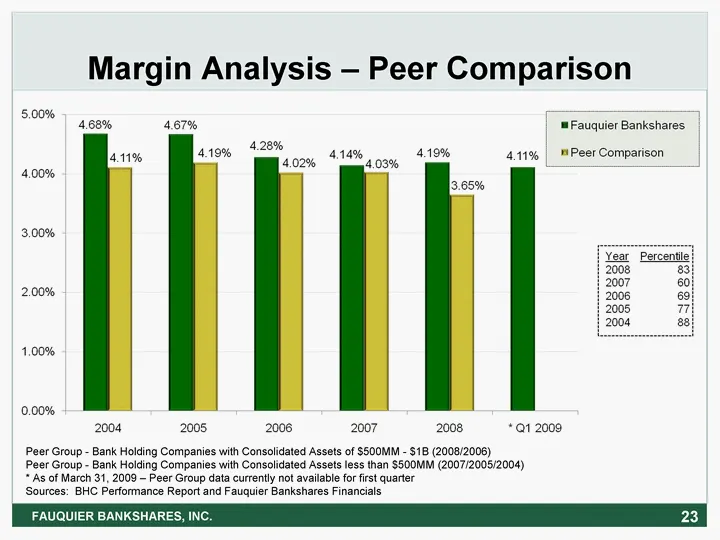
Slide 23: Margin Analysis - Peer Comparison
Margin Analysis - Peer Comparison 23 FAUQUIER BANKSHARES, INC. Peer Group - Bank Holding Companies with Consolidated Assets of $500MM - $1B (2008/2006) Peer Group - Bank Holding Companies with Consolidated Assets less than $500MM (2007/2005/2004) * As of March 31, 2009 - Peer Group data currently no
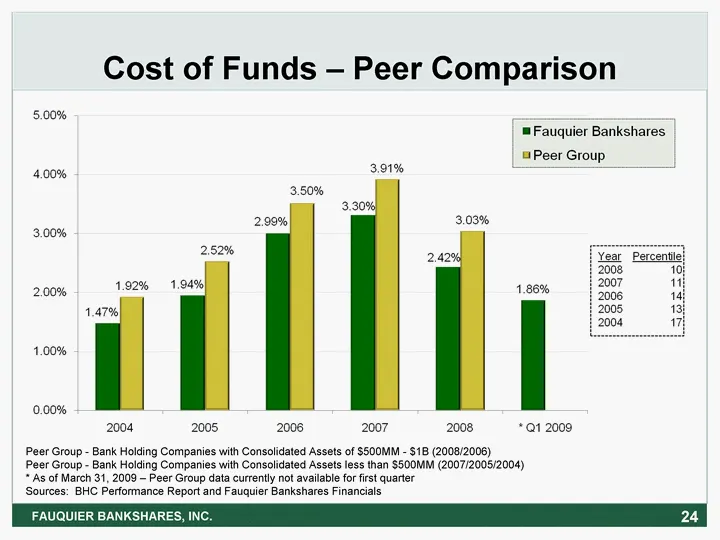
Slide 24: Cost of Funds - Peer Comparison
Cost of Funds - Peer Comparison 24 FAUQUIER BANKSHARES, INC. Peer Group - Bank Holding Companies with Consolidated Assets of $500MM - $1B (2008/2006) Peer Group - Bank Holding Companies with Consolidated Assets less than $500MM (2007/2005/2004) * As of March 31, 2009 - Peer Group data currently not
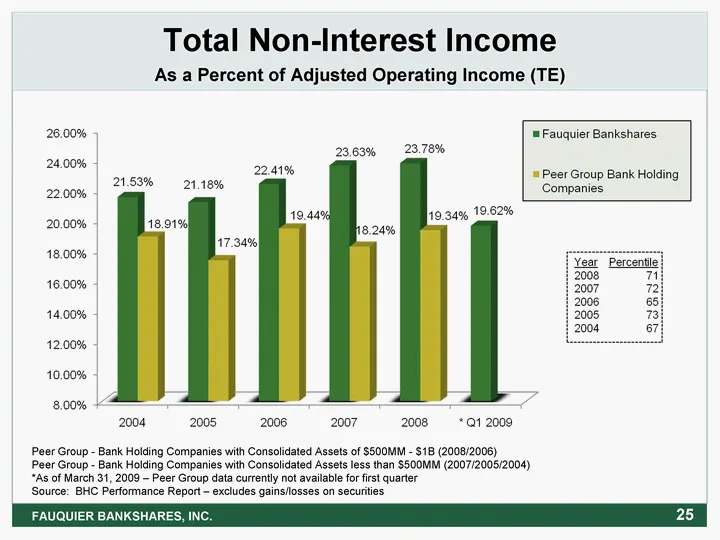
Slide 25: Total Non-Interest Income as a Percent of Adjusted Operating Income
Total Non-Interest Income As a Percent of Adjusted Operating Income (TE) FAUQUIER BANKSHARES, INC. 25 Peer Group - Bank Holding Companies with Consolidated Assets of $500MM - $1B (2008/2006) Peer Group - Bank Holding Companies with Consolidated Assets less than $500MM (2007/2005/2004) *As of March 3
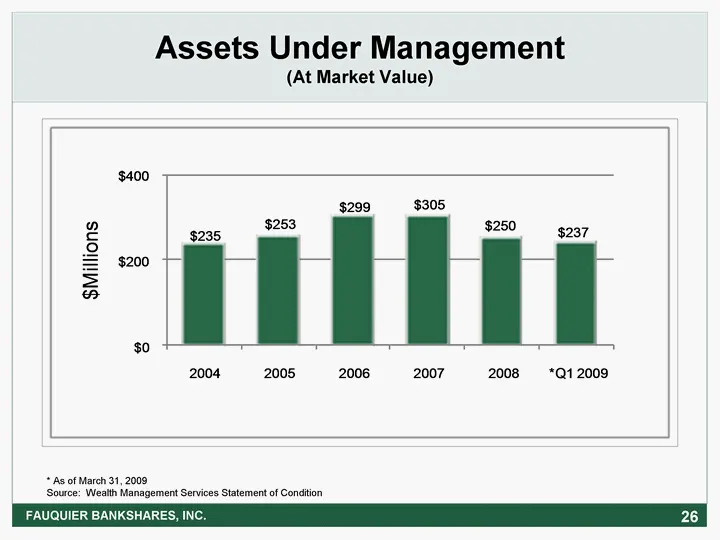
Slide 26: Assets Under Management
26 Assets Under Management (At Market Value) FAUQUIER BANKSHARES, INC. * As of March 31, 2009 Source: Wealth Management Services Statement of Condition
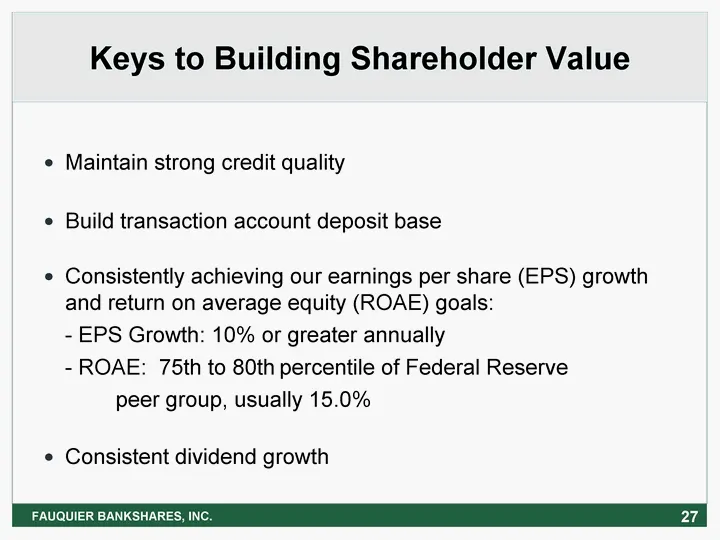
Slide 27: Keys to Building Shareholder Value
Keys to Building Shareholder Value Maintain strong credit quality Build transaction account deposit base Consistently achieving our earnings per share (EPS) growth and return on average equity (ROAE) goals: - EPS Growth: 10% or greater annually - ROAE: 75th to 80th percentile of Federal Reserve peer
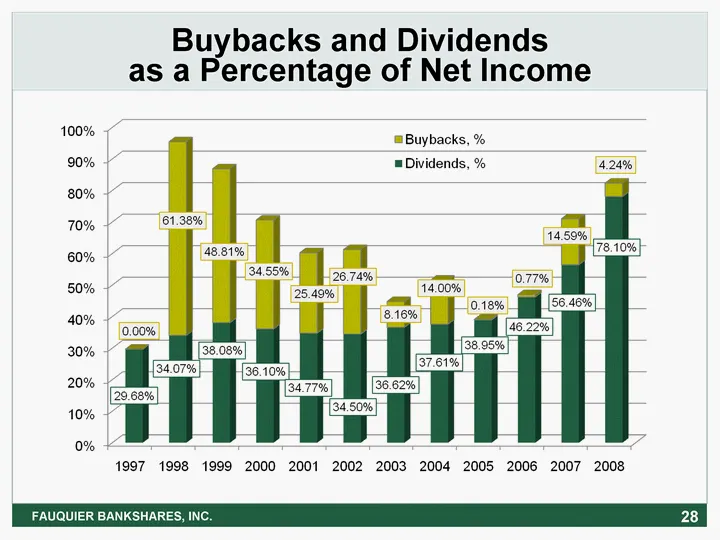
Slide 28: Buybacks and Dividends as a Percentage of Net Income
Buybacks and Dividends as a Percentage of Net Income 28 FAUQUIER BANKSHARES, INC.
Slide 29: Stock Total Return Performance
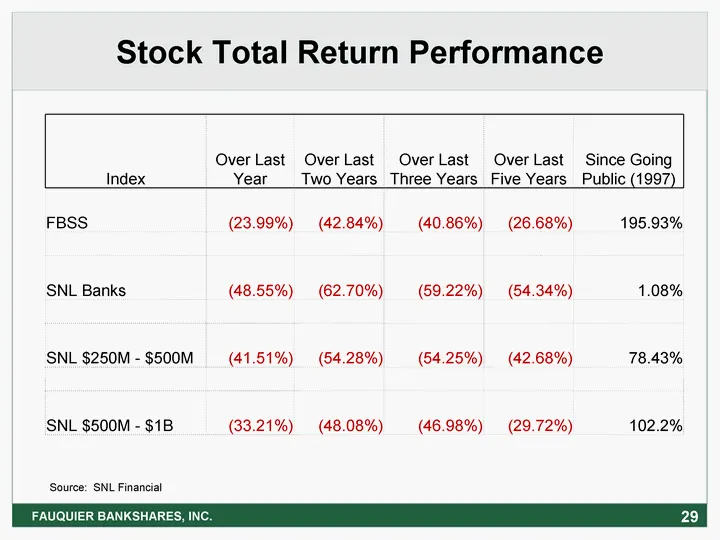
29 Stock Total Return Performance Index Over Last Year Over Last Two Years Over Last Three Years Over Last Five Years Since Going Public (1997) FBSS (23.99%) (42.84%) (40.86%) (26.68%) 195.93% SNL Banks (48.55%) (62.70%) (59.22%) (54.34%) 1.08% SNL $250M - $500M (41.51%) (54.28%) (54.25%) (42.68%) 7
Slide 30: Stock Total Return Performance
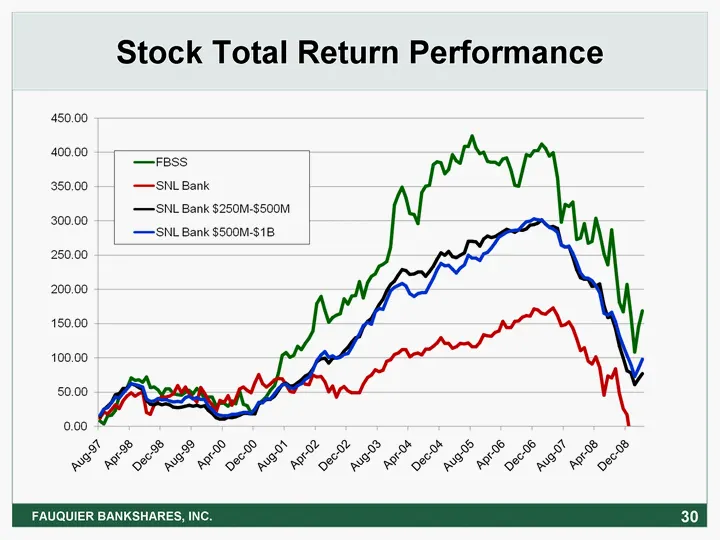
30 Stock Total Return Performance FAUQUIER BANKSHARES, INC.
Slide 31: Stock Chart - Price/Tangible Book Value
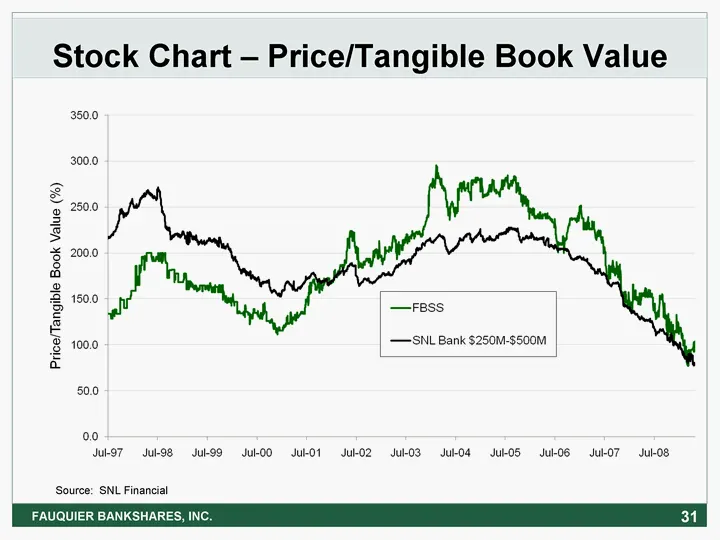
Stock Chart - Price/Tangible Book Value 31 FAUQUIER BANKSHARES, INC. Source: SNL Financial
Slide 32: Annual Meeting
32 Annual Meeting FAUQUIER BANKSHARES, INC.
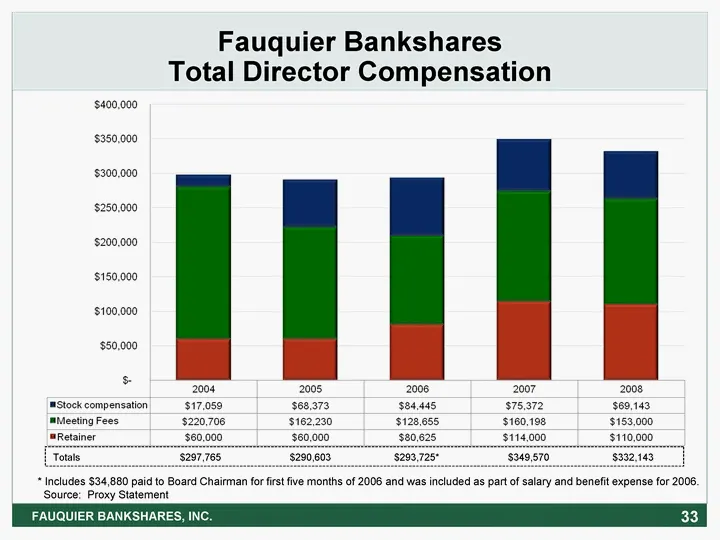
Slide 33: Total Director Compensation
33 Fauquier Bankshares Total Director Compensation FAUQUIER BANKSHARES, INC. Totals $297,765 $290,603 $293,725* $349,570 $332,143 * Includes $34,880 paid to Board Chairman for first five months of 2006 and was included as part of salary and benefit expense for 2006. Source: Proxy Statement
Source: SEC EDGAR · 8-K filed May 19, 2009
More decks from Fauquier Bankshares Inc
 Merger or Acquisition (October 2020)20 slides · Oct 1, 2020
 Shareholder Meeting (May 2020)30 slides · May 19, 2020
 Investor Presentation (August 2019)20 slides · Aug 7, 2019
 Shareholder Meeting (May 2019)31 slides · May 21, 2019
 Investor Presentation (October 2018)18 slides · Oct 22, 2018
 Shareholder Meeting (May 2018)33 slides · May 15, 2018