Holly Energy Partners LP — Wells Fargo Energy Symposium 2013
23 slides from Holly Energy Partners LP's conference presentation, Dec 11, 2013
Slide 1: Holly Energy Partners, L.P. Wells Fargo Energy Symposium
Holly Energy Partners, L.P. Wells Fargo Energy Symposium New York, New York December 11, 2013
Slide 2: Safe Harbor Disclosure Statement
Statements made during the course of this presentation that are not historical facts are “forward-looking statements” within the meaning of the U.S. Private Securities Litigation Reform Act of 1995. Forward-looking statements are inherently uncertain and necessarily involve risks that may affect the
Slide 3: Holly Energy Partners, L.P. Investment Highlights
Holly Energy Partners, L.P. (“HEP”) Investment Highlights 3 Well positioned assets serve high growth markets Revenues are 100% fee based with no commodity ownership risk Long-term contracts support cash flow stability HEP benefits from strong sponsor relationship with HollyFrontier Corporati
Slide 4: Well Positioned Assets
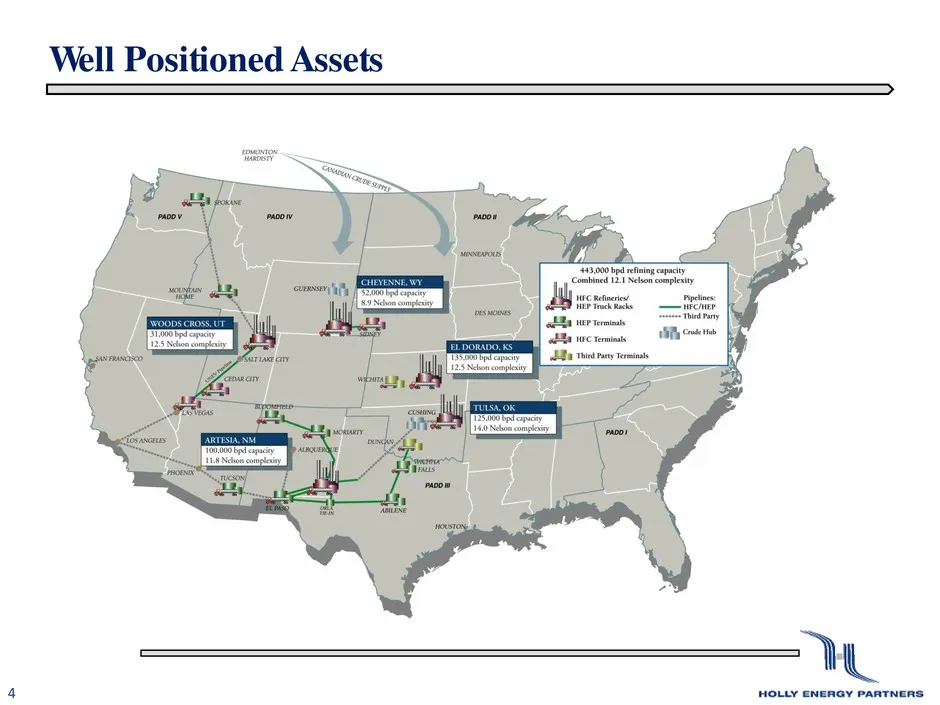
Well Positioned Assets 4
Slide 5: Fee-based Revenues with No Commodity Risk
Fee-based Revenues with No Commodity Risk 5 Fee-based revenues • Tariffs from pipeline movements • Storage and transfer fees for terminal activity • Loading fees for loading rack activity • Capacity lease commitments With no commodity ownership risk • HEP shippers own hydrocarbon inventory • No
Slide 6: Long Term Contracts Support Cashflow Stability
Long Term Contracts Support Cashflow Stability 6 Major refiner customers have entered into 15-year long term contracts Contracts require minimum payment obligations for volume and/or revenue commitments Earliest contract matures in 2018 Minimum annualized commitments will result in over $259
Slide 7: Strategic Relationship with HollyFrontier
Strategic Relationship with HollyFrontier 7 HEP’s assets are integral to HollyFrontier’s five refineries Currently, subsidiaries of HFC own 37% of the MLP through limited partner interests and 2% through a general partner interest As HFC grows, HEP is positioned to benefit by partnering with H
Slide 8: Successful Execution of Growth Plan Over Time
Successful Execution of Growth Plan Over Time 8 Organic growth: Increase cash flow via logical additions to existing assets, volume growth and annual contractual PPI-related growth HFC growth: Partner with HFC to grow current asset base with projects and joint acquisitions Third party growth:
Slide 9: HEP Growth Chronology: IPO to Present
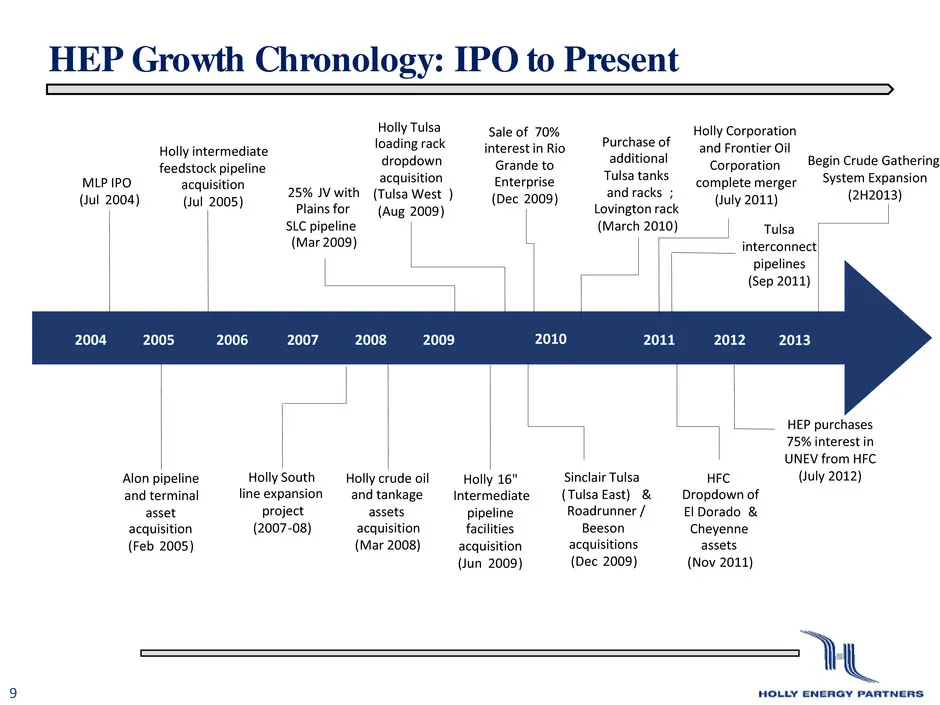
HEP Growth Chronology: IPO to Present 9 2004 2005 2006 2007 2008 2009 MLP IPO ( Jul 2004 ) Holly intermediate feedstock pipeline acquisition ( Jul 2005 ) 25 % JV with Plains for SLC pipeline ( Mar 2009 ) Holly Tulsa loading rack dropdown acquisition ( Tulsa West ) ( Aug 2009 ) Holly crude oil and ta
Slide 10: HEP Growth: EBITDA Since Inception
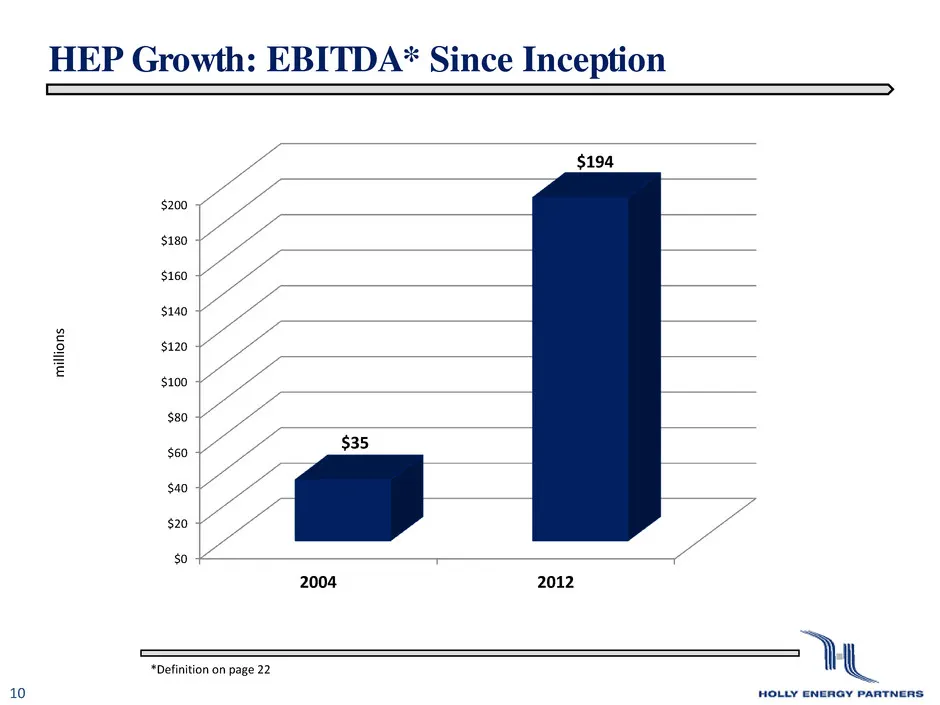
HEP Growth: EBITDA* Since Inception 10 *Definition on page 22 milli o n s $0 $20 $40 $60 $80 $100 $120 $140 $160 $180 $200 2004 2012 $35 $194
Slide 11: HEP Statistics: Then and Now
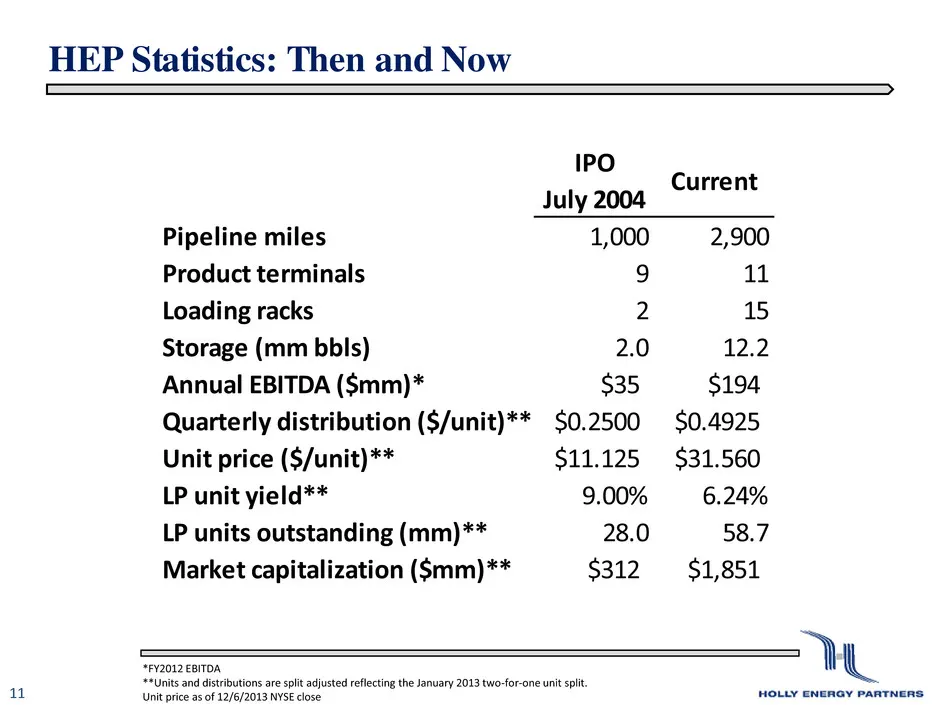
HEP Statistics: Then and Now 11 *FY2012 EBITDA **Units and distributions are split adjusted reflecting the January 2013 two-for-one unit split. Unit price as of 12/6/2013 NYSE close IPO July 2004 Current Pipeline miles 1,000 2,900 Product terminals 9 11 Loading racks 2 15 Storage (mm bbls) 2.0 12.2
Slide 12: HEP Growth: Distributable Cash Flow
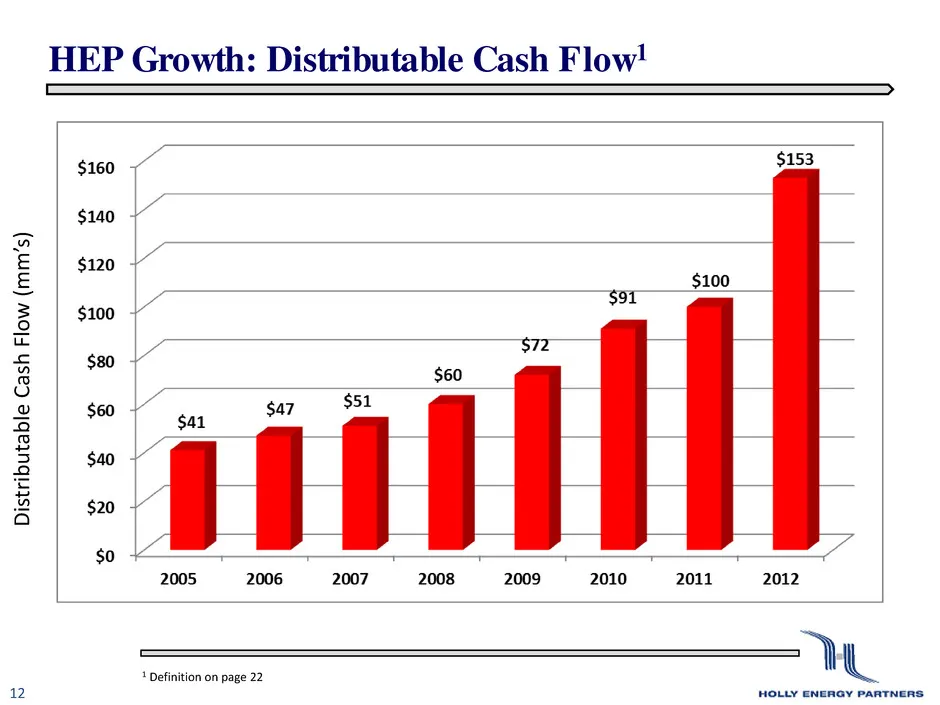
HEP Growth: Distributable Cash Flow1 12 Di str ibu table Cas h F lo w (mm’ s) 1 Definition on page 22
Slide 13: HEP Growth: Limited Partner Distributions
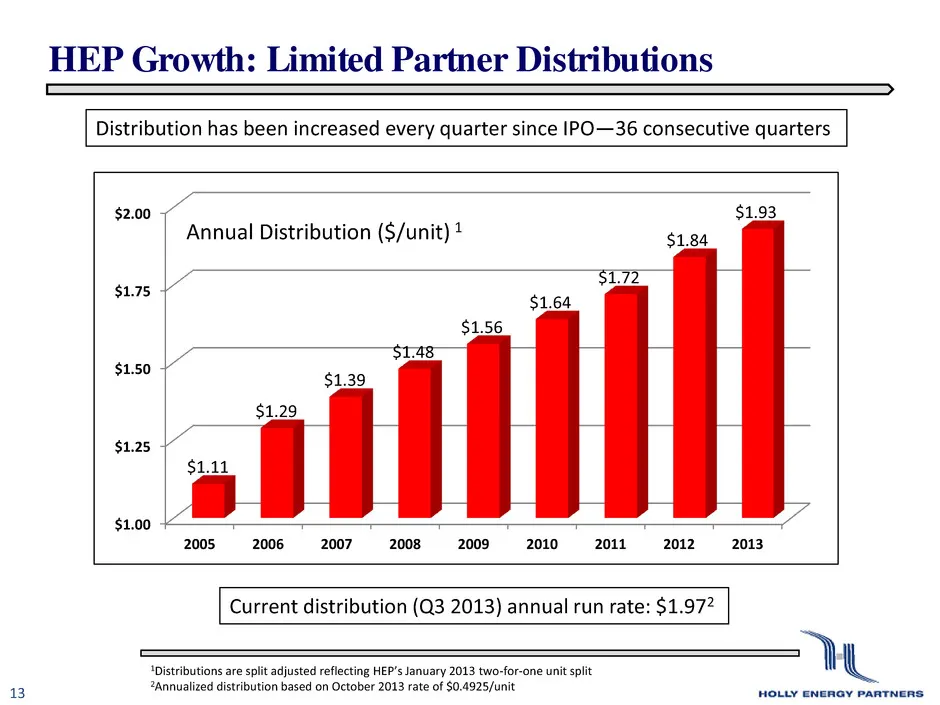
HEP Growth: Limited Partner Distributions 13 Distribution has been increased every quarter since IPO—36 consecutive quarters Current distribution (Q3 2013) annual run rate: $1.972 1Distributions are split adjusted reflecting HEP’s January 2013 two-for-one unit split 2Annualized distribution based on
Slide 14: Current HEP Growth Initiatives
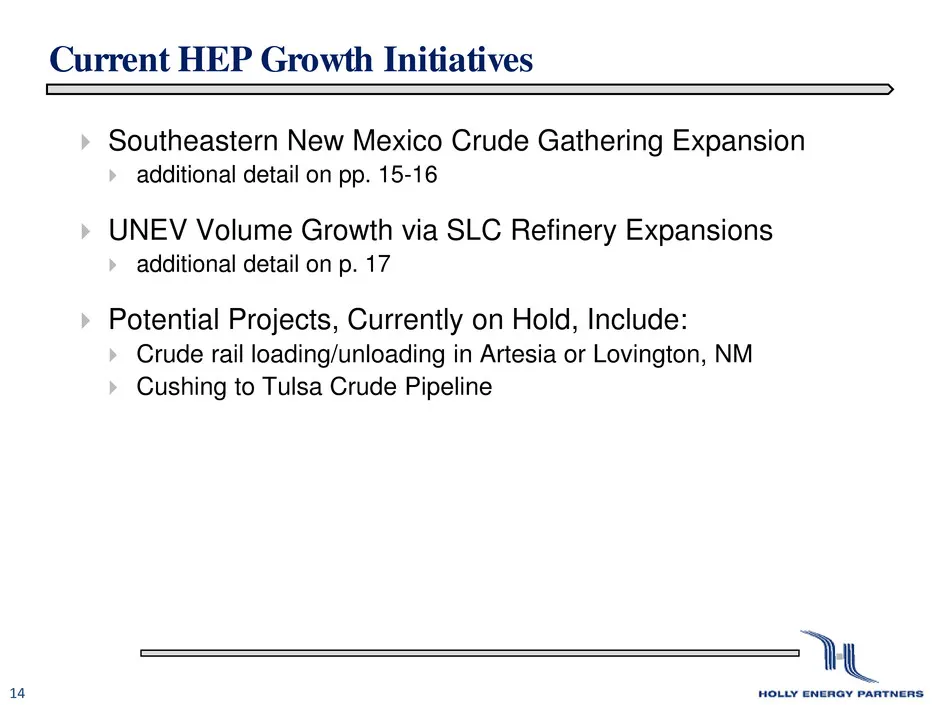
Current HEP Growth Initiatives 14 Southeastern New Mexico Crude Gathering Expansion additional detail on pp. 15-16 UNEV Volume Growth via SLC Refinery Expansions additional detail on p. 17 Potential Projects, Currently on Hold, Include: Crude rail loading/unloading in Artesia or Lovingto
Slide 15: Southeastern New Mexico Crude System
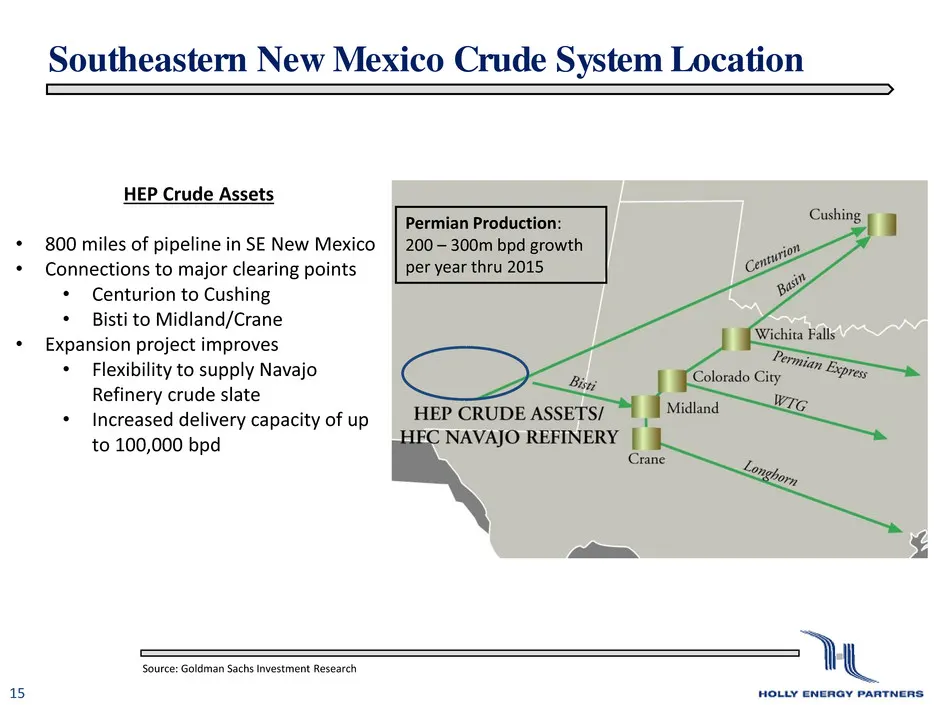
Southeastern New Mexico Crude System Location 15 HEP Crude Assets • 800 miles of pipeline in SE New Mexico • Connections to major clearing points • Centurion to Cushing • Bisti to Midland/Crane • Expansion project improves • Flexibility to supply Navajo Refinery crude slate • Increased delivery capa
Slide 16: Southeastern New Mexico Crude System Expansion
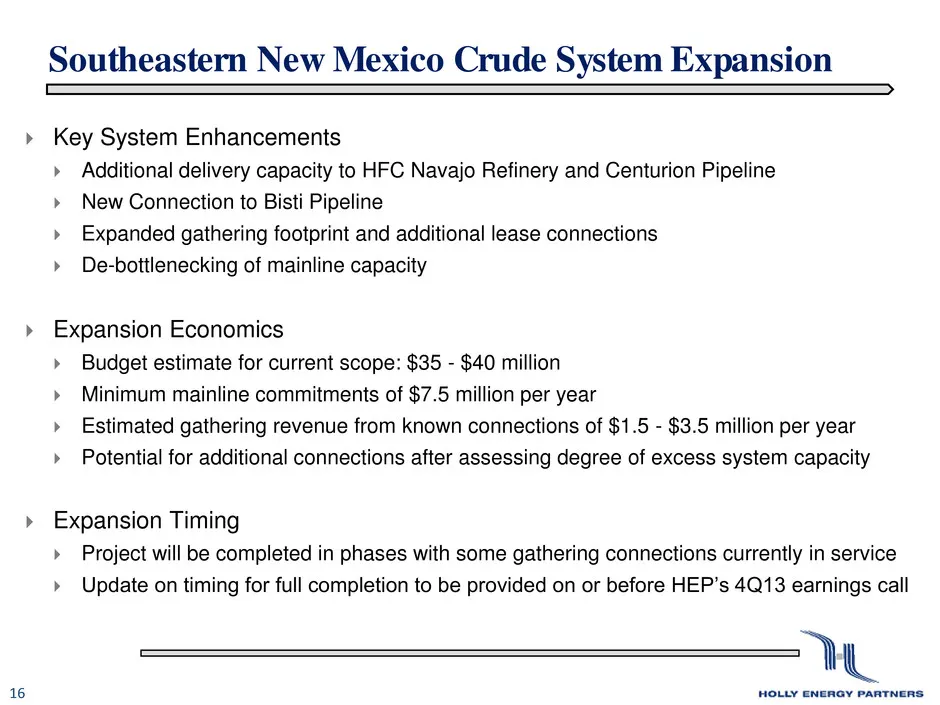
Southeastern New Mexico Crude System Expansion 16 Key System Enhancements Additional delivery capacity to HFC Navajo Refinery and Centurion Pipeline New Connection to Bisti Pipeline Expanded gathering footprint and additional lease connections De-bottlenecking of mainline capacity Expans
Slide 17: UNEV Pipeline Volume Growth
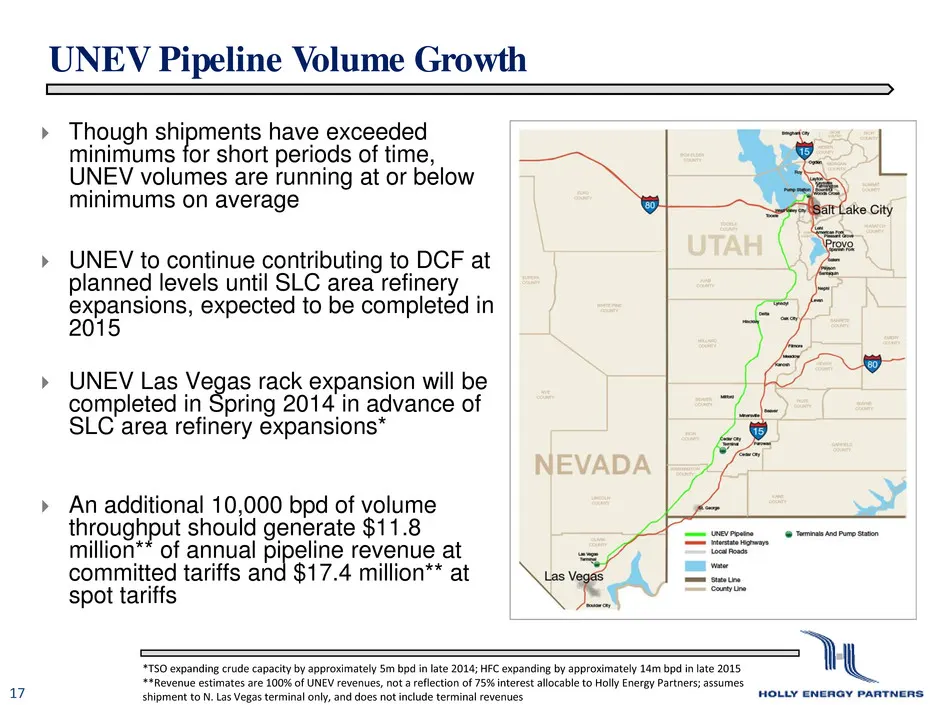
UNEV Pipeline Volume Growth 17 Though shipments have exceeded minimums for short periods of time, UNEV volumes are running at or below minimums on average UNEV to continue contributing to DCF at planned levels until SLC area refinery expansions, expected to be completed in 2015 UNEV Las Vegas
Slide 18: HollyFrontier Business Highlights
HollyFrontier Business Highlights 18 Pure play competitive refiner 5 refineries with 443,000 bbls per day of refining capacity High refining complexity – combined Nelson complexity of over 12.0. Multiple sources of crude oil – all crude oil ‘WTI’ price-based Attractive markets Geographic
Slide 19: HollyFrontier Corporation: Strong Returns on Capital
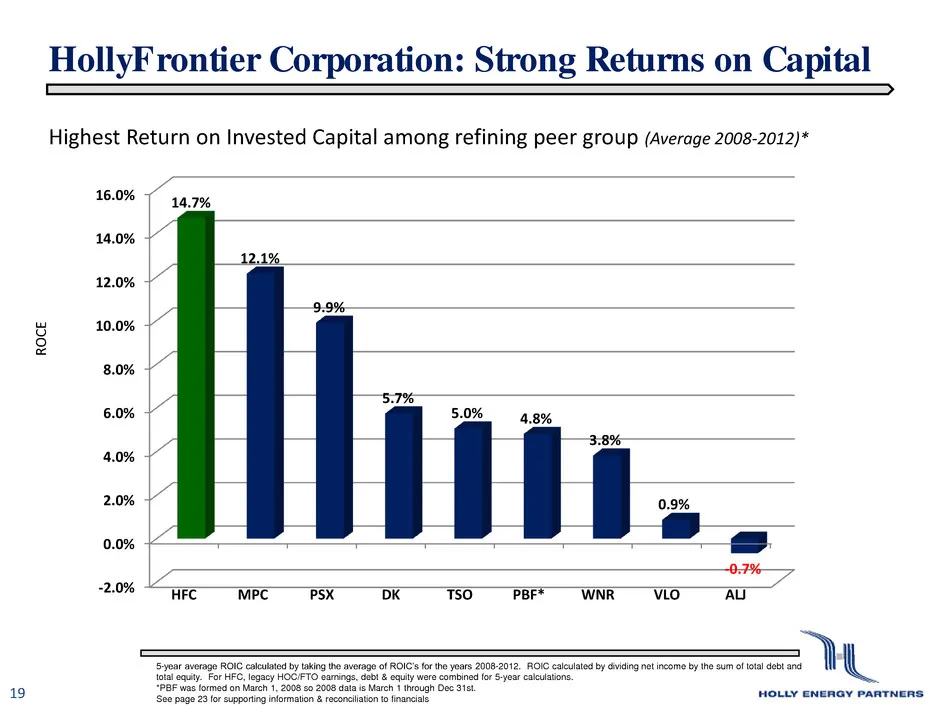
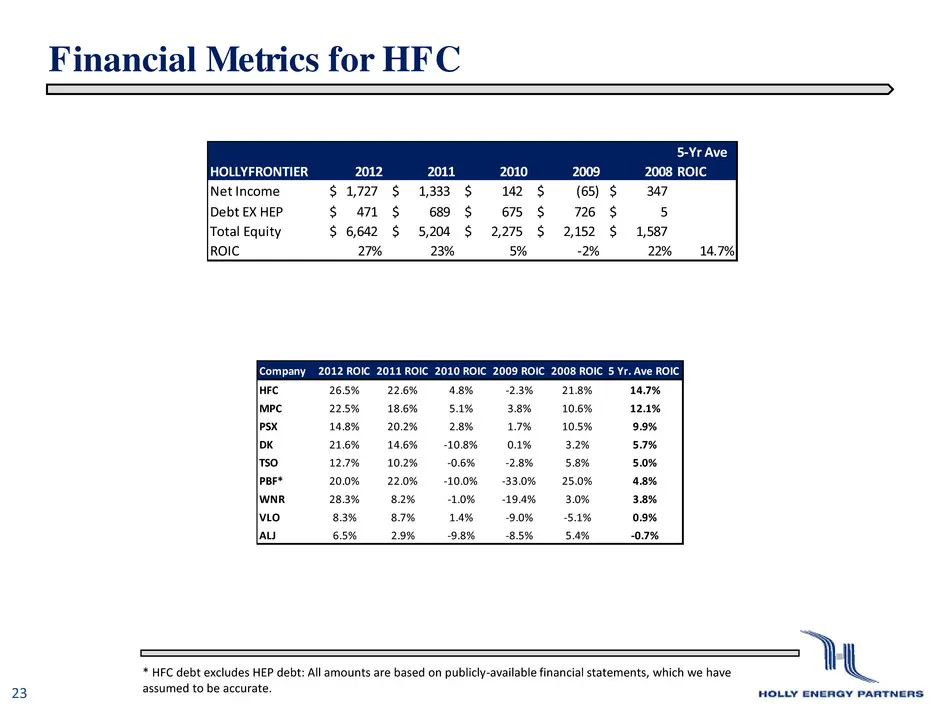
HollyFrontier Corporation: Strong Returns on Capital 19 Highest Return on Invested Capital among refining peer group (Average 2008-2012)* 5-year average ROIC calculated by taking the average of ROIC’s for the years 2008-2012. ROIC calculated by dividing net income by the sum of total debt and total

Slide 20: Contact Information: Holly Energy Partners, L.P.
Contact Information: Holly Energy Partners, L.P. (NYSE: HEP) For investor relations questions please contact: Julia Heidenreich, VP, Investor Relations Blake Barfield, Investor Relations 2828 N. Harwood, Suite 1300 Dallas, Texas 75201 (214) 954-6511 investors@hollyenergy.com 20
Slide 21: Appendix
W HOLLY EI Appendix
Slide 22: Definitions
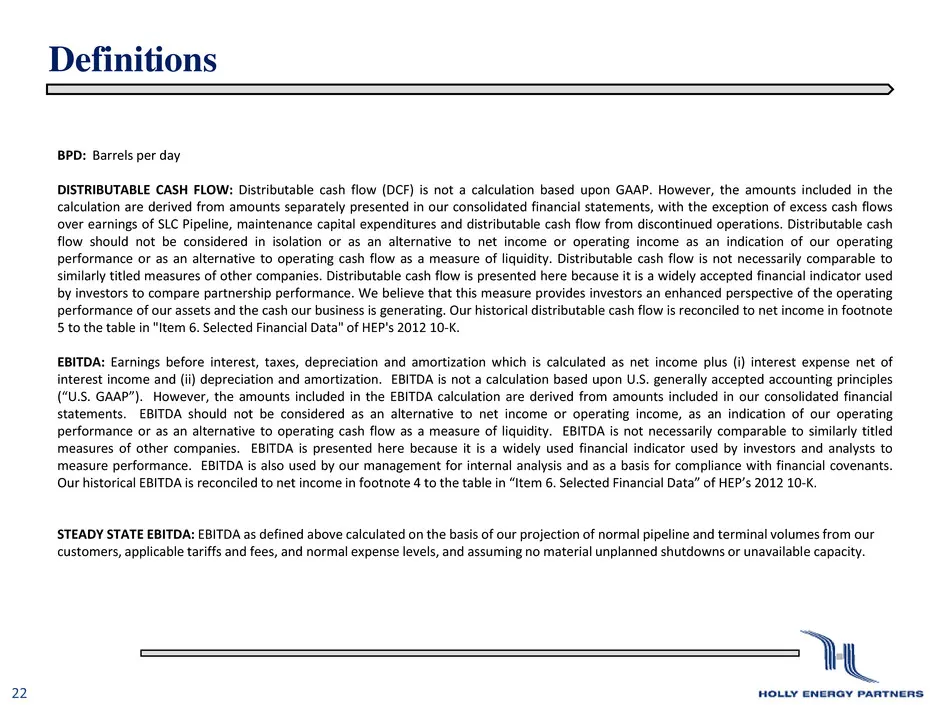
Definitions 22 BPD: Barrels per day DISTRIBUTABLE CASH FLOW: Distributable cash flow (DCF) is not a calculation based upon GAAP. However, the amounts included in the calculation are derived from amounts separately presented in our consolidated financial statements, with the exception of excess cash
Slide 23: Financial Metrics for HFC
Financial Metrics for HFC 23 * HFC debt excludes HEP debt: All amounts are based on publicly-available financial statements, which we have assumed to be accurate. Company 2012 ROIC 2011 ROIC 2010 ROIC 2009 ROIC 2008 ROIC 5 Yr. Ave ROIC HFC 26.5% 22.6% 4.8% -2.3% 21.8% 14.7% MPC 22.5% 18.6% 5.1% 3.8%
Source: SEC EDGAR · 8-K filed Dec 11, 2013
More decks from Holly Energy Partners LP
 Investor Presentation (March 2023)20 slides · Mar 2, 2023
 Investor Presentation (August 2022)24 slides · Aug 16, 2022
 Investor Presentation (May 2022)23 slides · May 17, 2022
 Investor Presentation (March 2022)12 slides · Mar 22, 2022
 Investor Presentation (March 2022)18 slides · Mar 1, 2022
 Investor Presentation (December 2021)18 slides · Dec 9, 2021