Civitas Resources — Bonanza Creek Energy — Merger or Acquisition (December 2017)
33 slides from Civitas Resources's merger presentation, Dec 13, 2017
Slide 1: Acquisition of Bonanza Creek Energy
ACQUISITION DECEMBER 2017 OF BONANZA CREEK ENERGY w w w . s a n d r i d g e e n e r g y . c o m
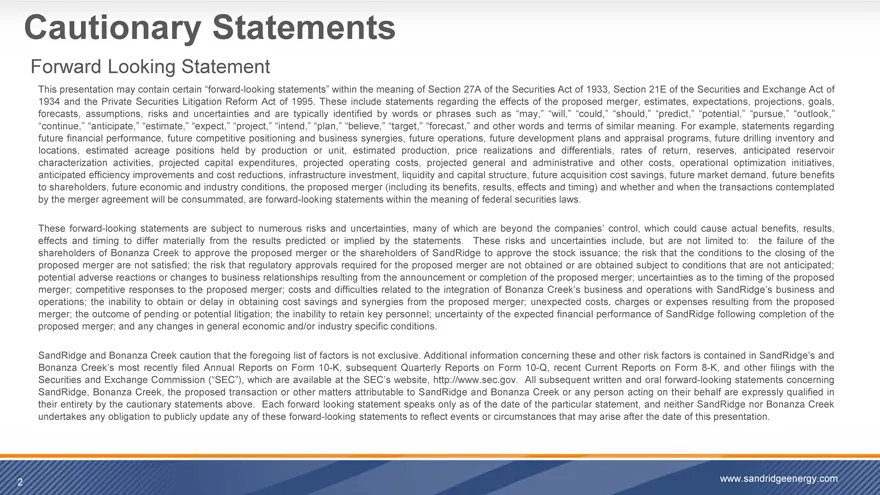
Slide 2: Cautionary Statements
Cautionary Statements Forward Looking Statement This presentation may contain certain “forward-looking statements” within the meaning of Section 27A of the Securities Act of 1933, Section 21E of the Securities and Exchange Act of 1934 and the Private Securities Litigation Reform Act of 1995. These i
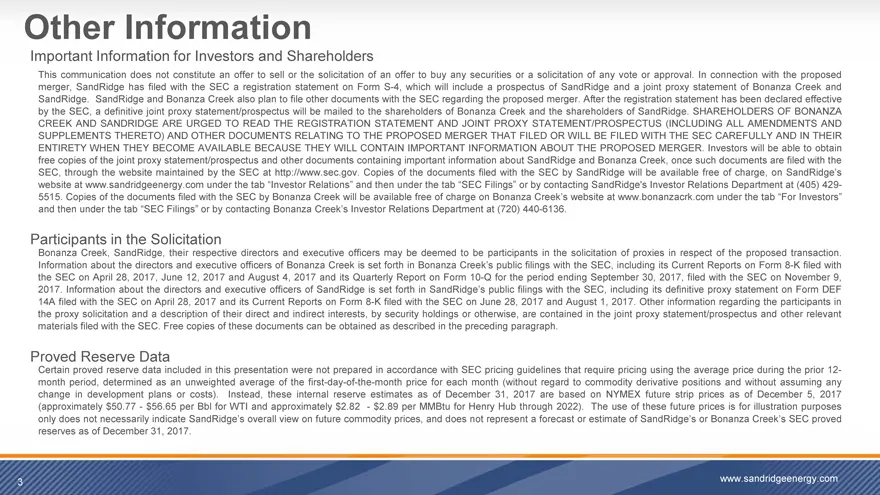
Slide 3: Other Information
Other Information Important Information for Investors and Shareholders This communication does not constitute an offer to sell or the solicitation of an offer to buy any securities or a solicitation of any vote or approval. In connection with the proposed merger, SandRidge has filed with the SEC a r
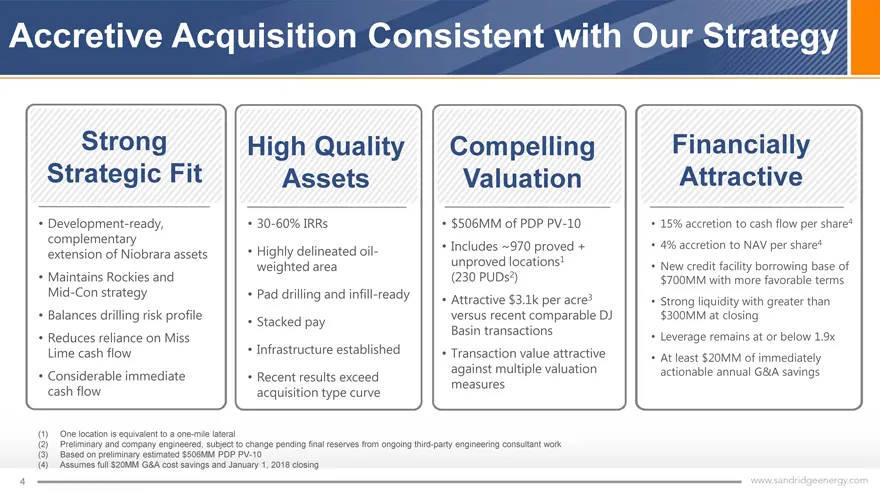
Slide 4: Accretive Acquisition Consistent with Our Strategy
Accretive Acquisition Consistent with Our Strategy Strong High QualityCompellingFinancially Strategic FitAssetsValuationAttractive •Development-ready,• 30-60% IRRs• $506MM of PDP PV-10• 15% accretion to cash flow per share4 complementary extension of Niobrara assets• Highly delineated oil-• Includes
Slide 5: Transaction Overview
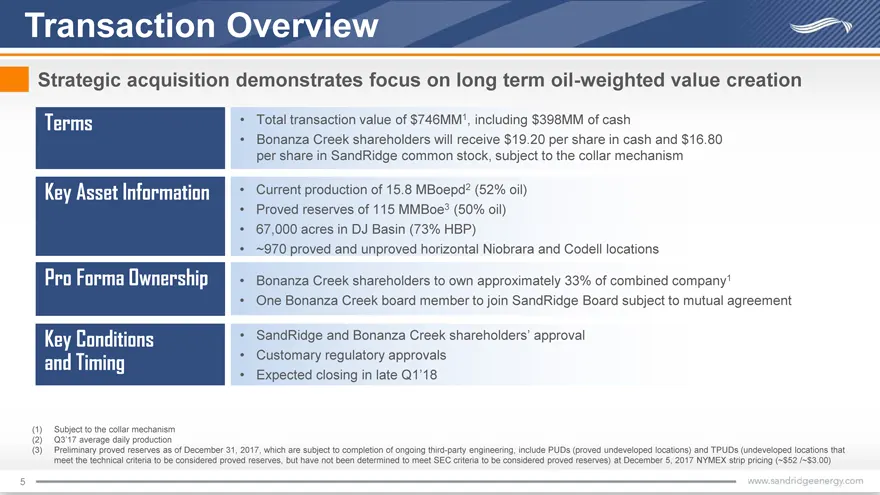
Transaction Overview Strategic acquisition demonstrates focus on long term oil-weighted value creation Terms •Total transaction value of $746MM1, including $398MM of cash •Bonanza Creek shareholders will receive $19.20 per share in cash and $16.80 per share in SandRidge common stock, subject to the
Slide 6: Acquisition Price of $36 per Bonanza Creek Share
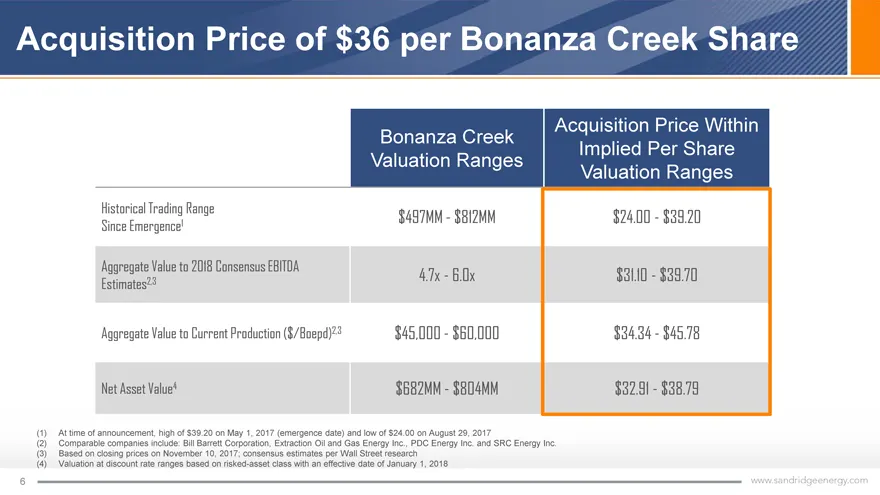
Acquisition Price of $36 per Bonanza Creek Share Acquisition Price Within Bonanza CreekImplied Per Share Valuation RangesValuation Ranges Historical Trading Range$497MM—$812MM$24.00—$39.20 Since Emergence1 Aggregate Value to 2018 Consensus EBITDA4.7x—6.0x$31.10—$39.70 Estimates2,3 Aggregate Value to
Slide 7: Immediately Accretive Acquisition
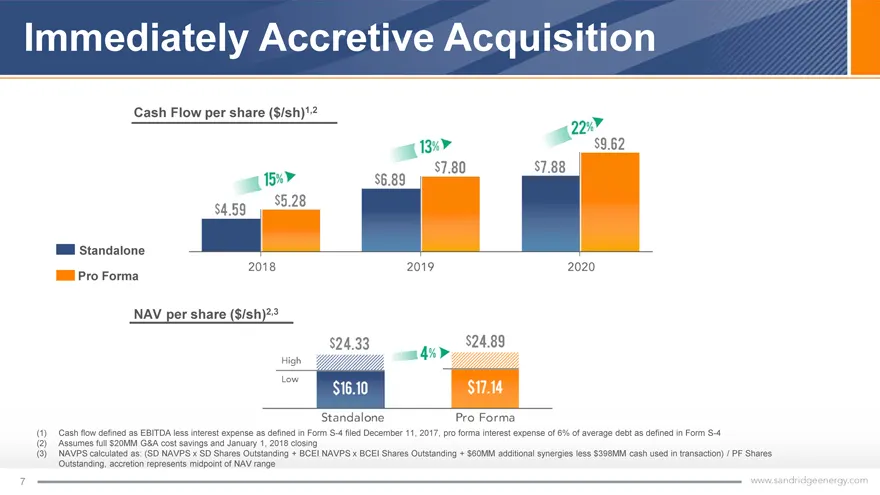
Immediately Accretive Acquisition Cash Flow per share ($/sh)1,2 Standalone Pro Forma NAV per share ($/sh)2,3 (1) Cash flow defined as EBITDA less interest expense as defined in Form S-4 filed December 11, 2017, pro forma interest expense of 6% of average debt as defined in Form S-4 (2) Assumes full
Slide 8: Cost Reductions Improve Margins
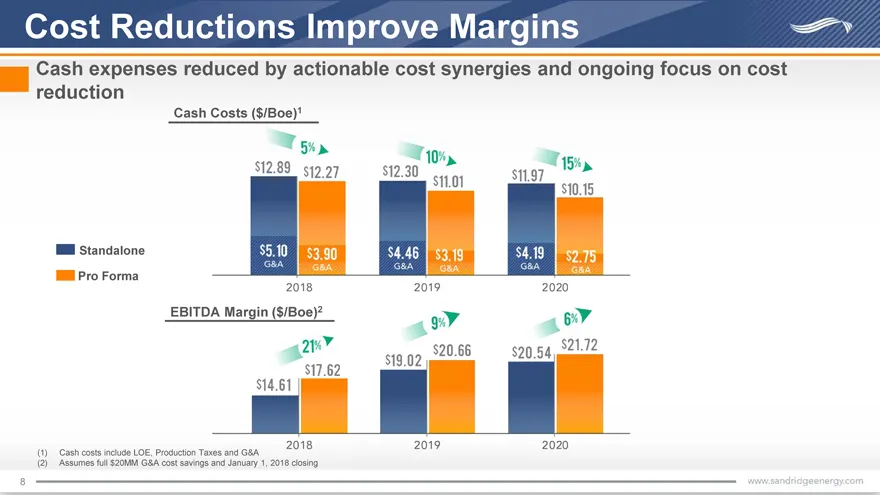
Cost Reductions Improve Margins Cash expenses reduced by actionable cost synergies and ongoing focus on cost reduction C Standalone Pro Forma EBI (1) Cash costs include LOE, Production (2) Assumes full $20MM G&A cost savi 8
Slide 9: Enhances Production Profile
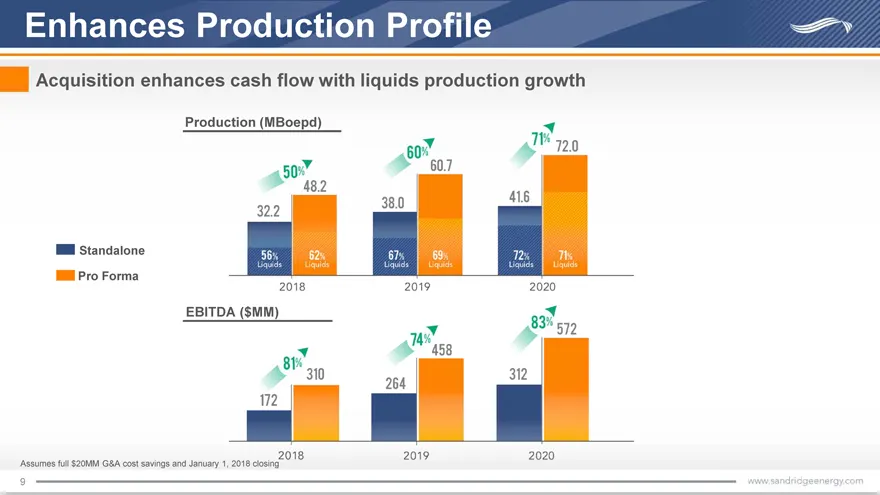
Enhances Production Profile Acquisition enhances cash flow with liquids production growth Production (MBoepd) Standalone Pro Forma EBITDA ($MM) Assumes full $20MM G&A cost savings and January 1, 2018 closing 9
Slide 10: Generates Meaningful Synergies
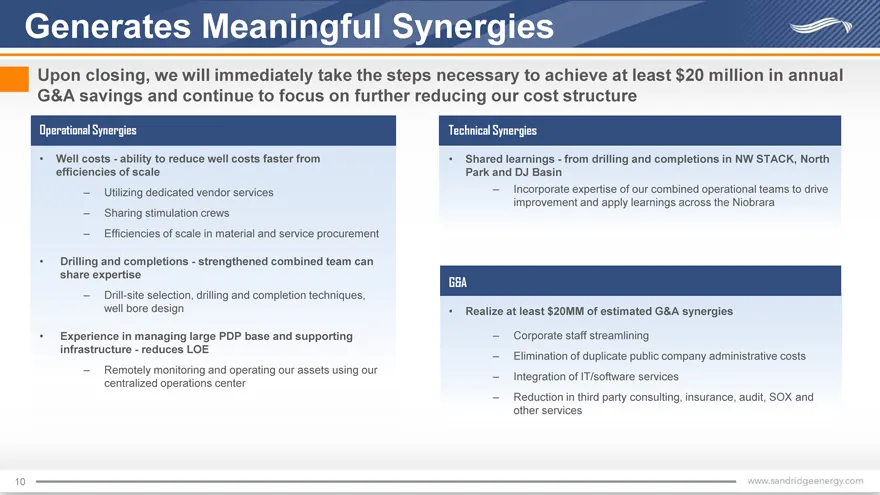
Generates Meaningful Synergies Upon closing, we will immediately take the steps necessary to achieve at least $20 million in annual G&A savings and continue to focus on further reducing our cost structure Operational Synergies Technical Synergies • Well costs—ability to reduce well costs faster from
Slide 11: Pro Forma March 31, 2018 Capitalization
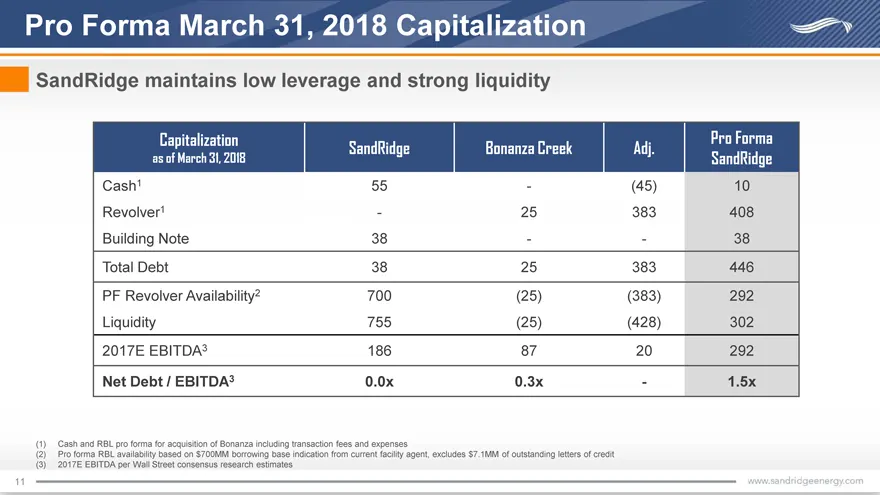
Pro Forma March 31, 2018 Capitalization SandRidge maintains low leverage and strong liquidity CapitalizationSandRidgeBonanza CreekAdj.Pro Forma as of March 31, 2018SandRidge Cash155-(45)10 Revolver1-25383408 Building Note38--38 Total Debt3825383446 PF Revolver Availability2700(25)(383)292 Liquidity7
Slide 12: Precedent Transaction Comparisons
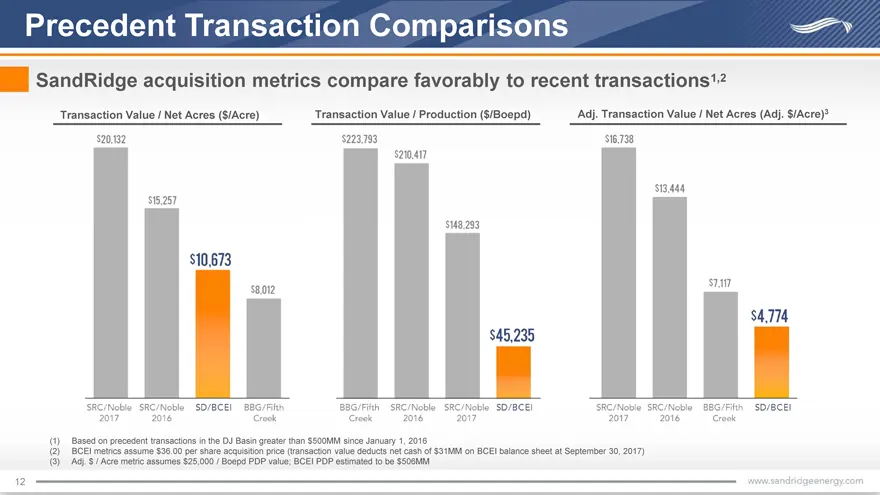
Precedent Transaction Comparisons SandRidge acquisition metrics compare favorably to recent transactions1,2 Transaction Value / Net Acres ($/Acre) Transaction Value / Production ($/Boepd)Adj. Transaction Value / Net Acres (Adj. $/Acre)3 (1)Based on precedent transactions in the DJ Basin greater than
Slide 13: Acquisition Metrics Compare Favorably to Peer Trading Levels
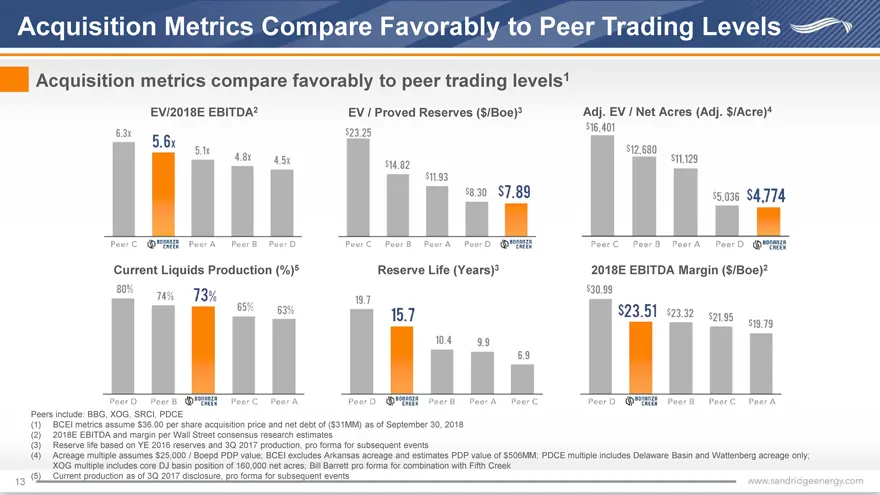
Acquisition Metrics Compare Favorably to Peer Trading Levels Acquisition metrics compare favorably to peer trading levels1 EV/2018E EBITDA2EV / Proved Reserves ($/Boe)3Adj. EV / Net Acres (Adj. $/Acre)4 Current Liquids Production (%)5Reserve Life (Years)32018E EBITDA Margin ($/Boe)2 Peers include: B
Slide 14: DJ Basin Assets Balance SandRidge Risk Profile
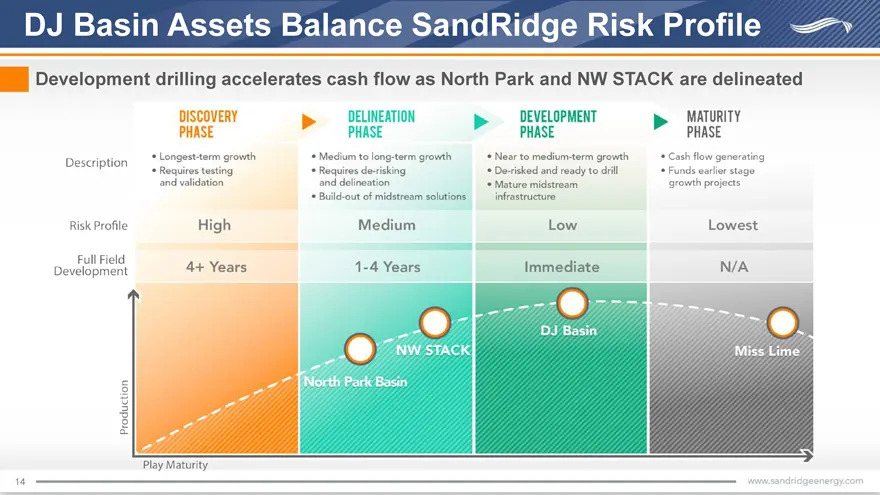
DJ Basin Assets Balance SandRidge Risk Profile Development drilling accelerates cash flow as North Park and NW STACK are delineated 14
Slide 15: North Park in Delineation Phase
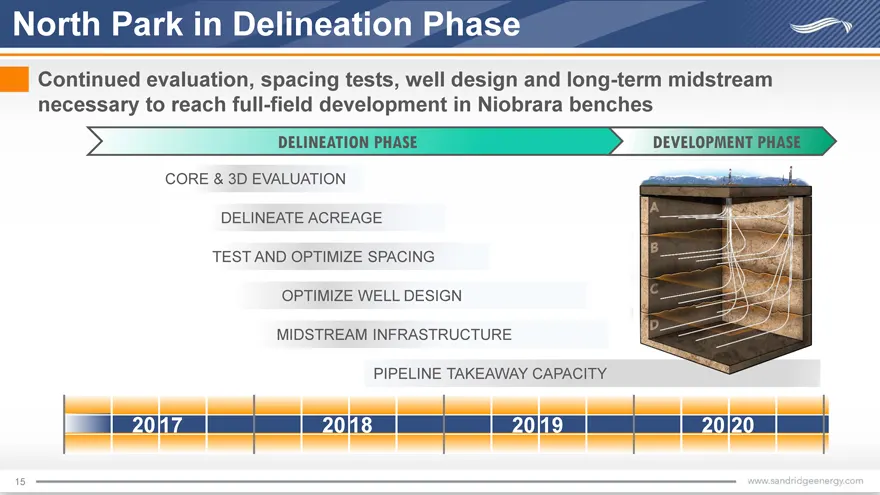
North Park in Delineation Phase Continued evaluation, spacing tests, well design and long-term midstream necessary to reach full-field development in Niobrara benches DELINEATION PHASE DEVELOPMENT PHASE CORE & 3D EVALUATION DELINEATE ACREAGE TEST AND OPTIMIZE SPACING OPTIMIZE WELL DESIGN MIDSTREAM I
Slide 16: NW STACK in Delineation Phase
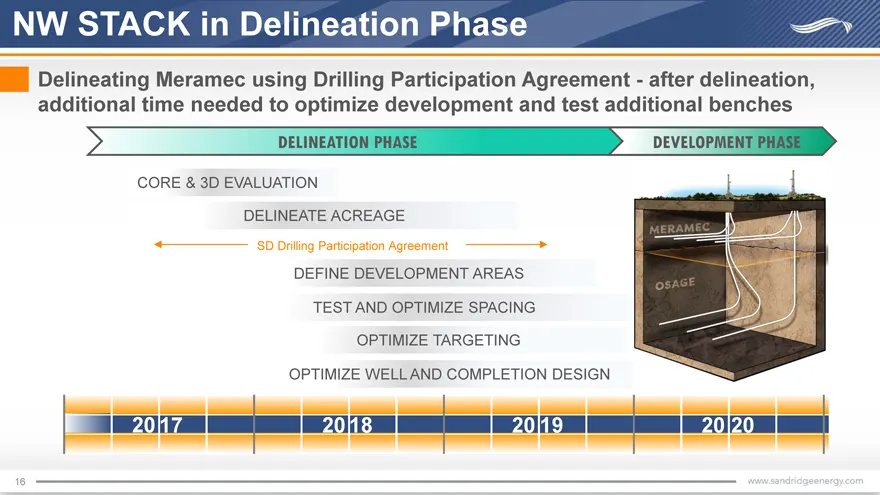
NW STACK in Delineation Phase Delineating Meramec using Drilling Participation Agreement—after delineation, additional time needed to optimize development and test additional benches DELINEATION PHASE DEVELOPMENT PHASE CORE & 3D EVALUATION DELINEATE ACREAGE SD Drilling Participation Agreement DEFINE
Slide 17: NW STACK Play Evaluation
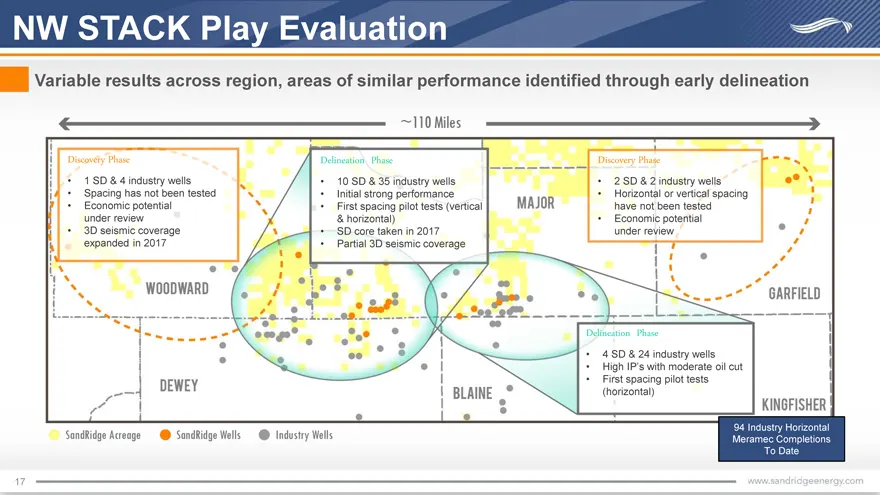
NW STACK Play Evaluation Variable results across region, areas of similar performance identified through early delineation Discovery PhaseDelineation PhaseDiscovery Phase •1 SD & 4 industry wells•10 SD & 35 industry wells•2 SD & 2 industry wells •Spacing has not been tested•Initial strong performanc
Slide 18: DJ Basin in Development Phase
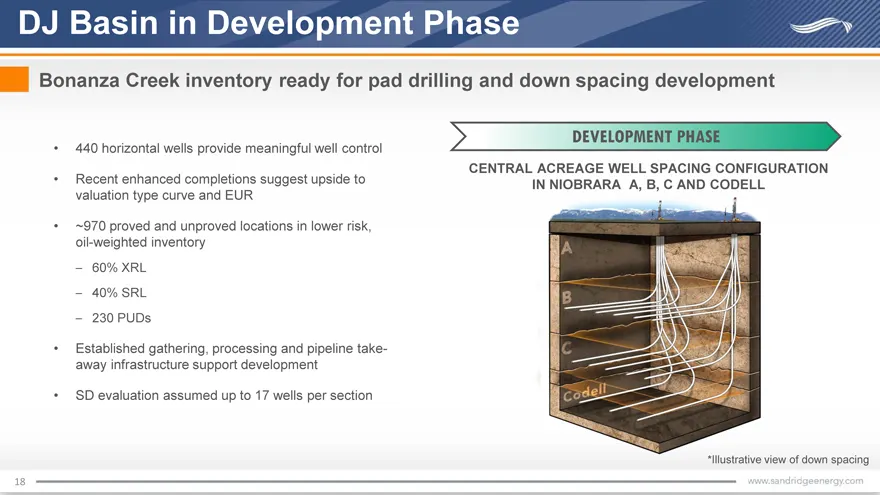
DJ Basin in Development Phase Bonanza Creek inventory ready for pad drilling and down spacing development DEVELOPMENT PHASE • 440 horizontal wells provide meaningful well control CENTRAL ACREAGE WELL SPACING CONFIGURATION • Recent enhanced completions suggest upside to valuation type curve and EUR •
Slide 19: Preliminary Year End 2017 Reserves
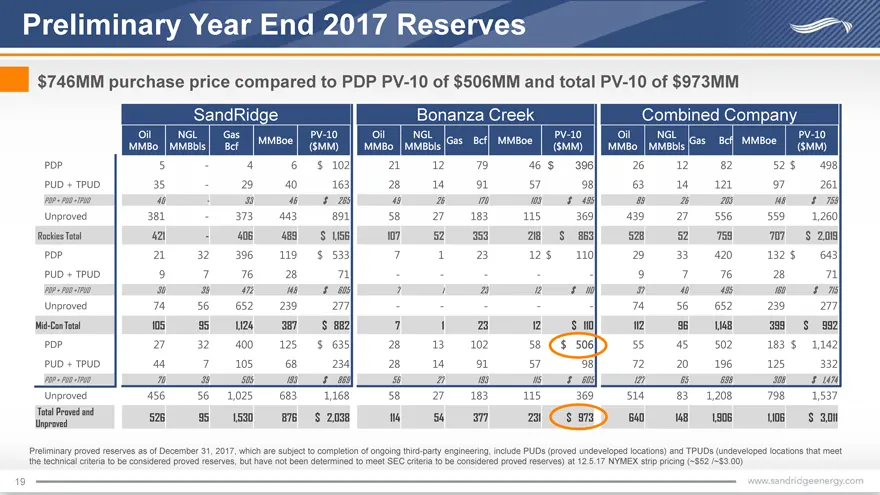
Preliminary Year End 2017 Reserves $746MM purchase price compared to PDP PV-10 of $506MM and total PV-10 of $973MM SandRidgeBonanza CreekCombined Company OilNGLGasPV-10OilNGLPV-10OilNGLPV-10 MMBoeGas Bcf MMBoeGas BcfMMBoe MMBo MMBblsBcf($MM)MMBo MMBbls($MM)MMBo MMBbls($MM) PDP5-46$10221127946$396261
Slide 20: Bonanza Creek DJ Basin Assets
BONANZA CREEK DJ BASIN ASSETS w w w . s a n d r i d g e e n e rg y . c om
Slide 21: Bonanza's DJ Basin Asset
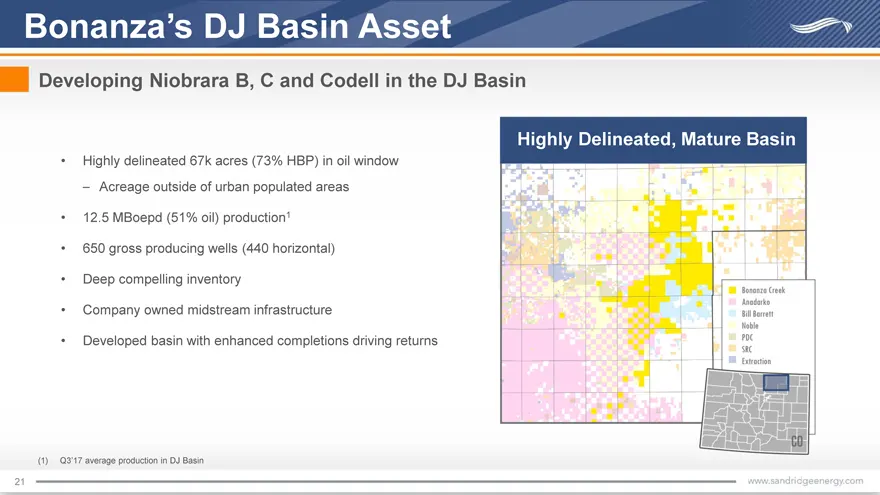
Bonanza’s DJ Basin Asset Developing Niobrara B, C and Codell in the DJ Basin Highly Delineated, Mature Basin • Highly delineated 67k acres (73% HBP) in oil window – Acreage outside of urban populated areas • 12.5 MBoepd (51% oil) production1 • 650 gross producing wells (440 horizontal) • Deep compel
Slide 22: Acreage Position Delineated By Strong Well Performance
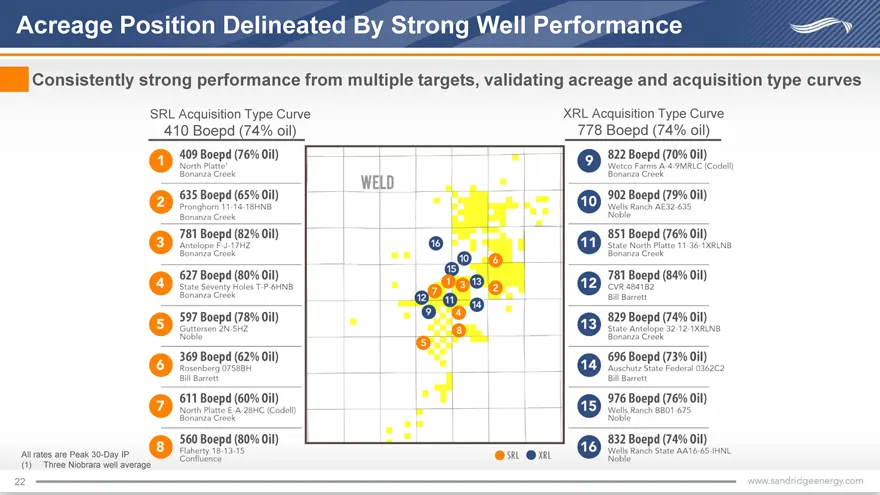
Acreage Position Delineated By Strong Well Performance Consistently strong performance from multiple targets, validating acreage and acquisition type curves All rates are Peak 30-Day (1) Three Niobrara well 22
Slide 23: Enhanced Completion Results
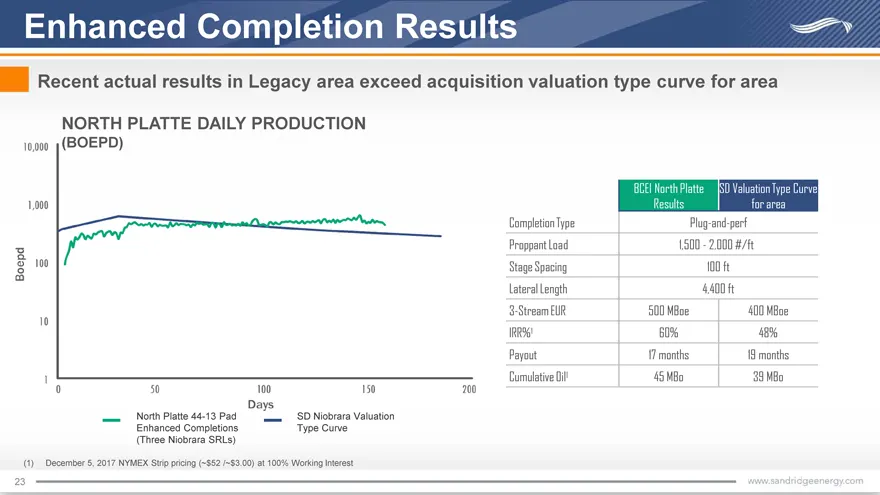
Enhanced Completion Results Recent actual results in Legacy area exceed acquisition valuation type curve for area NORTH PLATTE DAILY PRODUCTION (BOEPD) BCEI North PlatteSD Valuation Type Curve Resultsfor area Completion TypePlug-and-perf Proppant Load1,500—2,000 #/ft___ Stage Spacing100 ft Lateral L
Slide 24: Acquisition Development Plan
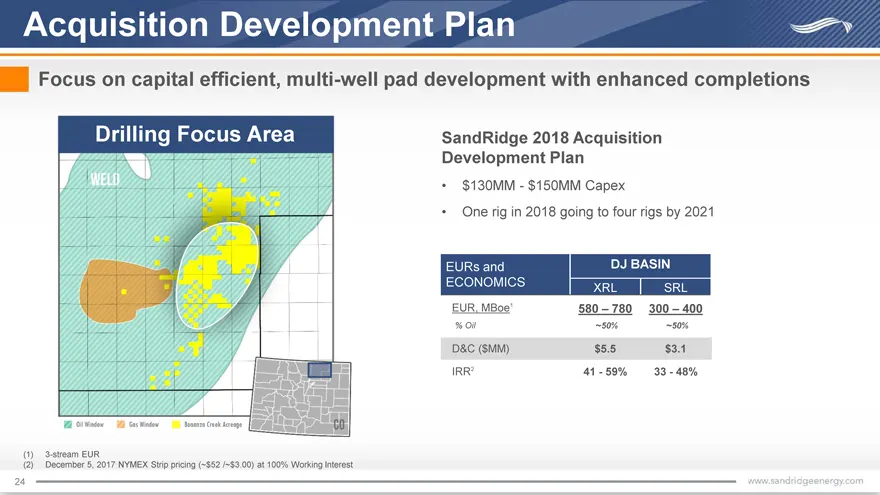
Acquisition Development Plan Focus on capital efficient, multi-well pad development with enhanced completions Drilling Focus AreaSandRidge 2018 Acquisition Development Plan •$130MM—$150MM Capex •One rig in 2018 going to four rigs by 2021 EURs andDJ BASIN ECONOMICSXRLSRL EUR, MBoe1580 – 780300 – 400
Slide 25: RMI Enhances Value of Upstream Assets
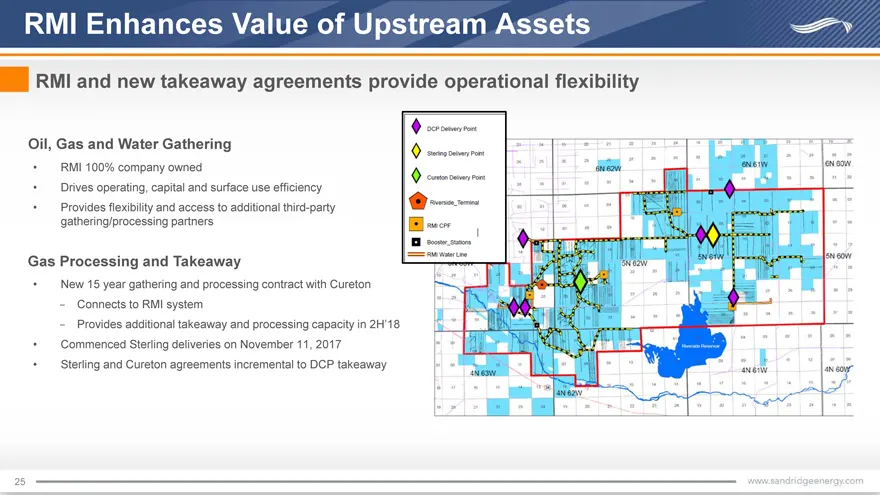
RMI Enhances Value of Upstream Assets RMI and new takeaway agreements provide operational flexibility Oil, Gas and Water Gathering • RMI 100% company owned • Drives operating, capital and surface use efficiency • Provides flexibility and access to additional third-party gathering/processing partners
Slide 26: DJ Development Returns Complementary to Delineation Drilling
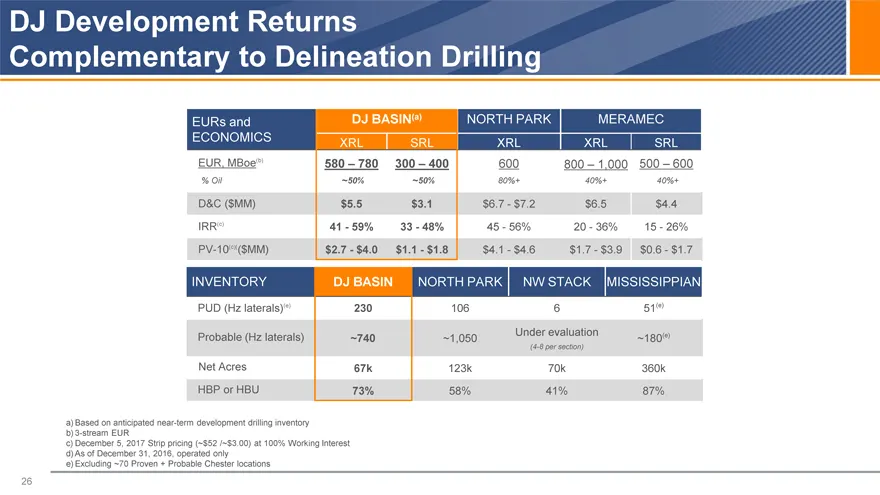
DJ Development Returns Complementary to Delineation Drilling EURs andDJ BASIN(a)NORTH PARKMERAMEC ECONOMICSXRLSRLXRLXRLSRL EUR, MBoe(b)580 – 780300 – 400600800 – 1,000500 – 600 % Oil~50%~50%80%+40%+40%+ D&C ($MM)$5.5$3.1$6.7—$7.2$6.5$4.4 IRR(c)41—59%33—48%45—56%20—36%15—26% PV-10(c)(($MM)$2.7—$4.0$1
Slide 27: Combined Company Preliminary 2018 Outlook
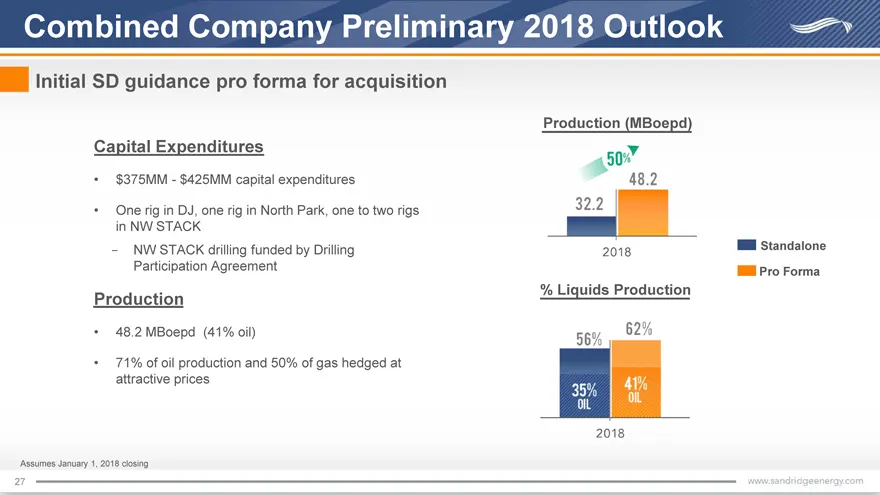
Combined Company Preliminary 2018 Outlook Initial SD guidance pro forma for acquisition Production (MBoepd) Capital Expenditures •$375MM—$425MM capital expenditures •One rig in DJ, one rig in North Park, one to two rigs in NW STACK - NW STACK drilling funded by DrillingStandalone Participation Agree
Slide 28: Setting the Record Straight
eS SETTING THE ———— RECORD STRAIGHT |
Slide 29: Responding To Activists' Objections: Strategic and Economic Sense
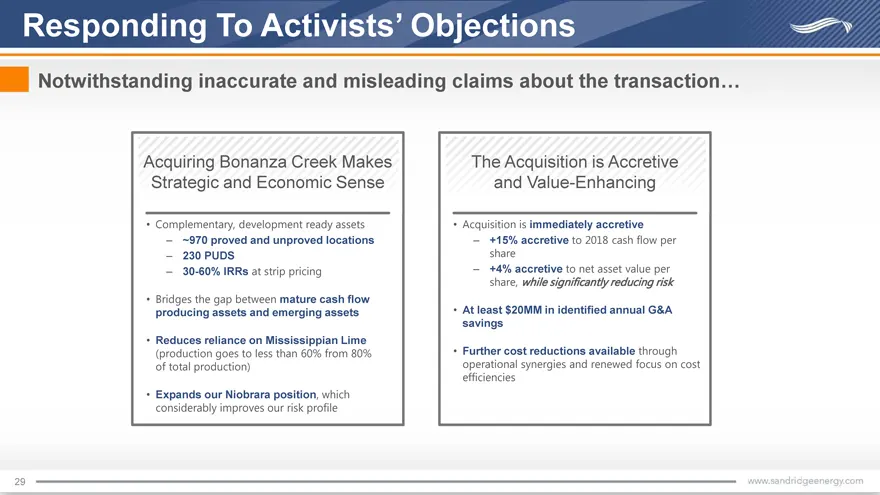
Responding To Activists’ Objections Notwithstanding inaccurate and misleading claims about the transaction Acquiring Bonanza Creek Makes The Acquisition is Accretive Strategic and Economic Senseand Value-Enhancing Complementary, development ready assets Acquisition is immediately accretive ’~970 pro
Slide 30: Responding To Activists' Objections: Fair Price and Cash/Stock Mix
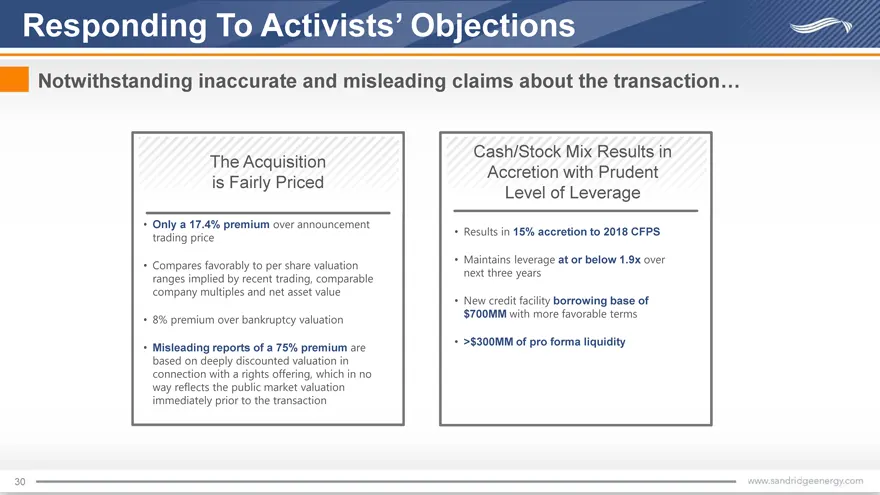
Responding To Activists’ Objections Notwithstanding inaccurate and misleading claims about the transaction… The Acquisition Cash/Stock Mix Results in is Fairly PricedAccretion with Prudent Level of Leverage •Only a 17.4% premium over announcement trading price• Results in 15% accretion to 2018 CFPS
Slide 31: Responding To Activists' Objections: Shareholder Value
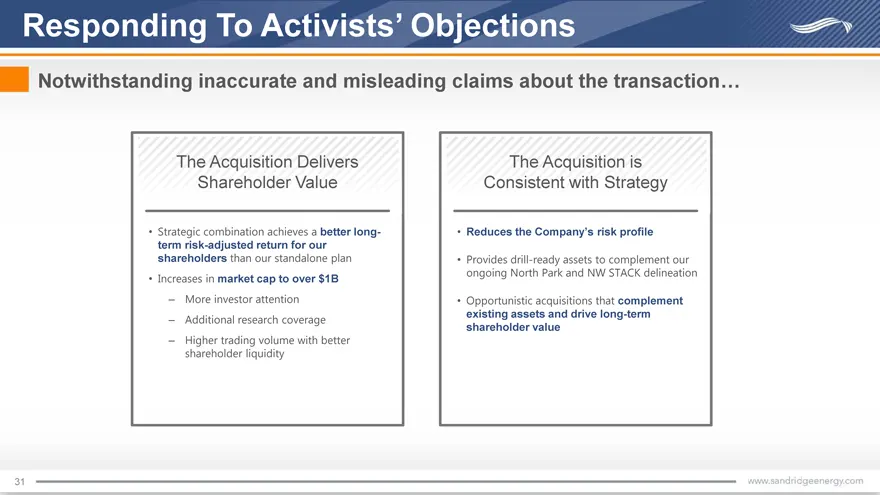
Responding To Activists’ Objections Notwithstanding inaccurate and misleading claims about the transaction… The Acquisition DeliversThe Acquisition is Shareholder ValueConsistent with Strategy •Strategic combination achieves a better long-• Reduces the Company’s risk profile term risk-adjusted retur
Slide 32: Appendix
> APPENDIX <
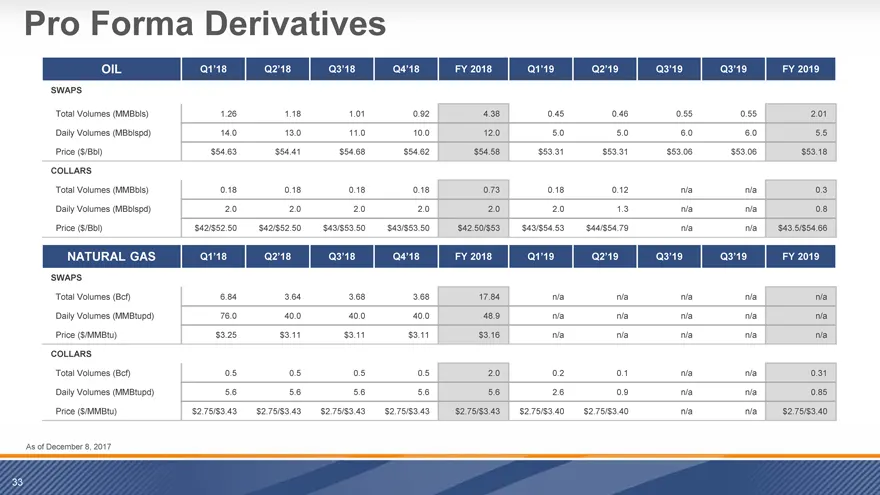
Slide 33: Pro Forma Derivatives
Pro Forma Derivatives OILQ1’18Q2’18Q3’18Q4’18FY 2018Q1’19Q2’19Q3’19Q3’19FY 2019 SWAPS Total Volumes (MMBbls)1.261.181.010.924.380.450.460.550.552.01 Daily Volumes (MBblspd)14.013.011.010.012.05.05.06.06.05.5 Price ($/Bbl)$54.63$54.41$54.68$54.62$54.58$53.31$53.31$53.06$53.06$53.18 COLLARS Total Volu
Source: SEC EDGAR · 425 filed Dec 13, 2017
More decks from Civitas Resources Inc
 Merger or Acquisition (November 2025)14 slides · Nov 17, 2025
 Merger or Acquisition (November 2025)14 slides · Nov 3, 2025
 Merger or Acquisition (November 2025)10 slides · Nov 3, 2025
 Q2 2025 Earnings Presentation22 slides · Aug 7, 2025
 Q4 2024 Earnings Presentation31 slides · February 2025
 Q3 2024 Earnings Presentation27 slides · Nov 8, 2024