Ascom Holding AG · SIX:ASCN
Ascom — H1 2012 Earnings Presentation
54 slides from Ascom's earnings presentation, Aug 22, 2012
Slide 1: Welcome to the Ascom Media & Analyst Conference 2012 Half-Year Results
WELCOME TO THE ASCOM MEDIA & ANALYST CONFERENCE 2012 HALF-YEAR RESULTS
Slide 2: 2012 Half-Year Results
[ ] 2012 HALF-YEAR RESULTS FRITZ MUMENTHALER, CEO MARTIN ZWYSSIG, CFO 2012 Half-Year Results Conference, 22/08/2012 © Ascom Group 2
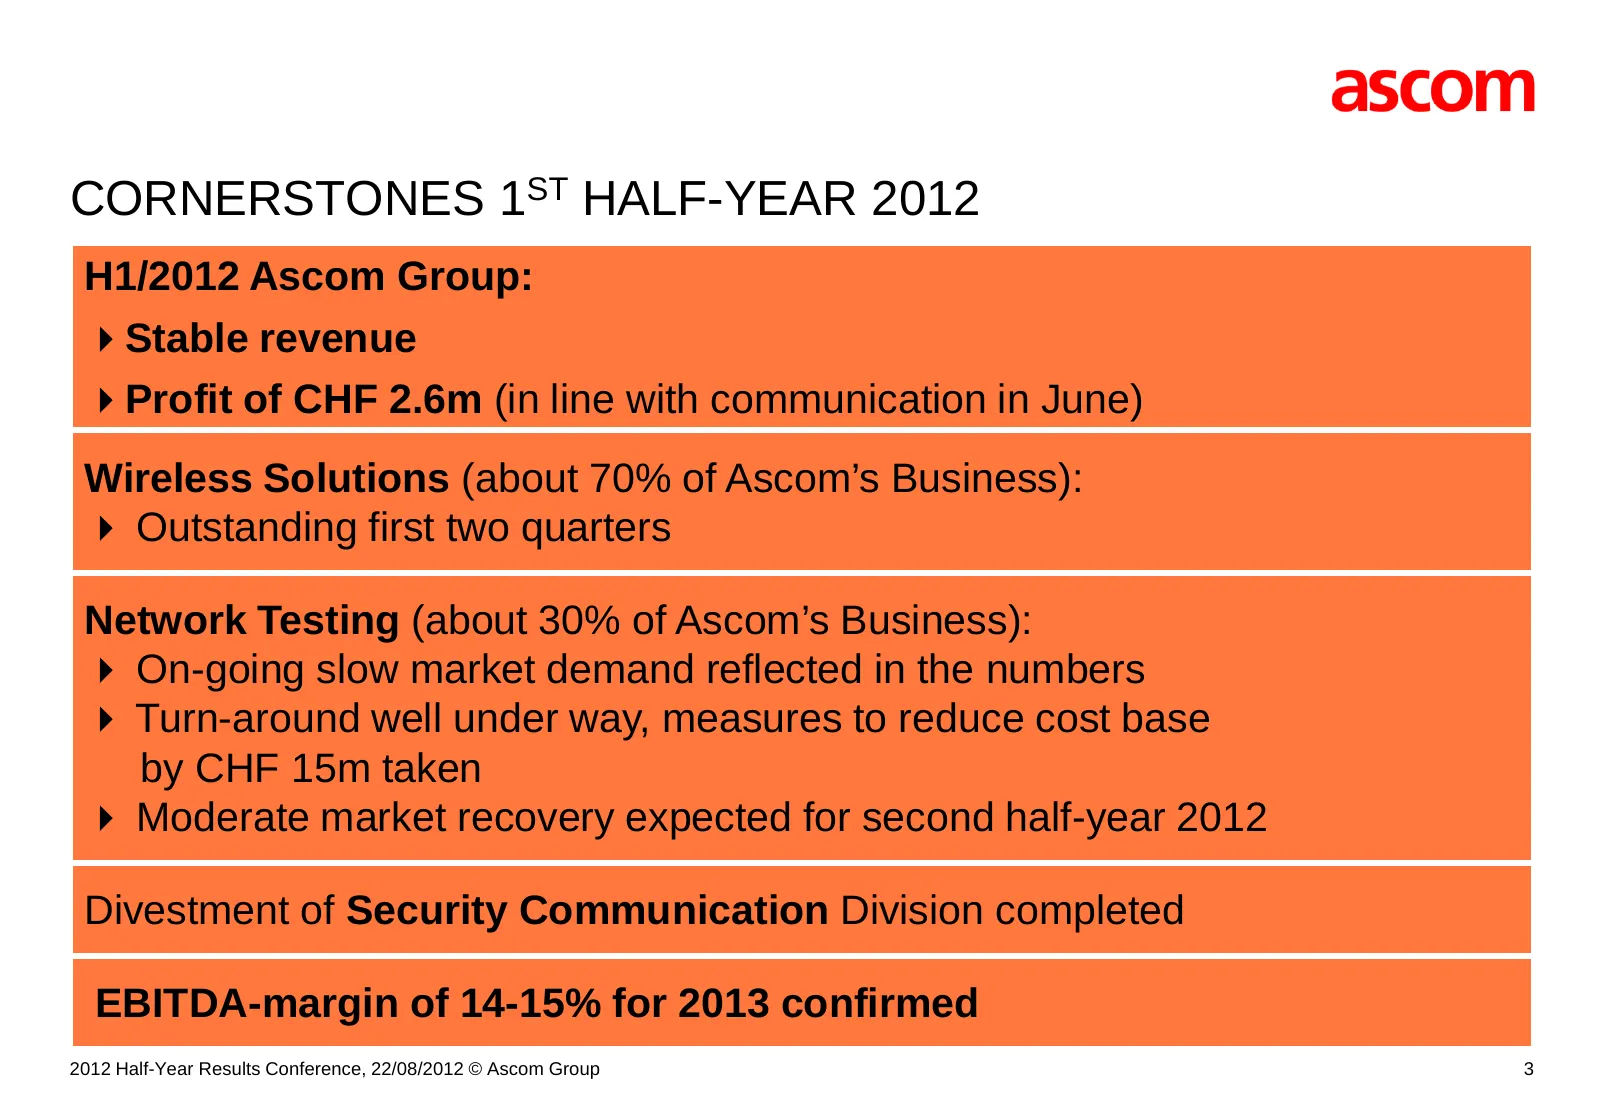
Slide 3: Cornerstones 1st Half-Year 2012
CORNERSTONES 1ST HALF-YEAR 2012 H1/2012 Ascom Group: Stable revenue Profit of CHF 2.6m (in line with communication in June) Wireless Solutions (about 70% of Ascom’s Business): Outstanding first two quarters Network Testing (about 30% of Ascom’s Business): On-going slow market demand reflected
Slide 4: Agenda
[ ] AGENDA 2012 HALF-YEAR RESULTS AT A GLANCE BUSINESS DEVELOPMENT 2012 HALF-YEAR FINANCIAL RESULTS SUMMARY AND OUTLOOK 2012 Half-Year Results Conference, 22/08/2012 © Ascom Group 4

Slide 5: 2012 Half-Year Results at a Glance
[ ] 2012 HALF-YEAR RESULTS AT A GLANCE 2012 Half-Year Results Conference, 22/08/2012 © Ascom Group 5
Slide 6: Stable Revenues
STABLE REVENUES Stable revenue development for continuing operations Wireless Solutions: Revenue growth in local currencies 9.7%. Market position in Health Care further improved. Network Testing: Decrease of revenue by 12.7% in local currencies reflects continuing slow market demand. Market shar
Slide 7: Profit as Communicated in June
PROFIT AS COMMUNICATED IN JUNE Group profit impacted by restructuring charges and NT performance Net profit: CHF 2.6m (H1/2011: CHF 9.0m) includes restructuring expenses of CHF 8.8m EBITDA for continuing operations CHF 10.7m (H1/2011: CHF 27.8m) Wireless Solutions Gross margin improved by anot
Slide 8: Divestment Security Communication Completed
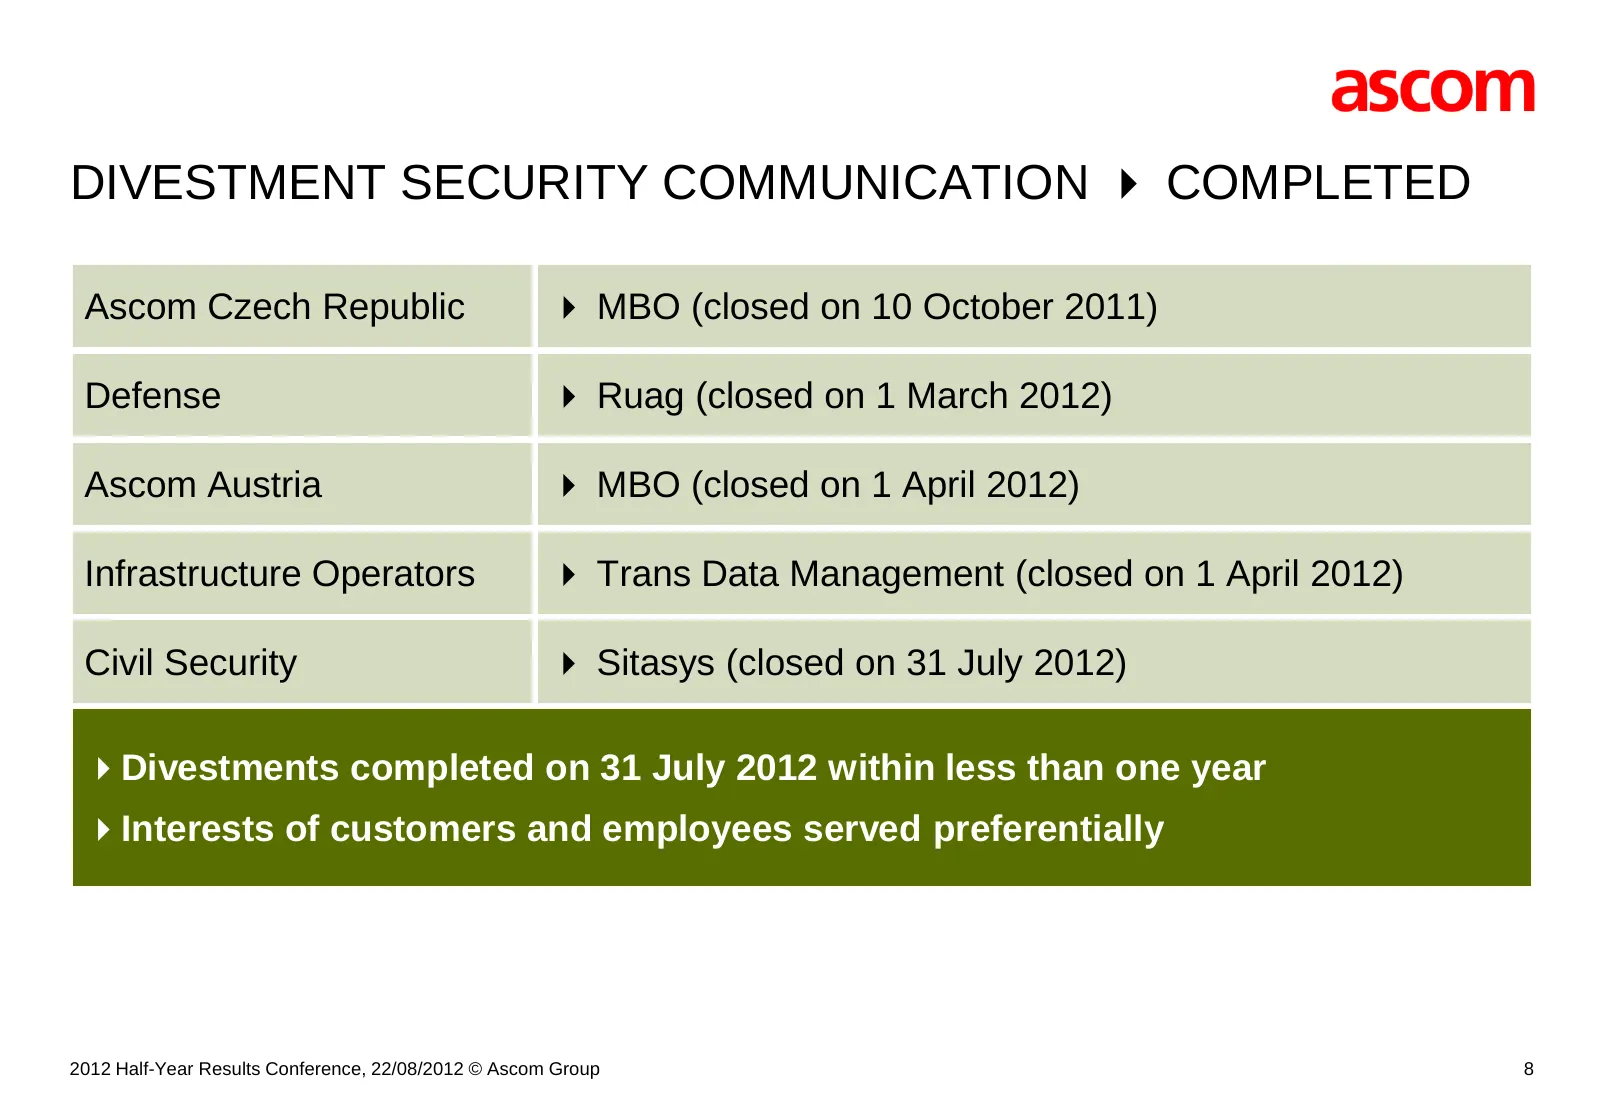
DIVESTMENT SECURITY COMMUNICATION COMPLETED Ascom Czech Republic MBO (closed on 10 October 2011) Defense Ruag (closed on 1 March 2012) Ascom Austria MBO (closed on 1 April 2012) Infrastructure Operators Trans Data Management (closed on 1 April 2012) Civil Security Sitasys (closed on 31 J
Slide 9: Business Development
[ ] BUSINESS DEVELOPMENT WIRELESS SOLUTIONS NETWORK TESTING 2012 Half-Year Results Conference, 22/08/2012 © Ascom Group 9
Slide 10: Wireless Solutions
[ ] WIRELESS SOLUTIONS www.ascom.com/ws 2012 Half-Year Results Conference, 22/08/2012 © Ascom Group 10
Slide 11: Wireless Solutions – Excellent Results in H1/12
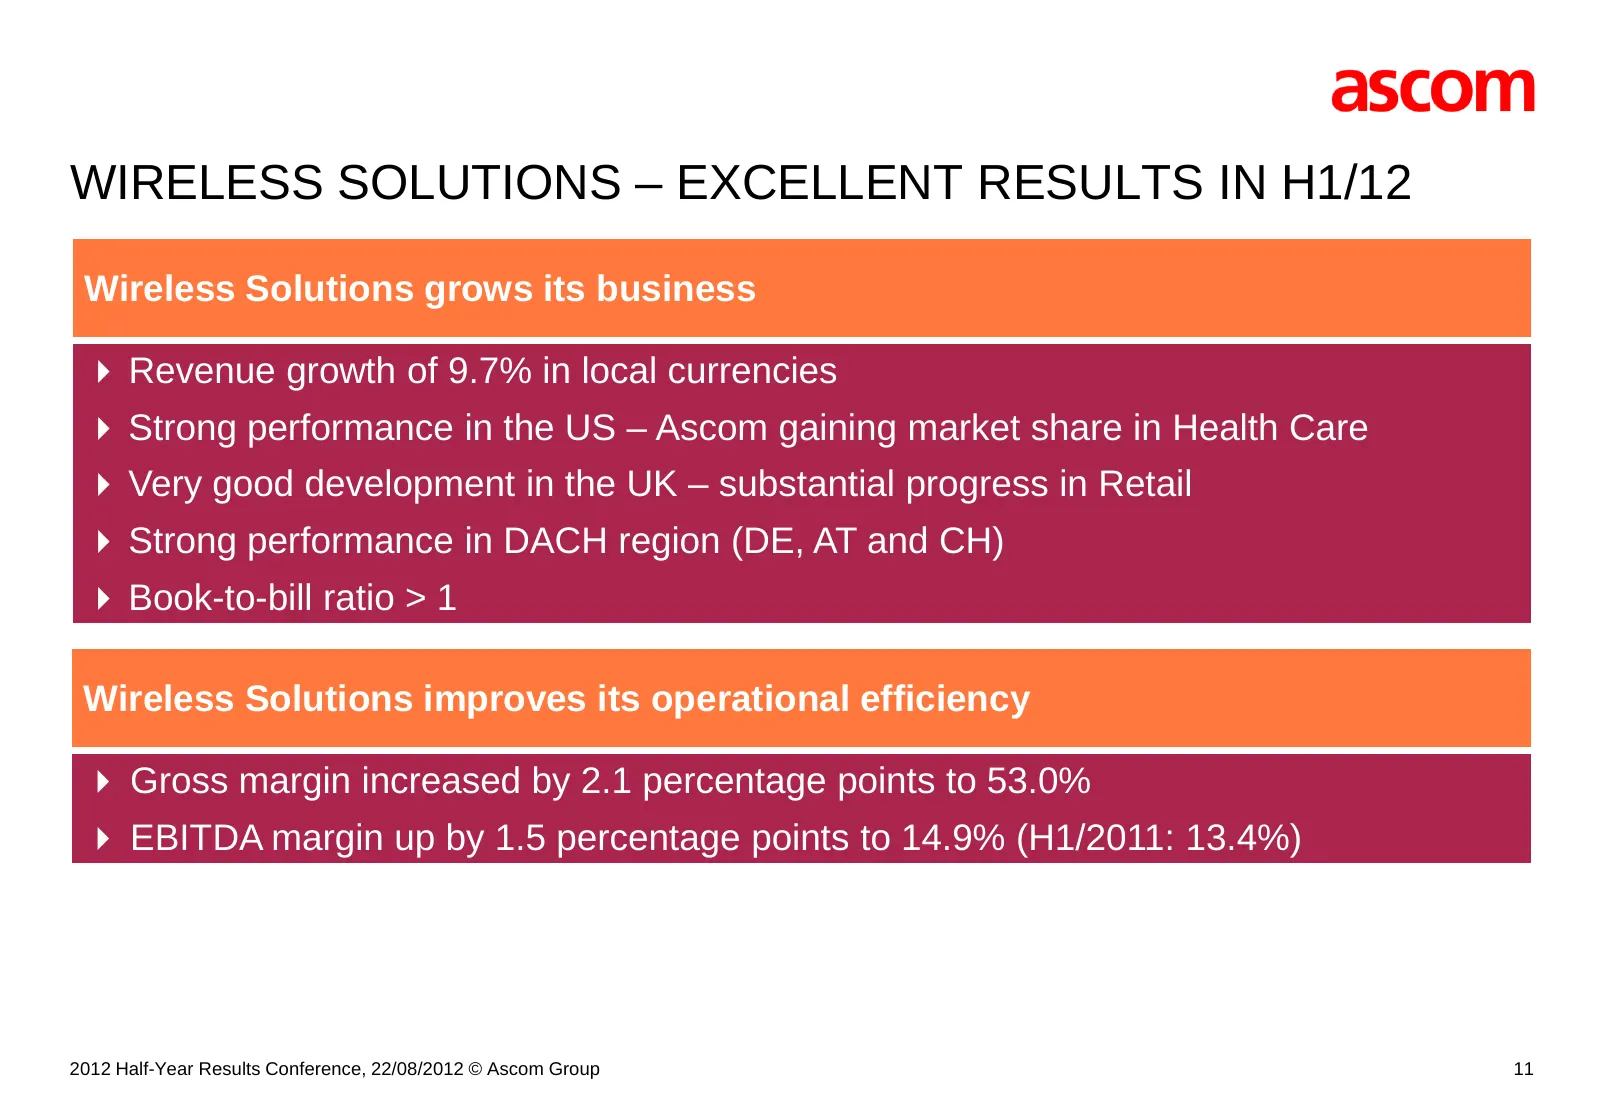
WIRELESS SOLUTIONS – EXCELLENT RESULTS IN H1/12 Wireless Solutions grows its business Revenue growth of 9.7% in local currencies Strong performance in the US – Ascom gaining market share in Health Care Very good development in the UK – substantial progress in Retail Strong performance in DAC
Slide 12: Wireless Solutions – Achievements
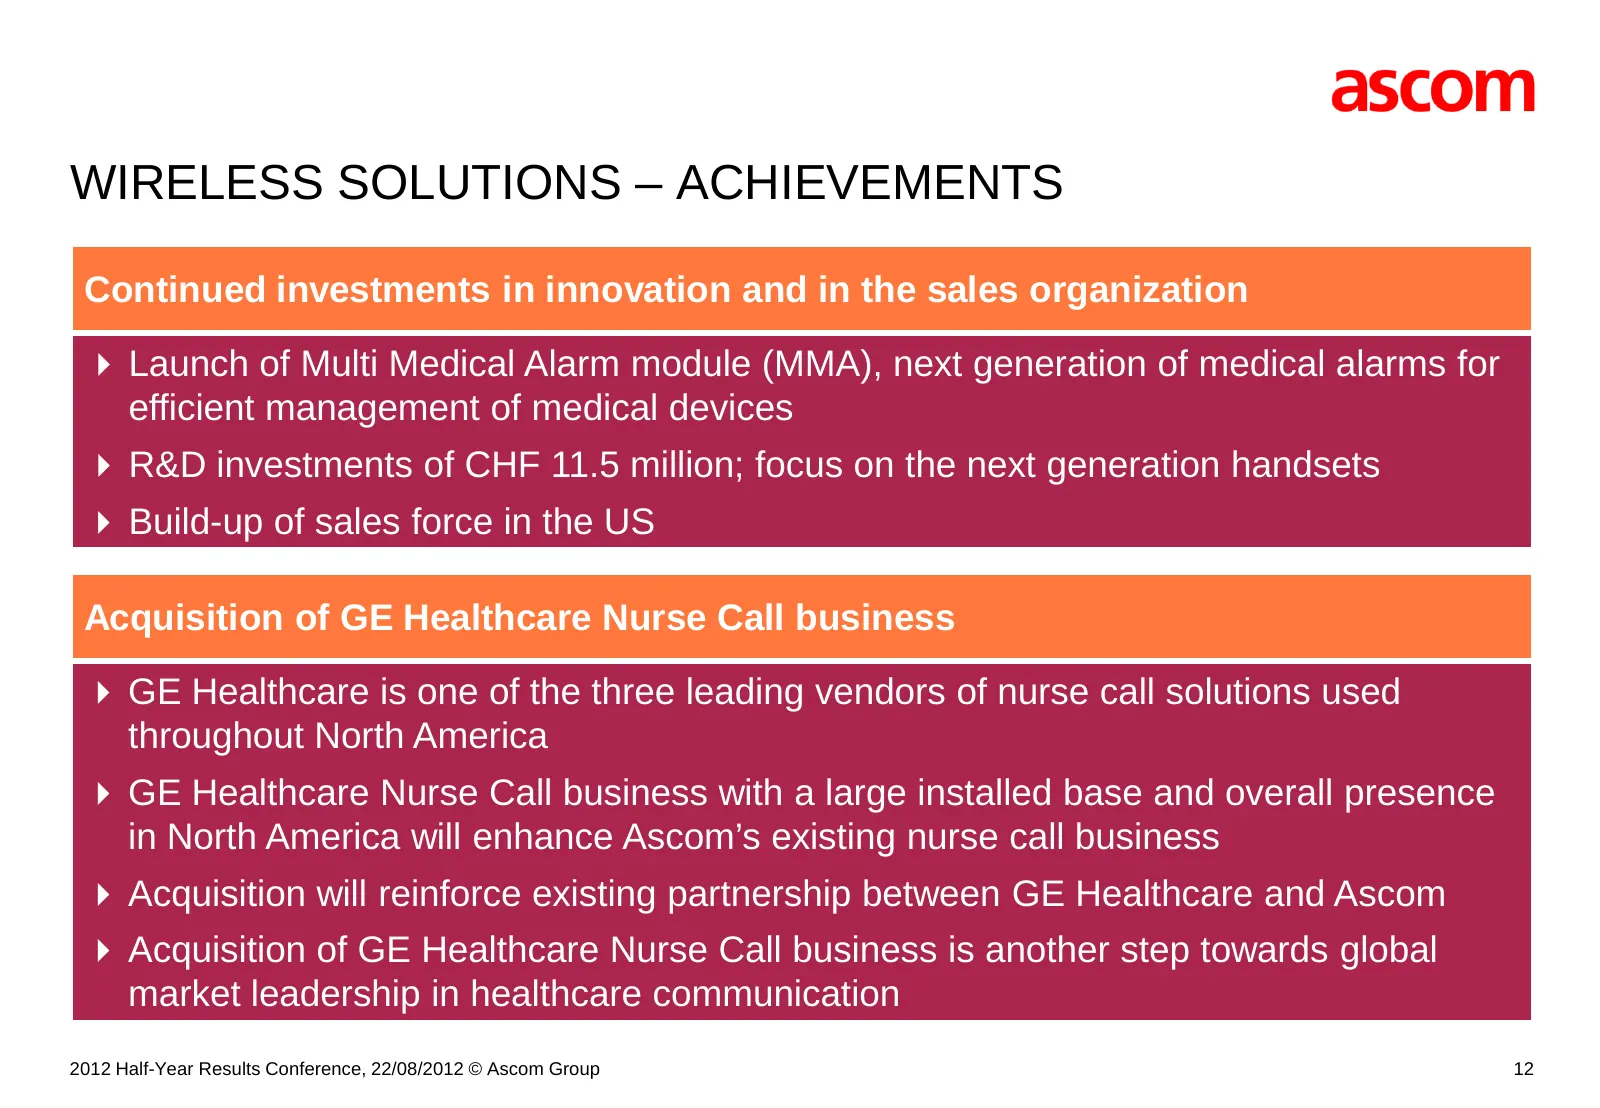
WIRELESS SOLUTIONS – ACHIEVEMENTS Continued investments in innovation and in the sales organization Launch of Multi Medical Alarm module (MMA), next generation of medical alarms for efficient management of medical devices R&D investments of CHF 11.5 million; focus on the next generation handsets
Slide 13: Ascom's USP
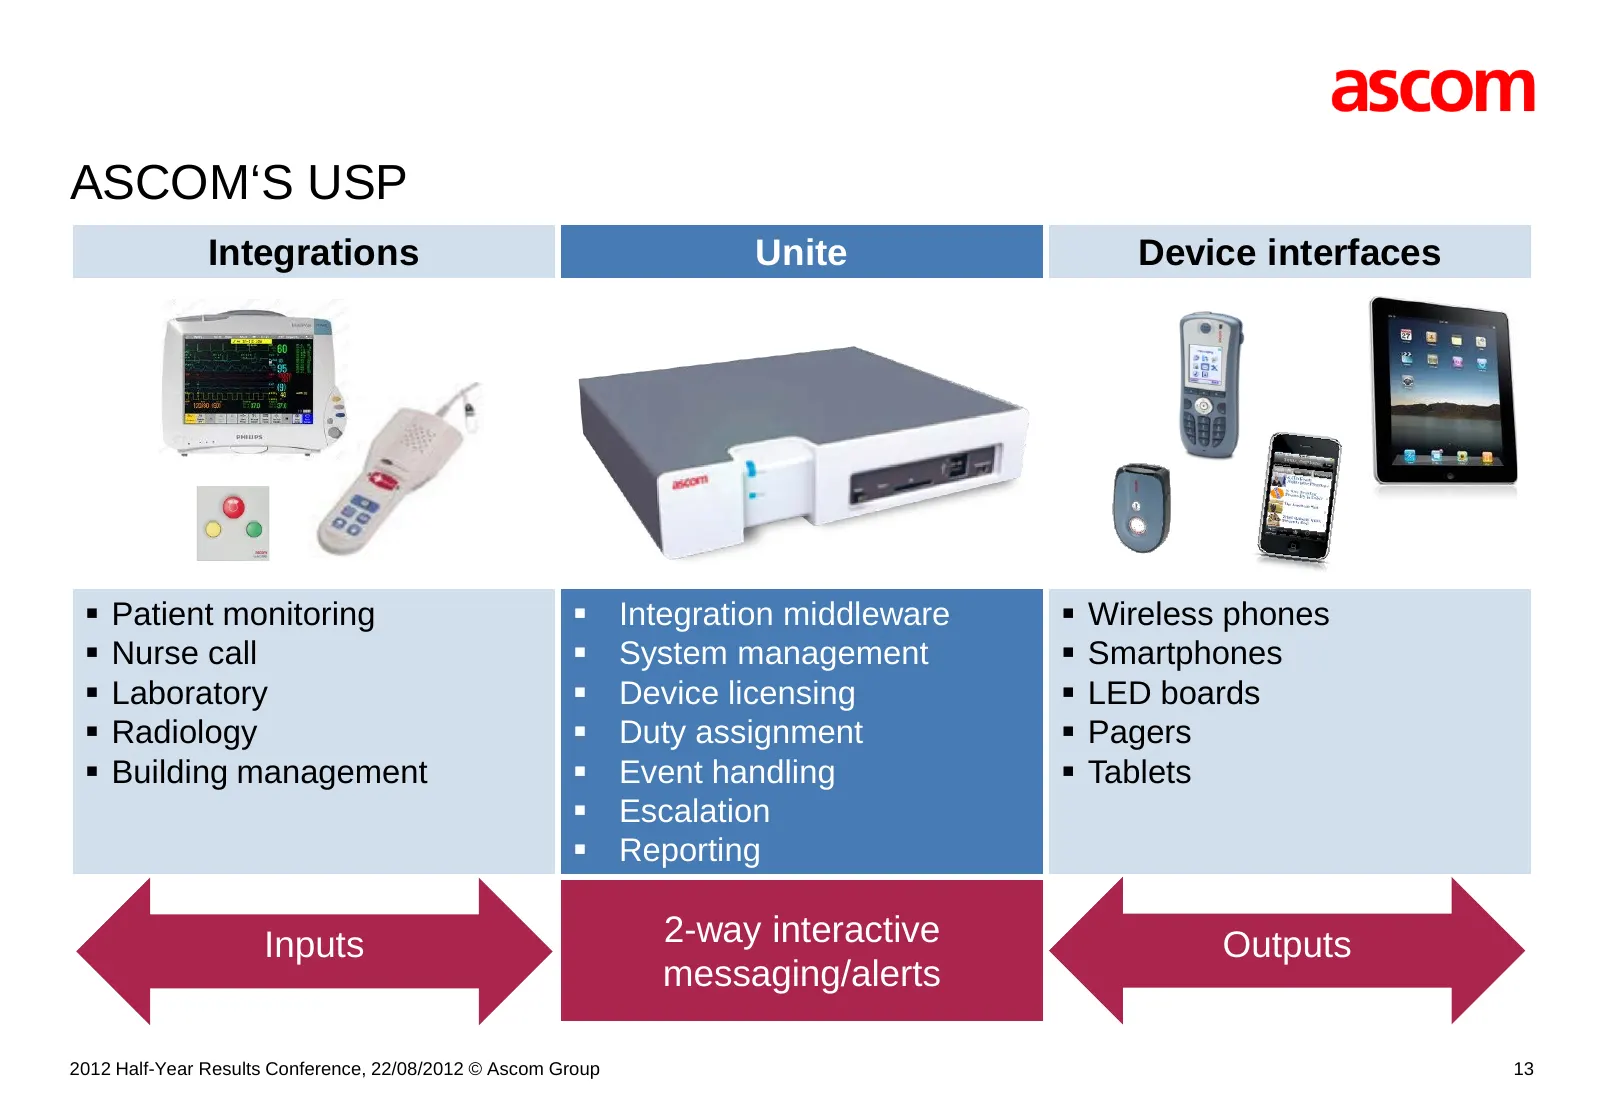
ASCOM‘S USP Integrations Unite Device interfaces Patient monitoring Integration middleware Wireless phones Nurse call System management Smartphones Laboratory Device licensing LED boards Radiology Duty assignment Pagers Building management Event handling Tablets Escal
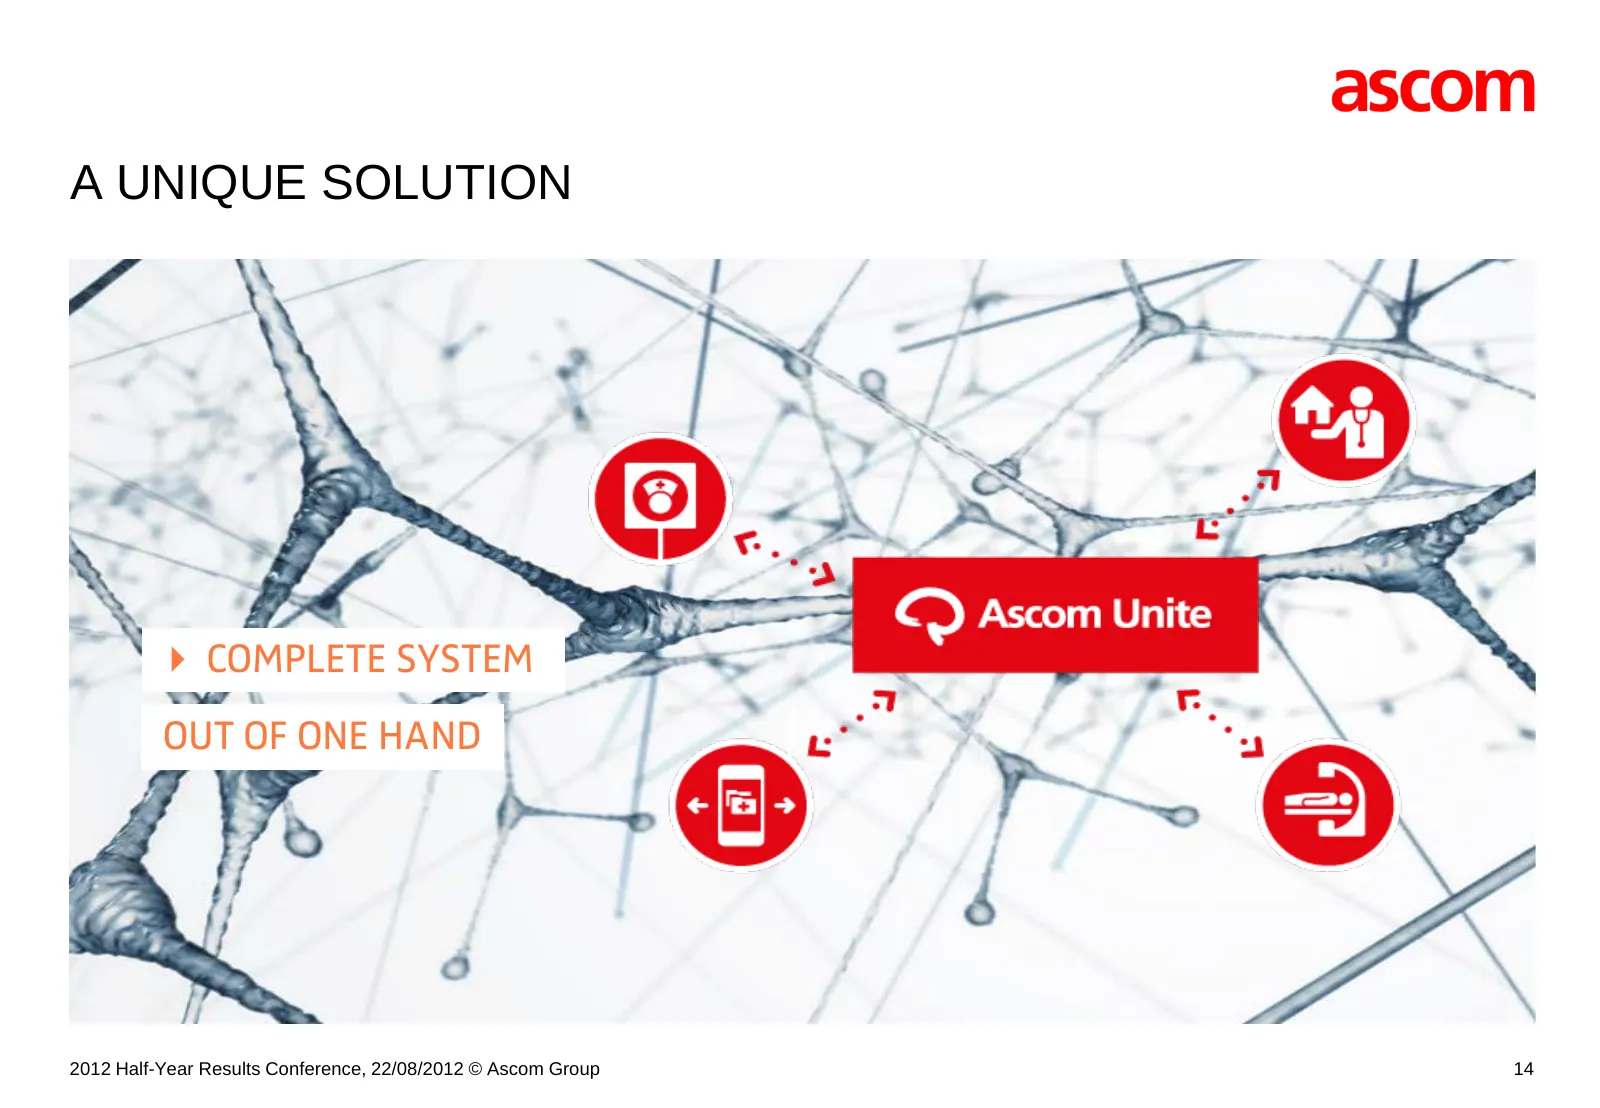
Slide 14: A Unique Solution – Complete System out of One Hand
A UNIQUE SOLUTION COMPLETE SYSTEM OUT OF ONE HAND 2012 Half-Year Results Conference, 22/08/2012 © Ascom Group 14
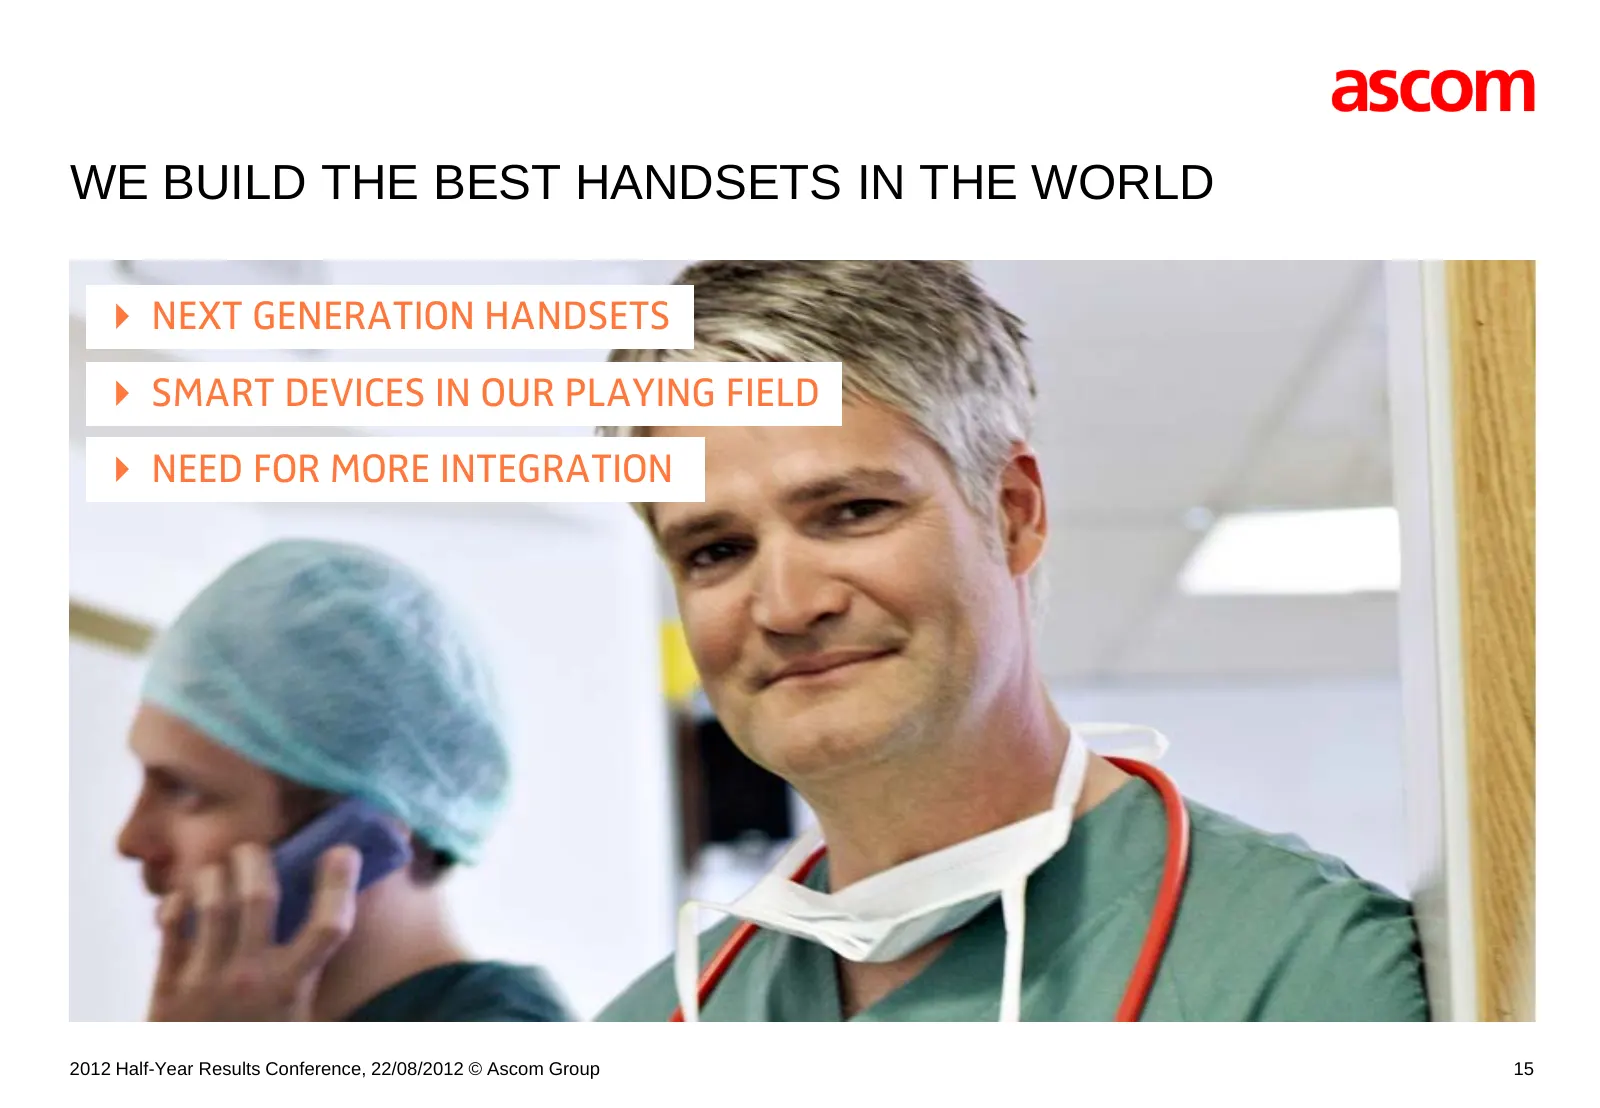
Slide 15: We Build the Best Handsets in the World
WE BUILD THE BEST HANDSETS IN THE WORLD NEXT GENERATION HANDSETS SMART DEVICES IN OUR PLAYING FIELD NEED FOR MORE INTEGRATION 2012 Half-Year Results Conference, 22/08/2012 © Ascom Group 15

Slide 16: An International Nurse Call Provider
AN INTERNATIONAL NURSE CALL PROVIDER COMPLETE SYSTEM CLOSELY INTEGRATED WITH UNITE TRULY GLOBAL USE THE MOMENTUM OF IP 2012 Half-Year Results Conference, 22/08/2012 © Ascom Group 16

Slide 17: Network Testing
[ ] NETWORK TESTING www.ascom.com/nt 2012 Half-Year Results Conference, 22/08/2012 © Ascom Group 17
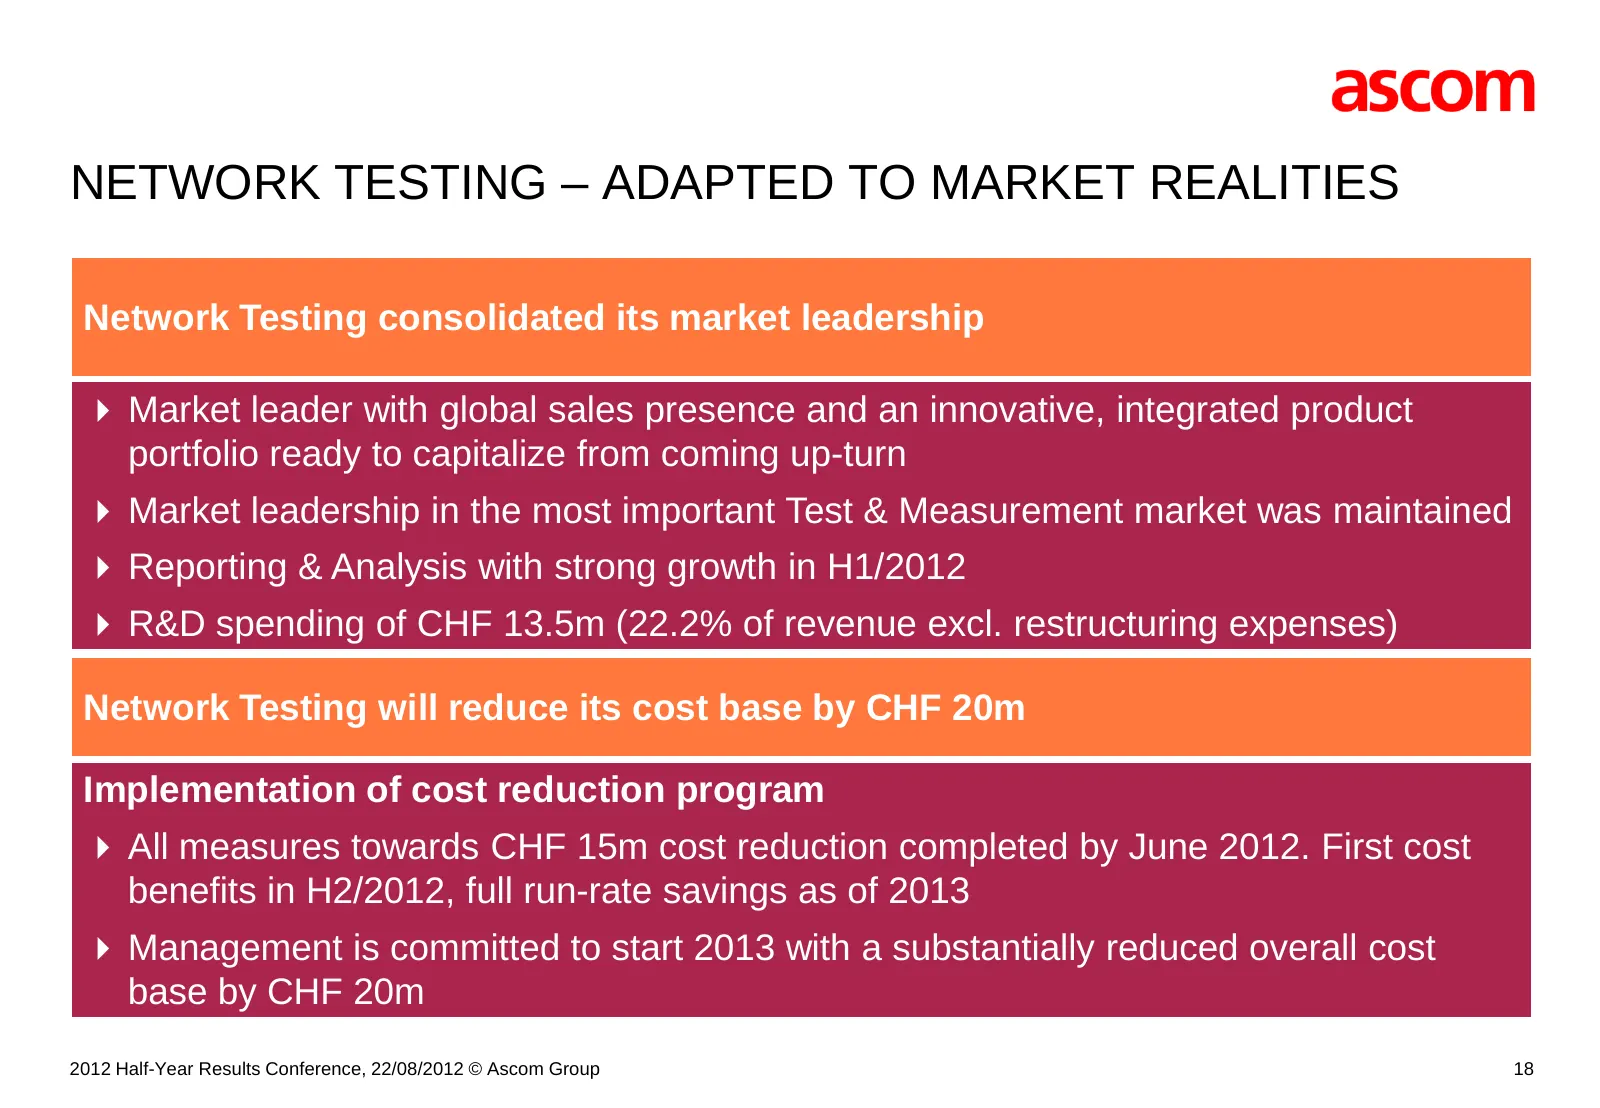
Slide 18: Network Testing – Adapted to Market Realities
NETWORK TESTING – ADAPTED TO MARKET REALITIES Network Testing consolidated its market leadership Market leader with global sales presence and an innovative, integrated product portfolio ready to capitalize from coming up-turn Market leadership in the most important Test & Measurement market was
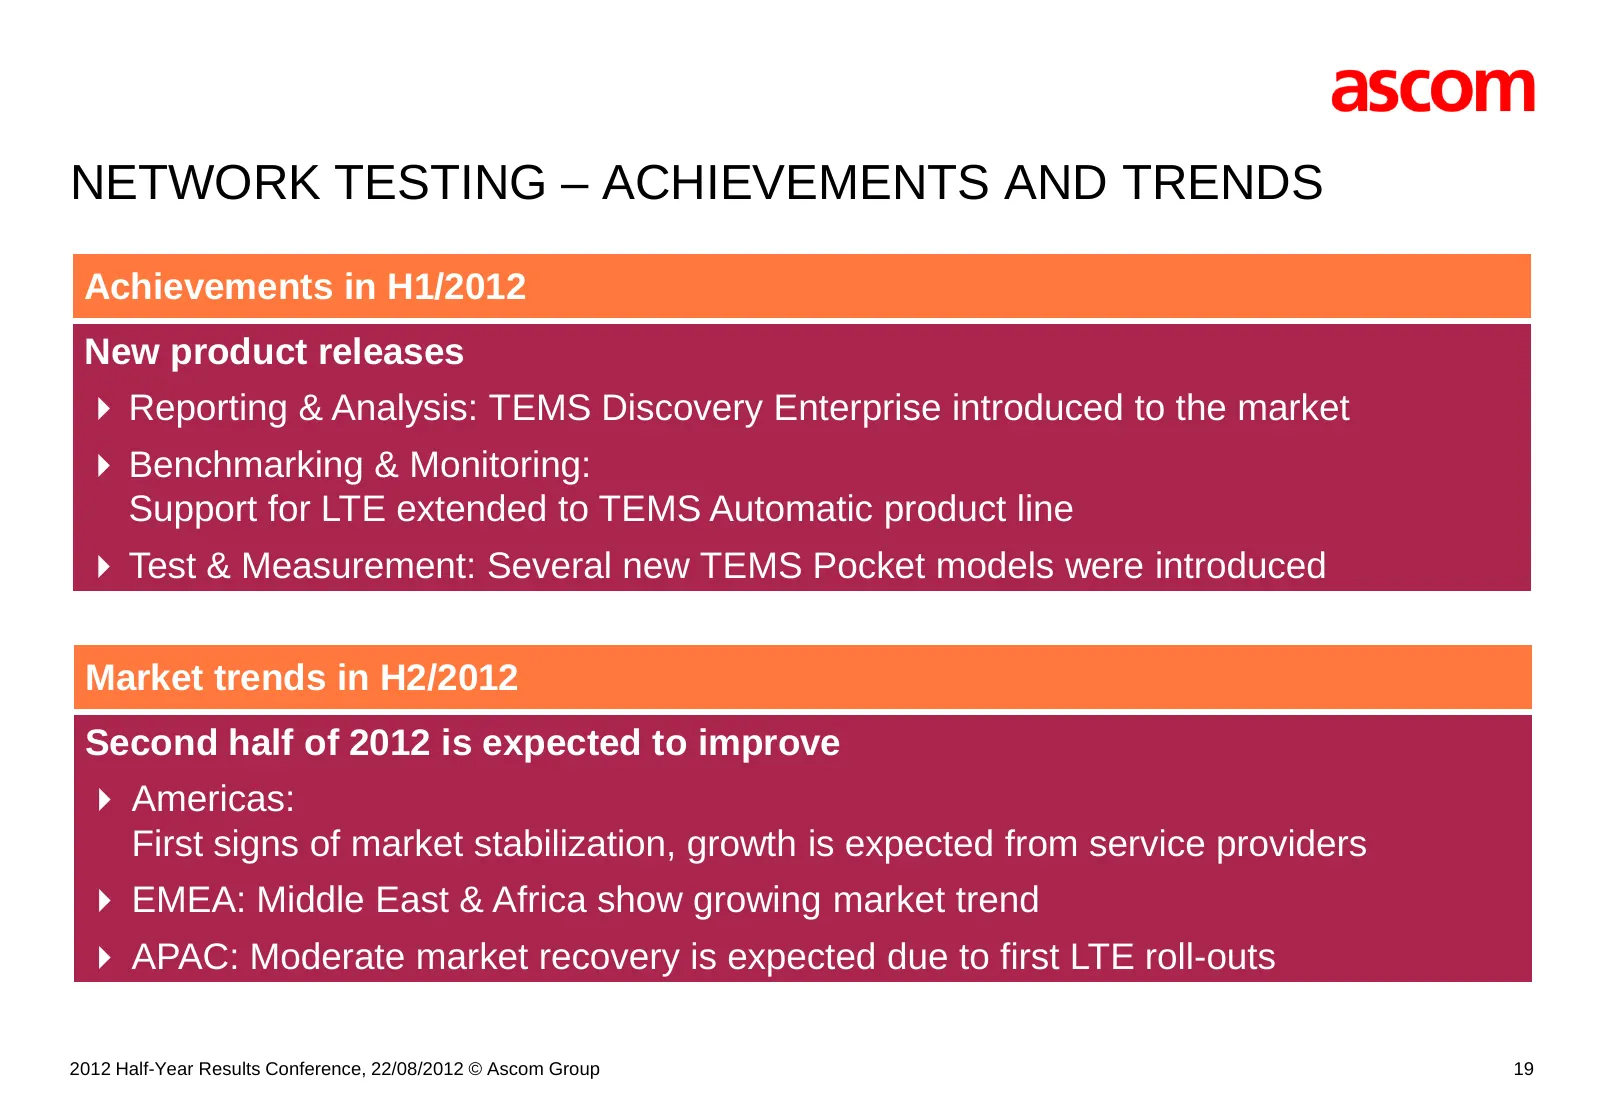
Slide 19: Network Testing – Achievements and Trends
NETWORK TESTING – ACHIEVEMENTS AND TRENDS Achievements in H1/2012 New product releases Reporting & Analysis: TEMS Discovery Enterprise introduced to the market Benchmarking & Monitoring: Support for LTE extended to TEMS Automatic product line Test & Measurement: Several new TEMS Pocket models

Slide 20: Network Testing: The Market
[ ] NETWORK TESTING: THE MARKET www.ascom.com/nt 2012 Half-Year Results Conference, 22/08/2012 © Ascom Group 20
Slide 21: Network Testing – Demanding Environment in H1/2012
NETWORK TESTING – DEMANDING ENVIRONMENT IN H1/2012 Harsh market environment Mobile network operators continued to focus on cost-saving programs for investments and operational expenses Investment in LTE networks continues being pushed out Further decline in the demand for mobile network infras
Slide 22: Market – Network Equipment Manufacturers
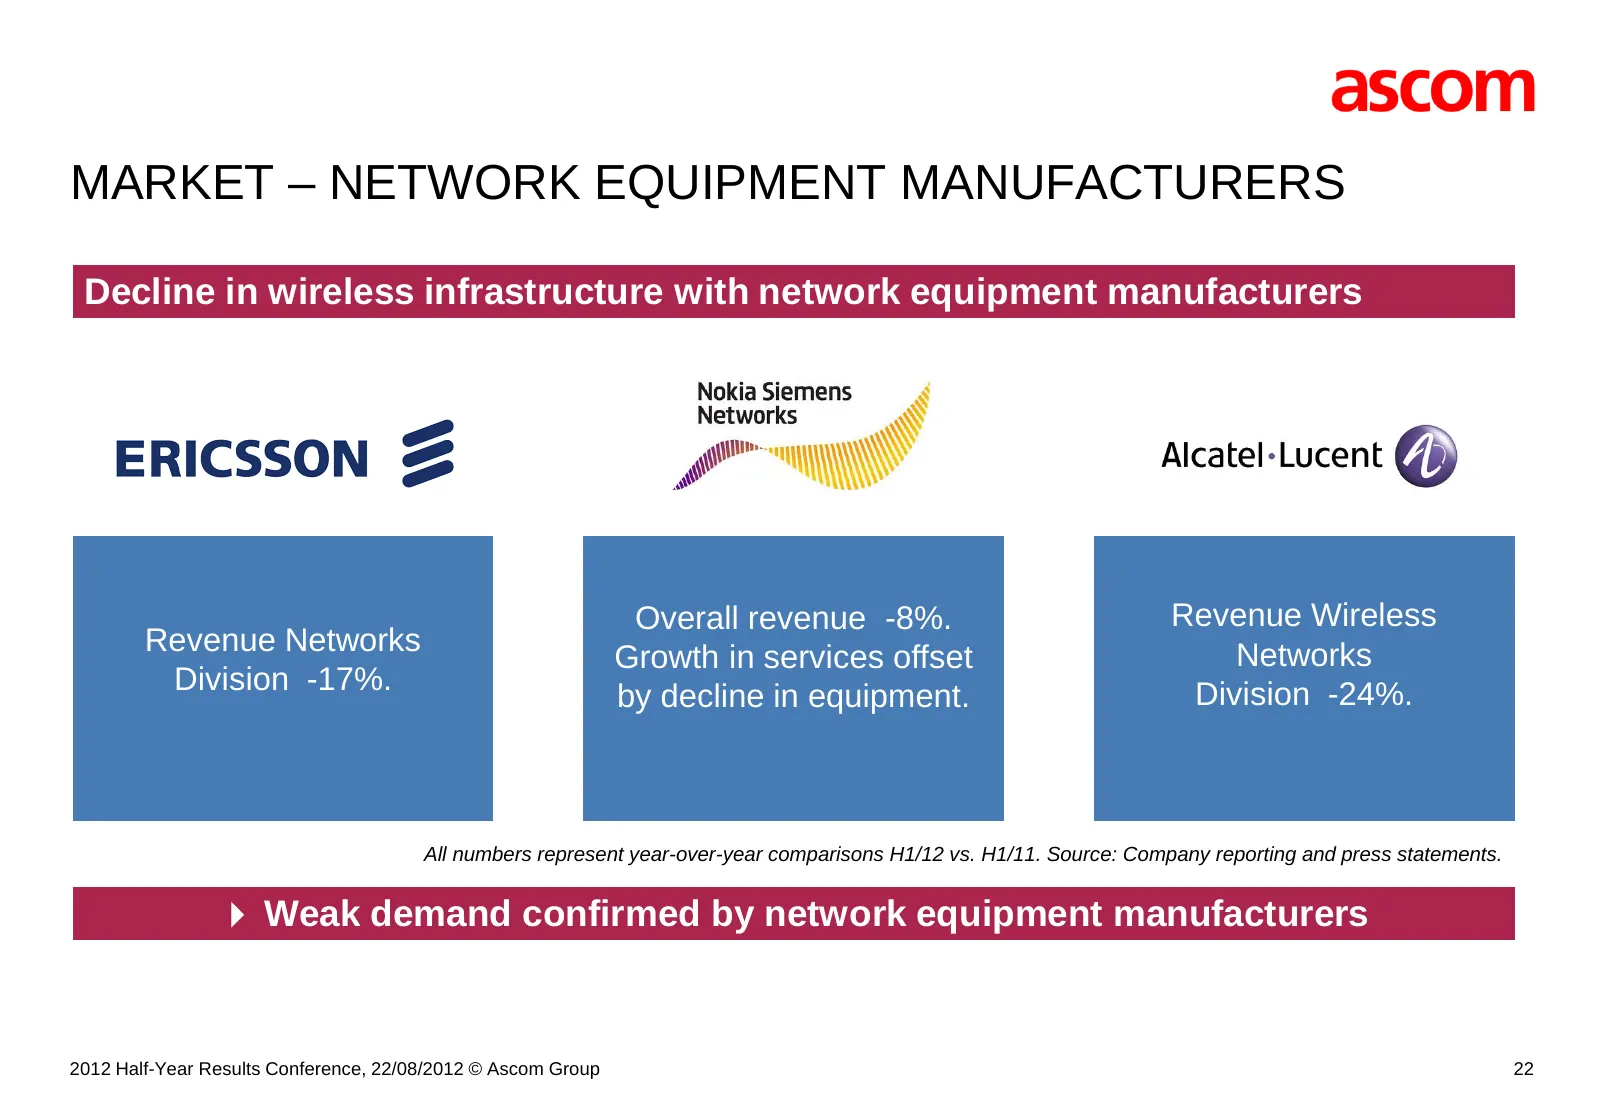
MARKET – NETWORK EQUIPMENT MANUFACTURERS Decline in wireless infrastructure with network equipment manufacturers Overall revenue -8%. Revenue Wireless Revenue Networks Networks Growth in services offset Division -17%. Division -24%. by decline in equipment. All numbers represent year-over-year compa
Slide 23: The Ascom Advantage
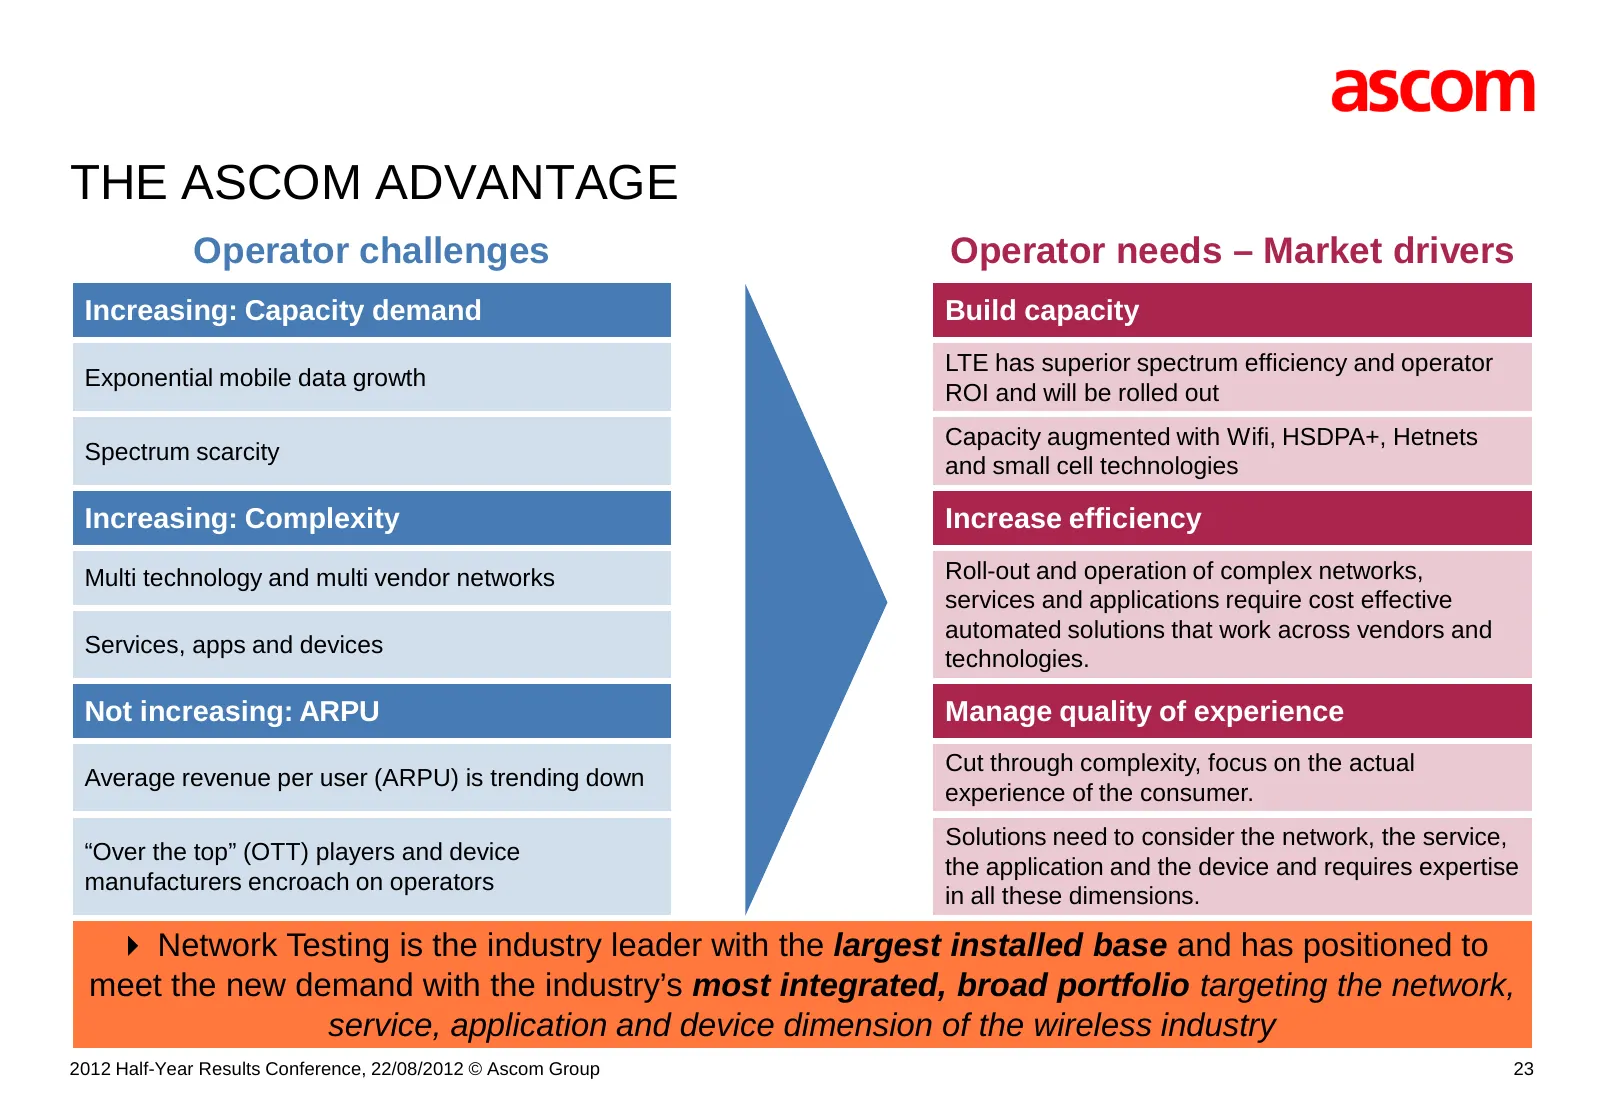
THE ASCOM ADVANTAGE Operator challenges Operator needs – Market drivers Increasing: Capacity demand Build capacity LTE has superior spectrum efficiency and operator Exponential mobile data growth ROI and will be rolled out Capacity augmented with Wifi, HSDPA+, Hetnets Spectrum scarcity and small cel
Slide 24: Exponential Data Growth Leading to Pressure on Capacity
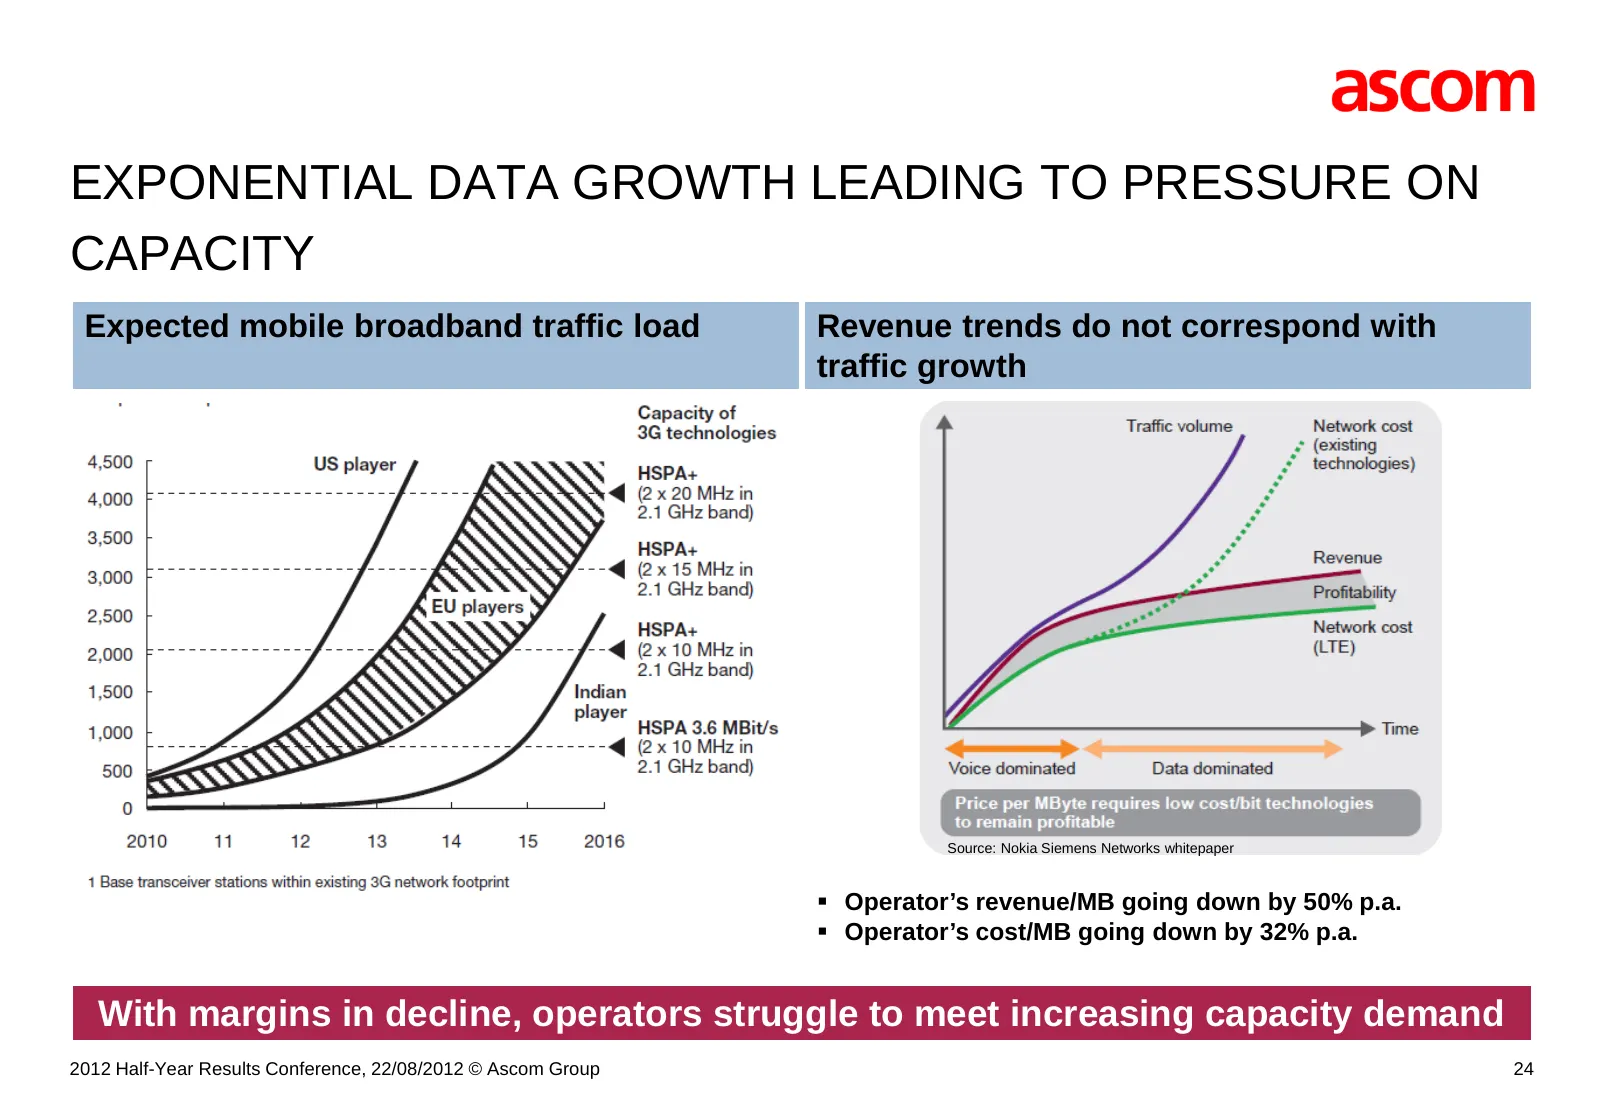
EXPONENTIAL DATA GROWTH LEADING TO PRESSURE ON CAPACITY Expected mobile broadband traffic load Revenue trends do not correspond with traffic growth Source: Nokia Siemens Networks whitepaper Operator’s revenue/MB going down by 50% p.a. Operator’s cost/MB going down by 32% p.a. With margins in dec
Slide 25: LTE Population Coverage Still Insignificant
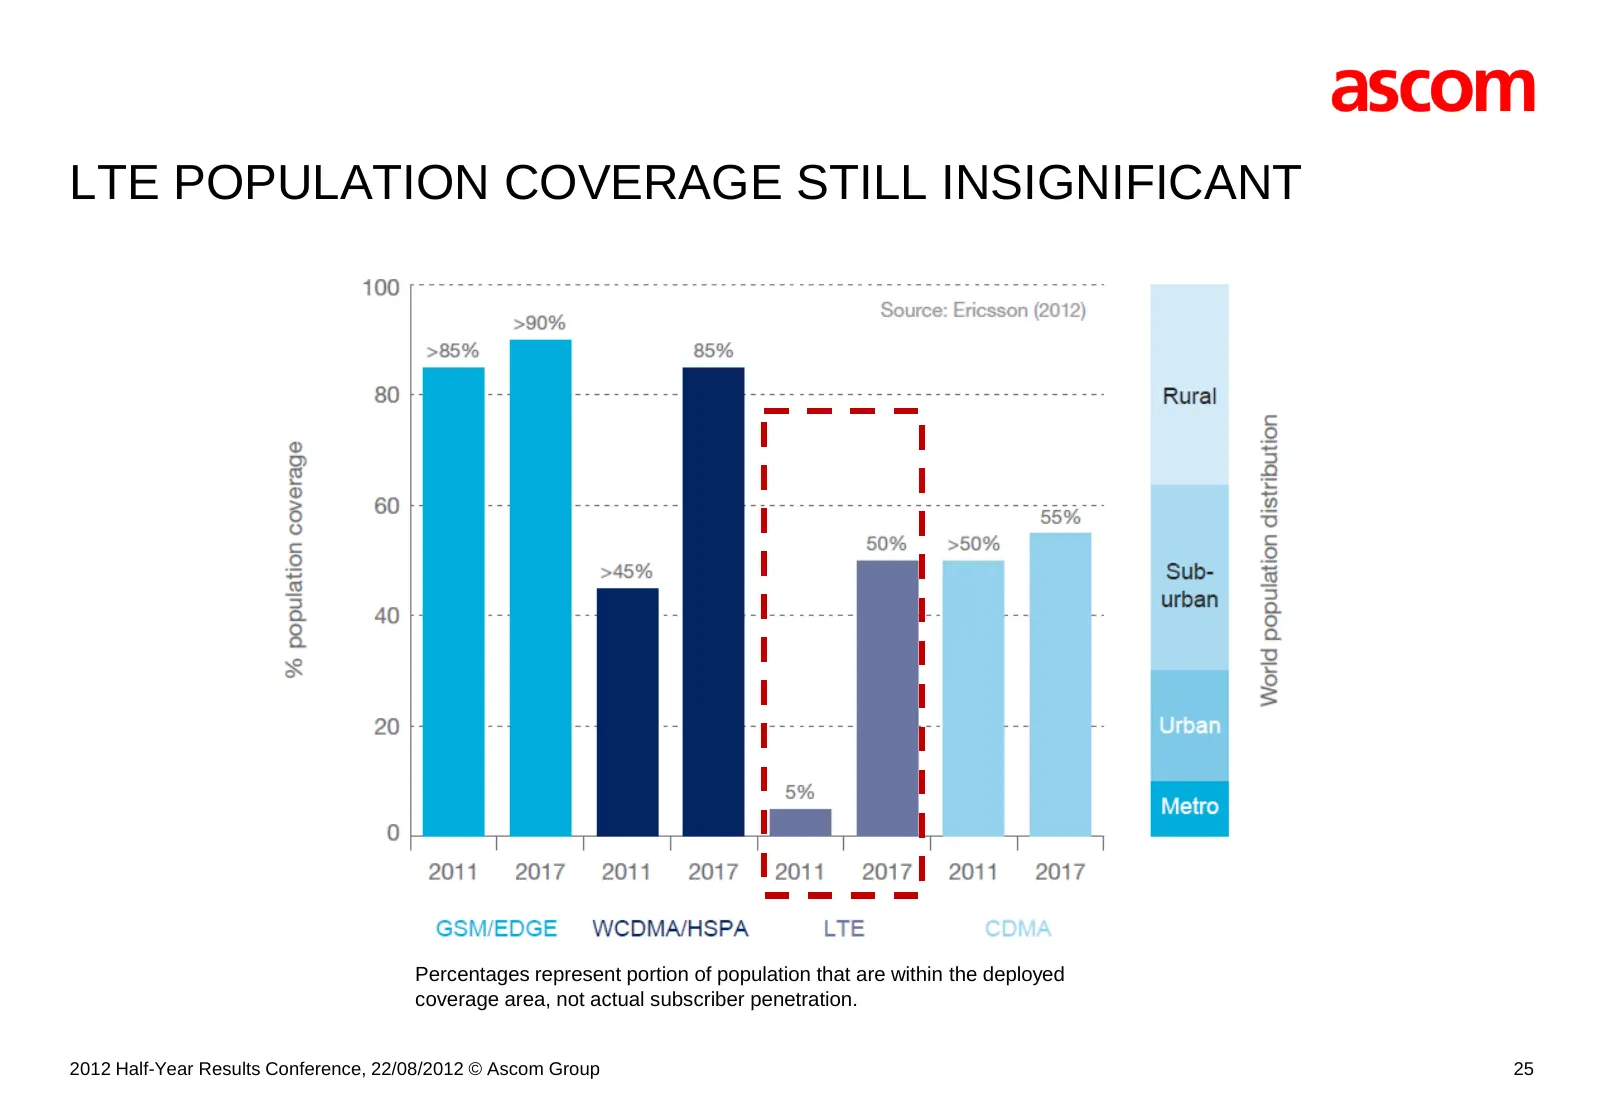
LTE POPULATION COVERAGE STILL INSIGNIFICANT Percentages represent portion of population that are within the deployed coverage area, not actual subscriber penetration. 2012 Half-Year Results Conference, 22/08/2012 © Ascom Group 25
Slide 26: LTE Penetration Offers Attractive Potential
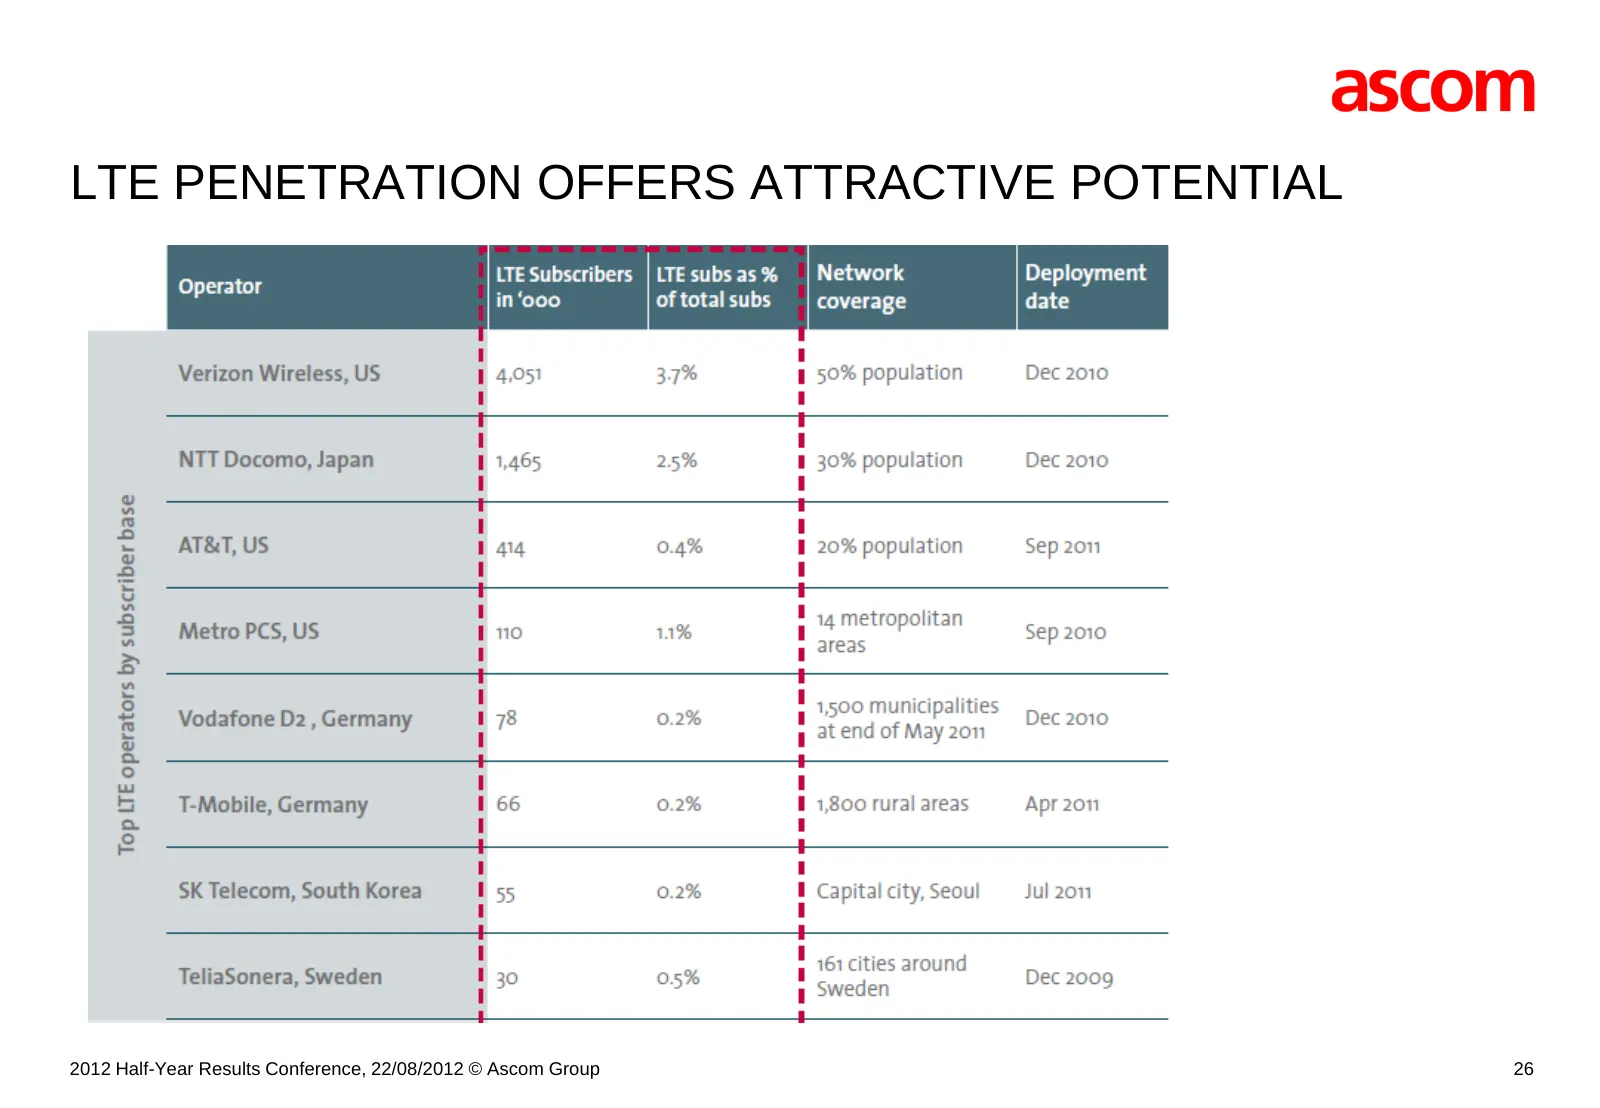
LTE PENETRATION OFFERS ATTRACTIVE POTENTIAL 2012 Half-Year Results Conference, 22/08/2012 © Ascom Group 26
Slide 27: Planned LTE Network Launches
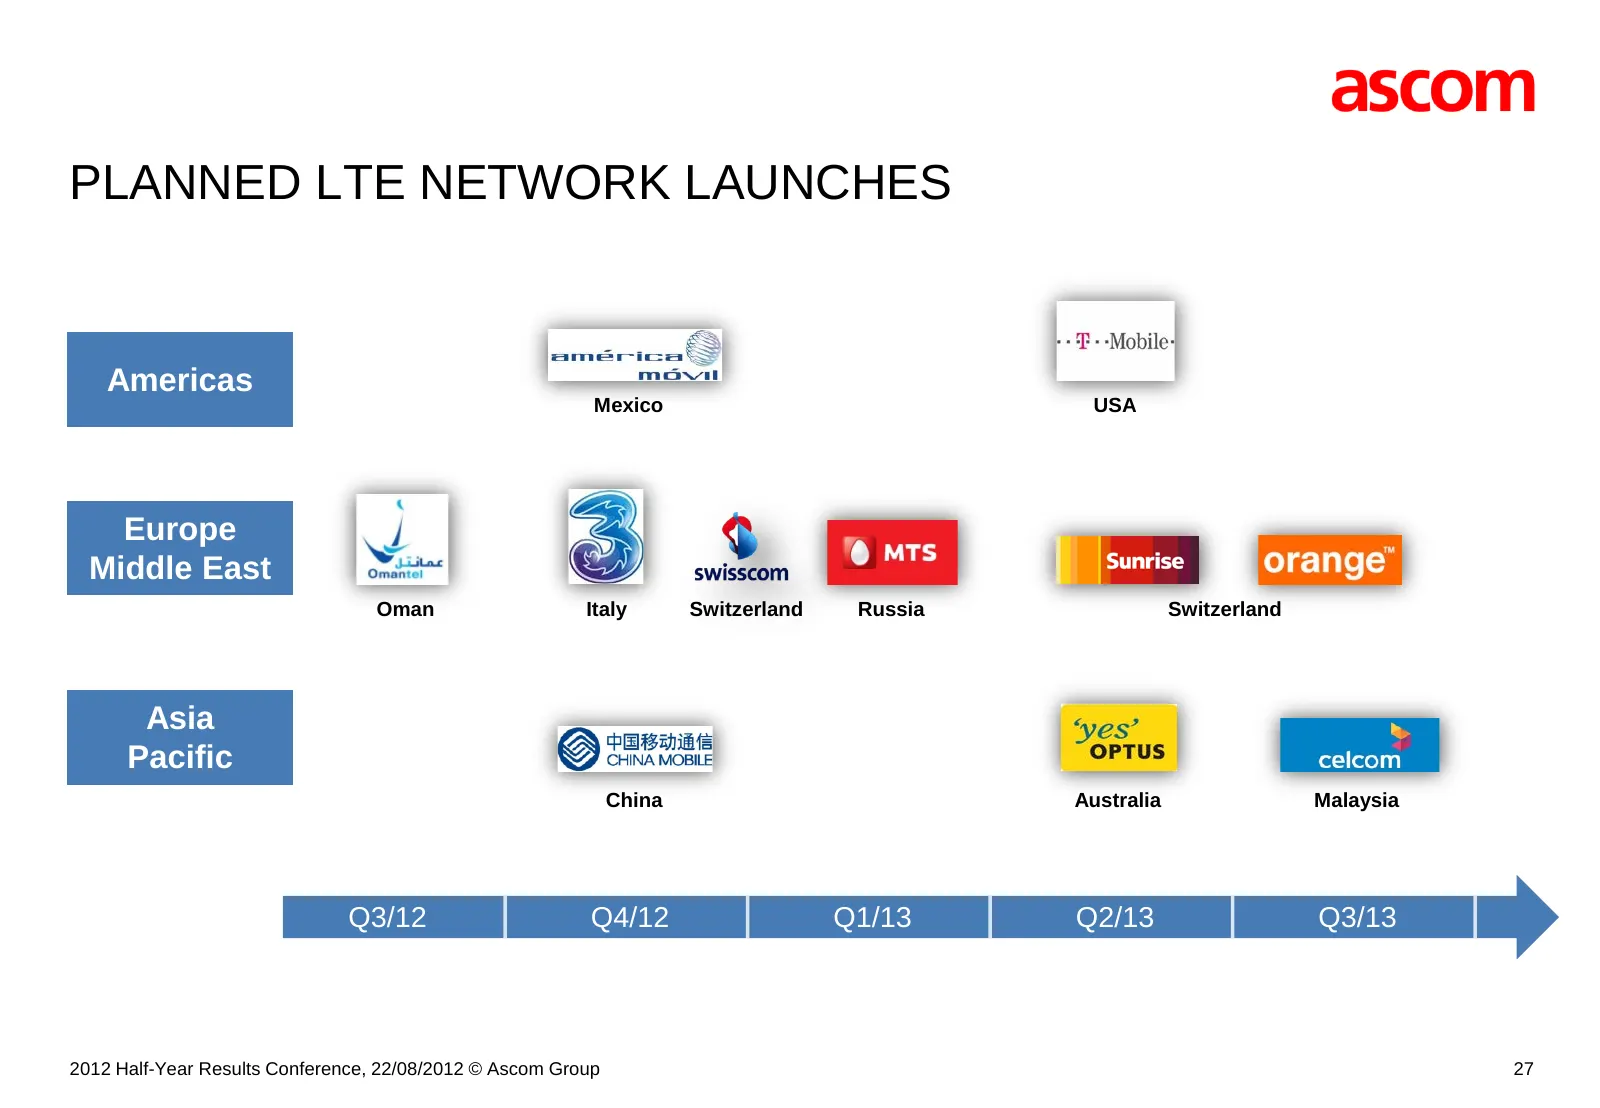
PLANNED LTE NETWORK LAUNCHES Americas Mexico USA Europe Middle East Oman Italy Switzerland Russia Switzerland Asia Pacific China Australia Malaysia Q3/12 Q4/12 Q1/13 Q2/13 Q3/13 2012 Half-Year Results Conference, 22/08/2012 © Ascom Group 27
Slide 28: When Does LTE Business Kick In?
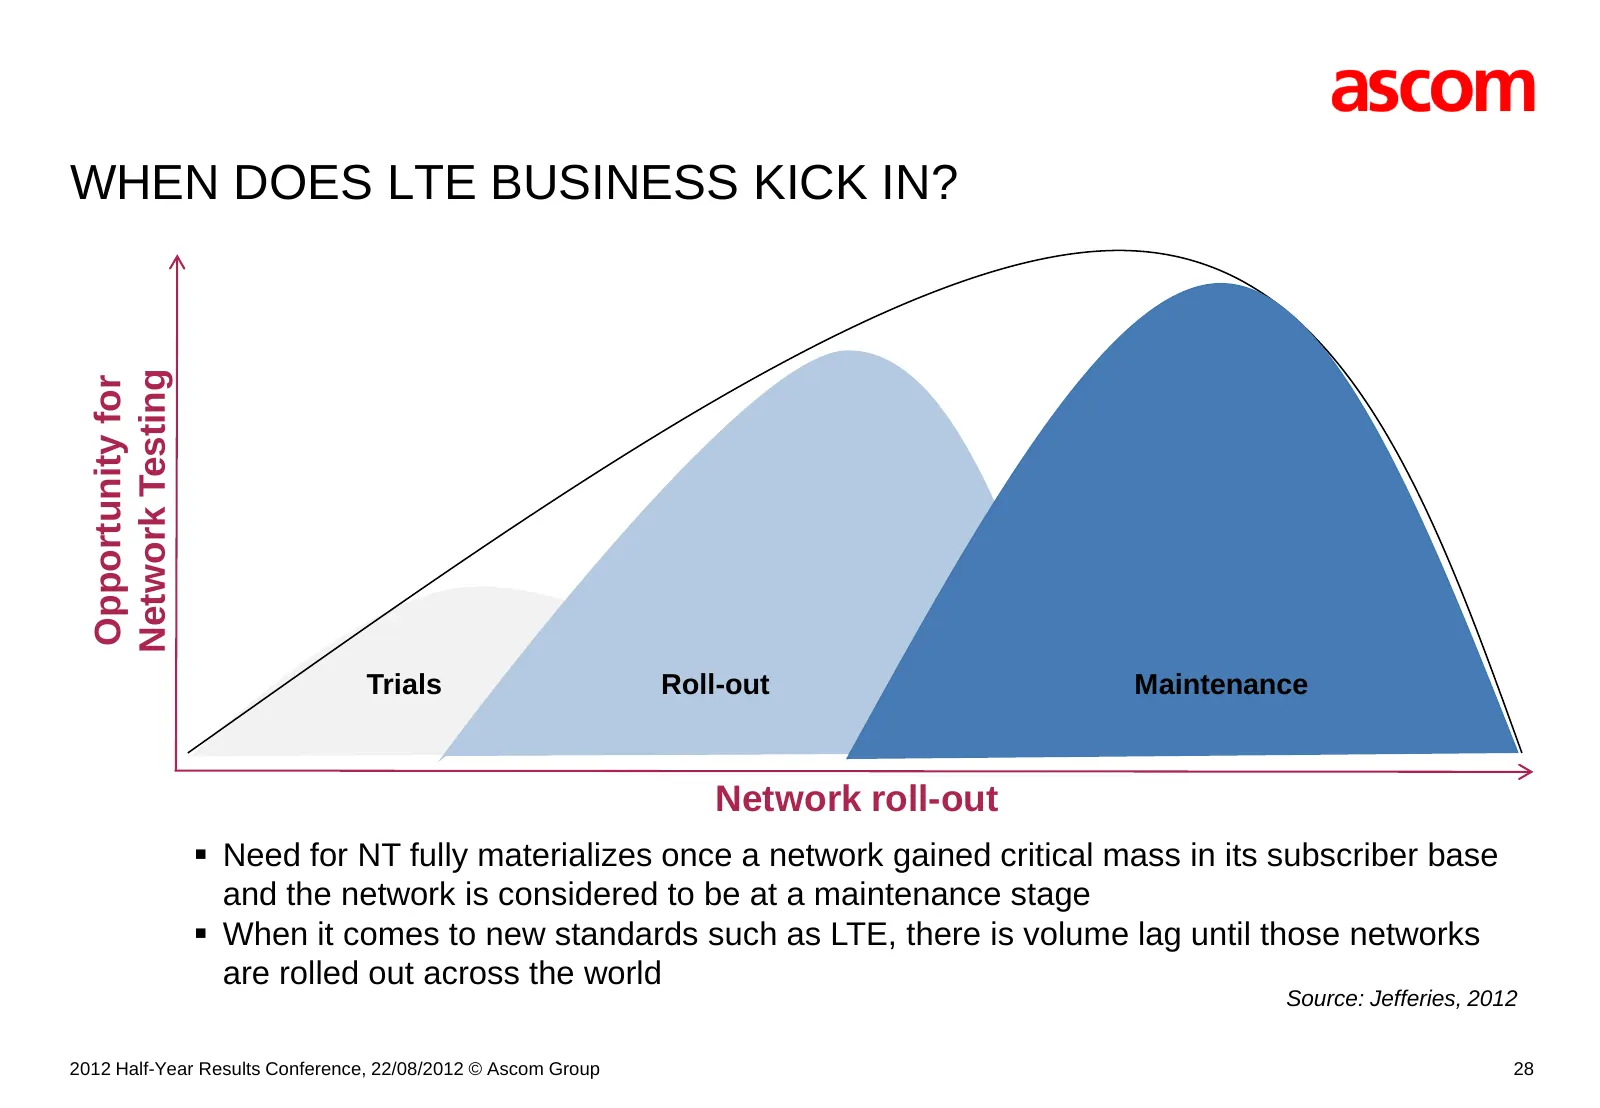
WHEN DOES LTE BUSINESS KICK IN? Network Testing Opportunity for Trials Roll-out Maintenance Network roll-out Need for NT fully materializes once a network gained critical mass in its subscriber base and the network is considered to be at a maintenance stage When it comes to new standards such as
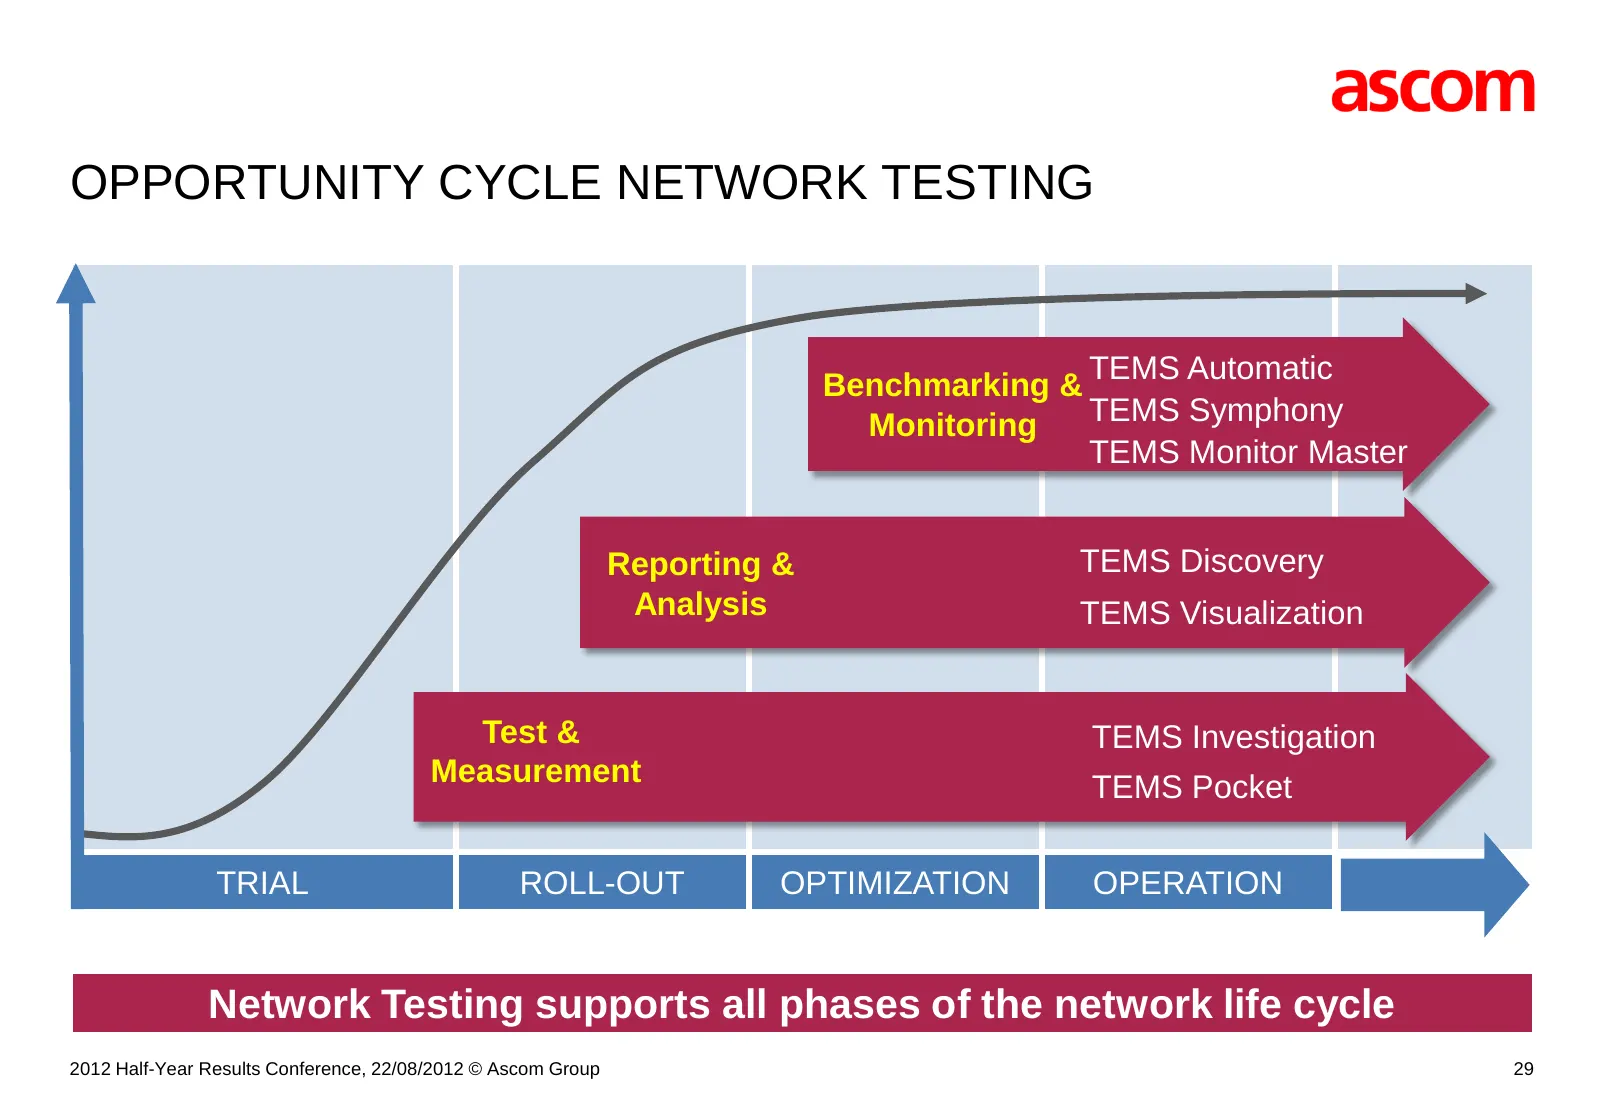
Slide 29: Opportunity Cycle Network Testing
OPPORTUNITY CYCLE NETWORK TESTING TEMS Automatic Benchmarking & Monitoring TEMS Symphony TEMS Monitor Master Reporting & TEMS Discovery Analysis TEMS Visualization Test & TEMS Investigation Measurement TEMS Pocket TRIAL ROLL-OUT OPTIMIZATION OPERATION Network Testing supports all phases of the netwo
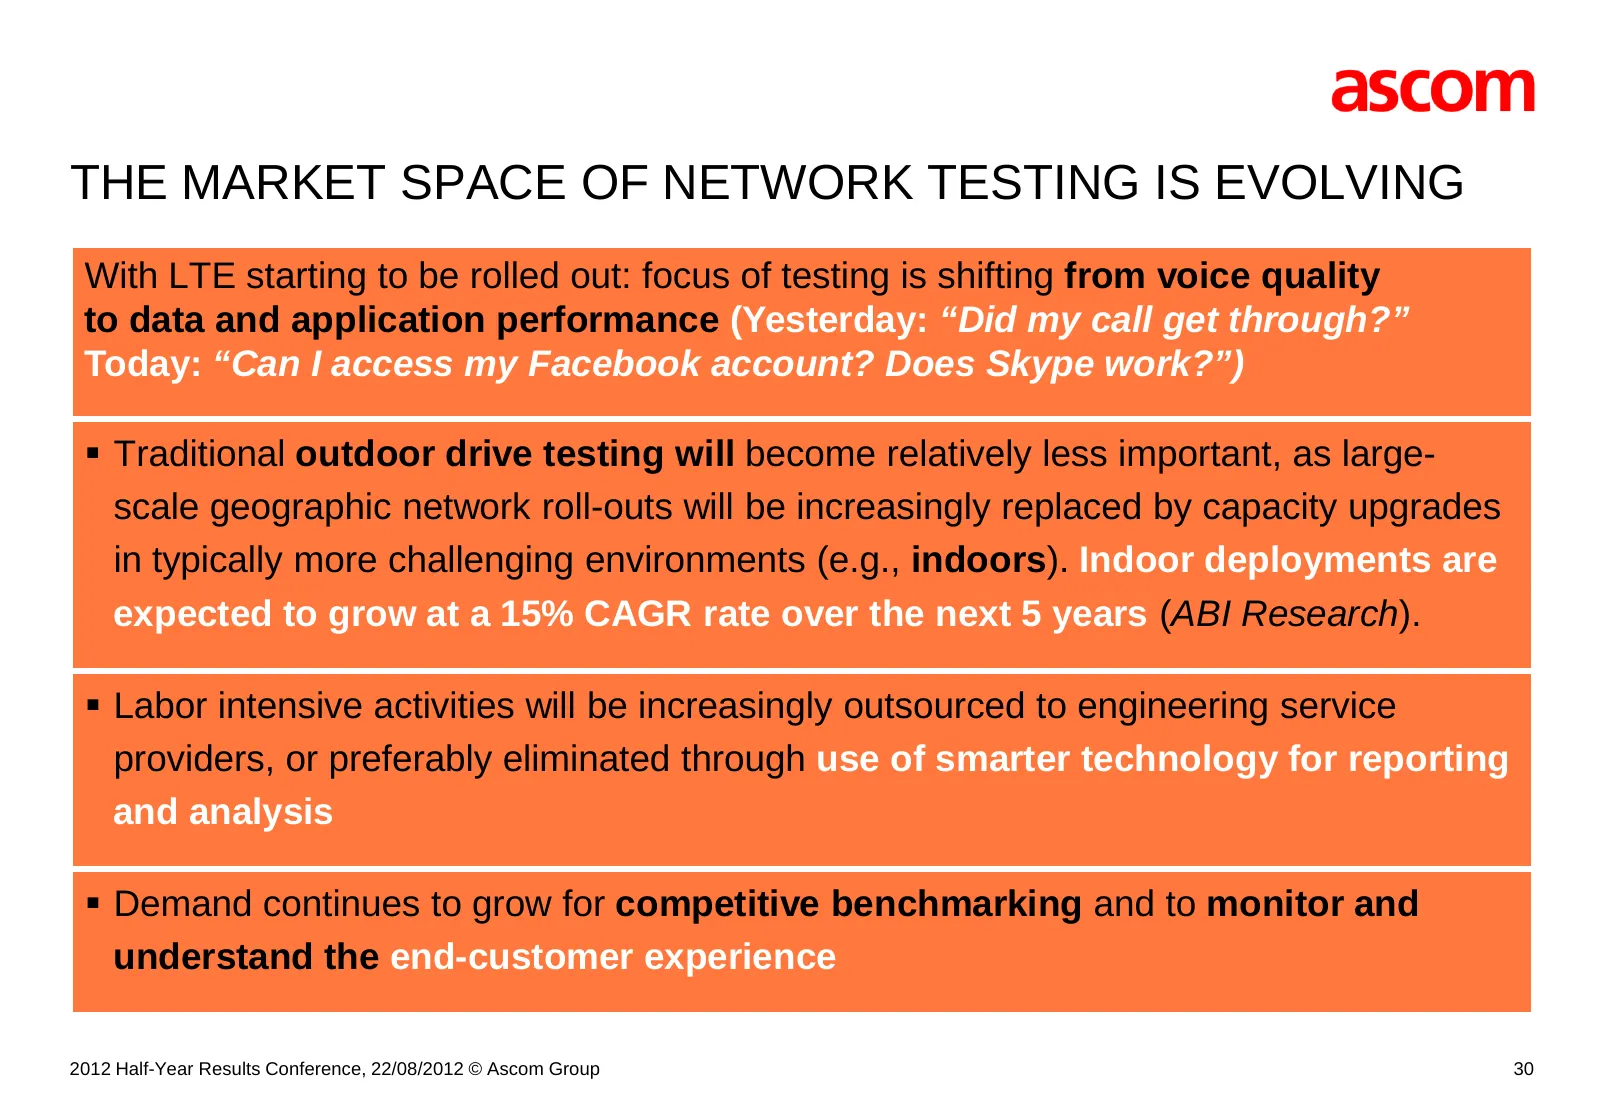
Slide 30: The Market Space of Network Testing Is Evolving
THE MARKET SPACE OF NETWORK TESTING IS EVOLVING With LTE starting to be rolled out: focus of testing is shifting from voice quality to data and application performance (Yesterday: “Did my call get through?” Today: “Can I access my Facebook account? Does Skype work?”) Traditional outdoor drive test
Slide 31: Network Testing Cost Reduction Program and Re-organization
[ ] NETWORK TESTING COST REDUCTION PROGRAM AND RE-ORGANIZATION www.ascom.com/nt 2012 Half-Year Results Conference, 22/08/2012 © Ascom Group 31
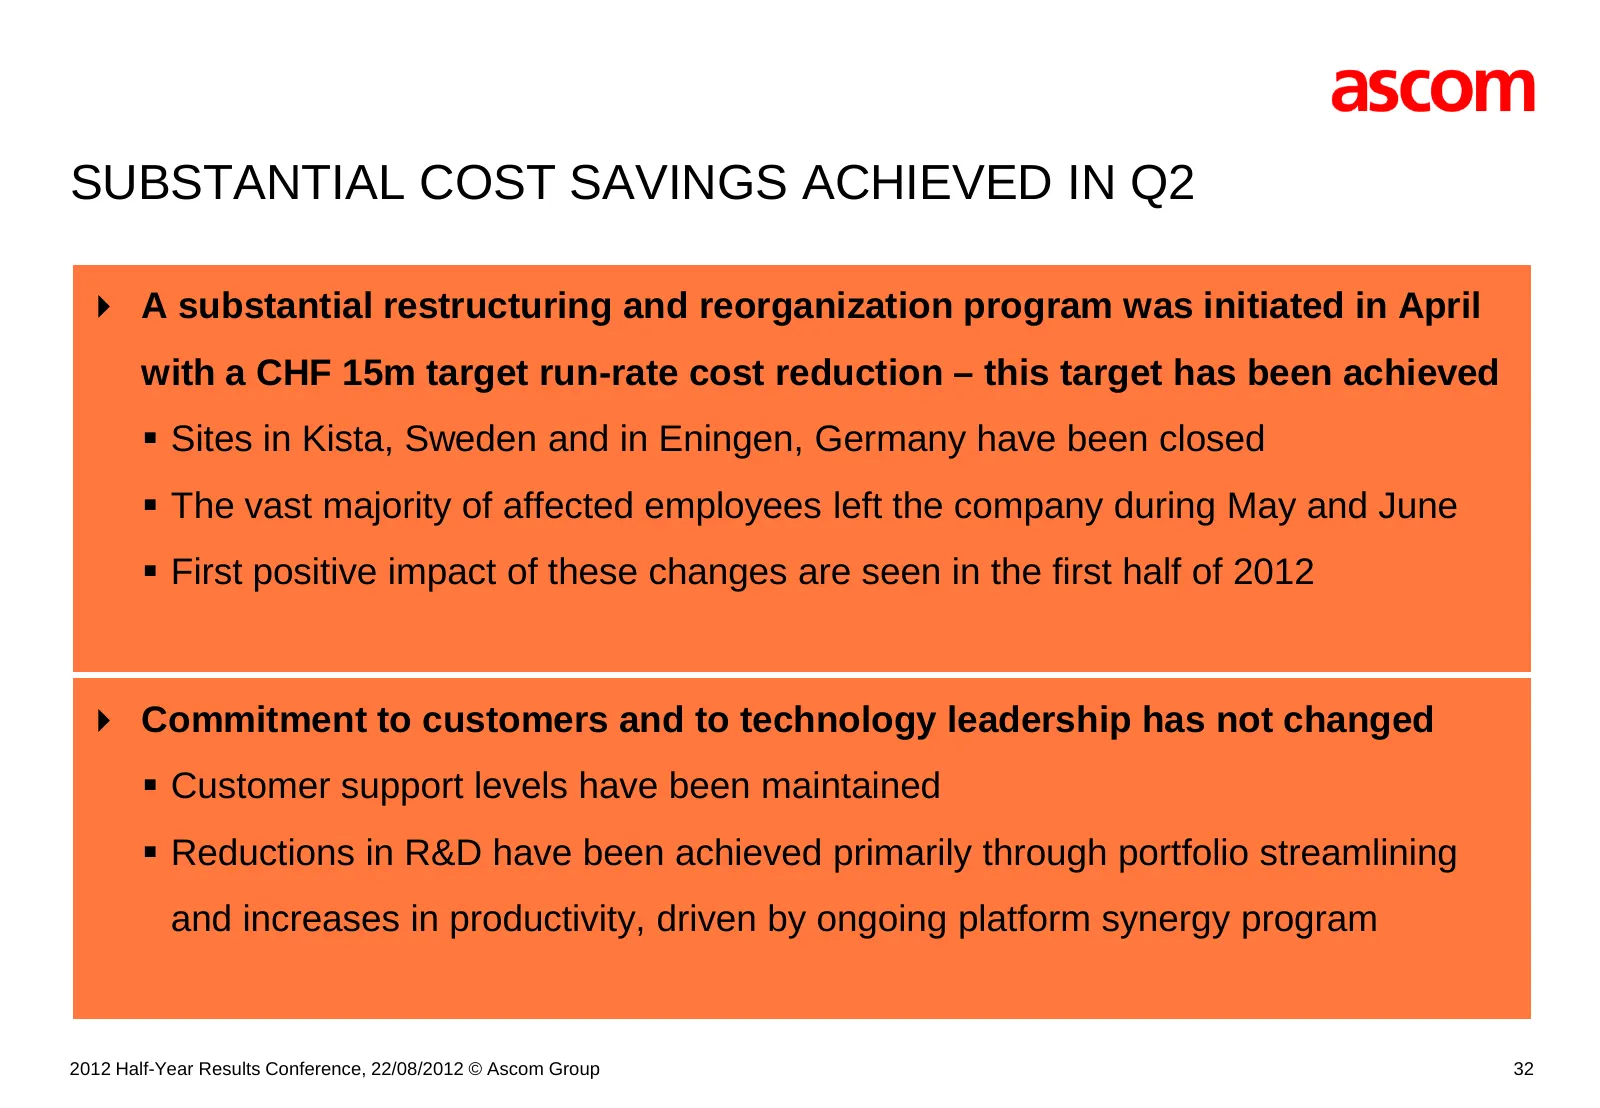
Slide 32: Substantial Cost Savings Achieved in Q2
SUBSTANTIAL COST SAVINGS ACHIEVED IN Q2 A substantial restructuring and reorganization program was initiated in April with a CHF 15m target run-rate cost reduction – this target has been achieved Sites in Kista, Sweden and in Eningen, Germany have been closed The vast majority of affected empl
Slide 33: Enhanced Customer Focus
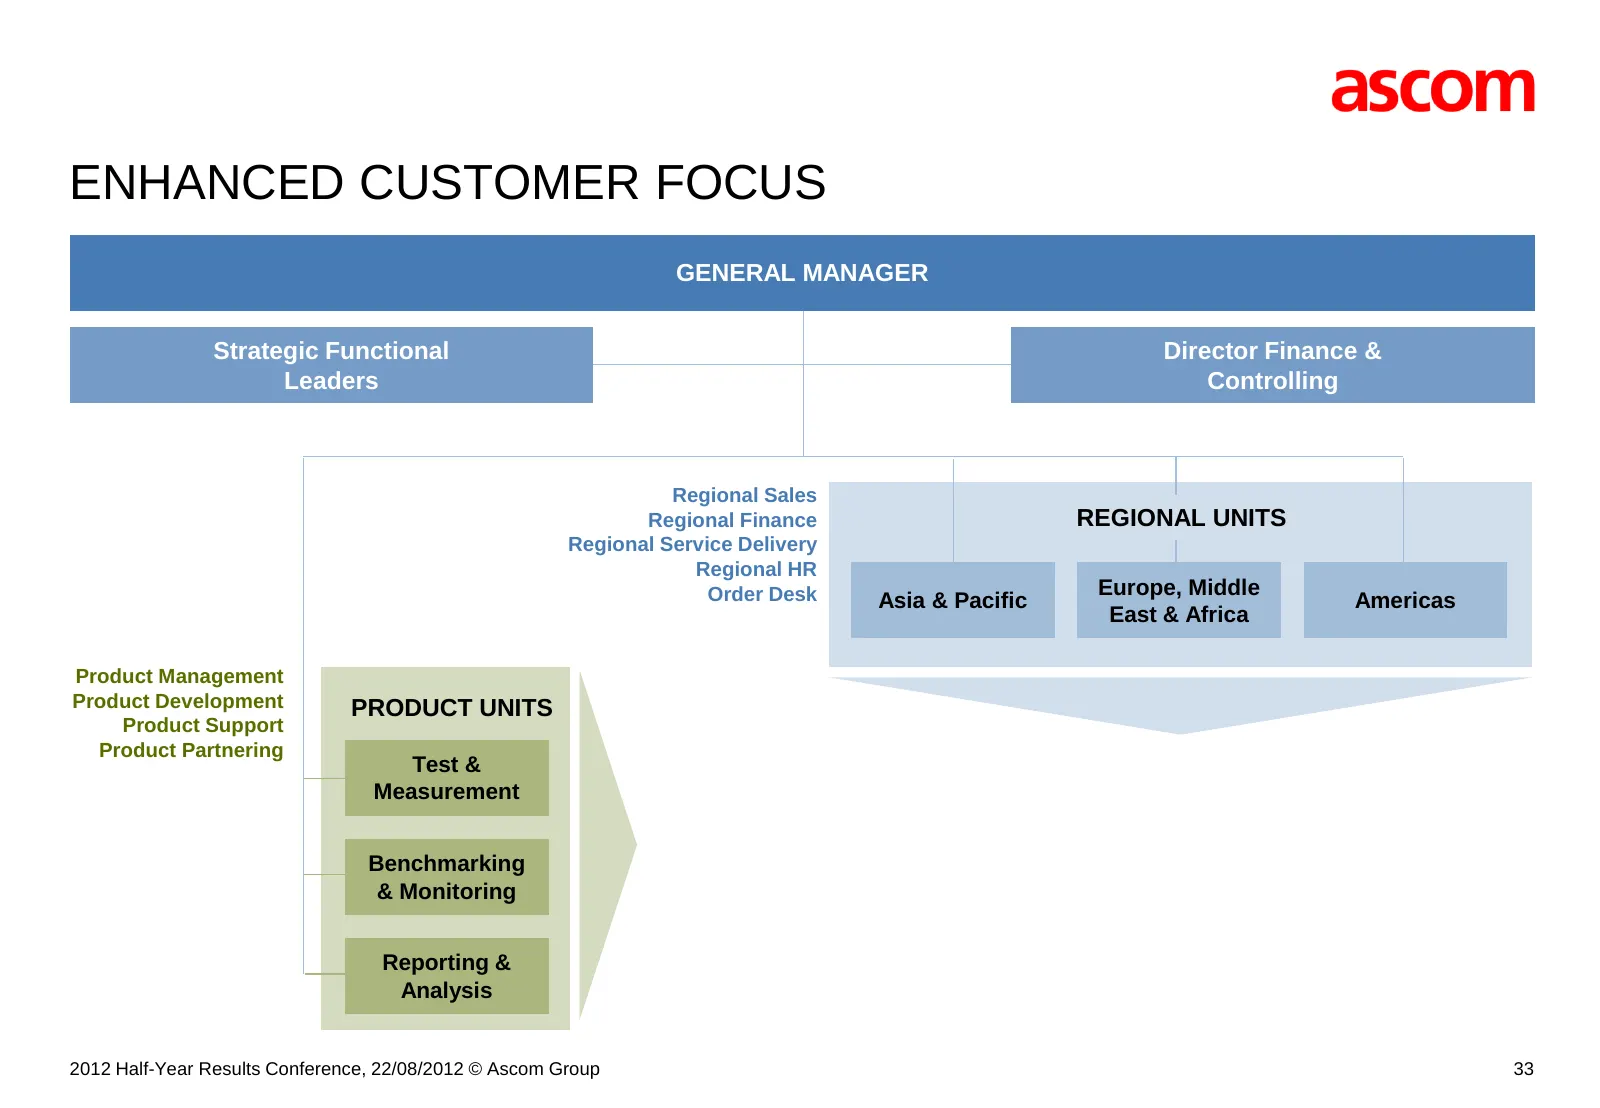
ENHANCED CUSTOMER FOCUS GENERAL MANAGER Strategic Functional Director Finance & Leaders Controlling Regional Sales Regional Finance REGIONAL UNITS Regional Service Delivery Regional HR Order Desk Europe, Middle Asia & Pacific Americas East & Africa Product Management Product Development PRODUCT UNIT
Slide 34: Reorganization Has Resulted in Immediate Benefits
REORGANIZATION HAS RESULTED IN IMMEDIATE BENEFITS The new structure has created immediate tangible benefits: Reductions in backlog as regional sales, finance and supply chain now formally own both expenses and revenue recognition Faster resolution of customer issues and increased visibility of o

Slide 35: Network Testing: Outlook
[ ] NETWORK TESTING: OUTLOOK www.ascom.com/nt 2012 Half-Year Results Conference, 22/08/2012 © Ascom Group 35
Slide 36: We Expect a Stronger Top Line in the Second Half
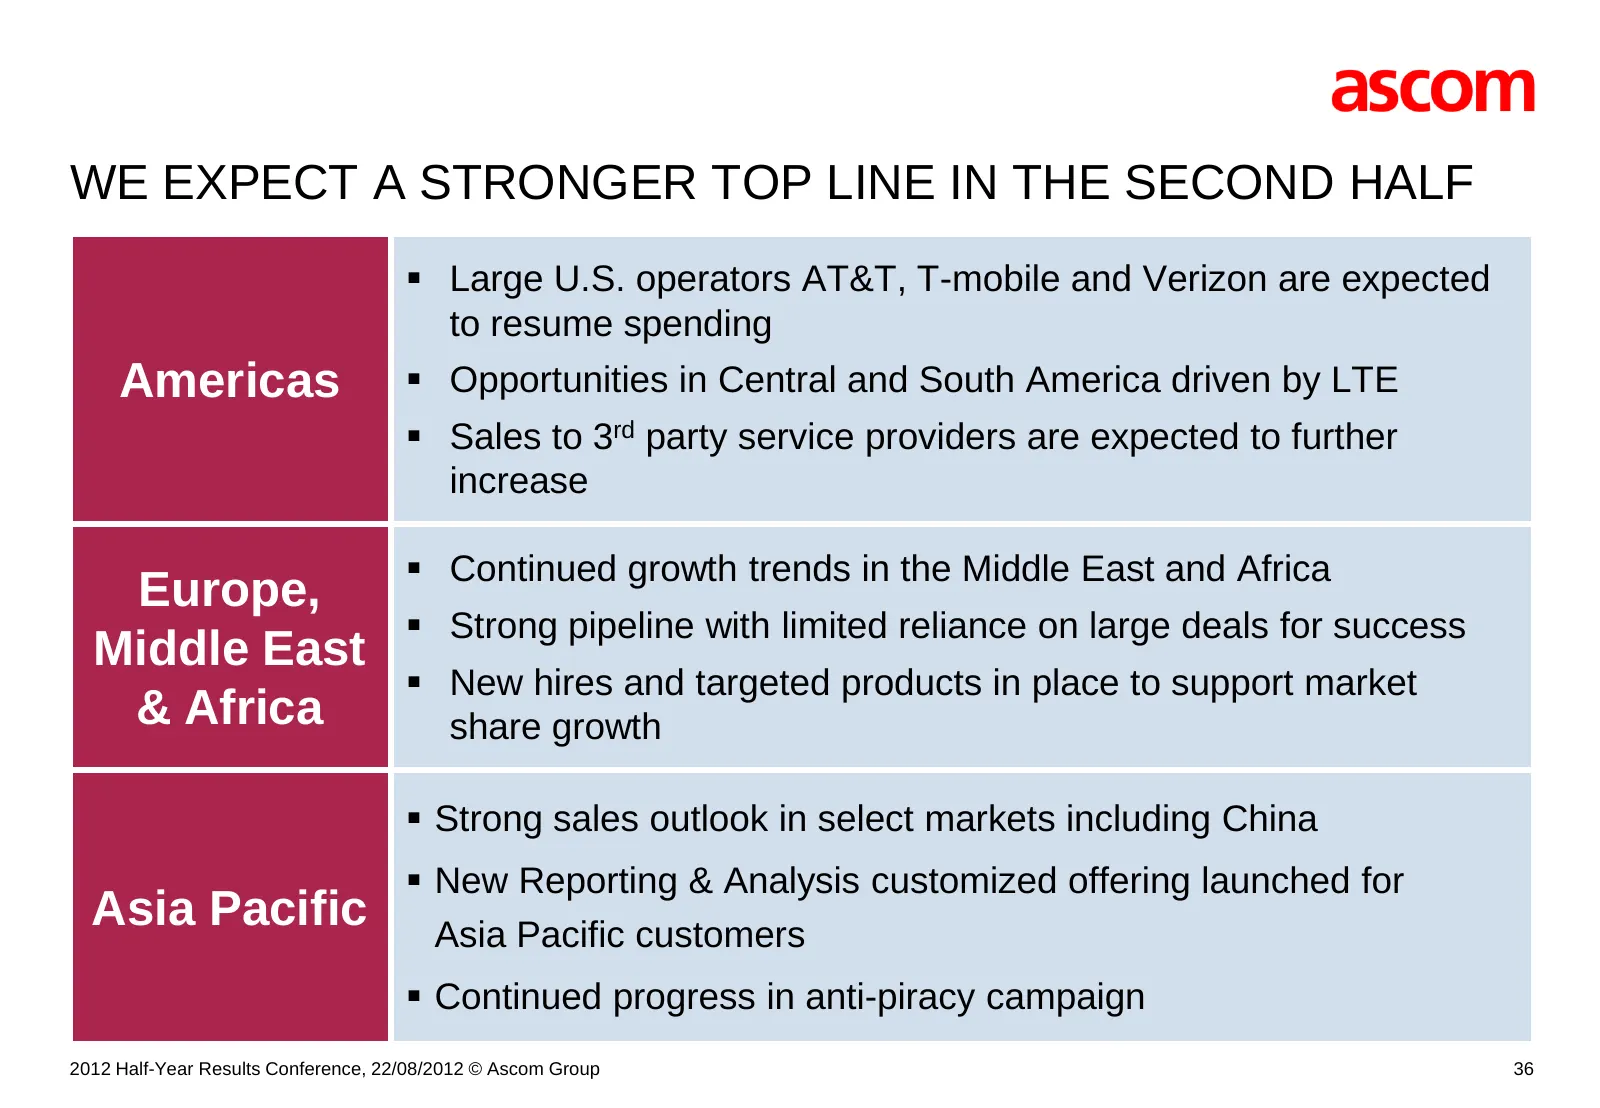
WE EXPECT A STRONGER TOP LINE IN THE SECOND HALF Large U.S. operators AT&T, T-mobile and Verizon are expected to resume spending Americas Opportunities in Central and South America driven by LTE Sales to 3rd party service providers are expected to further increase Continued growth trends in
Slide 37: Additional Profitability Measures Will Capitalize on Productivity Improvements
ADDITIONAL PROFITABILITY MEASURES WILL CAPITALIZE ON PRODUCTIVITY IMPROVEMENTS ACHIEVED In the course of implementing the cost reduction and restructuring program in Network Testing in the second quarter, additional selective cost reduction measures have been identified and are being implemented in

Slide 38: 2012 Half-Year Financial Results
[ ] 2012 HALF-YEAR FINANCIAL RESULTS 2012 Half-Year Results Conference, 22/08/2012 © Ascom Group 38
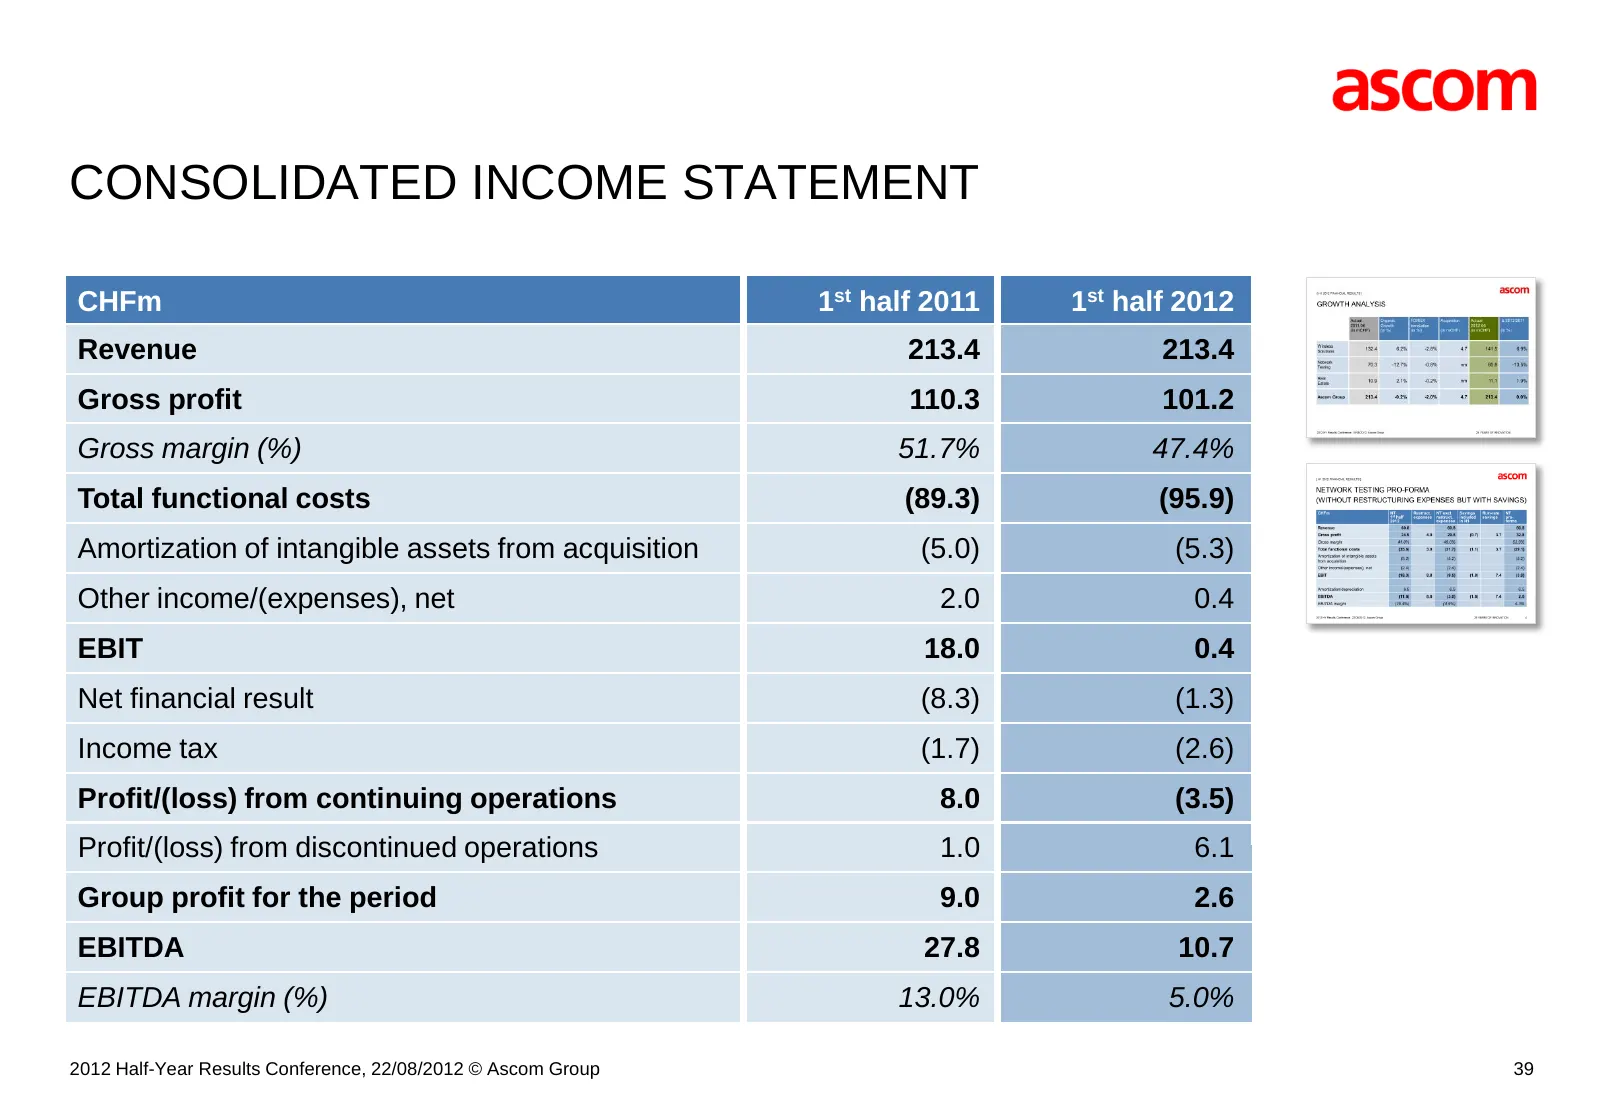
Slide 39: Consolidated Income Statement
CONSOLIDATED INCOME STATEMENT CHFm 1st half 2011 1st half 2012 Revenue 213.4 213.4 Gross profit 110.3 101.2 Gross margin (%) 51.7% 47.4% Total functional costs (89.3) (95.9) Amortization of intangible assets from acquisition (5.0) (5.3) Other income/(expenses), net 2.0 0.4 EBIT 18.0 0.4 Net financia
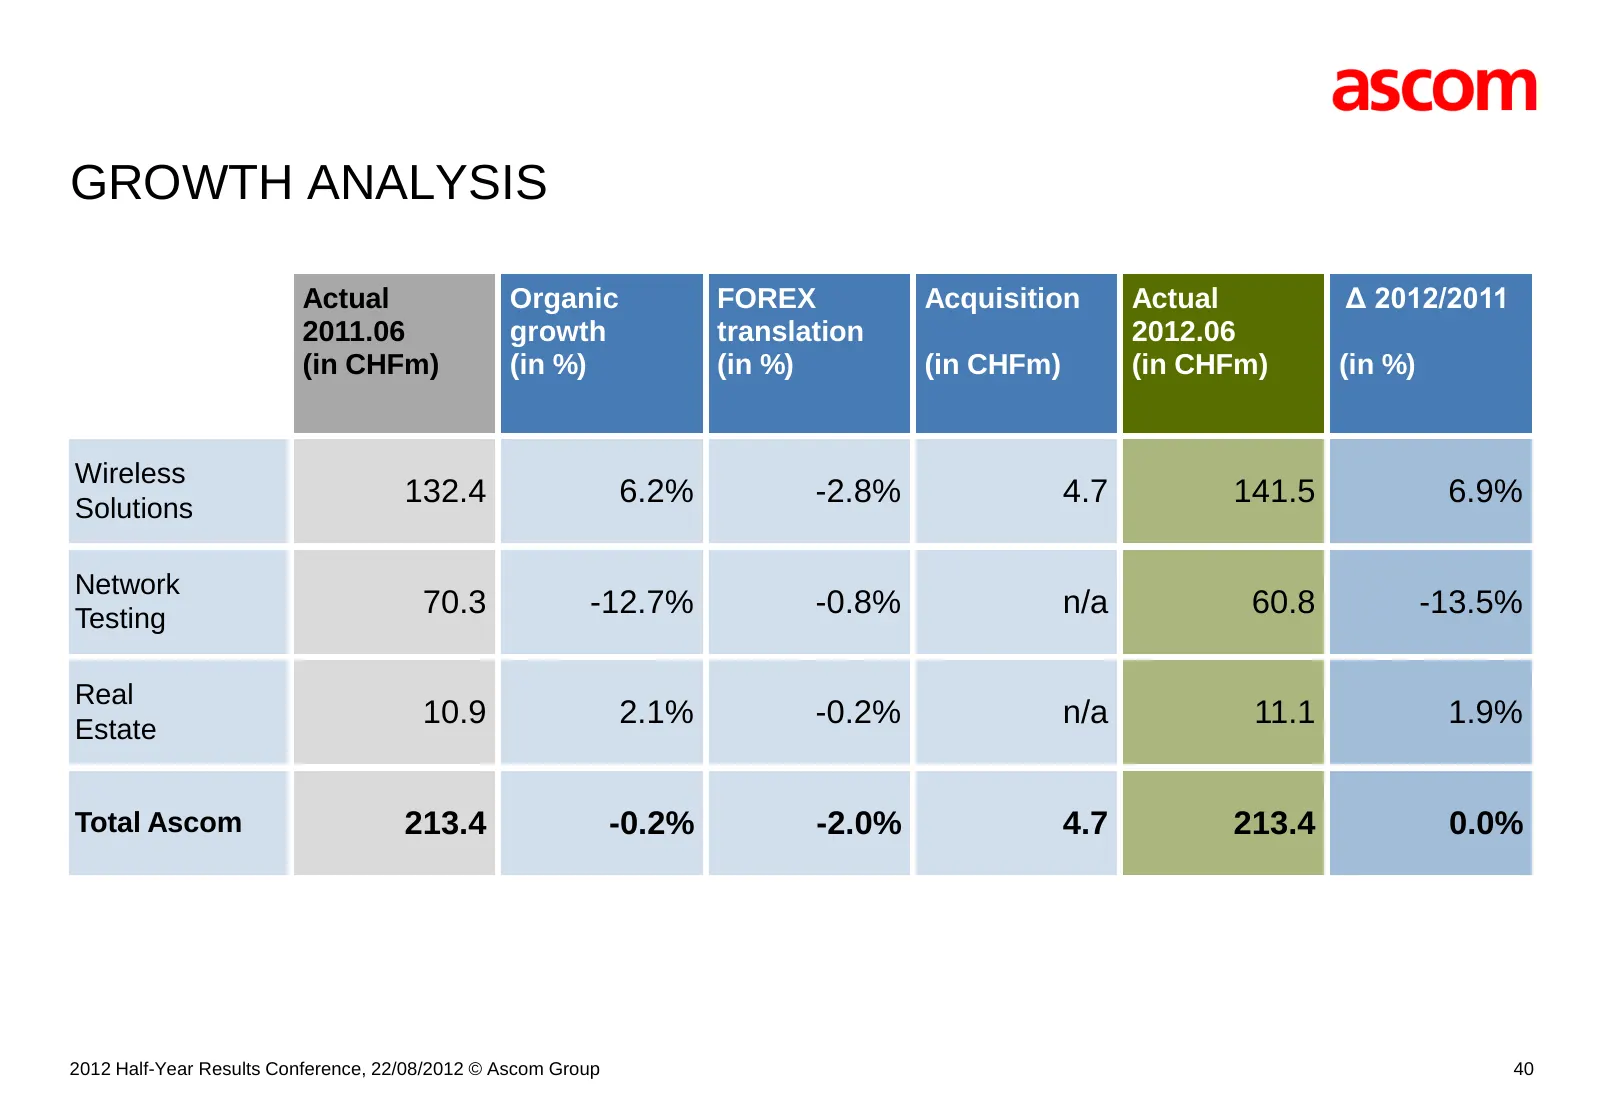
Slide 40: Growth Analysis
GROWTH ANALYSIS Actual Organic FOREX Acquisition Actual Δ 2012/2011 2011.06 growth translation 2012.06 (in CHFm) (in %) (in %) (in CHFm) (in CHFm) (in %) Wireless Solutions 132.4 6.2% -2.8% 4.7 141.5 6.9% Network Testing 70.3 -12.7% -0.8% n/a 60.8 -13.5% Real Estate 10.9 2.1% -0.2% n/a 11.1 1.9% Tot
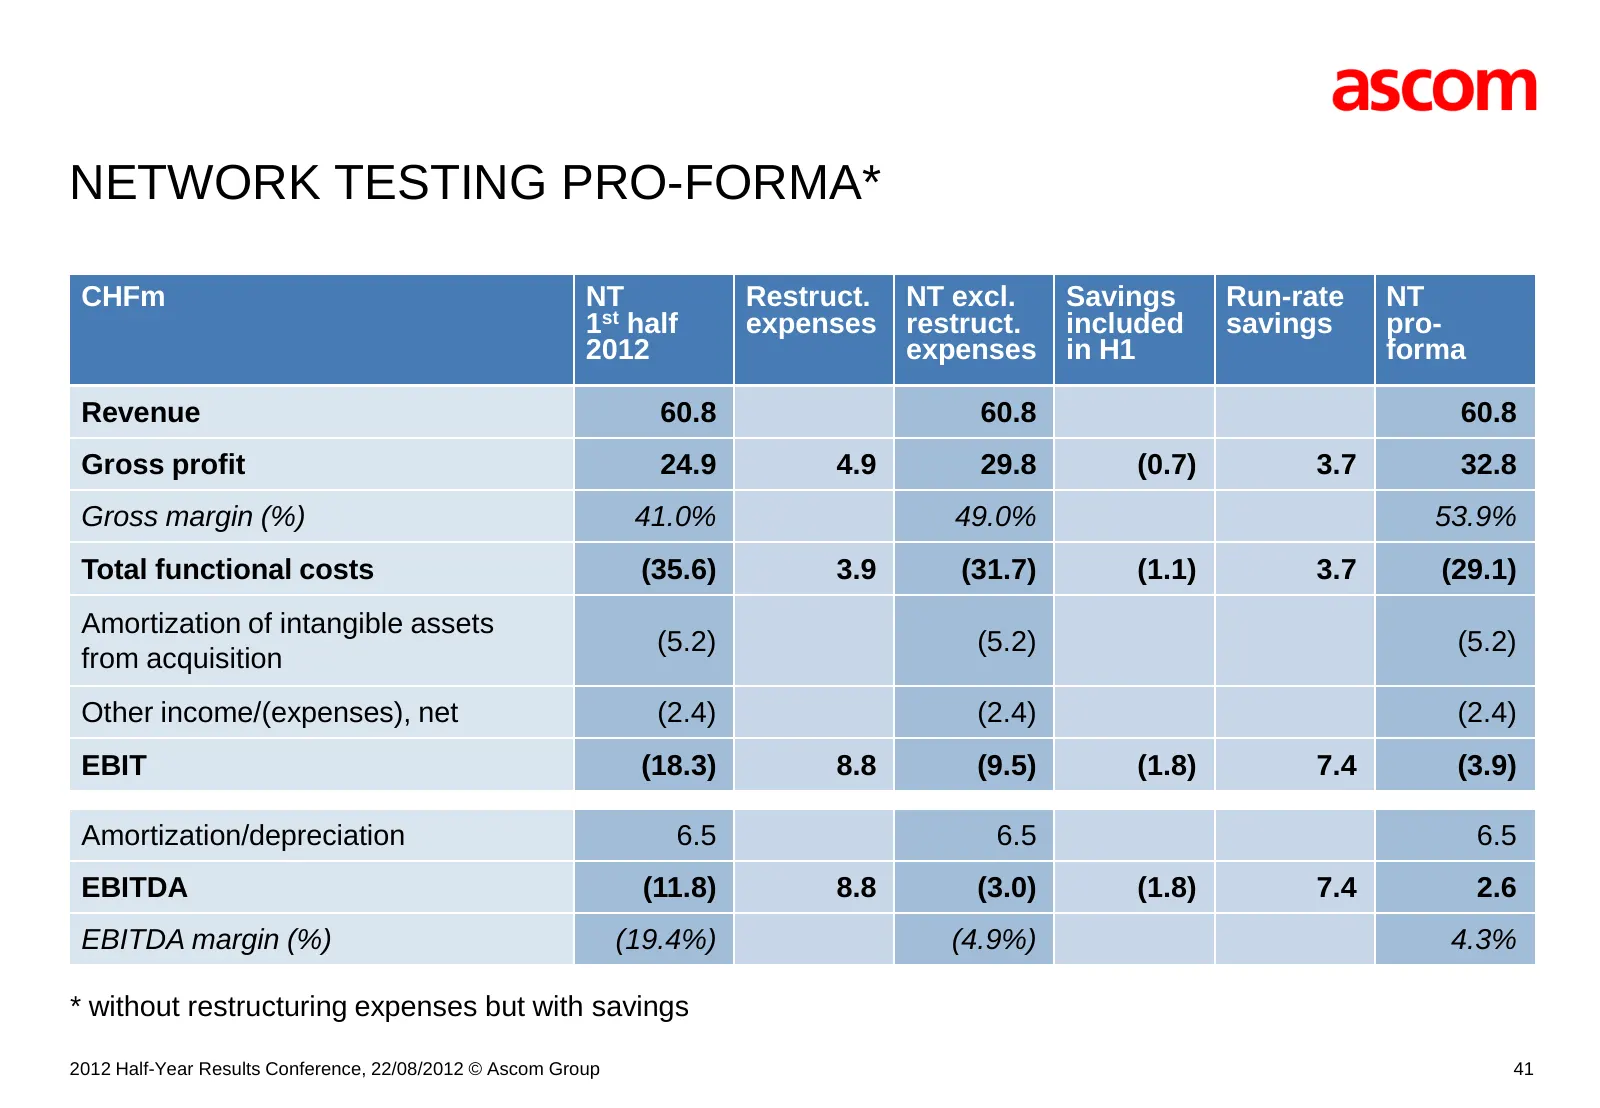
Slide 41: Network Testing Pro-forma
NETWORK TESTING PRO-FORMA* CHFm NT Restruct. NT excl. Savings Run-rate NT 1st half expenses restruct. included savings pro- 2012 expenses in H1 forma Revenue 60.8 60.8 60.8 Gross profit 24.9 4.9 29.8 (0.7) 3.7 32.8 Gross margin (%) 41.0% 49.0% 53.9% Total functional costs (35.6) 3.9 (31.7) (1.1) 3.7
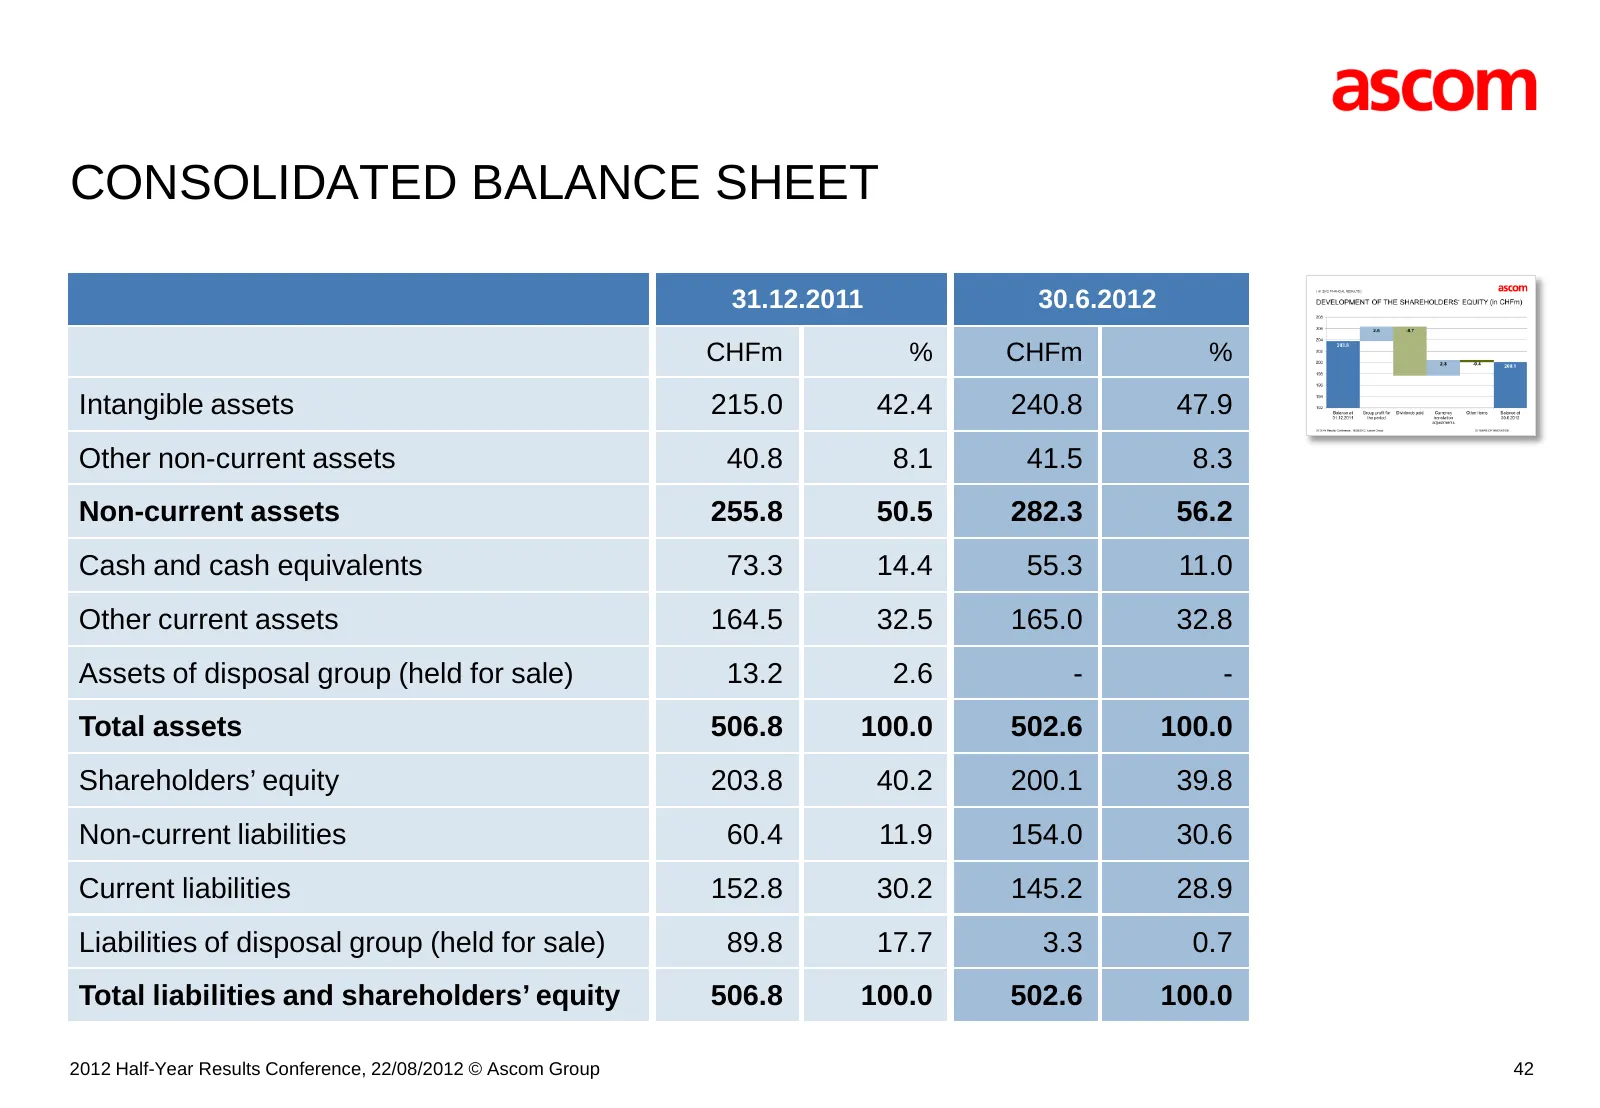
Slide 42: Consolidated Balance Sheet
CONSOLIDATED BALANCE SHEET 31.12.2011 30.6.2012 CHFm % CHFm % Intangible assets 215.0 42.4 240.8 47.9 Other non-current assets 40.8 8.1 41.5 8.3 Non-current assets 255.8 50.5 282.3 56.2 Cash and cash equivalents 73.3 14.4 55.3 11.0 Other current assets 164.5 32.5 165.0 32.8 Assets of disposal group
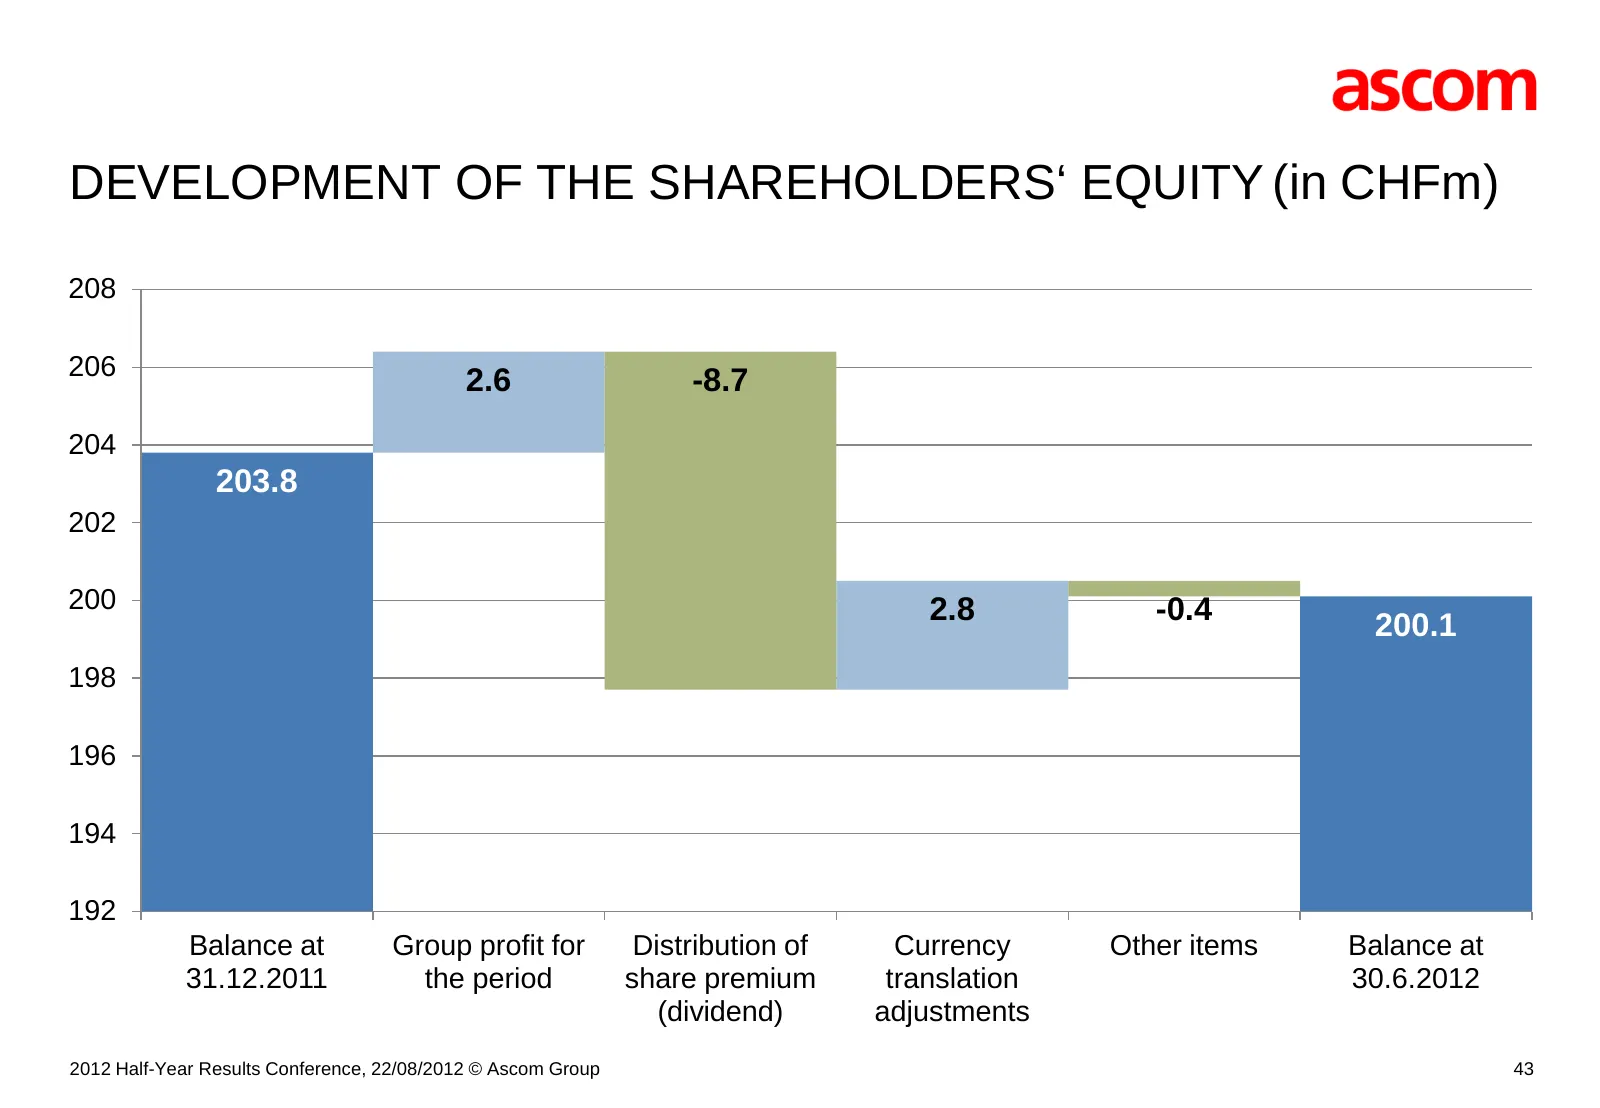
Slide 43: Development of the Shareholders' Equity
DEVELOPMENT OF THE SHAREHOLDERS‘ EQUITY (in CHFm) 208 206 2.6 -8.7 204 203.8 202 200 2.8 -0.4 200.1 198 196 194 192 Balance at Group profit for Distribution of Currency Other items Balance at 31.12.2011 the period share premium translation 30.6.2012 (dividend) adjustments 2012 Half-Year Results Conf
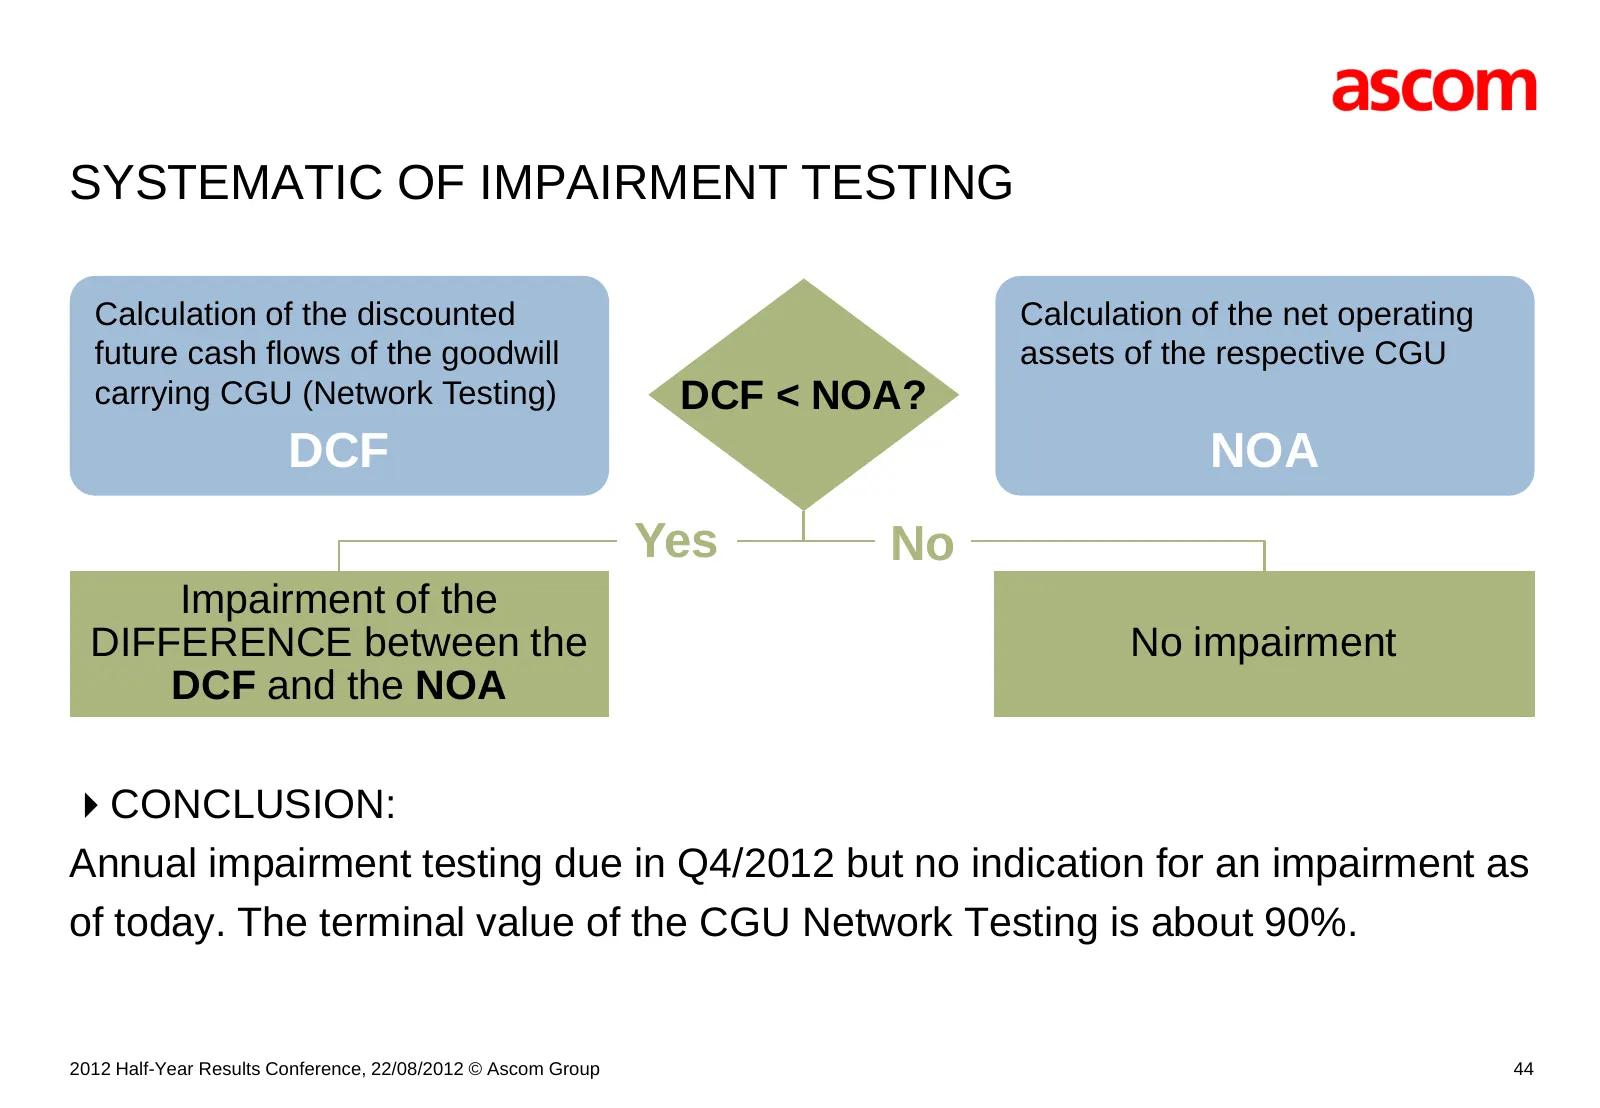
Slide 44: Systematic of Impairment Testing
SYSTEMATIC OF IMPAIRMENT TESTING Calculation of the discounted Calculation of the net operating future cash flows of the goodwill assets of the respective CGU carrying CGU (Network Testing) DCF < NOA? DCF NOA Yes No Impairment of the DIFFERENCE between the No impairment DCF and the NOA CONCLUSION:
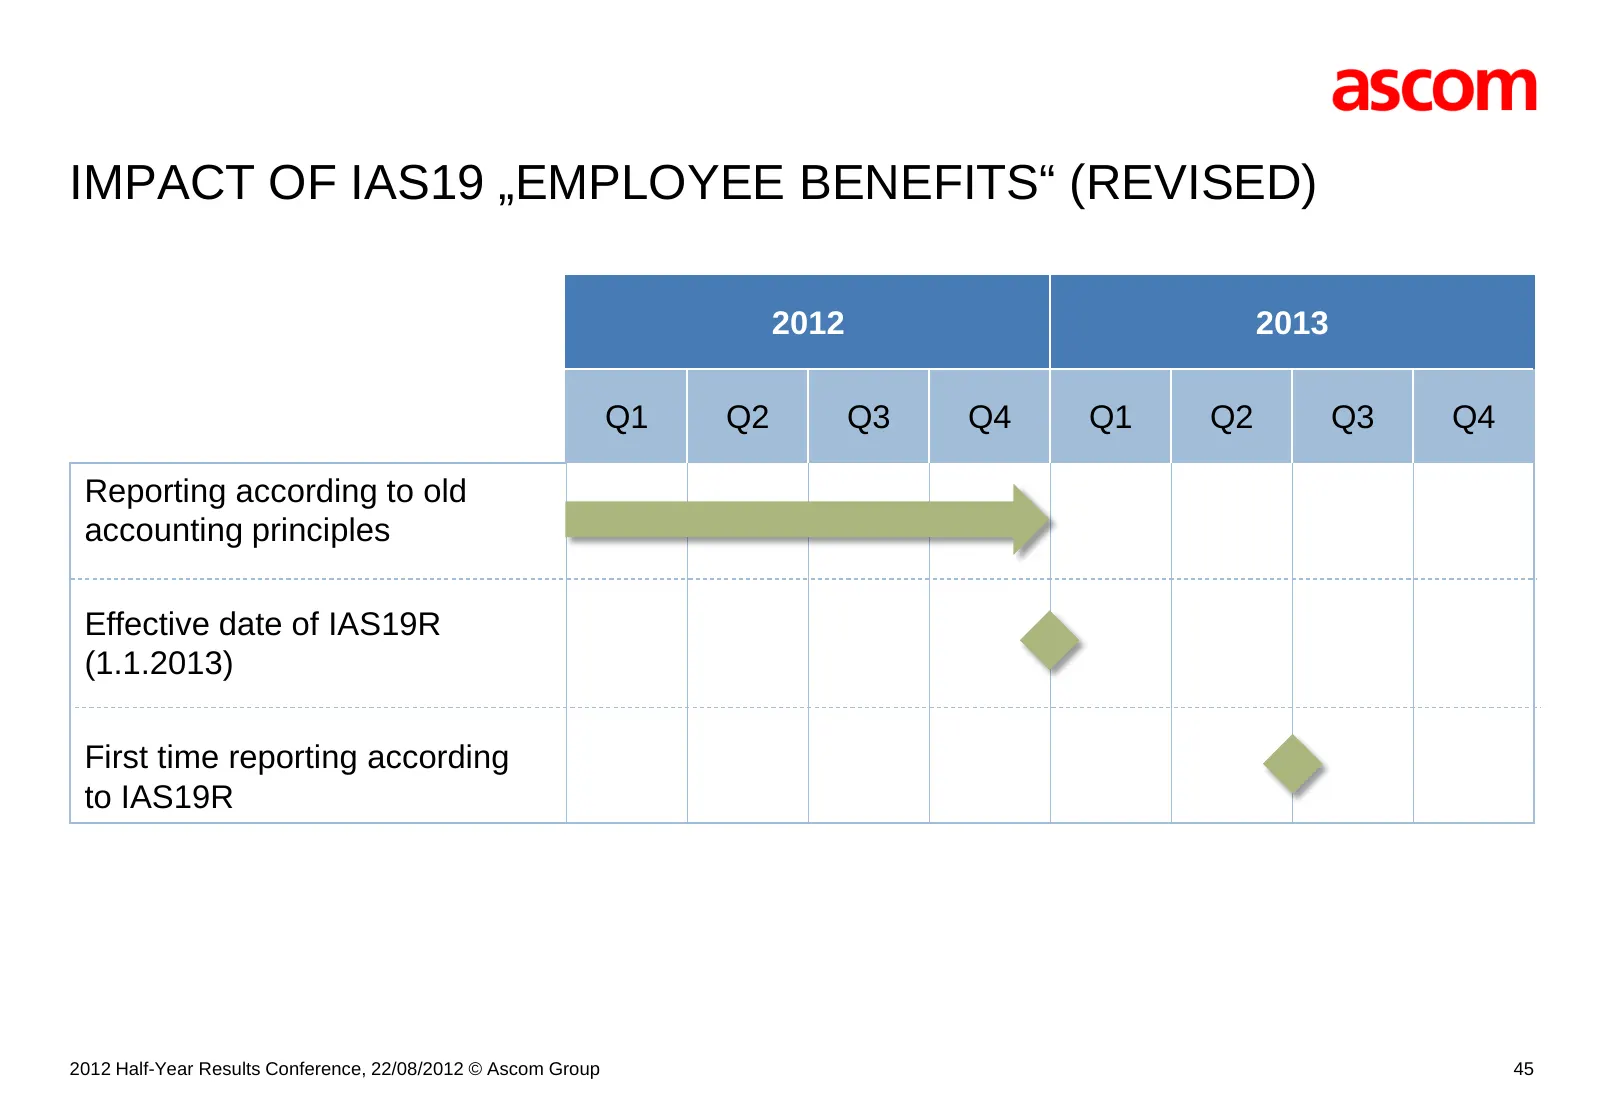
Slide 45: Impact of IAS19 Employee Benefits (Revised)
IMPACT OF IAS19 „EMPLOYEE BENEFITS“ (REVISED) 2012 2013 Q1 Q2 Q3 Q4 Q1 Q2 Q3 Q4 Reporting according to old accounting principles Effective date of IAS19R (1.1.2013) First time reporting according to IAS19R 2012 Half-Year Results Conference, 22/08/2012 © Ascom Group 45
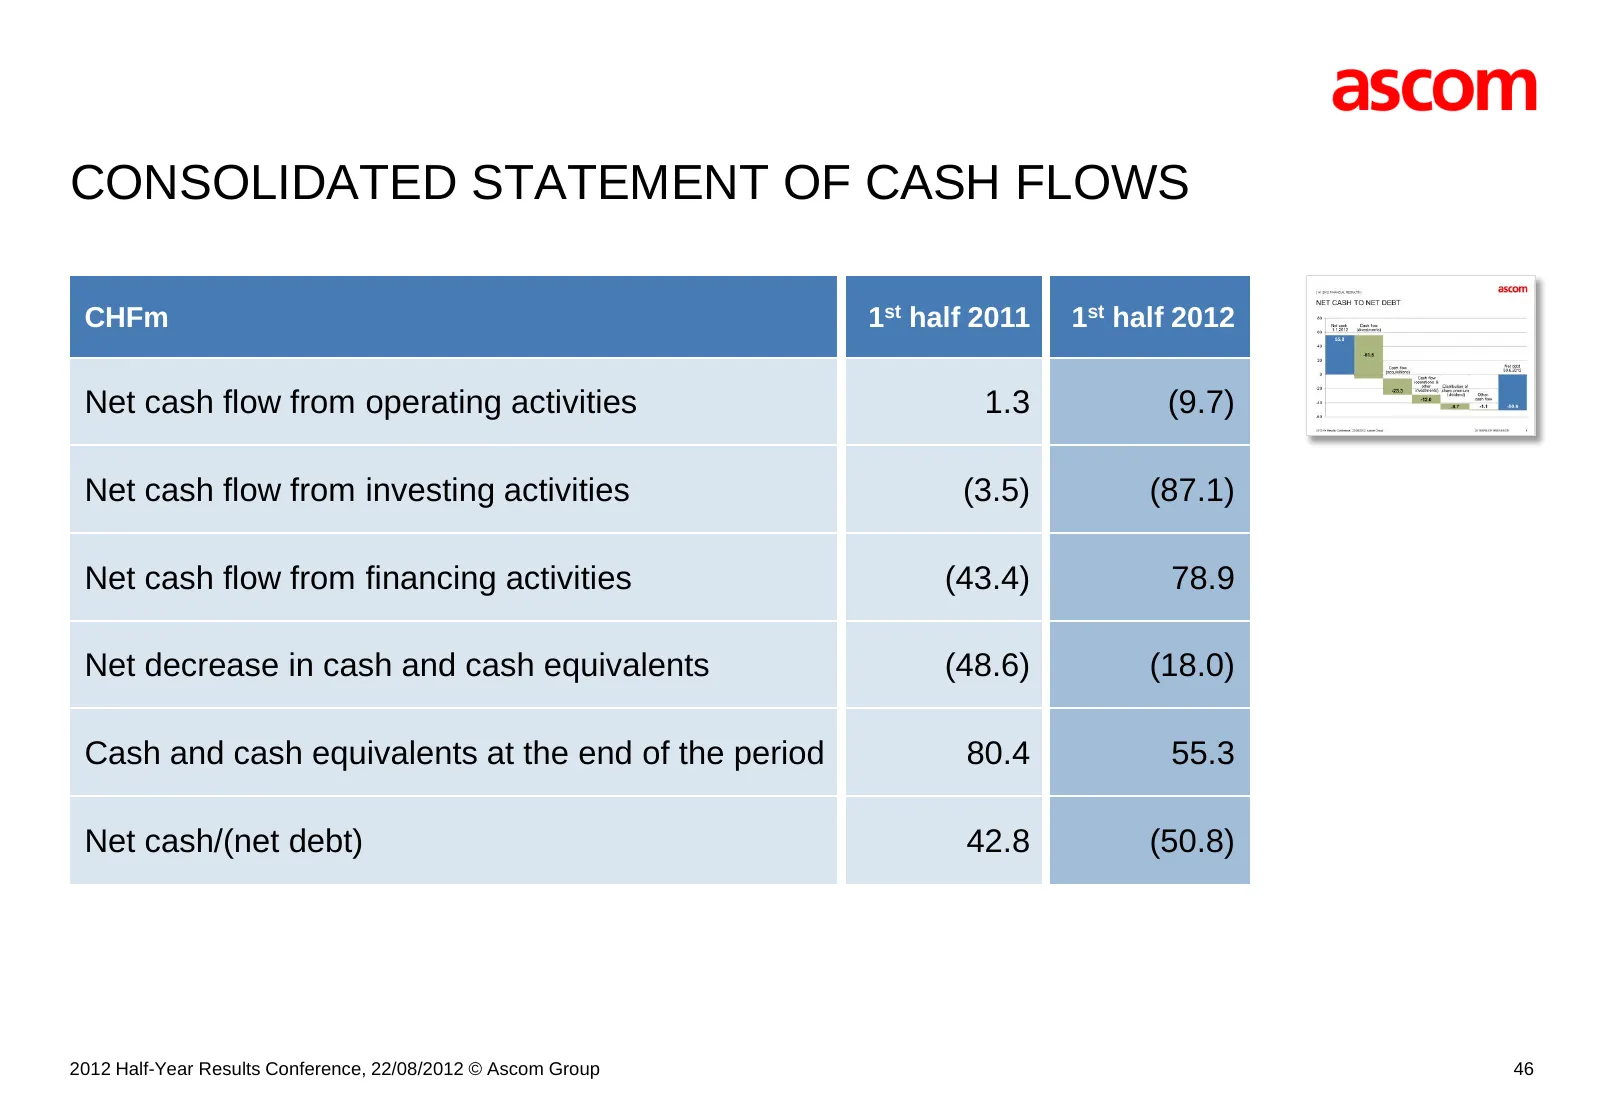
Slide 46: Consolidated Statement of Cash Flows
CONSOLIDATED STATEMENT OF CASH FLOWS CHFm 1st half 2011 1st half 2012 Net cash flow from operating activities 1.3 (9.7) Net cash flow from investing activities (3.5) (87.1) Net cash flow from financing activities (43.4) 78.9 Net decrease in cash and cash equivalents (48.6) (18.0) Cash and cash equiv
Slide 47: Net Cash to Net Debt
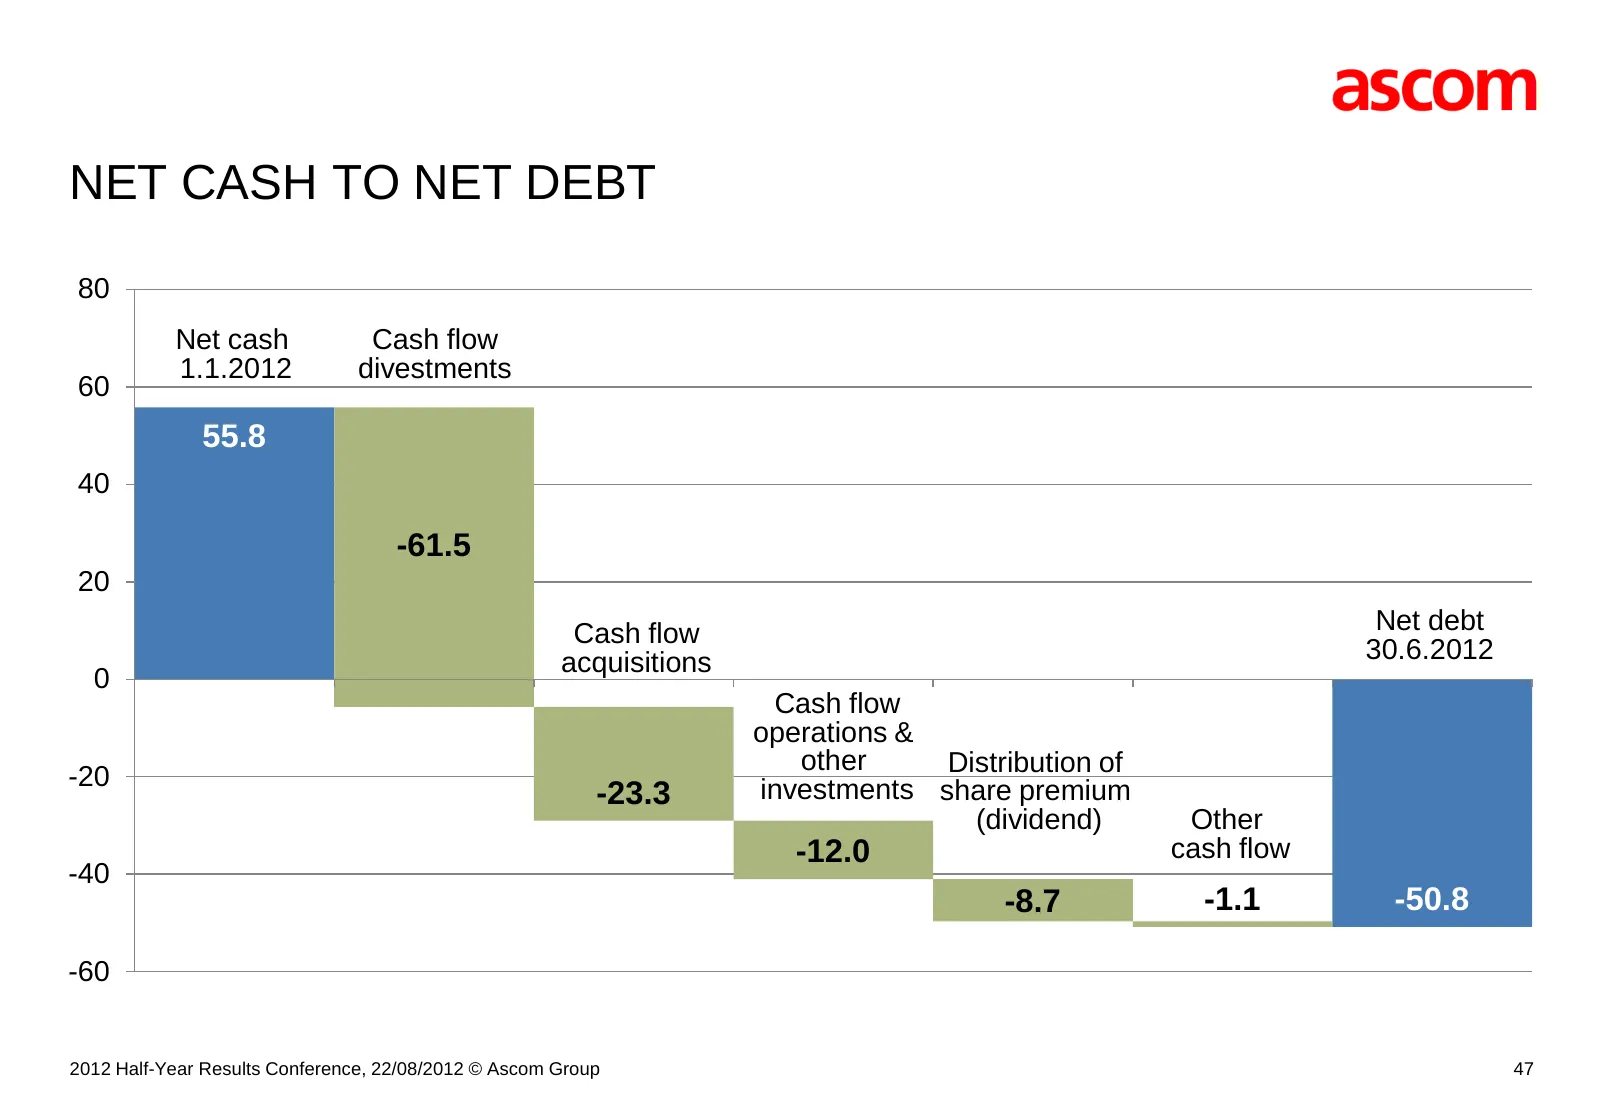
NET CASH TO NET DEBT 80 Net cash Cash flow 1.1.2012 divestments 60 55.8 40 -61.5 20 Cash flow Net debt acquisitions 30.6.2012 0 Cash flow operations & other Distribution of -20 investments share premium -23.3 (dividend) Other -12.0 cash flow -40 -8.7 -1.1 -50.8 -60 Net cash at Cash flow due to Cash

Slide 48: Summary and Outlook
[ ] SUMMARY AND OUTLOOK 2012 Half-Year Results Conference, 22/08/2012 © Ascom Group 48
Slide 49: Ascom Is Committed to Profitable Growth
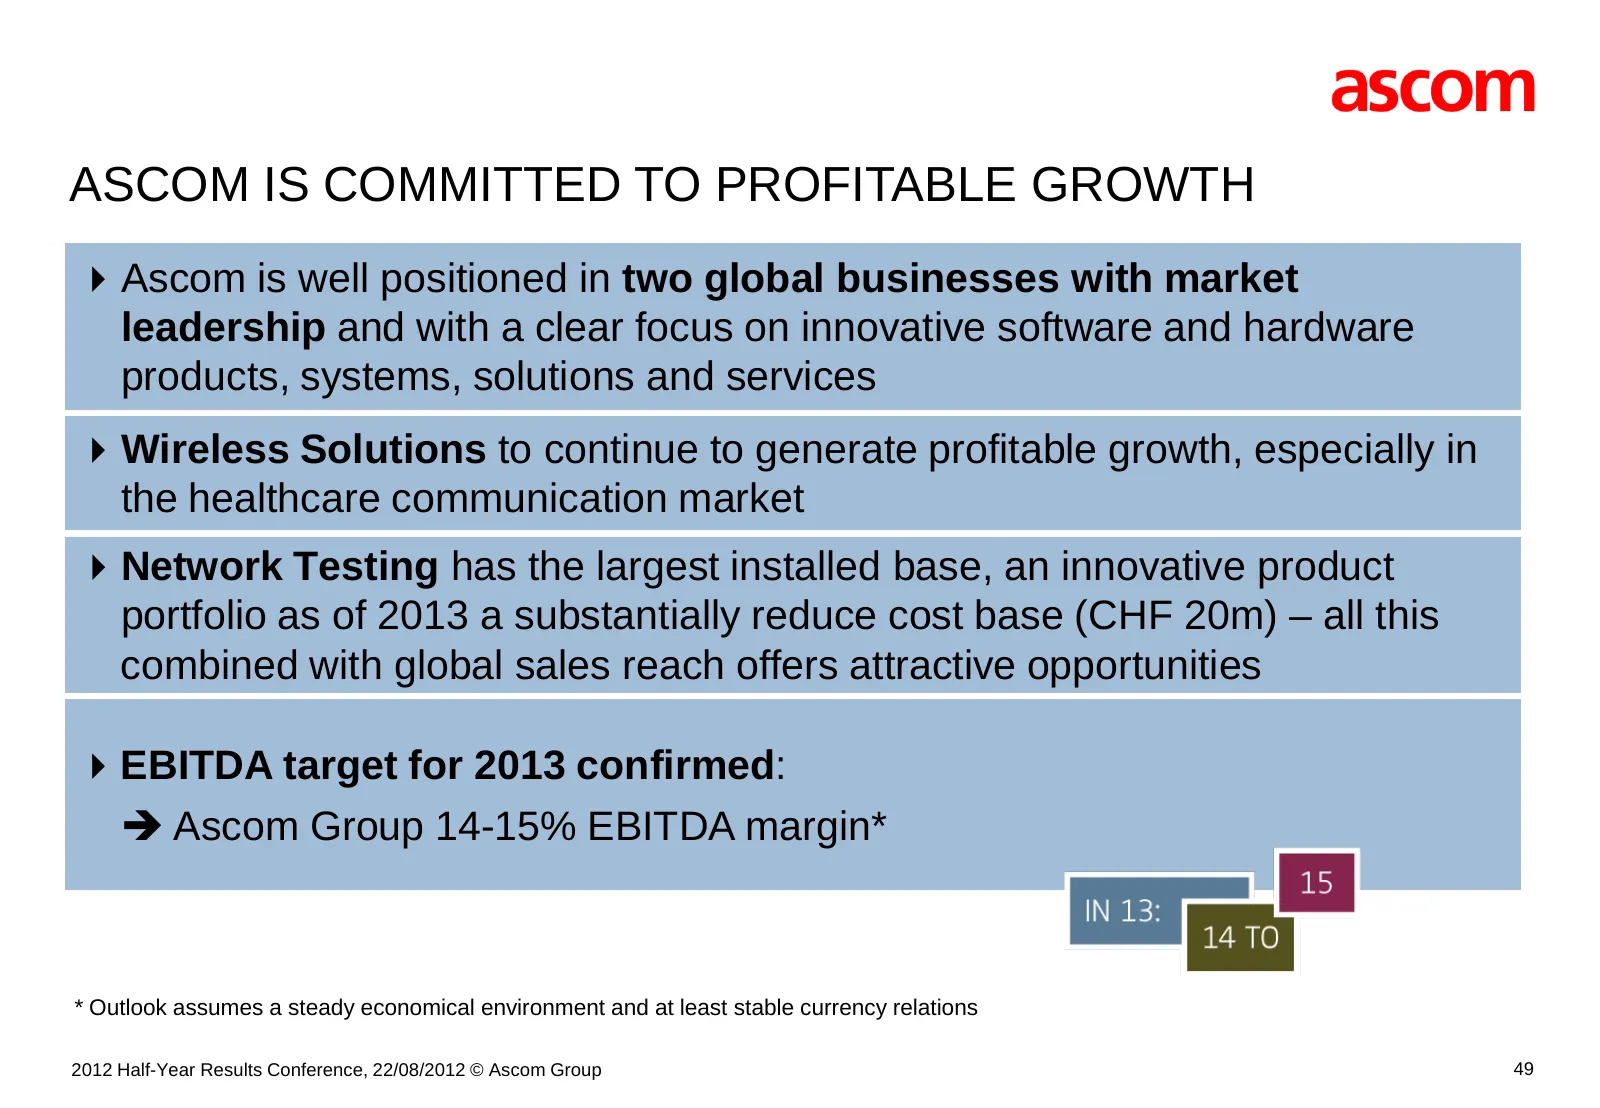
ASCOM IS COMMITTED TO PROFITABLE GROWTH Ascom is well positioned in two global businesses with market leadership and with a clear focus on innovative software and hardware products, systems, solutions and services Wireless Solutions to continue to generate profitable growth, especially in the heal
Slide 50: Outlook – Financial Targets for FY 2012
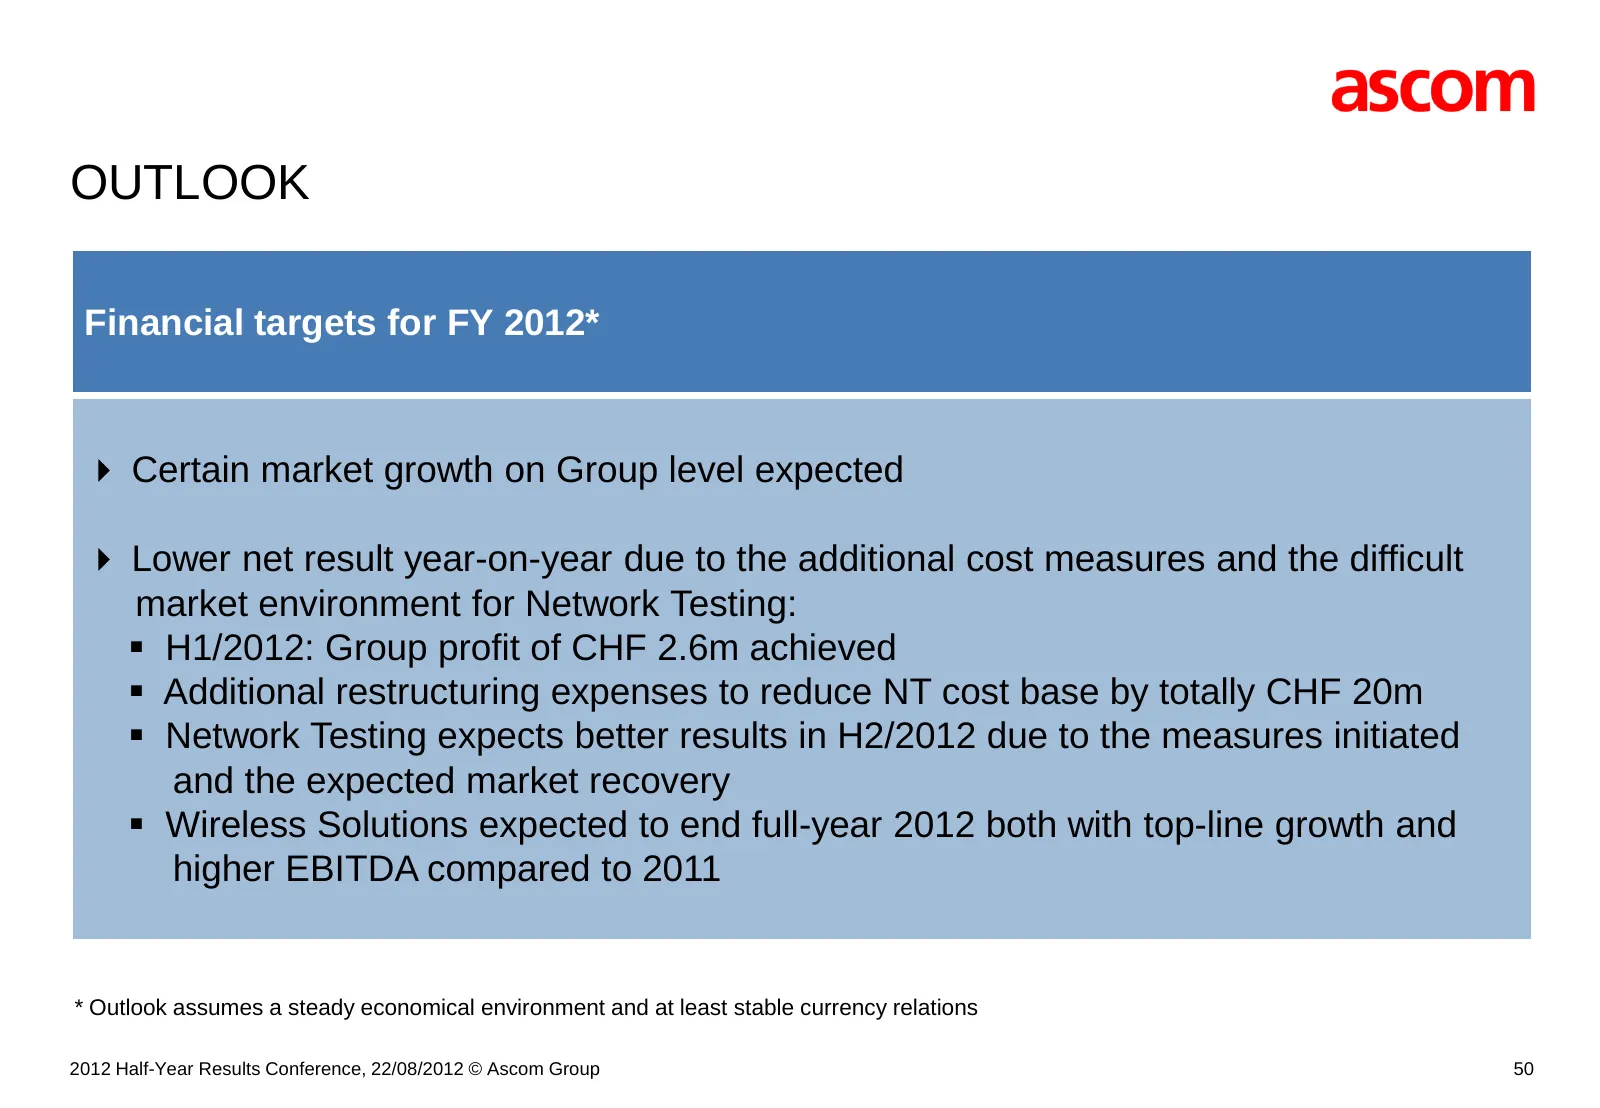
OUTLOOK Financial targets for FY 2012* Certain market growth on Group level expected Lower net result year-on-year due to the additional cost measures and the difficult market environment for Network Testing: H1/2012: Group profit of CHF 2.6m achieved Additional restructuring expenses to red
Slide 51: Outlook – Financial Targets for FY 2013
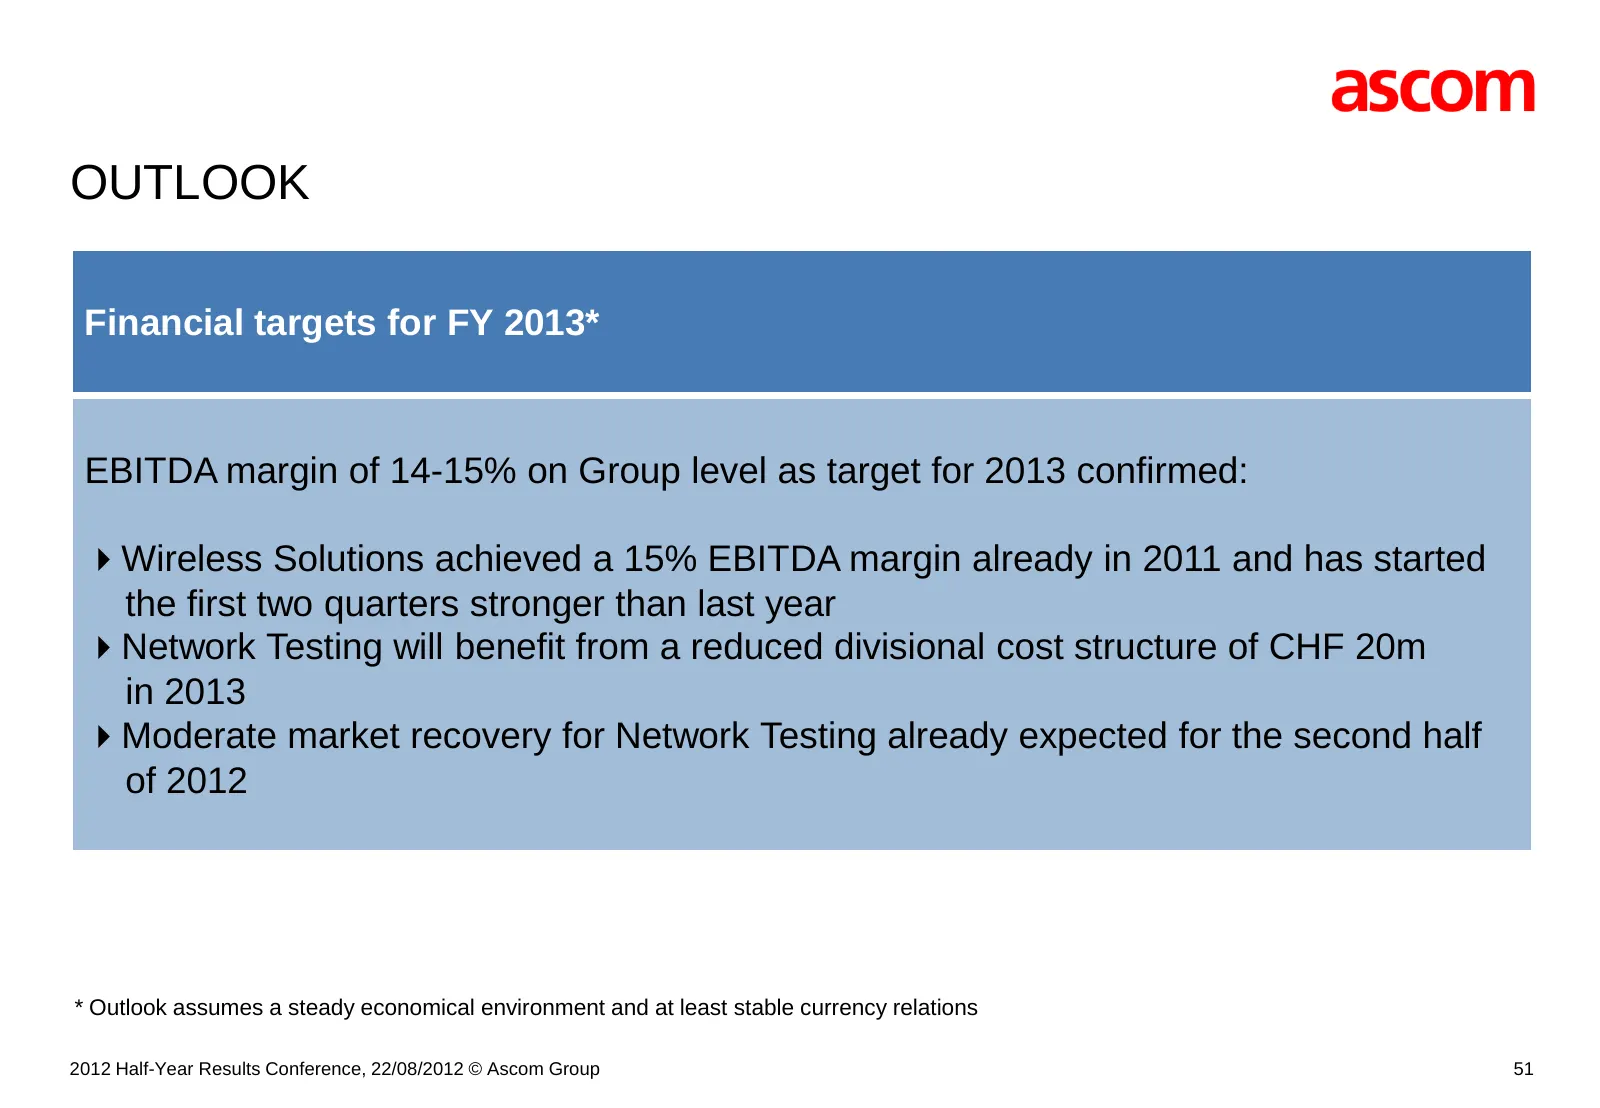
OUTLOOK Financial targets for FY 2013* EBITDA margin of 14-15% on Group level as target for 2013 confirmed: Wireless Solutions achieved a 15% EBITDA margin already in 2011 and has started the first two quarters stronger than last year Network Testing will benefit from a reduced divisional cost str

Slide 52: Group Contact
[ ] GROUP CONTACT Ascom Holding AG Investor Relations T +41 31 999 11 11 Stettbachstrasse 6 F +41 44 823 13 21 CH-8600 Dübendorf investor@ascom.com www.ascom.com 2012 Half-Year Results Conference, 22/08/2012 © Ascom Group 52
Slide 53: Legal Disclaimer
LEGAL DISCLAIMER This document contains specific forward-looking statements, e.g. statements including terms like “believe”, “expect” or similar expressions. Such forward-looking statements are subject to known and unknown risks, uncertainties and other factors which may result in a substantial dive

Slide 54: Thank You!
THANK YOU! — rrr | _ THE INTERNATIONAL TECHNO
Source: Internet Archive copy of ascom.com