Pricol Ltd. · NSE:PRICOLLTD
Pricol — Investor Presentation (November 2014)
12 slides from Pricol's investor presentation, November 2014

Slide 1: Investor Presentation November 2014
Strategic Document on Round Instruments Investor Presentation November 2014 -1-
Slide 2: Disclaimer
Disclaimer This presentation has been prepared by Pricol Limited (the “Company”) solely for your information and for your use and may not be taken away, distributed, reproduced or redistributed or passed on, directly or indirectly, to any other person (whether within or outside your organization or
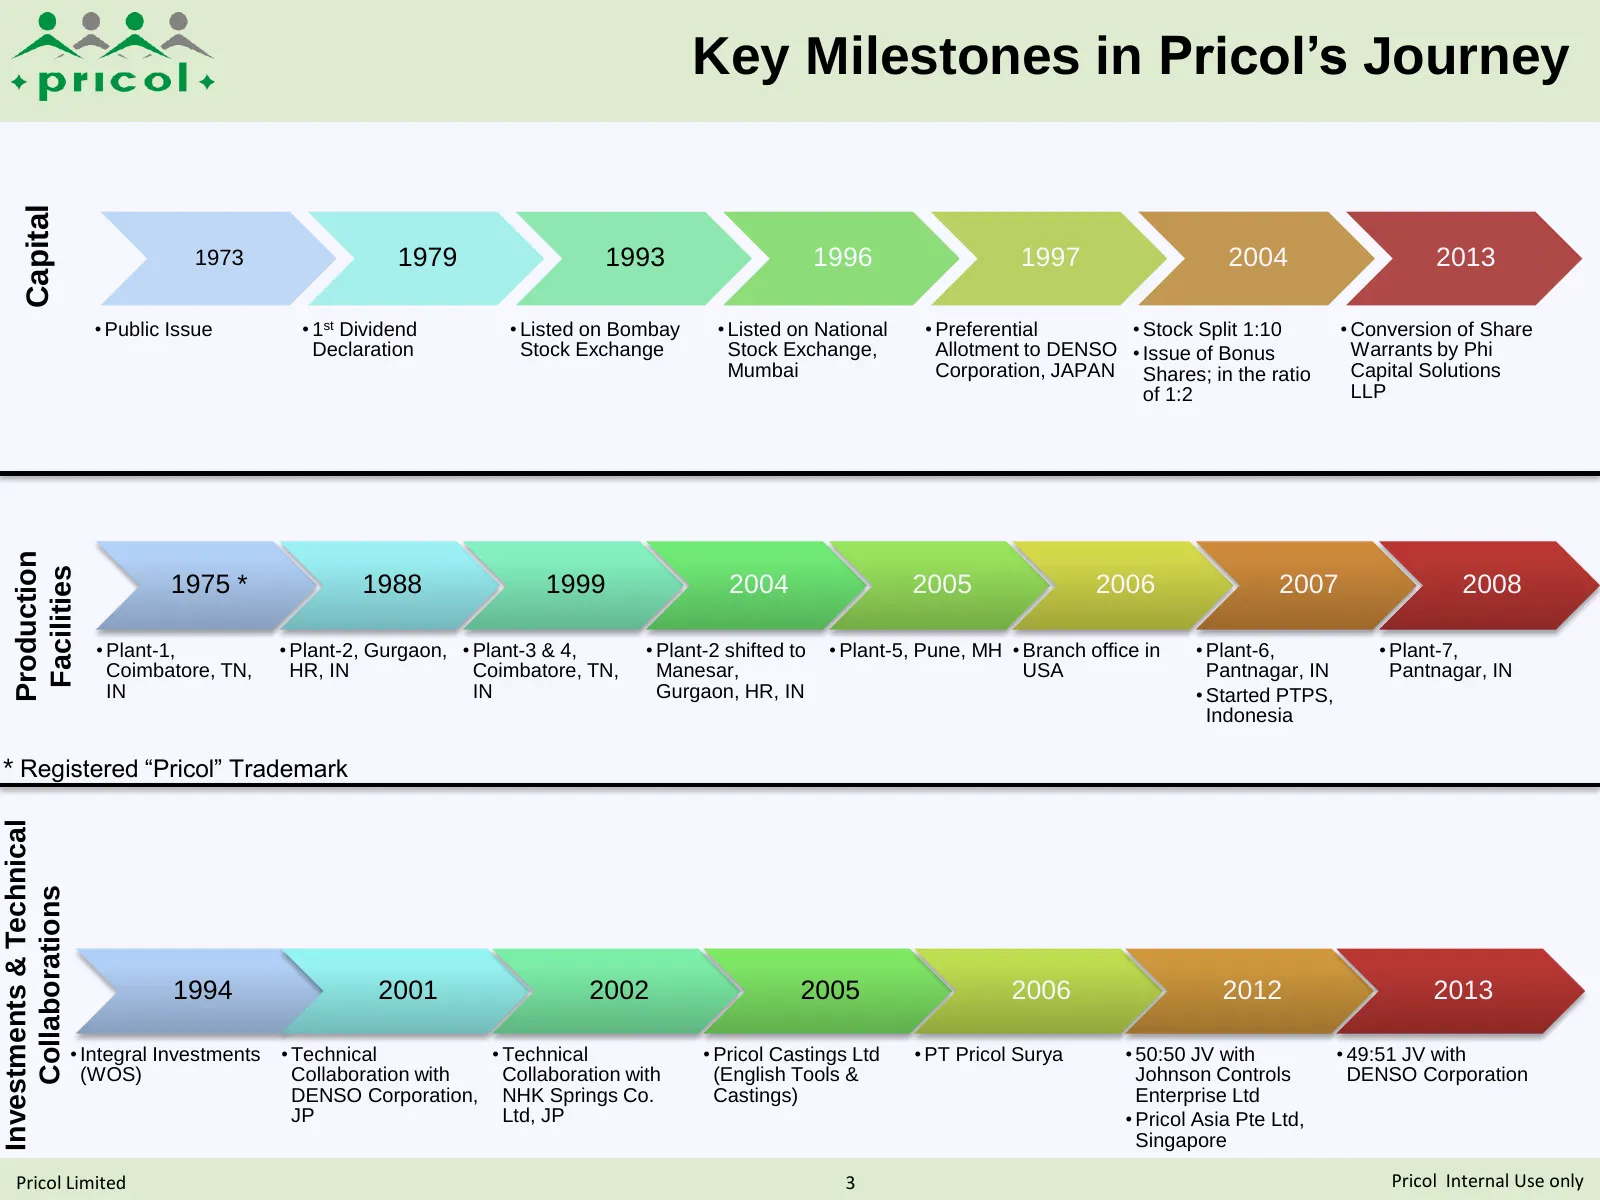
Slide 3: Key Milestones in Pricol's Journey
Capital Key Milestones in Pricol’s Journey 1973 1979 1993 1996 1997 2004 2013 • Public Issue • 1st Dividend • Listed on Bombay • Listed on National • Preferential • Stock Split 1:10 • Conversion of Share Declaration Stock Exchange Stock Exchange, Allotment to DENSO • Issue of Bonus Warrants by Phi M
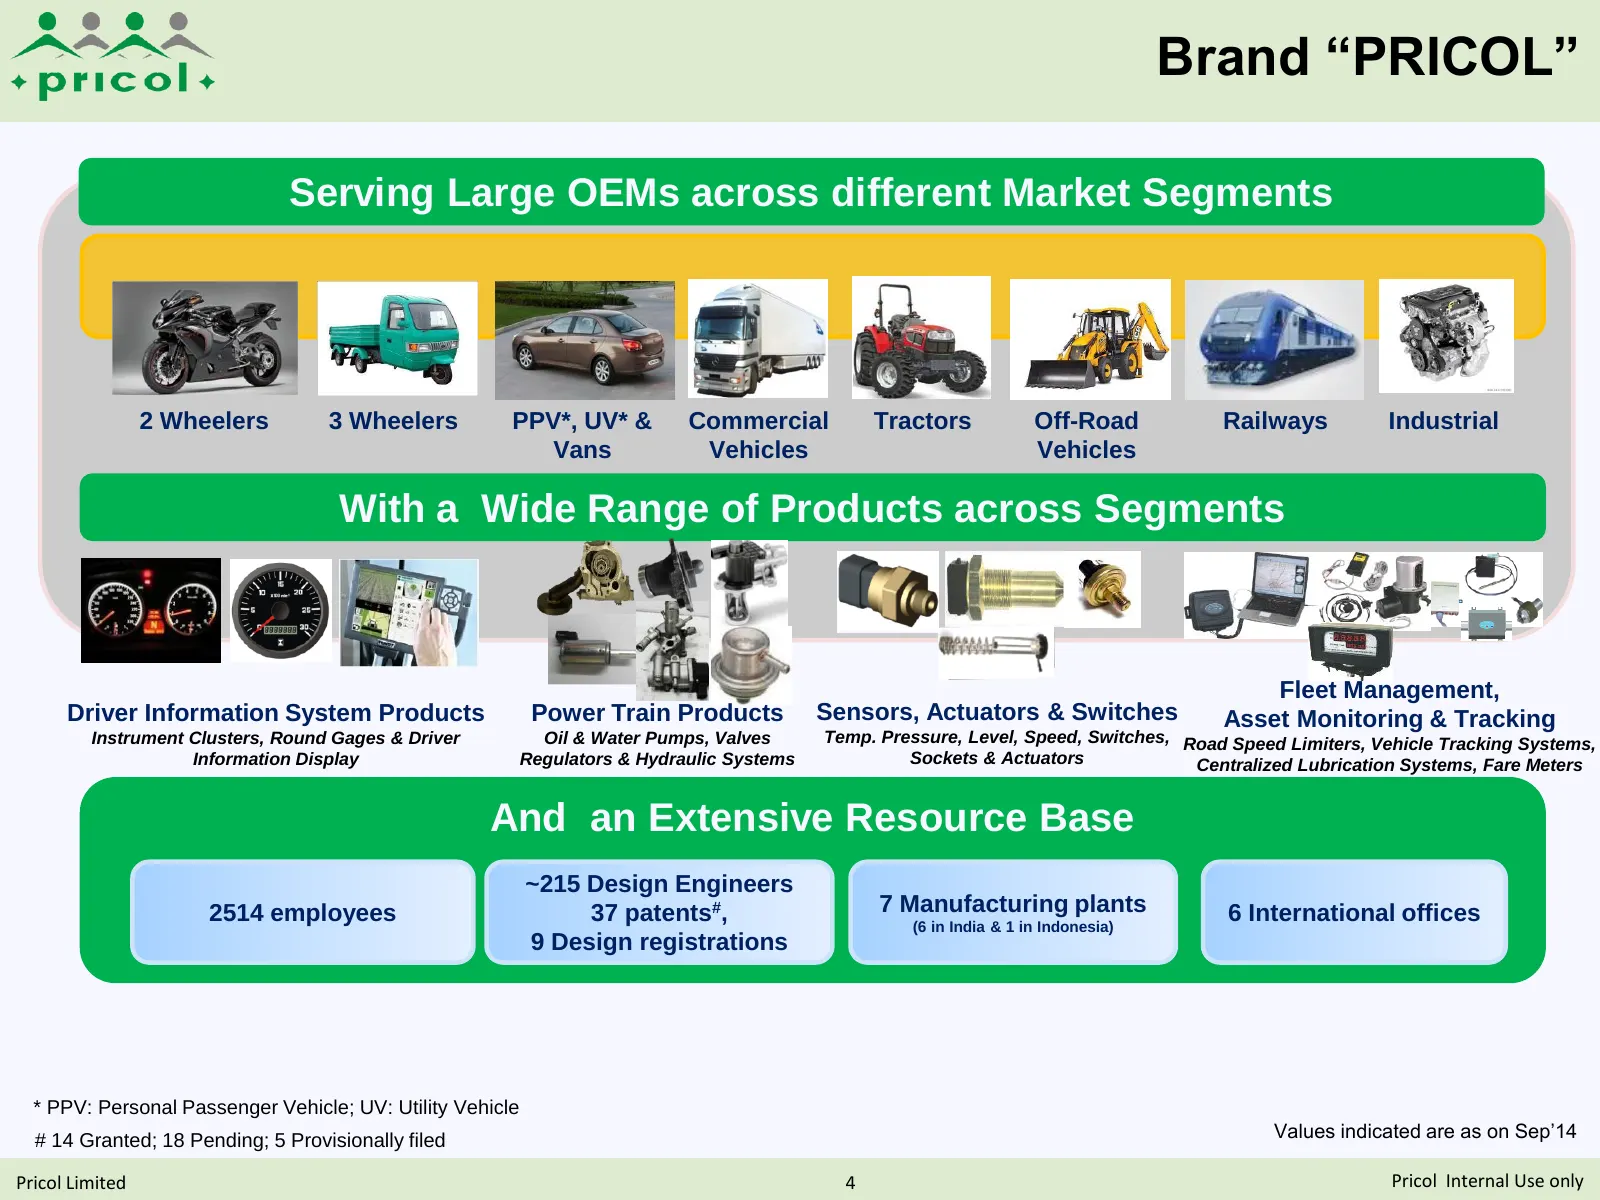
Slide 4: Brand "PRICOL"
Brand “PRICOL” Serving Large OEMs across different Market Segments 2 Wheelers 3 Wheelers PPV*, UV* & Commercial Tractors Off-Road Railways Industrial Vans Vehicles Vehicles With a Wide Range of Products across Segments Fleet Management, Driver Information System Products Power Train Products Sensors
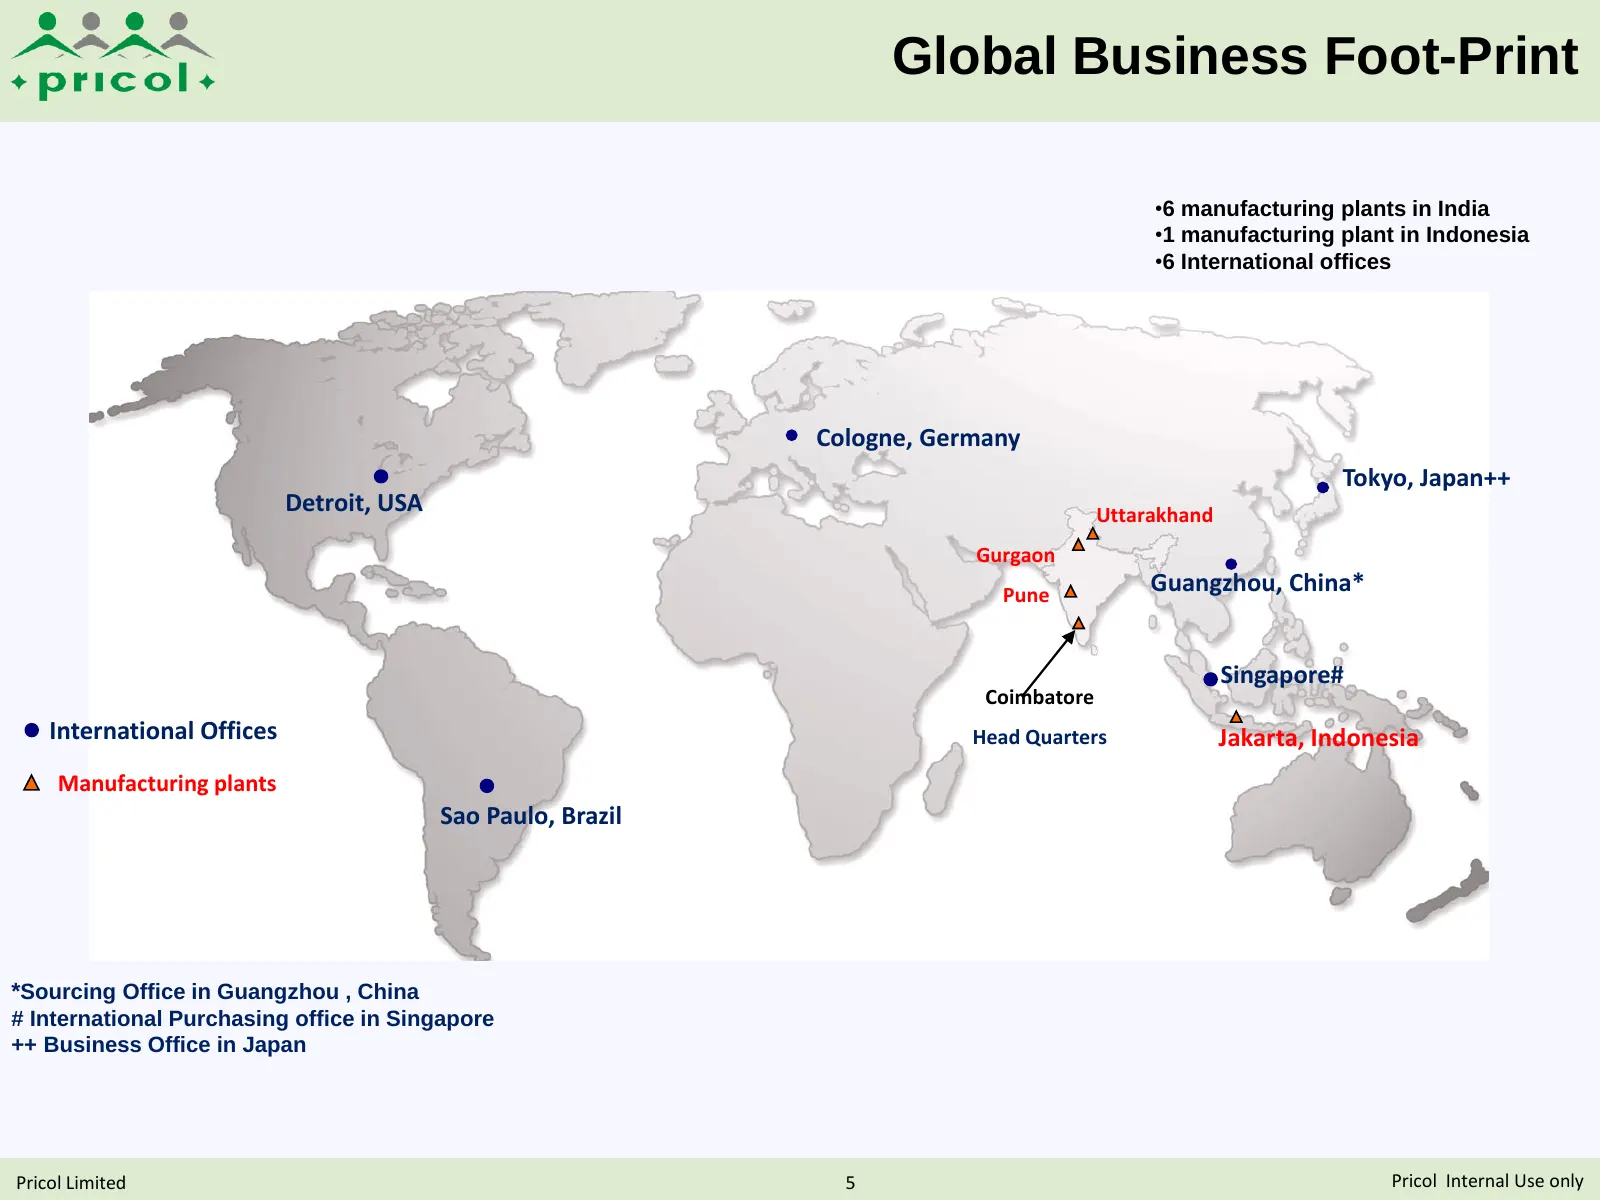
Slide 5: Global Business Foot-Print
Global Business Foot-Print •6 manufacturing plants in India •1 manufacturing plant in Indonesia •6 International offices Cologne, Germany Tokyo, Japan++ Detroit, USA Uttarakhand Gurgaon Pune Guangzhou, China* Singapore# Coimbatore International Offices Head Quarters Jakarta, Indonesia Manufacturing
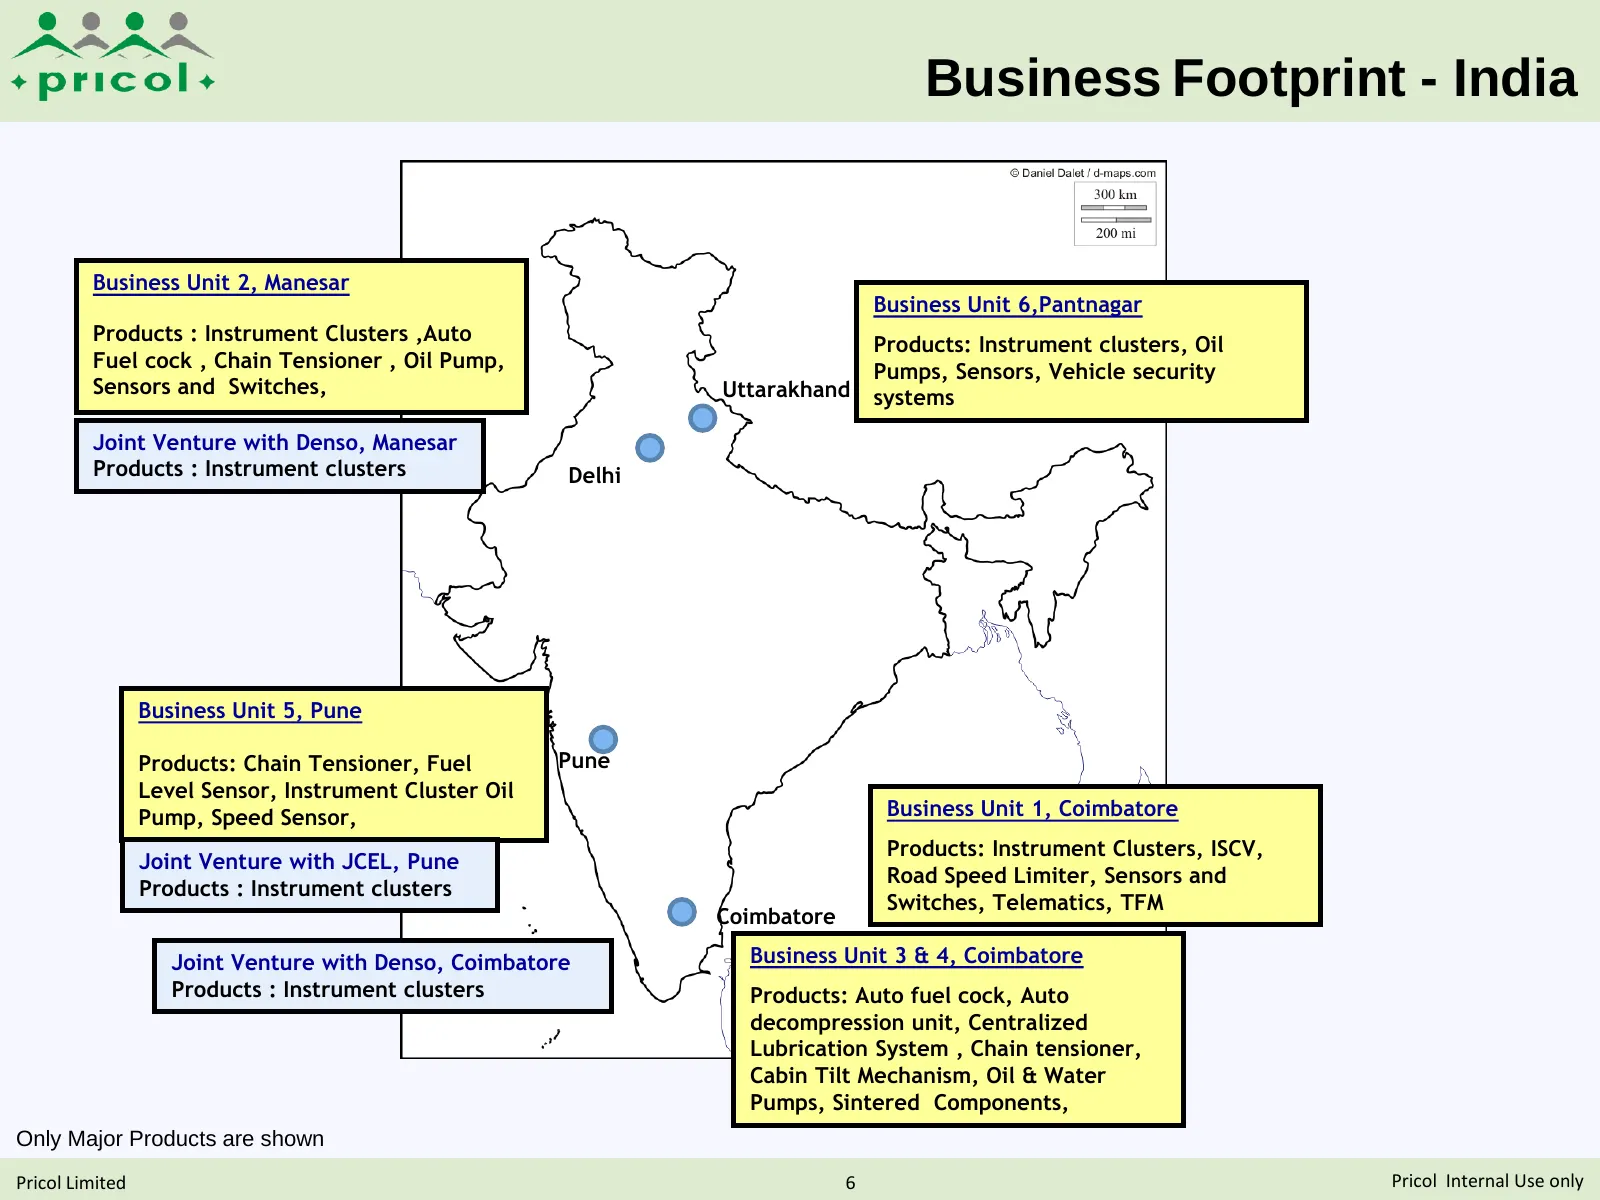
Slide 6: Business Footprint - India
Business Footprint - India Business Unit 2, Manesar Business Unit 6,Pantnagar Products : Instrument Clusters ,Auto Products: Instrument clusters, Oil Fuel cock , Chain Tensioner , Oil Pump, Pumps, Sensors, Vehicle security Sensors and Switches, Uttarakhand systems Joint Venture with Denso, Manesar P
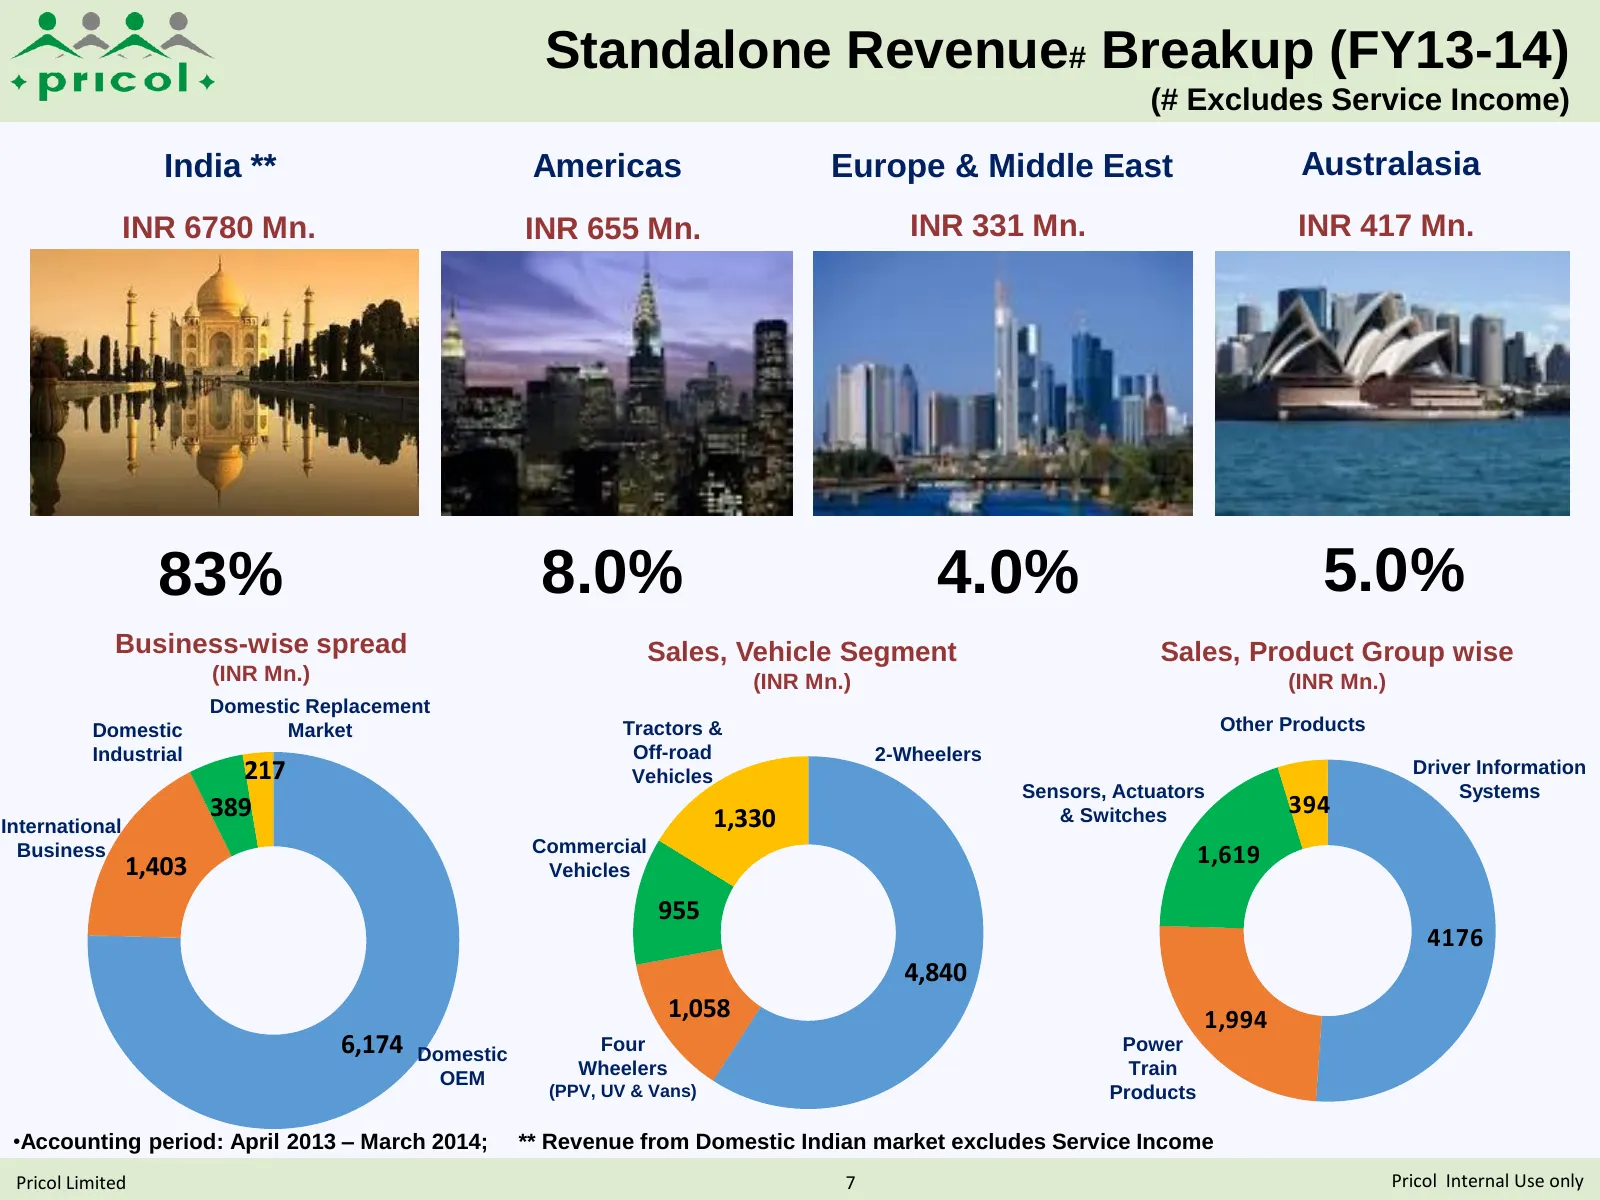
Slide 7: Standalone Revenue Breakup (FY13-14)
Standalone Revenue# Breakup (FY13-14) (# Excludes Service Income) India ** Americas Europe & Middle East Australasia INR 6780 Mn. INR 655 Mn. INR 331 Mn. INR 417 Mn. 83% 8.0% 4.0% 5.0% Business-wise spread Sales, Vehicle Segment Sales, Product Group wise (INR Mn.) (INR Mn.) (INR Mn.) Domestic Replac
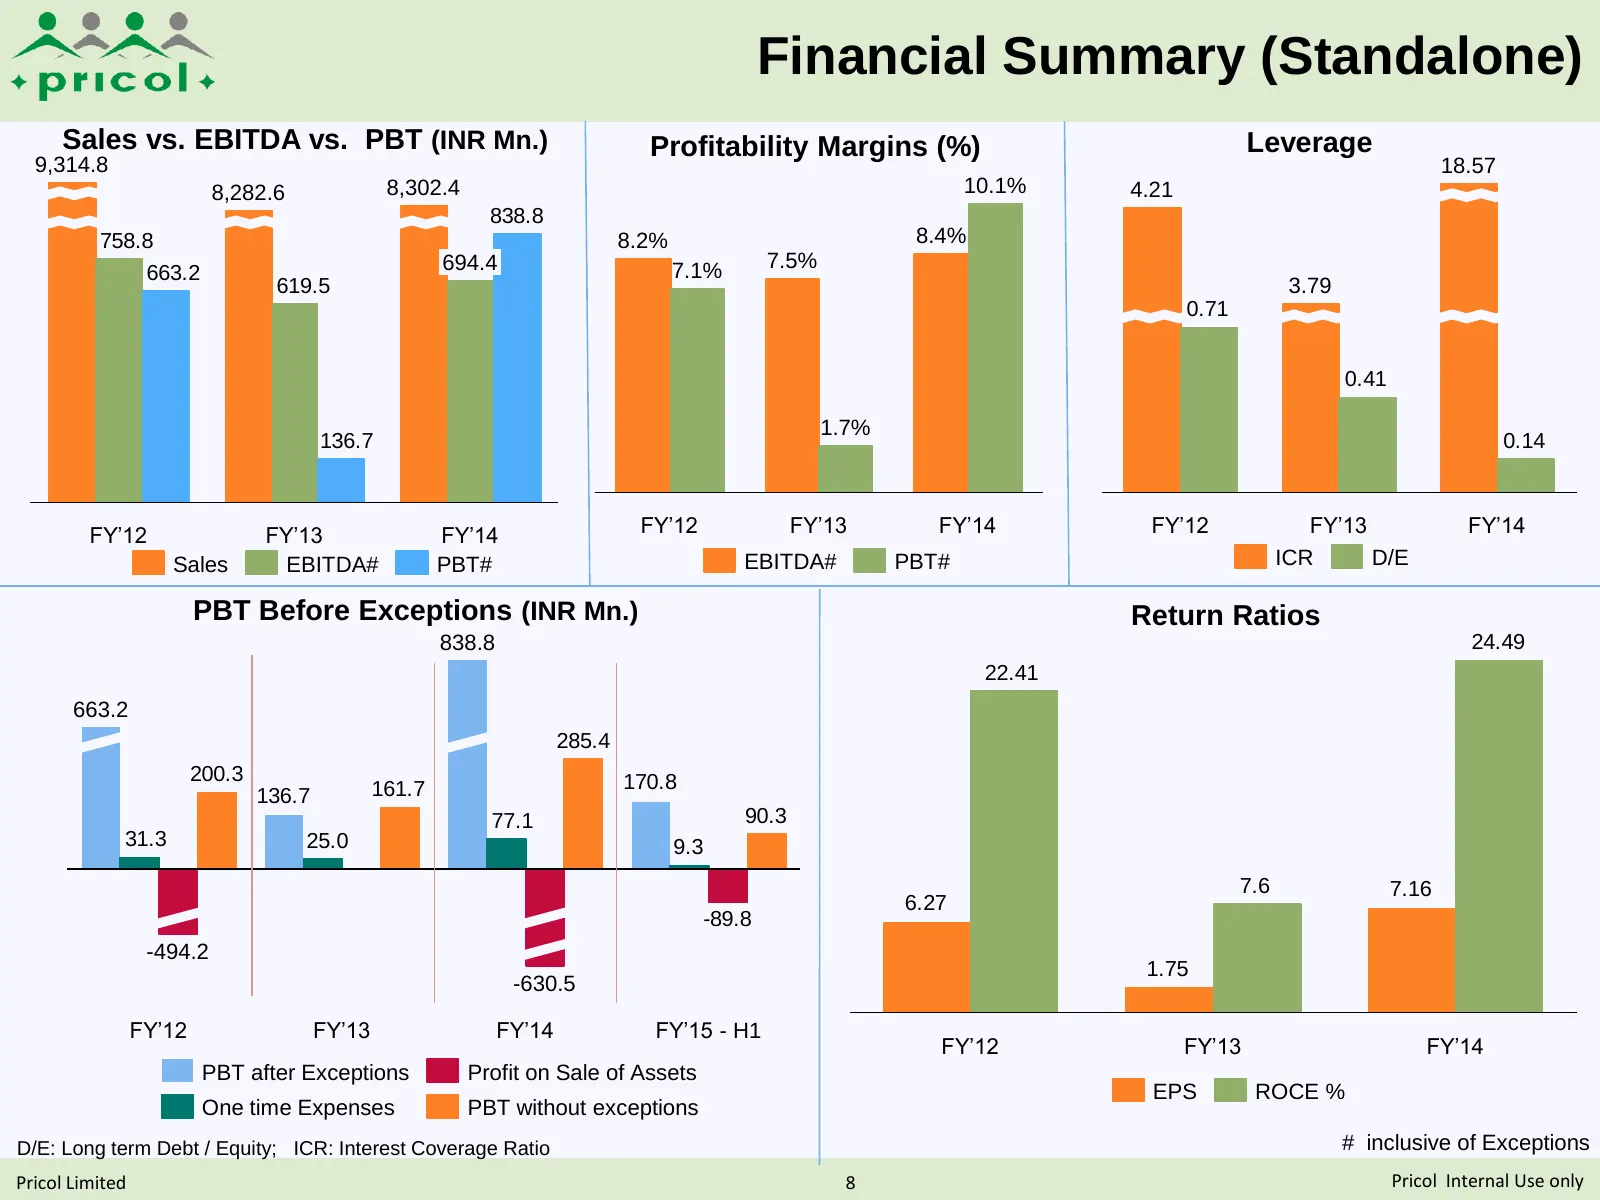
Slide 8: Financial Summary (Standalone)
Financial Summary (Standalone) Sales vs. EBITDA vs. PBT (INR Mn.) Profitability Margins (%) Leverage 9,314.8 18.57 8,282.6 8,302.4 10.1% 4.21 838.8 758.8 8.2% 8.4% 694.4 7.1% 7.5% 663.2 619.5 3.79 0.71 0.41 1.7% 136.7 0.14 FY’12 FY’13 FY’14 FY’12 FY’13 FY’14 FY’12 FY’13 FY’14 Sales EBITDA# PBT# EBIT
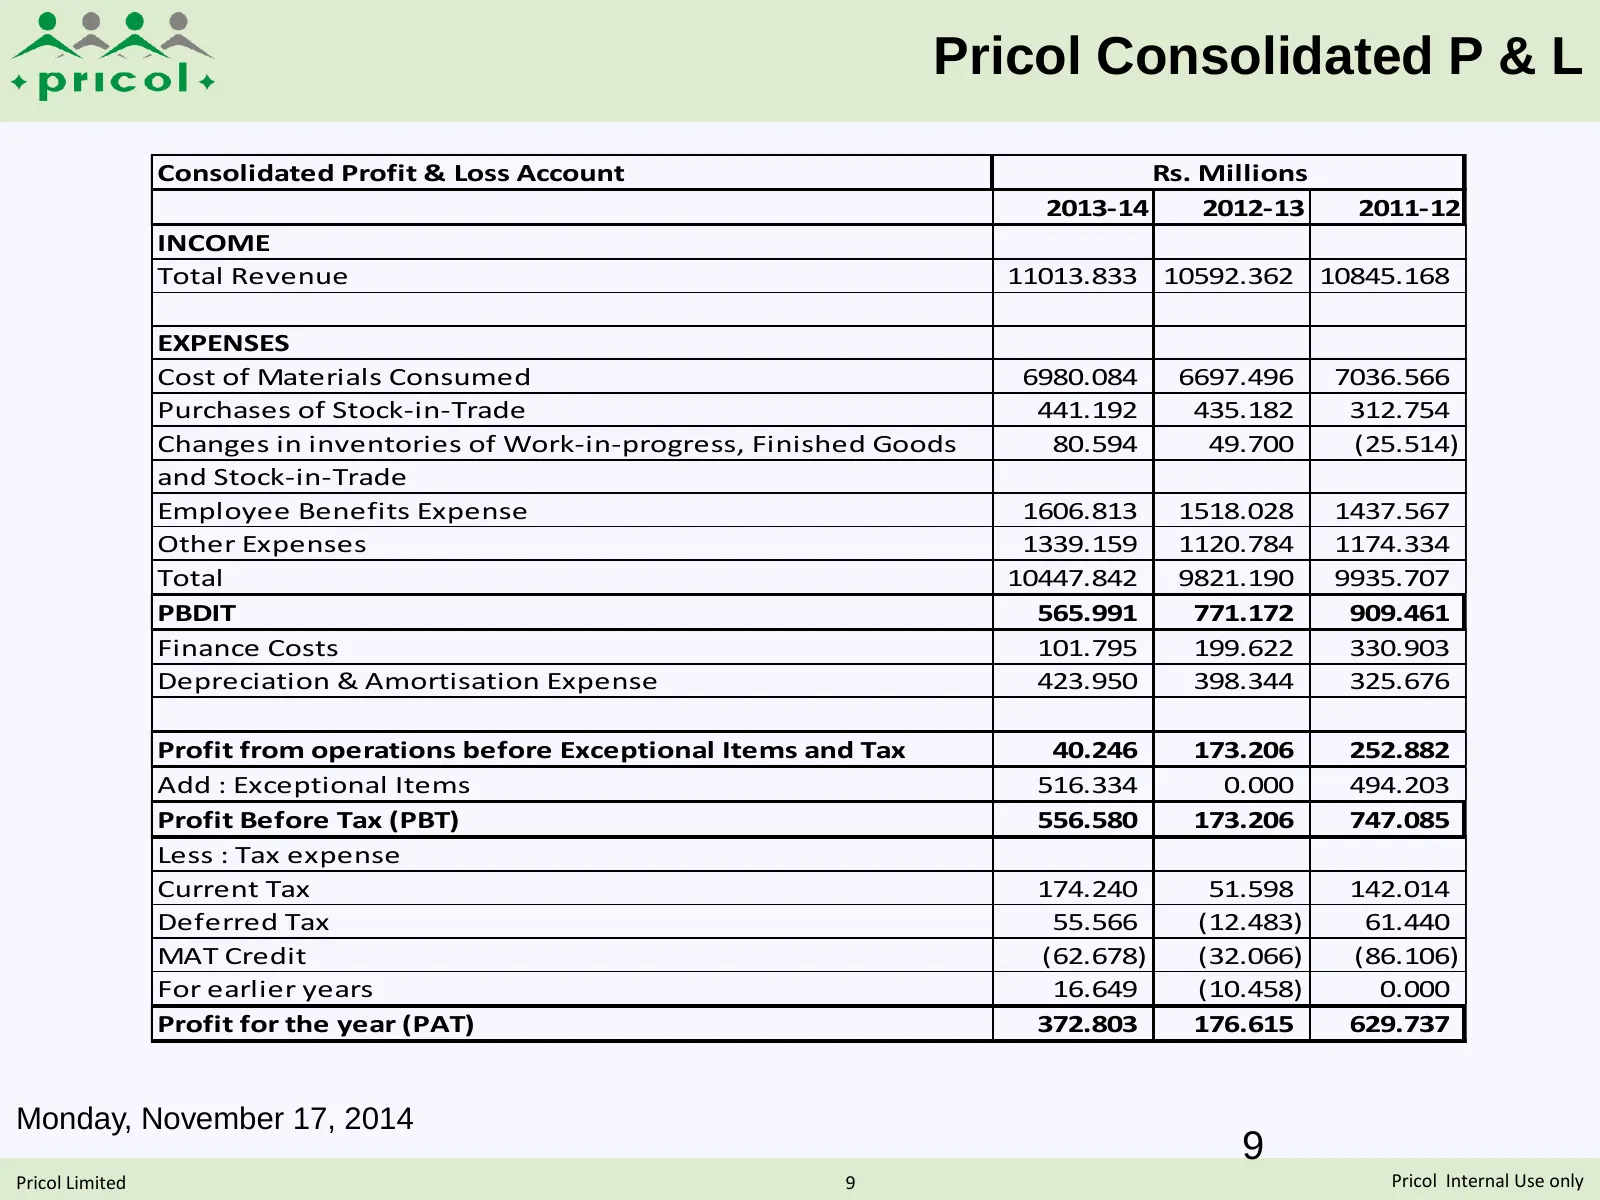
Slide 9: Pricol Consolidated P & L
Pricol Consolidated P & L Consolidated Profit & Loss Account Rs. Millions 2013-14 2012-13 2011-12 INCOME Total Revenue 11013.833 10592.362 10845.168 EXPENSES Cost of Materials Consumed 6980.084 6697.496 7036.566 Purchases of Stock-in-Trade 441.192 435.182 312.754 Changes in inventories of Work-in-pr
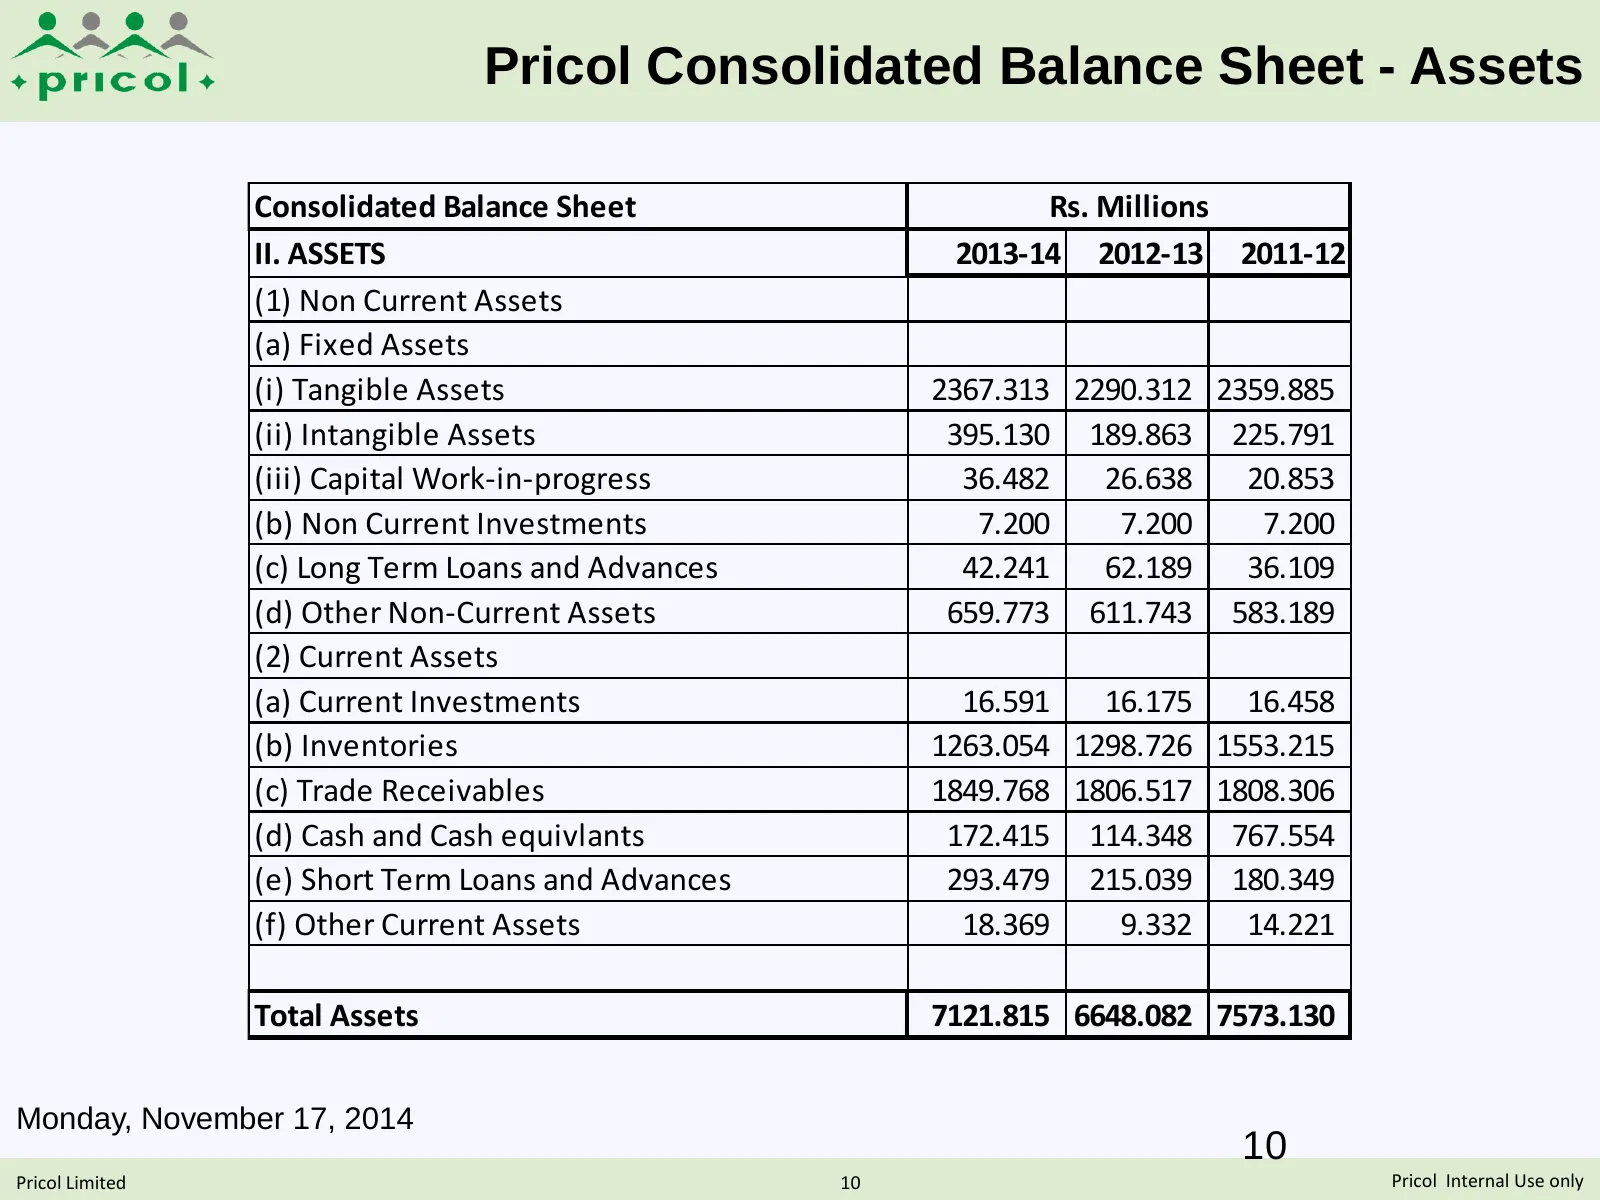
Slide 10: Pricol Consolidated Balance Sheet - Assets
Pricol Consolidated Balance Sheet - Assets Consolidated Balance Sheet Rs. Millions II. ASSETS 2013-14 2012-13 2011-12 (1) Non Current Assets (a) Fixed Assets (i) Tangible Assets 2367.313 2290.312 2359.885 (ii) Intangible Assets 395.130 189.863 225.791 (iii) Capital Work-in-progress 36.482 26.638 20.
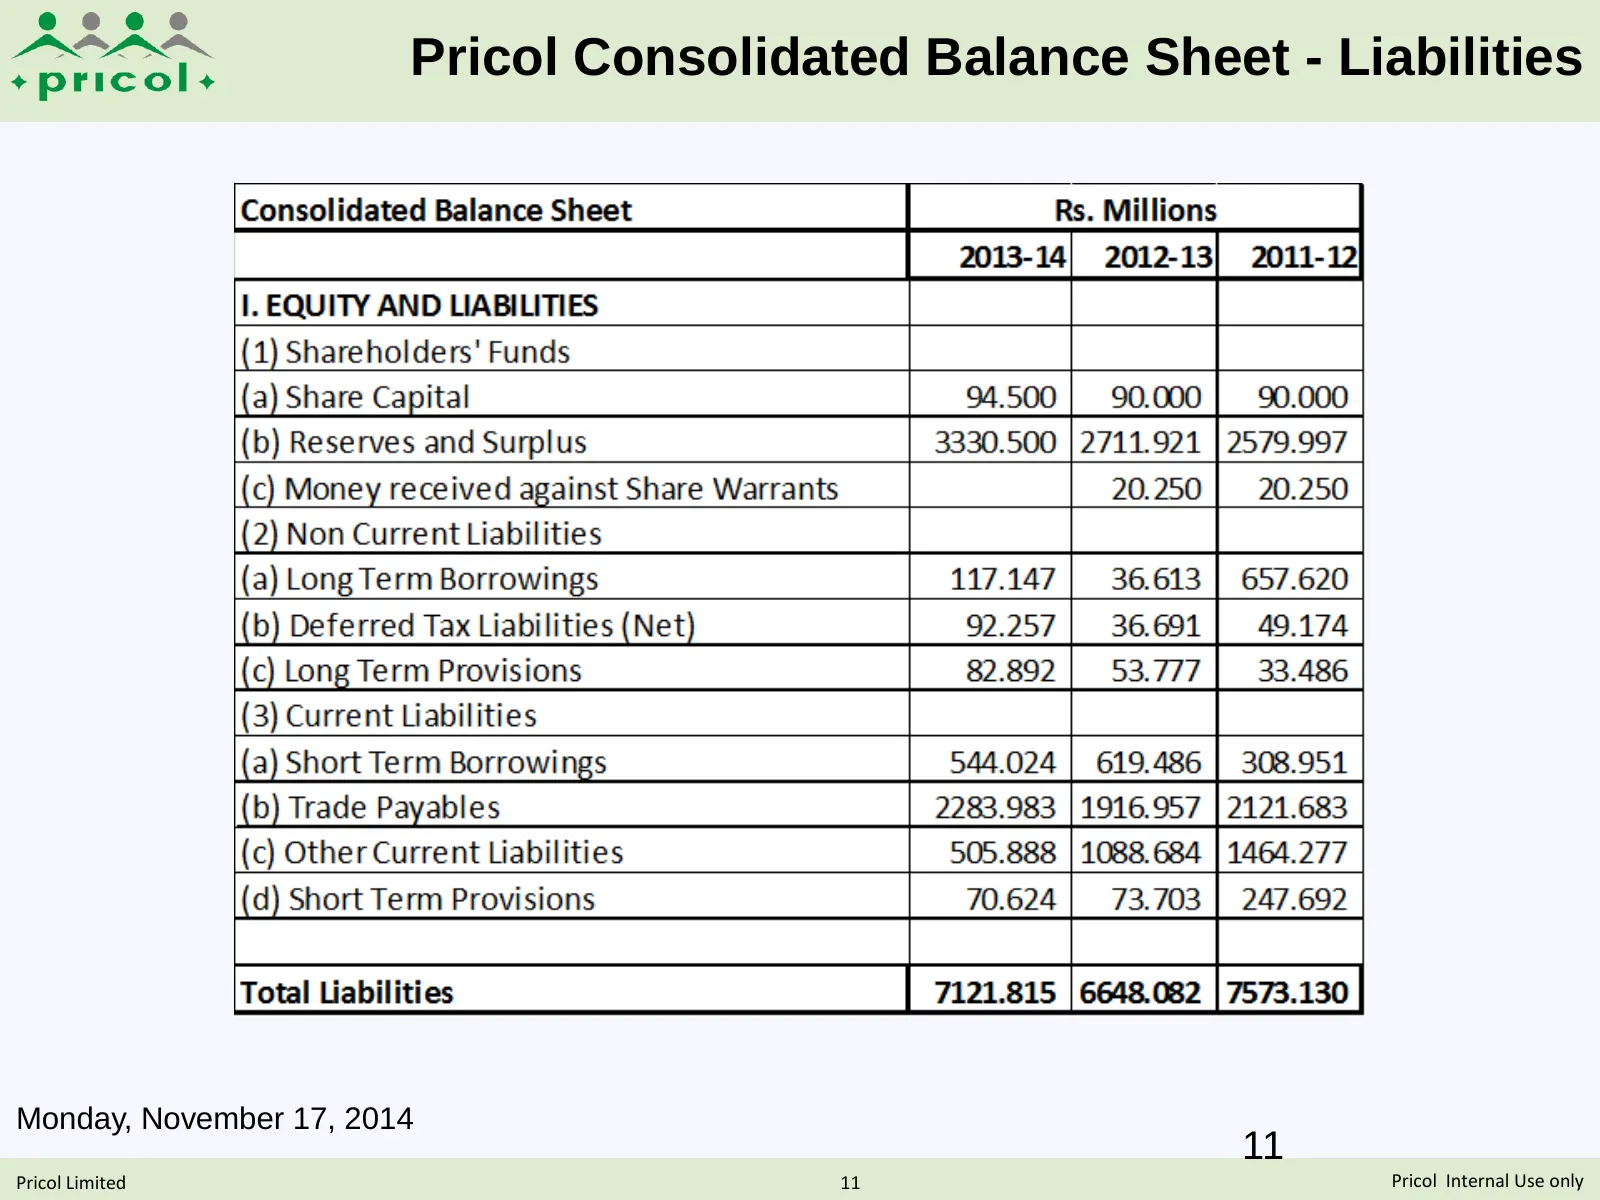
Slide 11: Pricol Consolidated Balance Sheet - Liabilities
Pricol Consolidated Balance Sheet - Liabilities Monday, November 17, 2014 11 Pricol Limited 11 Pricol Internal Use only

Slide 12: Thank You
THANK YOU Pricol Limited 12 Pricol Internal Use only
Source: Internet Archive copy of pricol.com
More decks from Pricol Ltd.
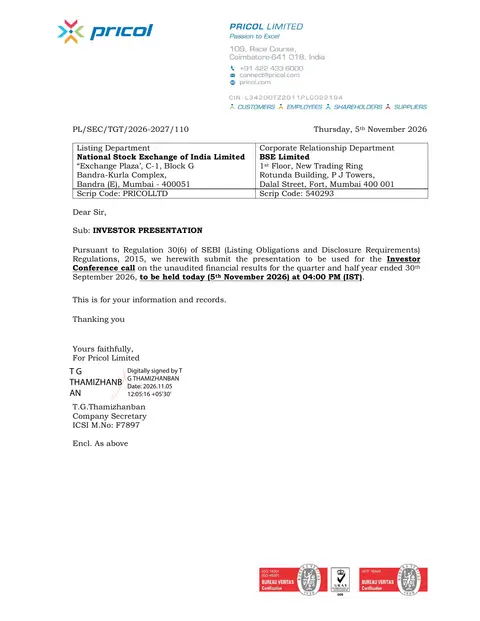 Q2 FY27 Earnings Presentation25 slides · Nov 5, 2026
 Investor Presentation (October 2026)54 slides · October 2026
 Investor Presentation (September 2026)53 slides · September 2026
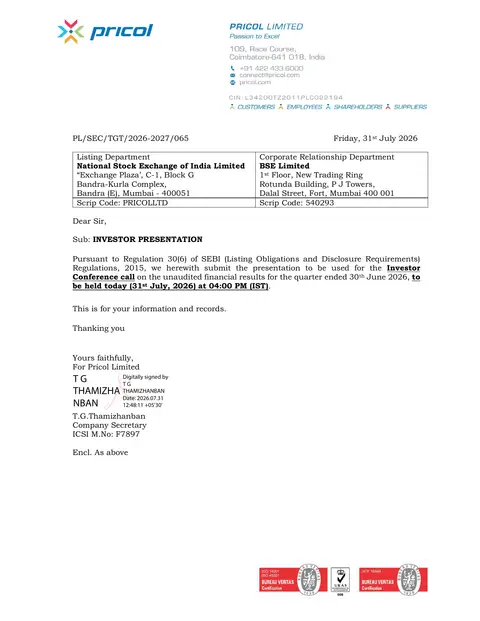 Q1 FY27 Earnings Presentation22 slides · Jul 31, 2026
 Investor Presentation (July 2026)50 slides · July 2026
 Q4 FY26 Earnings Presentation23 slides · May 15, 2026