ENAV S.p.A. · MIL:ENAV
ENAV — H1 2022 Earnings Presentation
12 slides from ENAV's earnings presentation, Aug 3, 2022
Slide 1: 1H 2022 Financial Results
1H 2022 Financial Results A u g ust 3 , 2 0 22 e n a v. i t
Slide 2: 1H 2022 Group's Highlights
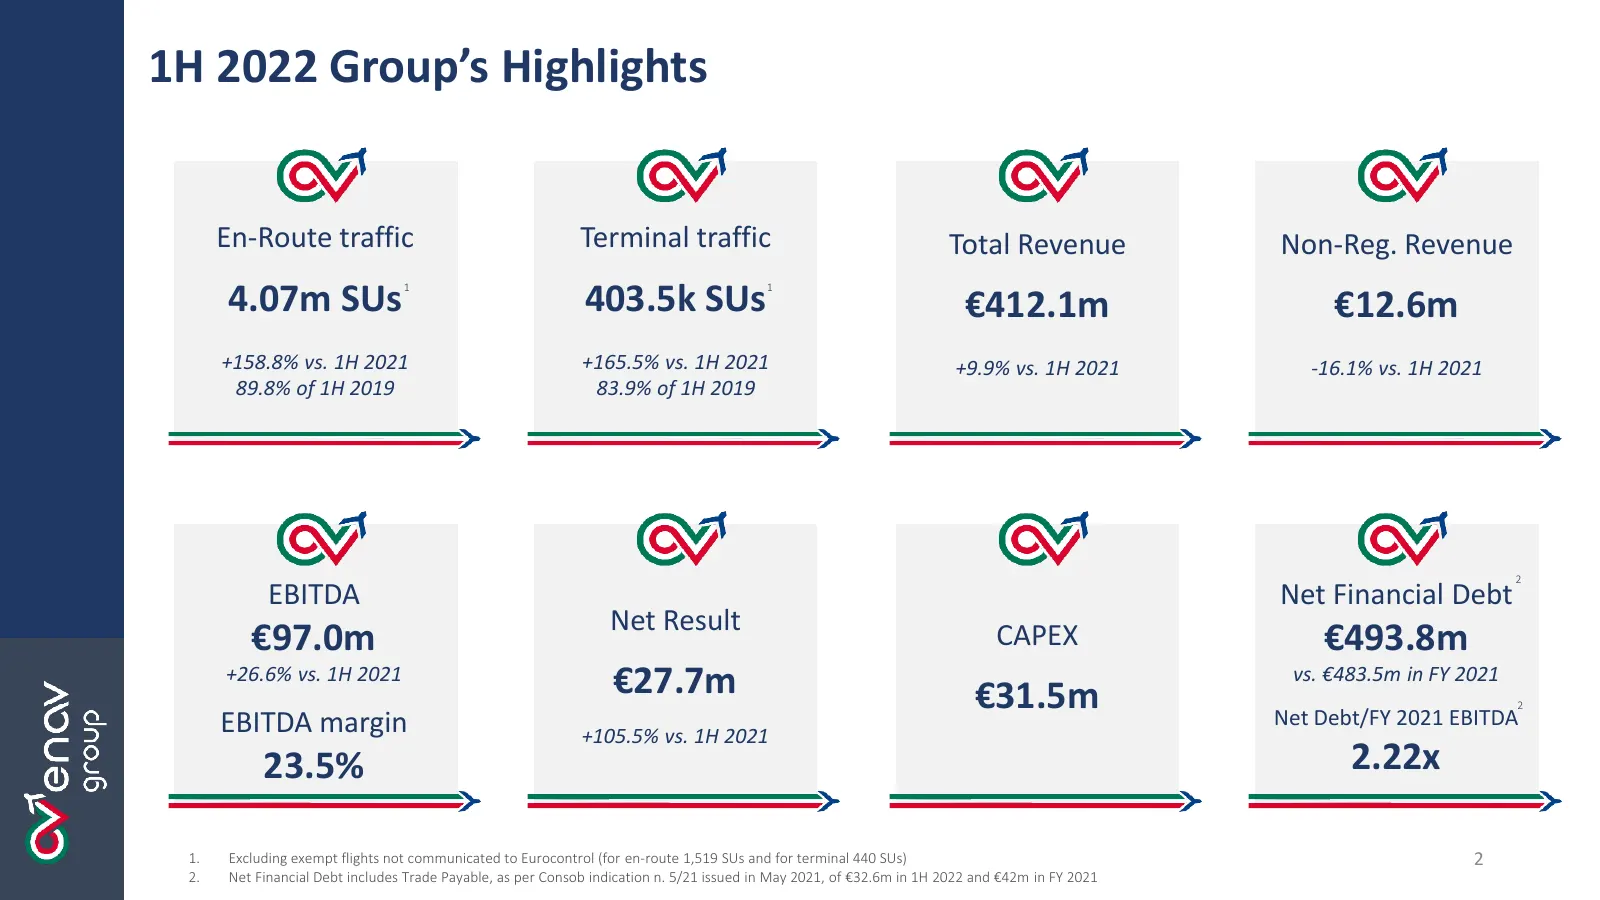
1H 2022 Group’s Highlights En-Route traffic Terminal traffic Total Revenue Non-Reg. Revenue 4.07m SUs 1 403.5k SUs 1 €412.1m €12.6m +158.8% vs. 1H 2021 +165.5% vs. 1H 2021 +9.9% vs. 1H 2021 -16.1% vs. 1H 2021 89.8% of 1H 2019 83.9% of 1H 2019 2 EBITDA Net Financial Debt Net Result €97.0m CAPEX €493.
Slide 3: 1H 2022 Main Traffic Trends – En-Route
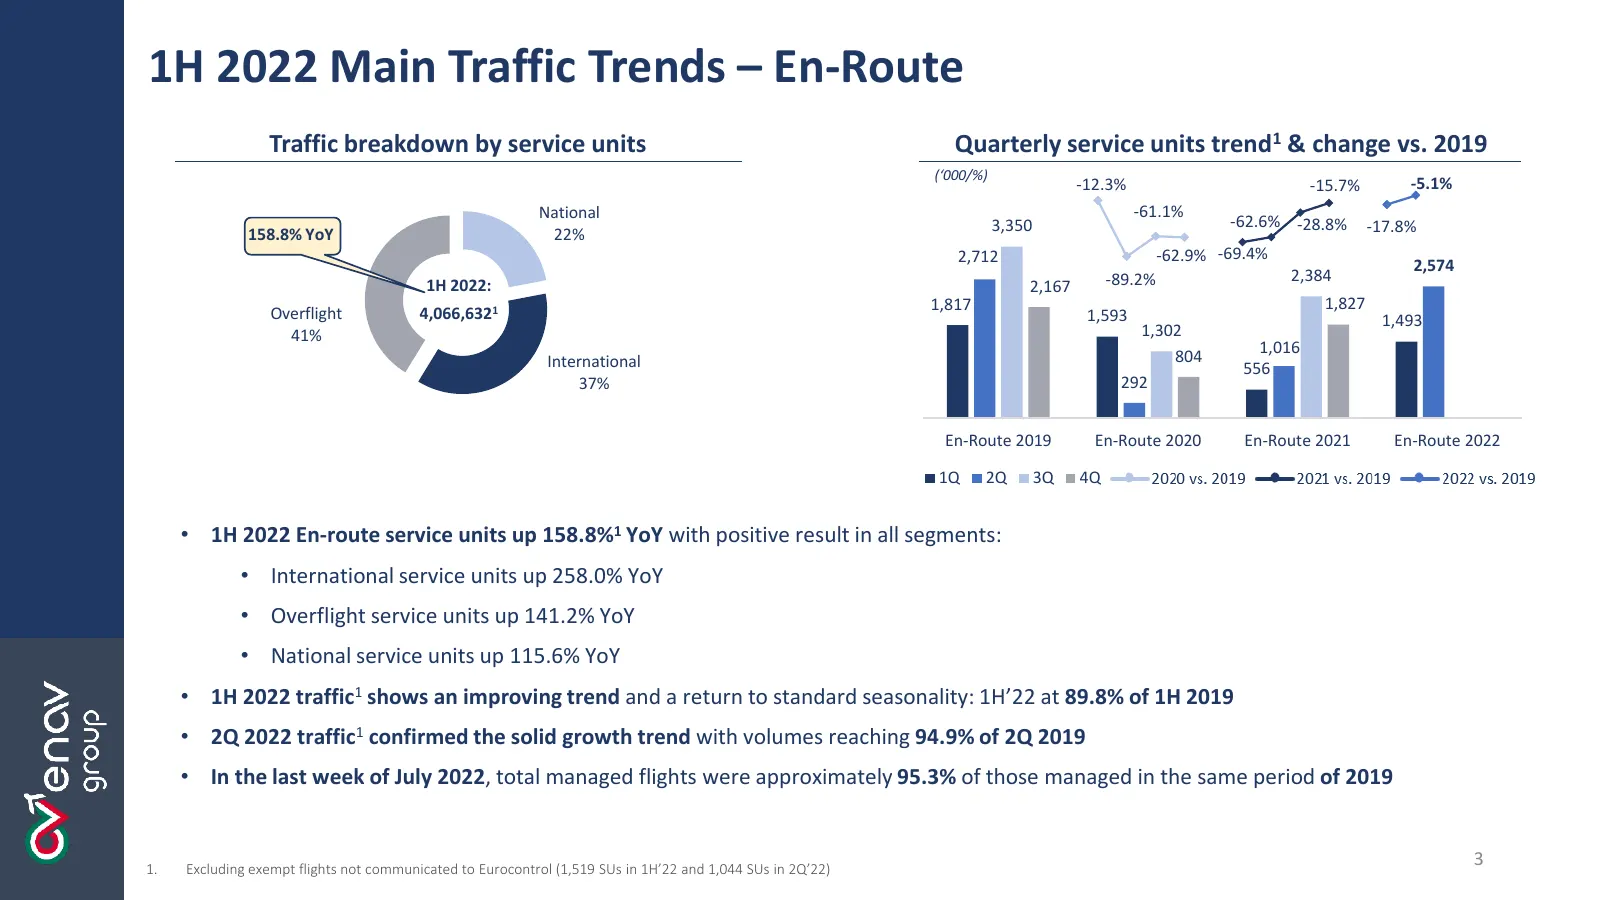
1H 2022 Main Traffic Trends – En-Route Traffic breakdown by service units Quarterly service units trend1 & change vs. 2019 (‘000/%) -12.3% -15.7% -5.1% National -61.1% 3,350 -62.6% -28.8% -17.8% 158.8% YoY 22% 2,712 -62.9% -69.4% 2,574 -89.2% 2,384 1H 2022: 2,167 1,817 1,827 Overflight 4,066,6321 1,
Slide 4: 1H 2022 Main Traffic Trends – Terminal
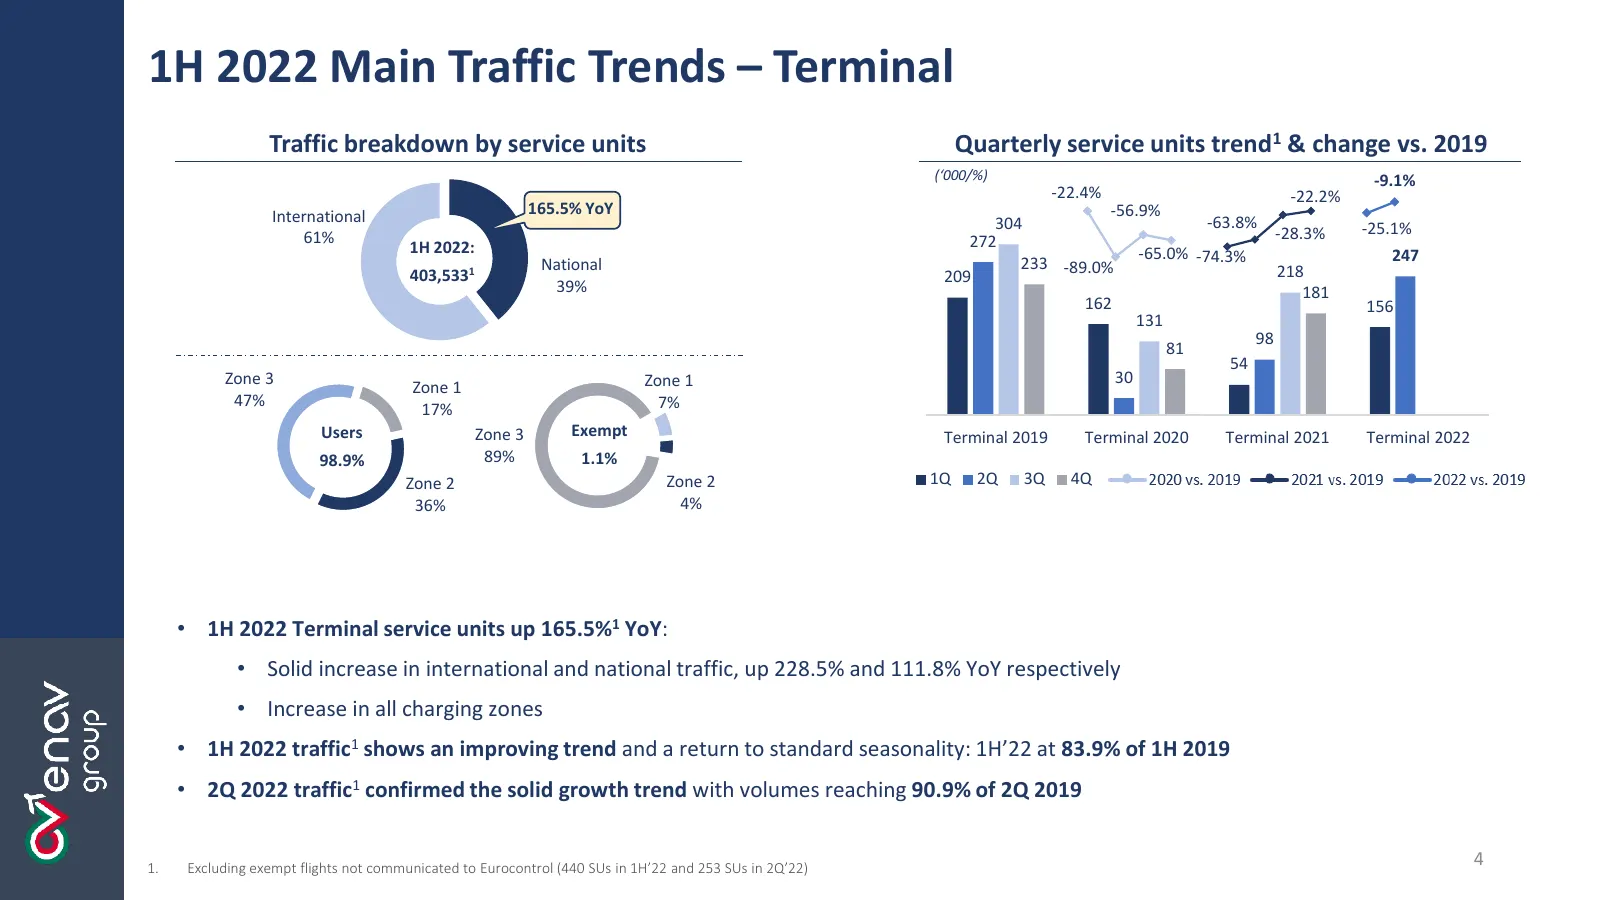
1H 2022 Main Traffic Trends – Terminal Traffic breakdown by service units Quarterly service units trend1 & change vs. 2019 (‘000/%) -9.1% -22.4% -22.2% International 165.5% YoY -56.9% 304 -63.8% -25.1% 61% 272 -28.3% 1H 2022: -65.0% -74.3% 247 National 233 -89.0% 218 403,5331 209 39% 181 162 156 131

Slide 5: 1H 2022 Financials Overview
C'enav group 1H 2022 Financials Overview
Slide 6: Total Revenue Performance
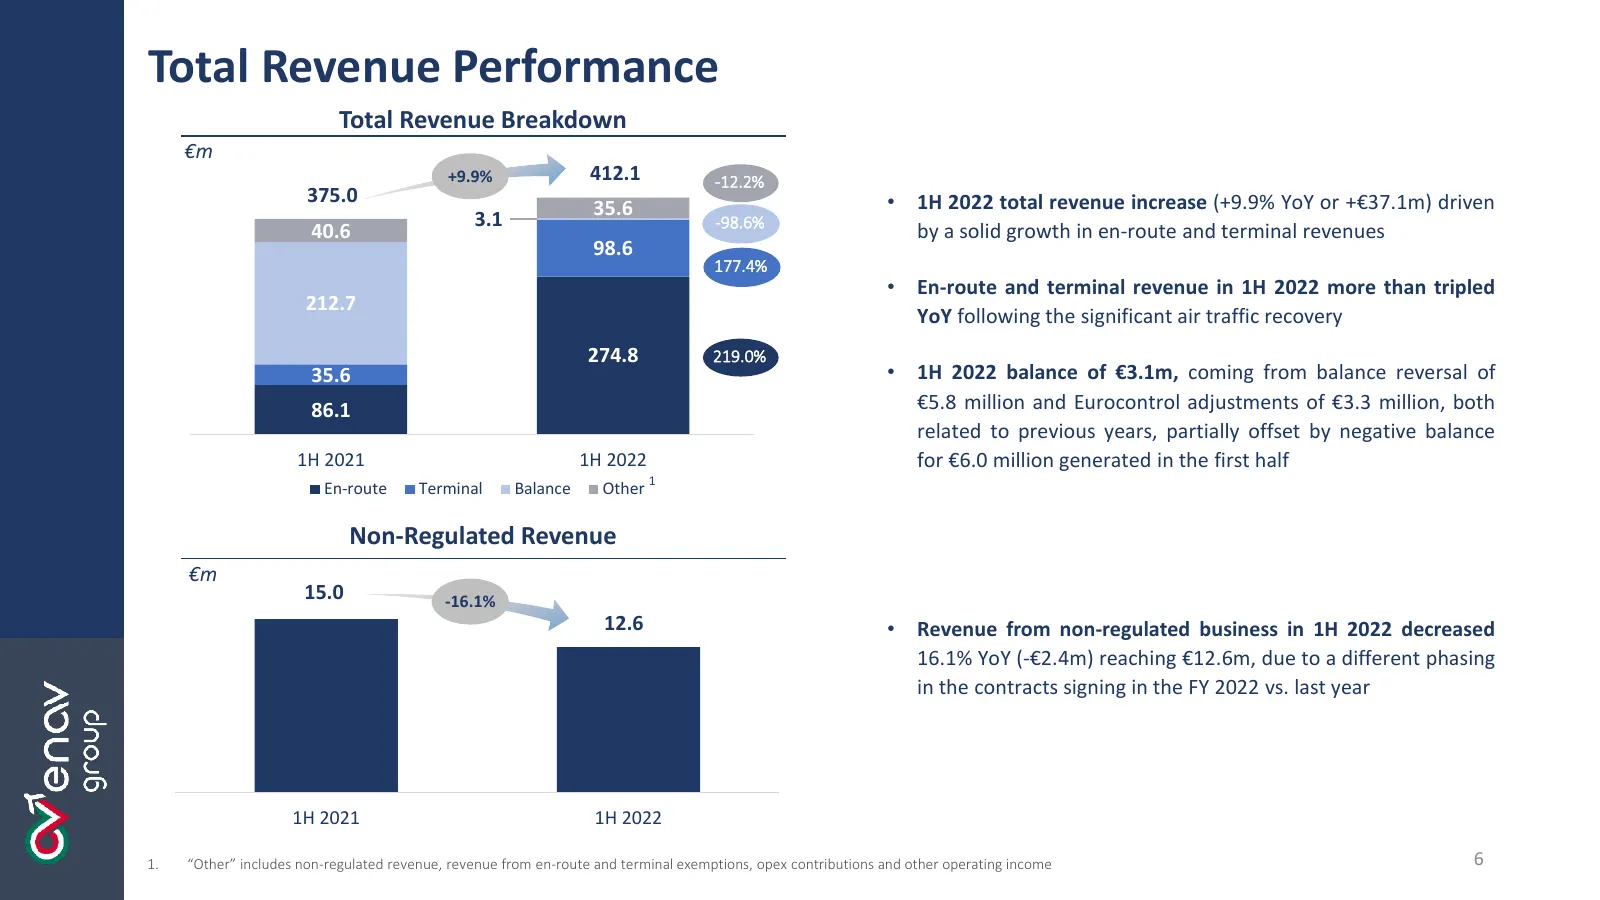
Total Revenue Performance Total Revenue Breakdown €m +9.9% 412.1 -12.2% 375.0 • 1H 2022 total revenue increase (+9.9% YoY or +€37.1m) driven 35.6 3.1 -98.6% 40.6 by a solid growth in en-route and terminal revenues 98.6 177.4% • En-route and terminal revenue in 1H 2022 more than tripled 212.7 YoY fol
Slide 7: Cost Evolution
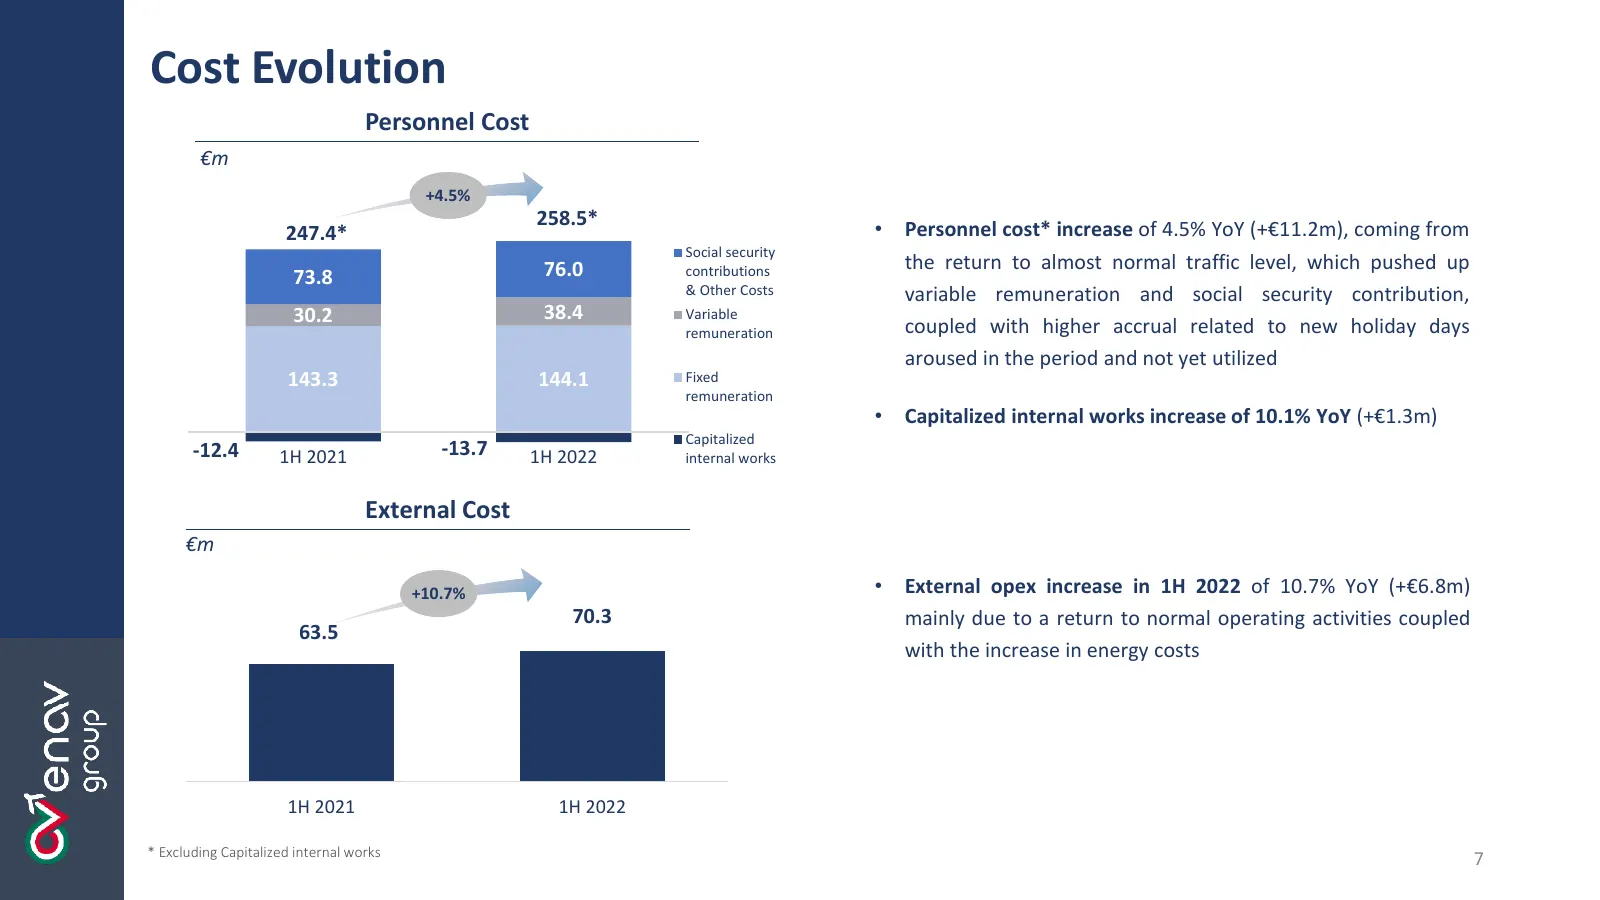
Cost Evolution Personnel Cost €m +4.5% 258.5* 247.4* • Personnel cost* increase of 4.5% YoY (+€11.2m), coming from Social security 76.0 contributions the return to almost normal traffic level, which pushed up 73.8 & Other Costs variable remuneration and social security contribution, 30.2 38.4 Variab
Slide 8: Total Revenue and EBITDA Development
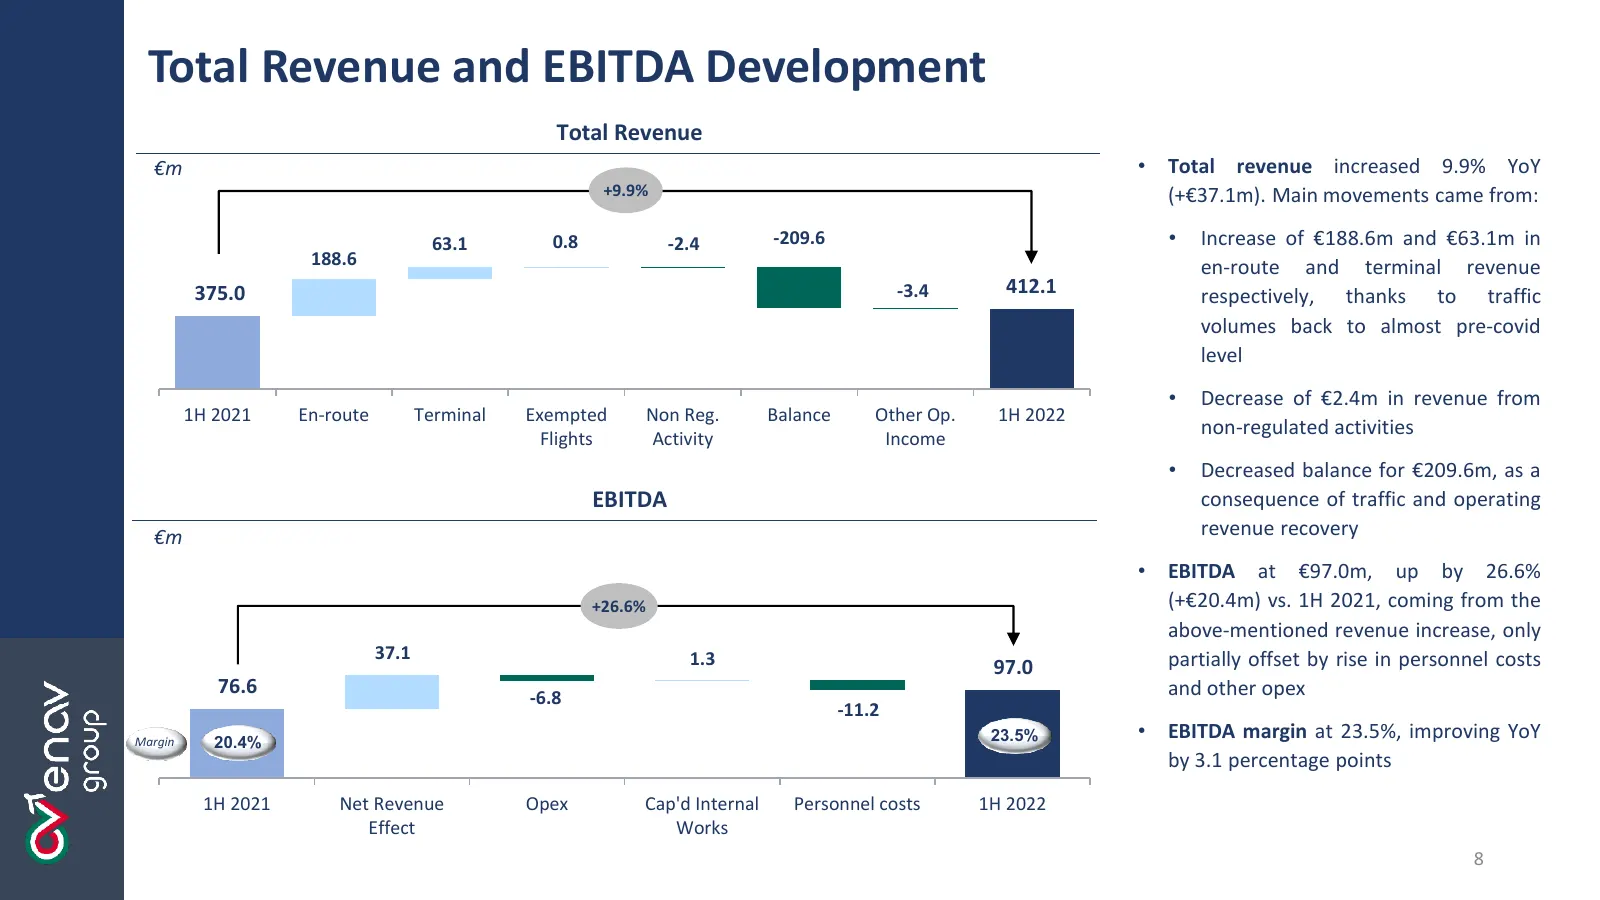
Total Revenue and EBITDA Development Total Revenue €m • Total revenue increased 9.9% YoY 16 +9.9% (+€37.1m). Main movements came from: 63.1 0.8 -2.4 -209.6 • Increase of €188.6m and €63.1m in 188.6 en-route and terminal revenue 375.0 -3.4 412.1 respectively, thanks to traffic volumes back to almost
Slide 9: Consolidated P&L and Main Movements below EBITDA
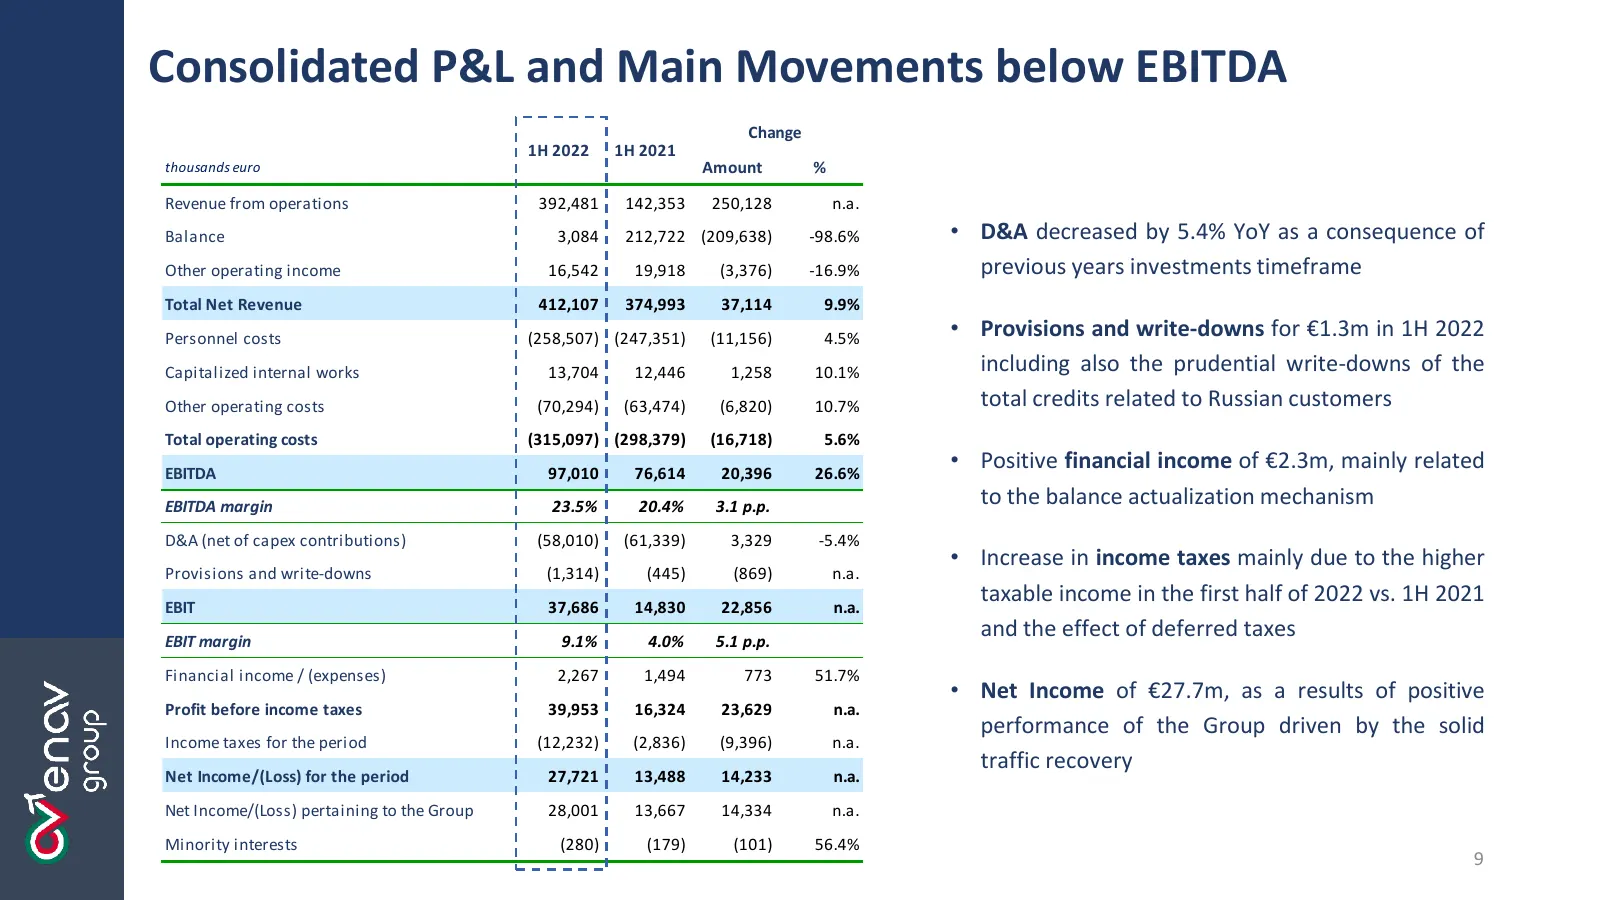
Consolidated P&L and Main Movements below EBITDA Change 1H 2022 1H 2021 thousands euro Amount % Revenue from operations 392,481 142,353 250,128 n.a. Balance 3,084 212,722 (209,638) -98.6% • D&A decreased by 5.4% YoY as a consequence of Other operating income 16,542 19,918 (3,376) -16.9% previous yea
Slide 10: Cash Flow and Capitalization
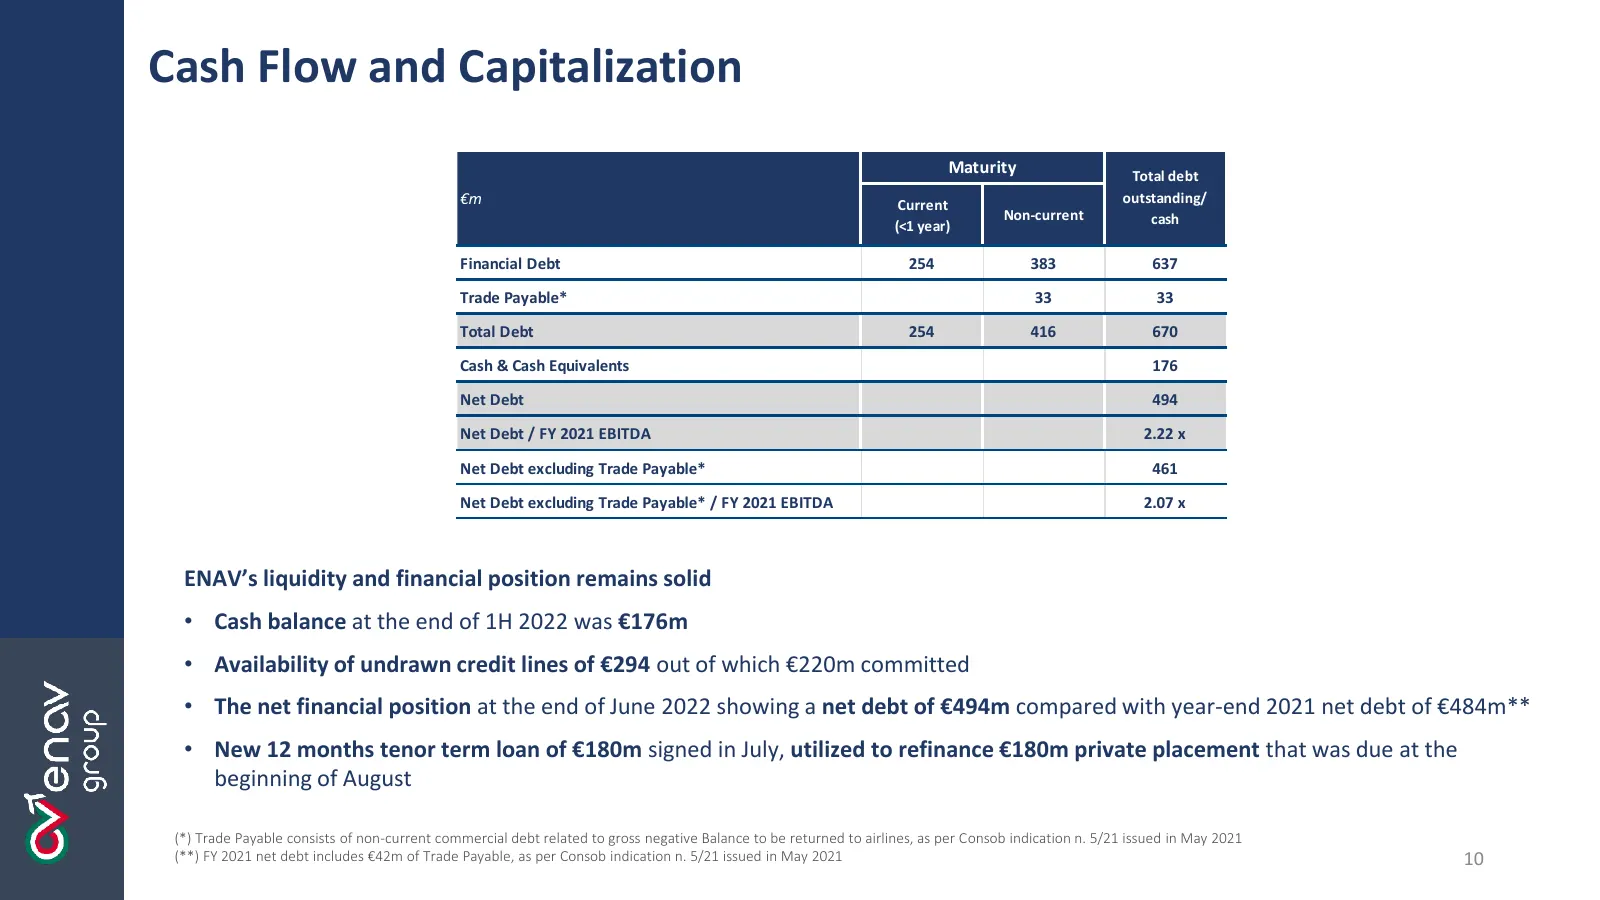
Cash Flow and Capitalization Maturity Total debt €m Current outstanding/ Non-current cash (<1 year) Financial Debt 254 383 637 Trade Payable* 33 33 Total Debt 254 416 670 Cash & Cash Equivalents 176 Net Debt 494 Net Debt / FY 2021 EBITDA 2.22 x Net Debt excluding Trade Payable* 461 Net Debt excludin
Slide 11: Thank You
THANK YOU Q&A SESSION e n a v. i t
Slide 12: Disclaimer
Disclaimer This presentation contains certain forward-looking statements that reflect the Company’s management current views with respect to future events and the financial and operational performance of the Company and its subsidiaries. These forward-looking statements are based on ENAV S.p.A.’s cu
Source: Internet Archive copy of cdn-web.enav.it
More decks from ENAV S.p.A.
 H1 2026 Earnings Presentation13 slides · Aug 3, 2026
 Investor Presentation (August 2026)48 slides · August 2026
 Q1 2026 Earnings Presentation11 slides · May 12, 2026
 Q1 2026 Earnings Presentation48 slides · May 2026
 Investor Presentation (April 2026)54 slides · April 2026
 FY2025 Earnings Presentation17 slides · Mar 23, 2026