Exide Industries Limited · NSE:EXIDEIND
Exide Industries — Investor Presentation (May 2011)
21 slides from Exide Industries's investor presentation, May 31, 2011
Slide 1: Exide Industries: A Compelling Value And Growth Story
Exide Industries A Compelling Value And Growth Story 31 May 2011 1 1
Slide 2: Introduction
Introduction 2 2
Slide 3: Exide Industries - An Introduction
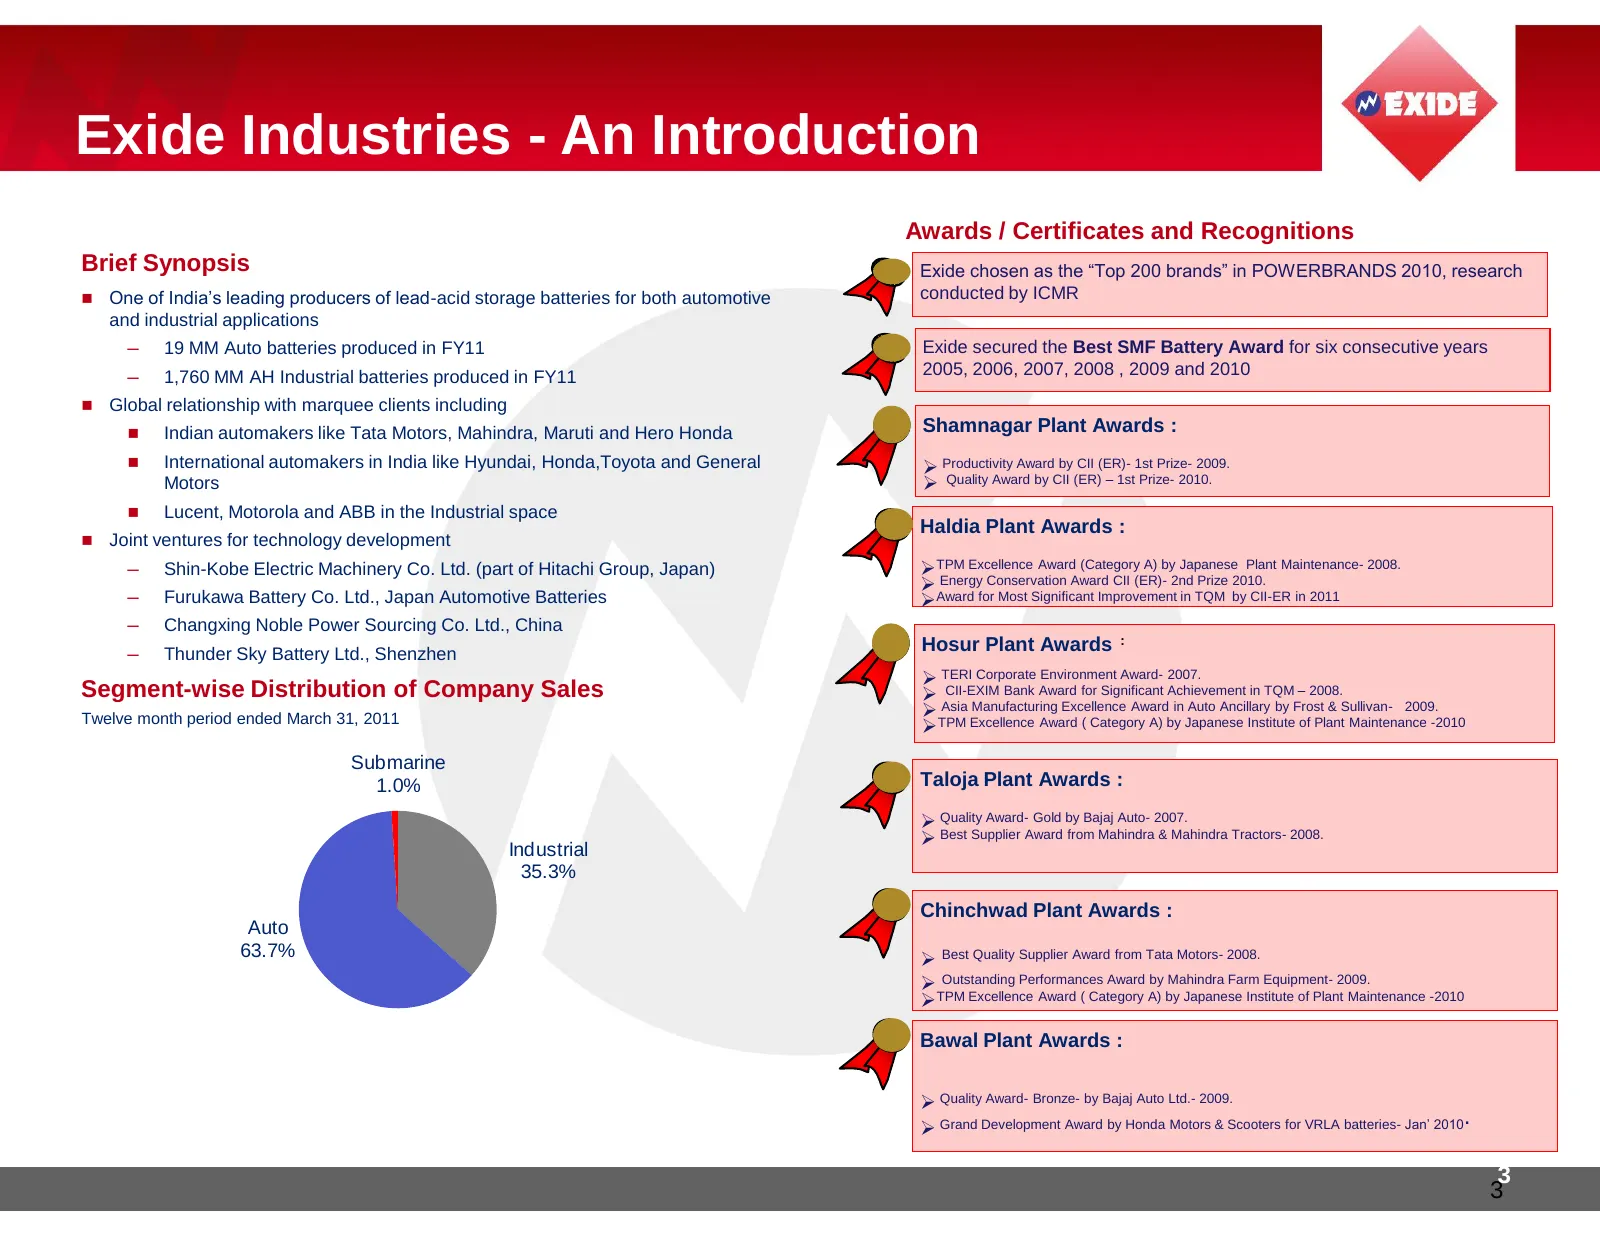
Exide Industries - An Introduction Awards / Certificates and Recognitions Brief Synopsis Exide chosen as the “Top 200 brands” in POWERBRANDS 2010, research One of India‟s leading producers of lead-acid storage batteries for both automotive conducted by ICMR and industrial applications ─ 19 MM Auto
Slide 4: Exide Industries – An Introduction (cont’d)
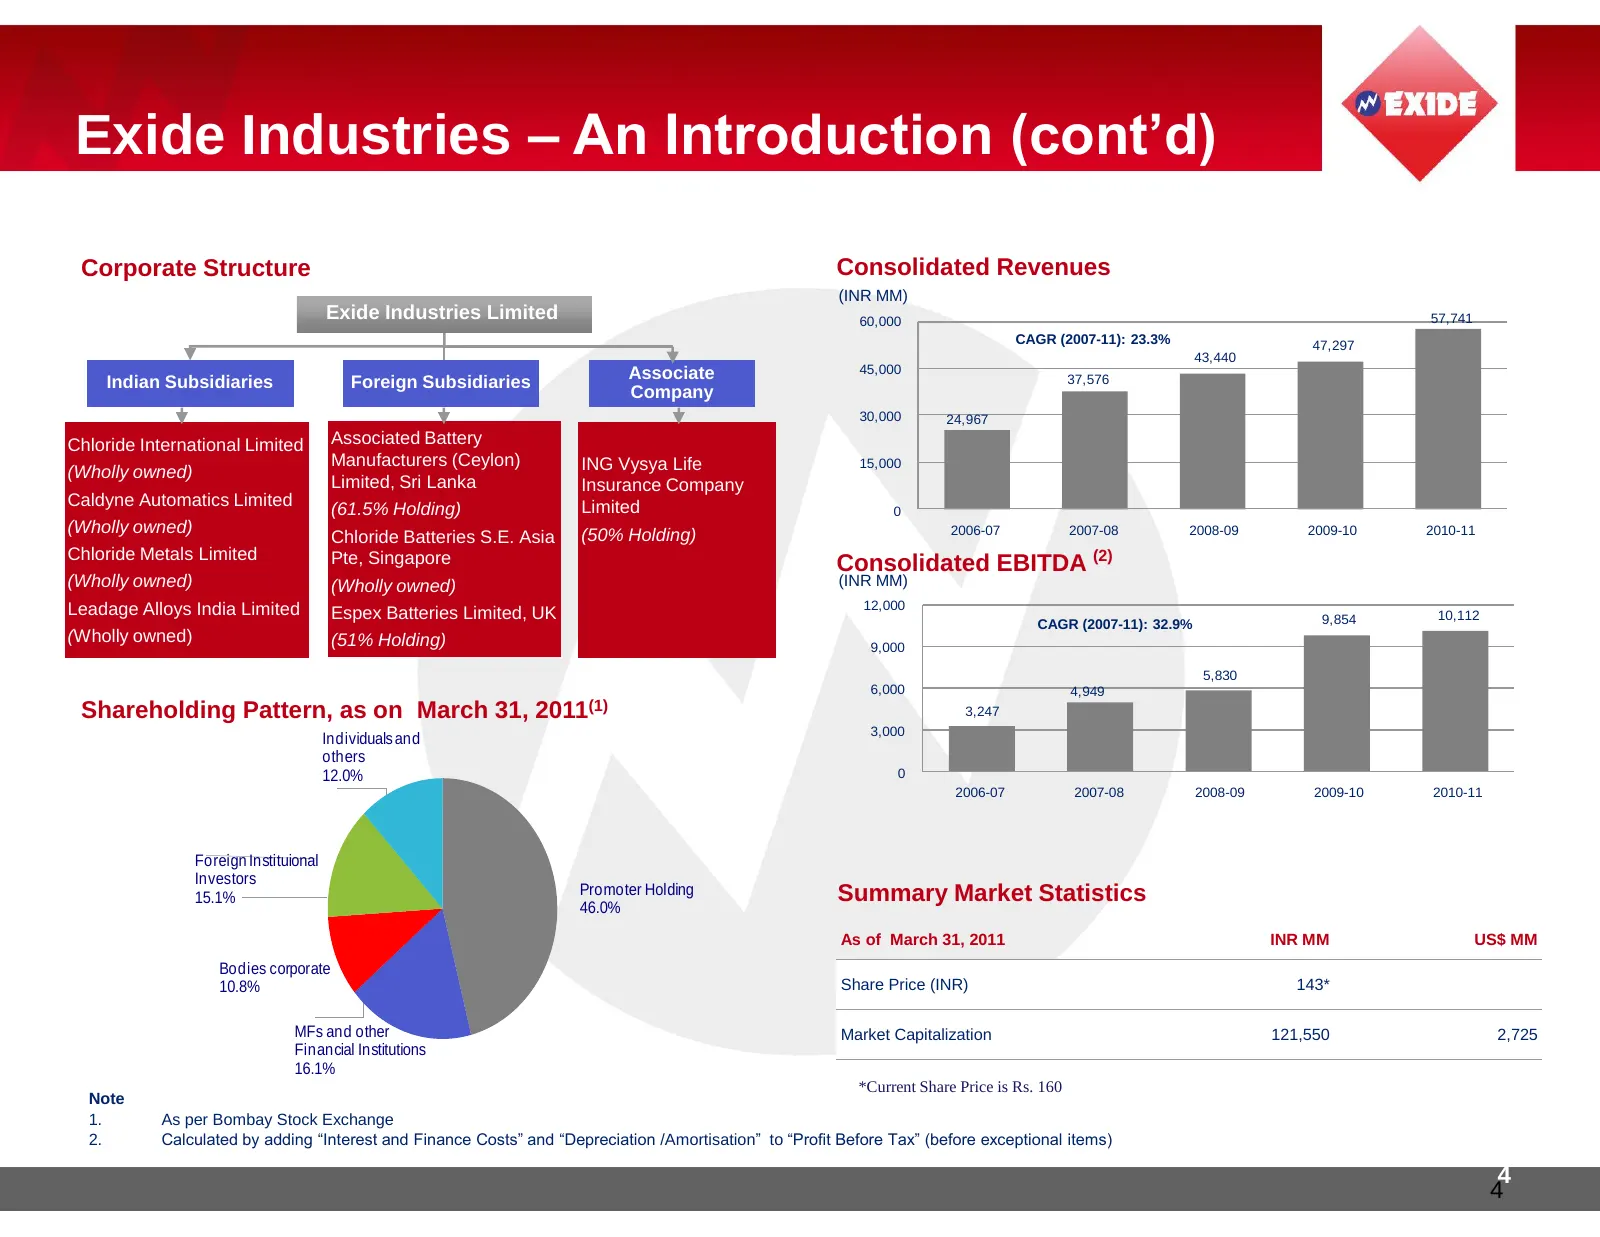
Exide Industries – An Introduction (cont’d) Corporate Structure Consolidated Revenues (INR MM) Exide Industries Limited 60,000 57,741 CAGR (2007-11): 23.3% 47,297 43,440 Associate 45,000 Indian Subsidiaries Foreign Subsidiaries 37,576 Company 30,000 24,967 Chloride International Limited Associated B
Slide 5: Growth through Organic, JVs and Strategic Acquisitions
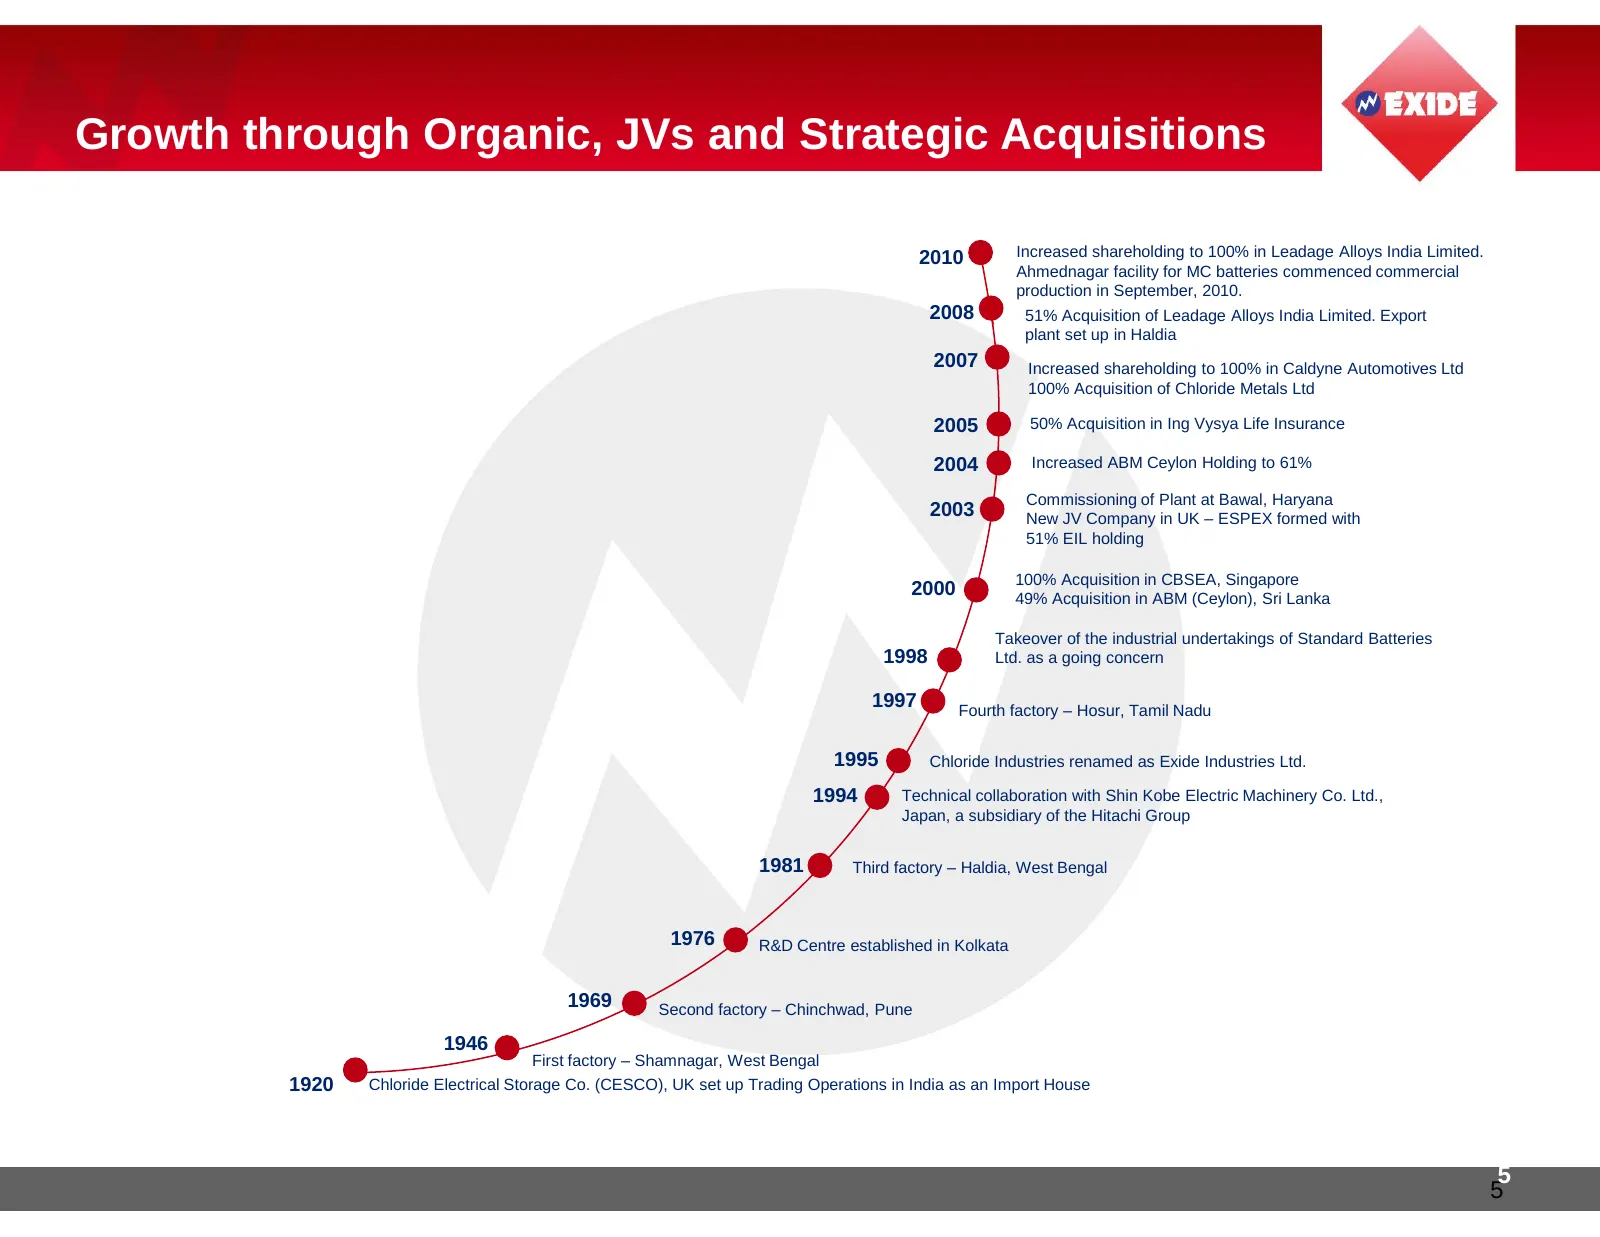
Growth through Organic, JVs and Strategic Acquisitions 2010 Increased shareholding to 100% in Leadage Alloys India Limited. Ahmednagar facility for MC batteries commenced commercial production in September, 2010. 2008 51% Acquisition of Leadage Alloys India Limited. Export plant set up in Haldia 200
Slide 6: Exide Industries: Strong Value and Growth History
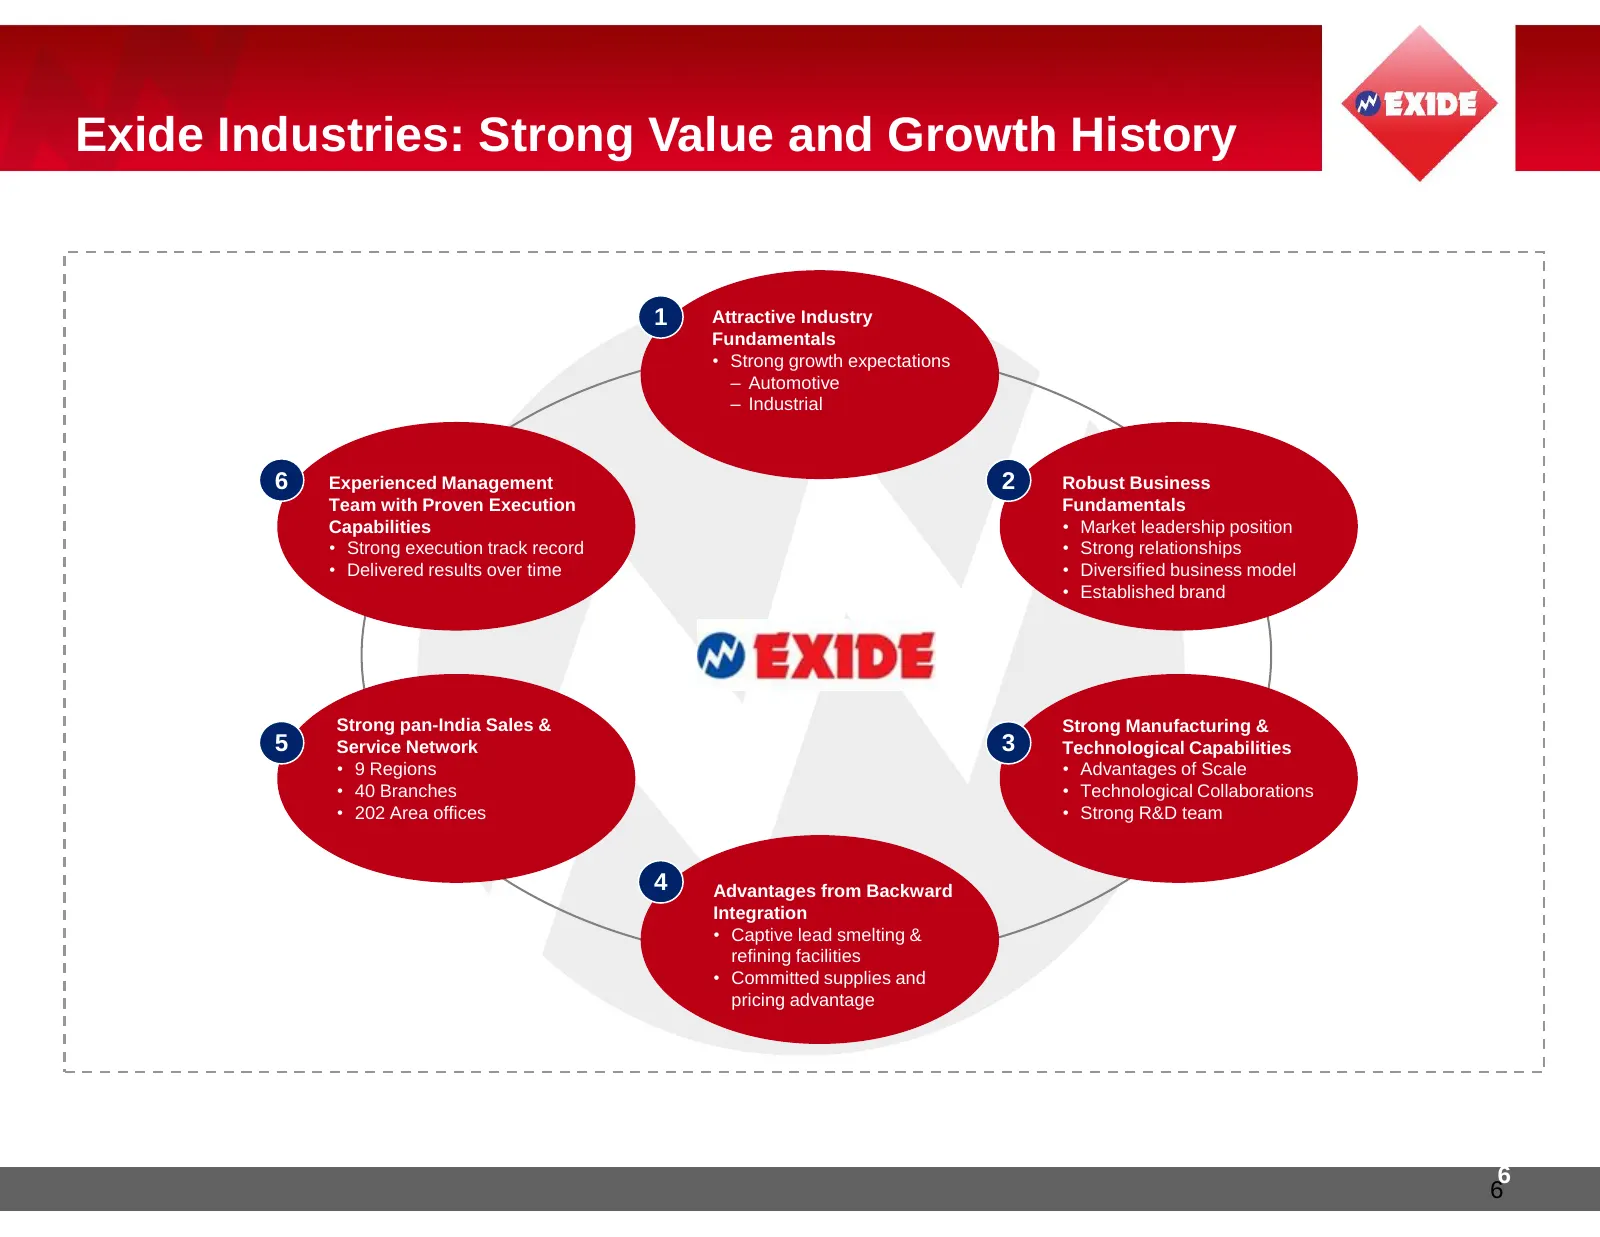
Exide Industries: Strong Value and Growth History 1 Attractive Industry Fundamentals • Strong growth expectations – Automotive – Industrial 6 Experienced Management 2 Robust Business Team with Proven Execution Fundamentals Capabilities • Market leadership position • Strong execution track record • S
Slide 7: Industry Structure
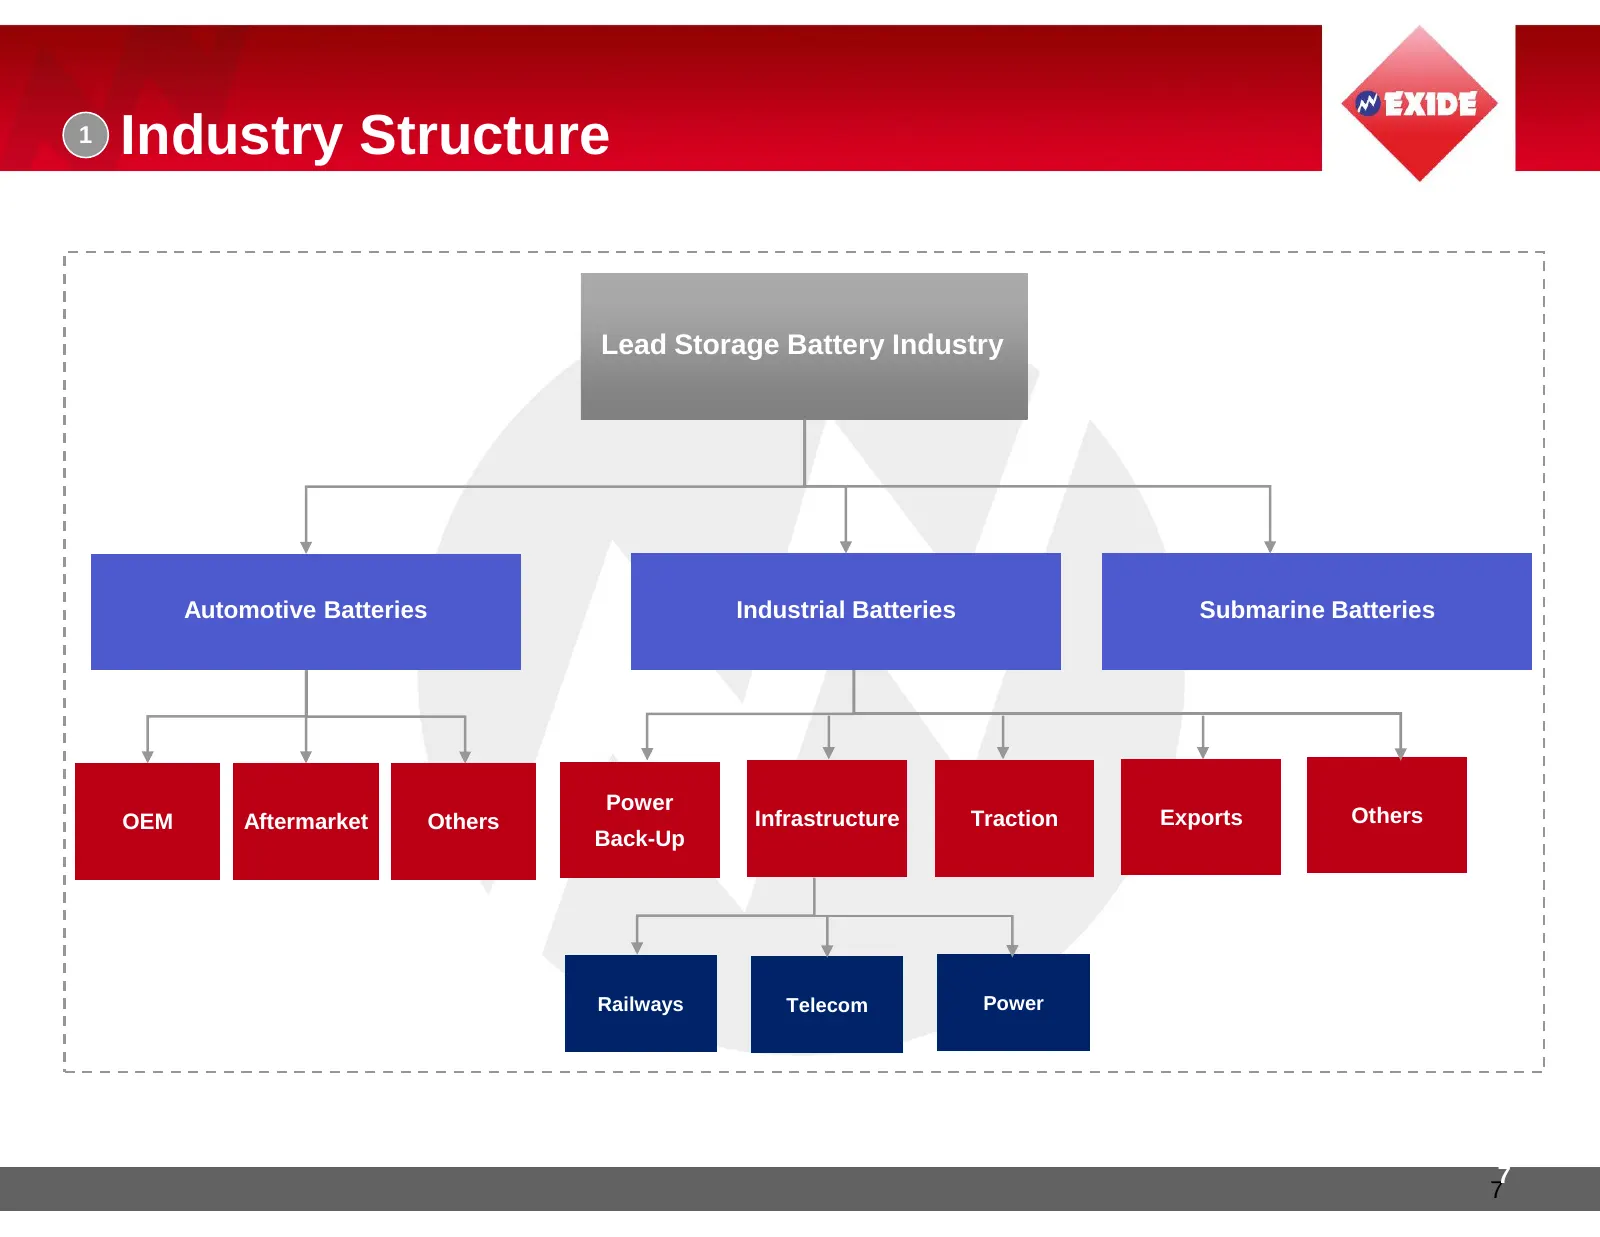
1 Industry Structure Lead Storage Battery Industry Automotive Batteries Industrial Batteries Submarine Batteries Power OEM Aftermarket Others Infrastructure Traction Exports Others Back-Up Railways Telecom Power 7 7
Slide 8: Attractive Macro Fundamentals
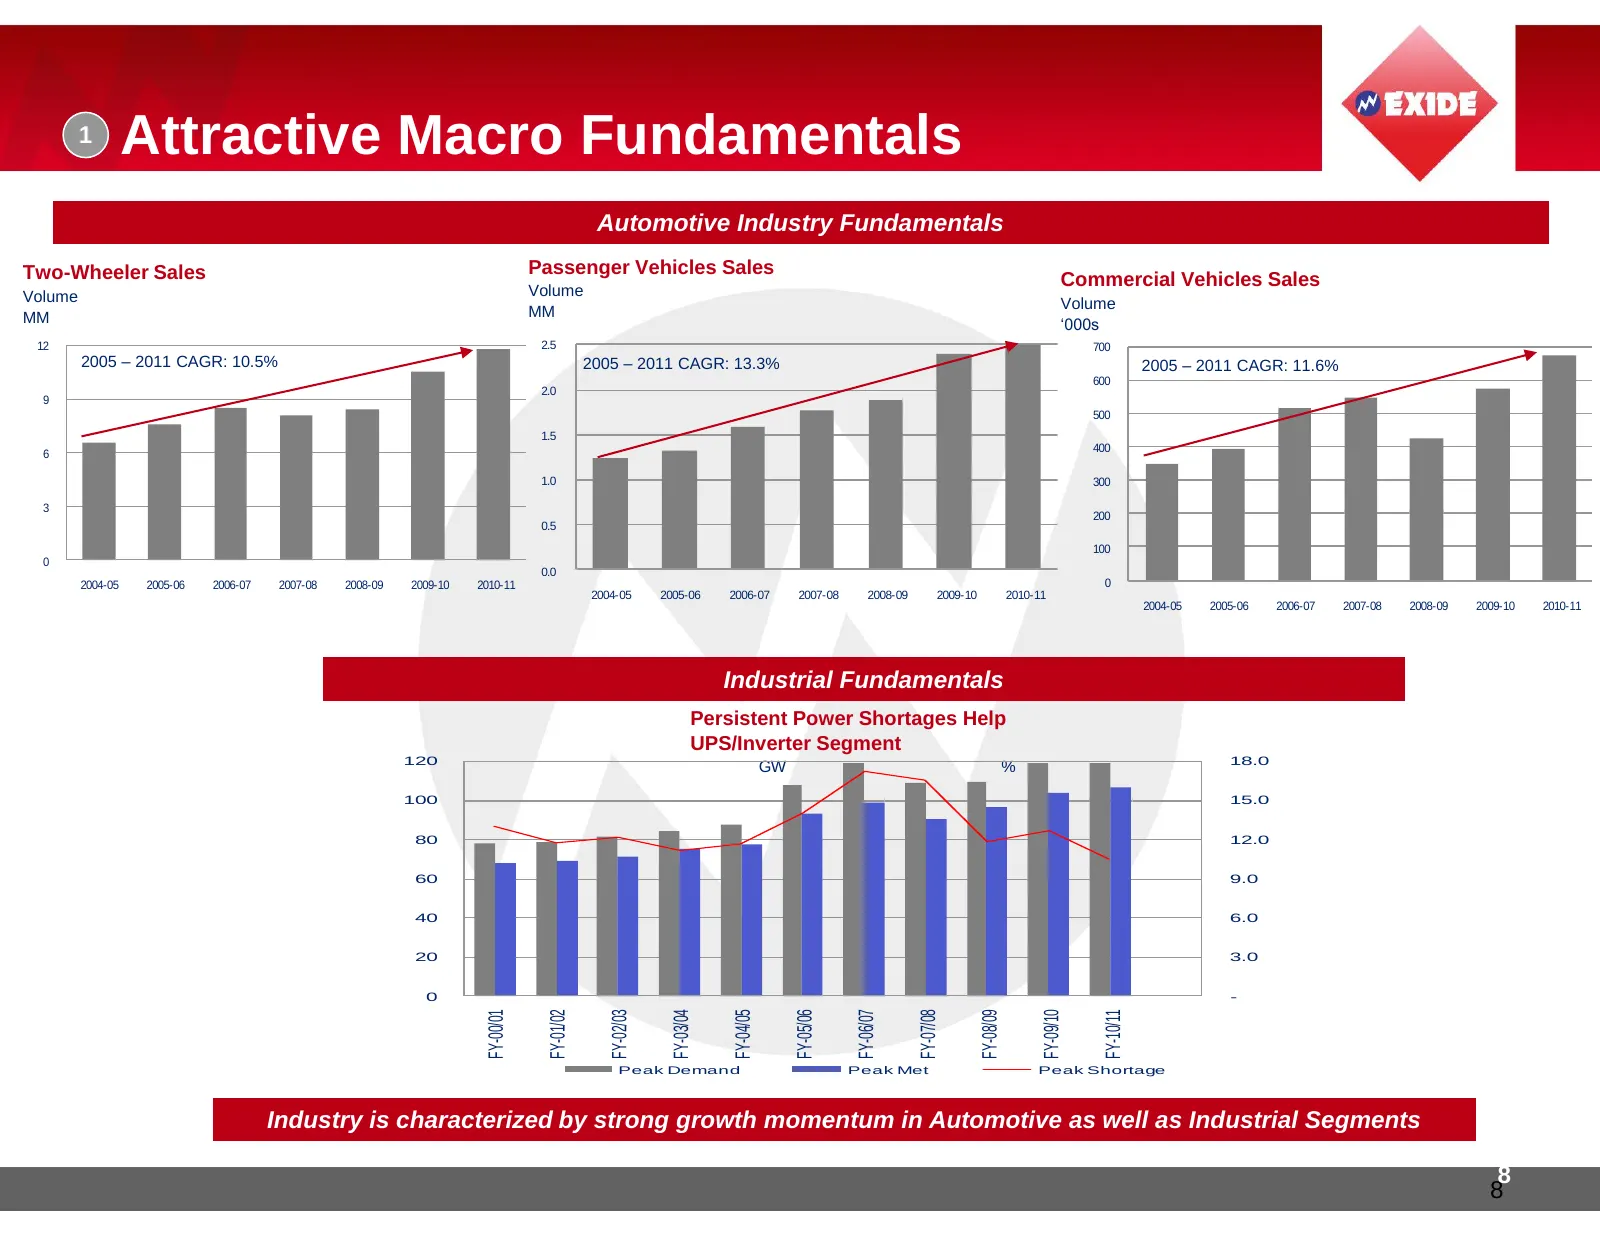
1 Attractive Macro Fundamentals Automotive Industry Fundamentals Two-Wheeler Sales Passenger Vehicles Sales Volume Commercial Vehicles Sales Volume Volume MM MM „000s 12 2.5 700 2005 – 2011 CAGR: 10.5% 2005 – 2011 CAGR: 13.3% 2005 – 2011 CAGR: 11.6% 600 2.0 9 500 1.5 6 400 1.0 300 3 200 0.5 100 0 0.
Slide 9: Robust Business Fundamentals
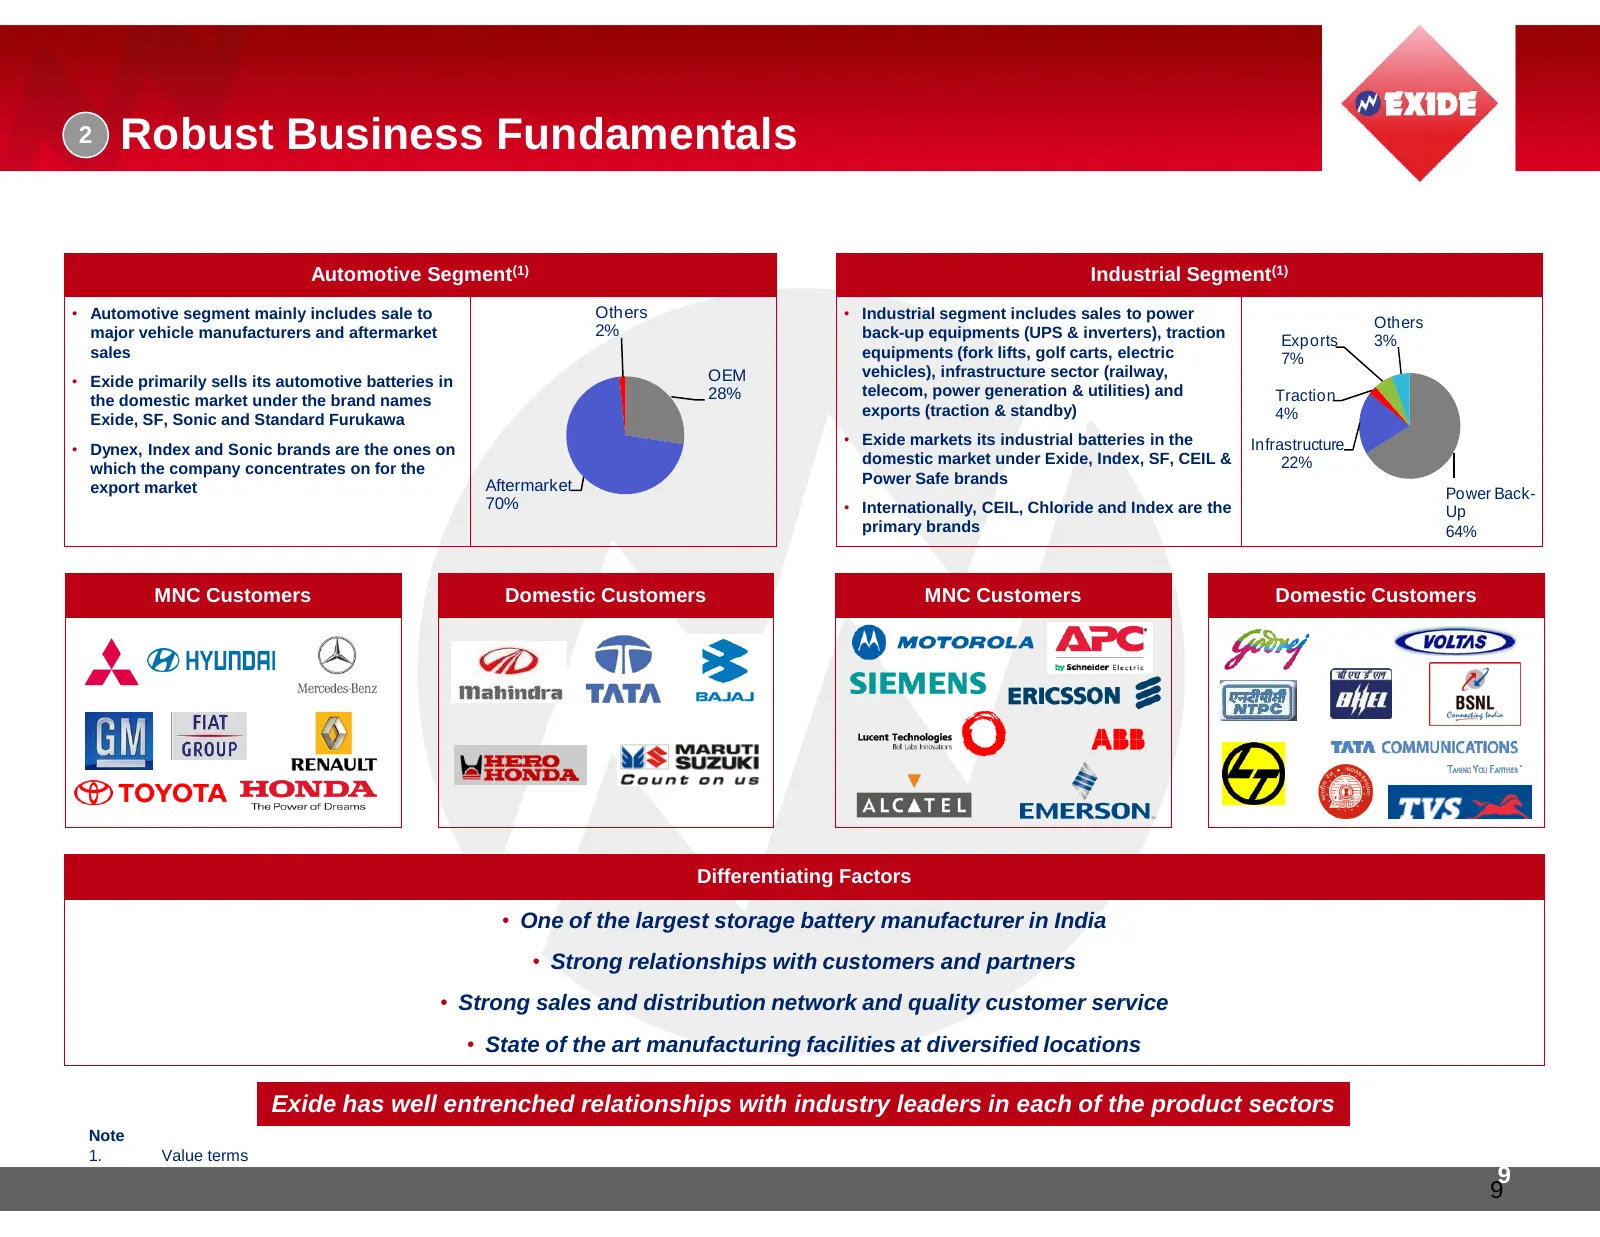
2 Robust Business Fundamentals Automotive Segment(1) Industrial Segment(1) • Automotive segment mainly includes sale to Others • Industrial segment includes sales to power 2% Others major vehicle manufacturers and aftermarket back-up equipments (UPS & inverters), traction Exports 3% sales equipments
Slide 10: Best in Class Manufacturing & Technological Capabilities
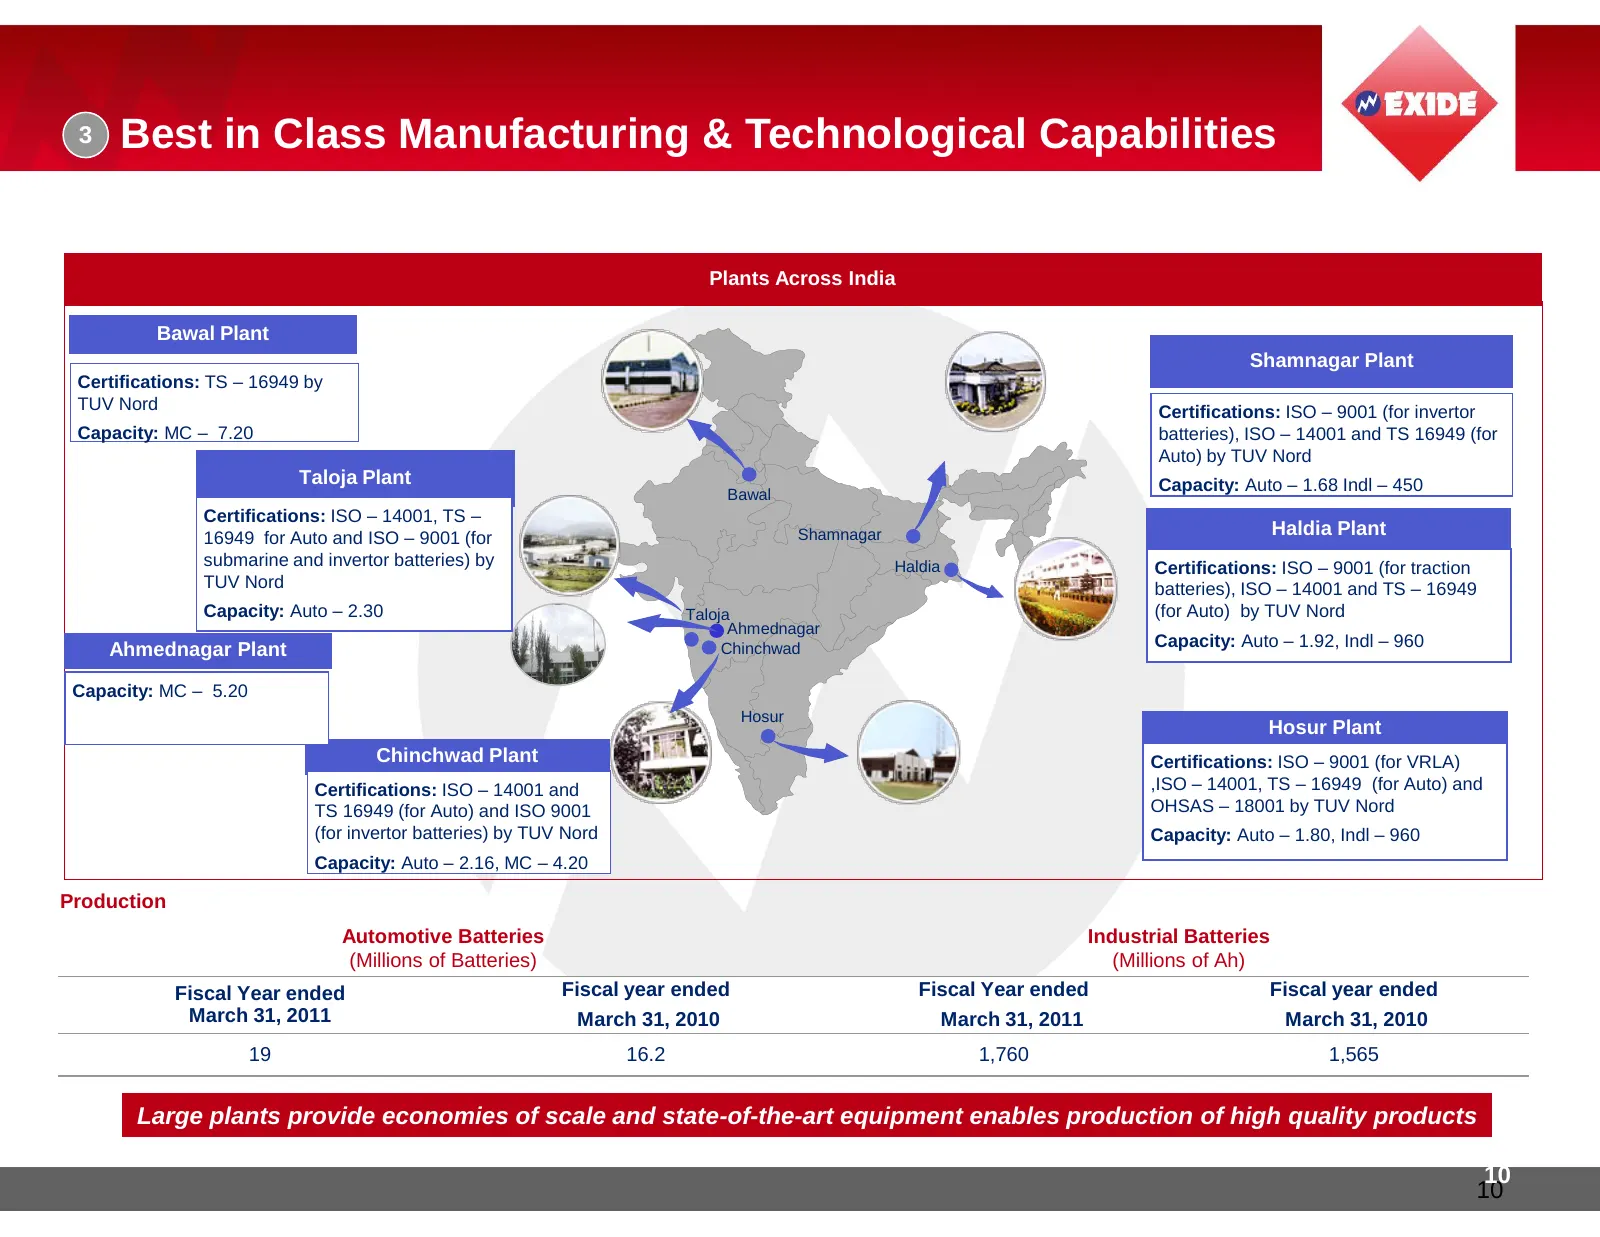
3 Best in Class Manufacturing & Technological Capabilities Plants Across India Bawal Plant Shamnagar Plant Certifications: TS – 16949 by TUV Nord Certifications: ISO – 9001 (for invertor Capacity: MC – 7.20 batteries), ISO – 14001 and TS 16949 (for Auto) by TUV Nord Taloja Plant Capacity: Auto – 1.6
Slide 11: Best in Class Manufacturing & Technological Capabilities (Cont’d)
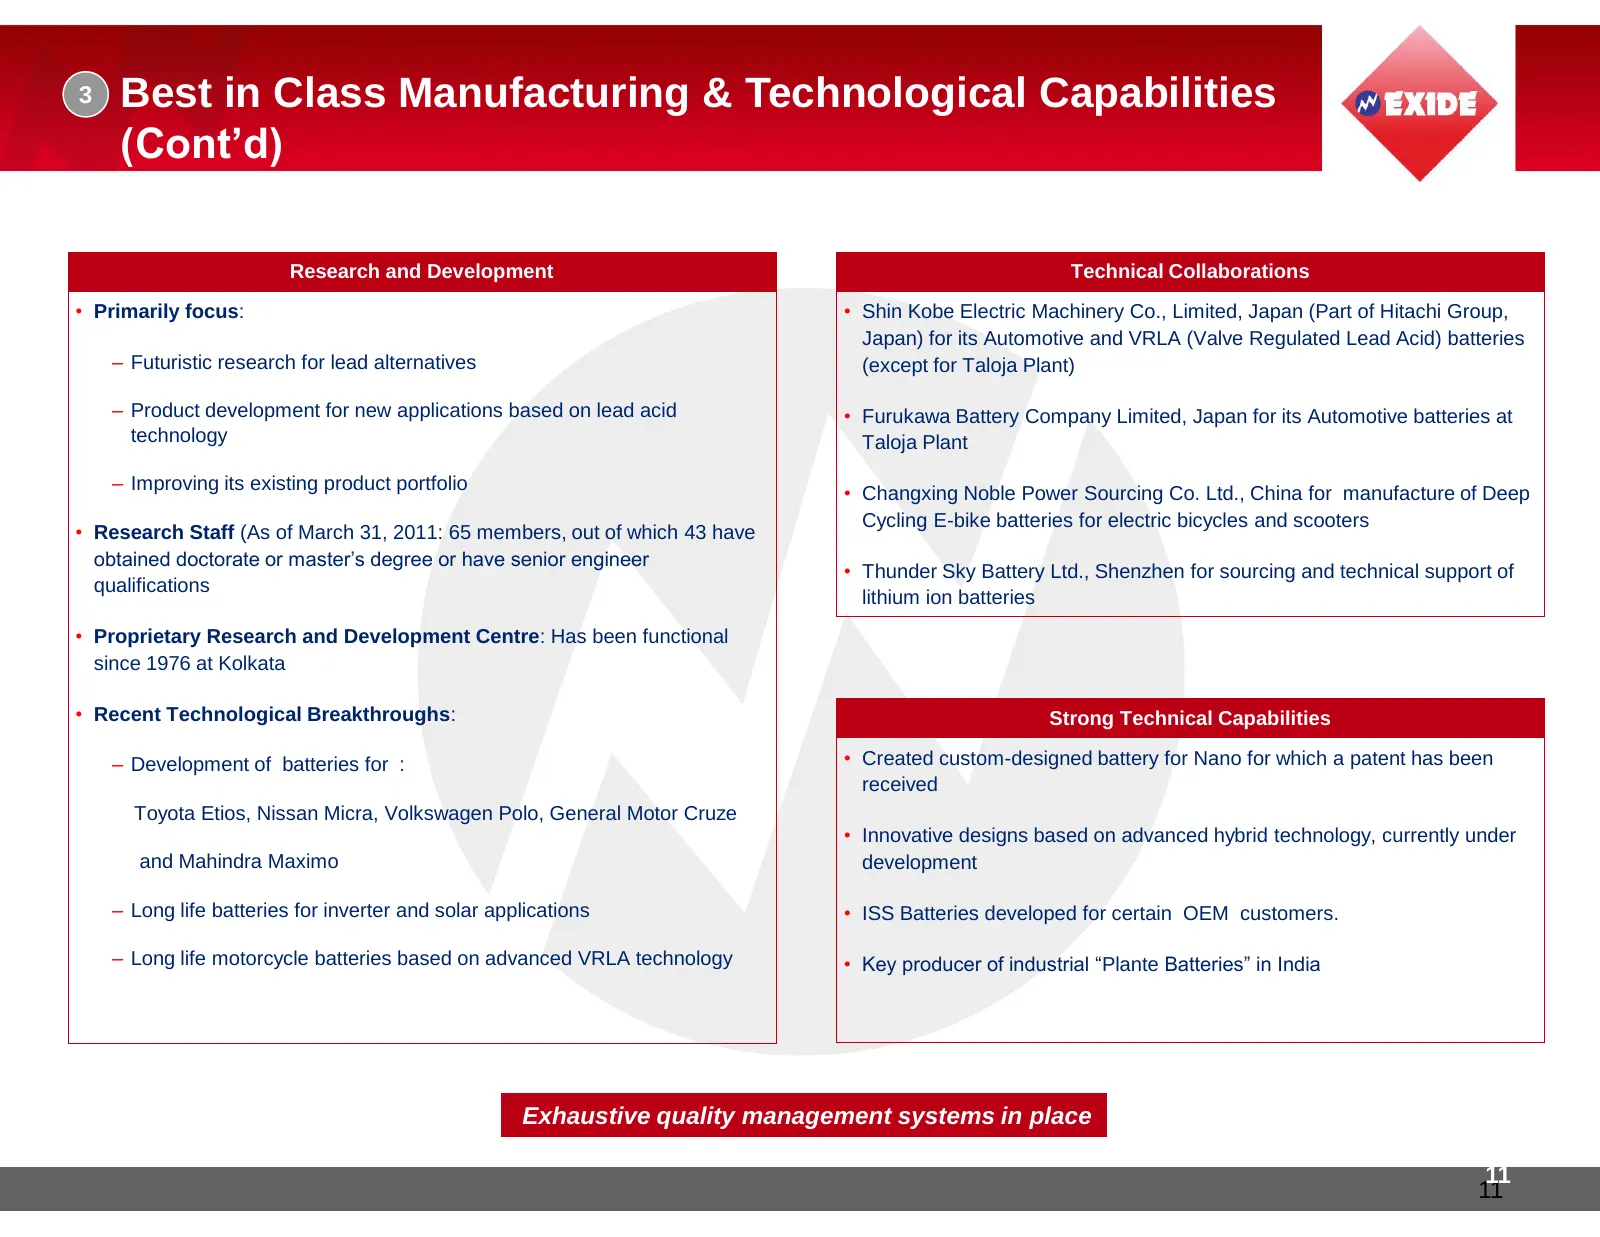
3 Best in Class Manufacturing & Technological Capabilities (Cont’d) Research and Development Technical Collaborations • Primarily focus: • Shin Kobe Electric Machinery Co., Limited, Japan (Part of Hitachi Group, Japan) for its Automotive and VRLA (Valve Regulated Lead Acid) batteries – Futuristic re
Slide 12: Backward Integration Advantages Due To Captive Facilities
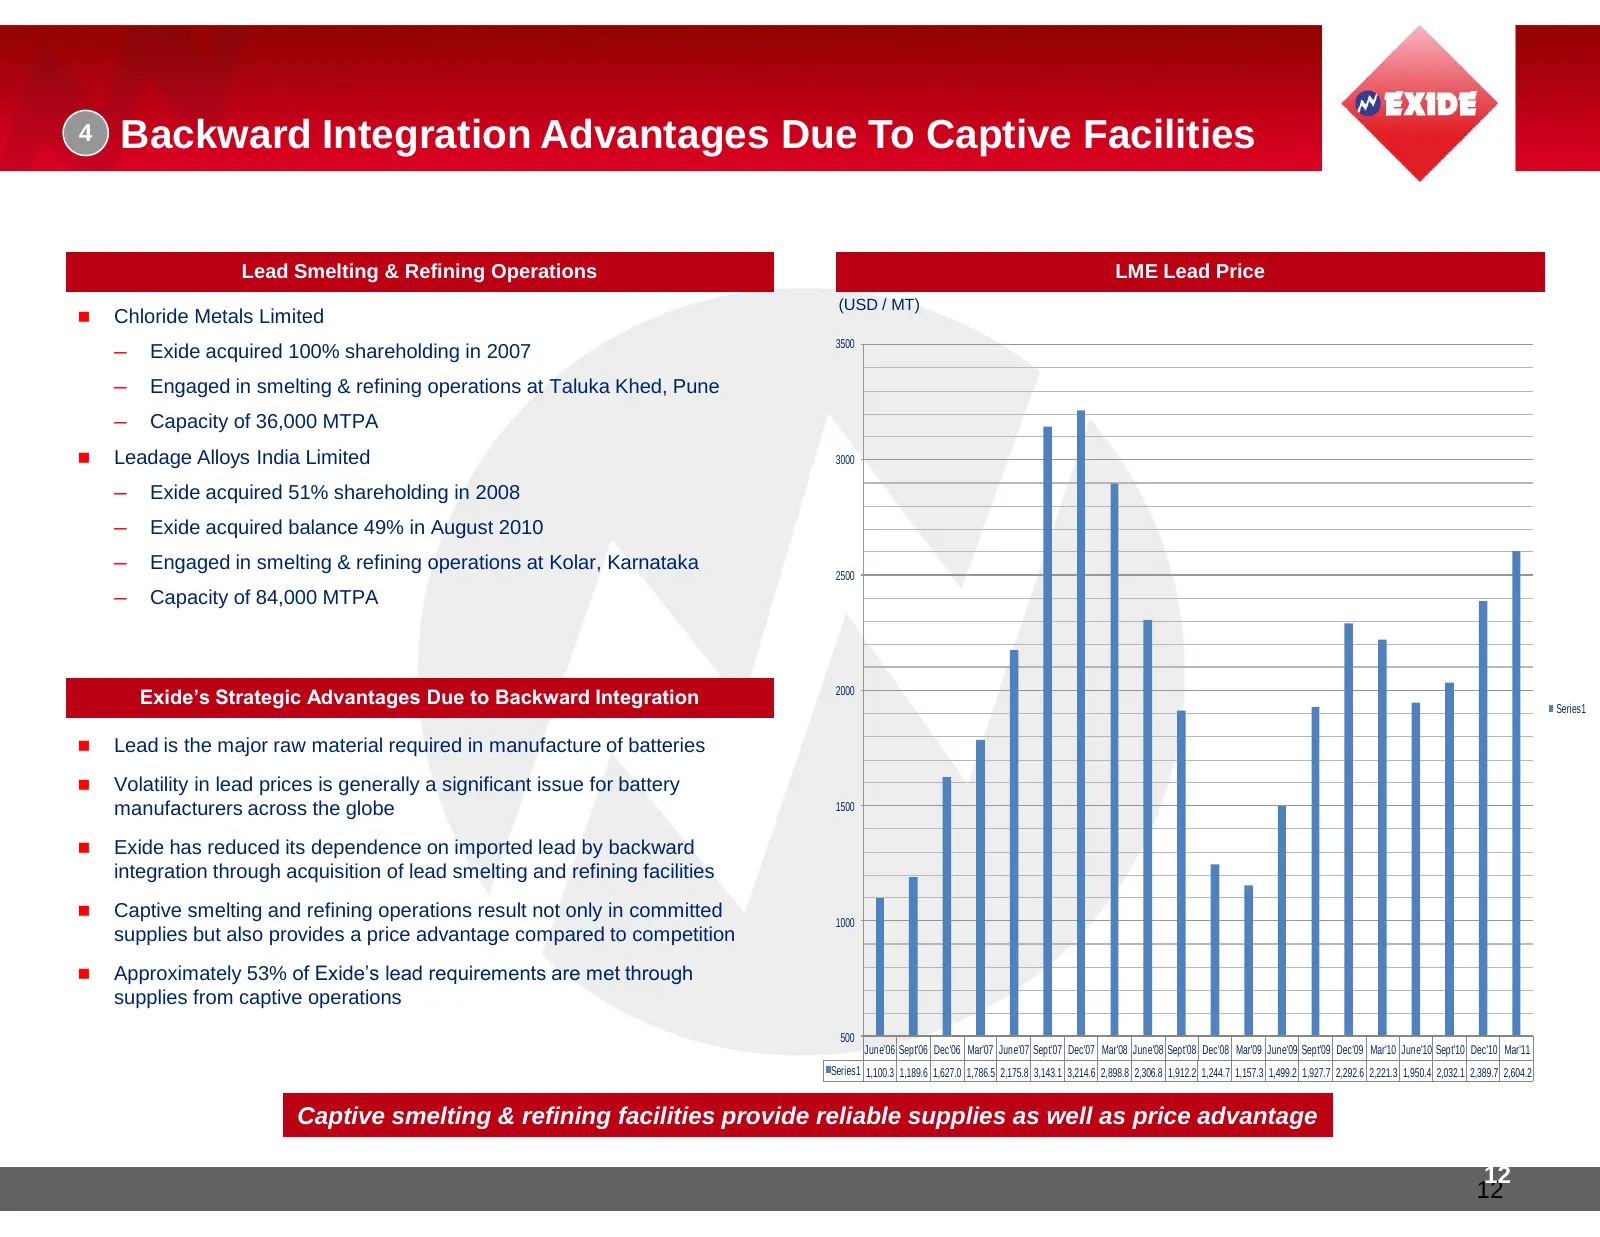
4 Backward Integration Advantages Due To Captive Facilities Lead Smelting & Refining Operations LME Lead Price (USD / MT) Chloride Metals Limited 3500 ─ Exide acquired 100% shareholding in 2007 ─ Engaged in smelting & refining operations at Taluka Khed, Pune ─ Capacity of 36,000 MTPA Leadage All
Slide 13: Strong Indian Footprint with an Expanding Global Footprint
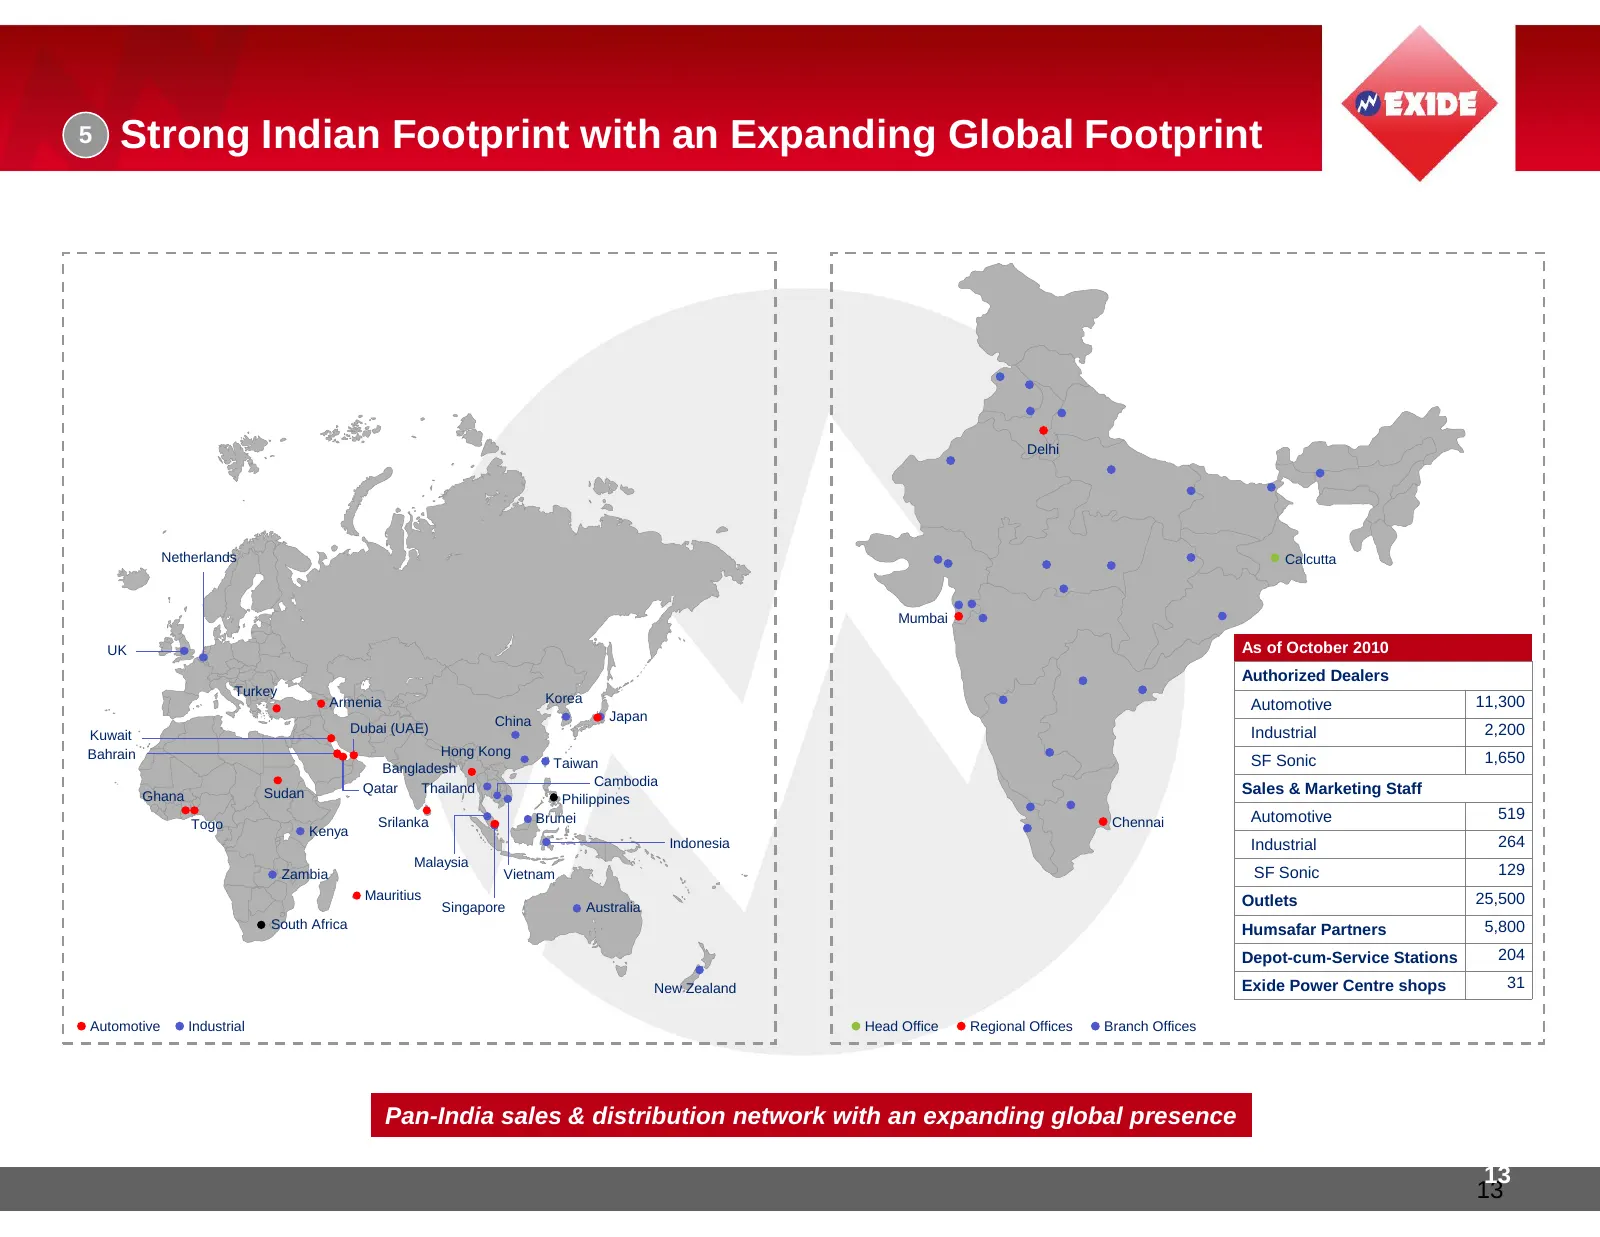
5 Strong Indian Footprint with an Expanding Global Footprint Delhi Netherlands Calcutta Mumbai UK As of October 2010 Authorized Dealers Turkey Armenia Korea Automotive 11,300 China Japan Dubai (UAE) Industrial 2,200 Kuwait Bahrain Hong Kong Taiwan SF Sonic 1,650 Bangladesh Cambodia Ghana Sudan Qatar
Slide 14: Strong and Dedicated Distribution Network
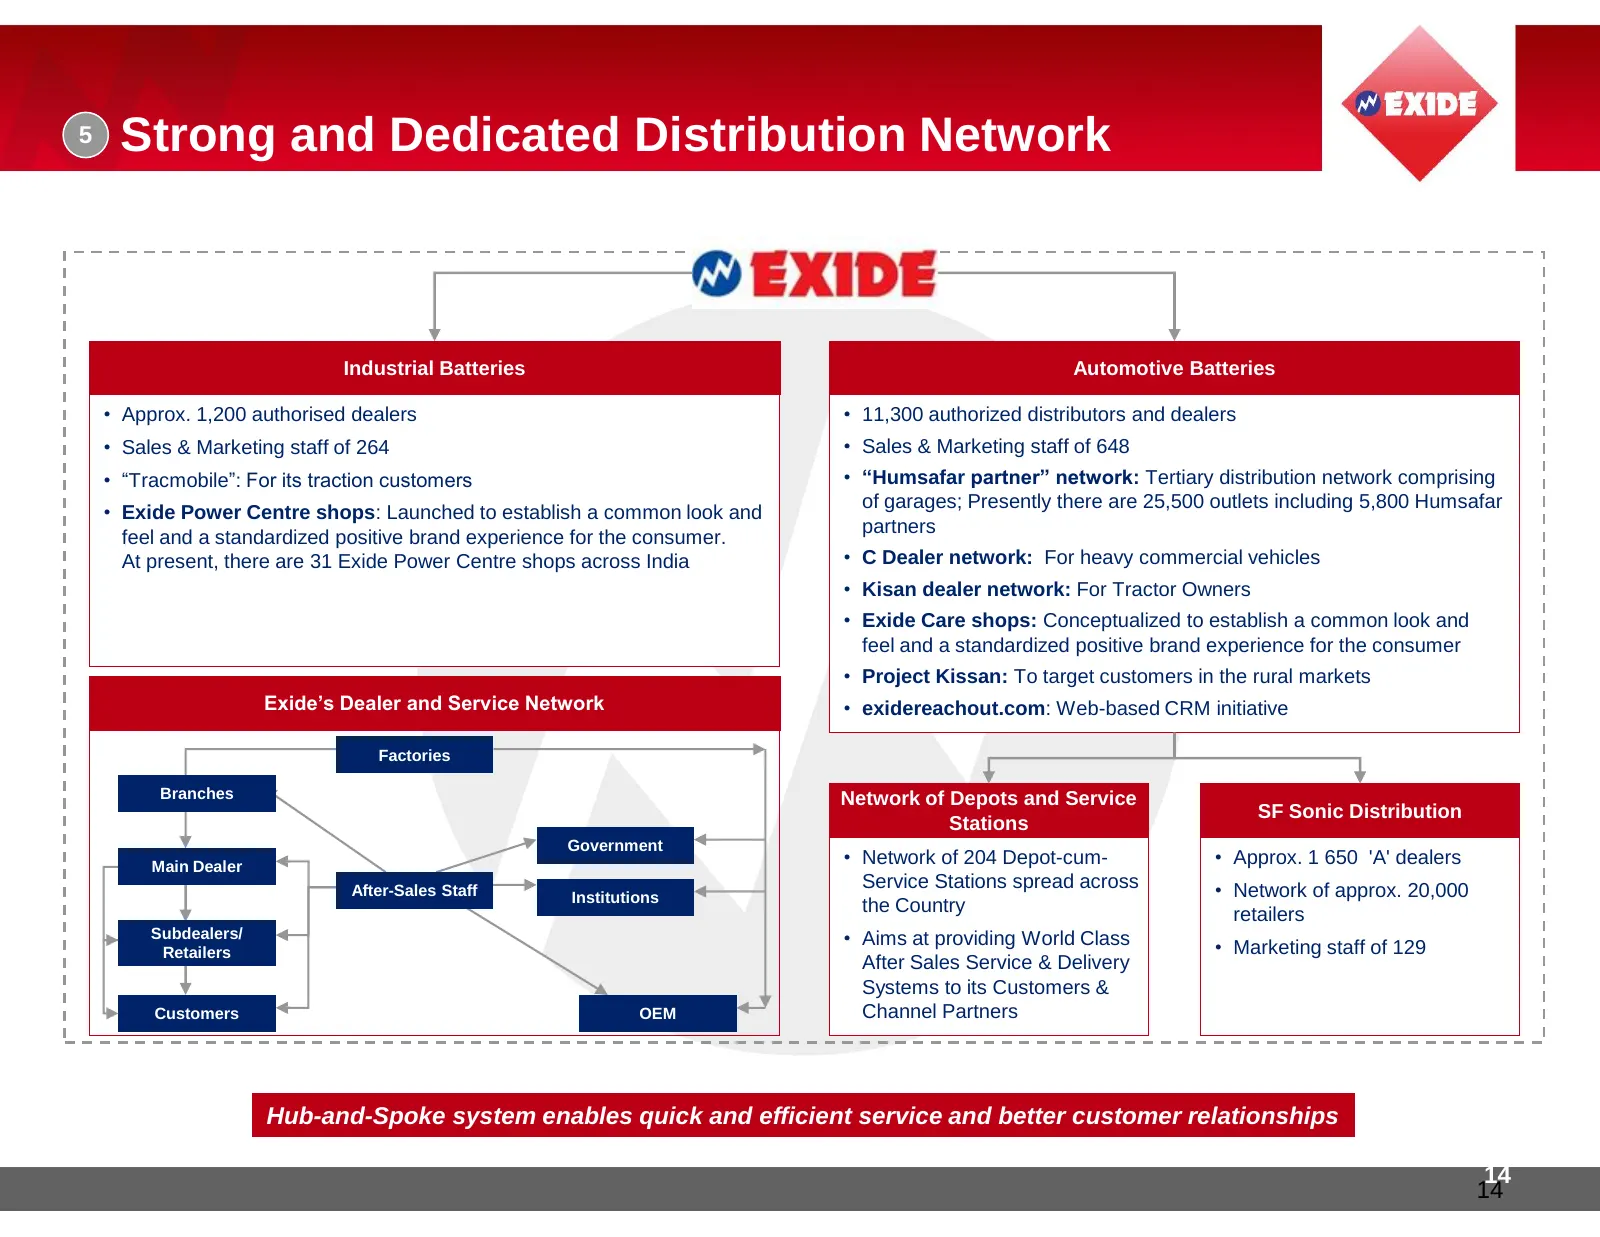
5 Strong and Dedicated Distribution Network Industrial Batteries Automotive Batteries • Approx. 1,200 authorised dealers • 11,300 authorized distributors and dealers • Sales & Marketing staff of 264 • Sales & Marketing staff of 648 • “Tracmobile”: For its traction customers • “Humsafar partner” netw
Slide 15: Strong Management Team with Proven Execution Capabilities
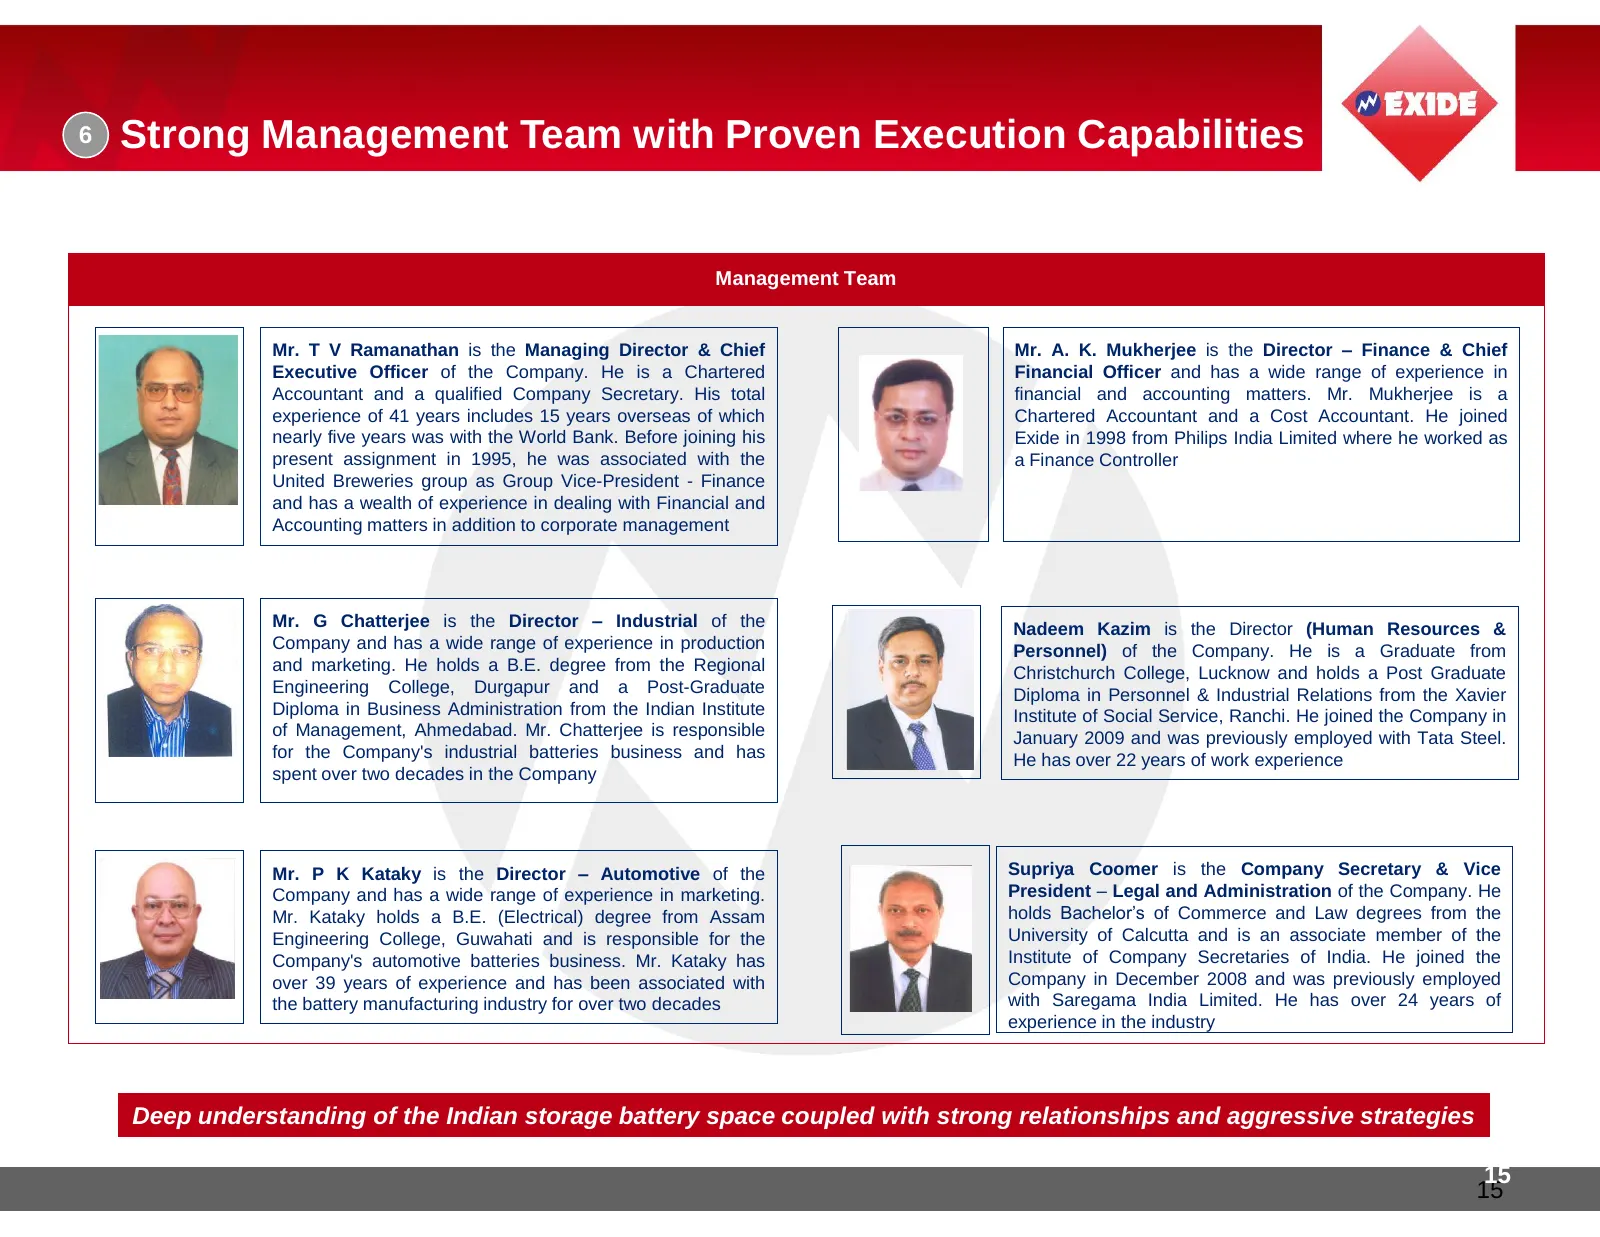
6 Strong Management Team with Proven Execution Capabilities Management Team Mr. T V Ramanathan is the Managing Director & Chief Mr. A. K. Mukherjee is the Director – Finance & Chief Executive Officer of the Company. He is a Chartered Financial Officer and has a wide range of experience in Accountant
Slide 16: Financial Information
Financial Information 16 16
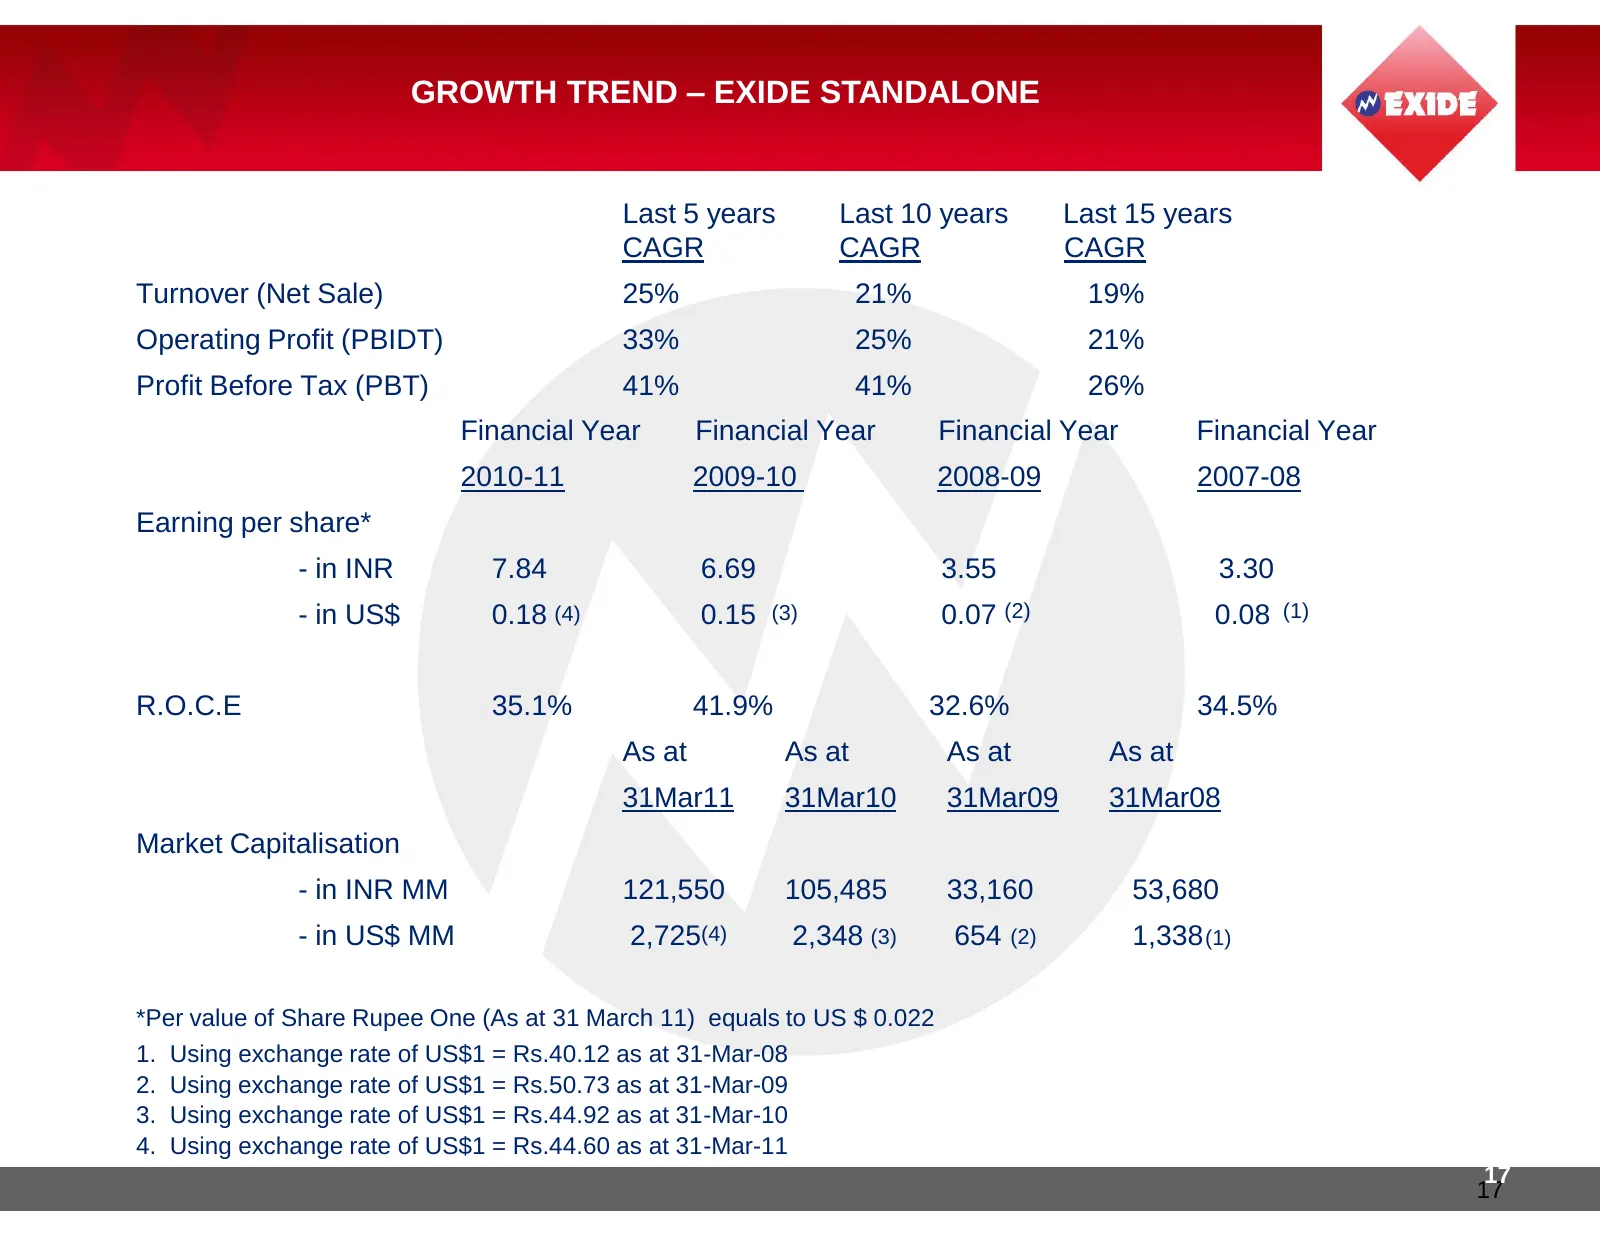
Slide 17: Growth Trend – Exide Standalone
GROWTH TREND – EXIDE STANDALONE Last 5 years Last 10 years Last 15 years CAGR CAGR CAGR Turnover (Net Sale) 25% 21% 19% Operating Profit (PBIDT) 33% 25% 21% Profit Before Tax (PBT) 41% 41% 26% Financial Year Financial Year Financial Year Financial Year 2010-11 2009-10 2008-09 2007-08 Earning per sha
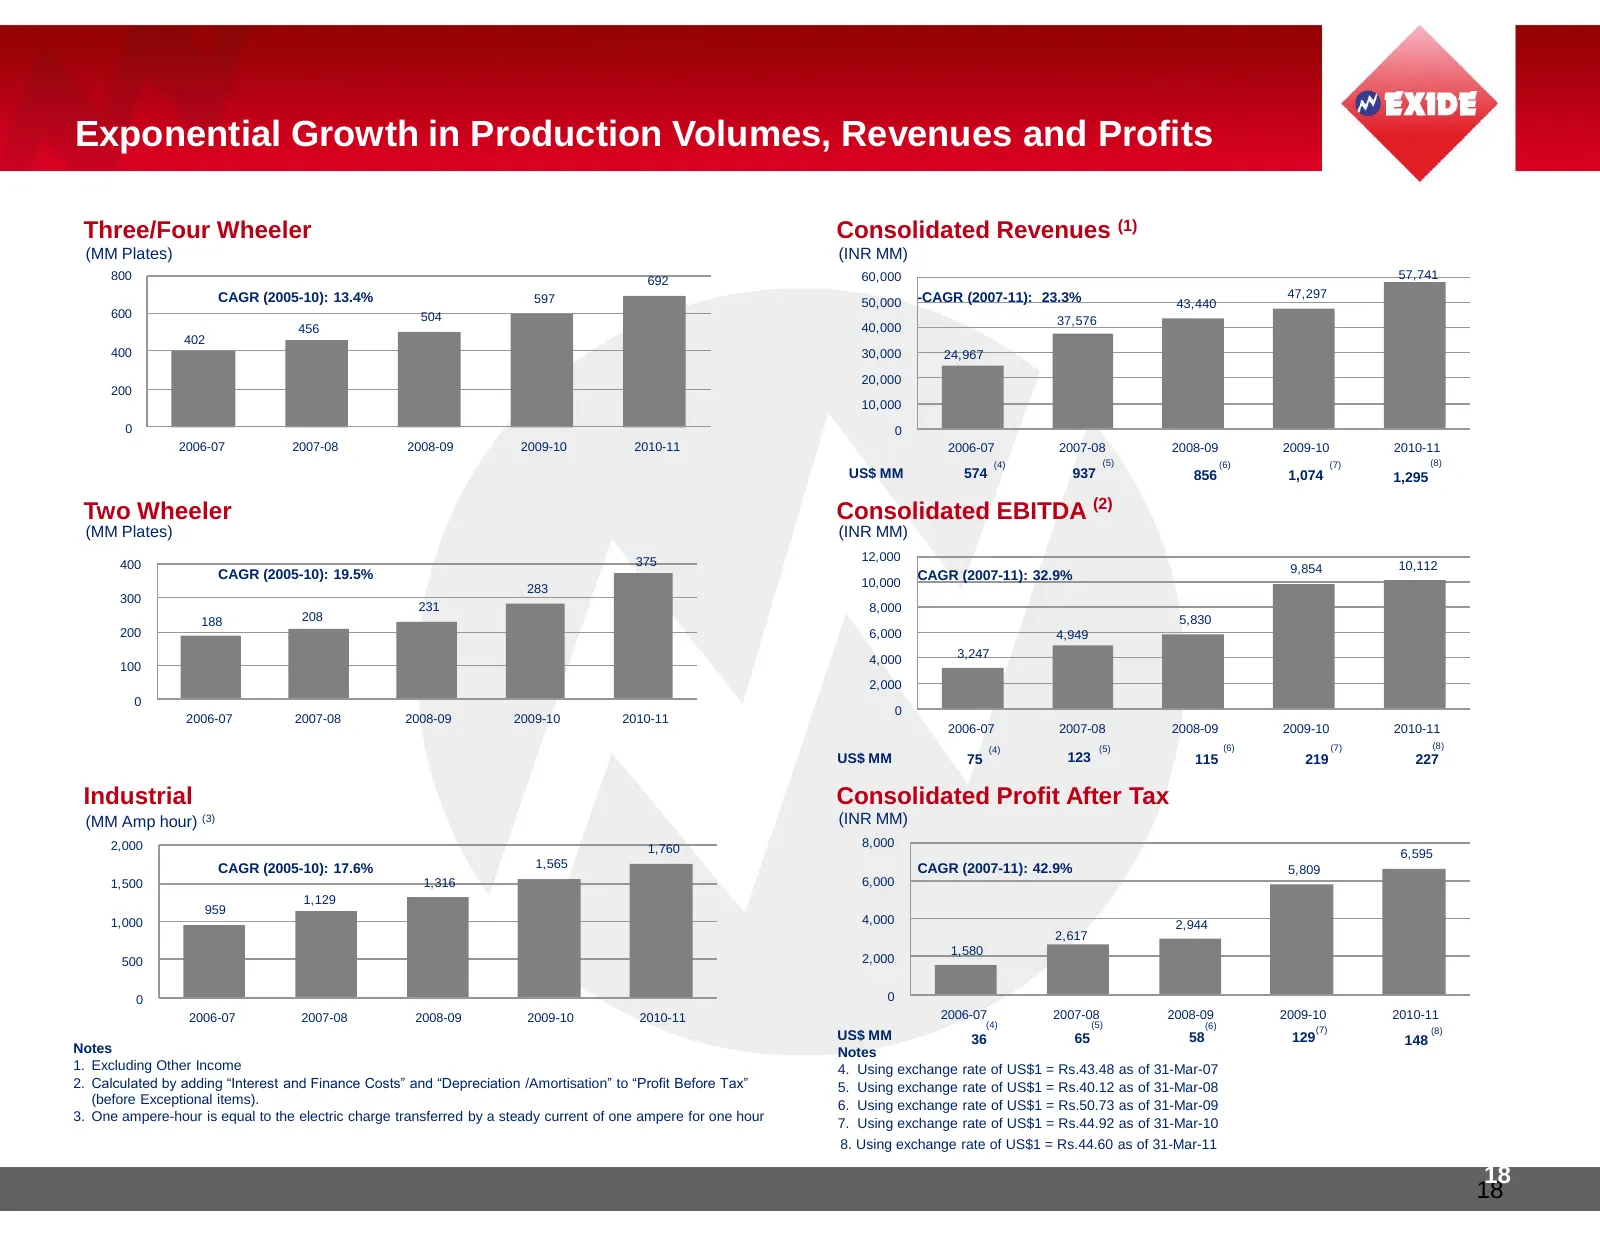
Slide 18: Exponential Growth in Production Volumes, Revenues and Profits
Exponential Growth in Production Volumes, Revenues and Profits Three/Four Wheeler Consolidated Revenues (1) (MM Plates) (INR MM) 800 692 60,000 57,741 CAGR (2005-10): 13.4% 597 -CAGR (2007-11): 23.3% 47,297 50,000 43,440 600 504 37,576 456 40,000 402 400 30,000 24,967 20,000 200 10,000 0 0 2006-07 2
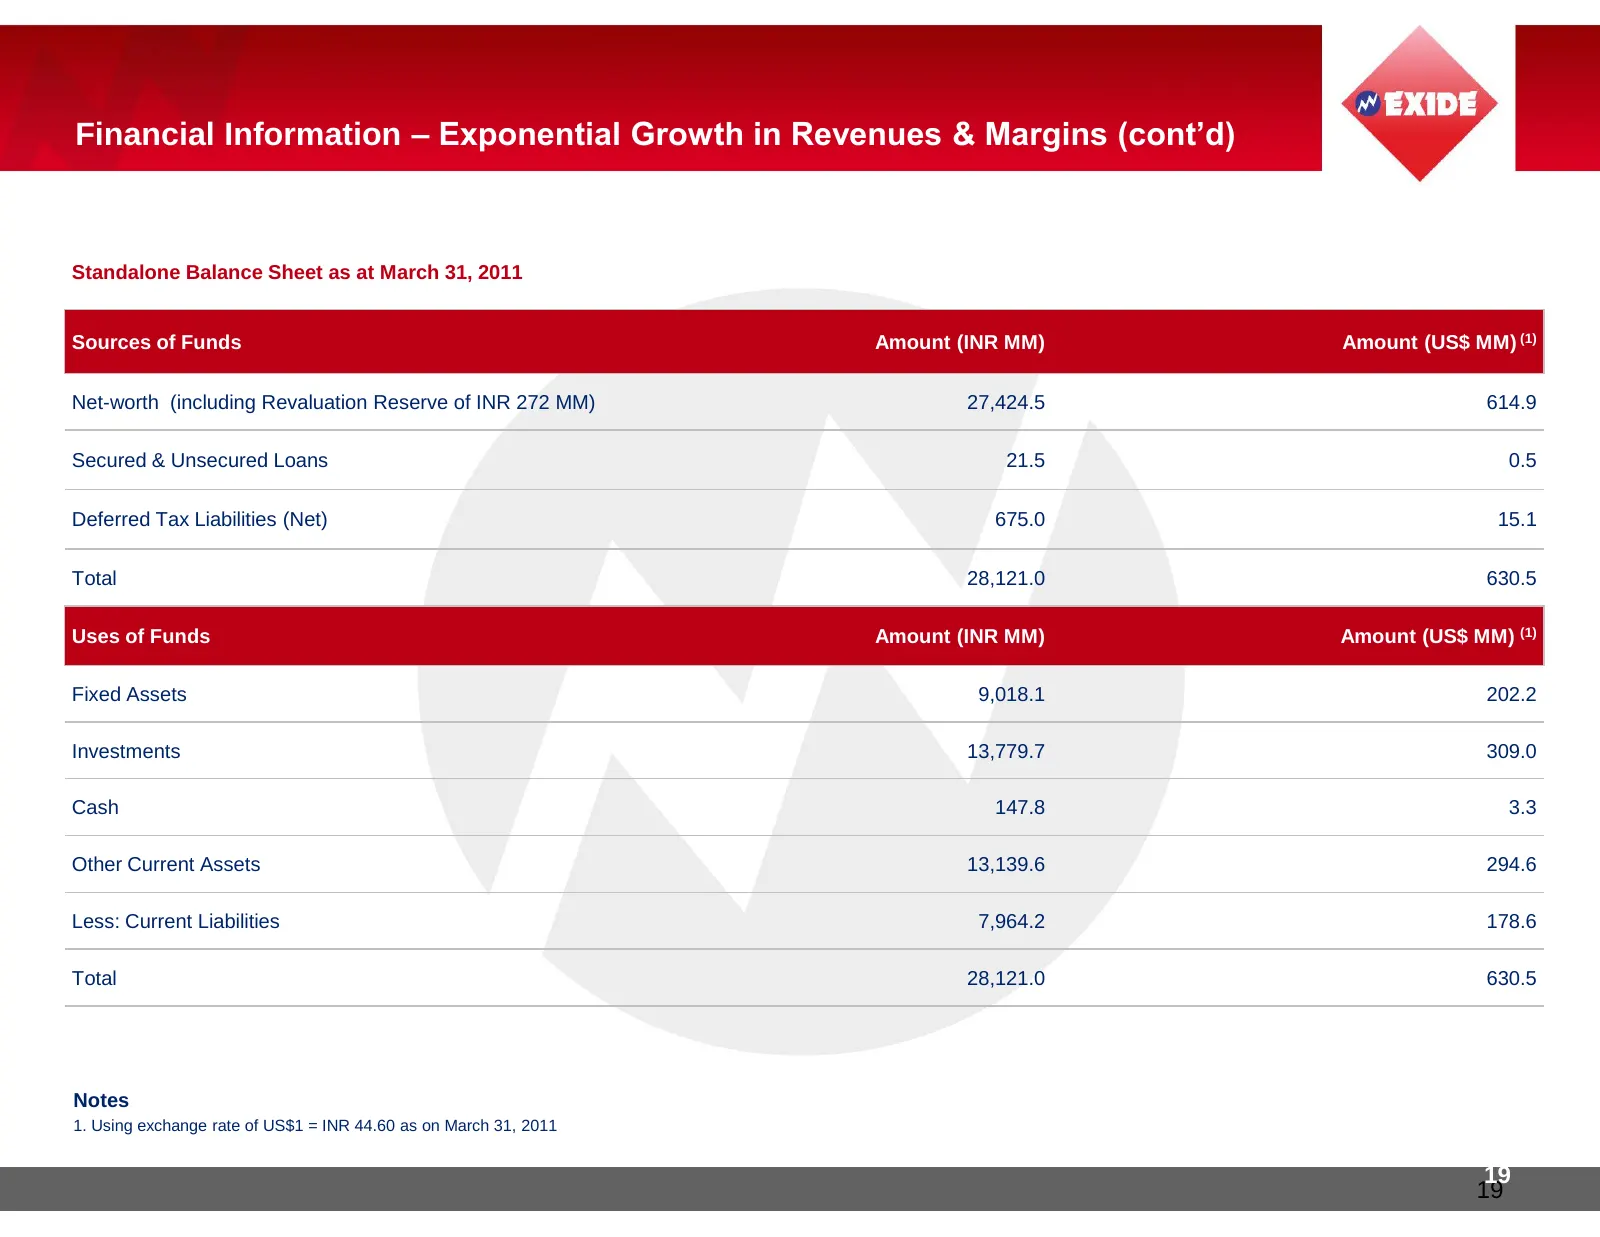
Slide 19: Standalone Balance Sheet as at March 31, 2011
Financial Information – Exponential Growth in Revenues & Margins (cont’d) Standalone Balance Sheet as at March 31, 2011 Sources of Funds Amount (INR MM) Amount (US$ MM) (1) Net-worth (including Revaluation Reserve of INR 272 MM) 27,424.5 614.9 Secured & Unsecured Loans 21.5 0.5 Deferred Tax Liabilit
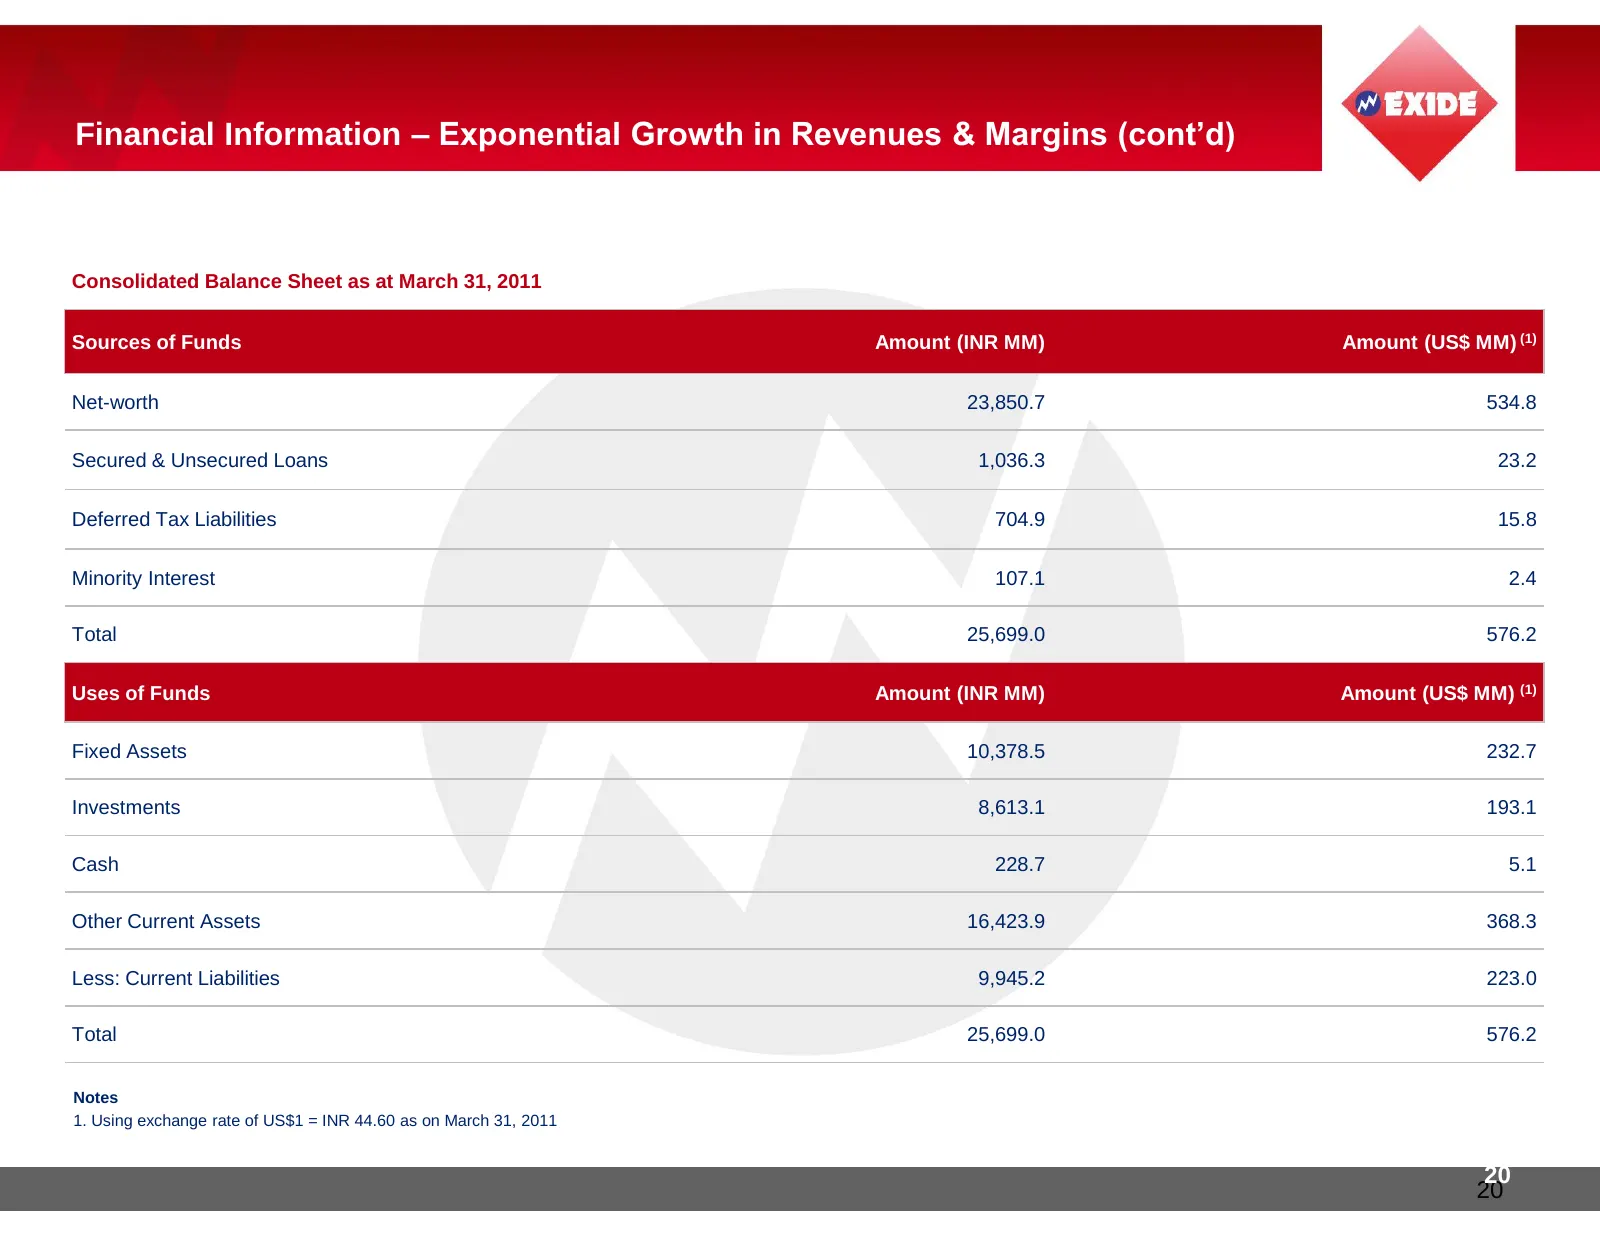
Slide 20: Consolidated Balance Sheet as at March 31, 2011
Financial Information – Exponential Growth in Revenues & Margins (cont’d) Consolidated Balance Sheet as at March 31, 2011 Sources of Funds Amount (INR MM) Amount (US$ MM) (1) Net-worth 23,850.7 534.8 Secured & Unsecured Loans 1,036.3 23.2 Deferred Tax Liabilities 704.9 15.8 Minority Interest 107.1 2
Slide 21: Thank You
THANK YOU 21 21
Source: Internet Archive copy of exideindustries.com
More decks from Exide Industries Limited
 Q2 FY27 Earnings Presentation33 slides · Nov 4, 2026
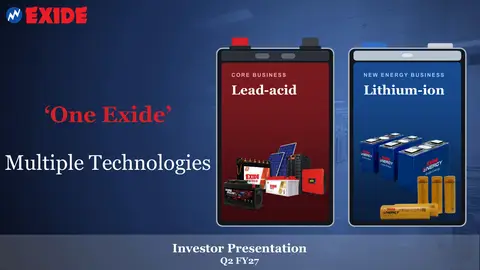 Q2 FY27 Earnings Presentation32 slides · November 2026
 Q1 FY27 Earnings Presentation34 slides · Aug 1, 2026
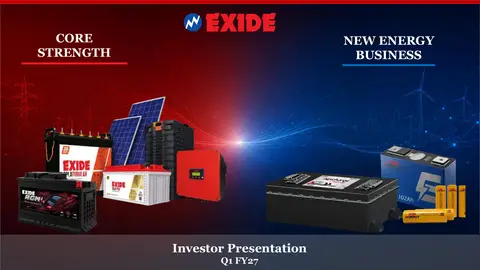 Q1 FY27 Earnings Presentation33 slides · July 2026
 Q4 FY26 Earnings Presentation38 slides · May 5, 2026
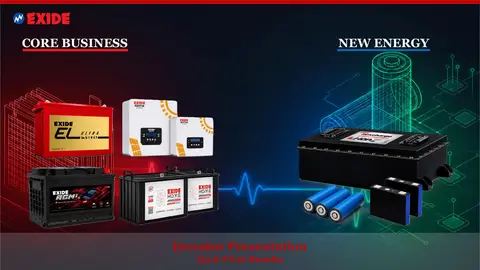 Q4 FY26 Earnings Presentation37 slides · May 2026