Indorama Ventures Public Co. Ltd. · SET:IVL
Indorama Ventures Public — Q2 2010 Earnings Presentation
29 slides from Indorama Ventures Public's earnings presentation, Aug 16, 2010
Slide 1: IVL – Q2 2010 Analyst Presentation
IVL – Q2 2010 Analyst Presentation St Strong Fundamentals F d t l – the th growth th story t continues… ti August 16, 2010
Slide 2: Disclaimer
Disclaimer This presentation contains “forward-looking statements”, which are based on current expectations and projections about future events, t and d iinclude l d allll statements t t t other th ththan statements t t t off hi historical t i l facts, f t including, i l di without ith t lilimitatio
Slide 3: Agenda
Agenda • Aspiration 2014 • Fi Financial i l results lt Q2 2010 and d 6M 2010 • Outlook 03 Q2 2010 Analyst Presentation
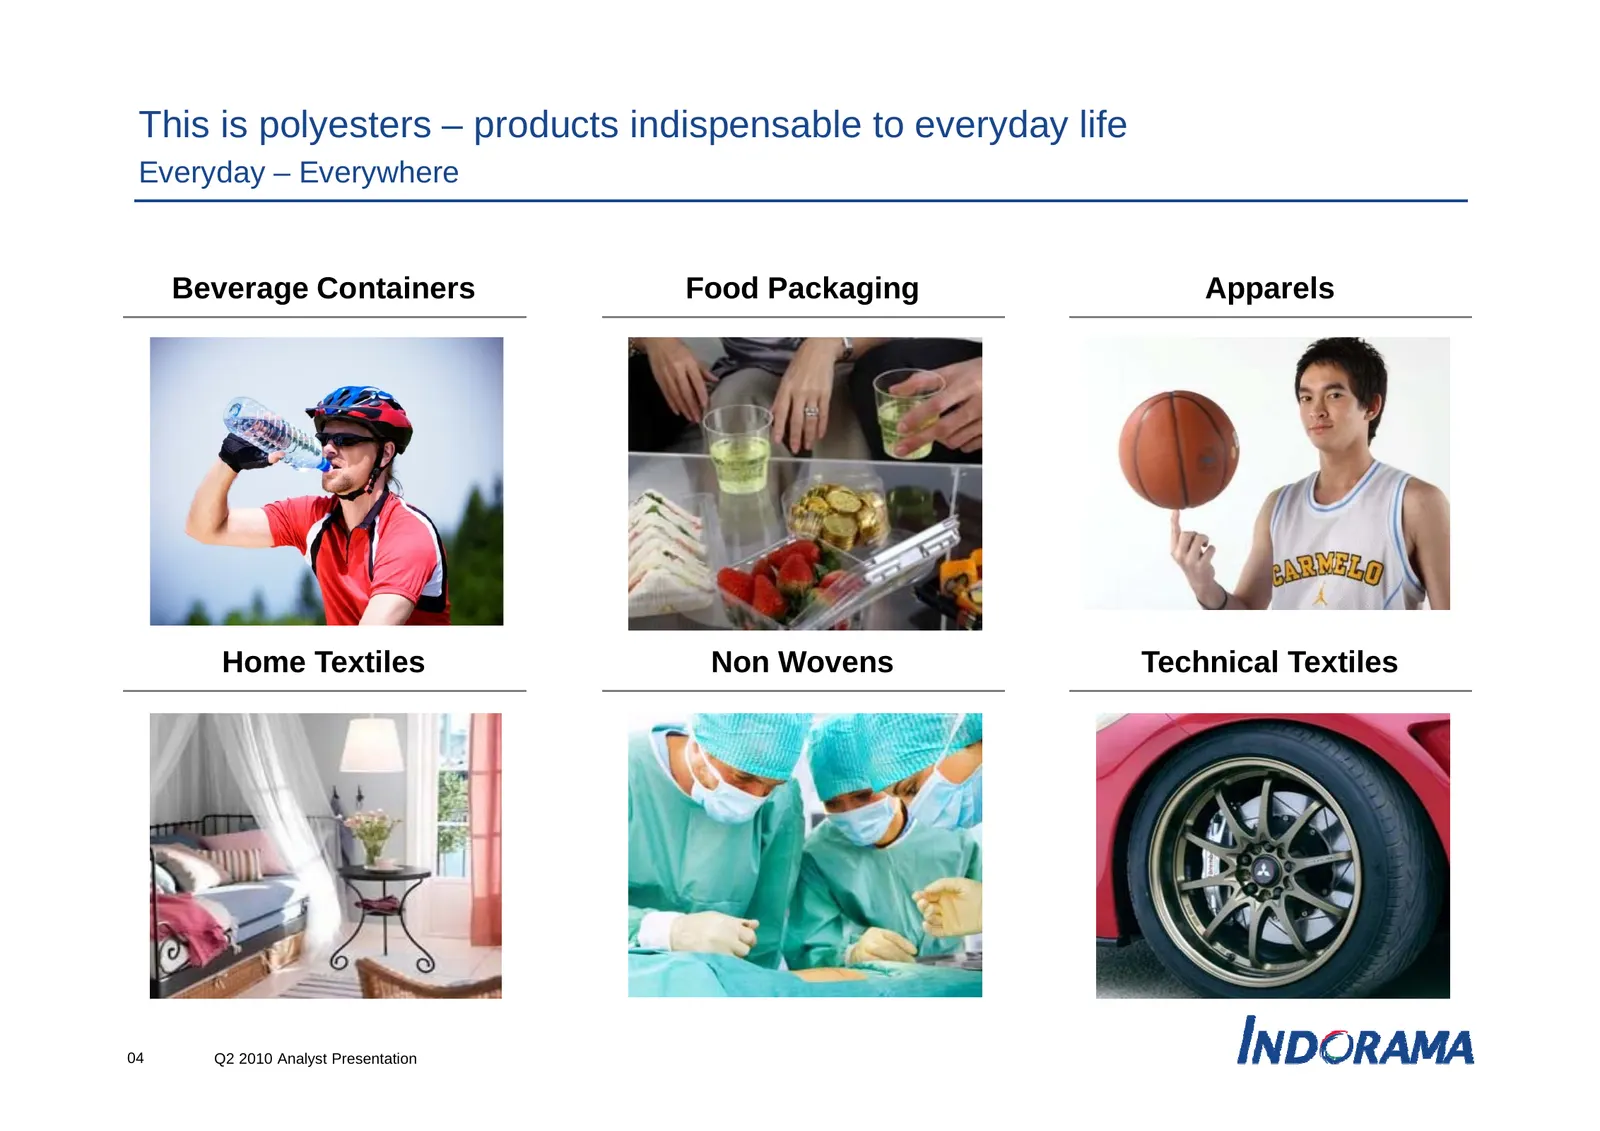
Slide 4: This is polyesters – products indispensable to everyday life
This is polyesters – products indispensable to everyday life Everyday – Everywhere Beverage Containers Food Packaging Apparels Home Textiles Non Wovens Technical Textiles 04 Q2 2010 Analyst Presentation
Slide 5: Aspiration 2014 and beyond
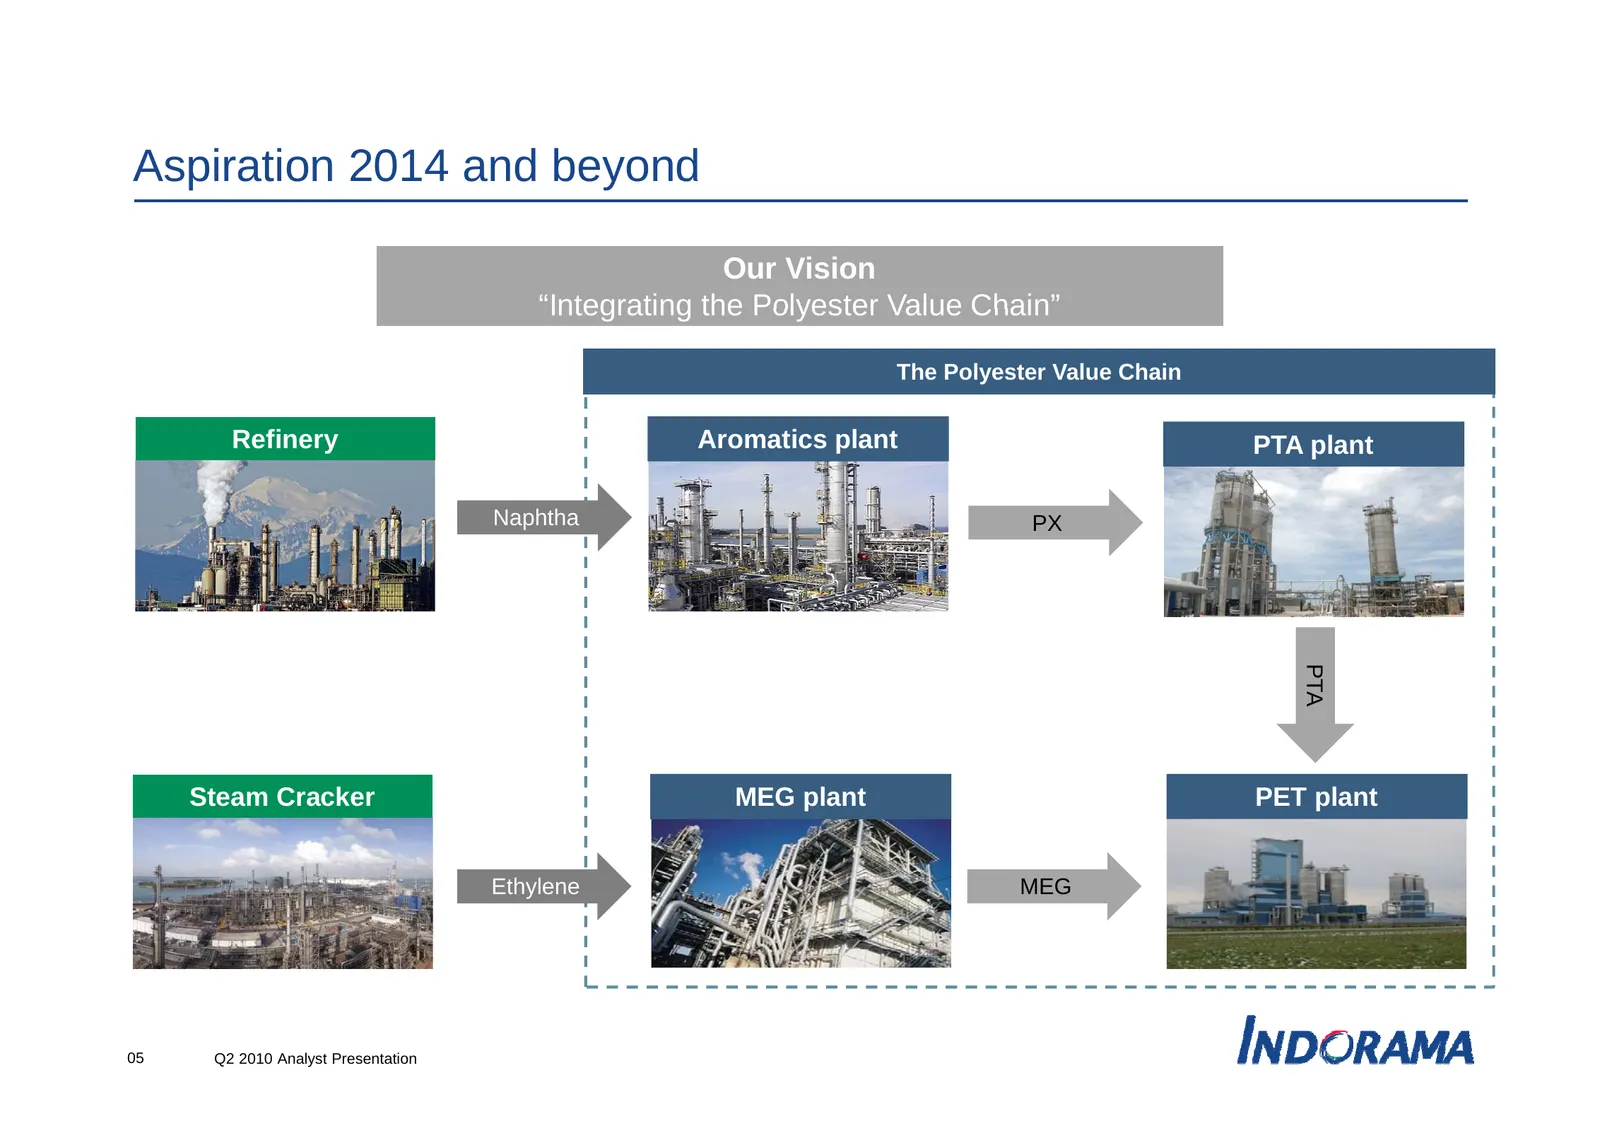
Aspiration 2014 and beyond Our Vision “Integrating Integrating the Polyester Value Chain” Chain The Polyester Value Chain Refinery Aromatics plant PTA plant l t Naphtha PX PTA A Steam Cracker MEG plant PET plant Ethylene MEG 05 Q2 2010 Analyst Presentation
Slide 6: Key goals and objectives
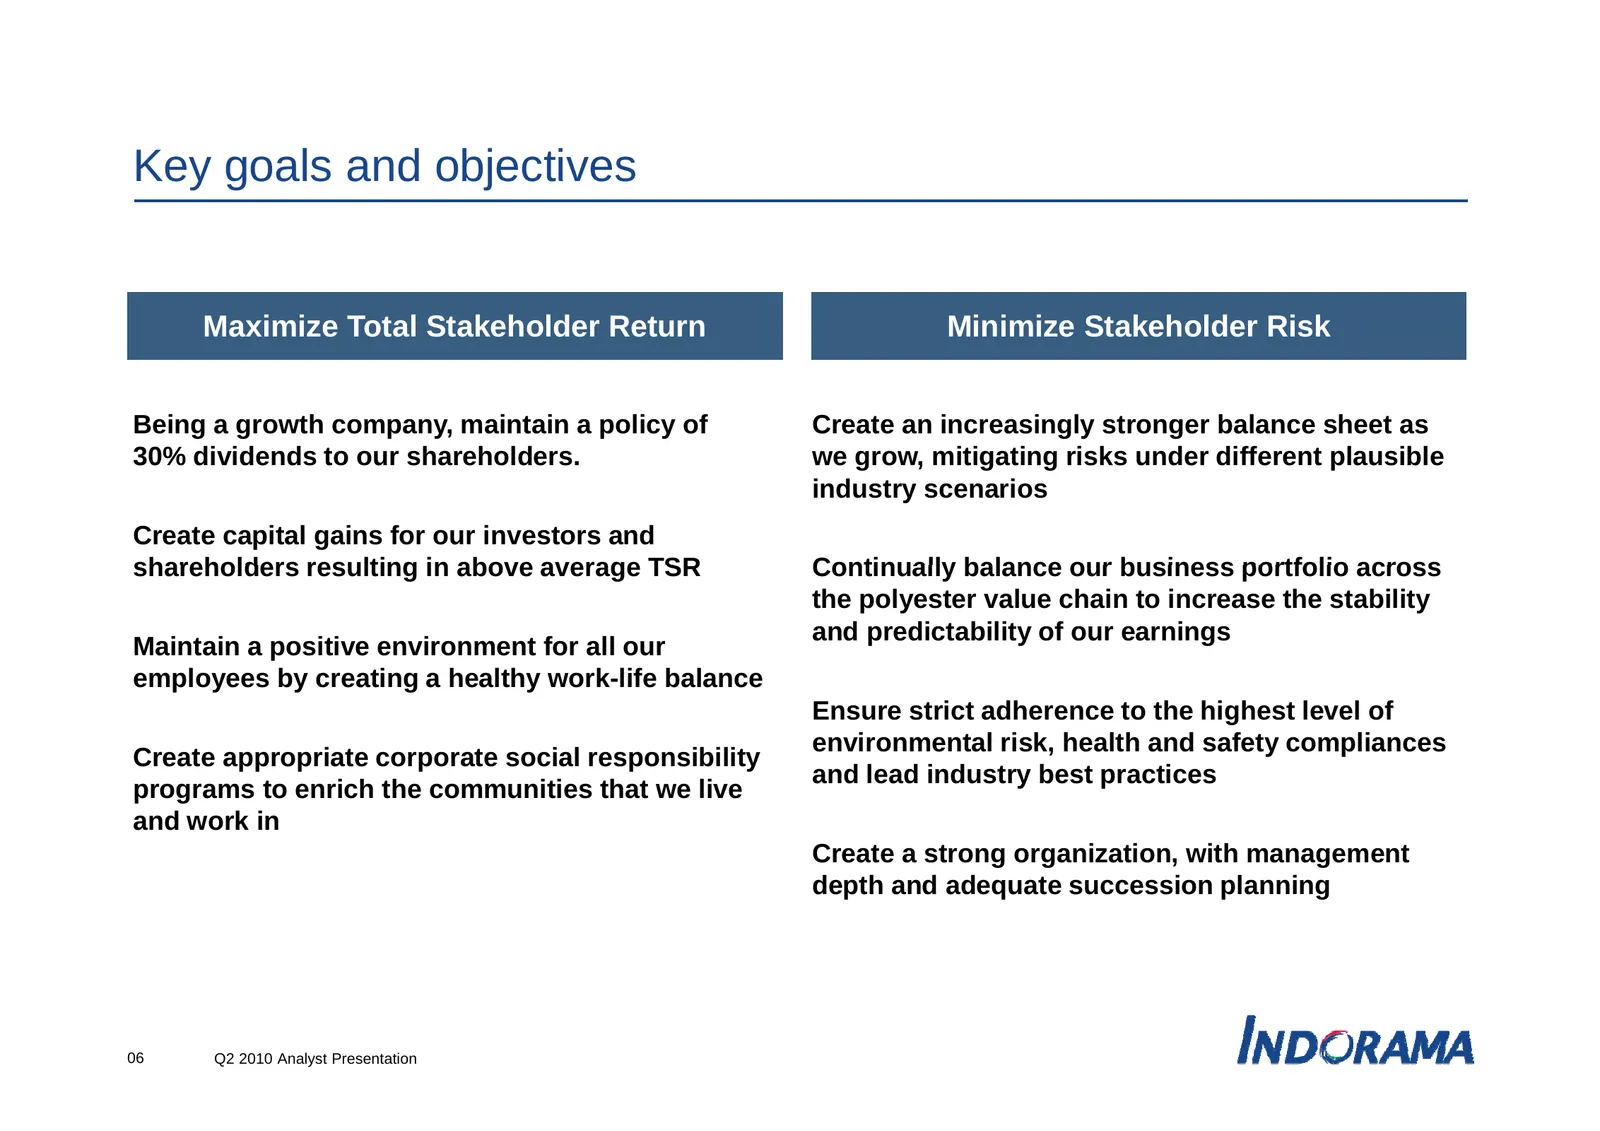
Key goals and objectives Maximize Total Stakeholder Return Minimize Stakeholder Risk Being g a growth g company, p y, maintain a policy p y of Create an increasingly g y stronger g balance sheet as 30% dividends to our shareholders. we grow, mitigating risks under different plausible industry scenar
Slide 7: Moving towards undisputable leadership
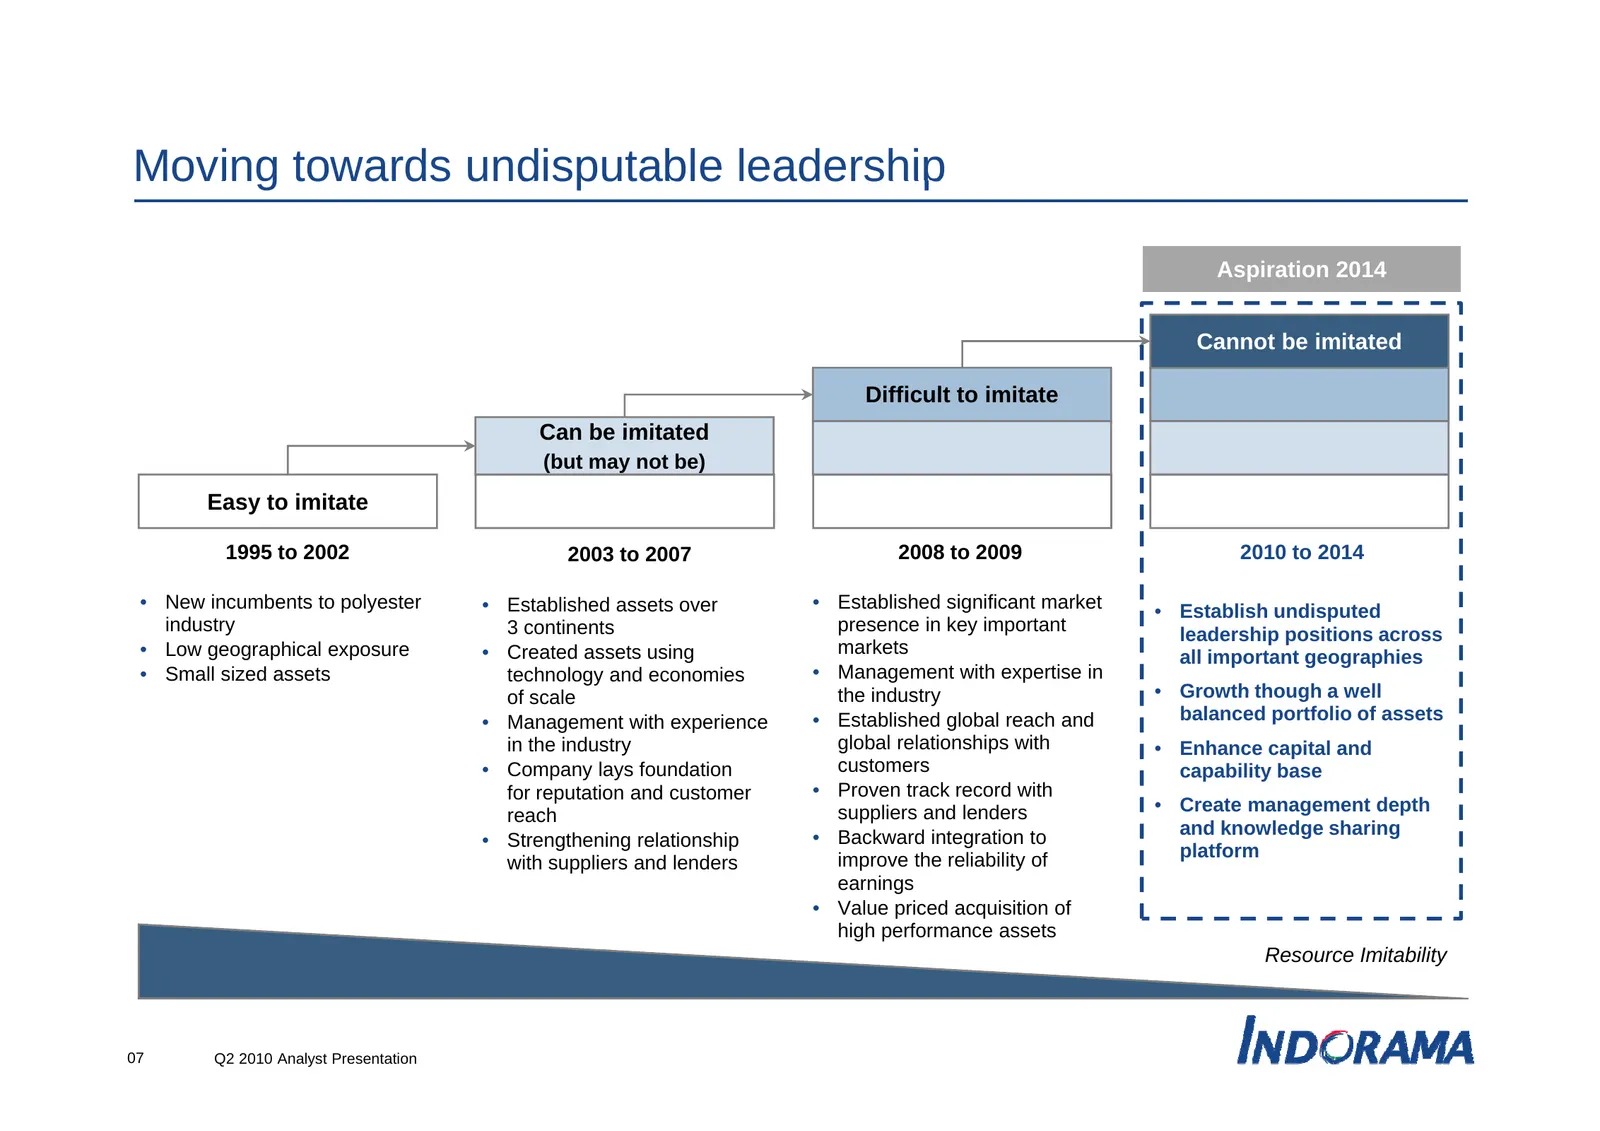
Moving towards undisputable leadership Aspiration 2014 Cannot be imitated Difficult to imitate Can be imitated (but may not be) Easy to imitate 1995 to 2002 2003 to 2007 2008 to 2009 2010 to 2014 • New incumbents to polyester • Established assets over • Established significant market • Establish und
Slide 8: Created superior market access
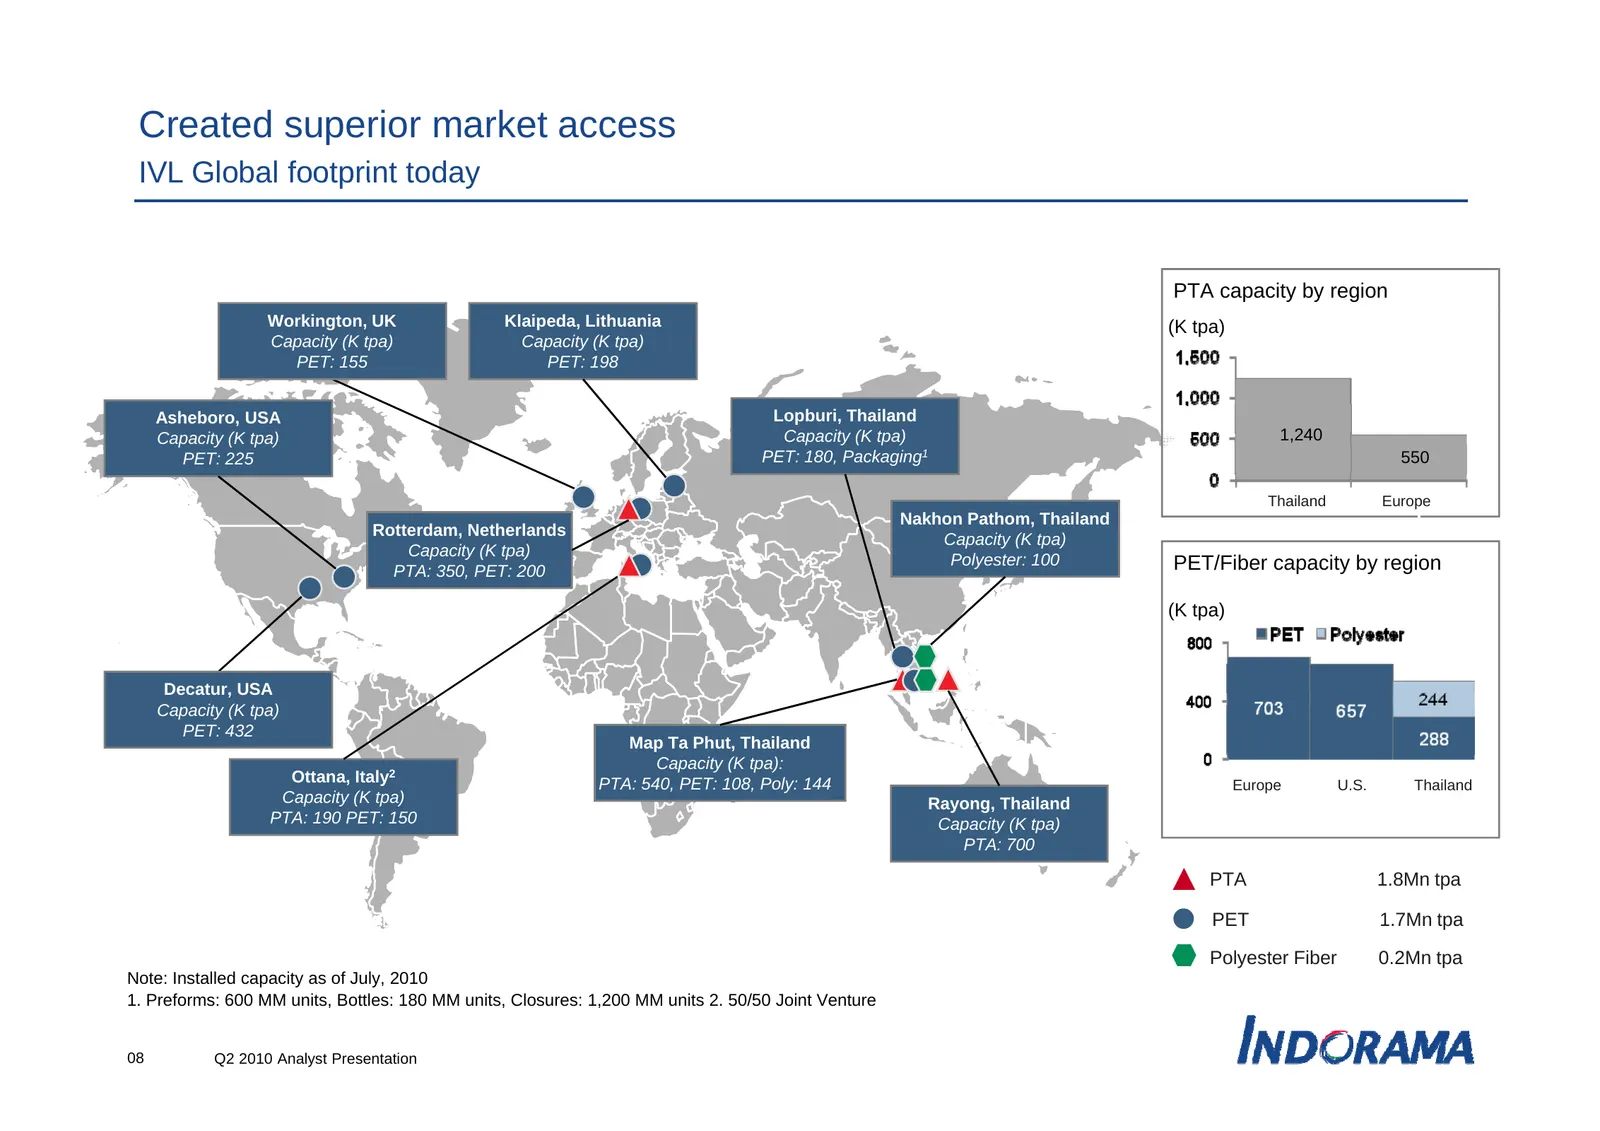
Created superior market access IVL Global footprint today PTA capacity by region Workington, UK Klaipeda, Lithuania (K tpa) Capacity (K tpa) Capacity (K tpa) PET: 155 PET: 198 Asheboro, USA Lopburi, Thailand Capacity (K tpa) Capacity (K tpa) 1 240 1,240 PET: 225 PET: 180, Packaging1 550 Thailand Eur
Slide 9: Optimized five elements to cost leadership
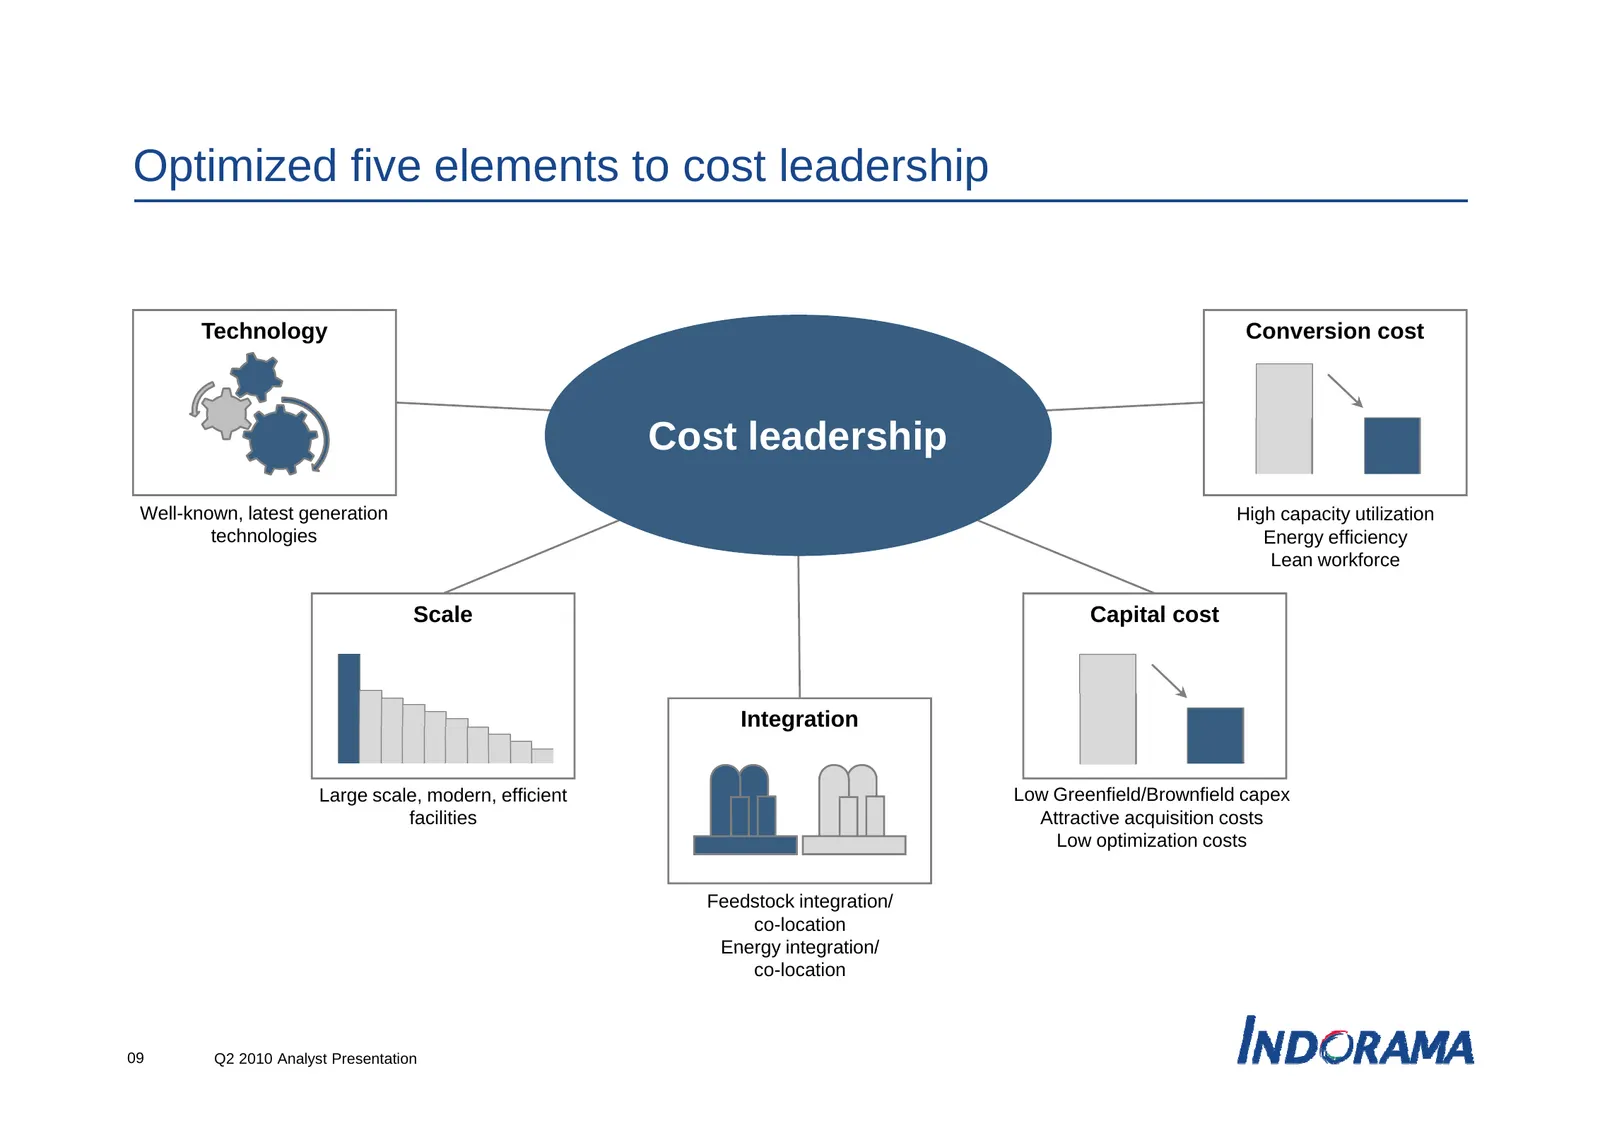
Optimized five elements to cost leadership Technology Conversion cost Cost leadership Well-known, latest generation High capacity utilization technologies Energy efficiency Lean workforce Scale Capital cost Integration Large scale, modern, efficient Low Greenfield/Brownfield capex facilities Attract
Slide 10: Spectacular polyester demand driven by consumer needs
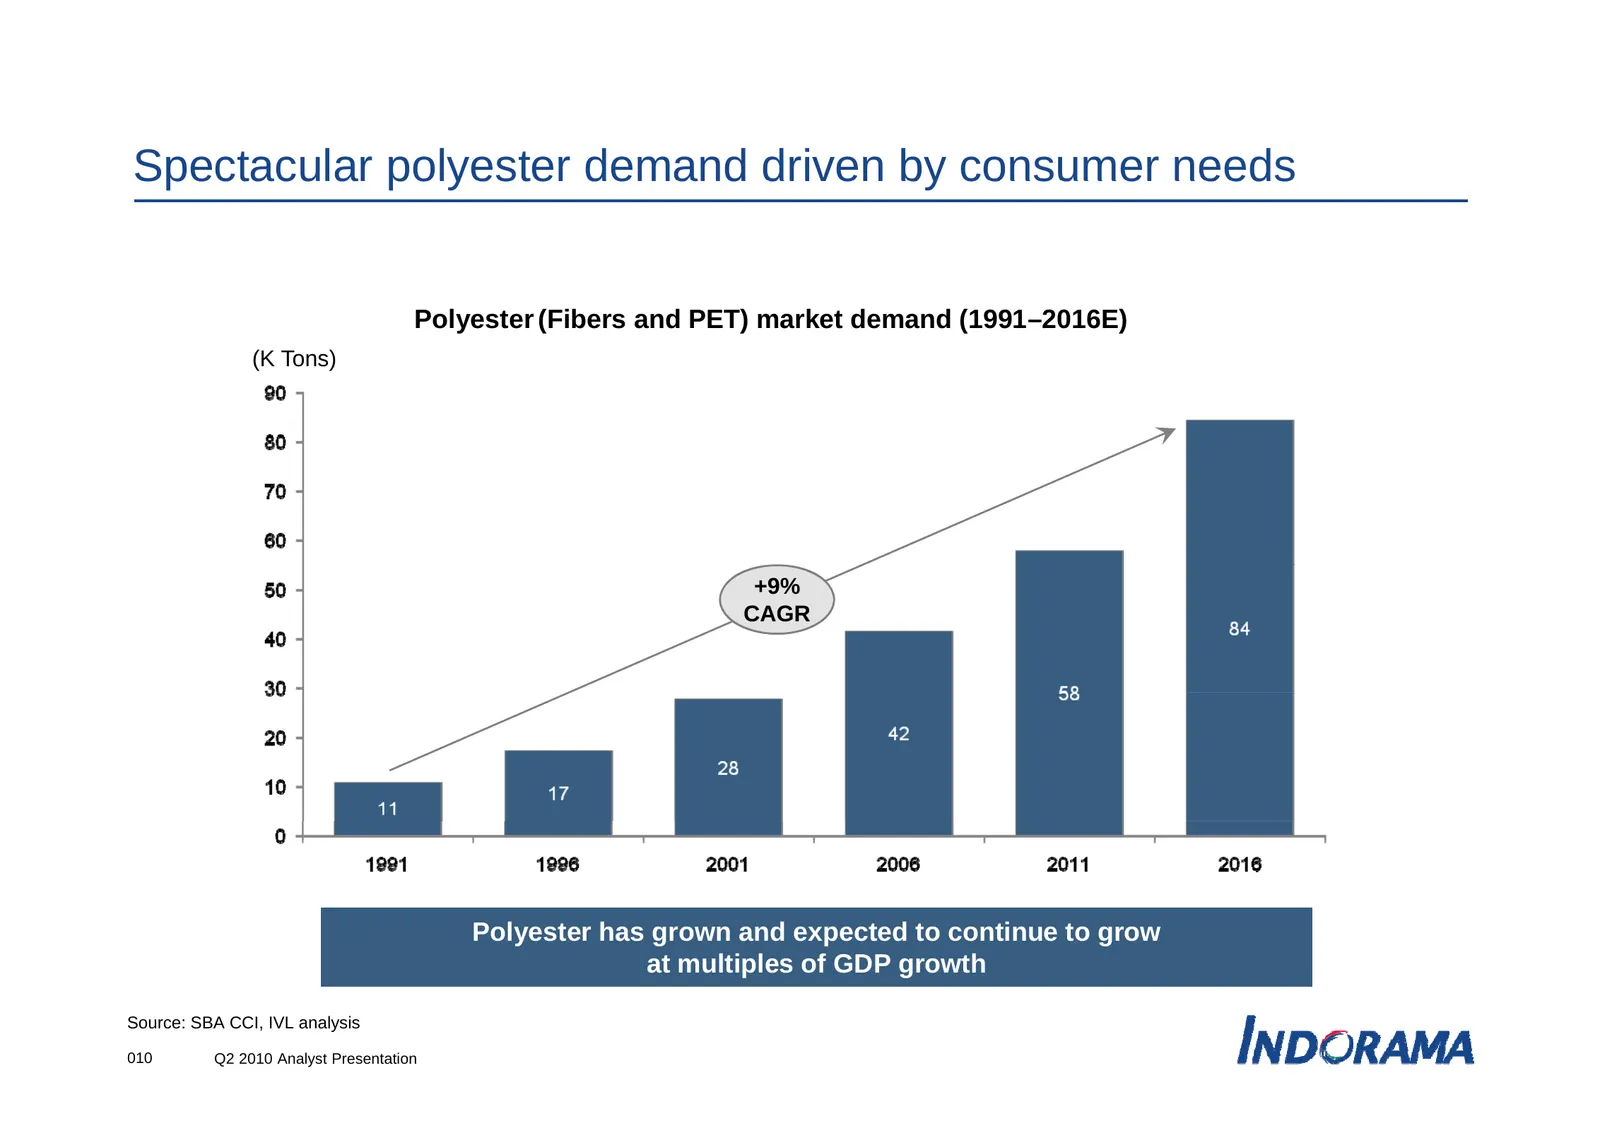
Spectacular polyester demand driven by consumer needs Polyester (Fibers and PET) market demand (1991–2016E) (K Tons) +9% CAGR Polyester has grown and expected to continue to grow at multiples of GDP growth Source: SBA CCI, IVL analysis 010 Q2 2010 Analyst Presentation
Slide 11: Polyester chain with proven sustainability and resilience
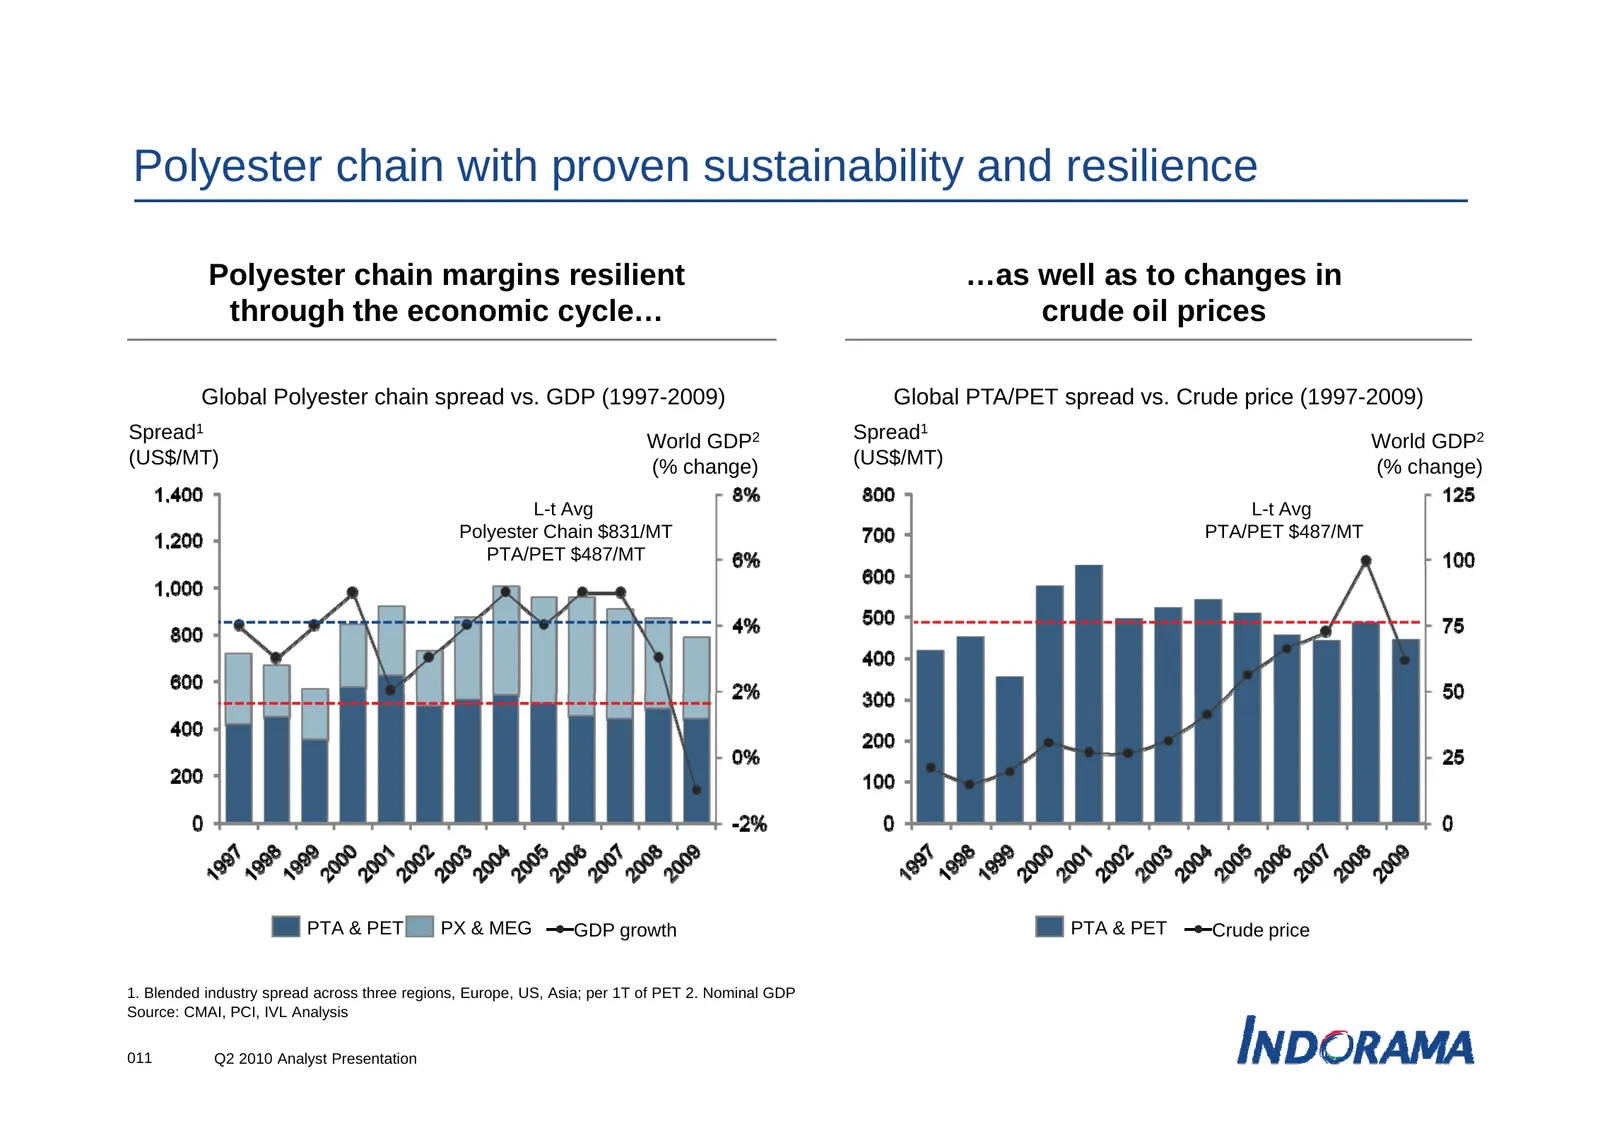
Polyester chain with proven sustainability and resilience Polyester chain margins resilient …as well as to changes in through the economic cycle cycle… crude oil prices Global Polyester chain spread vs. GDP (1997-2009) Global PTA/PET spread vs. Crude price (1997-2009) Spread1 ld GDP2 World W Spread1
Slide 12: Planned Capex and Investments of over US$ 2.0 billion
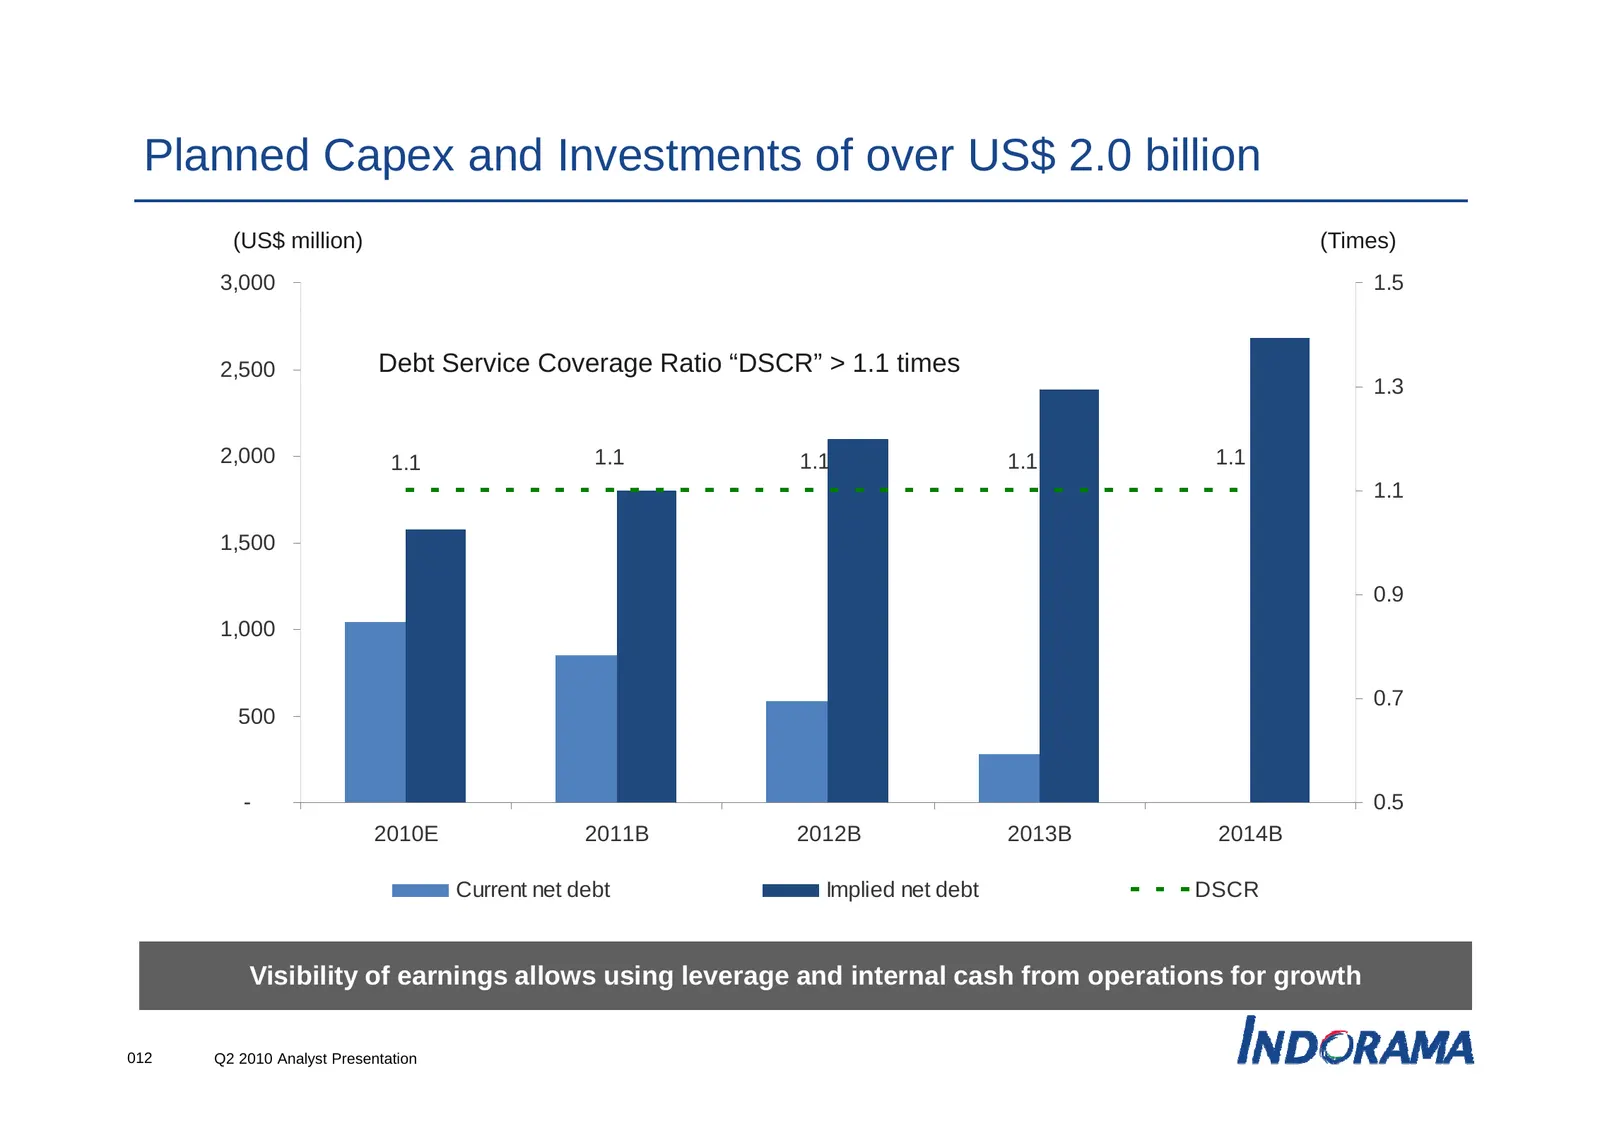
Planned Capex and Investments of over US$ 2.0 billion (US$ million) (Times) 3,000 1.5 2,500 Debt Service Coverage Ratio “DSCR” > 1.1 times 1.3 2,000 1.1 1.1 1.1 1.1 1.1 1.1 1,500 0.9 1,000 07 0.7 500 - 0.5 2010E 2011B 2012B 2013B 2014B Current net debt Implied net debt DSCR Visibility of earnings al
Slide 13: IVL Polyester value chain business .....Stronger By 2014
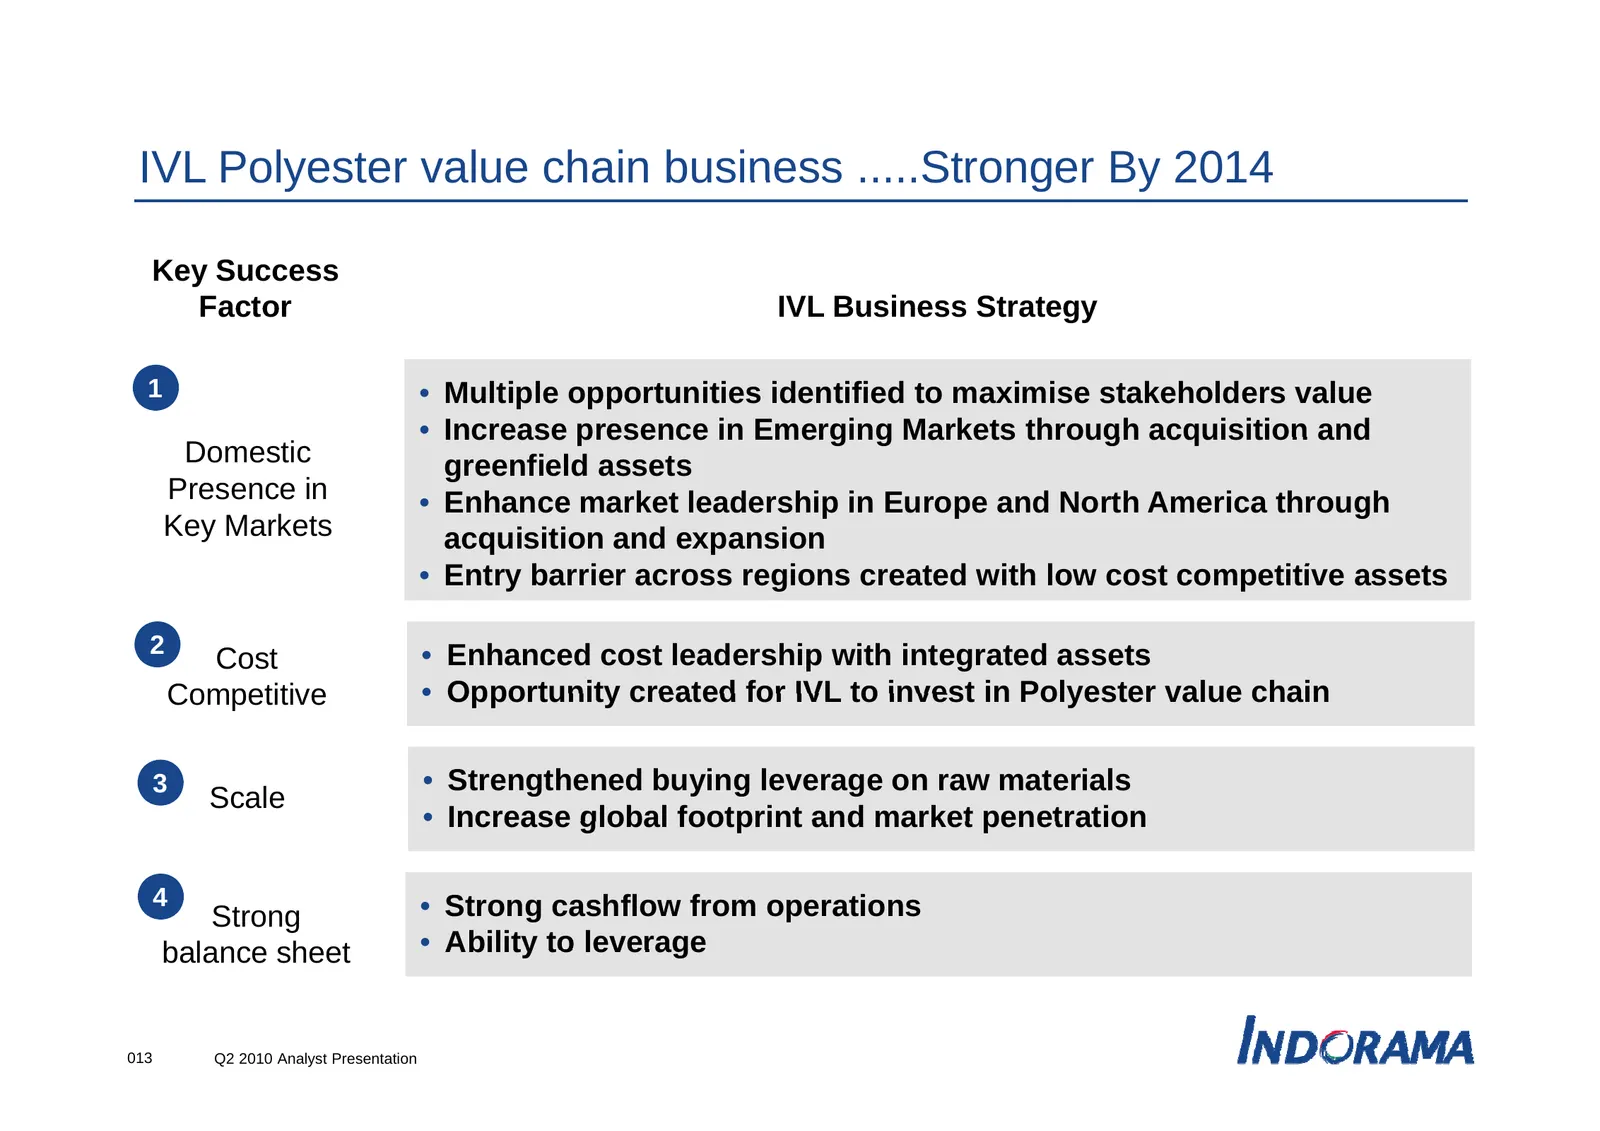
IVL Polyester value chain business .....Stronger By 2014 Key Success Factor IVL Business Strategy 1 • Multiple opportunities identified to maximise stakeholders value • Increase presence in Emerging Markets through acquisition and Domestic greenfield assets Presence in • Enhance market leadership in
Slide 14: 2014 portfolio will serve regional markets and extend global reach
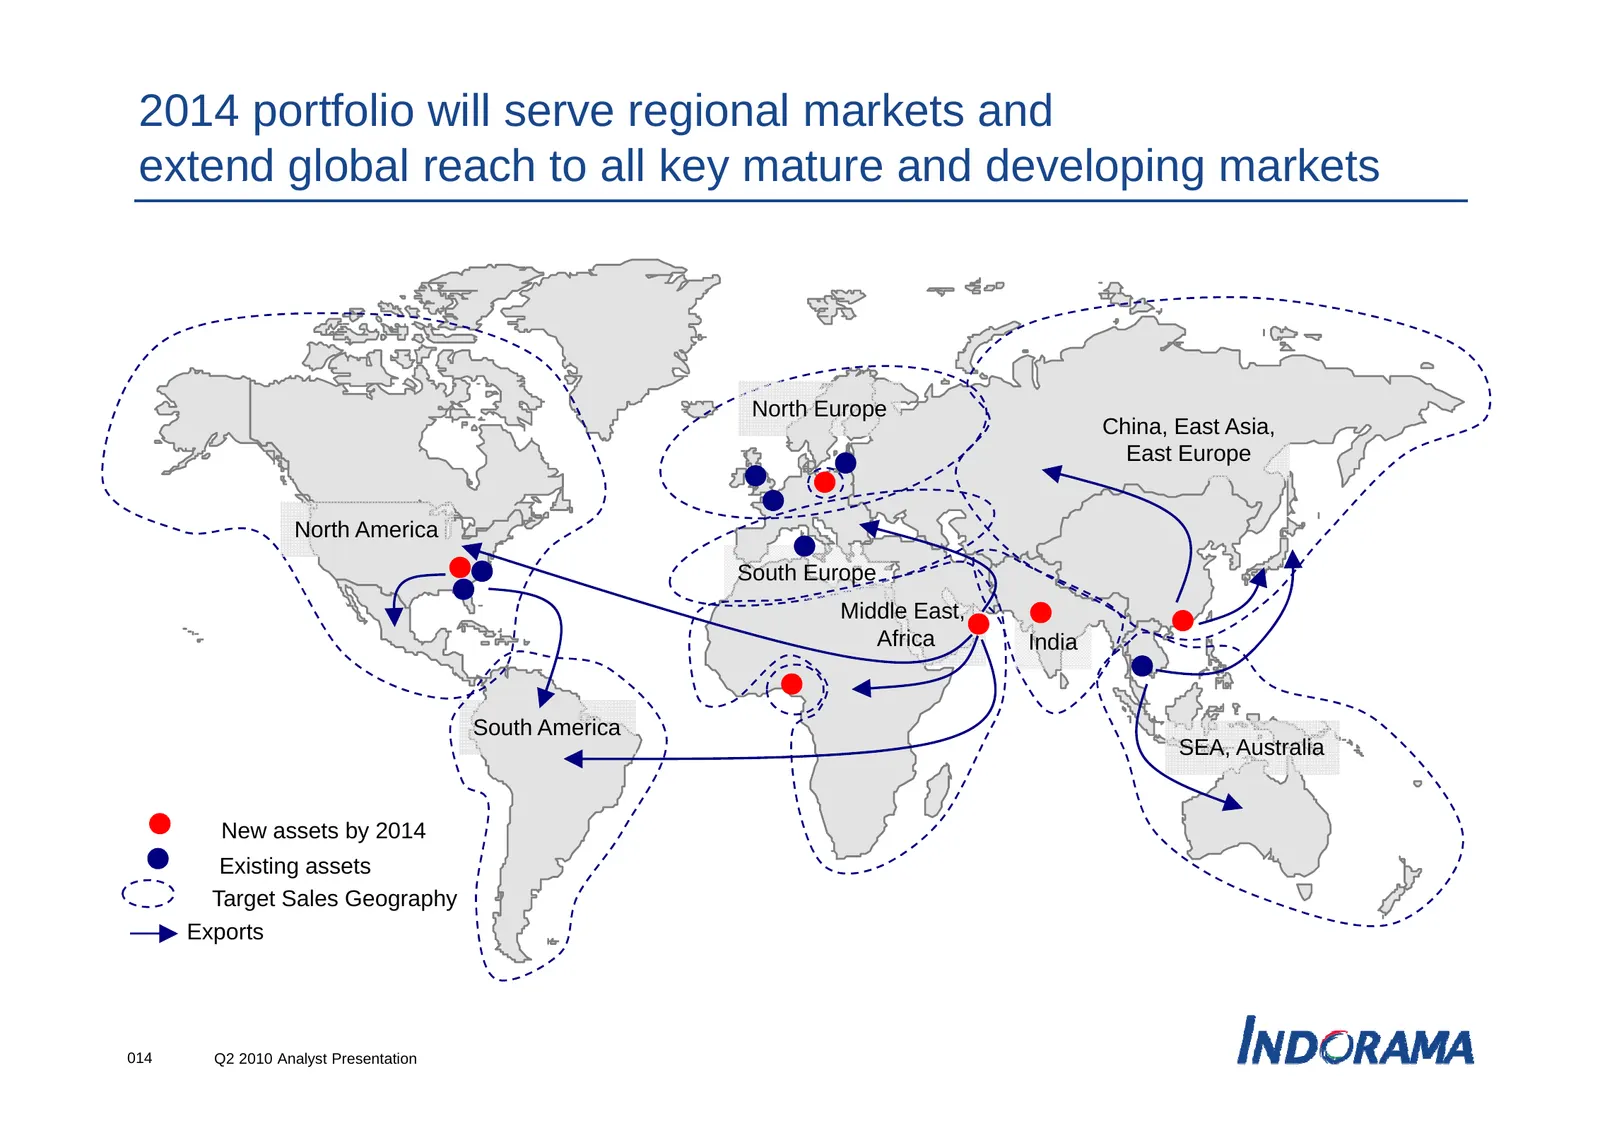
2014 portfolio will serve regional markets and extend global reach to all key mature and developing markets North Europe China,, East Asia,, East Europe North America S th Europe South E Middle East, Africa India South America SEA, Australia New assets by 2014 Existing assets Target Sales Geography
Slide 15: Agenda
Agenda • Aspiration 2014 • Fi Financial i l results lt Q2 2010 and d 6M 2010 • Outlook 015 Q2 2010 Analyst Presentation
Slide 16: 6M 2010 - High returns to shareholders
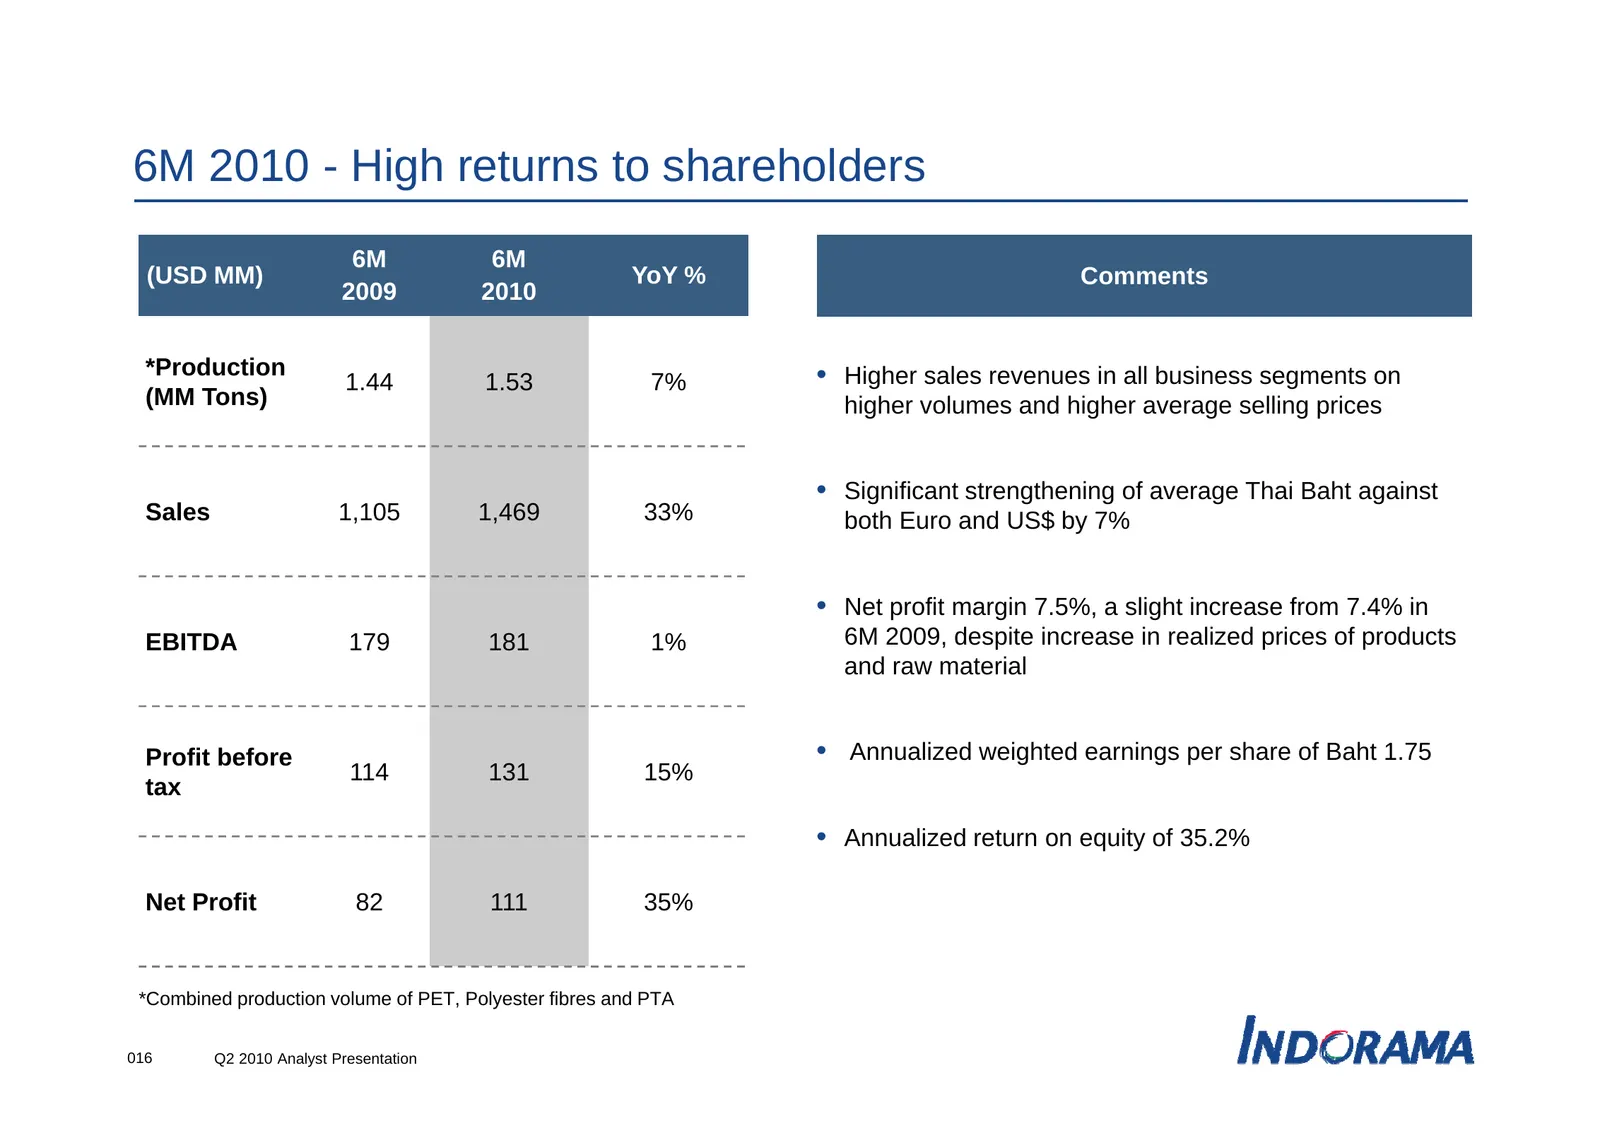
6M 2010 - High returns to shareholders 6M 6M (USD MM) YoY % Comments 2009 2010 *Production • Higher sales revenues in all business segments on 1.44 1.53 7% (MM Tons) higher volumes and higher average selling prices • Significant strengthening of average Thai Baht against Sales 1,105 1,469 33% both E
Slide 17: The power of a global presence
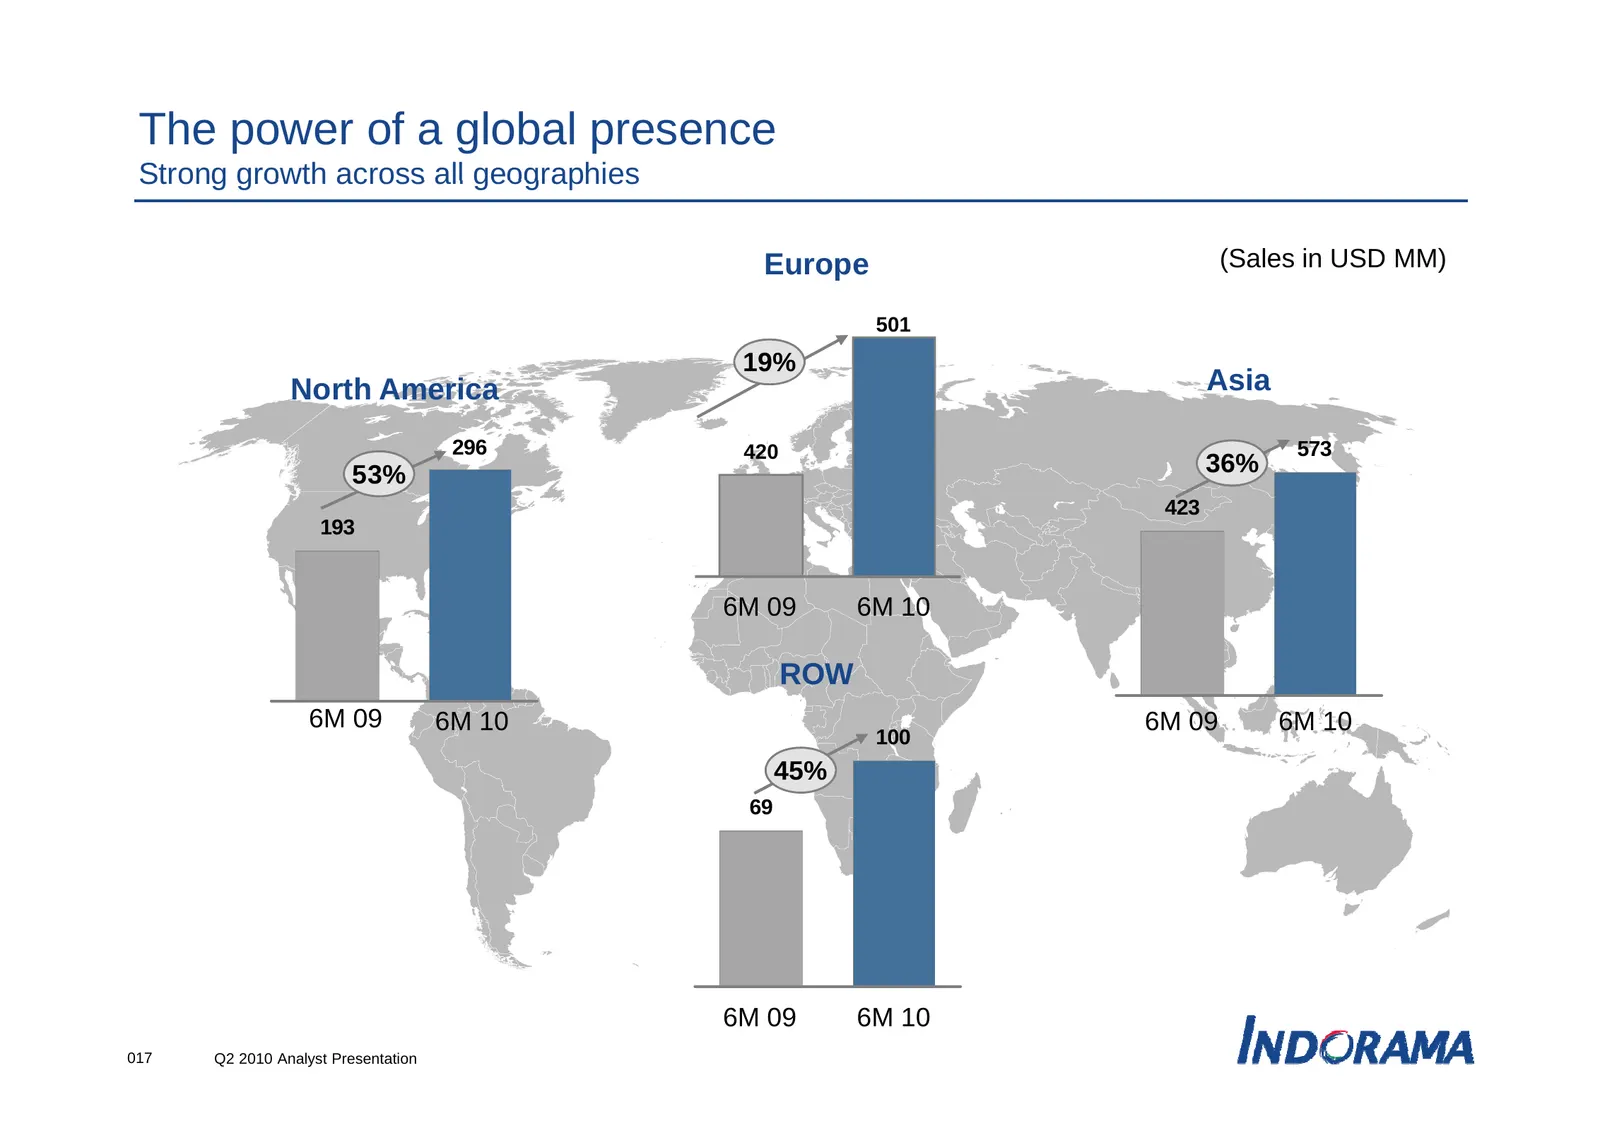
The power of a global presence Strong growth across all geographies Europe (Sales in USD MM) 501 19% North America Asia 296 420 573 53% 36% 423 193 6M 09 6M 10 ROW 6M 09 6M 10 6M 09 6M 10 100 45% 69 6M 09 6M 10 017 Q2 2010 Analyst Presentation
Slide 18: Q2 2010 - High returns to shareholders
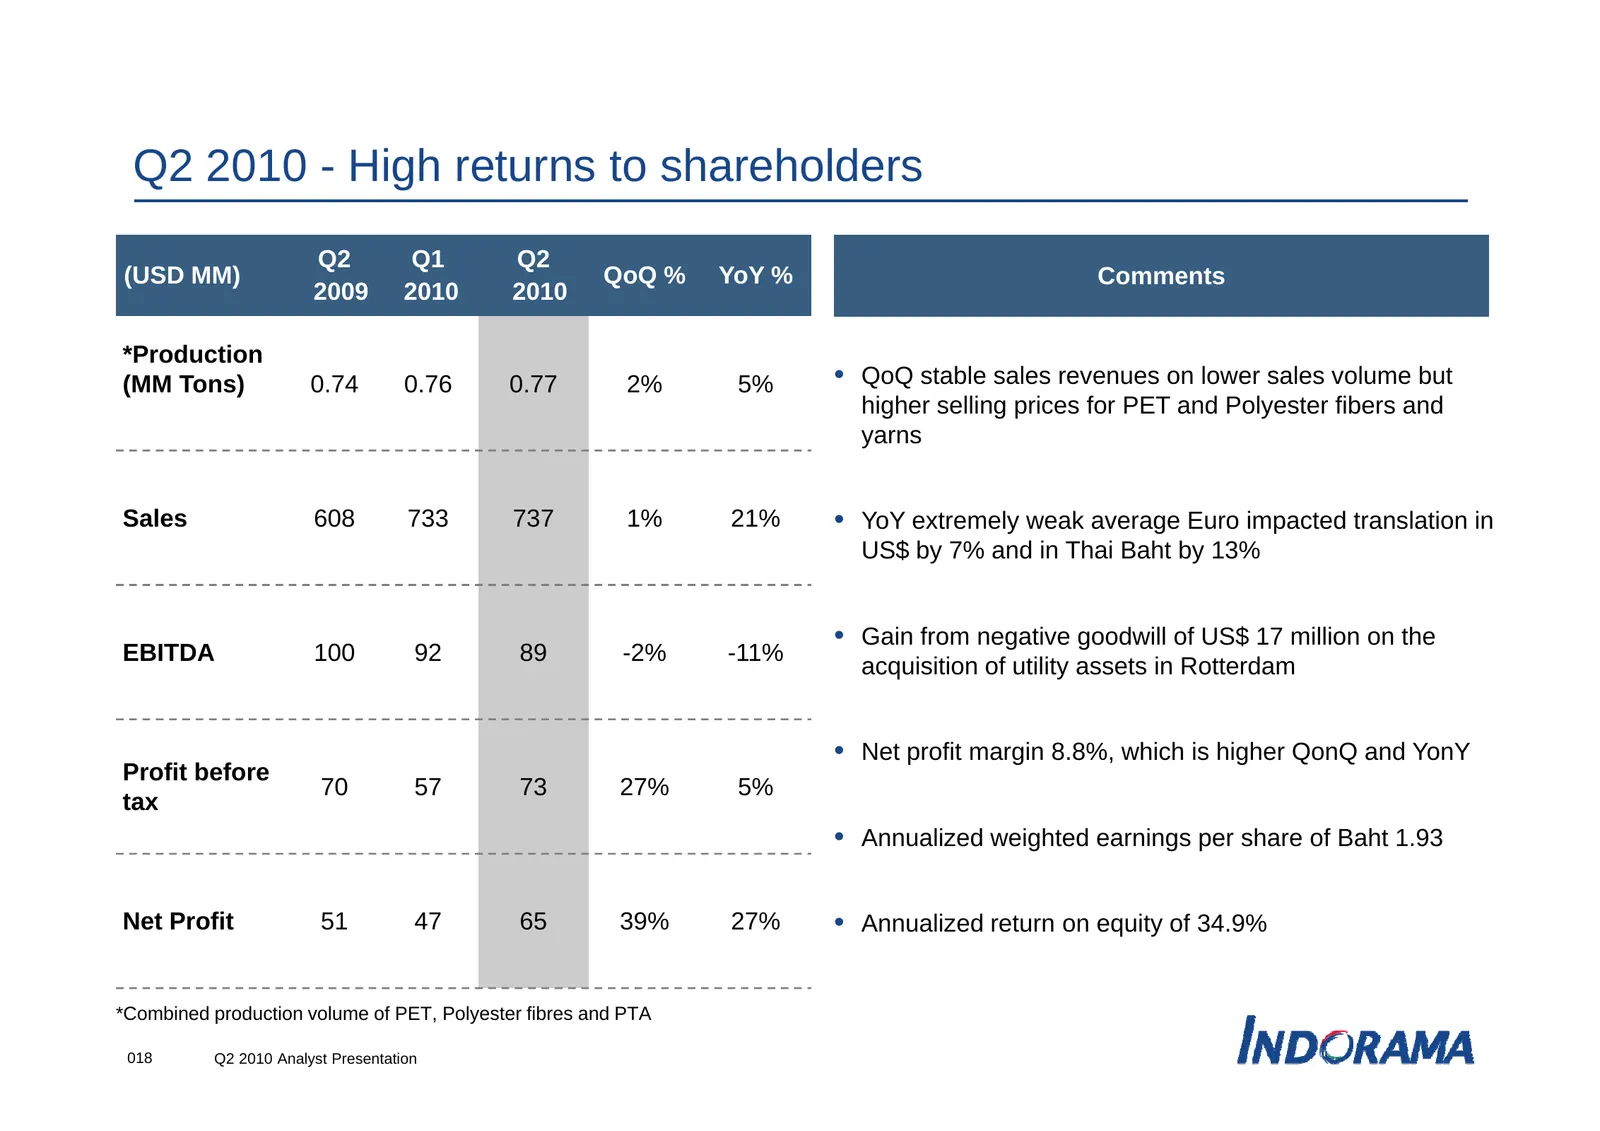
Q2 2010 - High returns to shareholders Q2 Q1 Q2 (USD MM) QoQ % YoY % Comments 2009 2010 2010 *Production (MM Tons) 0.74 0.76 0.77 2% 5% • QoQ stable sales revenues on lower sales volume but higher selling prices for PET and Polyester fibers and yarns Sales 608 733 737 1% 21% • YoY extremely weak ave
Slide 19: PTA: Impact from sharp fall in PX prices in 2Q 2010
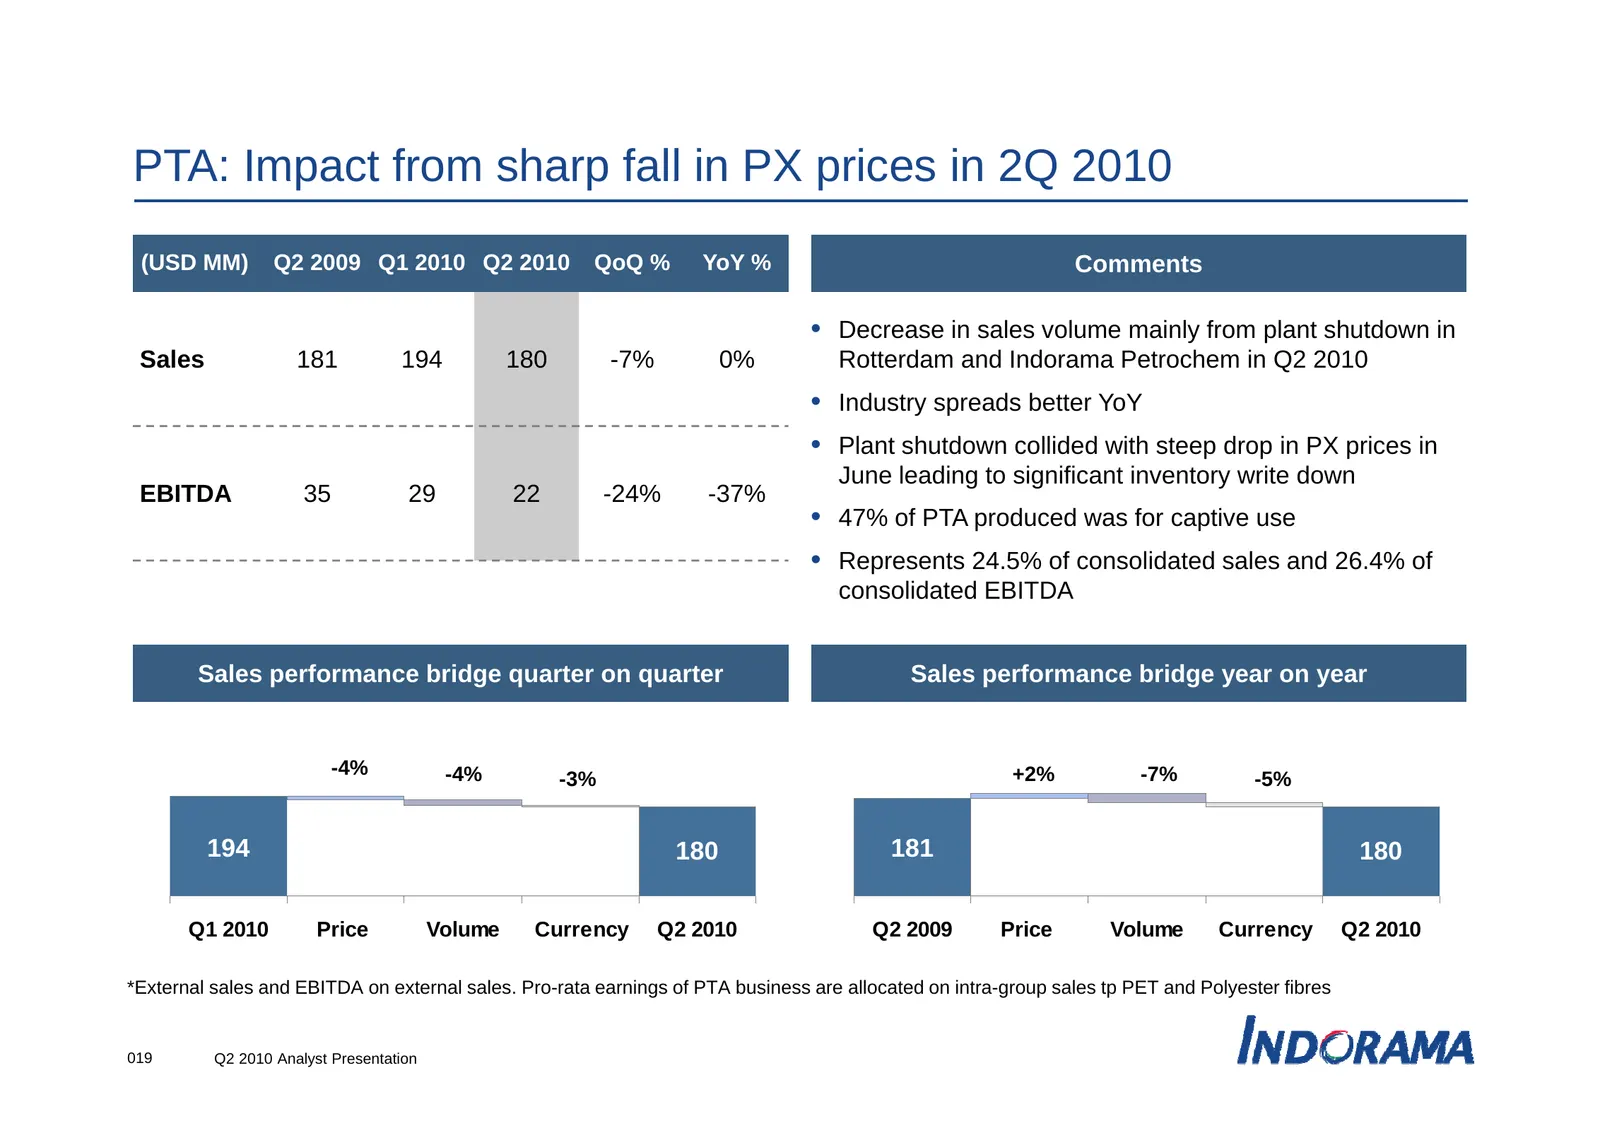
PTA: Impact from sharp fall in PX prices in 2Q 2010 (USD MM) Q2 2009 Q1 2010 Q2 2010 QoQ % YoY % Comments • Decrease in sales volume mainly from plant shutdown in Sales 181 194 180 -7% 0% Rotterdam and Indorama Petrochem in Q2 2010 • Industry spreads better YoY • Plant Pl t shutdown h td collided ll
Slide 20: PET Polymers: Margin improvement in Q2
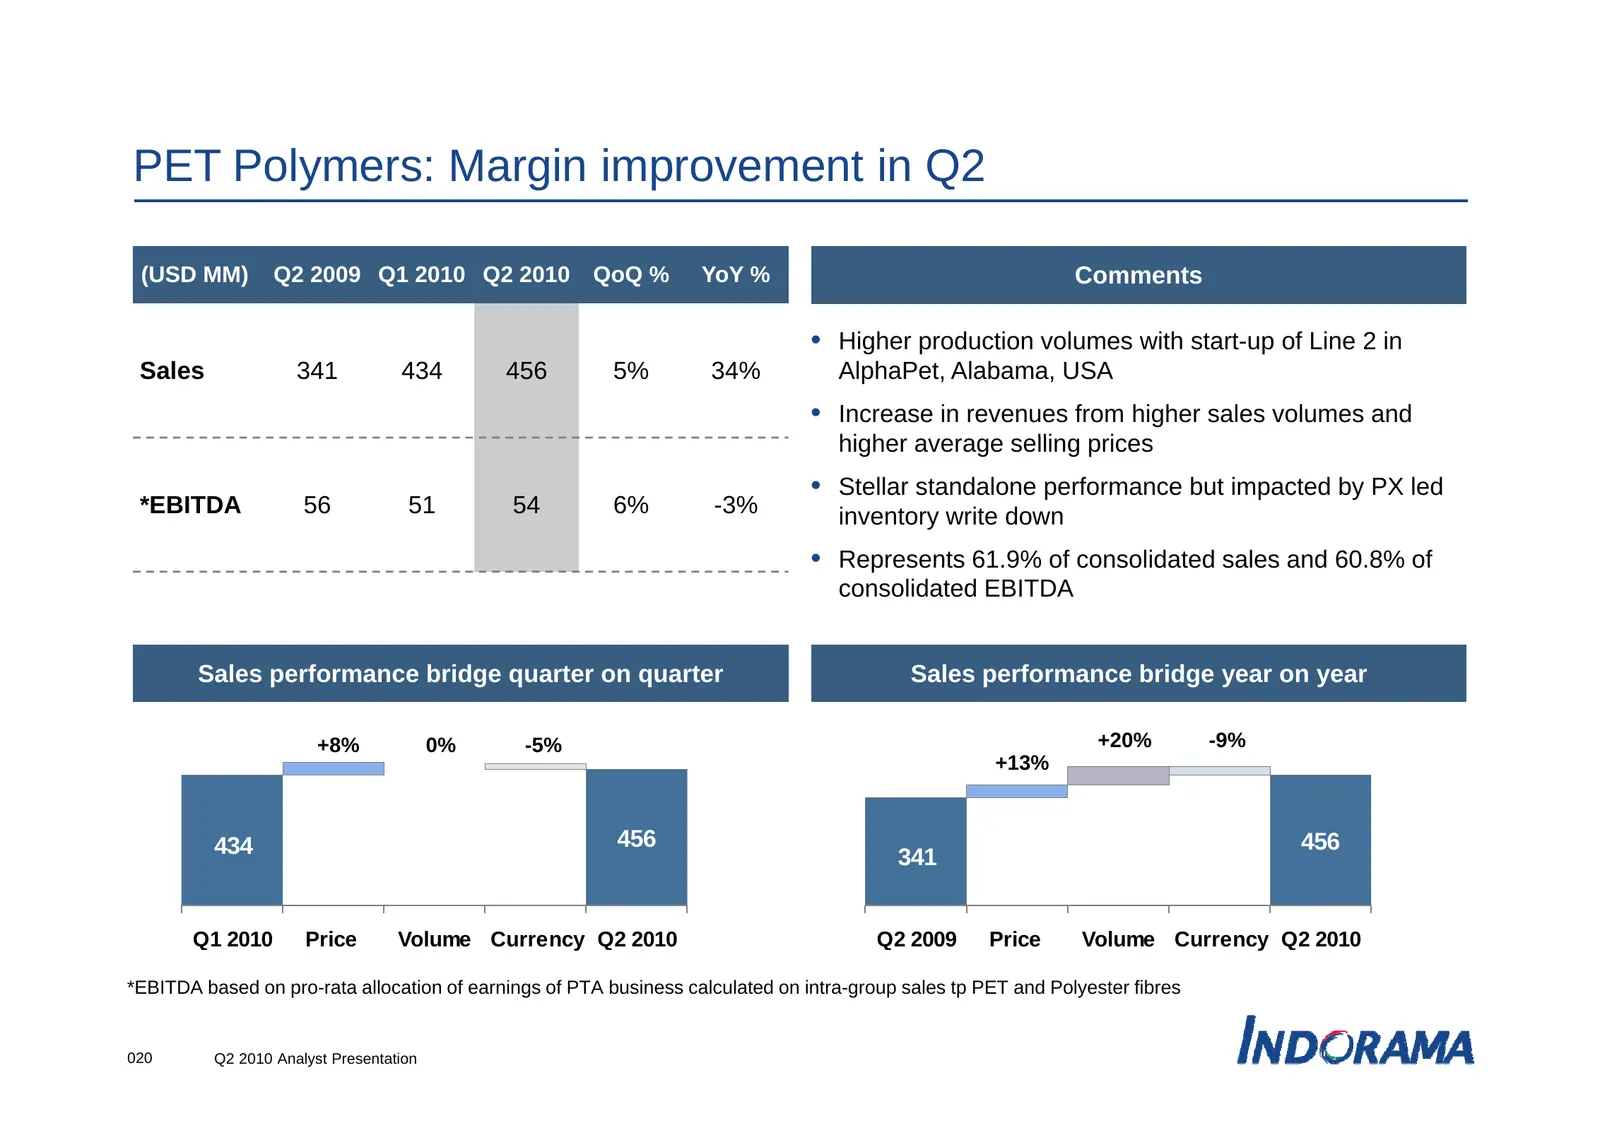
PET Polymers: Margin improvement in Q2 (USD MM) Q2 2009 Q1 2010 Q2 2010 QoQ % YoY % Comments • Higher production volumes with start-up of Line 2 in Sales 341 434 456 5% 34% AlphaPet, Alabama, USA • Increase in revenues from higher sales volumes and hi h average selling higher lli prices i • Stellar
Slide 21: Polyester Fibers & Wool: Positive earnings momentum
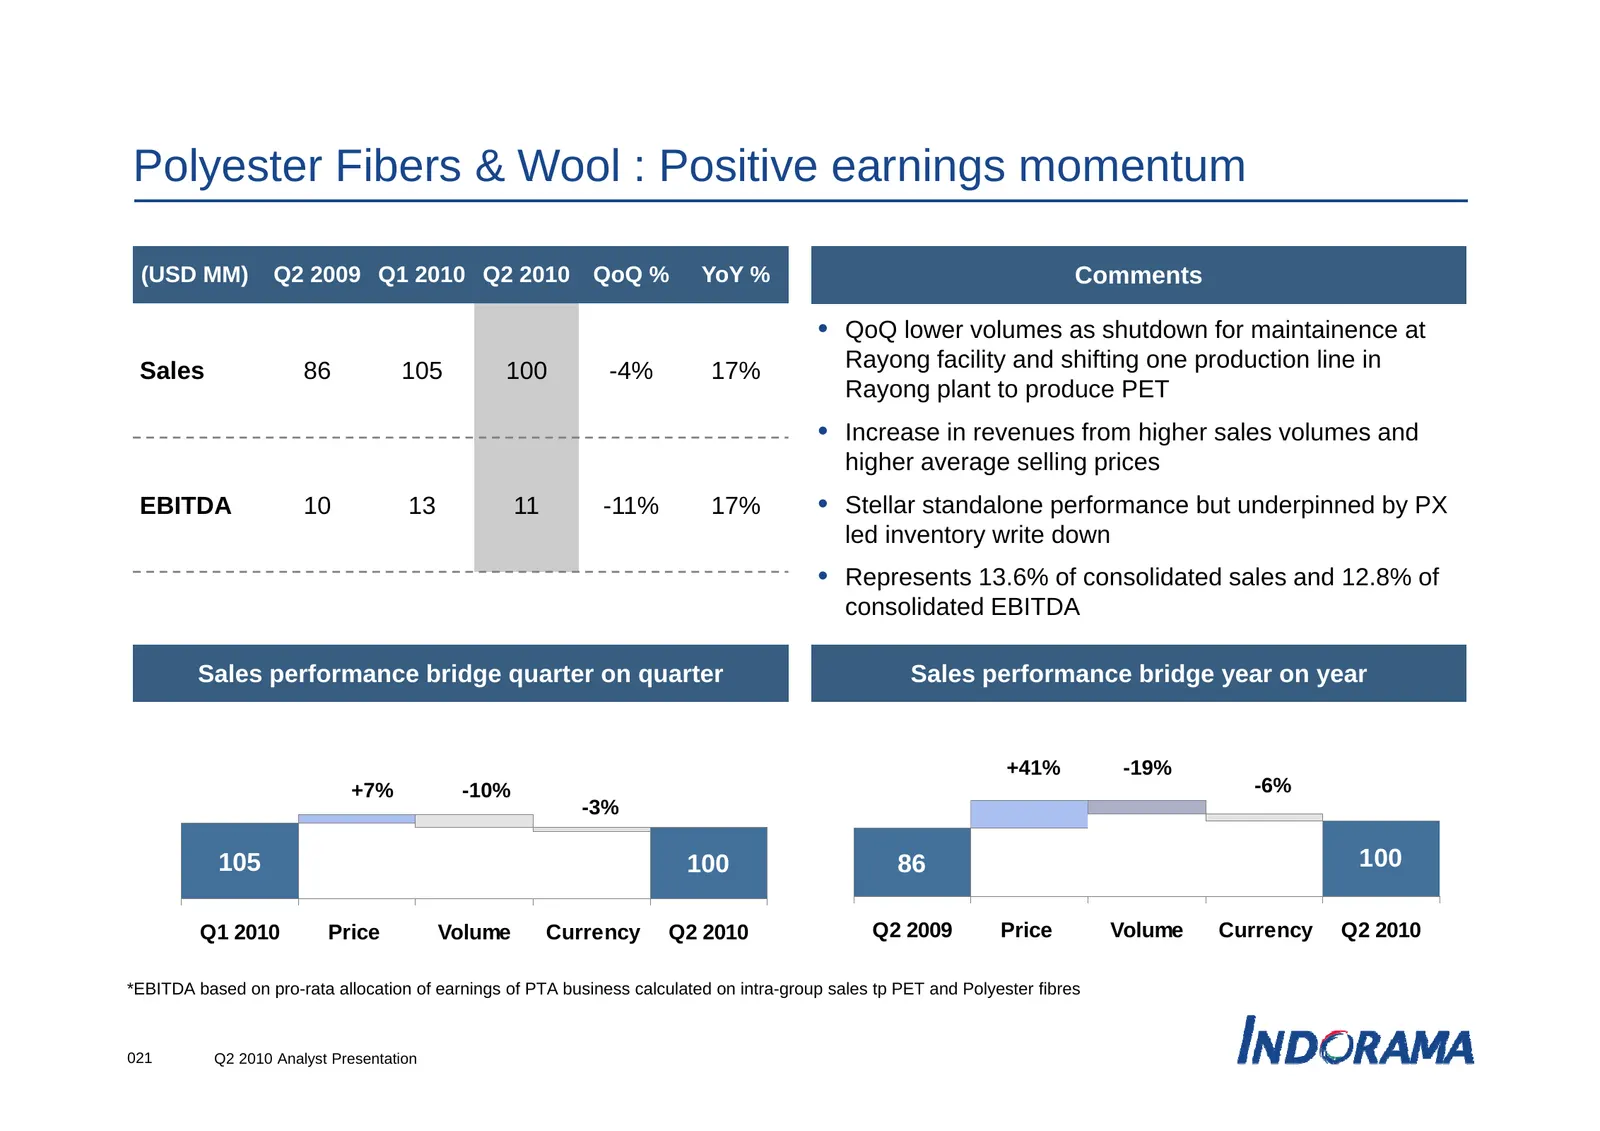
Polyester Fibers & Wool : Positive earnings momentum (USD MM) Q2 2009 Q1 2010 Q2 2010 QoQ % YoY % Comments • QoQ lower volumes as shutdown for maintainence at Sales 86 105 100 -4% 17% Rayong facility and shifting one production line in Rayong plant to produce PET • Increase in revenues from higher s
Slide 22: Reduced net debt
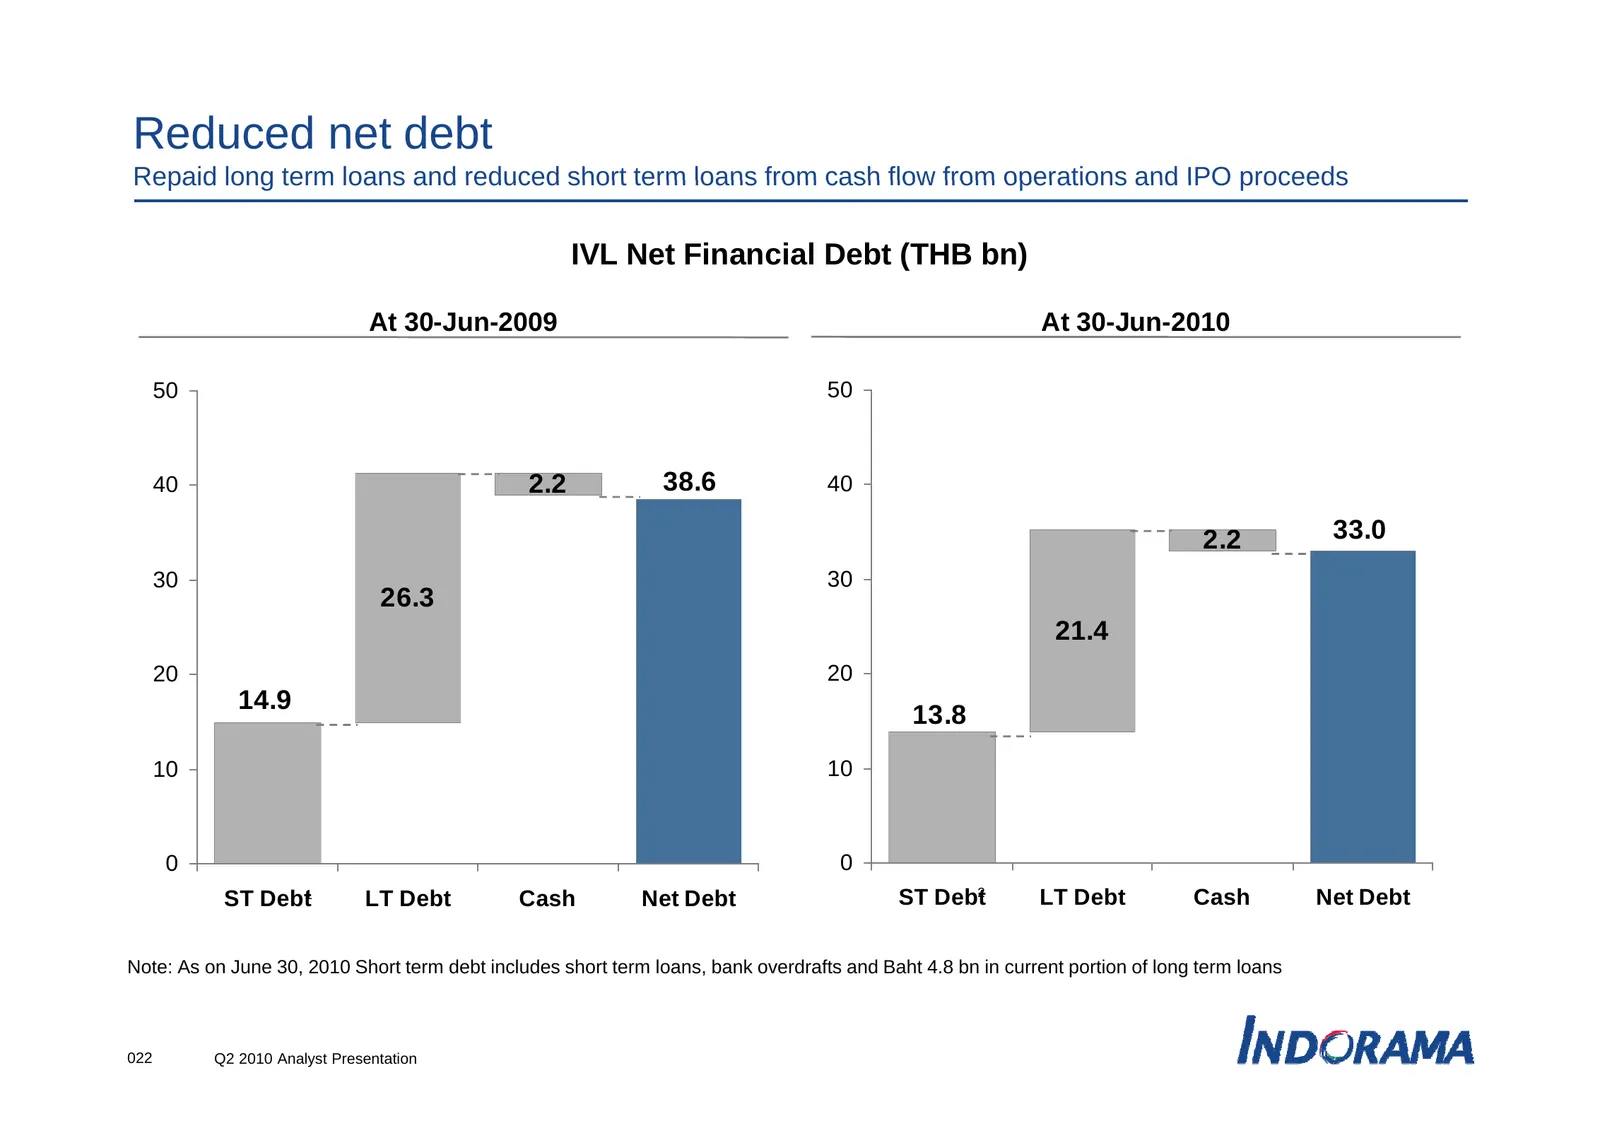
Reduced net debt Repaid long term loans and reduced short term loans from cash flow from operations and IPO proceeds IVL Net Financial Debt (THB bn) At 30-Jun-2009 At 30-Jun-2010 50 50 40 2.2 38.6 40 2.2 33.0 30 30 26.3 21.4 20 20 14 9 14.9 13.8 10 10 0 0 ST Debt1 LT Debt Cash Net Debt ST Debt2 LT D
Slide 23: De-leverage, prepared for growth
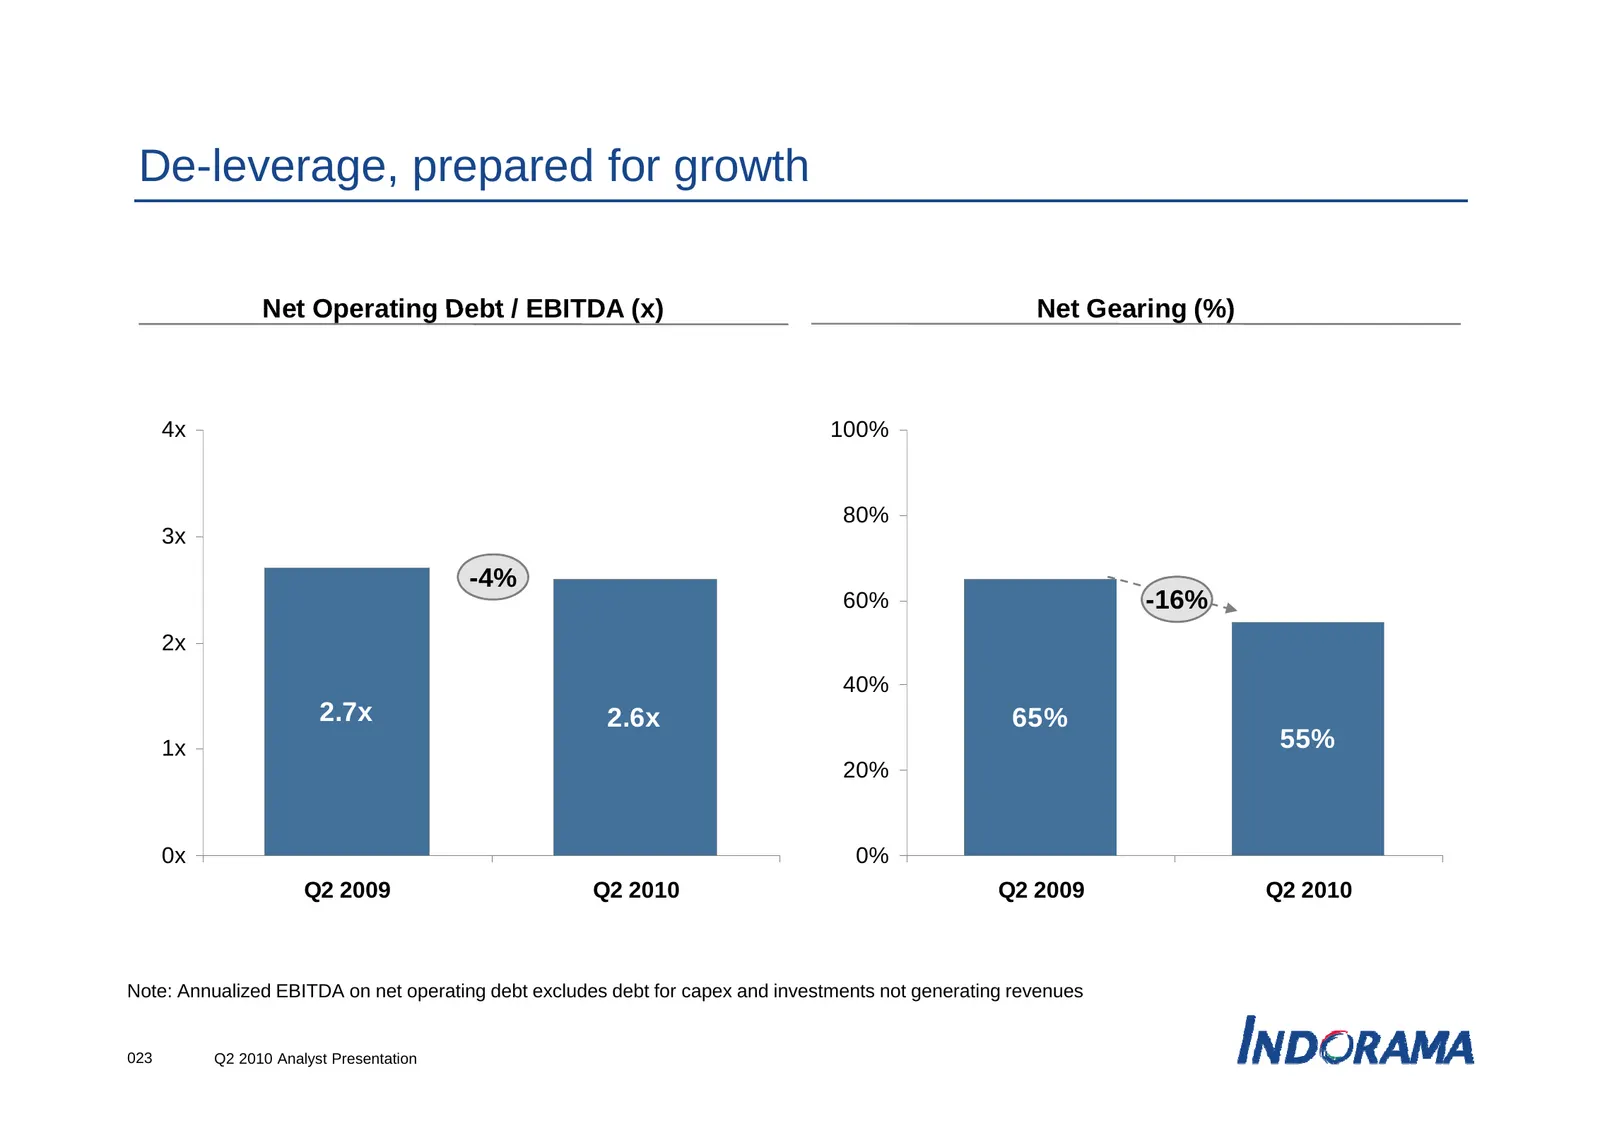
De-leverage, De leverage, prepared for growth Net Operating Debt / EBITDA (x) Net Gearing (%) 4x 100% 80% 3x -4% 60% - % -16% 2x 40% 2.7x 2.6x 65% 1x 55% 20% 0x 0% Q2 2009 Q2 2010 Q2 2009 Q2 2010 Note: Annualized EBITDA on net operating debt excludes debt for capex and investments not generating rev
Slide 24: Stable cashflow from operations despite strong Baht
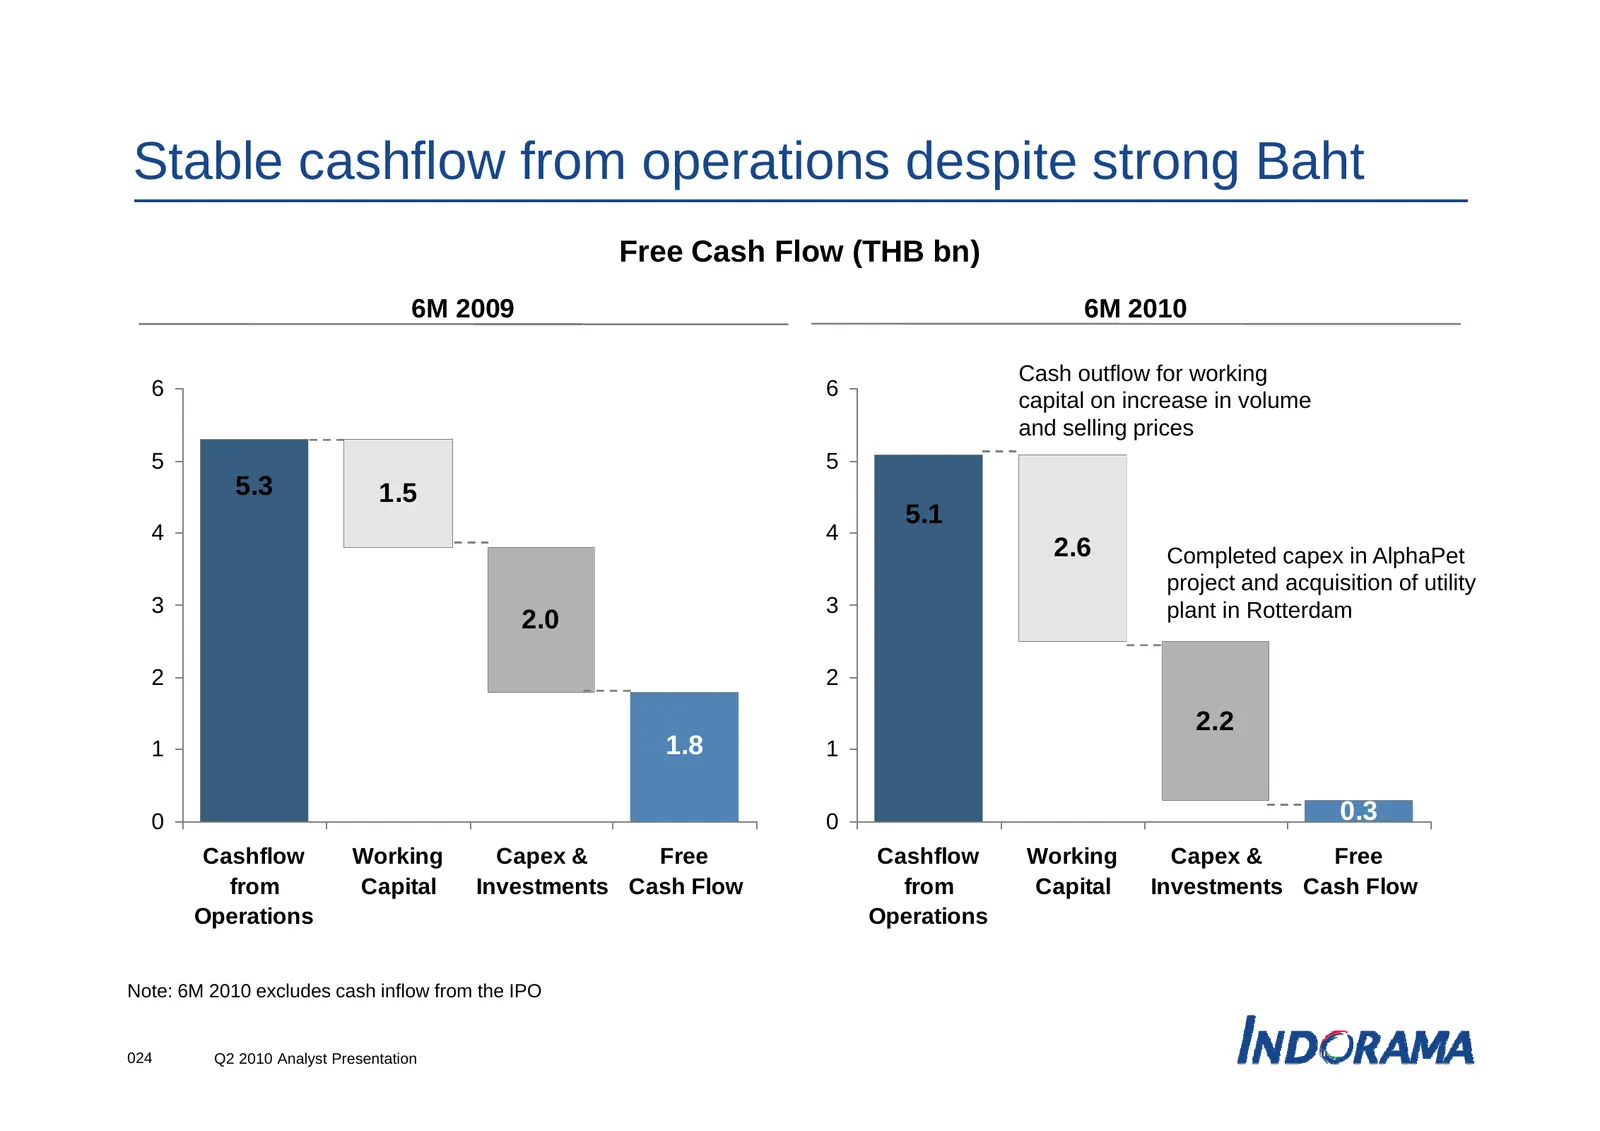
Stable cashflow from operations p despite p strong g Baht Free Cash Flow (THB bn) 6M 2009 6M 2010 Cash outflow for working 6 6 capital on increase in volume and selling gpprices 5 5 5.3 1.5 5.1 4 4 2.6 Completed p capex p in AlphaPet p project and acquisition of utility 3 3 plant in Rotterdam 2.0 2
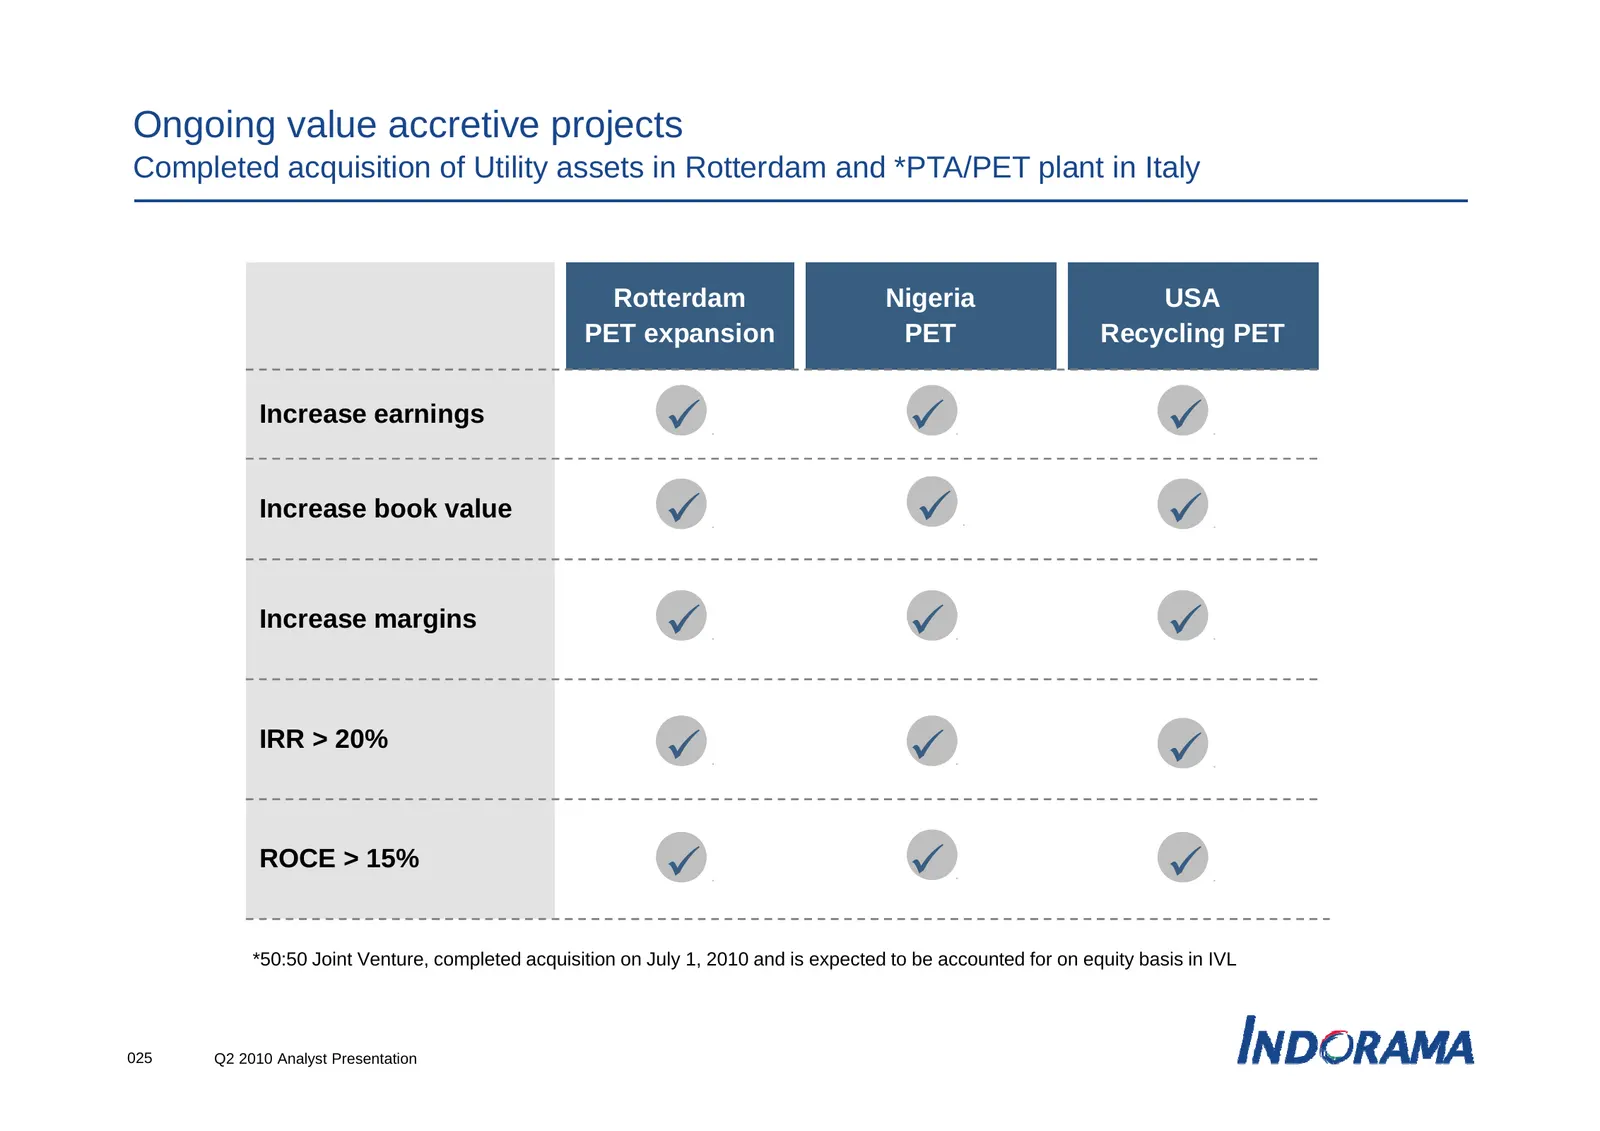
Slide 25: Ongoing value accretive projects
Ongoing value accretive projects Completed p acquisition q of Utility y assets in Rotterdam and *PTA/PET p plant in Italy y Rotterdam Nigeria g USA PET expansion PET Recycling PET Increase earnings 9 . 9 . 9 . Increase book value 9 . 9 . 9 . Increase margins 9 . 9 . 9 . IRR > 20% 9 . 9 . 9 . ROCE >
Slide 26: Agenda
Agenda • Aspiration 2014 • Fi Financial i l results lt Q2 2010 and d 6M 2010 • Outlook 026 Q2 2010 Analyst Presentation
Slide 27: In a league of our own……….
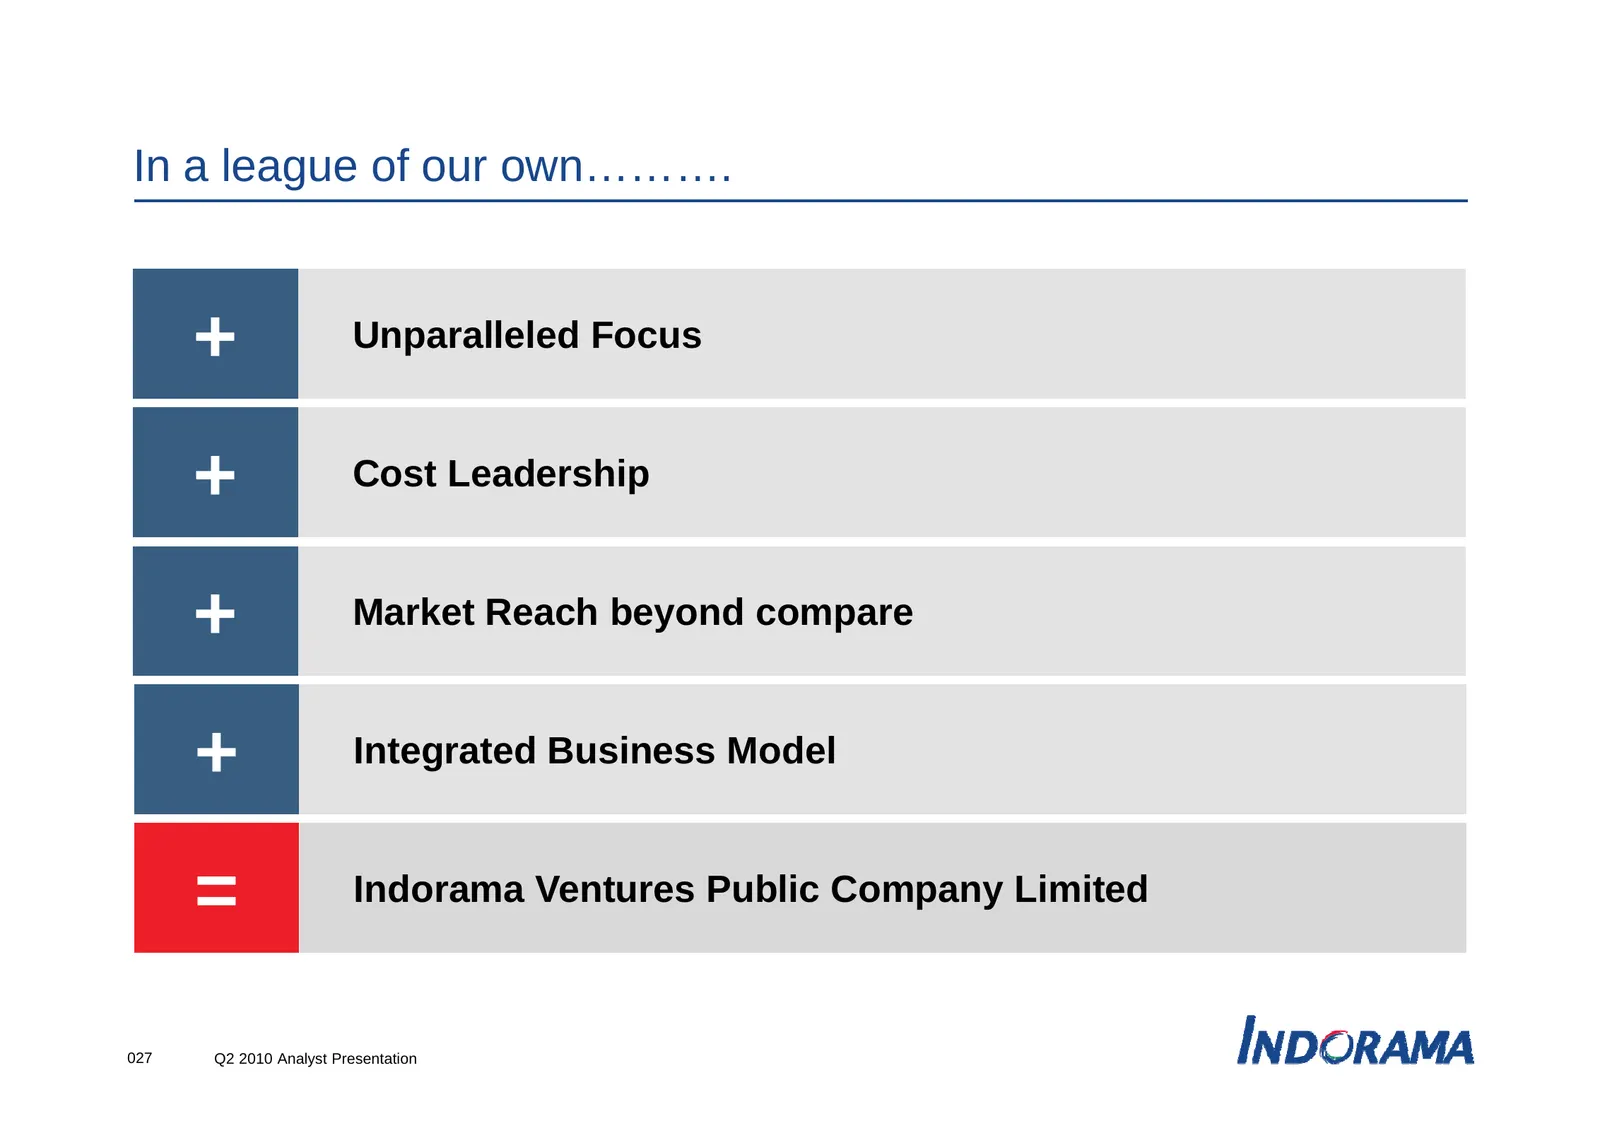
In a league of our own………. + Unparalleled Focus + Cost Leadership + Market Reach beyond compare + Integrated Business Model = Indorama Ventures Public Company Limited 027 Q2 2010 Analyst Presentation
Slide 28: IVL : Q3 Outlook
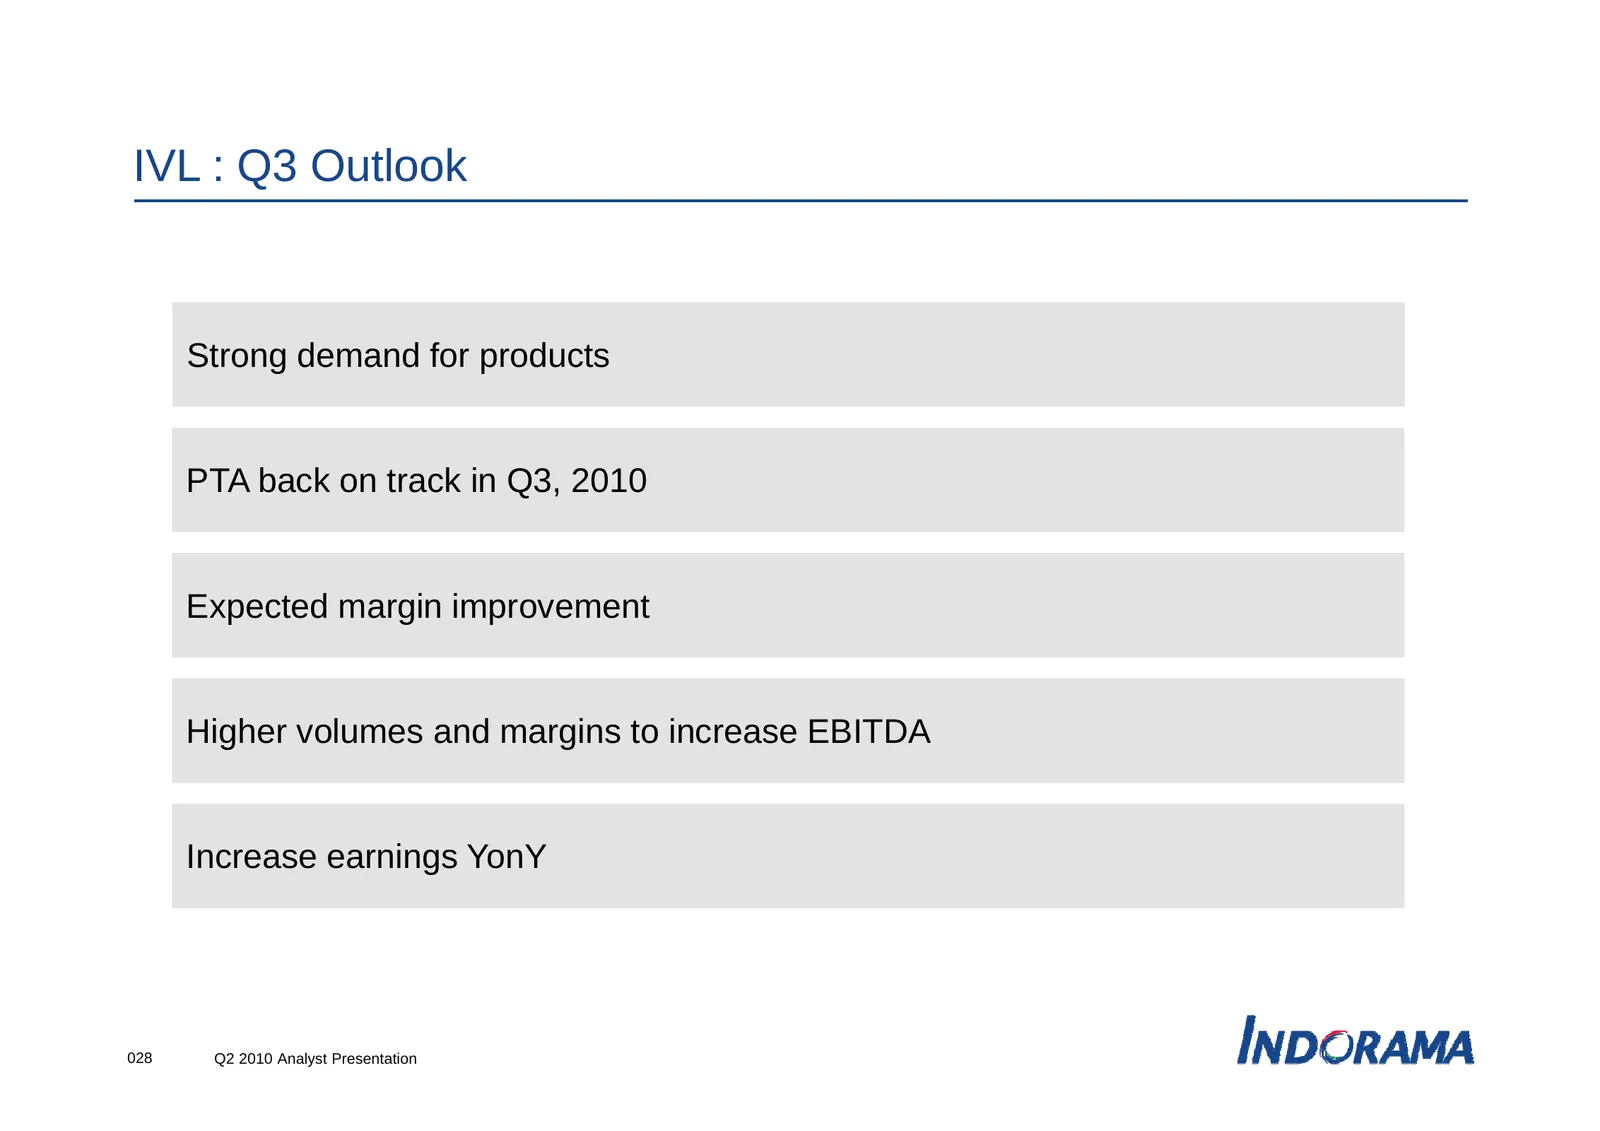
IVL : Q3 Outlook Strong demand for products PTA back on track in Q3, 2010 Expected margin improvement Higher volumes and margins to increase EBITDA Increase earnings YonY 028 Q2 2010 Analyst Presentation
Slide 29: Q&A
Q&A Visit our o r website ebsite www.indoramaventures.com 029 Q2 2010 Analyst Presentation
Source: Internet Archive copy of indoramaventures.com
More decks from Indorama Ventures Public Co. Ltd.
 Q2 2026 Earnings Presentation18 slides · Aug 11, 2026
 Q3 2025 Earnings Presentation21 slides · Nov 15, 2025
 Q2 2025 Earnings Presentation18 slides · Aug 23, 2025
 Q1 2025 Earnings Presentation17 slides · May 10, 2025
 Technical Presentation (March 2025)11 slides · March 2025
 FY2024 Earnings Presentation25 slides · Feb 27, 2025