UBS Group AG · SIX:UBSG
UBS — Q1 2024 Earnings Presentation
32 slides from UBS's earnings presentation, May 7, 2024
Slide 1: Form 6-K
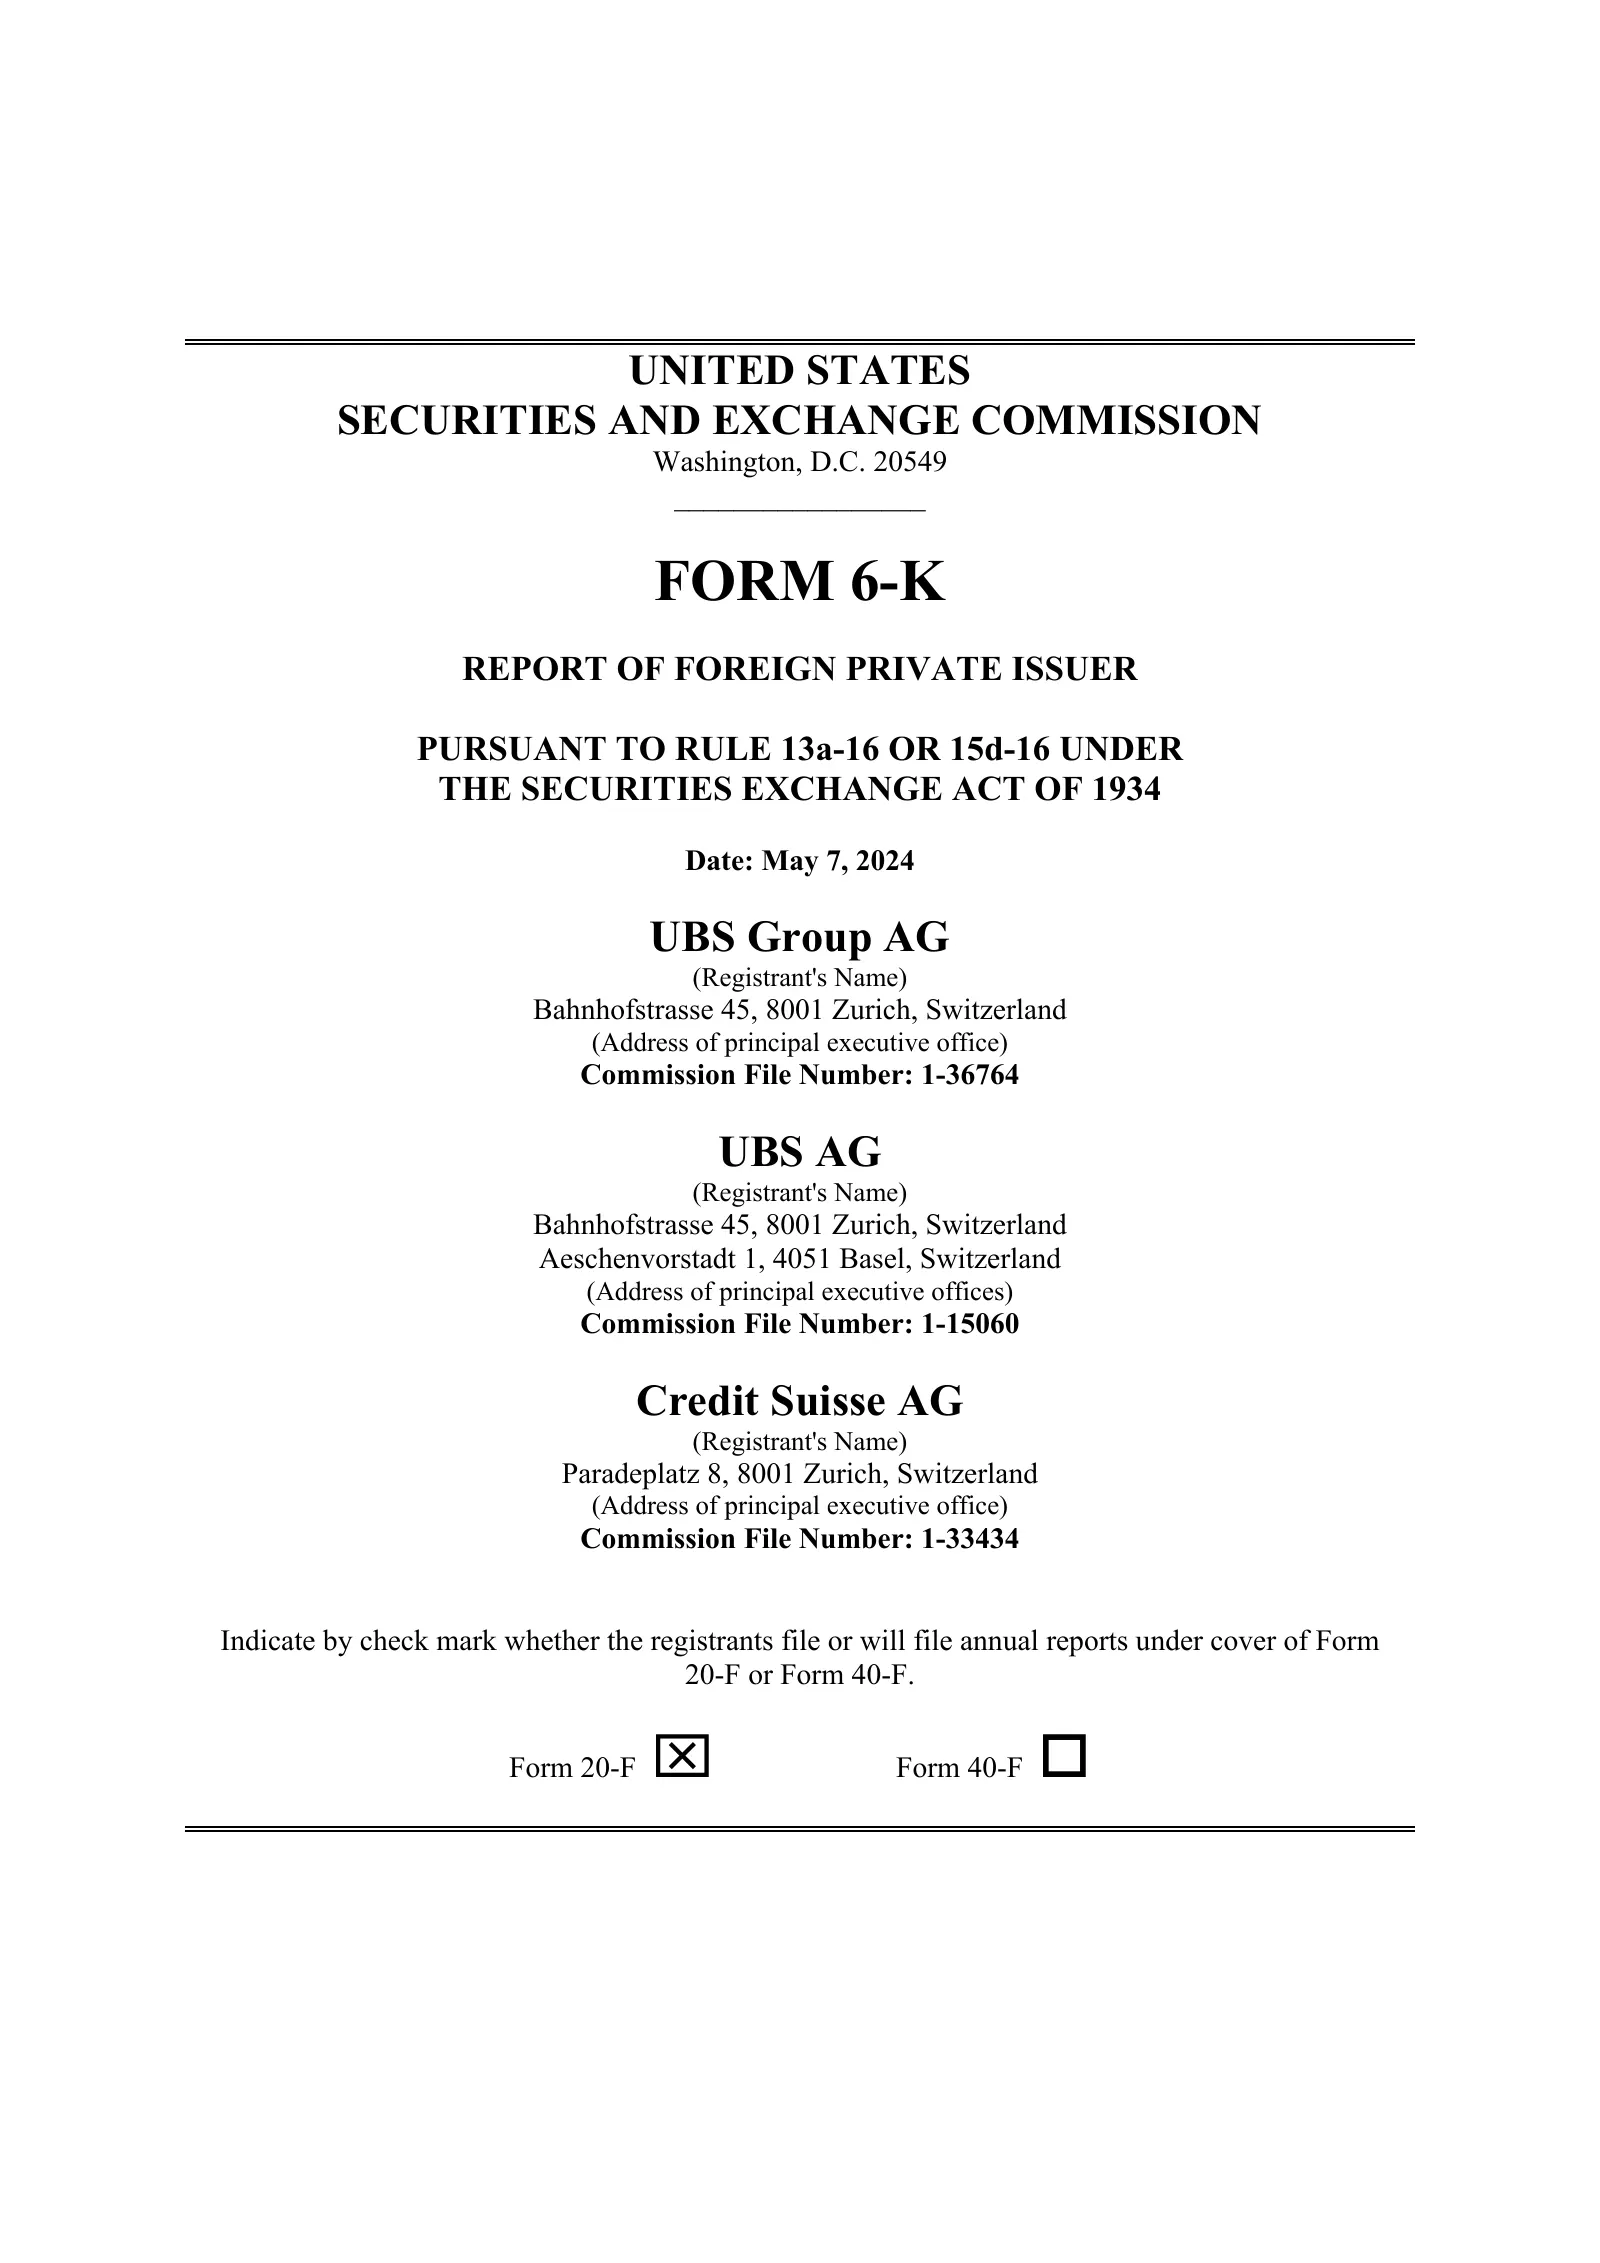
UNITED STATES SECURITIES AND EXCHANGE COMMISSION Washington, D.C. 20549 _________________ FORM 6-K REPORT OF FOREIGN PRIVATE ISSUER PURSUANT TO RULE 13a-16 OR 15d-16 UNDER THE SECURITIES EXCHANGE ACT OF 1934 Date: May 7, 2024 UBS Group AG (Registrant's Name) Bahnhofstrasse 45, 8001 Zurich, Switzerla

Slide 2: Form 6-K presentation materials note
This Form 6-K consists of the presentation materials related to the first quarter 2024 financial results of UBS, which appear immediately following this page.
Slide 3: First quarter 2024 Financial results
é UBS First quarter 2024 Financial results
Slide 4: Important information
Important information Looking nts: This contains that “Forward looking * incising but not limited to management's outiock for URS's financial performance, starements relating % the anticipated etecof ancien ond ta ios on URS Buss ond hae crore nd gil ot Hato wo achinn Co. ‘aasainabilty and other soc
Slide 5: Agenda
Agenda Key messages Sergio P. Ermotti, Group CEO UBS Financial performance Todd Tuckner, Group CFO Q&A
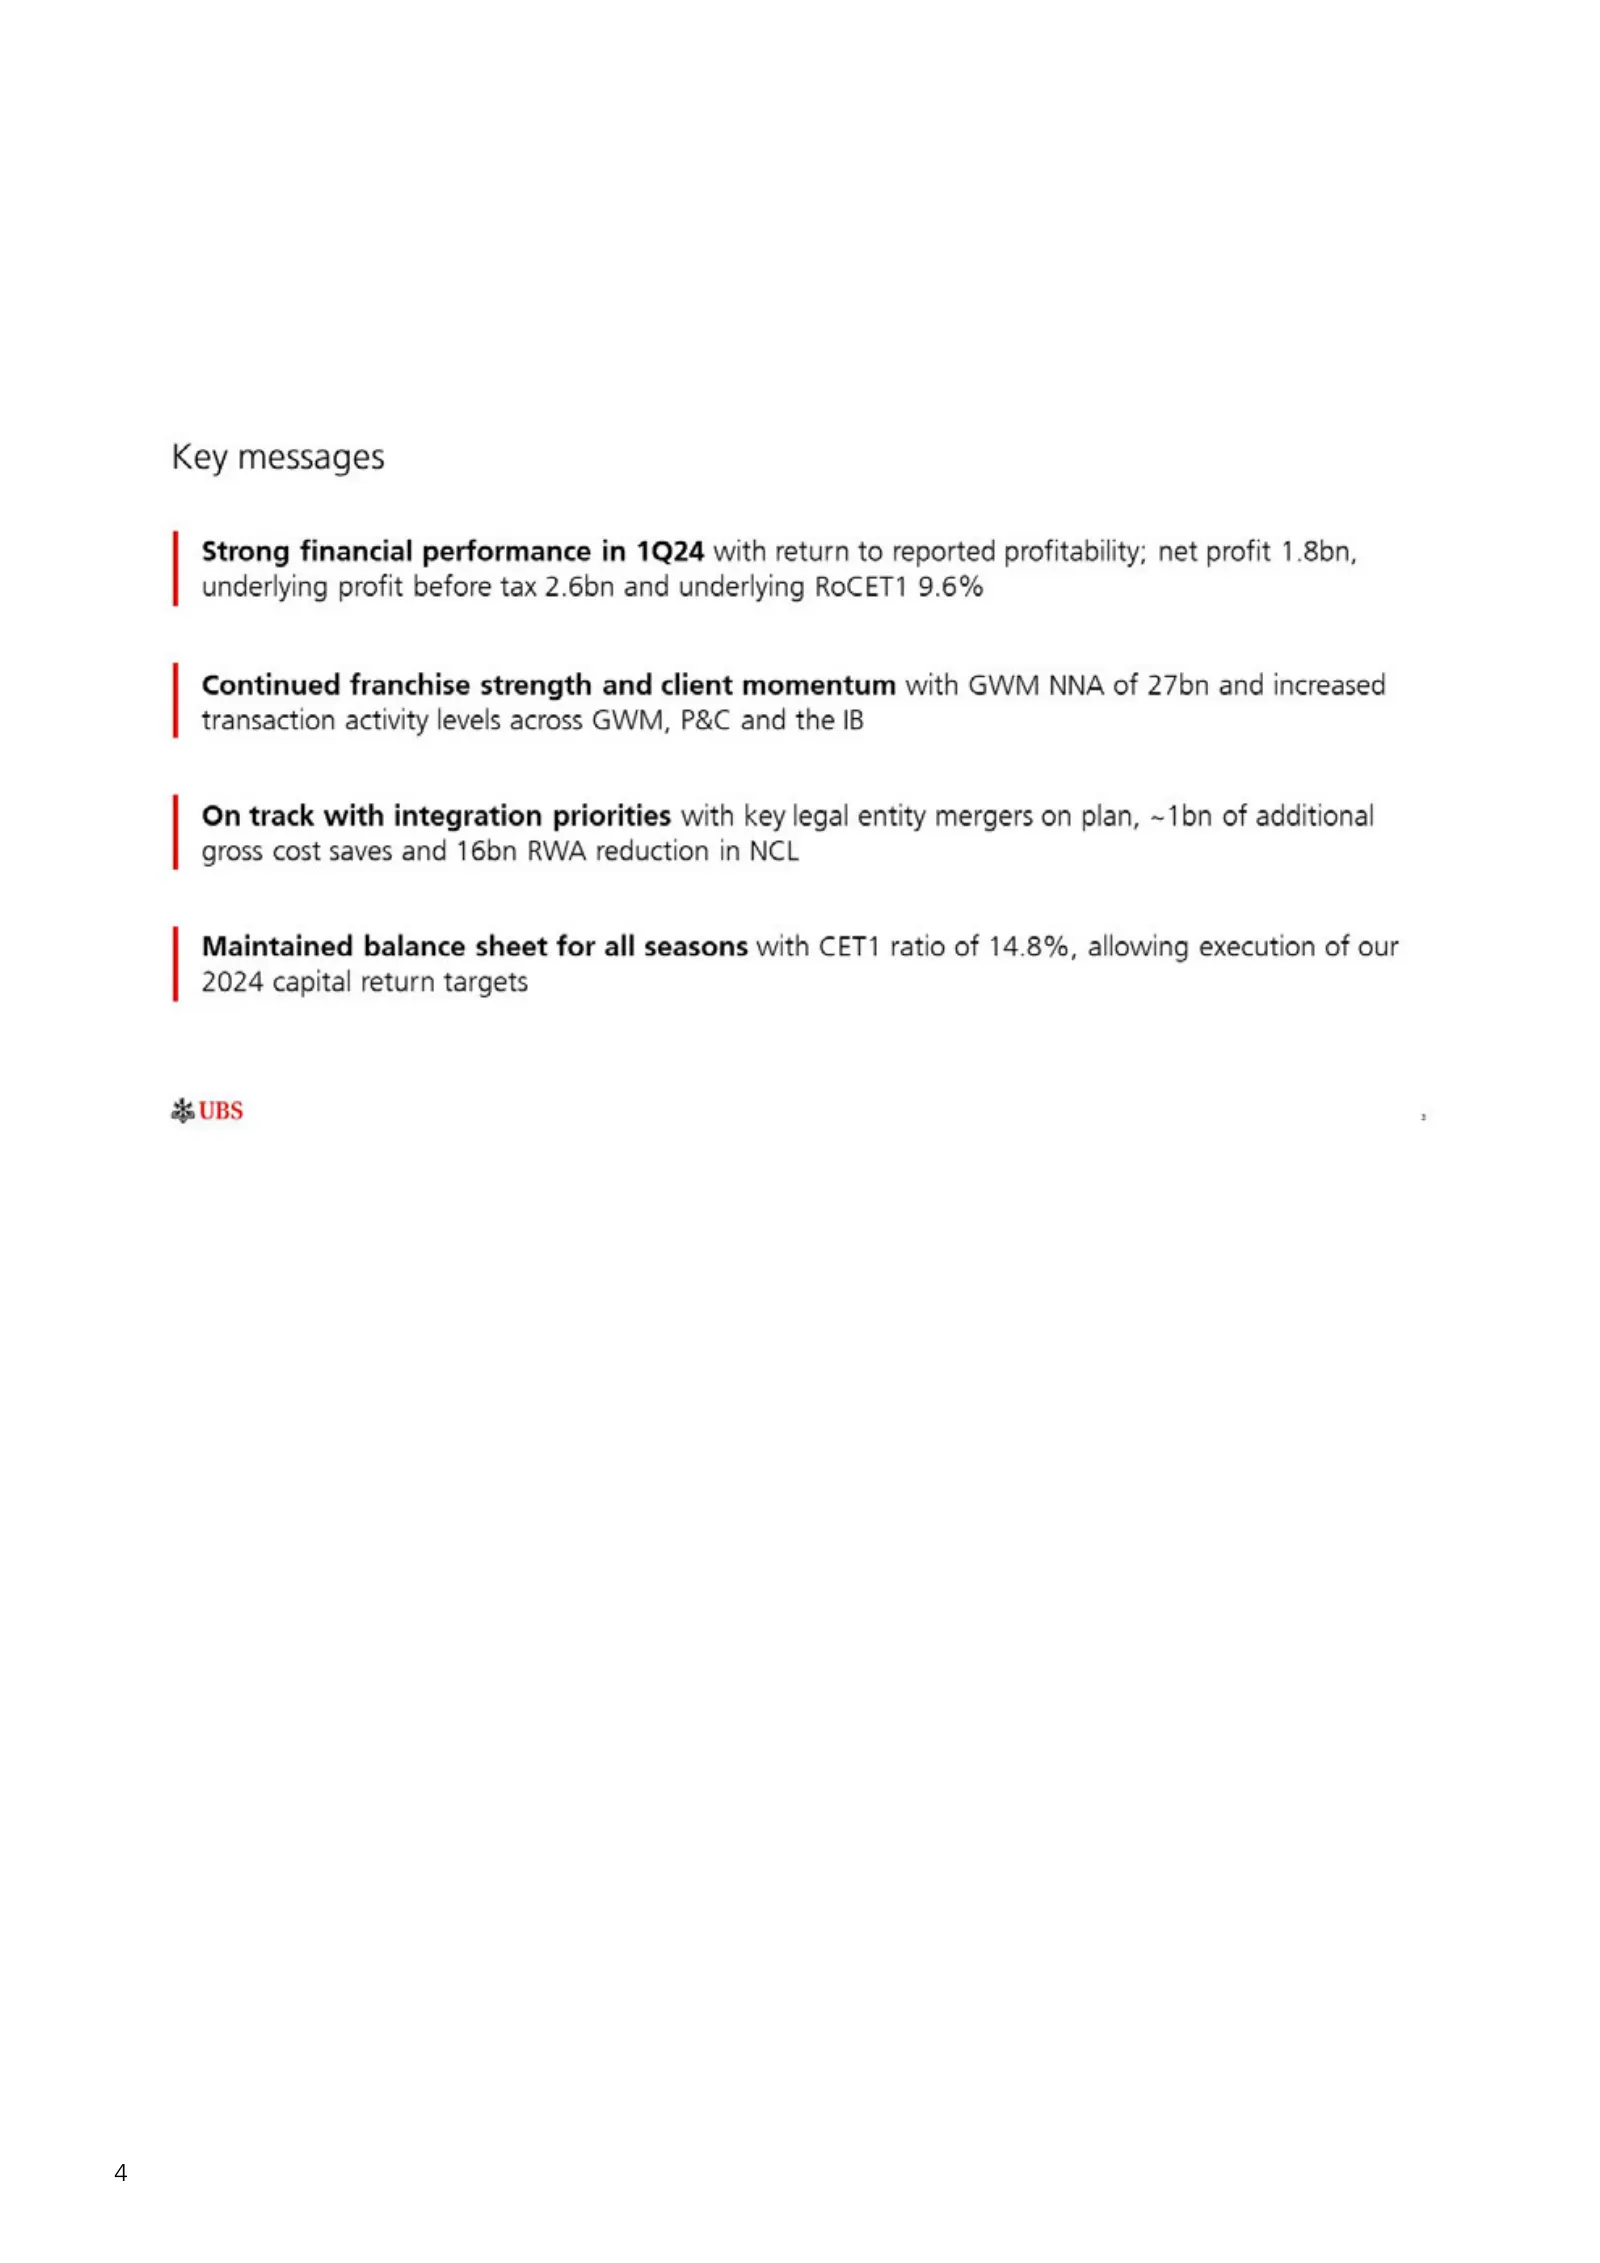
Slide 6: Key messages
Key messages Strong financial performance in 1Q24 with return to reported profitability; net profit 1.8bn, underlying profit before tax 2.6bn and underlying RoCET1 9.6% Continued franchise strength and client momentum with GWM NNA of 27bn and increased transaction activity levels across GWM, P&C and
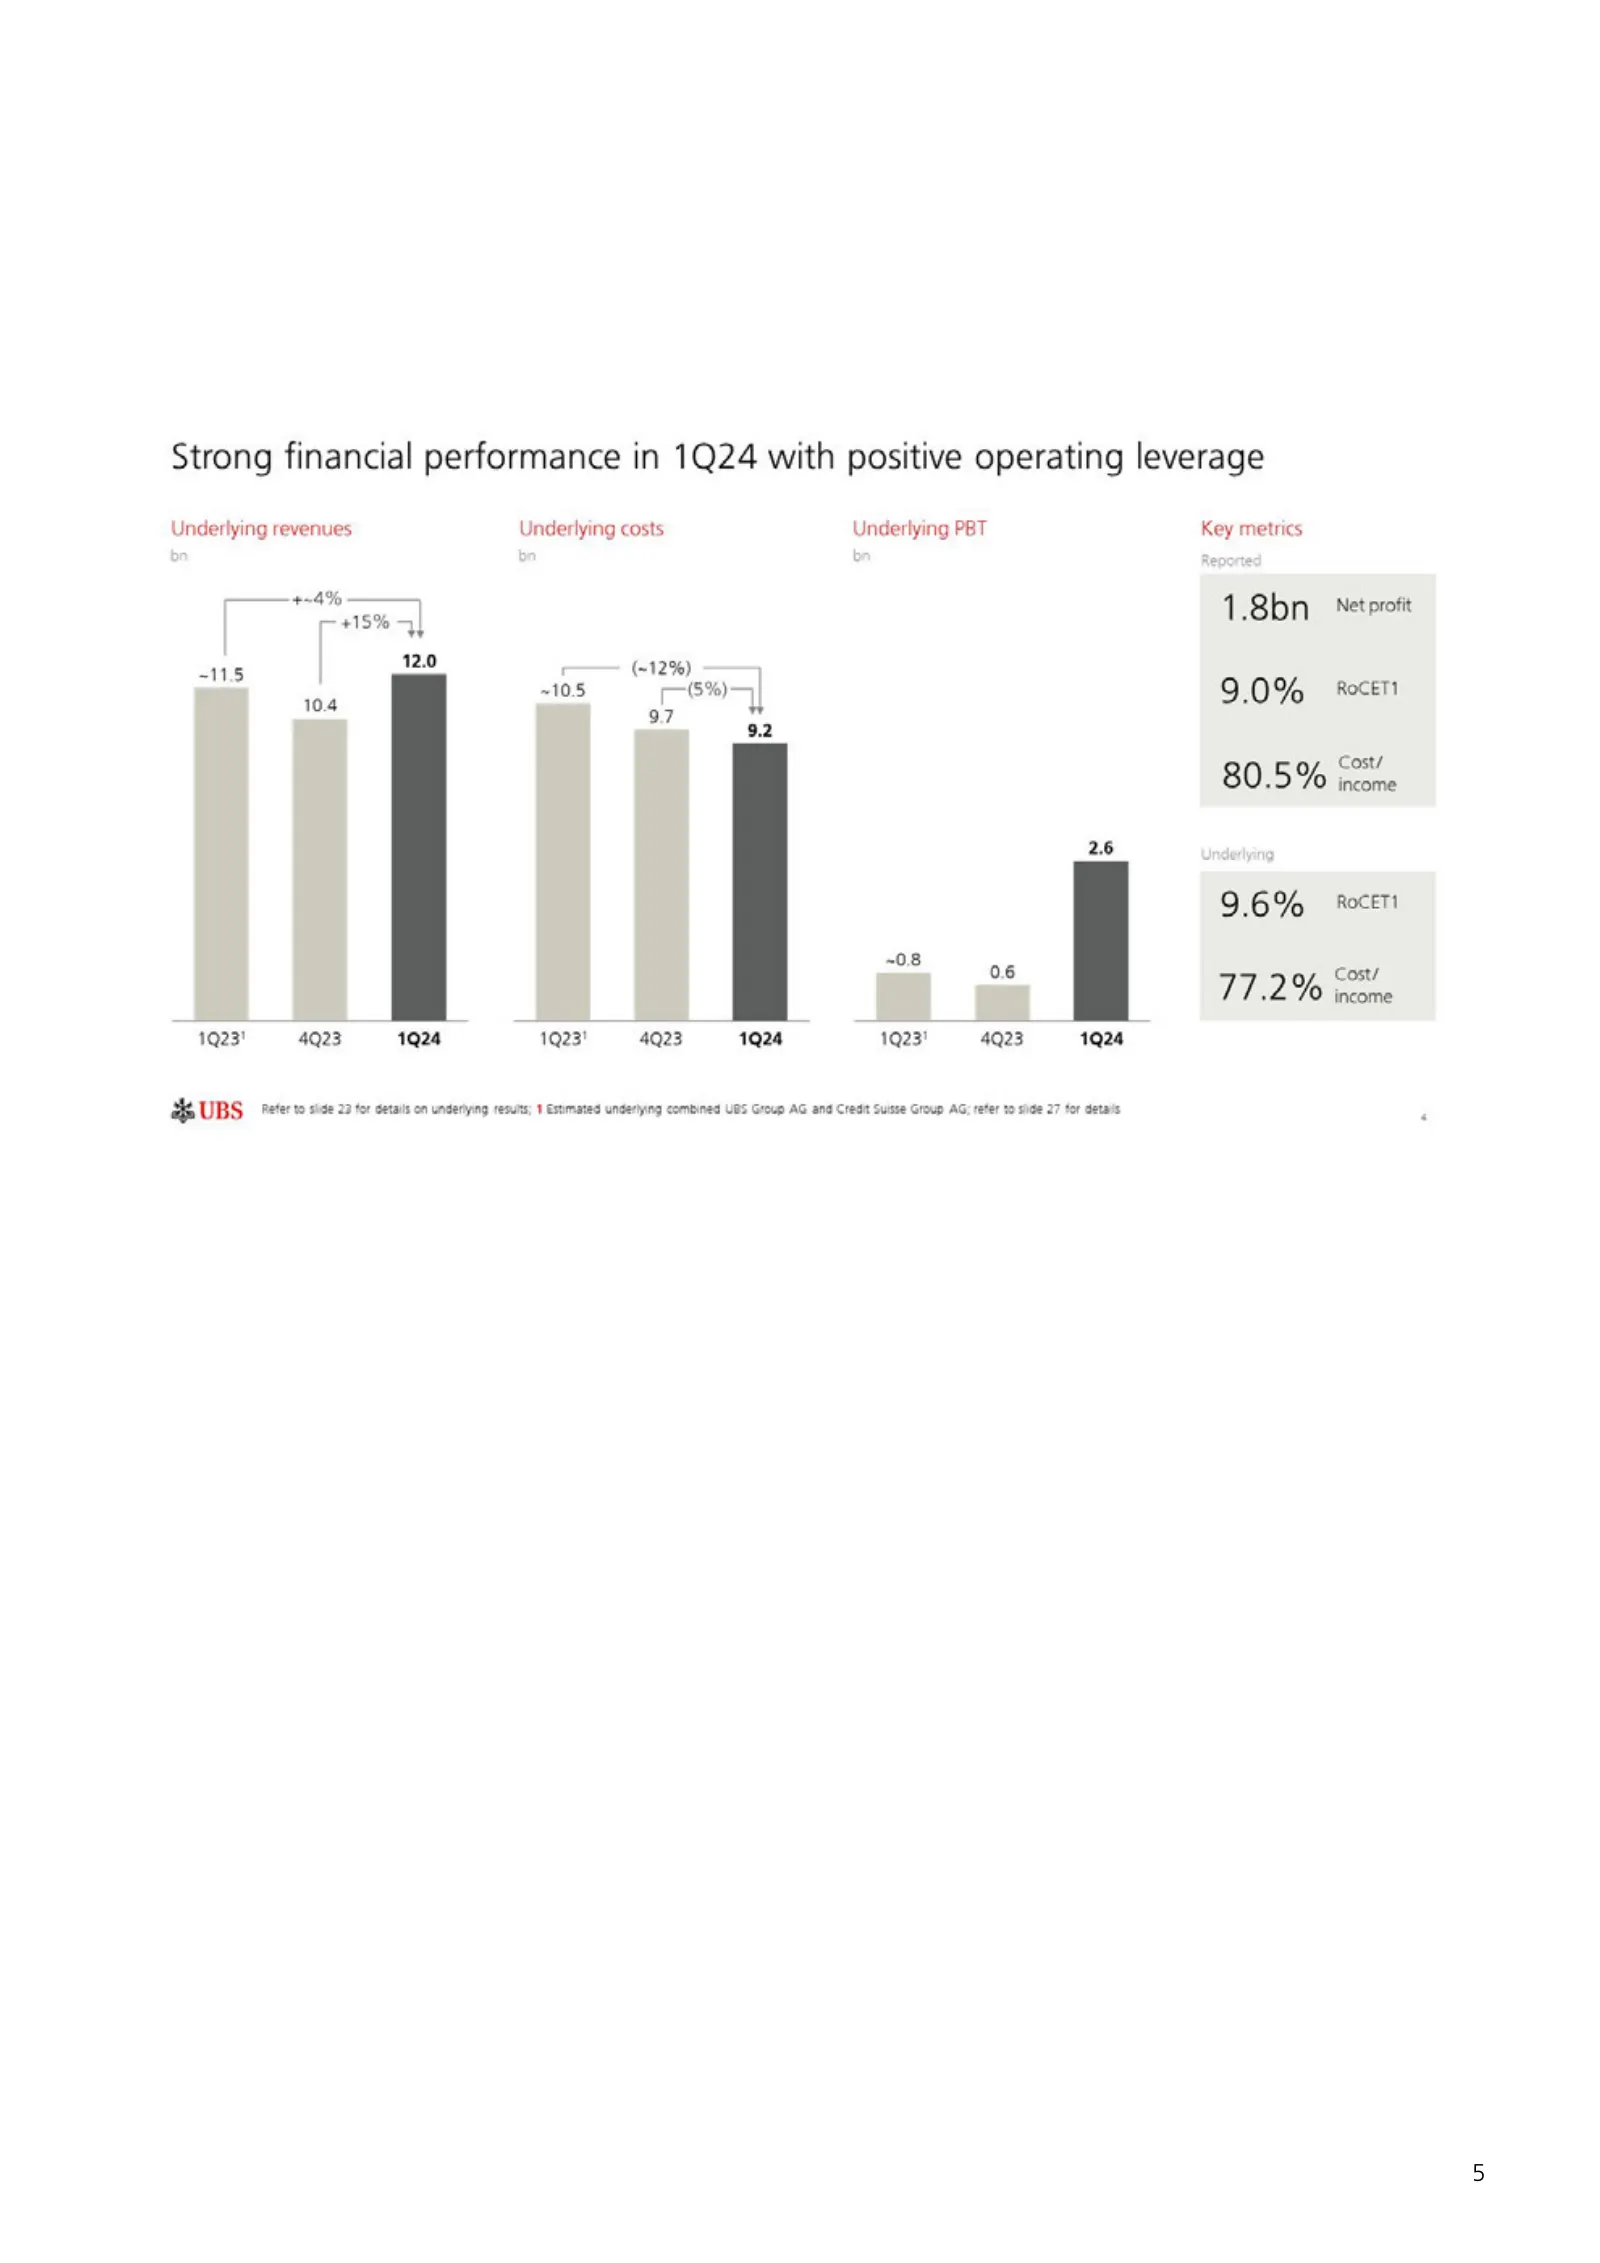
Slide 7: Strong financial performance in 1Q24 with positive operating leverage
Strong financial performance in 1Q24 with positive operating leverage Underlying revenues Underlying costs bn bn +-4% +15% yt “5 [ Lind — CMe) ~105 - 10.4 97 1Q23' 4Q23 1924 1Q23' 4Q23 Underlying PBT Key metrics bn Reported 1.8bn Netproft 9.0% _ Rocen 80.5% sone 2.6 Underlying 9.6% Rocert bad TOY 2
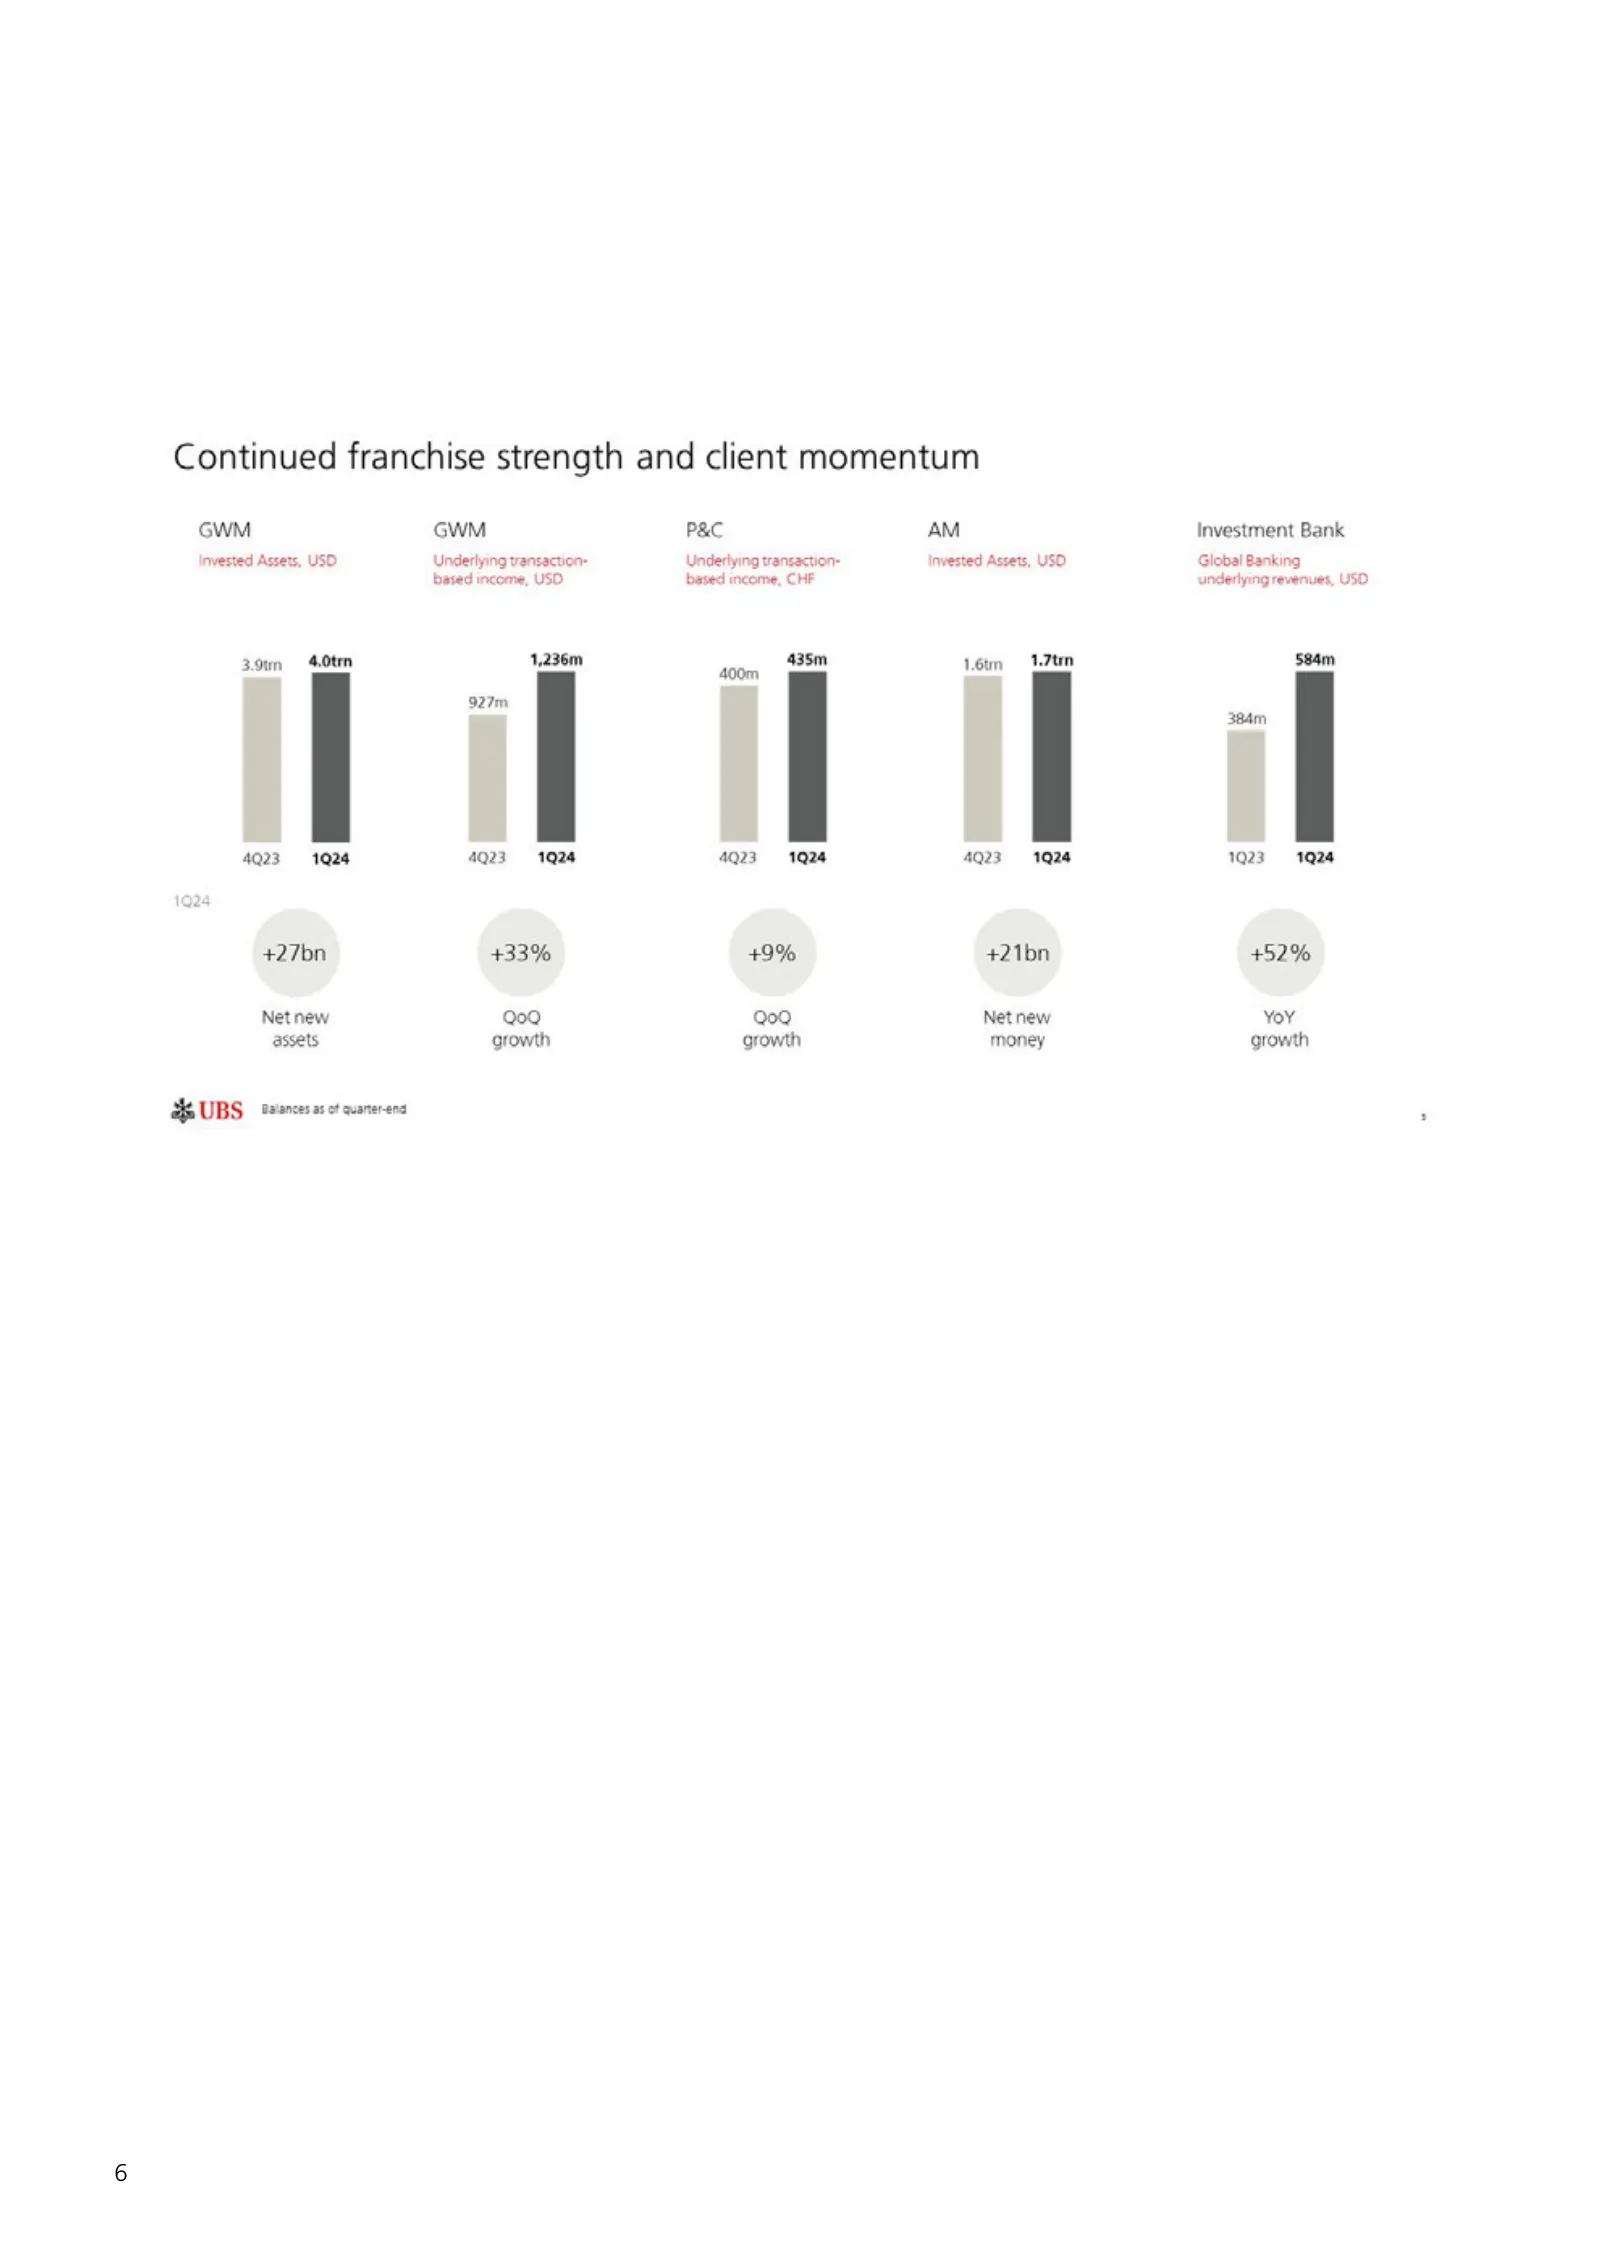
Slide 8: Continued franchise strength and client momentum
Continued franchise strength and client momentum GWM GWM invested Assets, USD Underlying transaction- based income, USD 3.90n 4.0ten 1,236m 4Q23 1924 4Q23 1924 +27bn +33% Net new Q00 assets growth SUBS taarces as ot quaner-ena P&C Underlying transaction- based income, CHF 435m | 4Q23 1924 AM investe
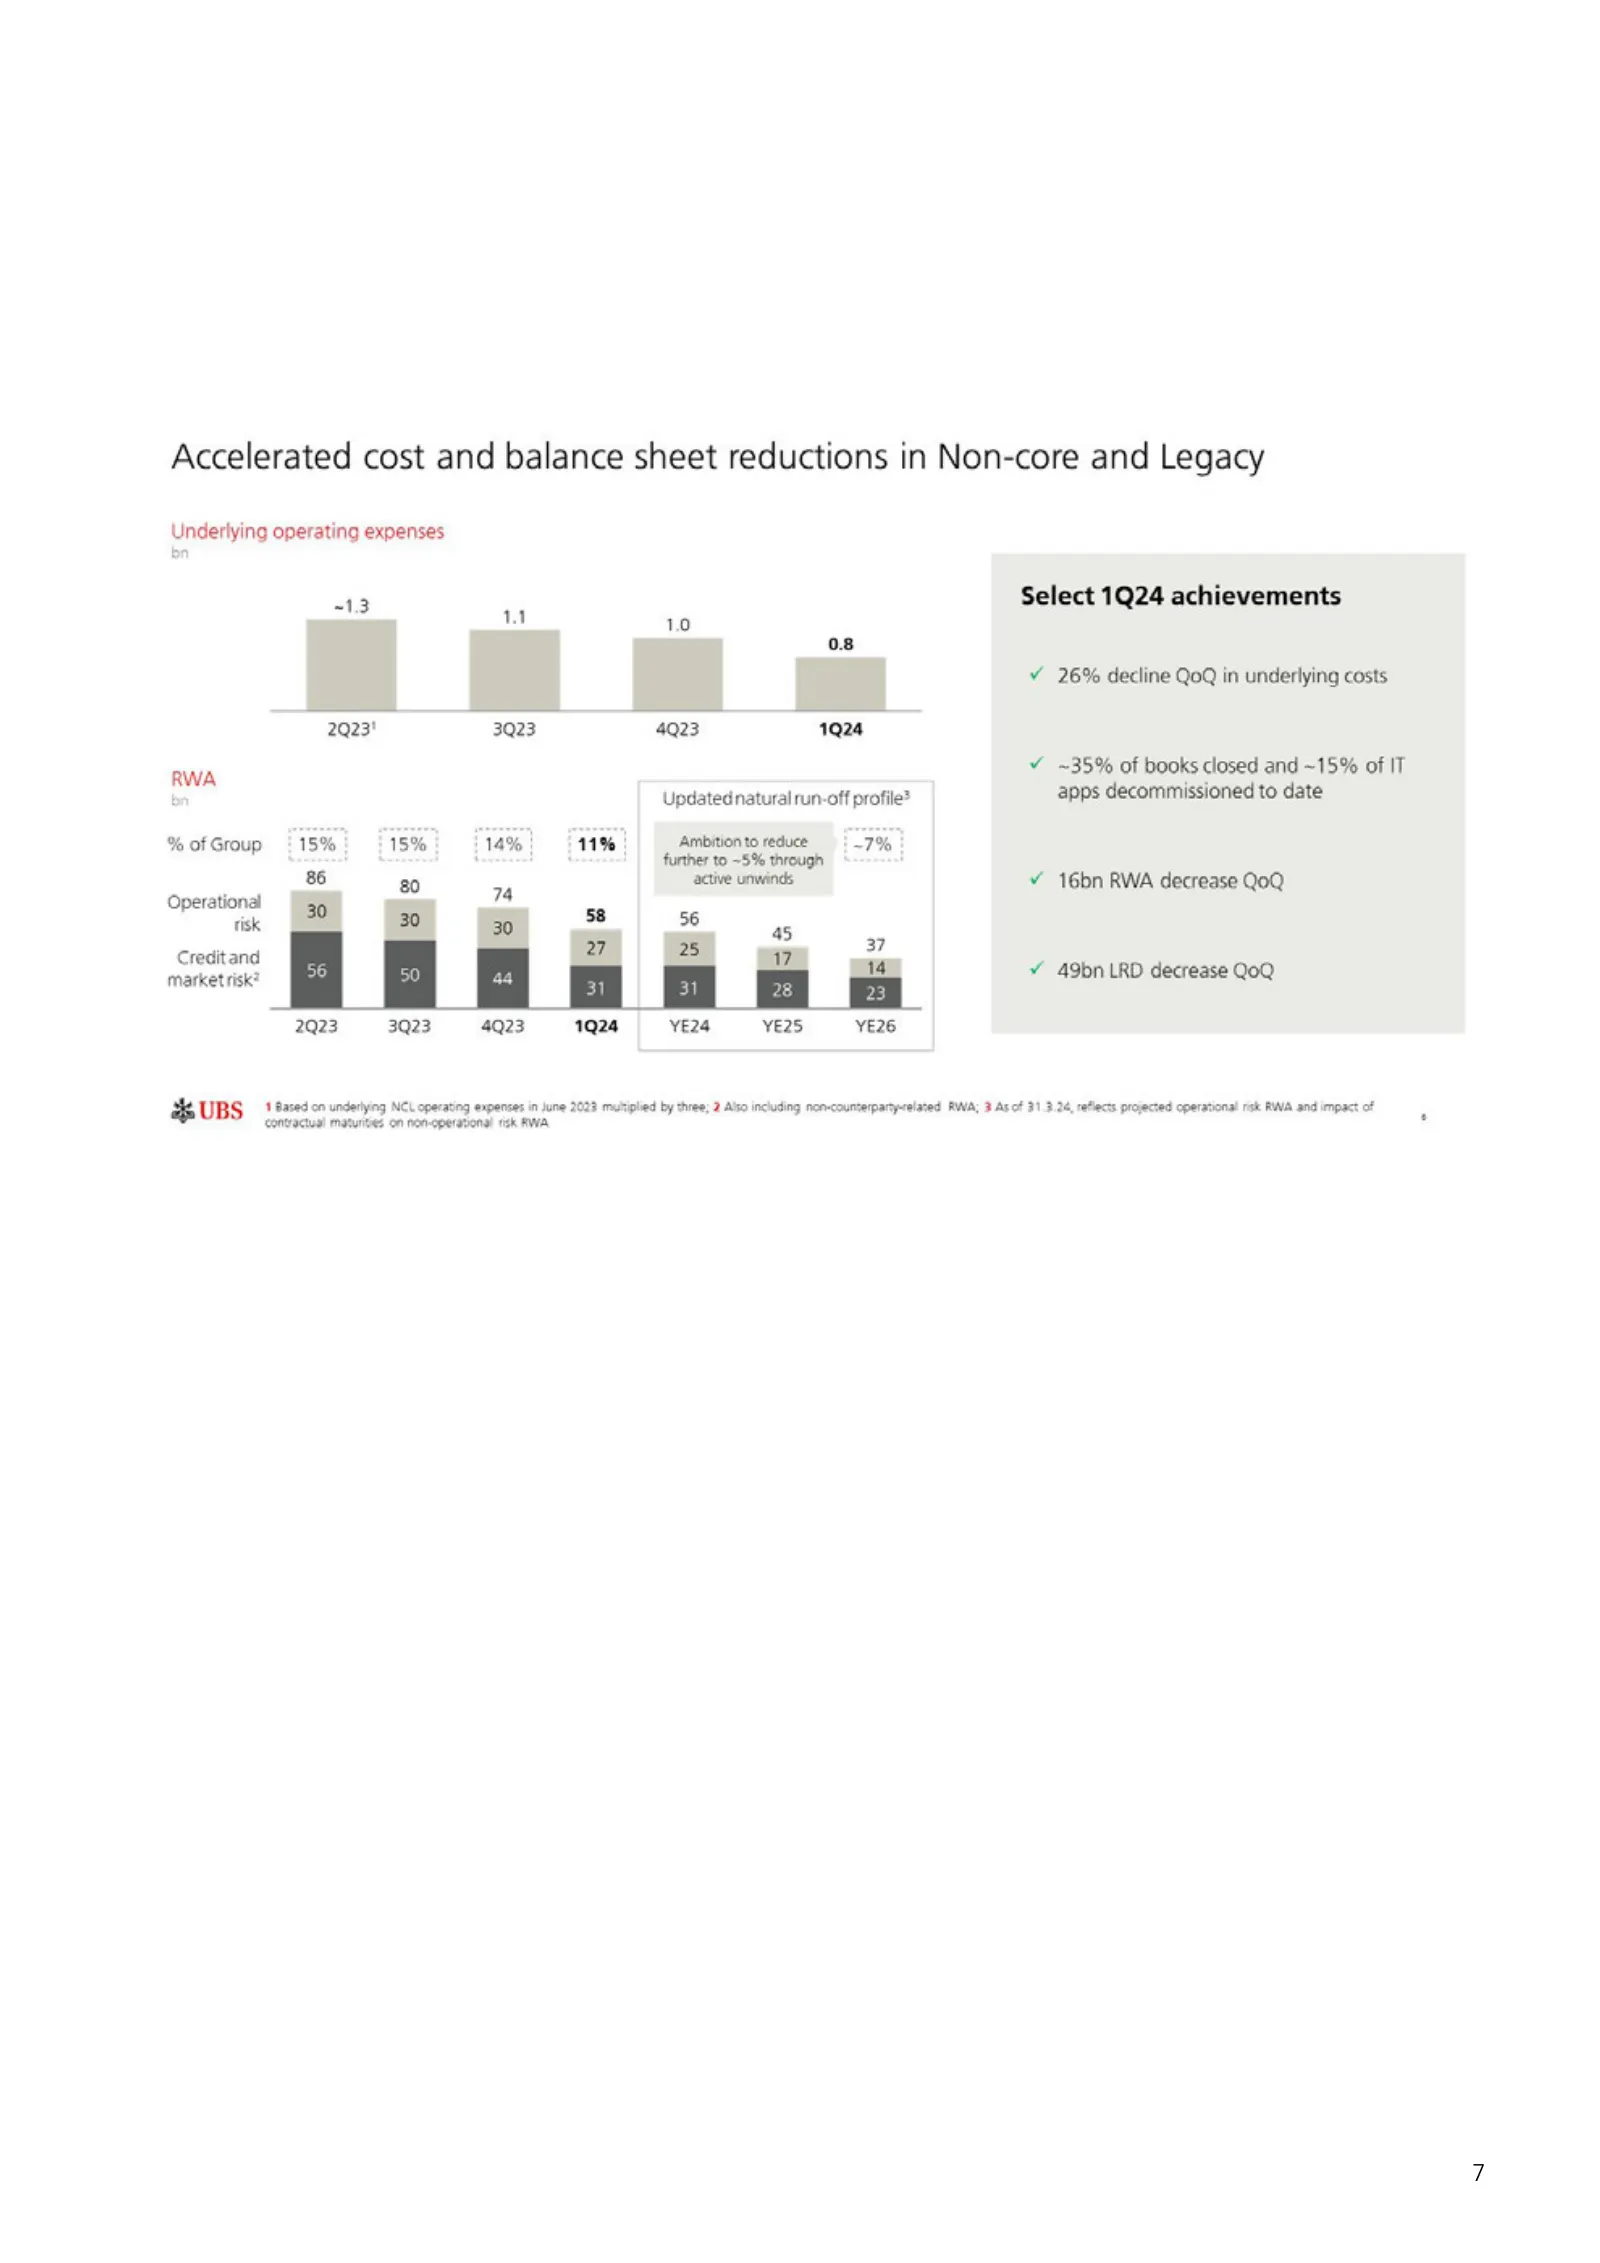
Slide 9: Accelerated cost and balance sheet reductions in Non-core and Legacy
Accelerated cost and balance sheet reductions in Non-core and Legacy Underlying operating expenses Select 1Q24 achievements ¥ 26% decline QoQ in underlying costs ¥ ~35% of books closed and ~15% of IT hws apps decommissioned to date % of Group § 15%! 15%: 114% | «11% | Ambitionto reduce 79% | : : fur
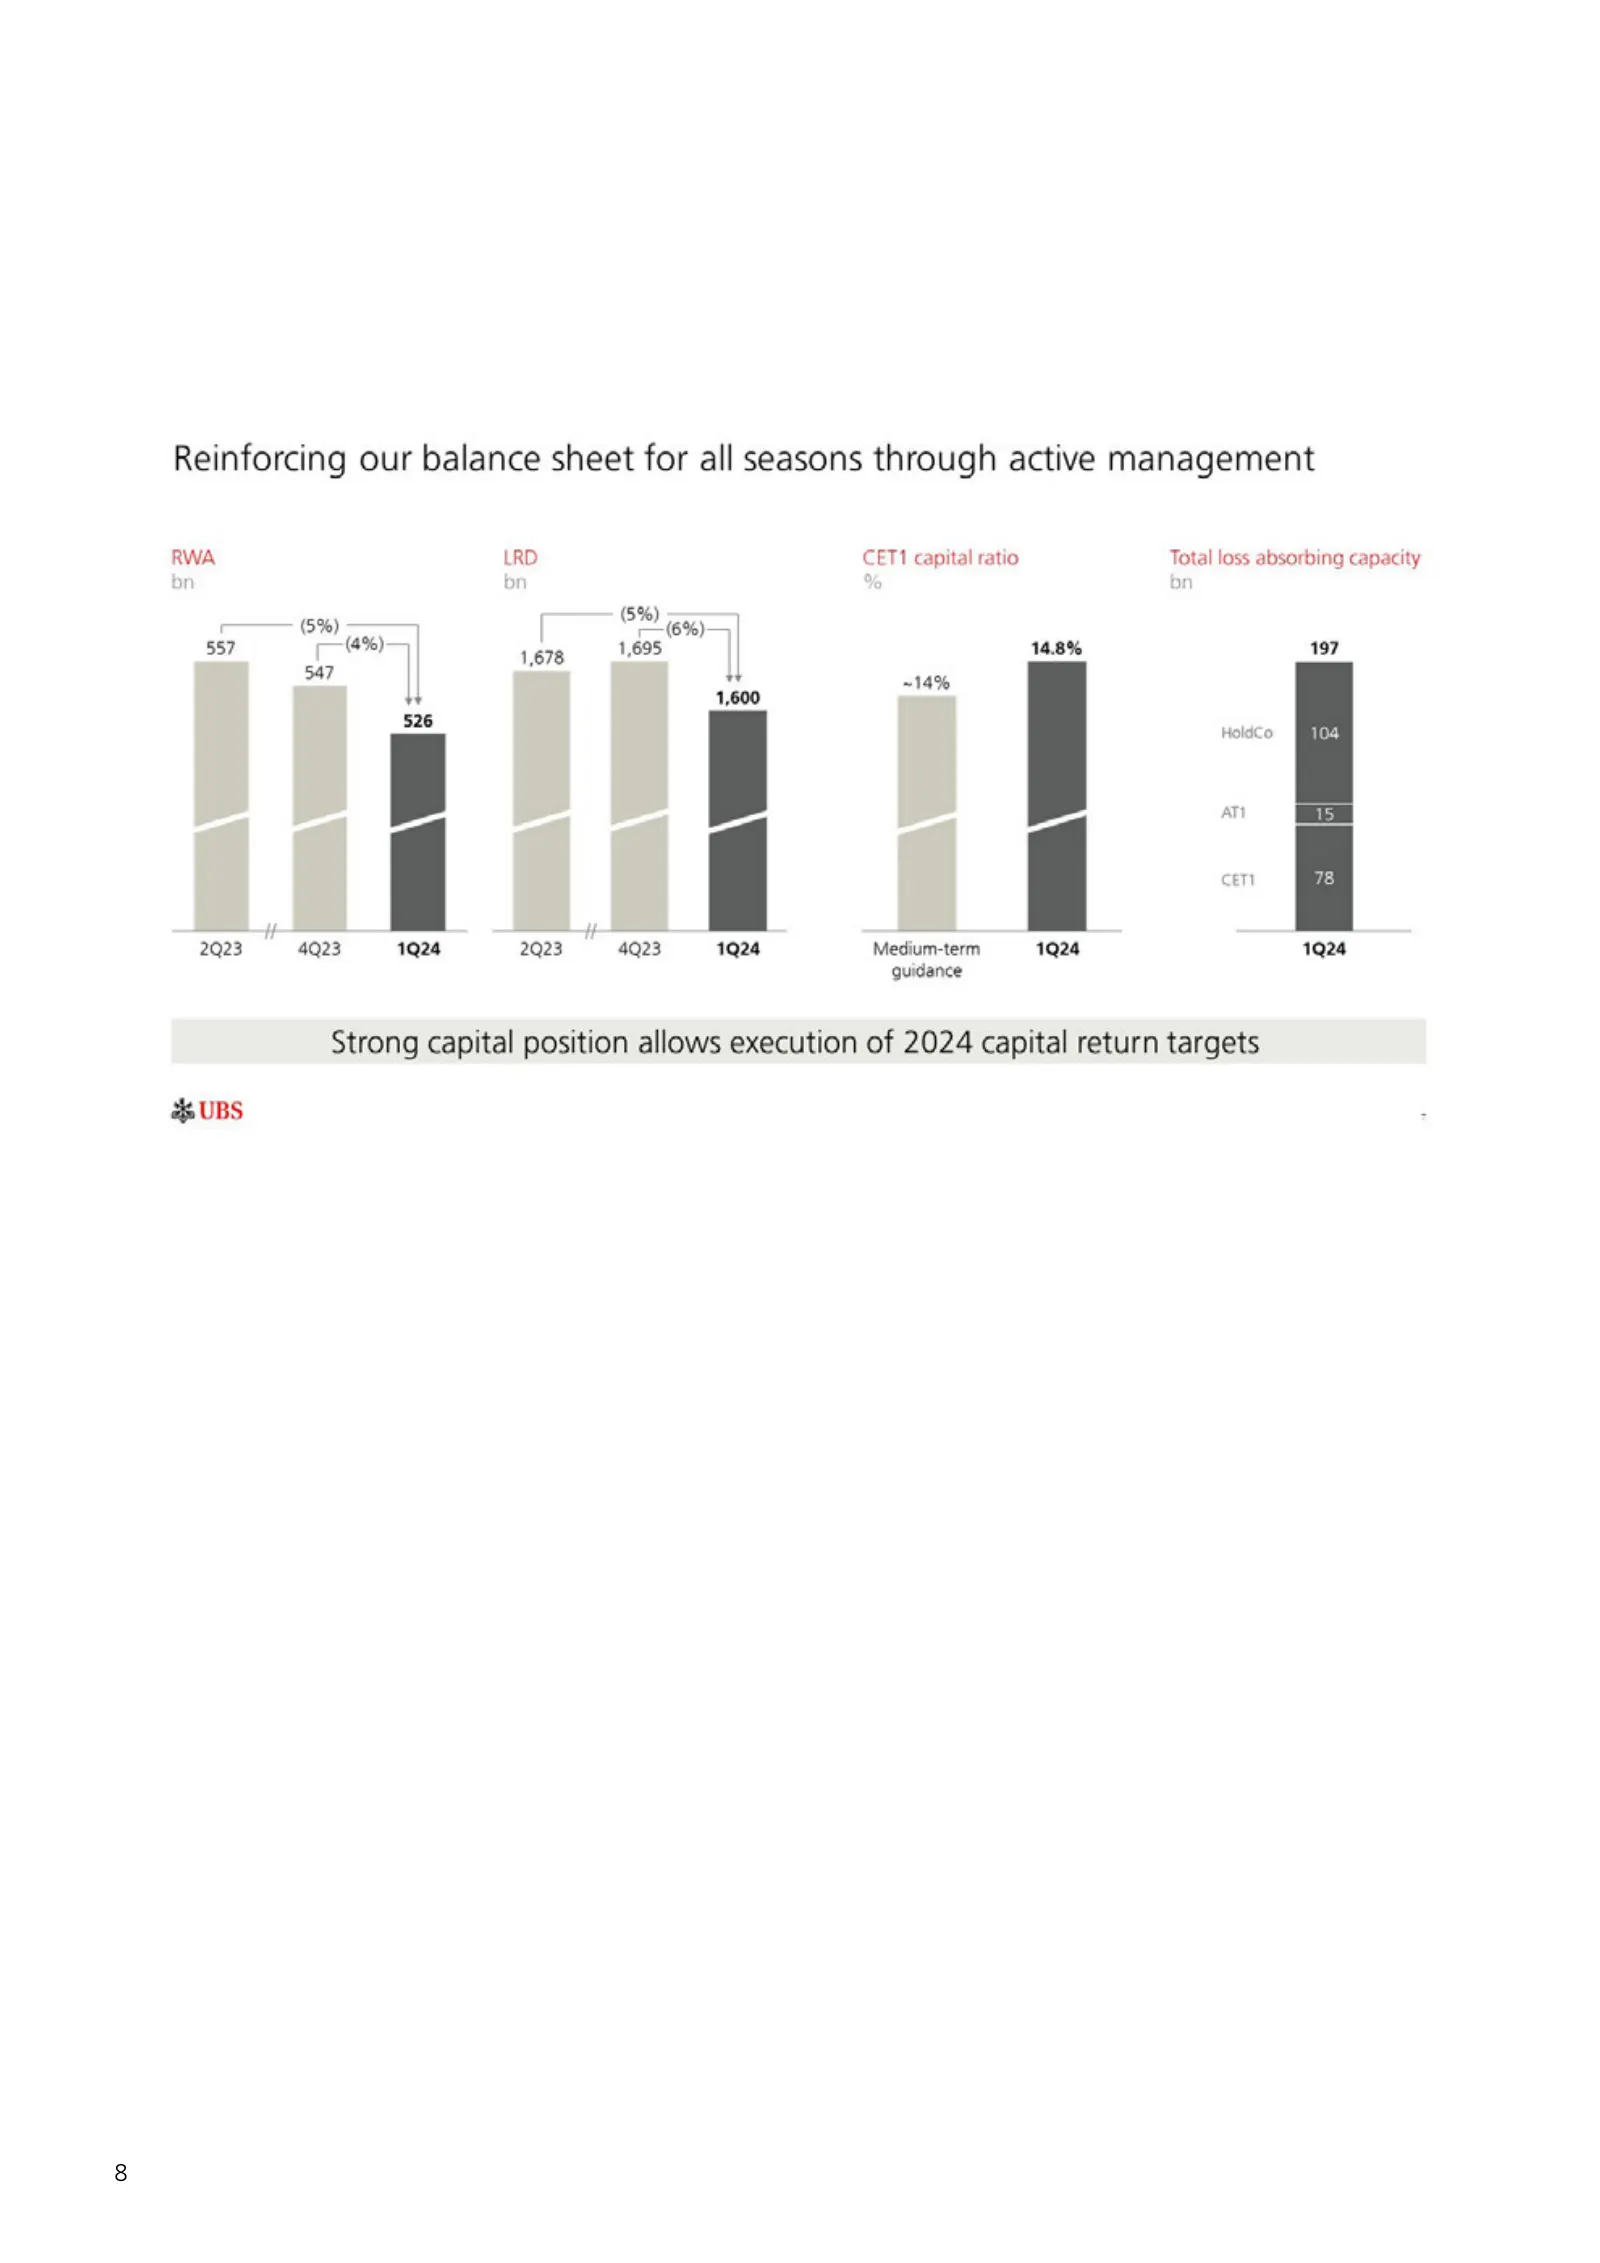
Slide 10: Reinforcing our balance sheet for all seasons through active management
Reinforcing our balance sheet for all seasons through active management RWA LRD CET1 capital ratio Total loss absorbing capacity bn bn e bn c— 6*) [ —(6%)— 557 i 1 1678 1,695 14.8% 197 is ~14% 1,600 [J , Holdco 1 [] [| ia UJ i [ - “ “ 2Q23 4Q23 1Q24 2Q23 4Q23 1924 Medium-term 1Q24 1924 guidance z St
Slide 11: Financial performance
Financial performance Todd Tuckner, Group CFO a UBS
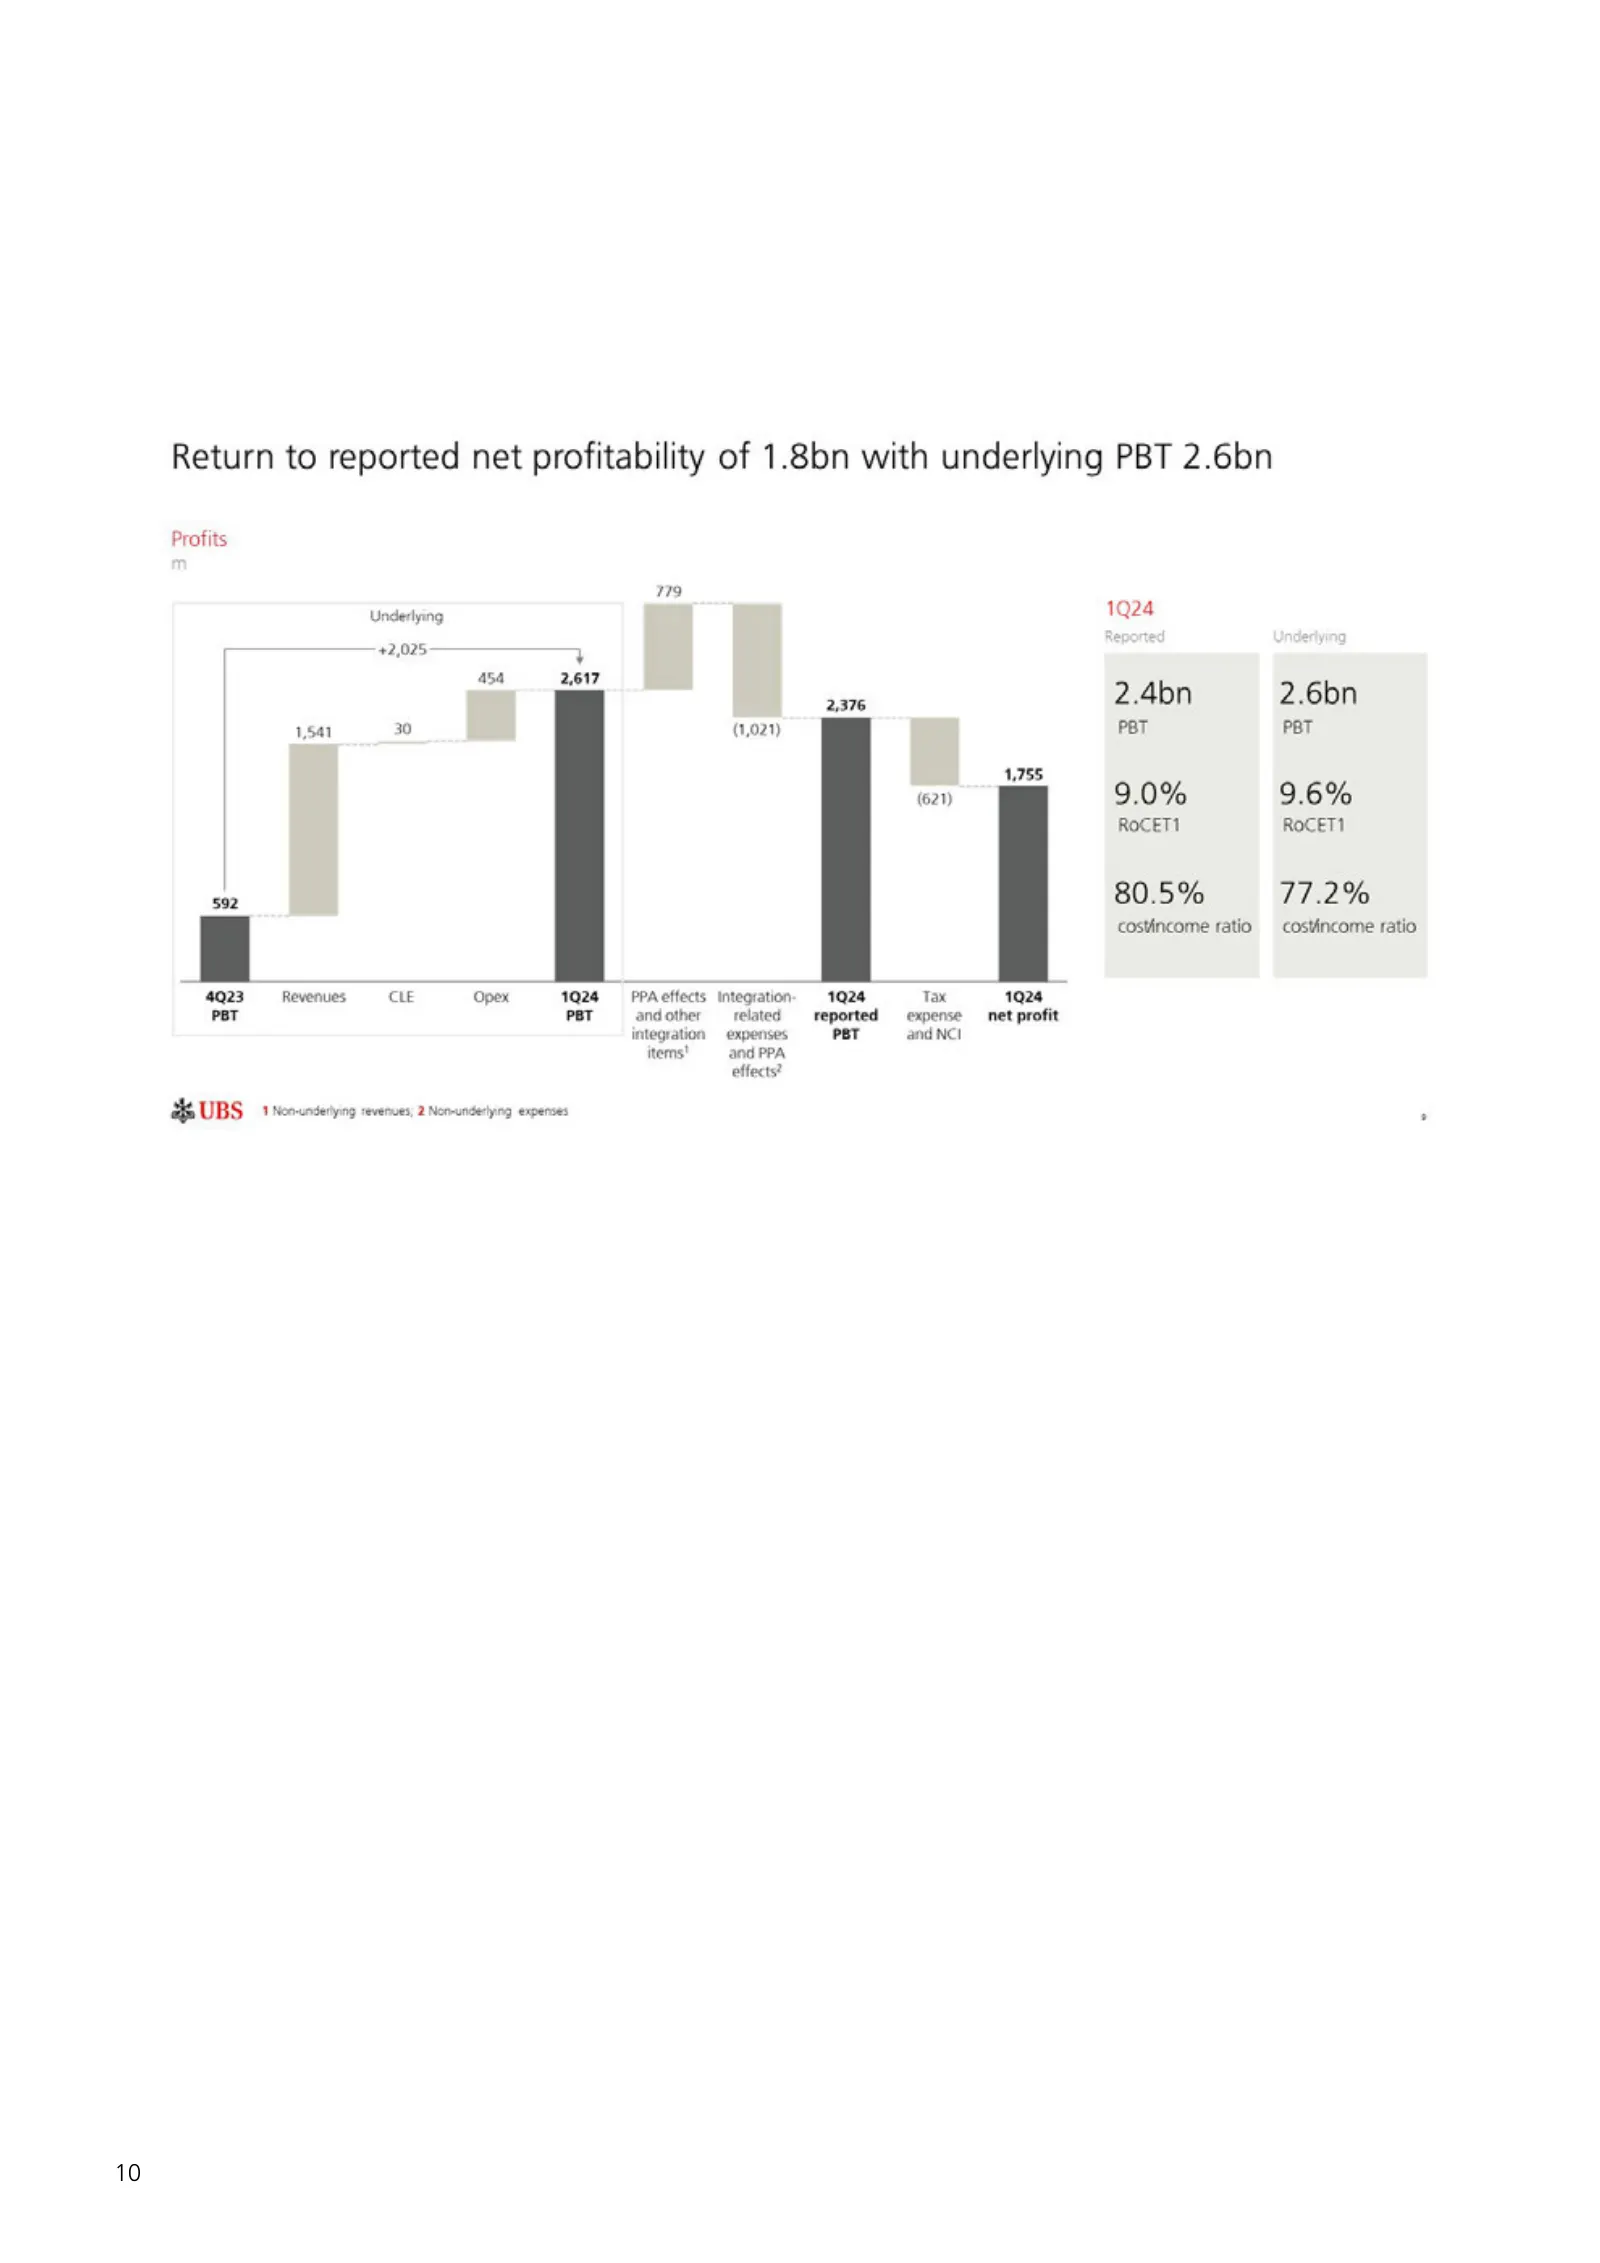
Slide 12: Return to reported net profitability of 1.8bn with underlying PBT 2.6bn
Return to reported net profitability of 1.8bn with underlying PBT 2.6bn Profits Underlying +2,025 454 1,541 30 92 4923 Revenues «CLE Opex PBT SHRUBS st recoenseiying venues, 2 Nerunderjing expenses 179 (1,021) PPA effects. Integration andother related integration expenses items' and PPA effects? 2,3
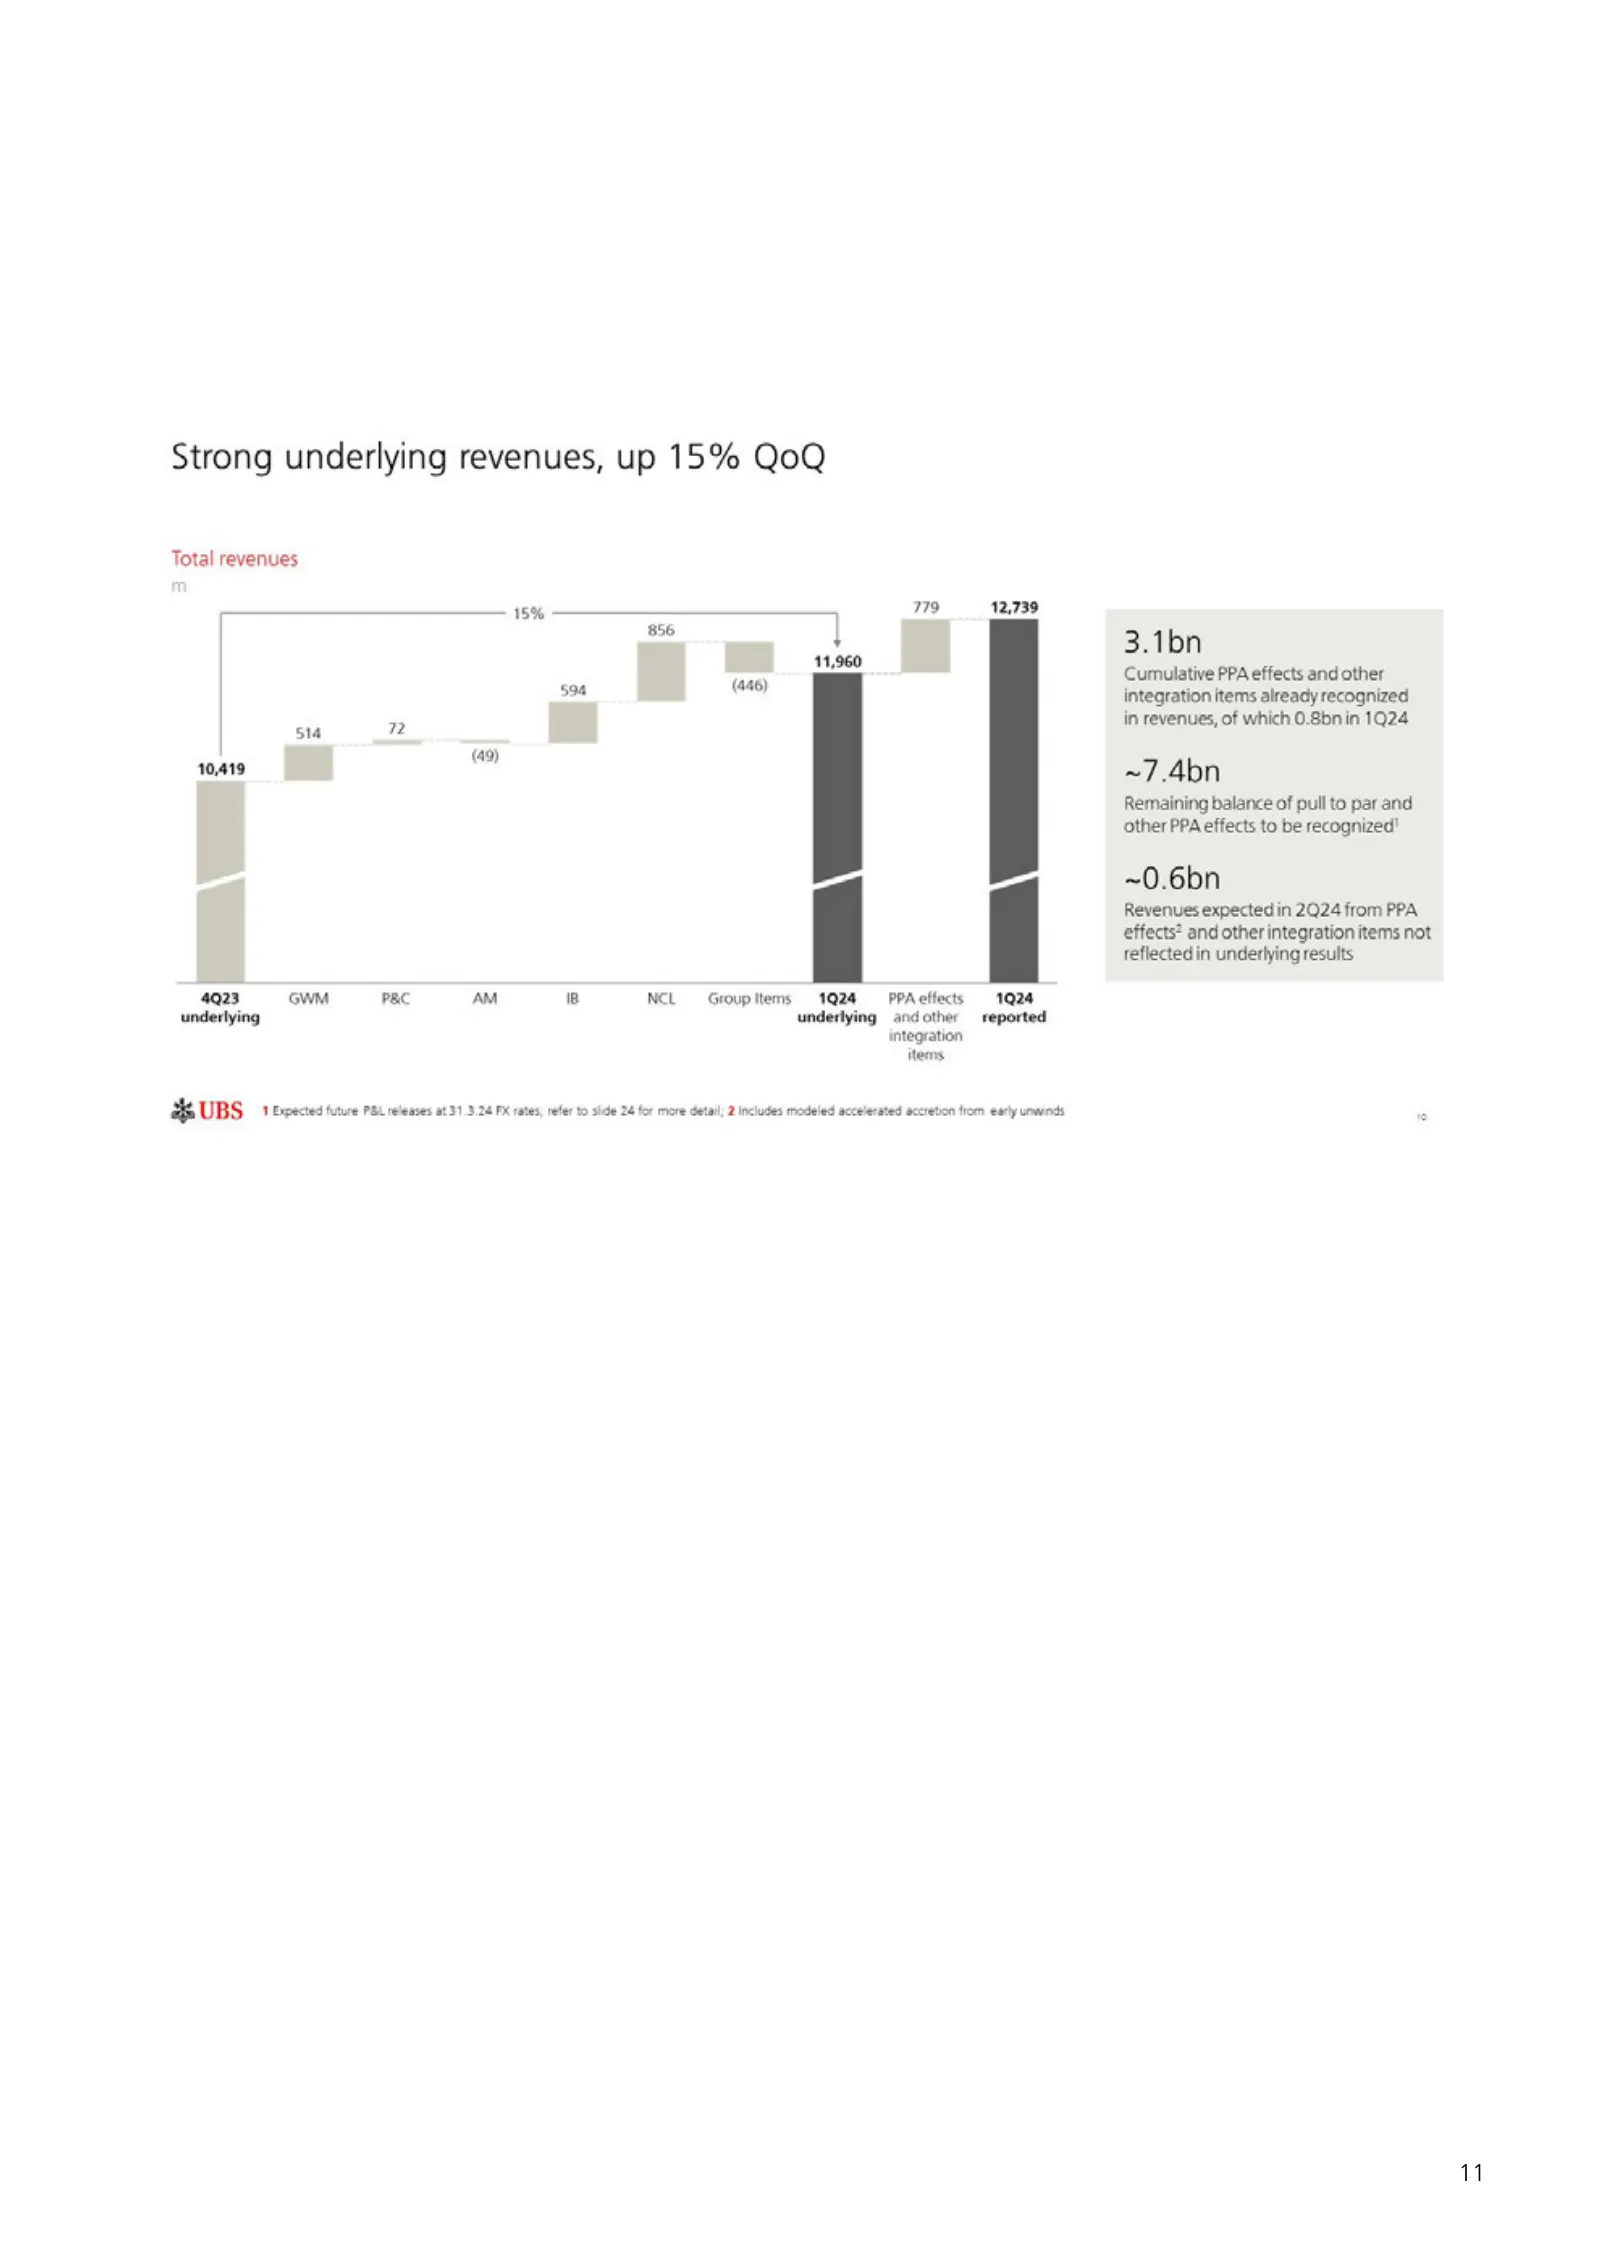
Slide 13: Strong underlying revenues, up 15% QoQ
Strong underlying revenues, up 15% QoQ Total revenues 514 72 10,419 i 4Q23 GWM PRC sh UBS 1 expected future Pat reteases at 313.24 FX rates, refer to side 24 for more detail, 2 Includes modeled accelerated accretion from early unwinds 15% (49) 856 NCL Group Items 1924 PPA effects 1924 underlying and
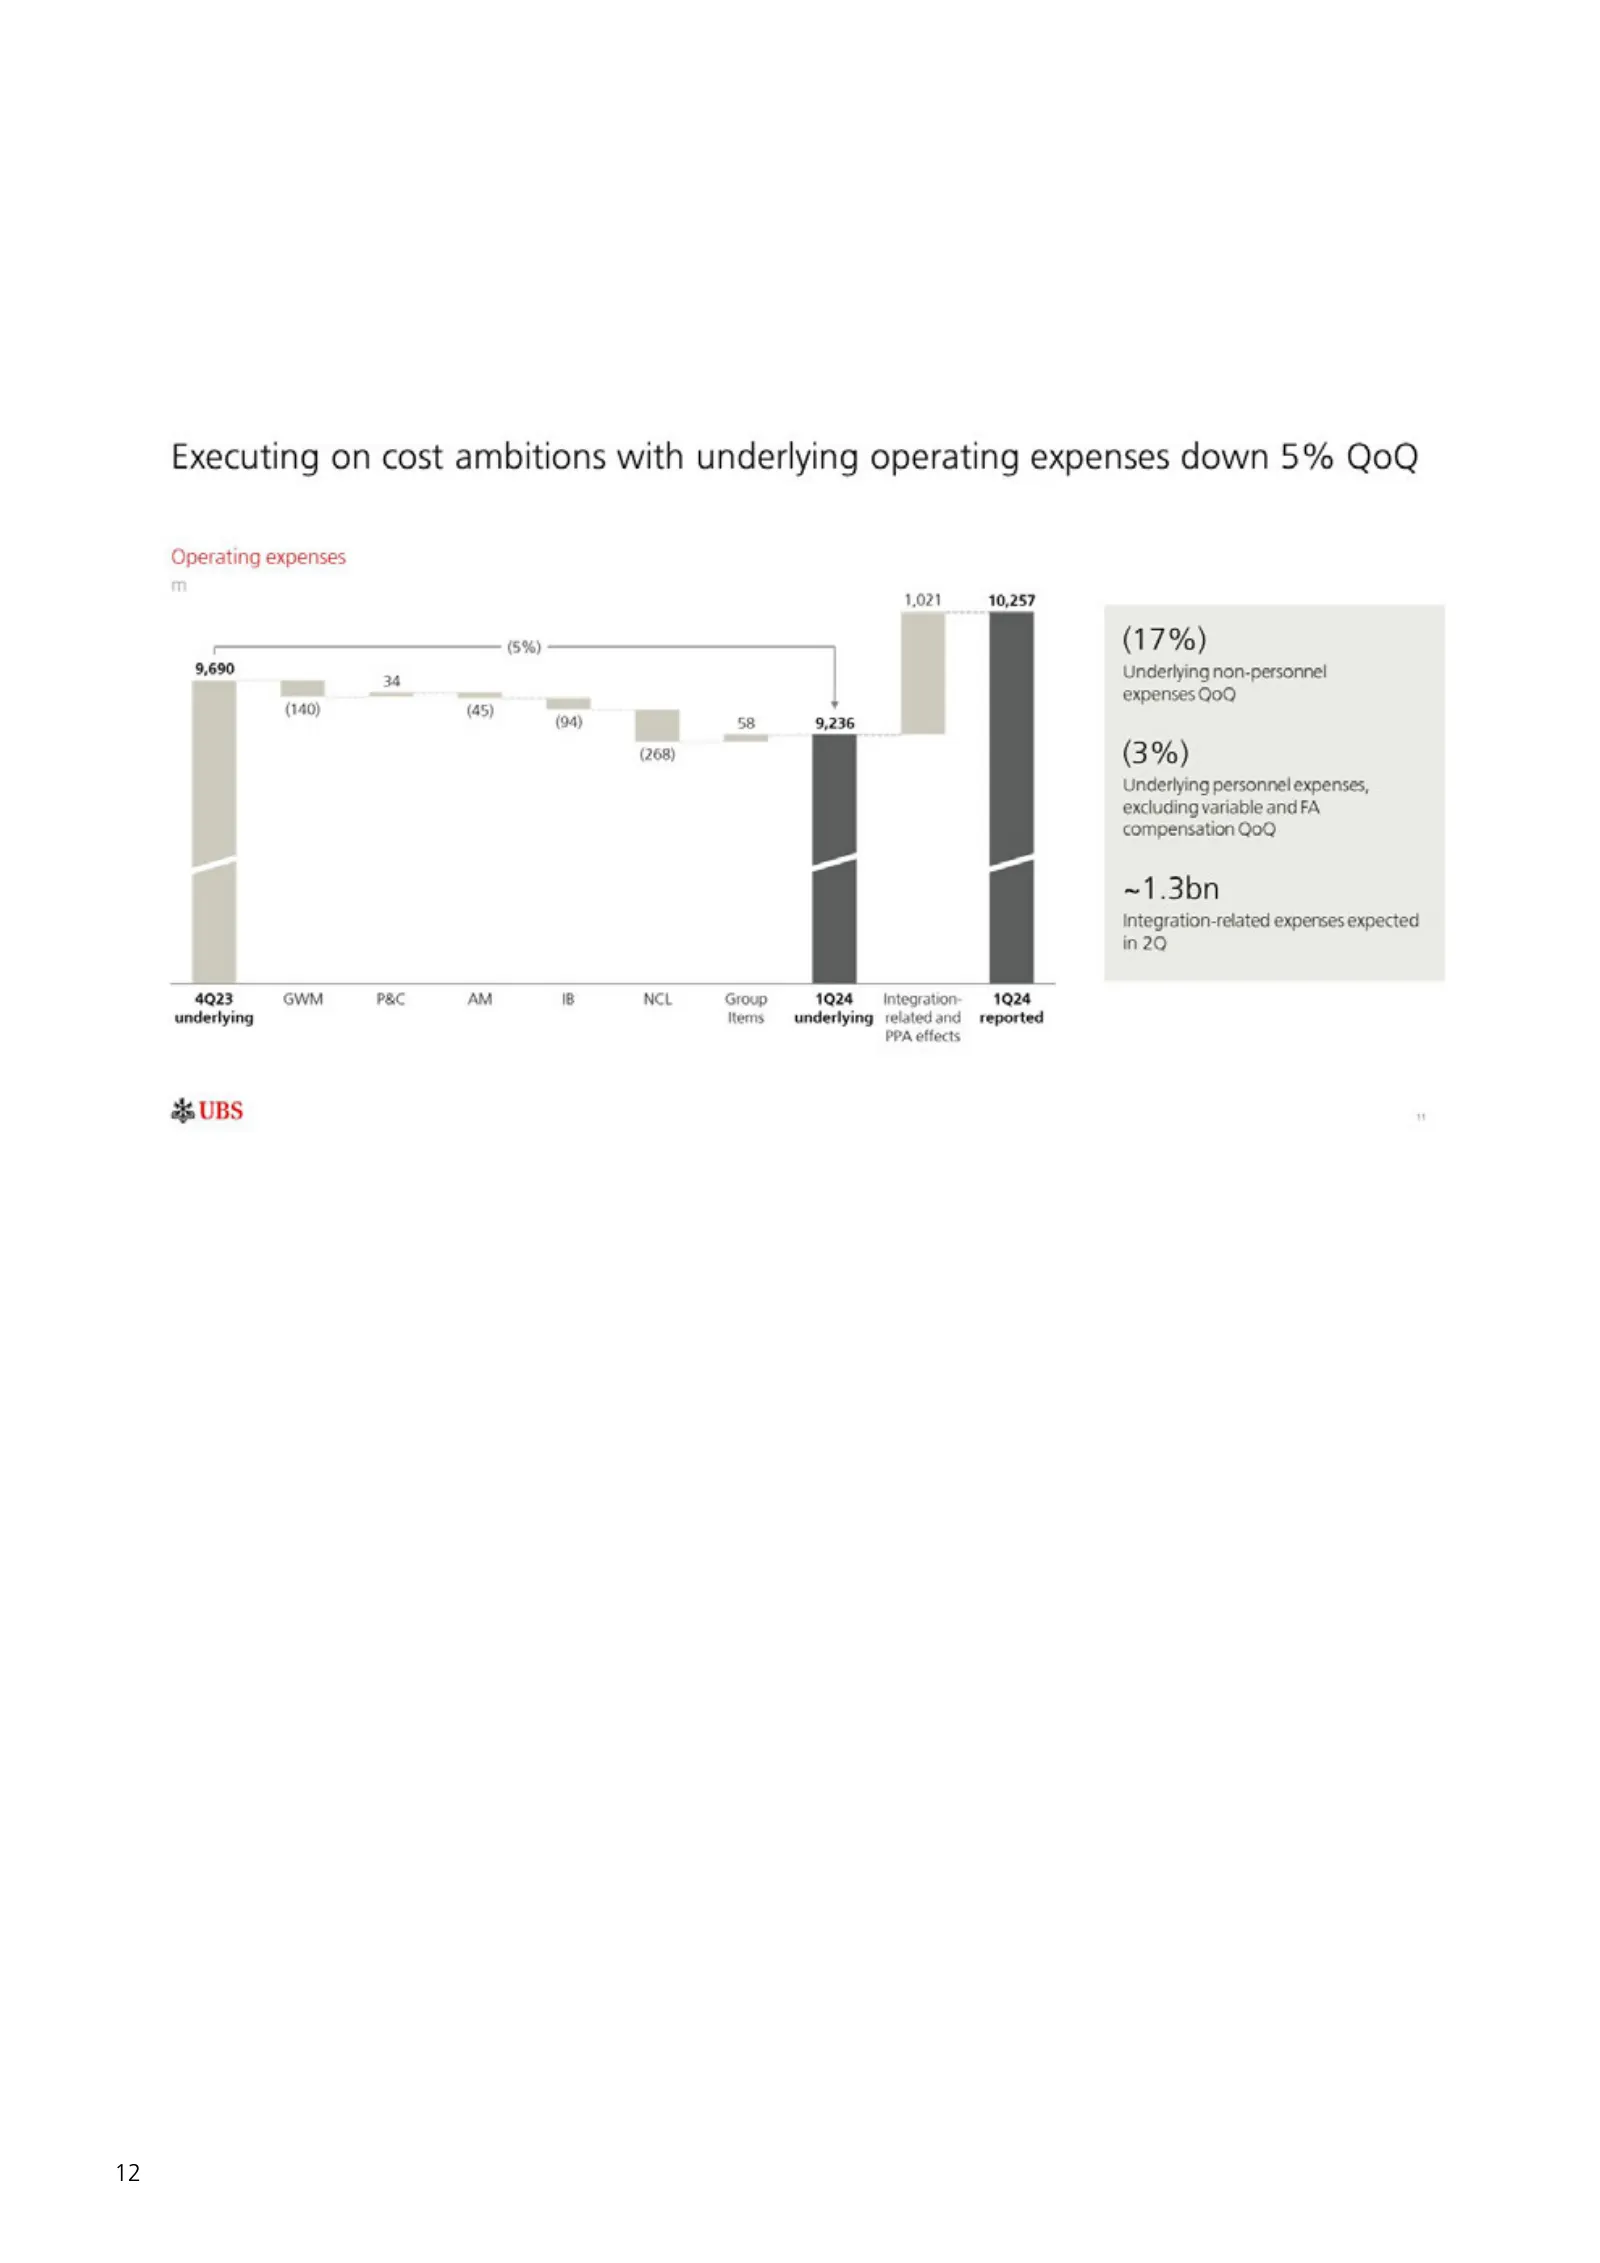
Slide 14: Executing on cost ambitions with underlying operating expenses down 5% QoQ
12 Executing on cost ambitions with underlying operating expenses down 5% QoQ Operating expenses 1,021 10,257 9,690 | 4Q23 underlying 4 UBS Group Nems 1924 Integration. = 1924 underlying ‘elaledand reported PPA effects (17%) Underlying non-personnel expenses QoQ, (3%) Underlying personnel expenses,
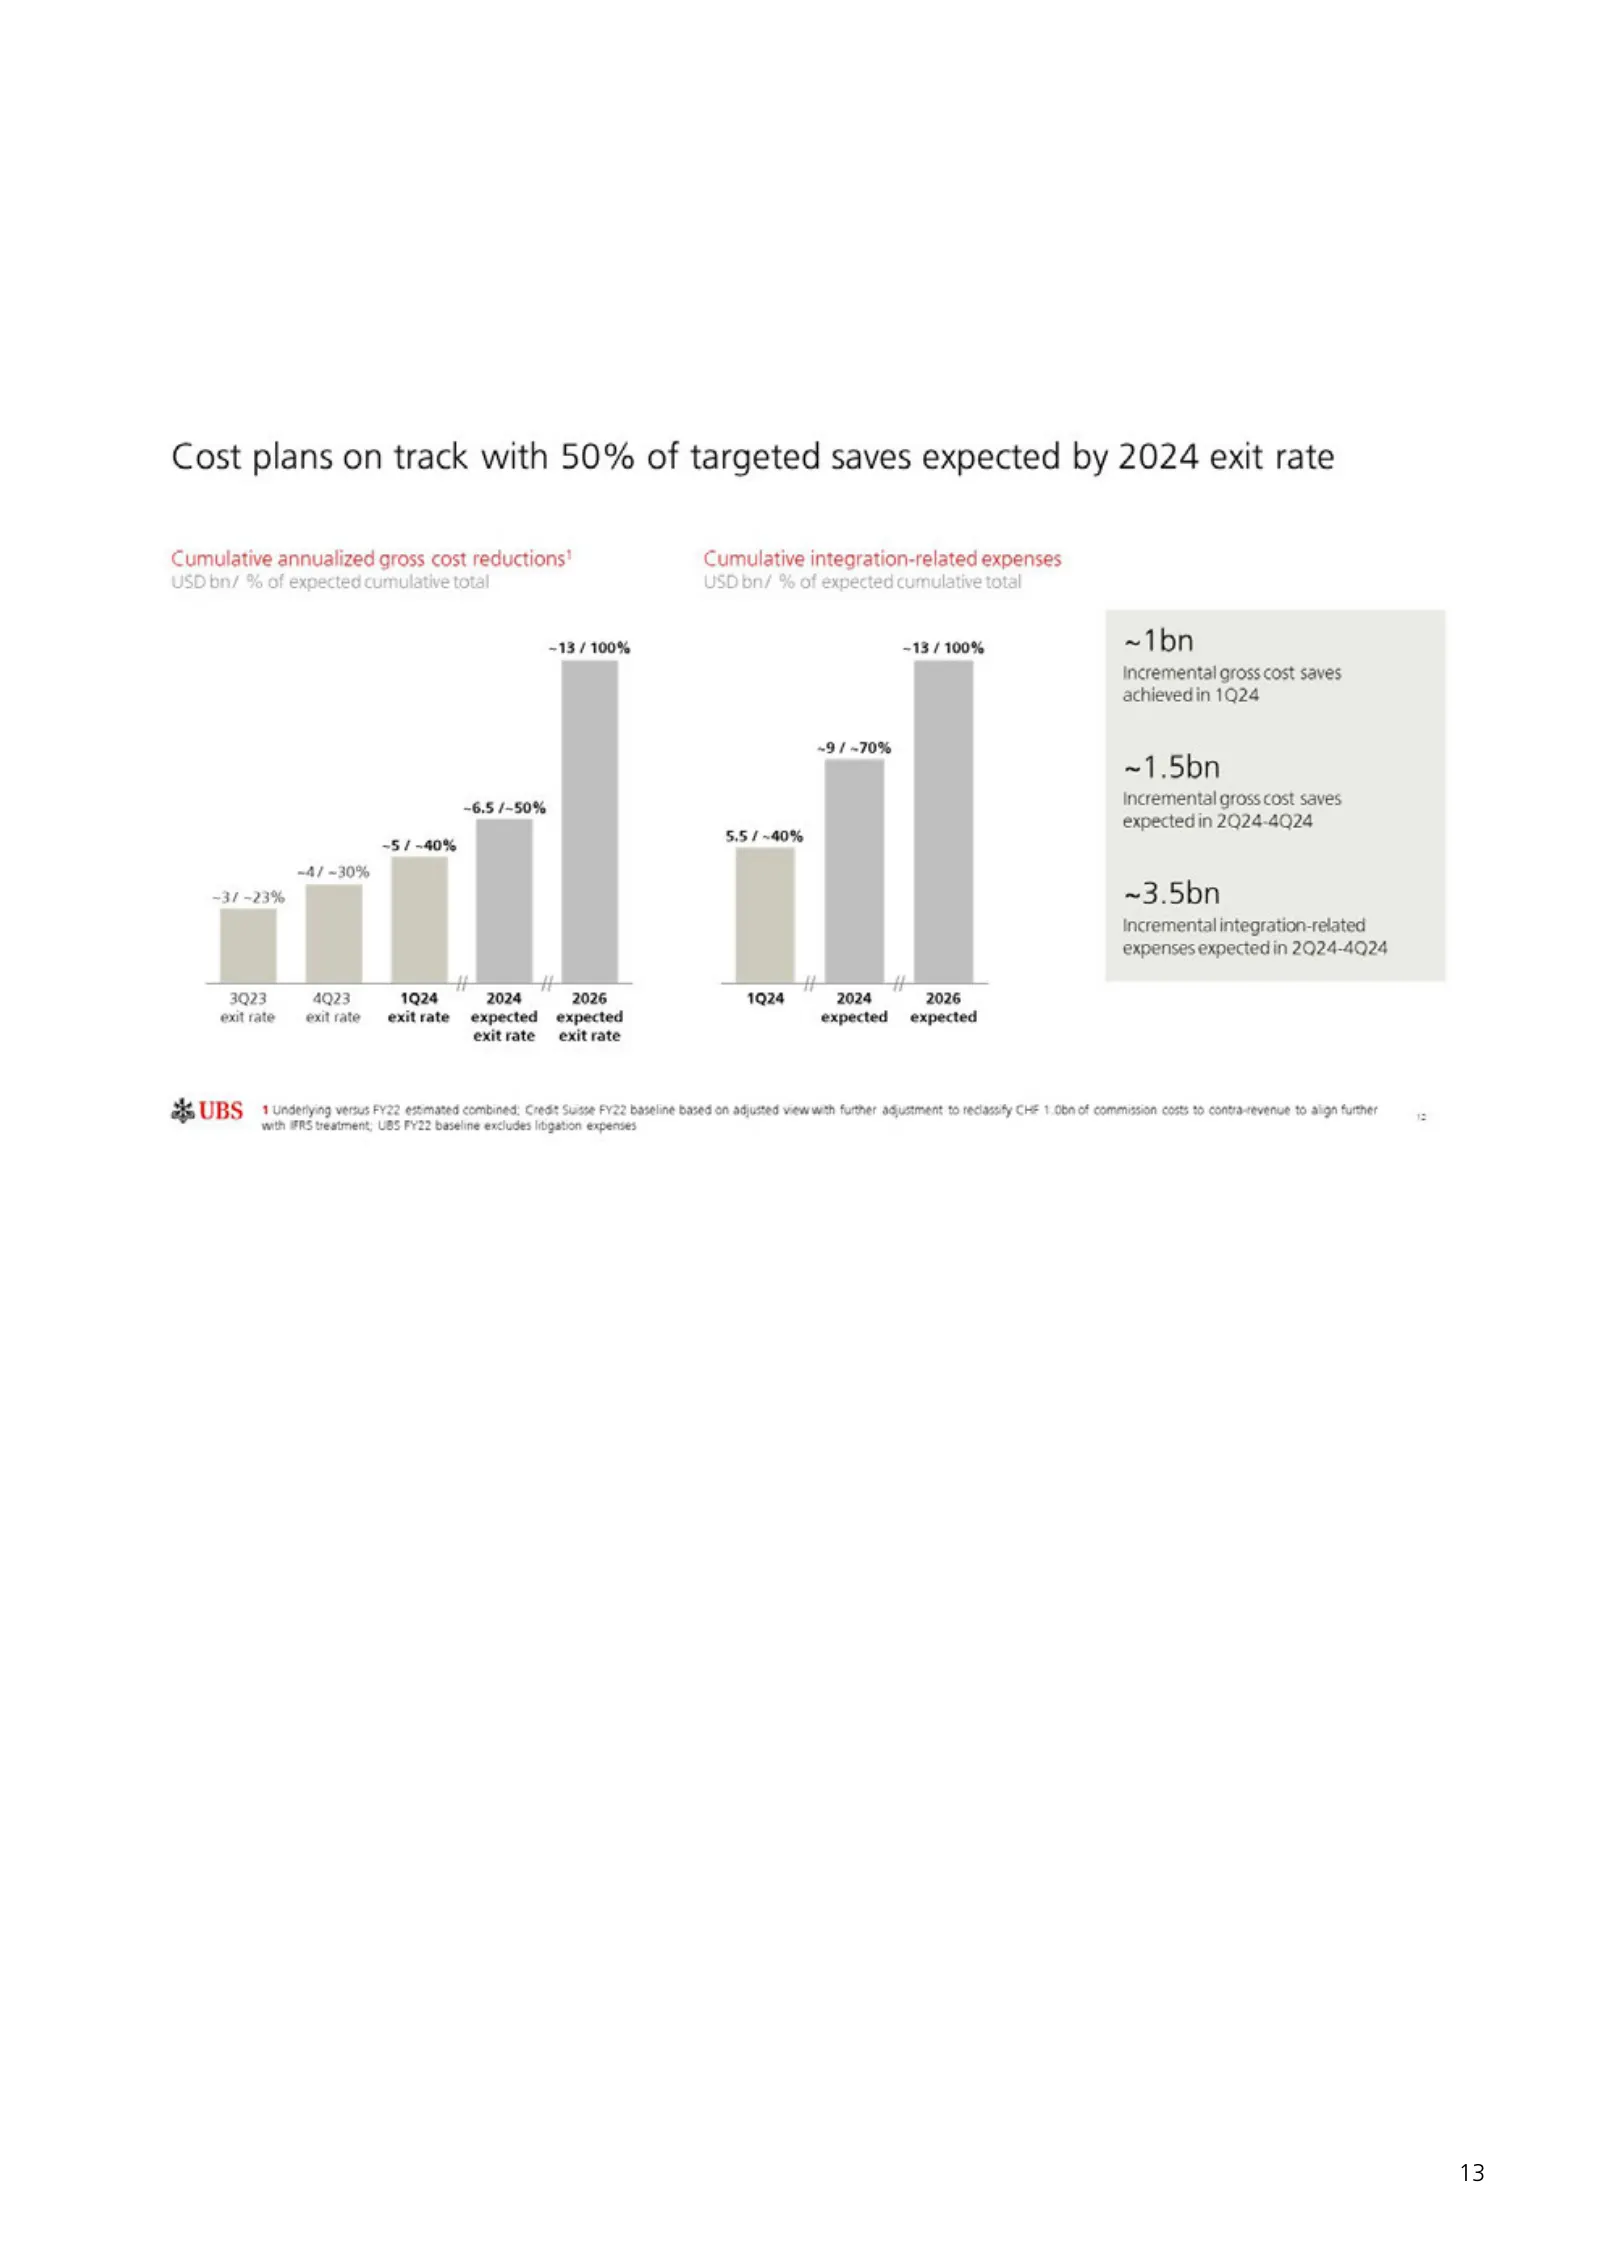
Slide 15: Cost plans on track with 50% of targeted saves expected by 4Q24 exit rate
Cost plans on track with 50% of targeted saves expected by 2024 exit rate Cumulative annualized gross cost reductions’ Cumulative integration-related expenses USD bn/ % of expected cumulative total USD bn/ % of expected cumulative total ~13 / 100% ~1bn Incremental Cost saves achieved in 1Q24 ~1.5bn
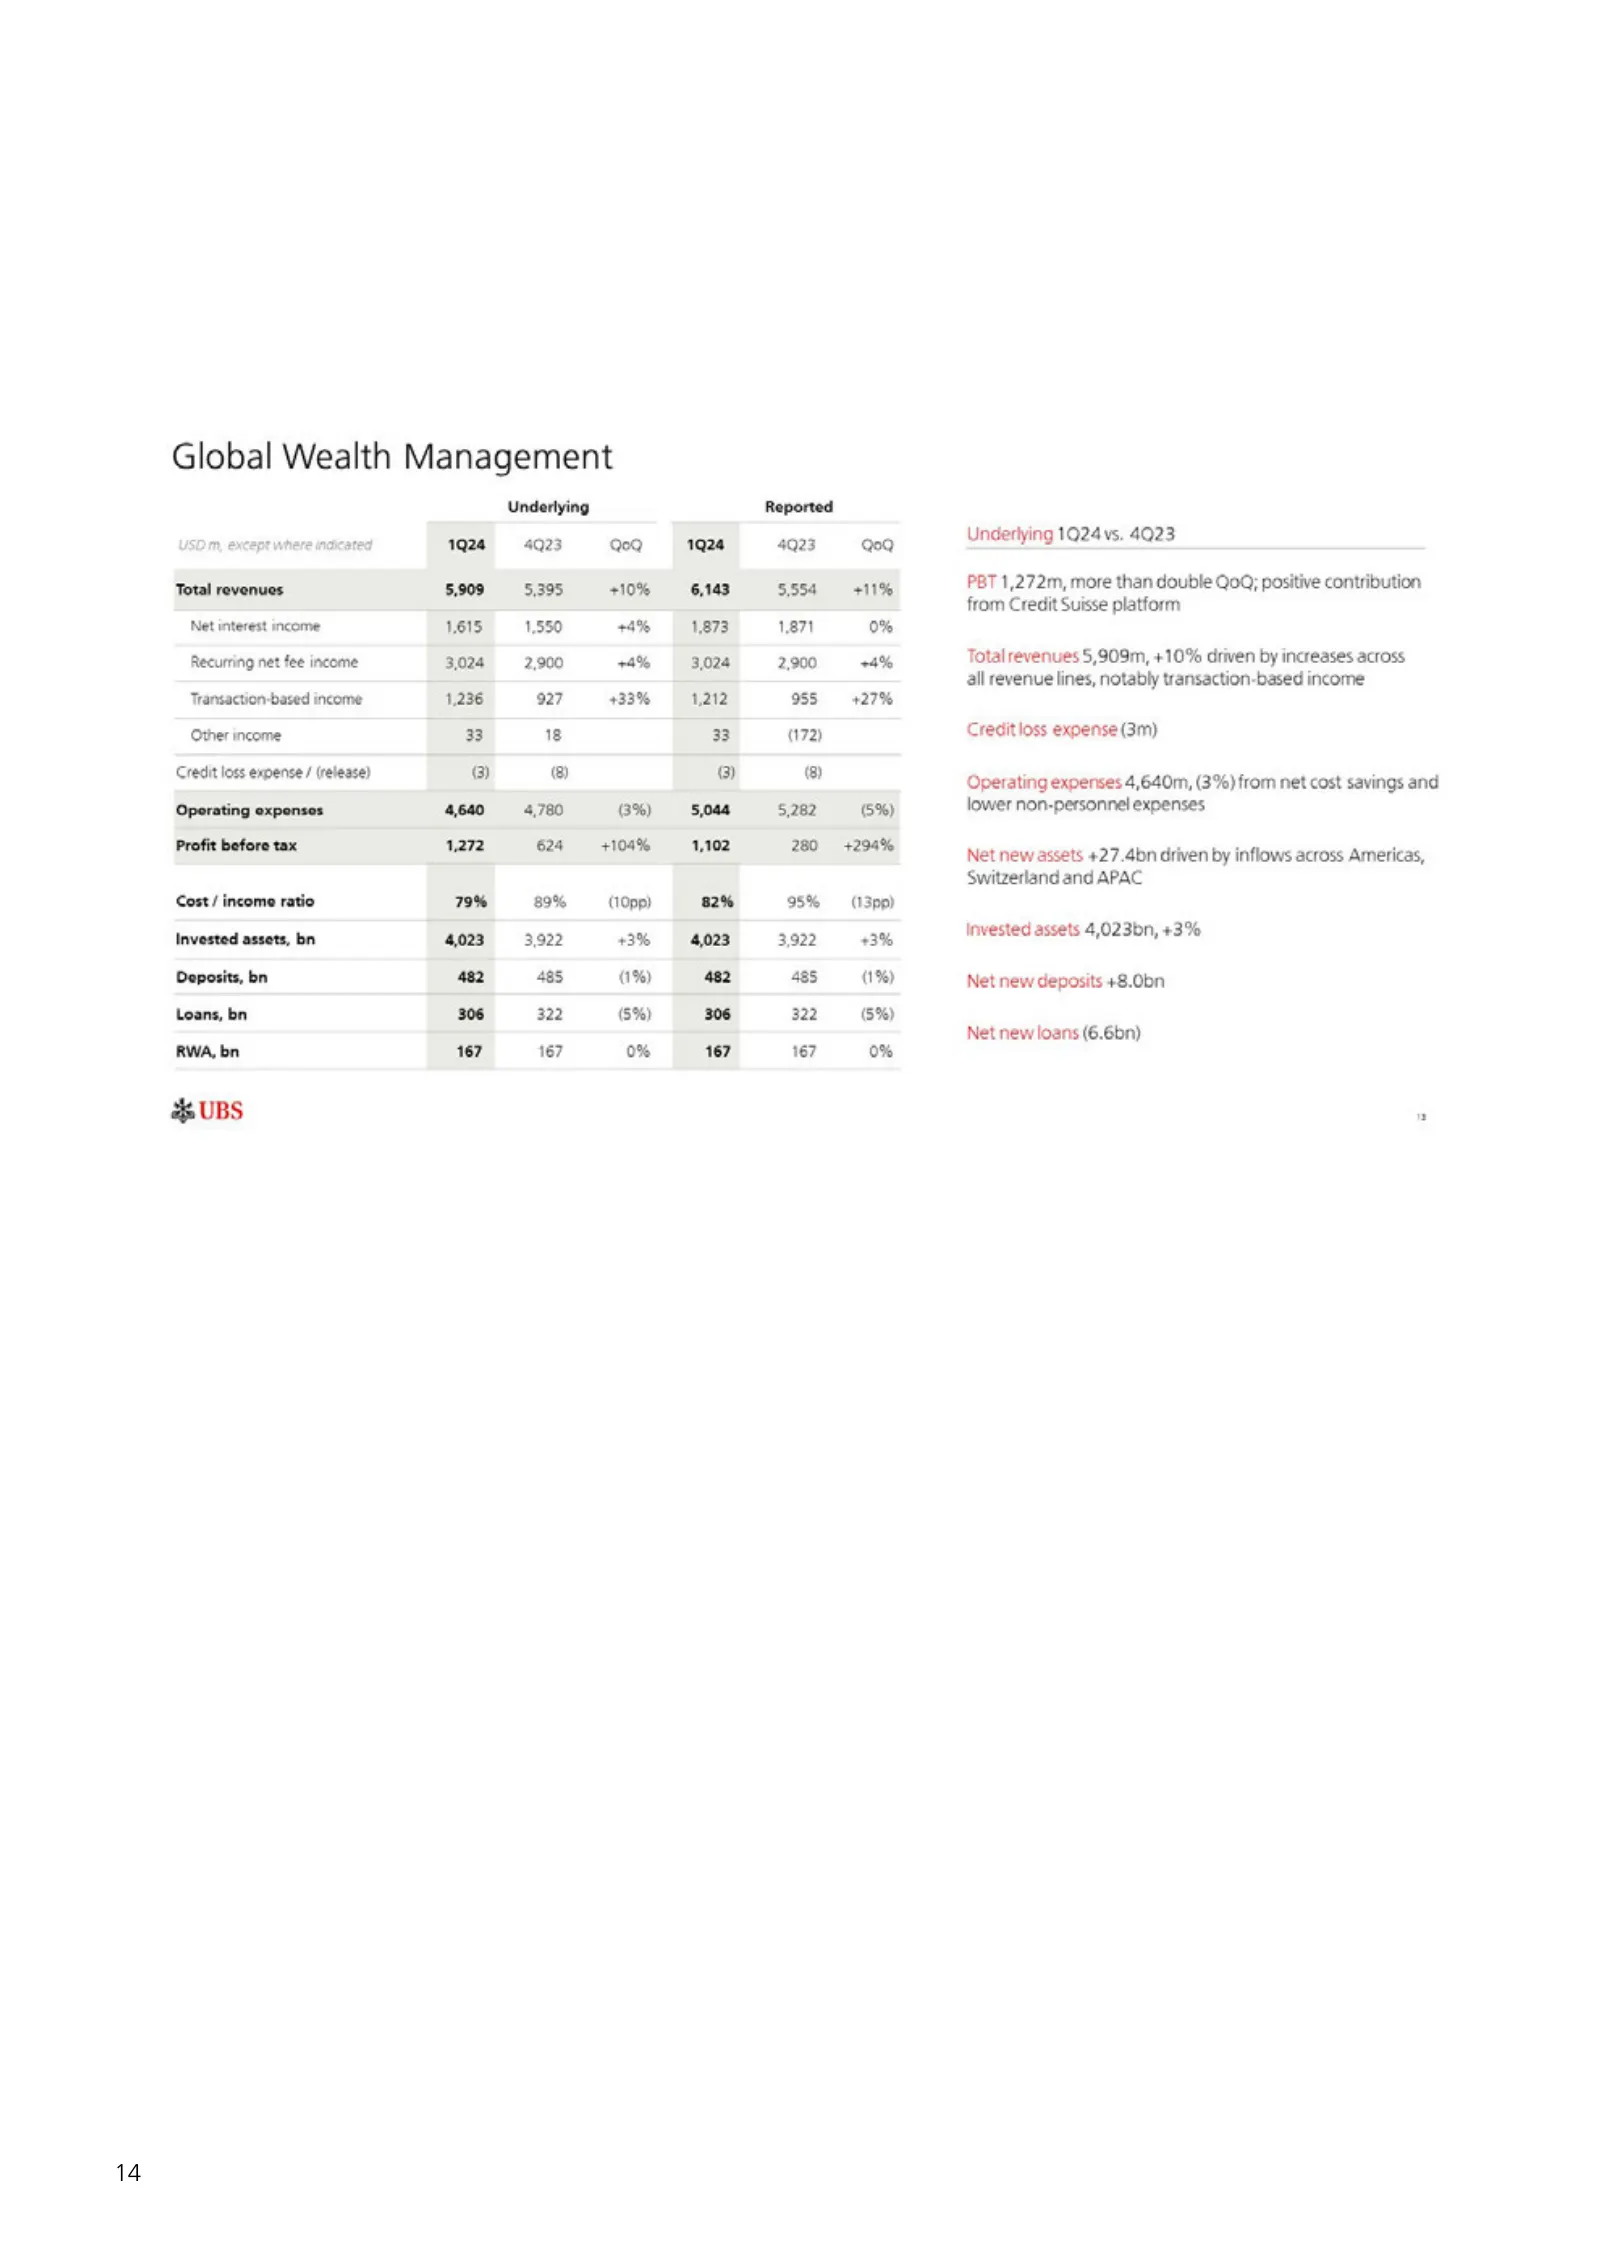
Slide 16: Global Wealth Management
14 Global Wealth Management Underlying 1924 4Q23 QeQ Total revenues 5,909 5,395 +10% Net interest income 1615 1,550 +4% Recurring net fee income 3,024 2,900 7% Transaction-based income 1,236 927 433% Other income 33 18 Credit loss expense / (release) @) @) Operating expenses 4,640 4,780 (3%) Profit
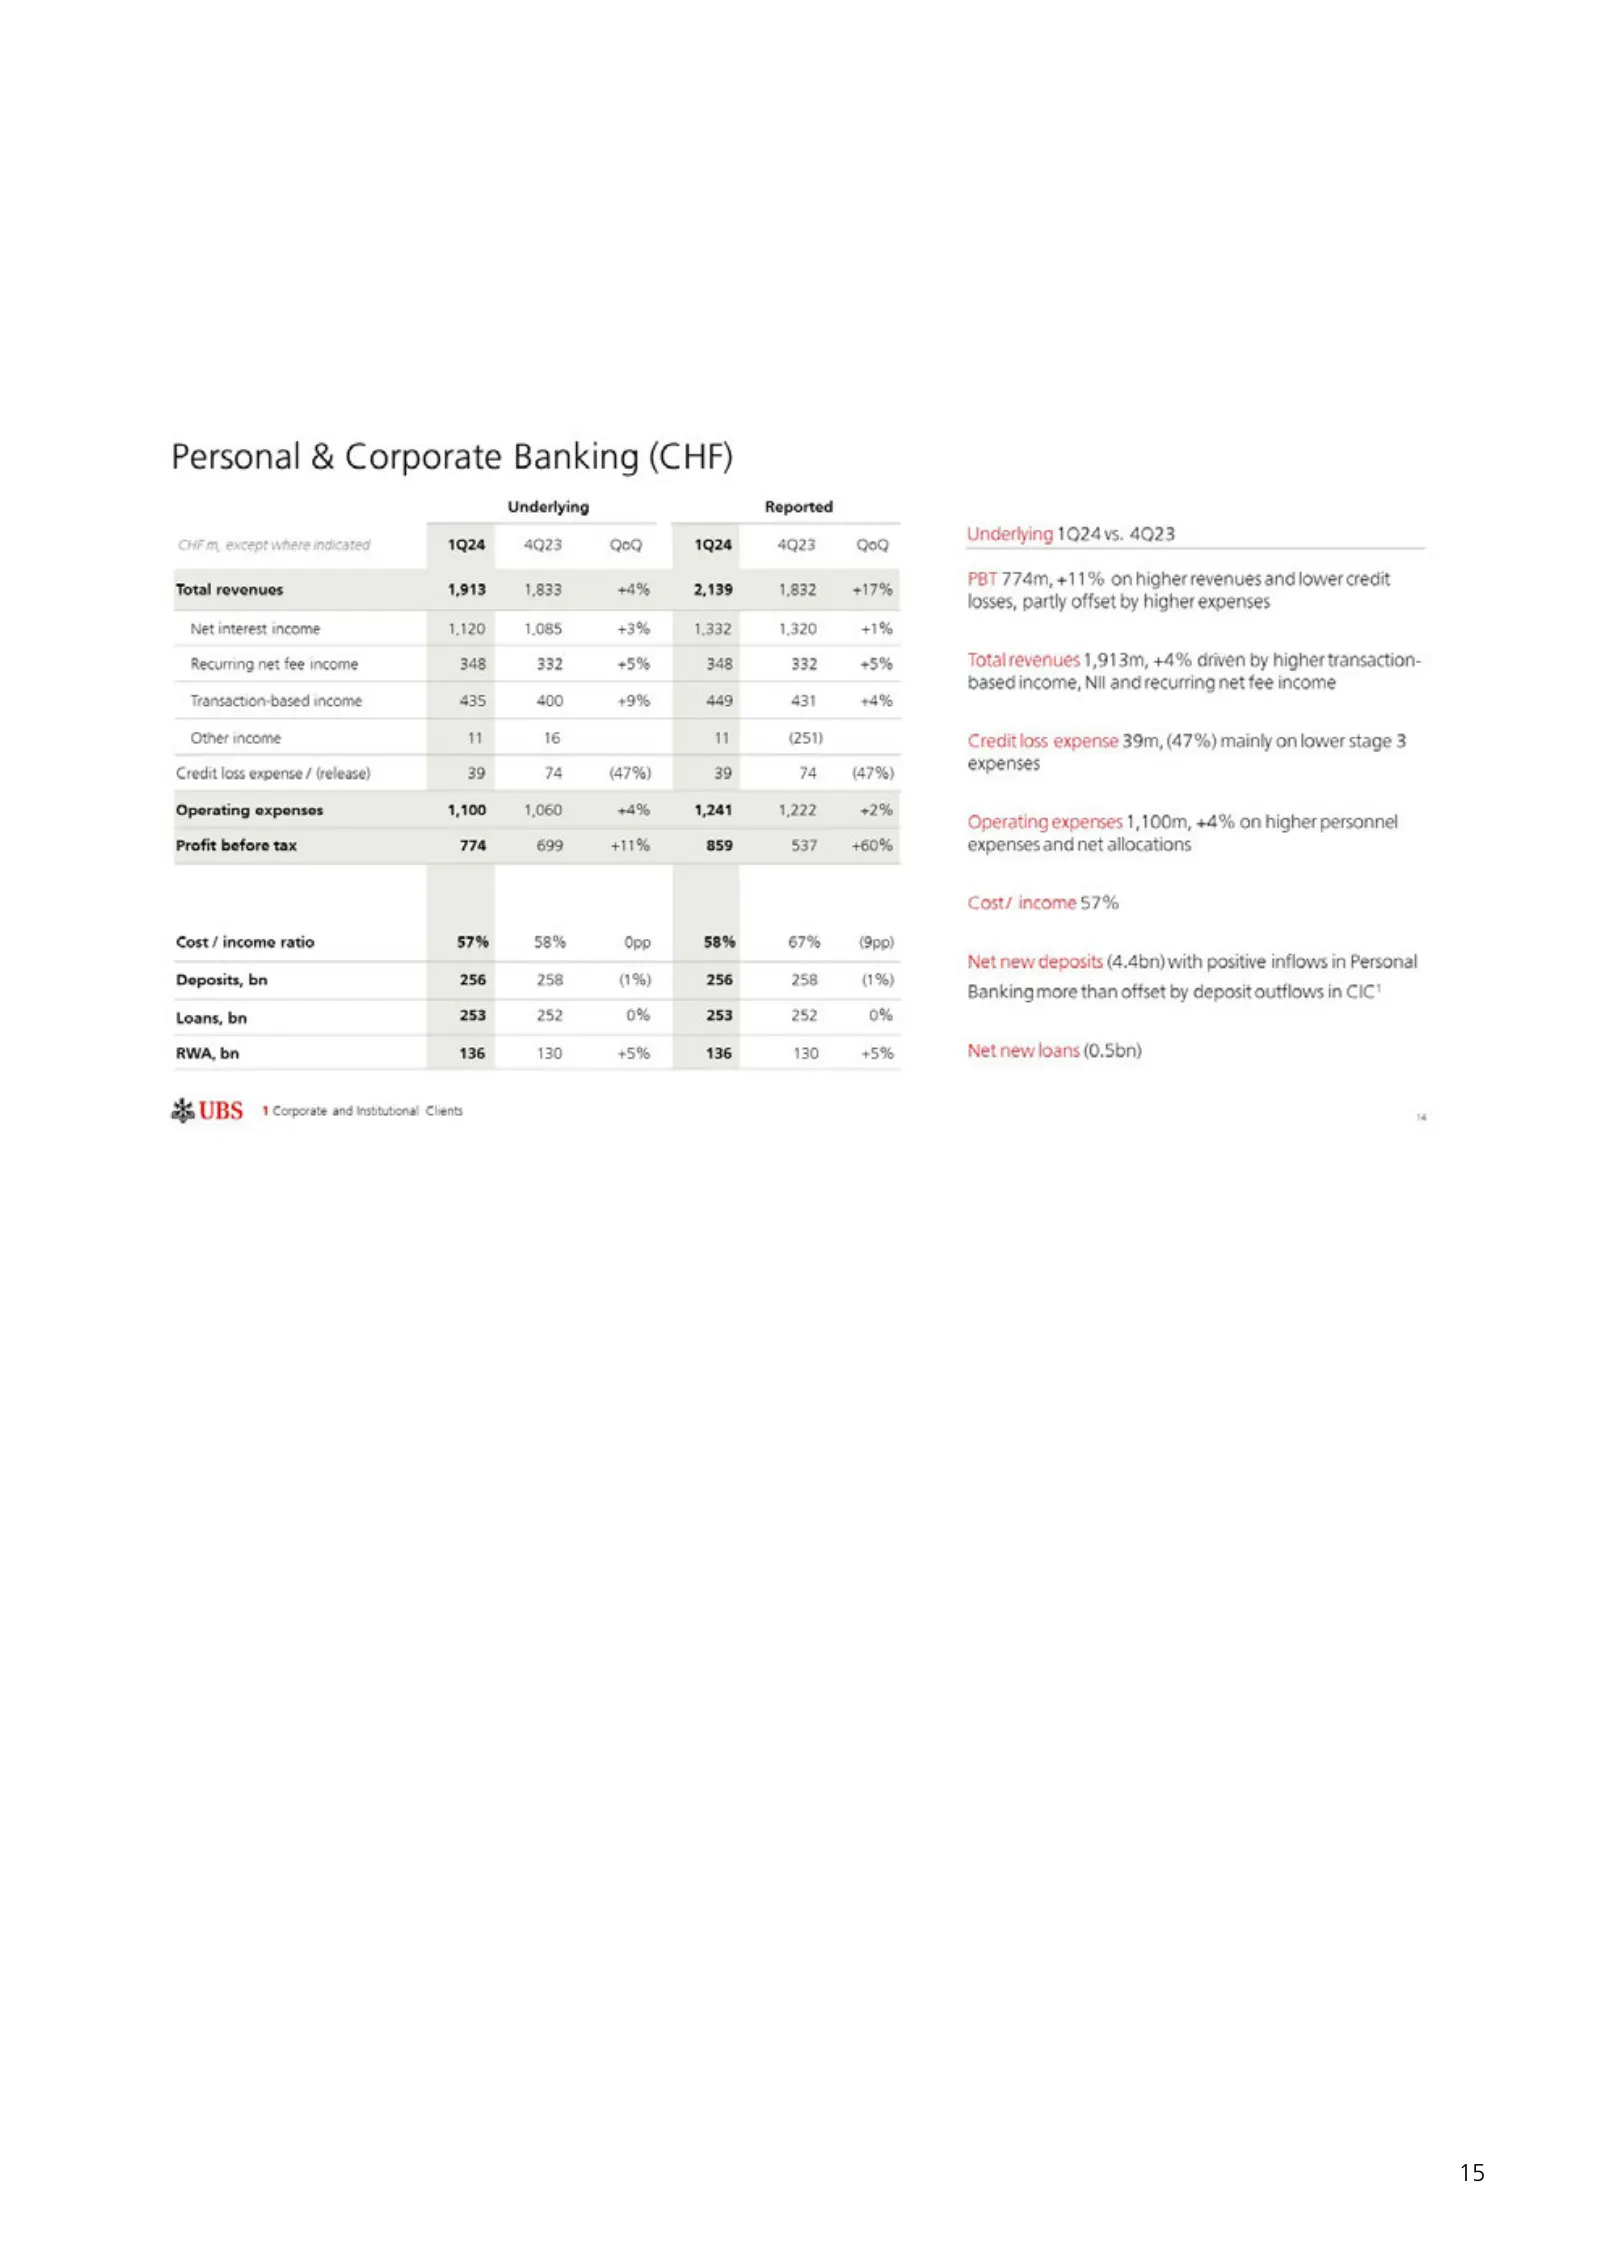
Slide 17: Personal & Corporate Banking (CHF)
Personal & Corporate Banking (CHF) Underlying Net interest income 1.120 1,085 +3% = 1,332 Recurring net fee income 348, 332 +5% 348 Transaction-based income 435 400 +9% 449 Other income " 16 on Credit loss expense / (release) 39 74 (47%) 39 Operating expenses 1,100 1,060 4% 1,241 Profit before tax 7
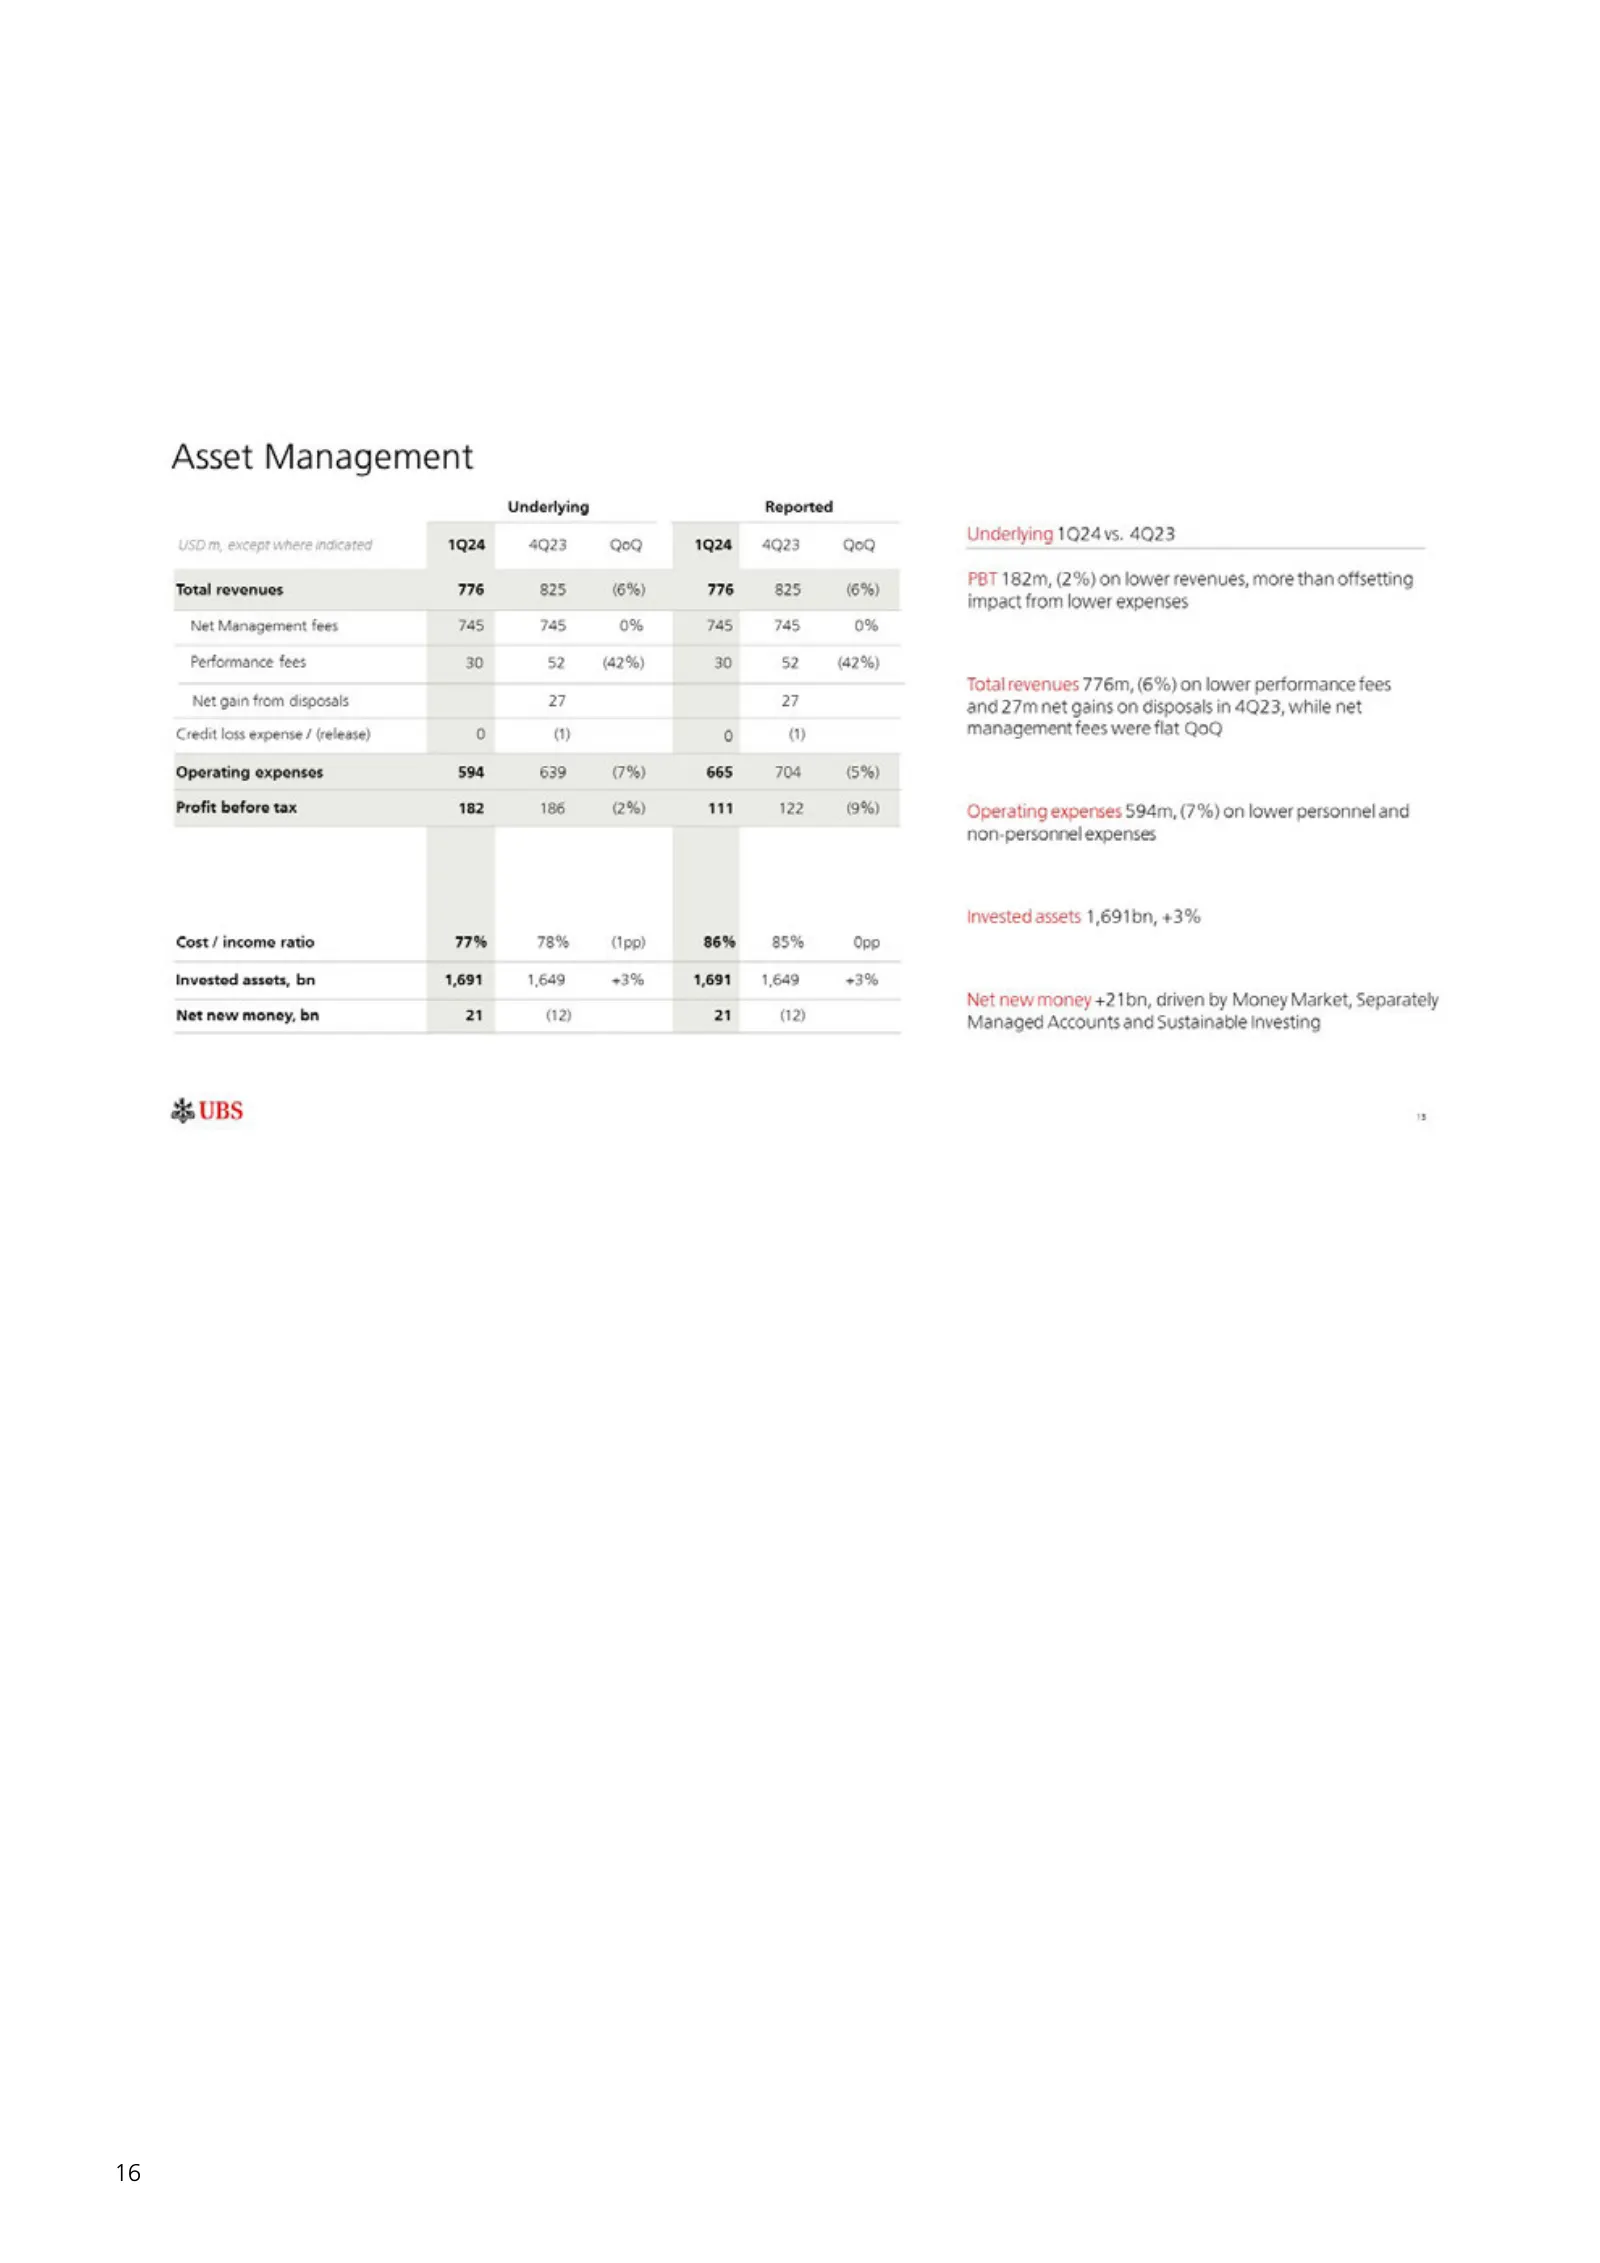
Slide 18: Asset Management
16 Asset Management Total revenues: Net Management fees Performance fees Net gain from disposals Credit loss expense / (release) Operating expenses Profit before tax 1924 745 77% 1,691 2 78% 1,649 (2) 7%) (2%) (pp) 33% aw 1,691 704 122 85% 1,649 (1a Opp +3% Underlying 1024 vs. 4023 PBT 182m, (2%) on
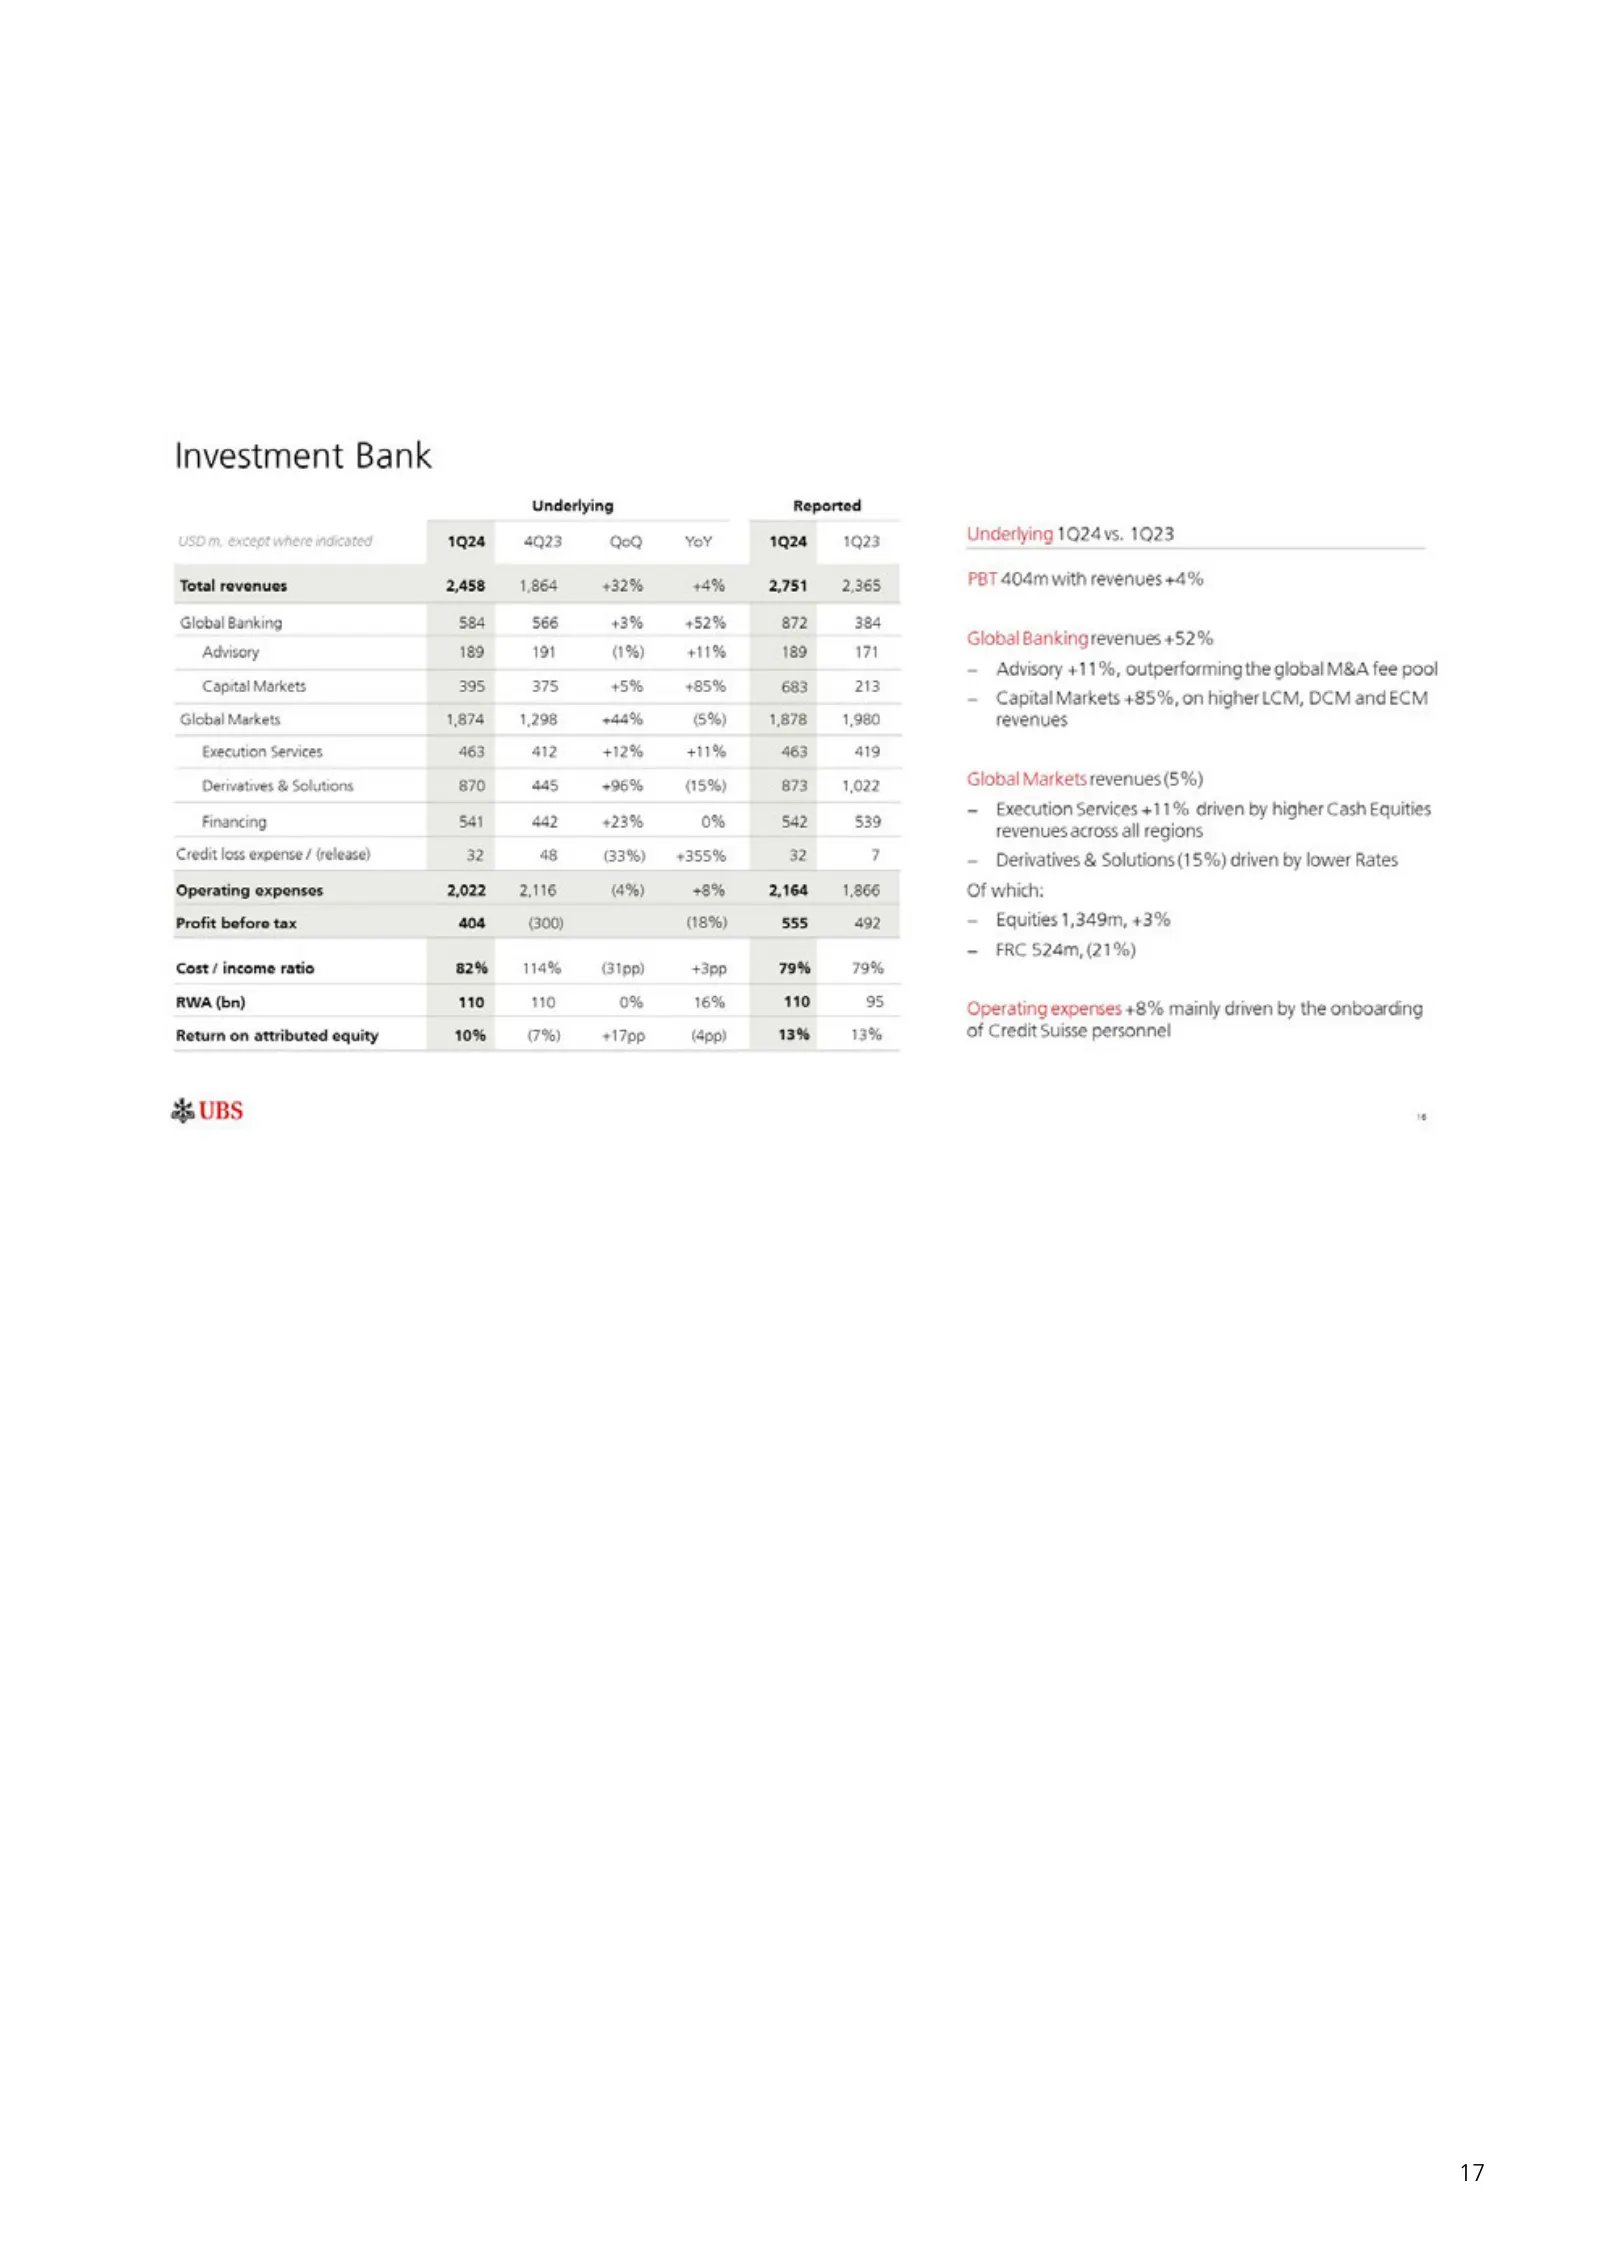
Slide 19: Investment Bank
Investment Bank where indicated ‘Total revenues Global Banking Advisory Capital Markets Global Markets Execution Services, Derivatives & Solutions Financing Credit loss expense / (release) Operating expenses Underlying 4Q23 QQ 1,864 432% 566 +3% 191 (1%) 375 +5% 1,298 748% 412 +12% 445 -+96% 442 +23
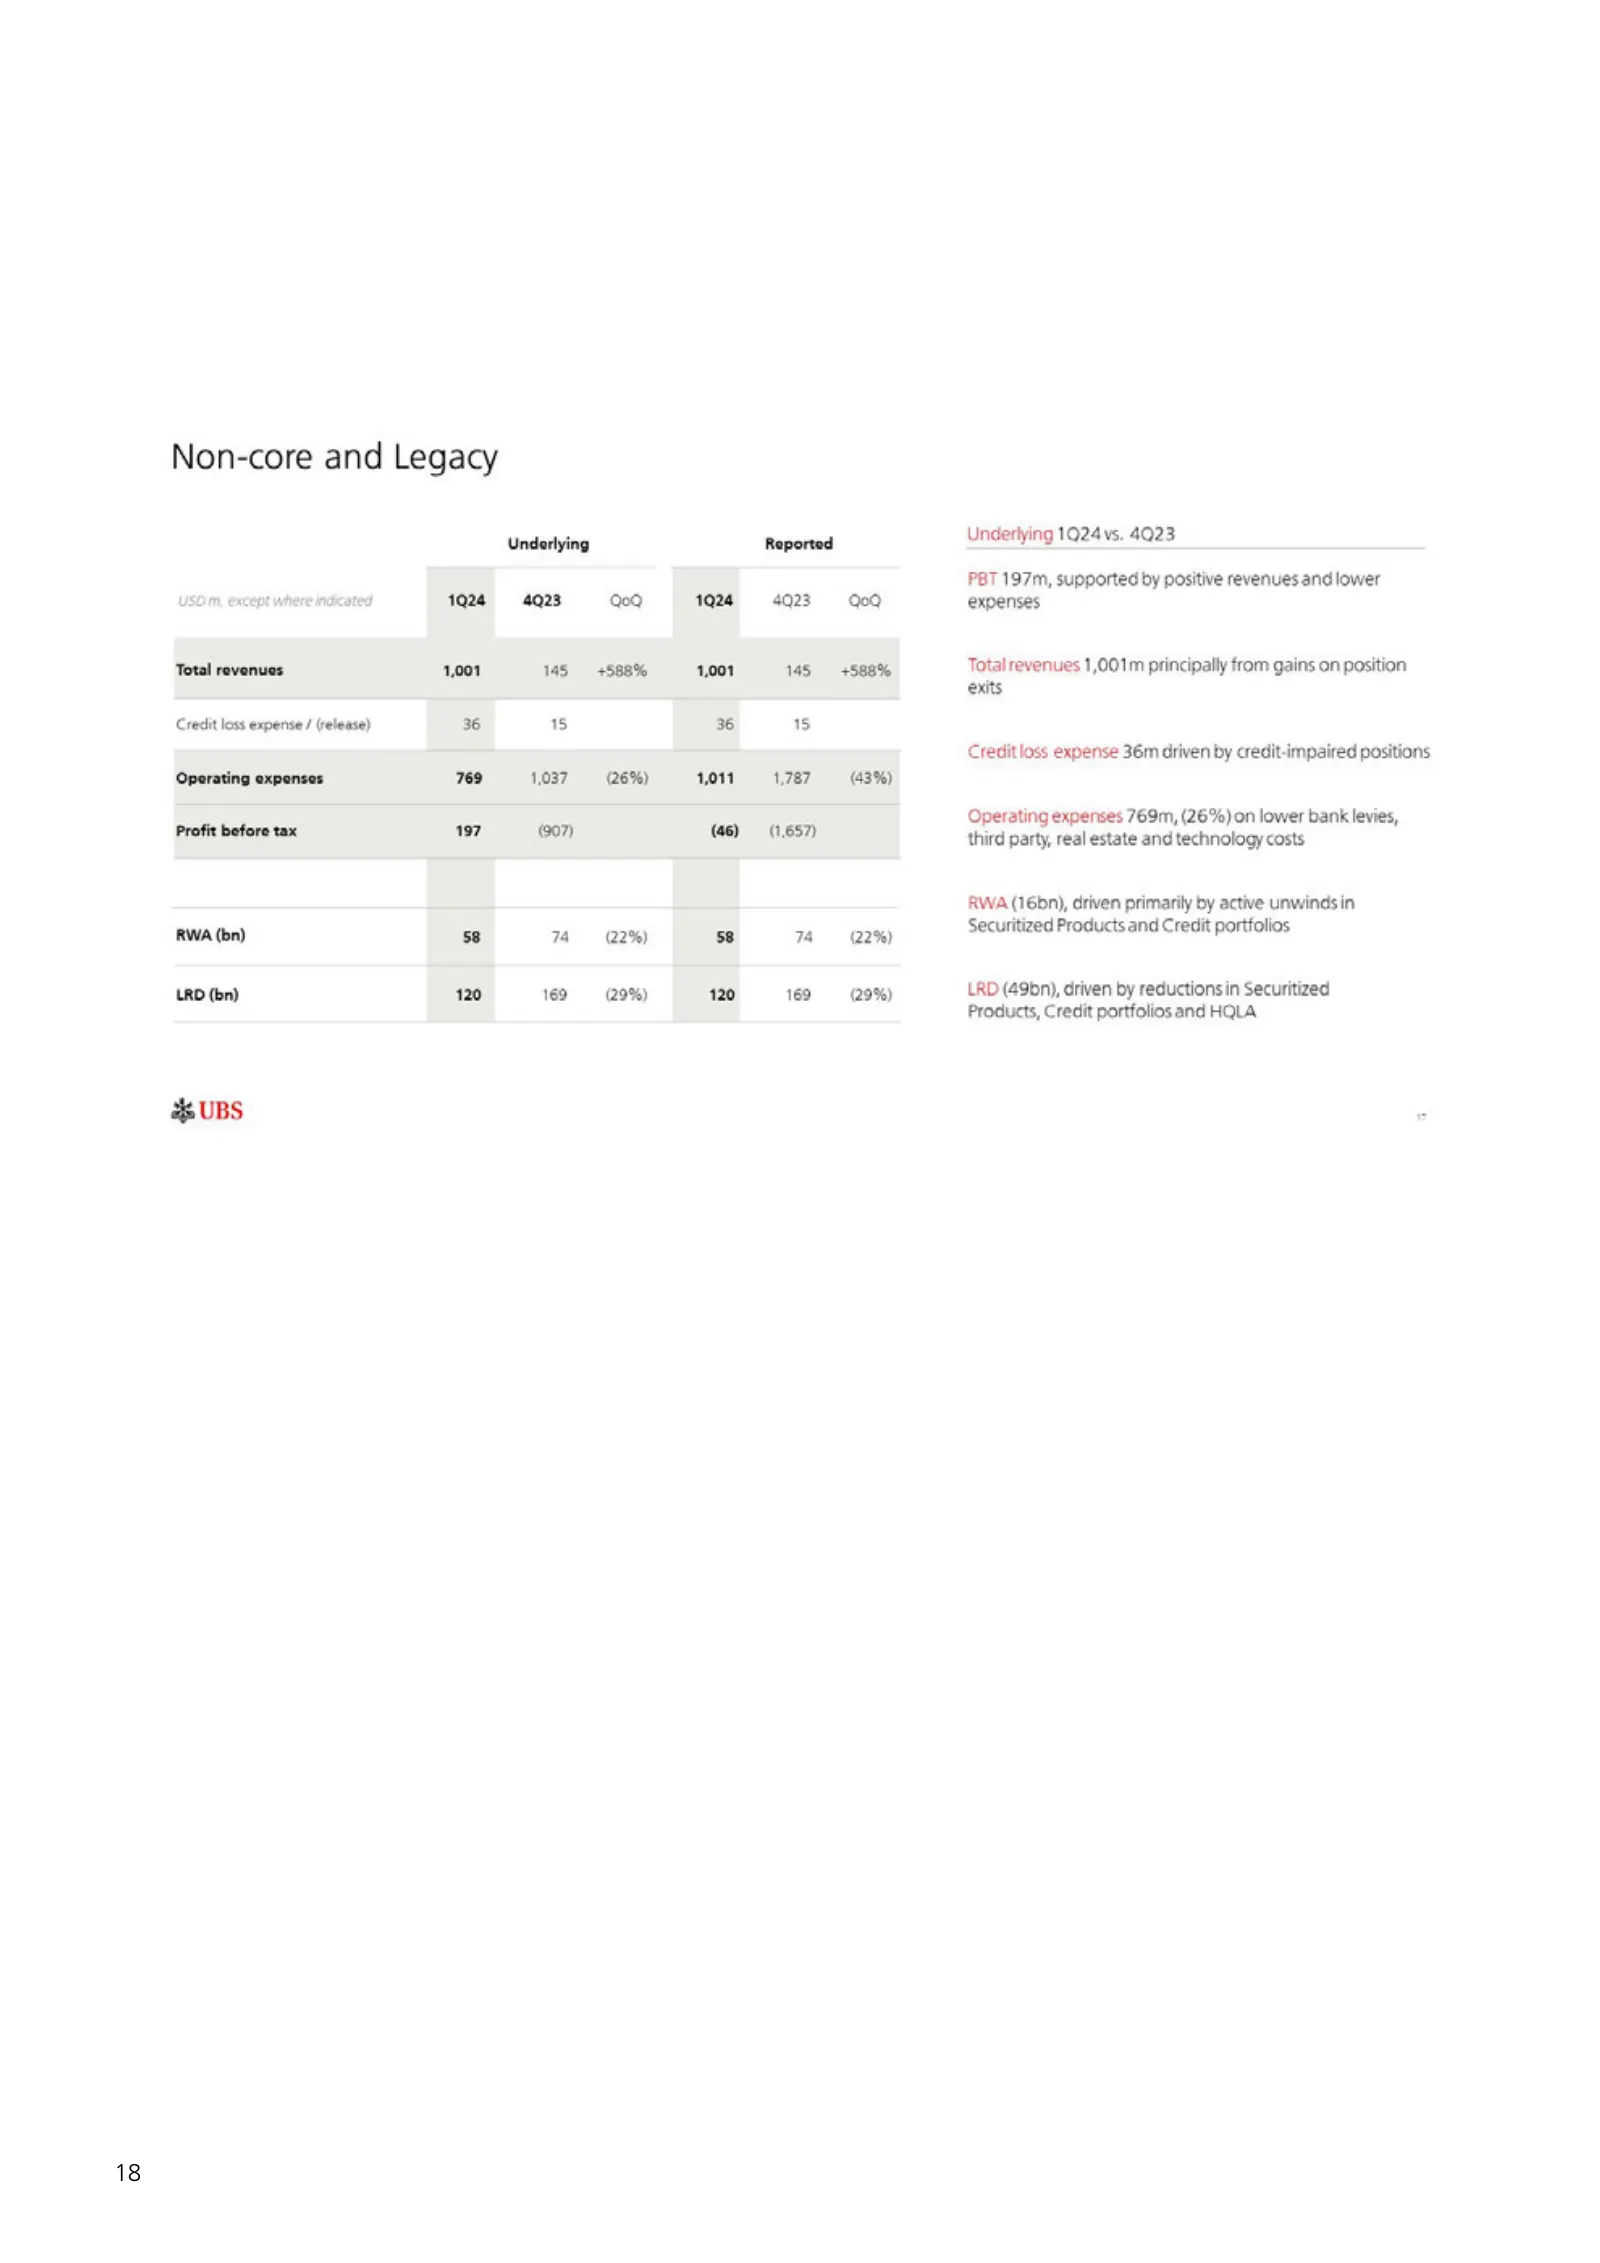
Slide 20: Non-core and Legacy
Non-core and Legacy disstig nisokies Underlying 1024 vs. 4023 PBT 197m, supported by positive revenues and lower except where indicated 1924 4Q23 QeQ 1Q24 4023 Q0Q expenses Total revenues 1,001 145 +588% 1,001 145 +588% Total revenues 1,001m principally from gains on position exits Credit loss expen
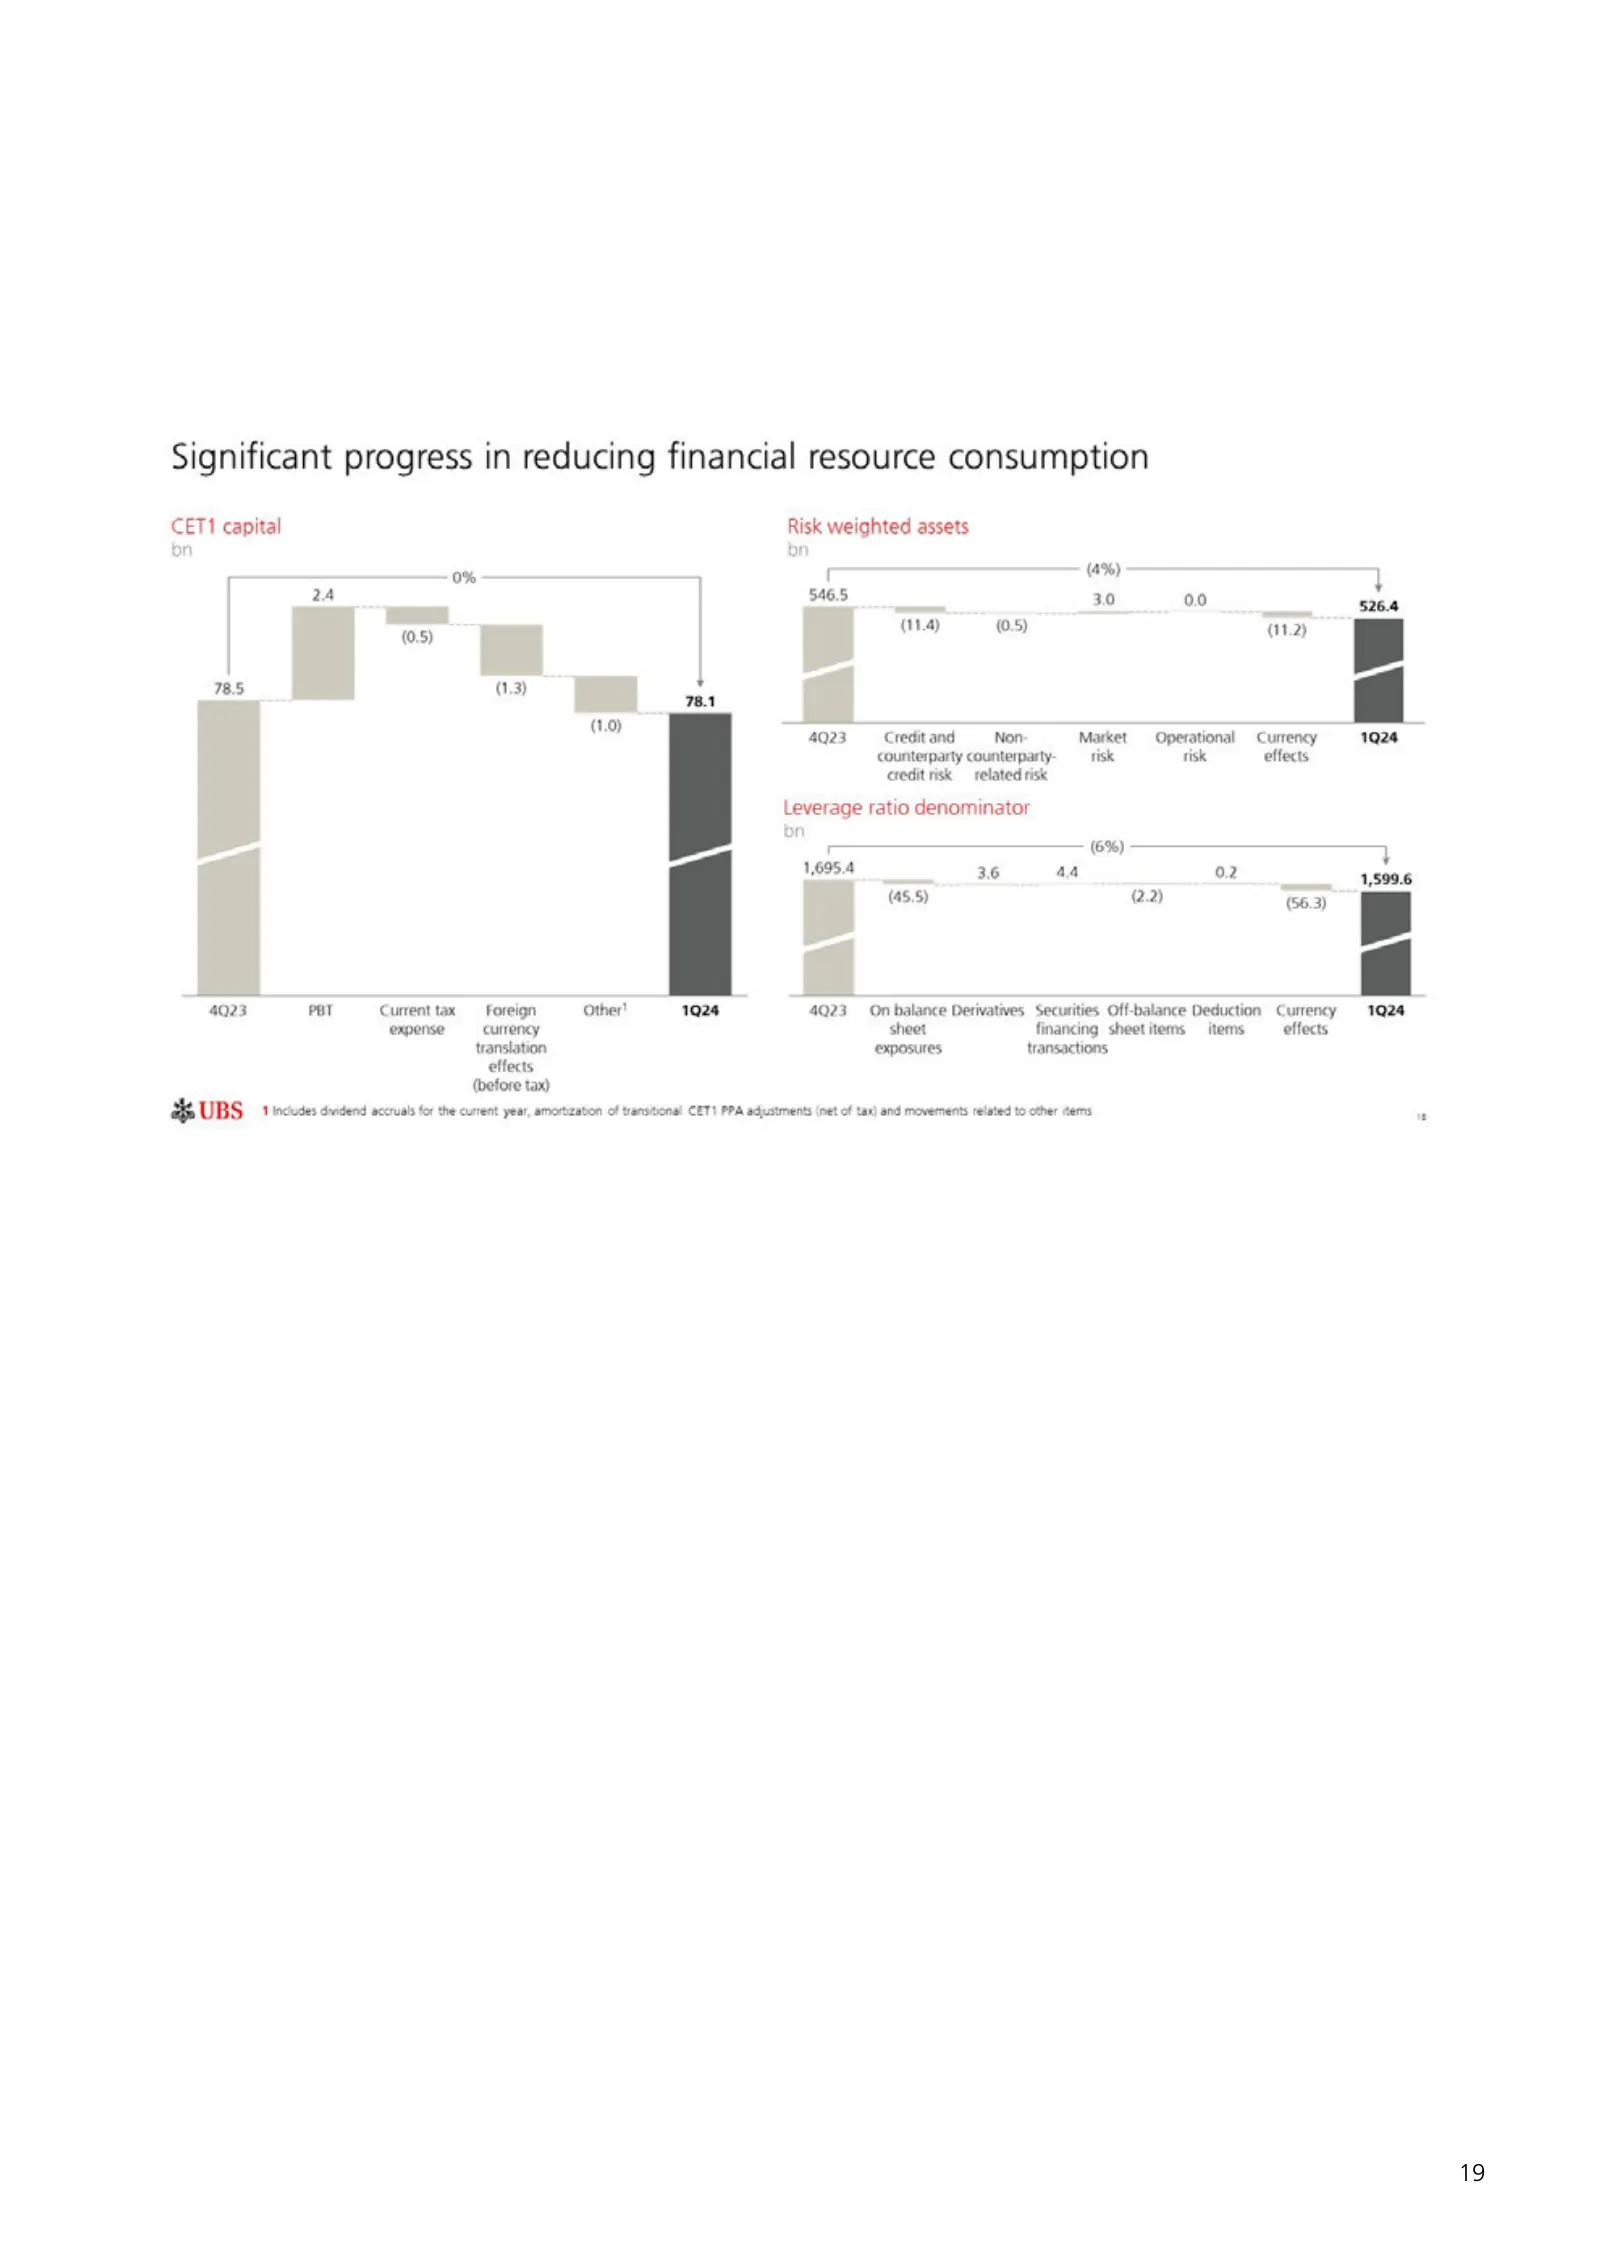
Slide 21: Significant progress in reducing financial resource consumption
Significant progress in reducing financial resource consumption CET1 capital bn 0% 24 = (0.5) i 78. 1.3) 8.5 (3) i oa (1,0) 4023 PBT Current tax Foreign Other! 1924 expense currency translation effects (before tax) SUBS | 1 incieses duidend accruals for the caren year, amortization of transitional C
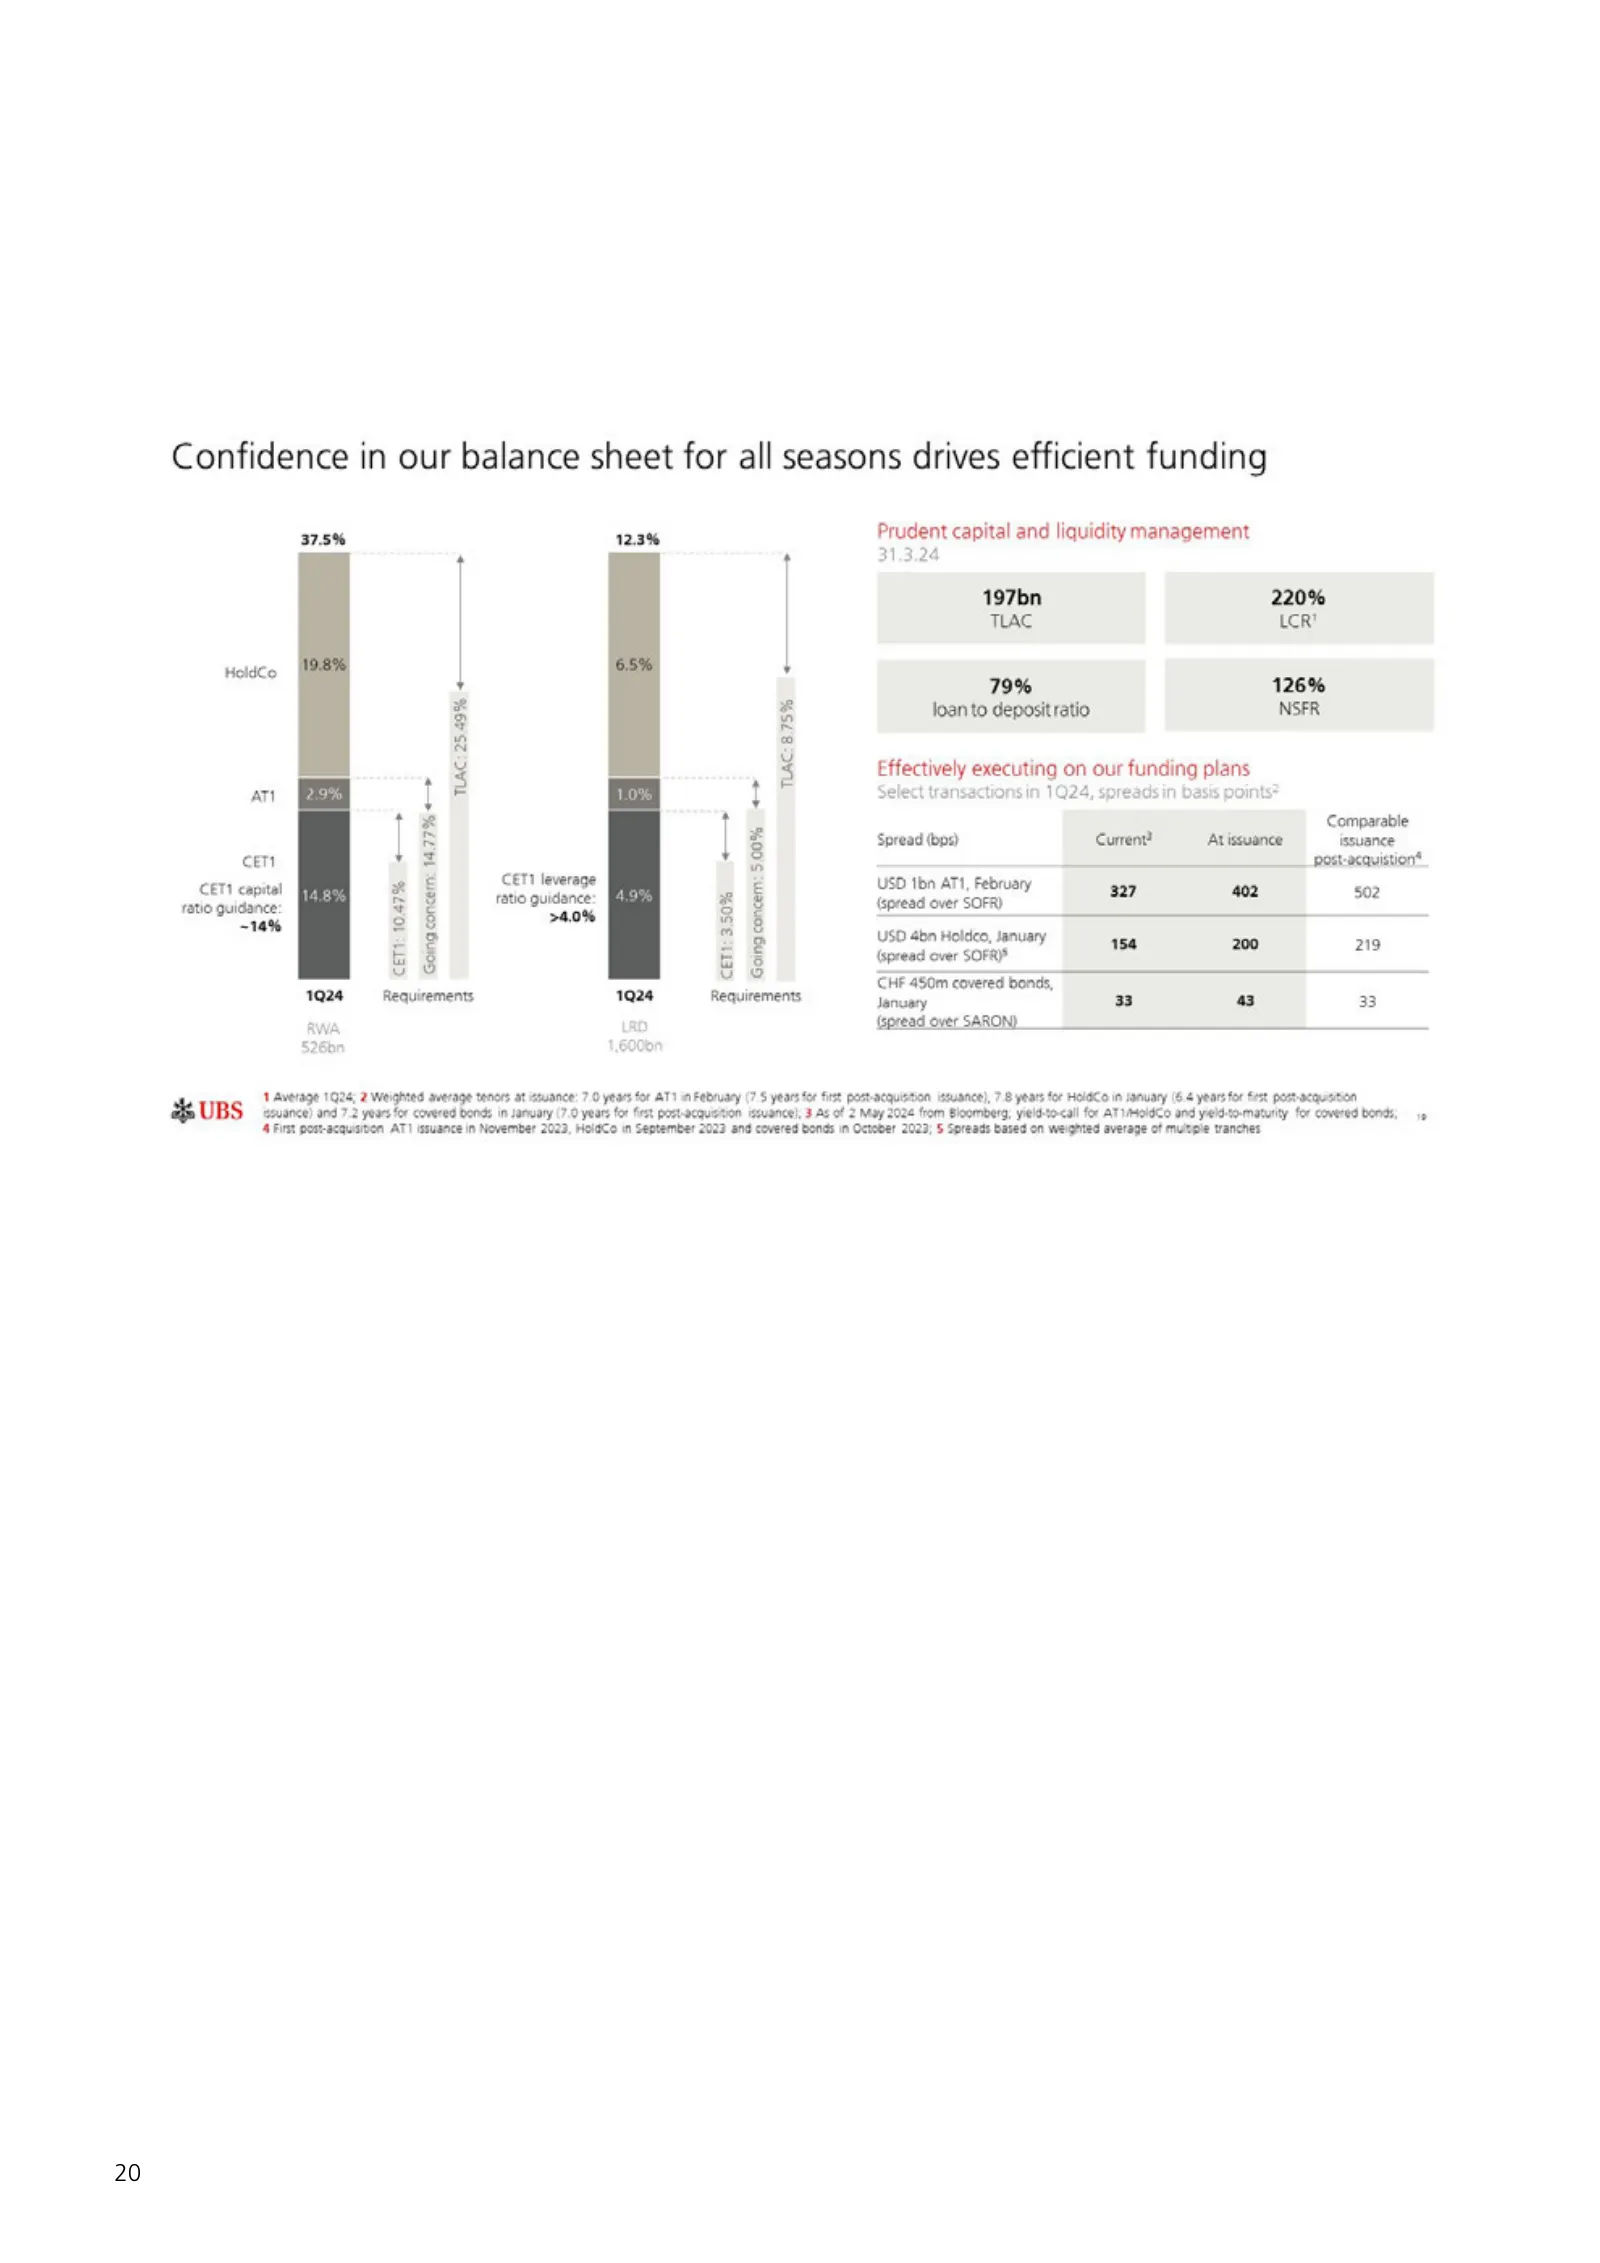
Slide 22: Confidence in our balance sheet for all seasons drives efficient funding
20 Confidence in our balance sheet for all seasons drives efficient funding 37.5% 123% poet capital and liquidity management 197bn 220% TLAC LCR’ Holdc © 79% 126% Fy x loan to deposit ratio NSFR 4 ® + 3 Effectively executing on our funding plans an if t Select transactions in 1024, spreads in basis

Slide 23: Appendix
Appendix a UBS
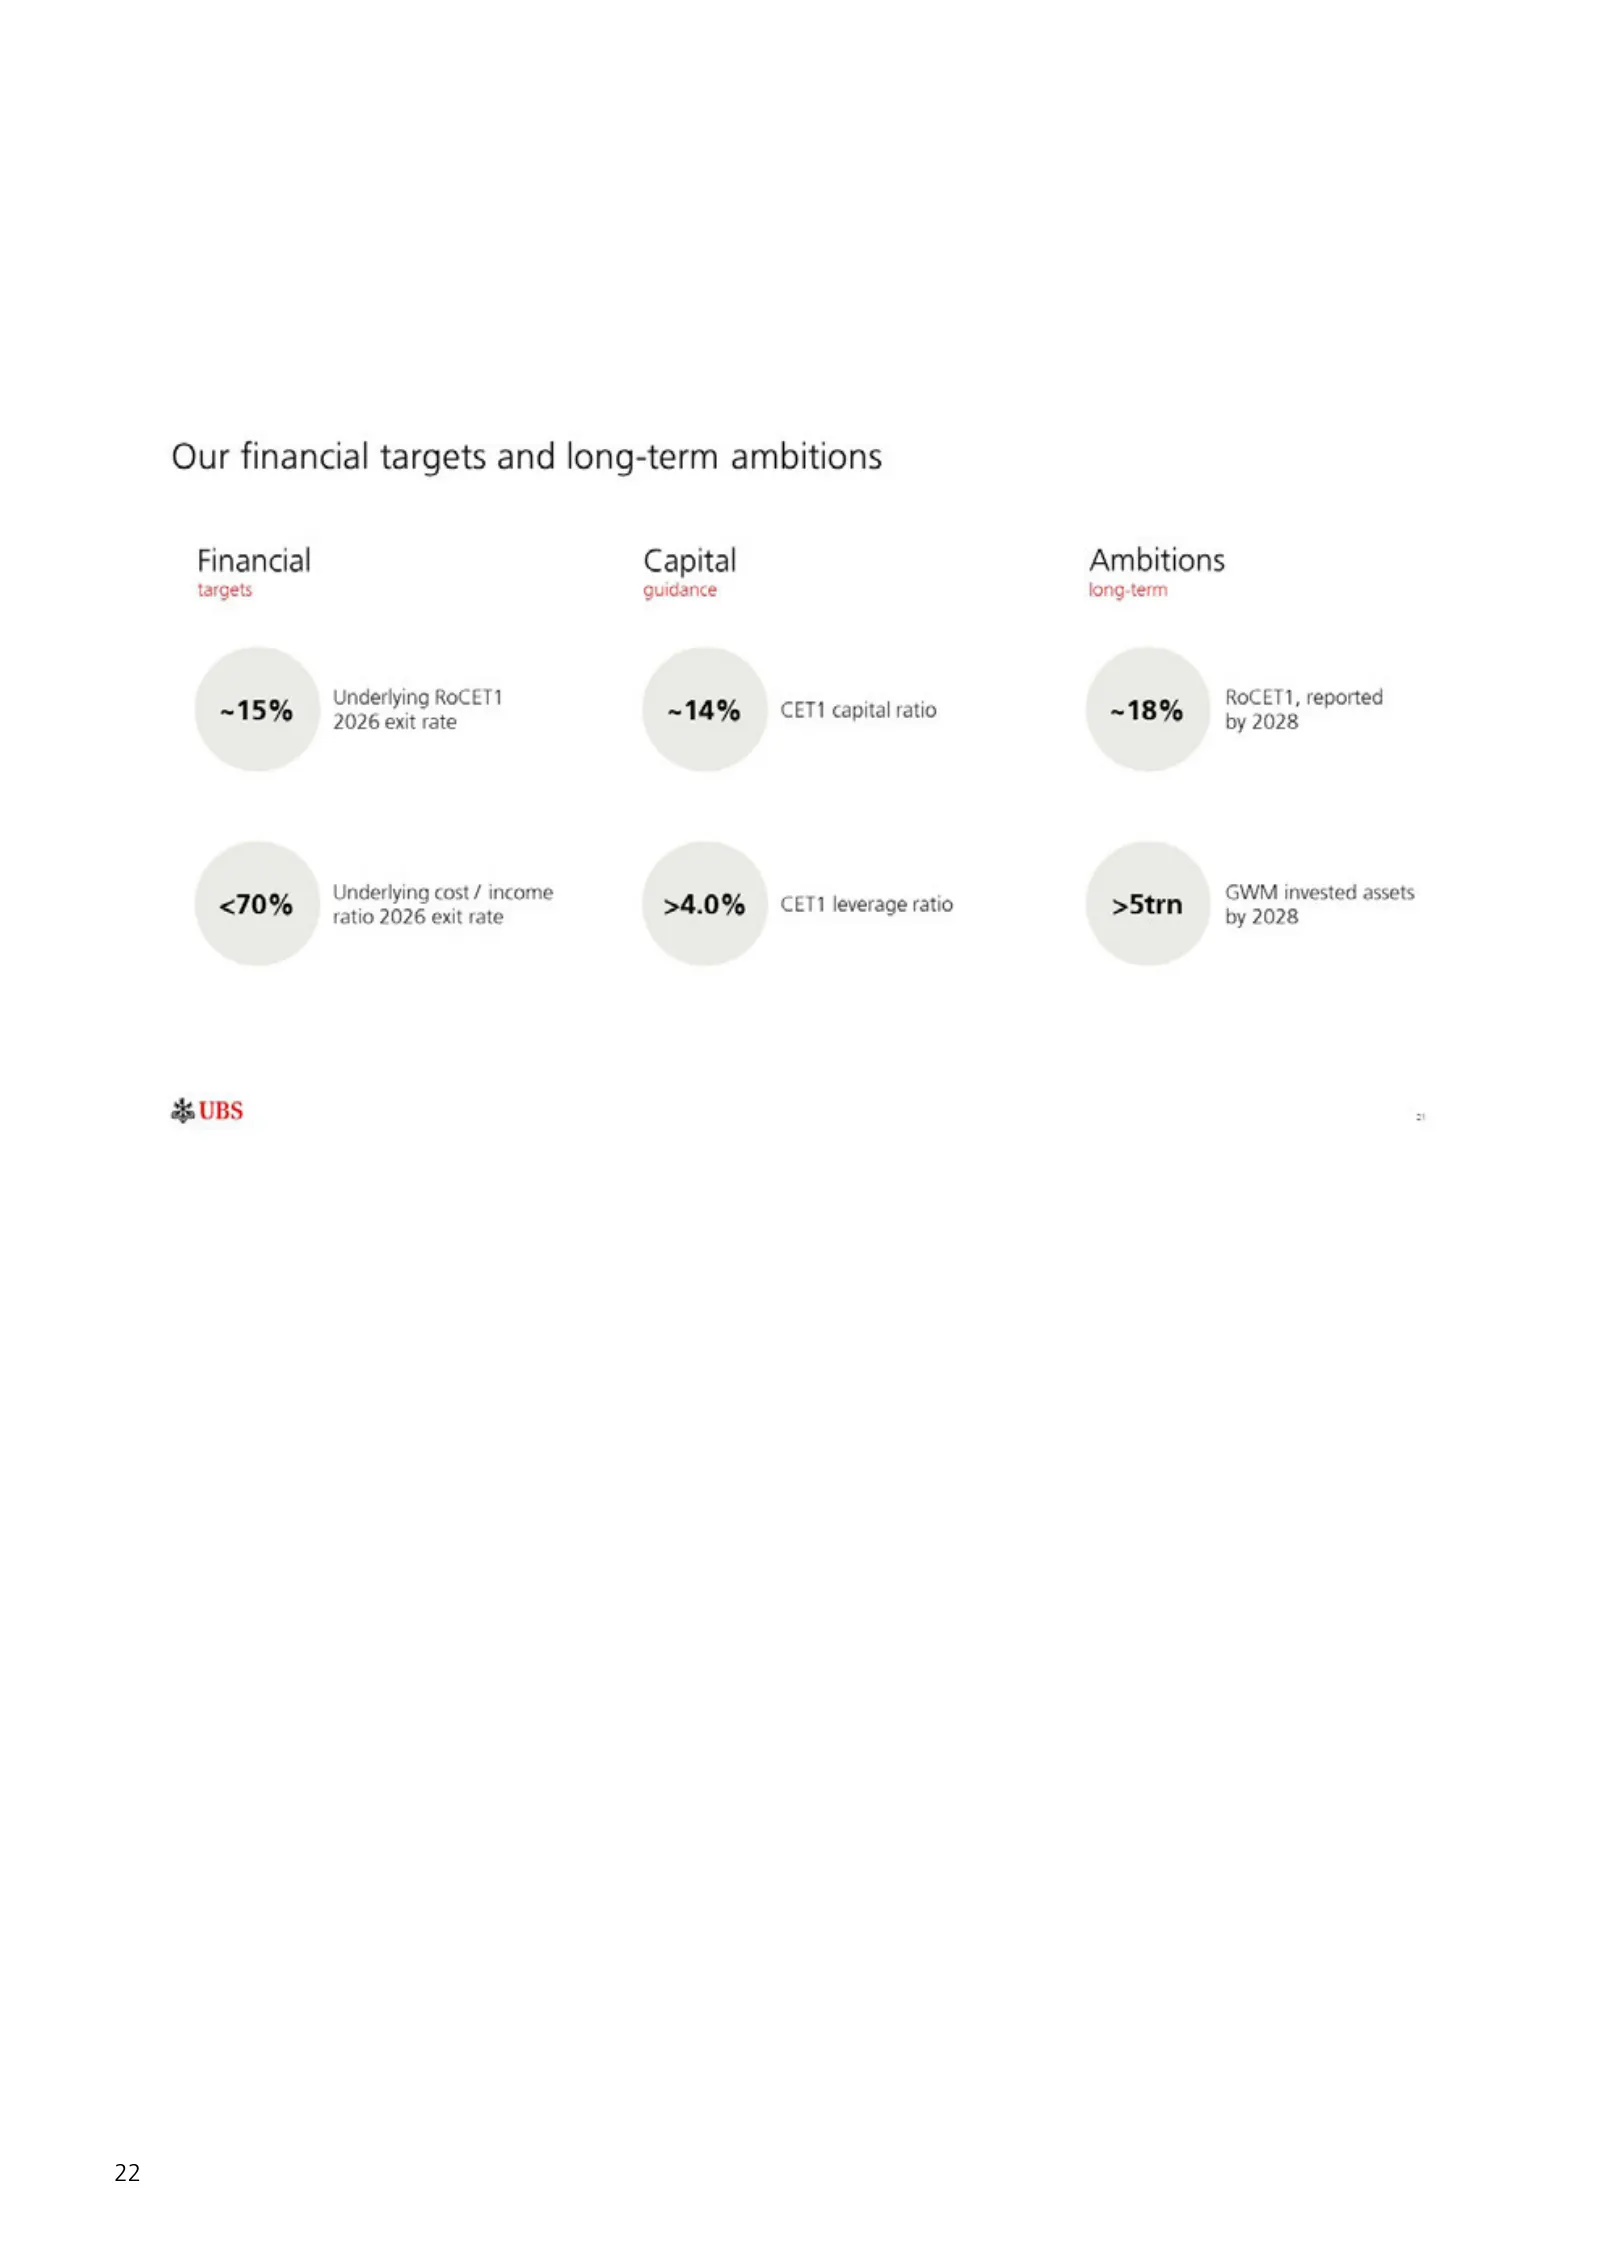
Slide 24: Our financial targets and long-term ambitions
22 Our financial targets and long-term ambitions Financial Capital targets guidance Underlying RoCET1 ~15% 4026 exit rate ~14% — CET! capital ratio <70% Underlying cost / income 54.0% CET1 leverage ratio ratio 2026 exit rate UBS Ambitions long-term ~18% >5trn RoCET1, reported by 2028 GWM invested as
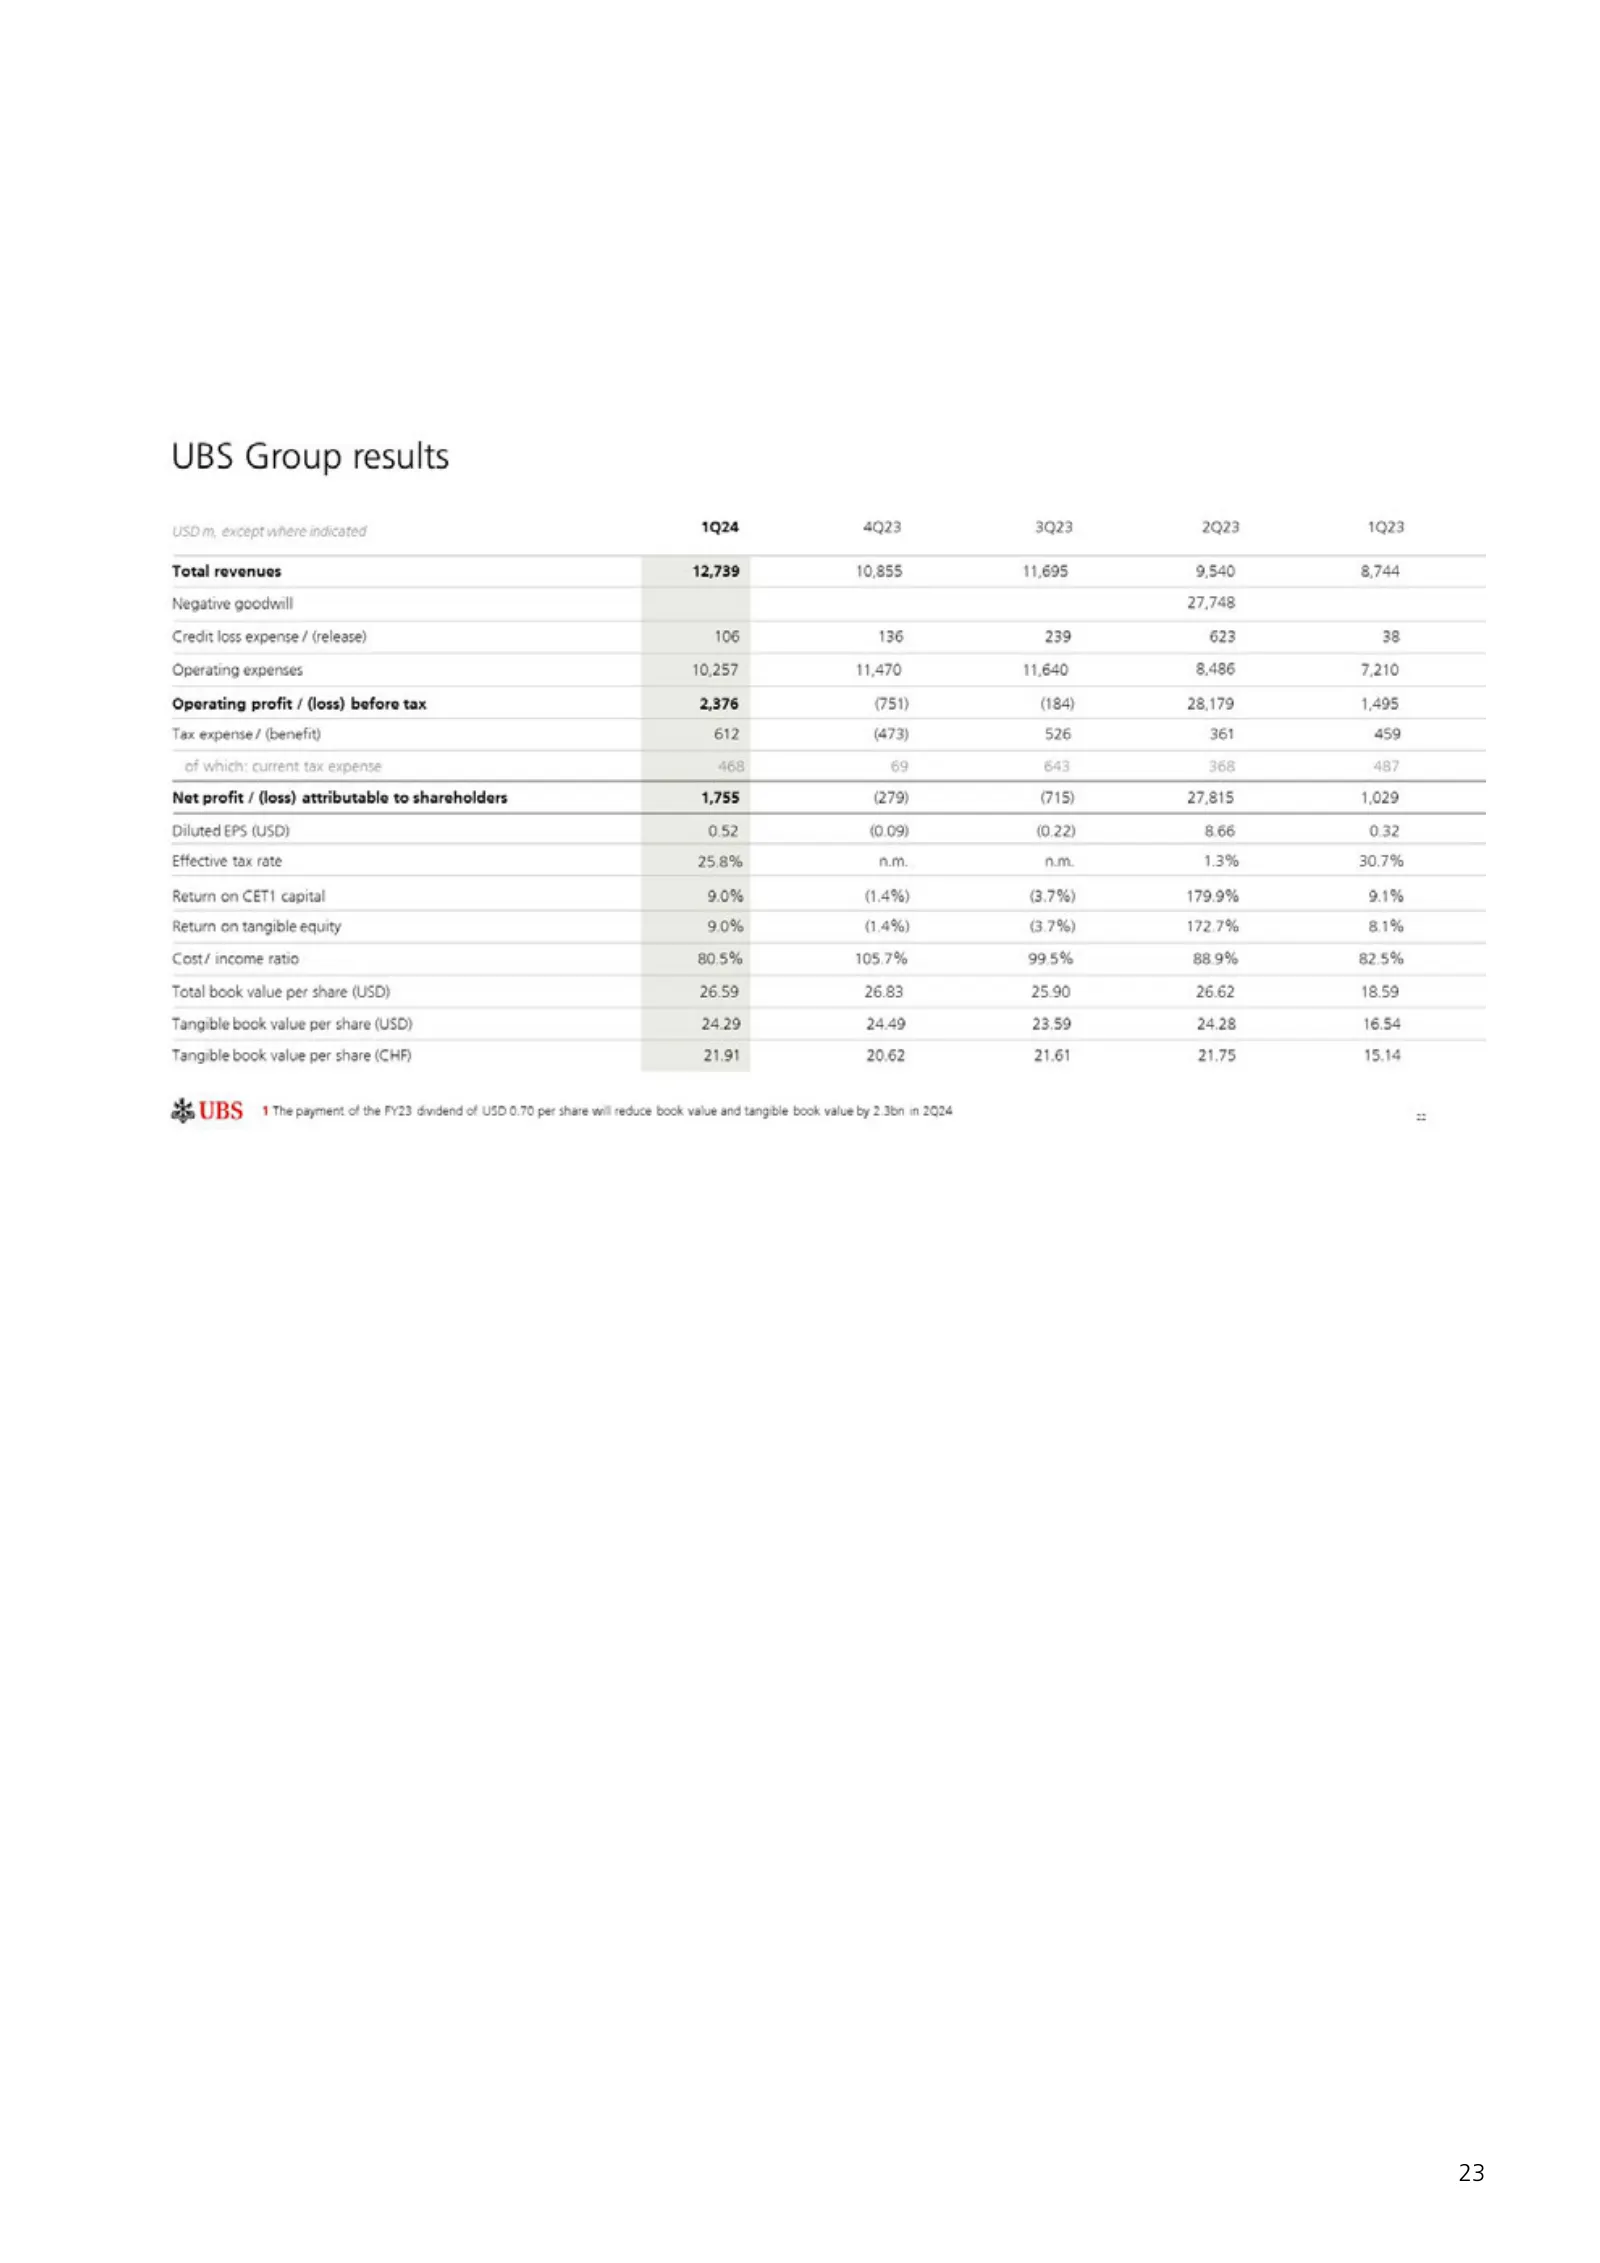
Slide 25: UBS Group results
UBS Group results USD m, except where indicated 1924 4923 3923 2923 1923 Total revenues 12,739 10,855 11,695 9,540 8.744 Negative goodwill 27.748 Credit loss expense / (release) 106 136 239 623 38 Operating expenses 10,257 11,470 11,640 8.486 7.210 Operating profit / (loss) before tax 2,376 (751) (1
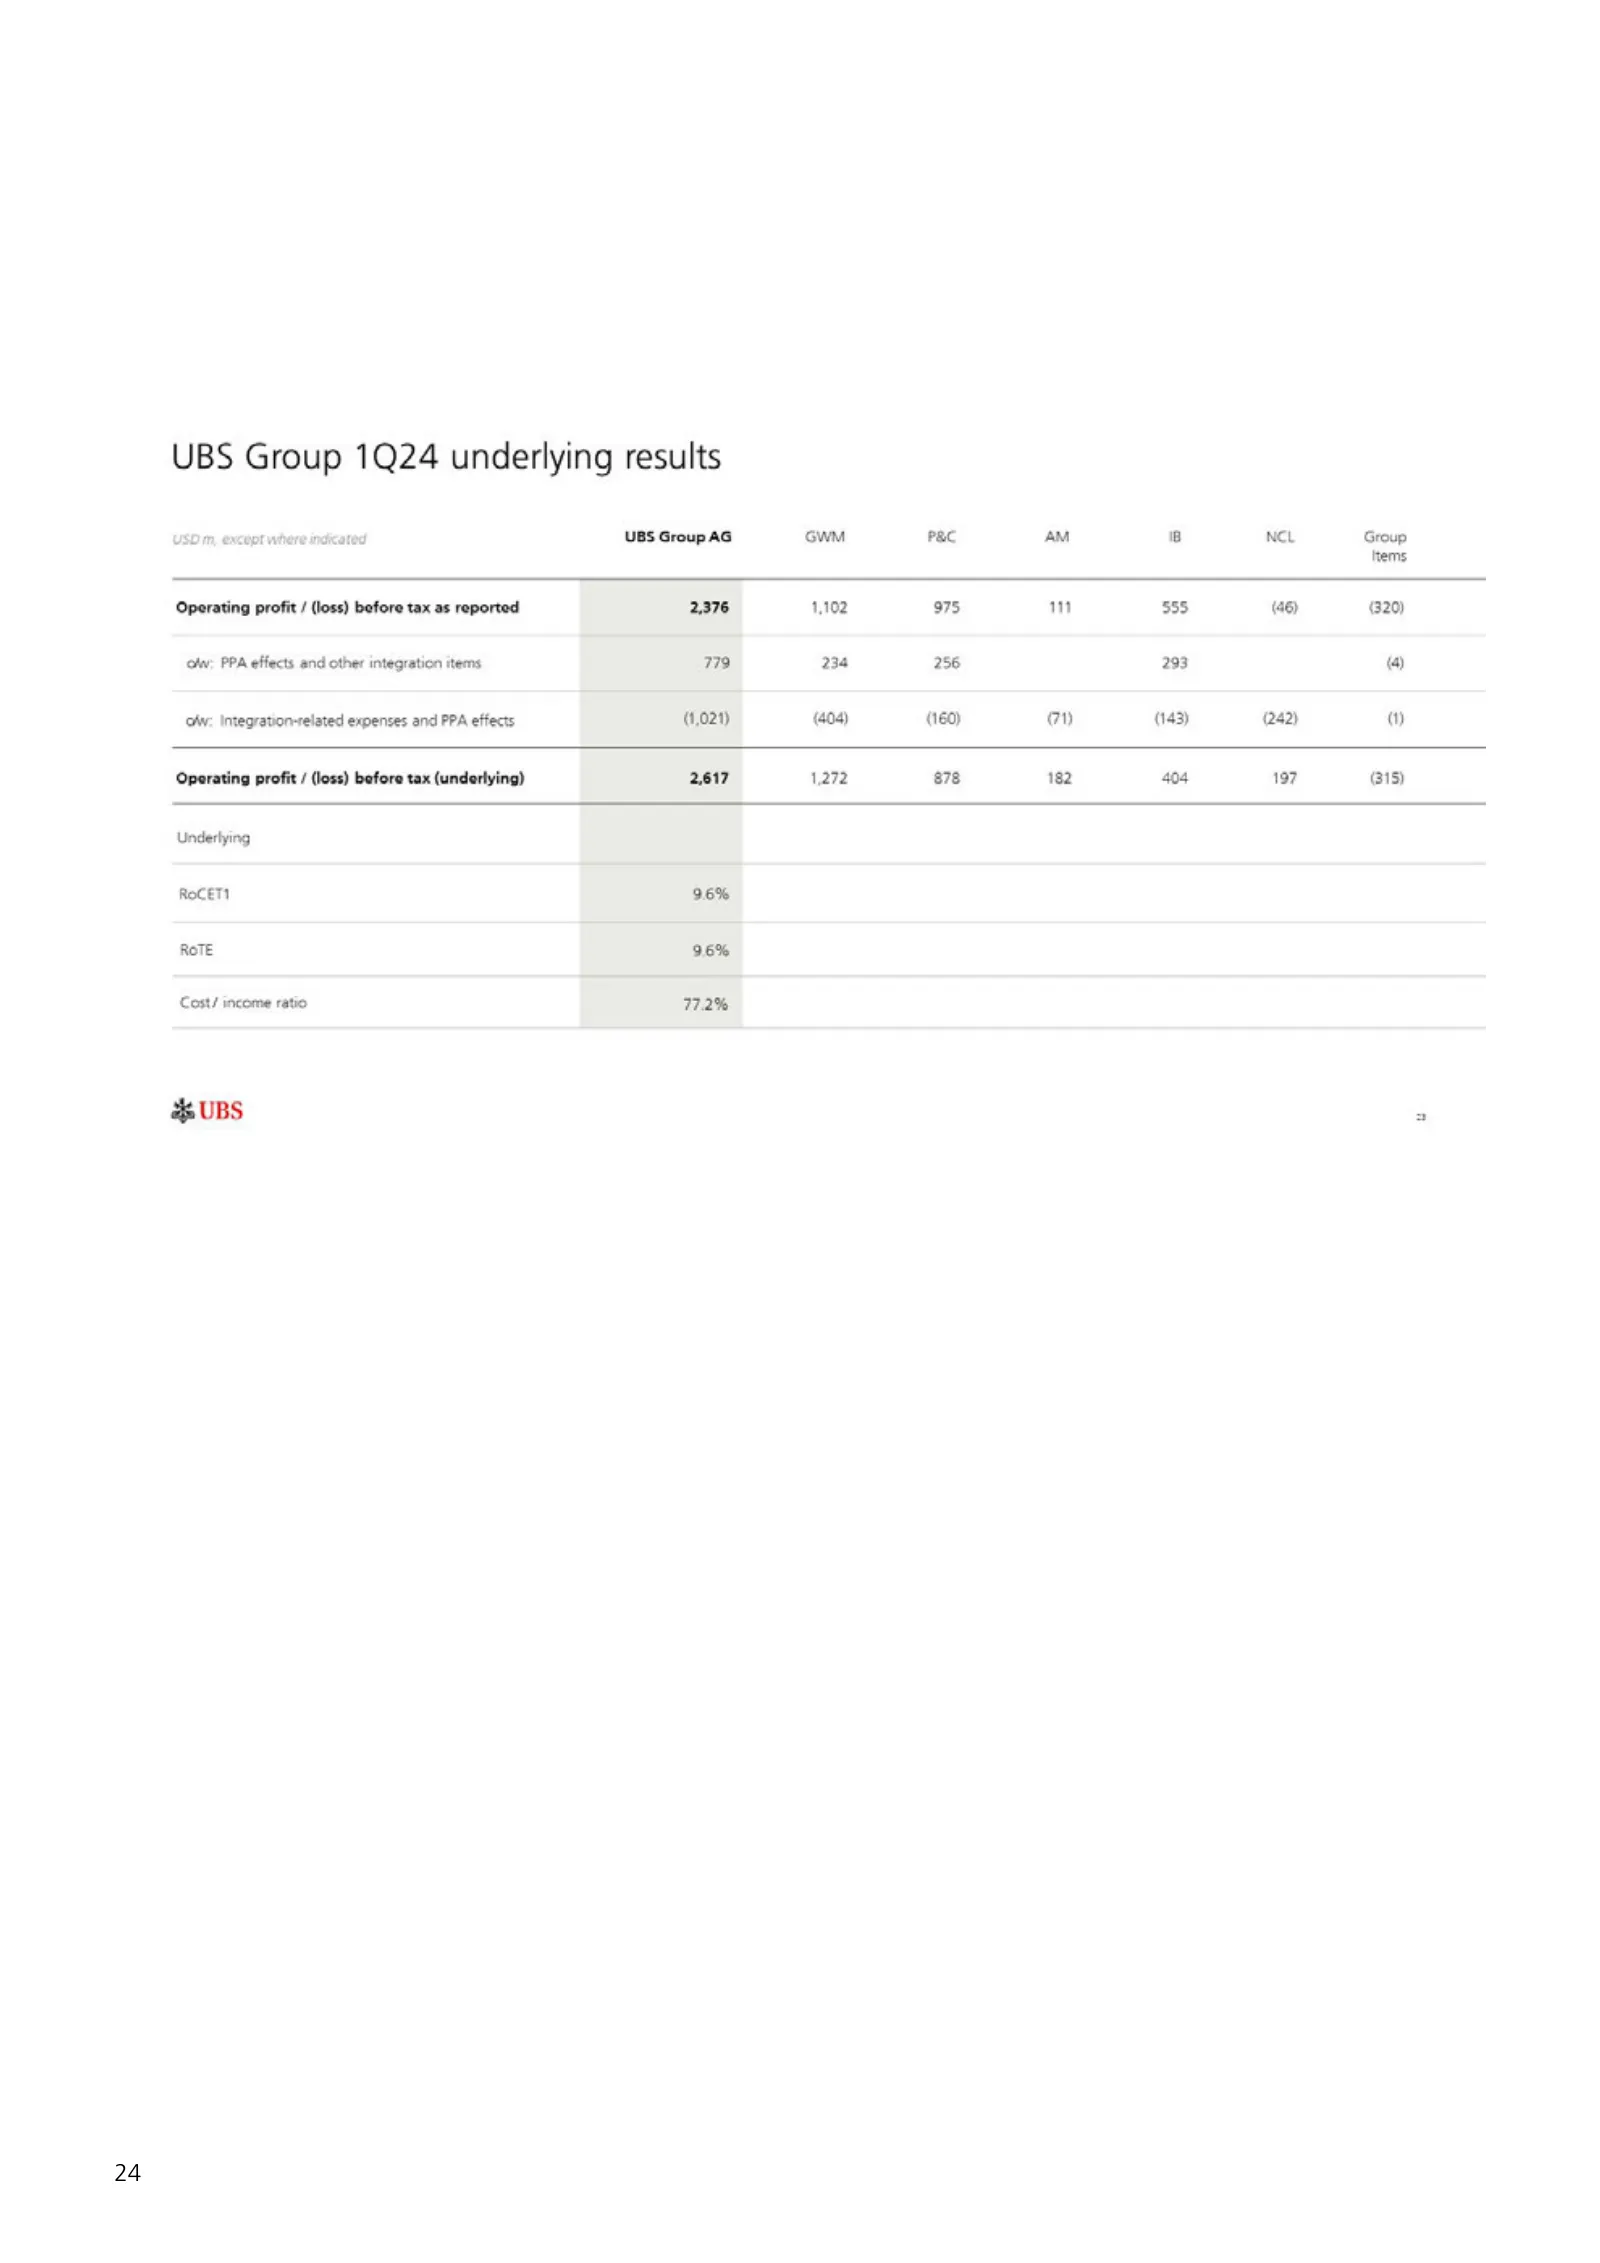
Slide 26: UBS Group 1Q24 underlying results
24 UBS Group 1Q24 underlying results USD m, except where indicated UBS Group AG GWM Pac AM ‘8 NCL Group hems Operating profit / (loss) before tax as reported 2,376 1,102 975 m 355 (46) 320) of: PPA effects and other integration items 779 234 256 293 (a) Ww: Integrapon-related expenses and PPA effect
Slide 27: PPA pull to par overview and revenue recognition
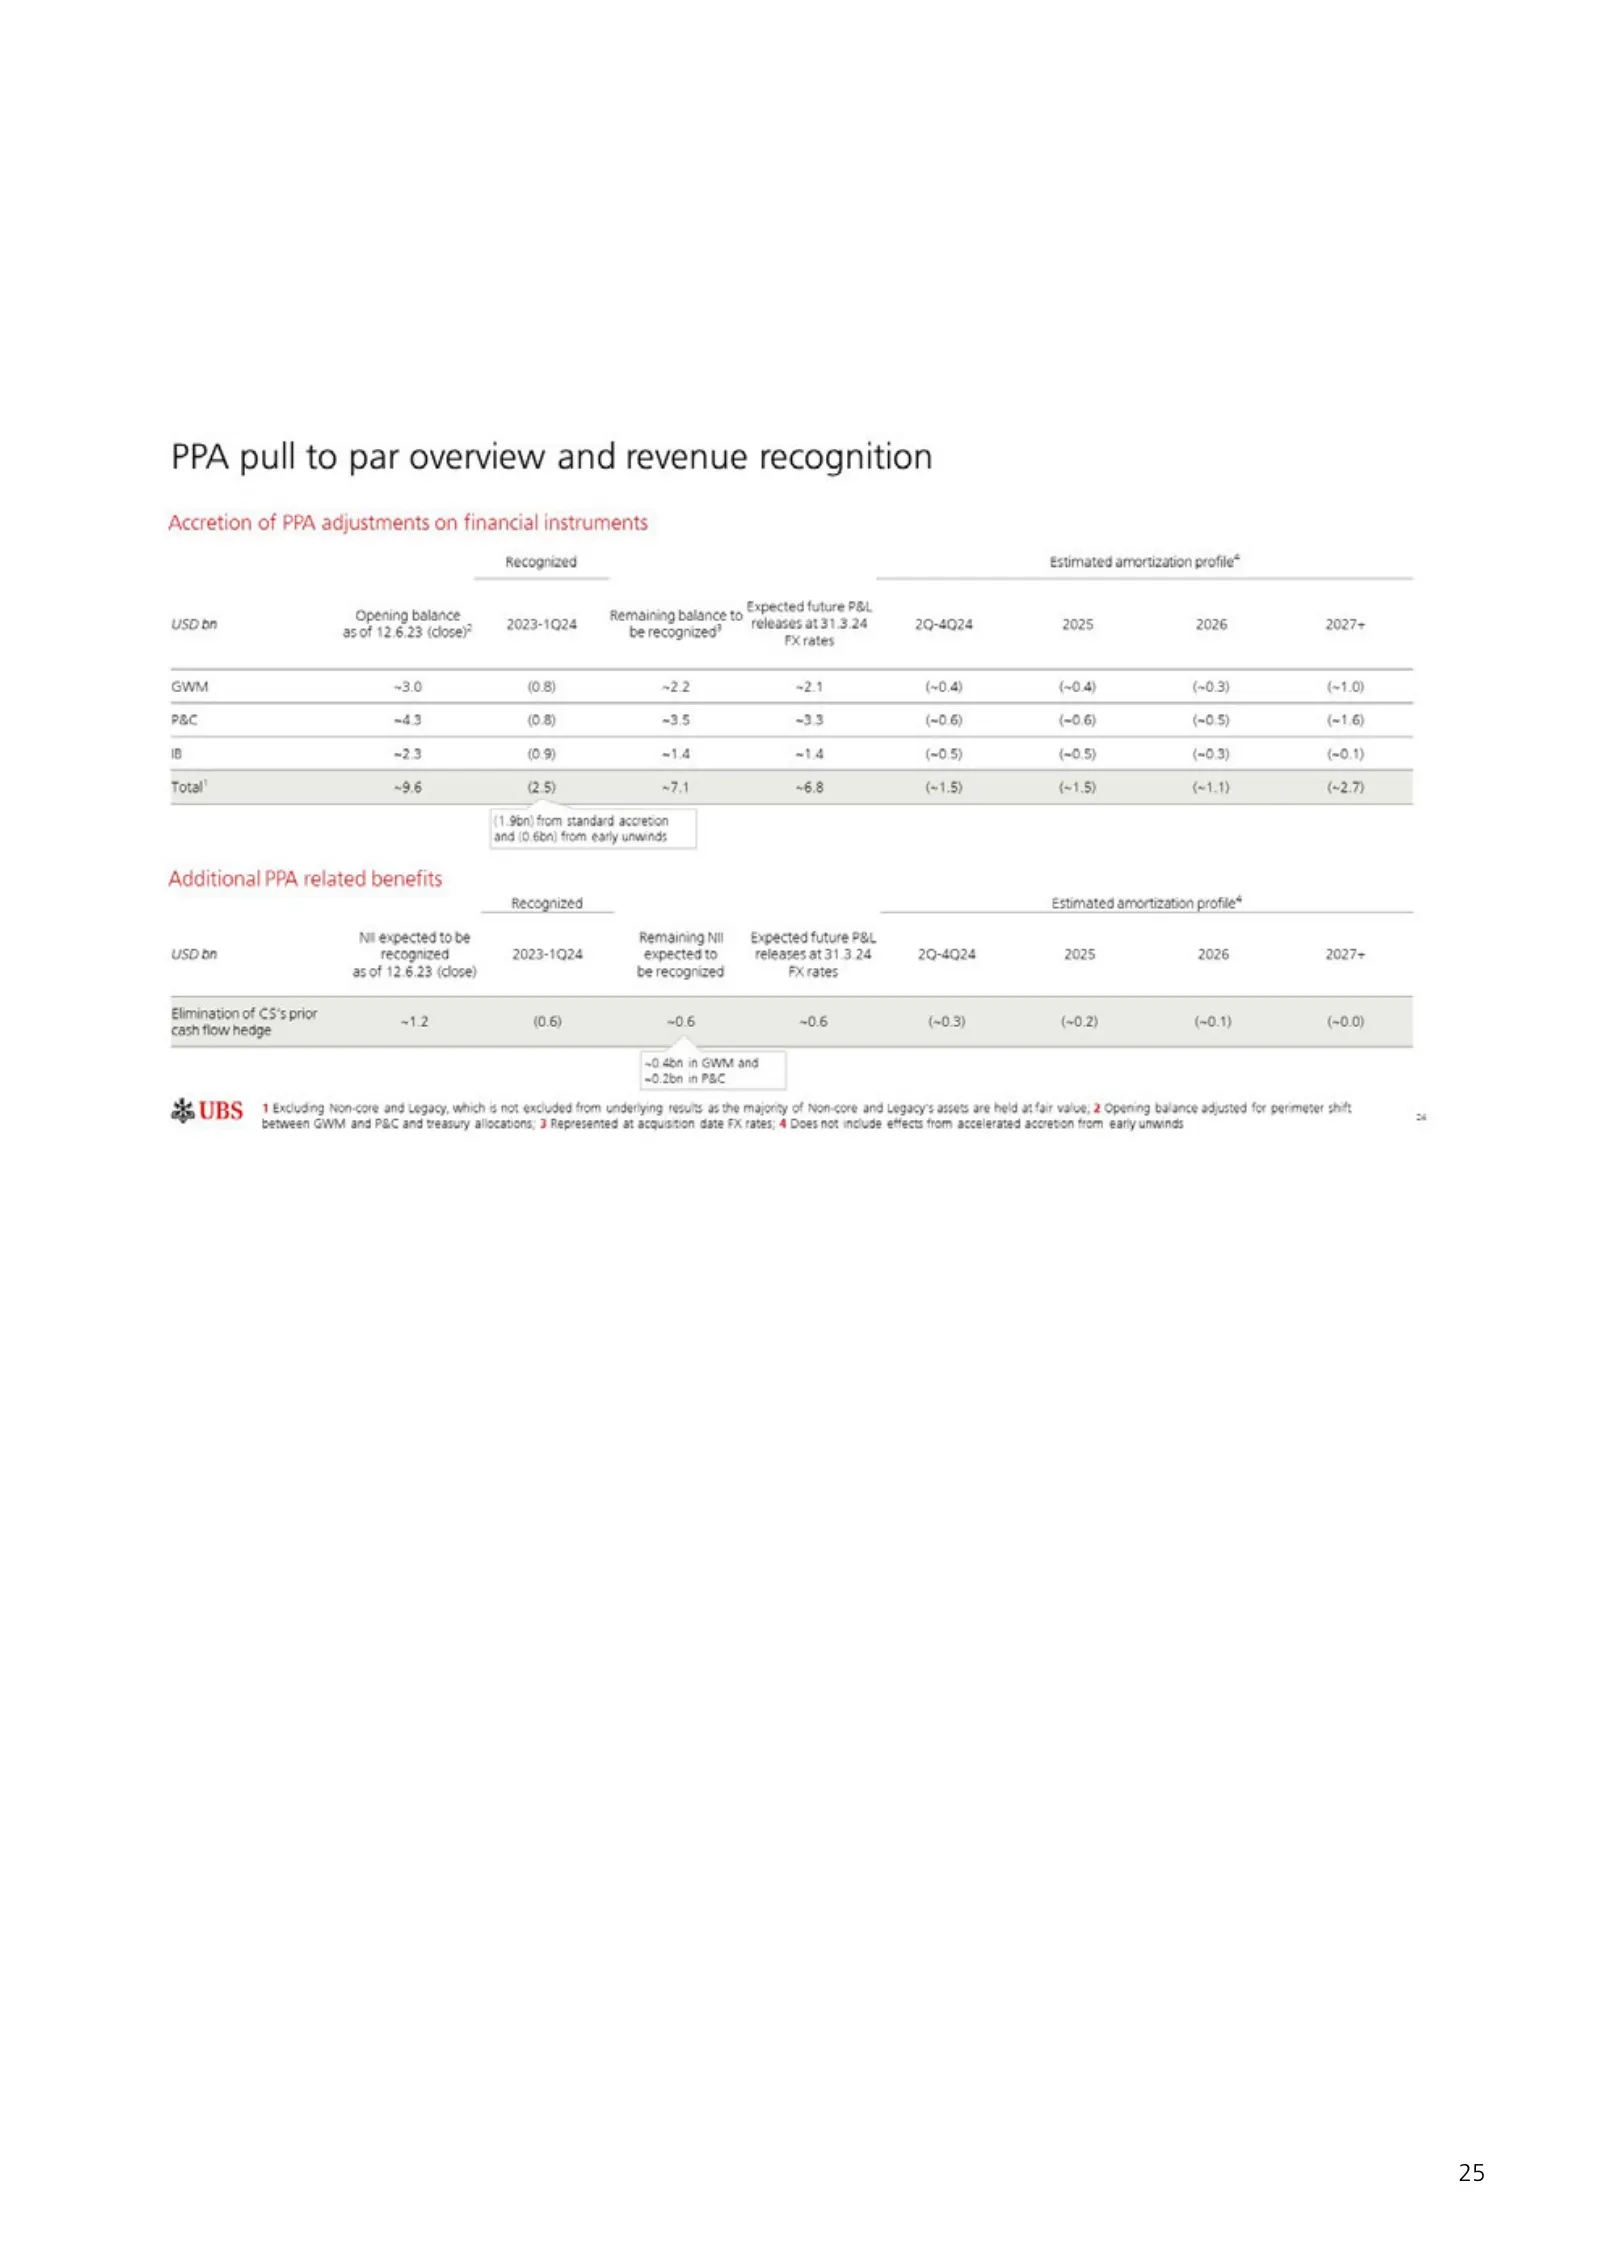
PPA pull to par overview and revenue recognition Accretion of PPA adjustments on financial instruments Recognized Estimated amortization profile* Expected future P&L uso be apnapaanct 2023-1024 ag ar ae teleasesat3122¢ 20-4024 2025 2026 2027+ cw ~30 (08) 22 “24 (-0.4) (0.4) (-03) (1.0) PEC ~43 08) 3
Slide 28: Capital and leverage ratios
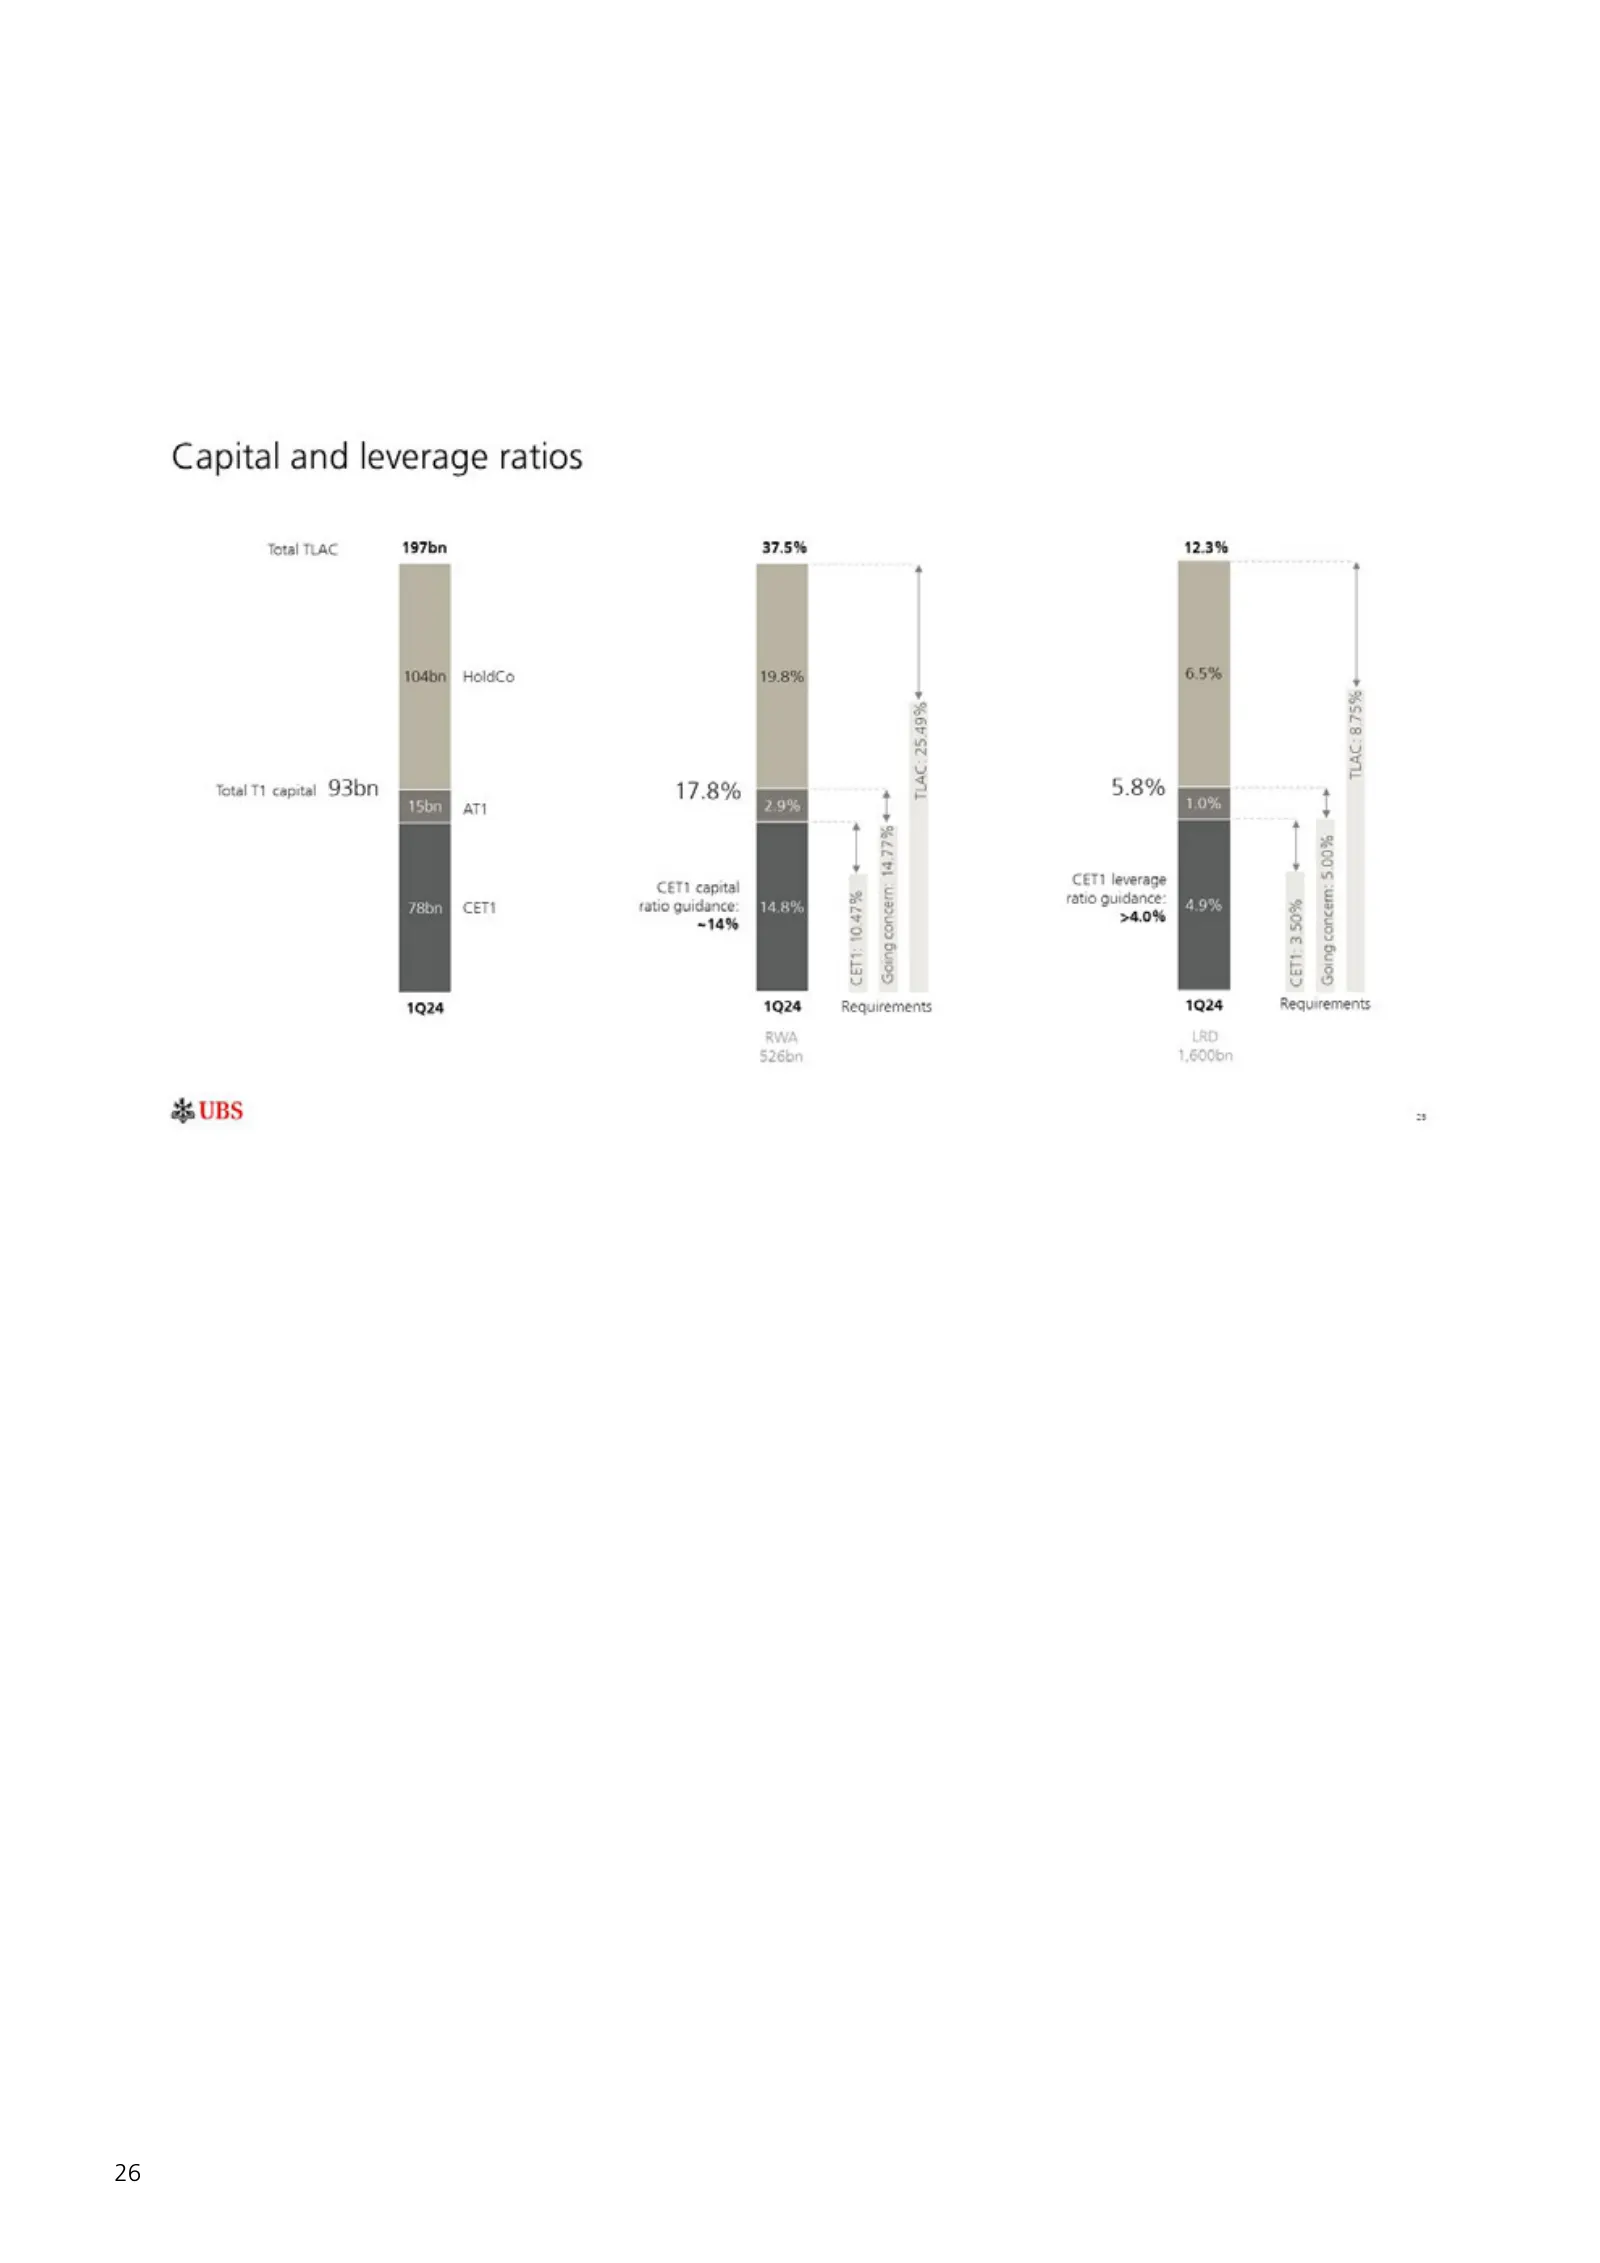
Capital and leverage ratios Total TLAC 197bn 37.5% 12.3% + * HoldCo 4 M # FA 2 g 4 u 3 3 Total T1 capital 93bN 17.8% ae 5.8% atl + t £ [8 : : bri CET! leverage CET1 capital . cert ratio guidance: # § a ri 3 5 =14% S5 -_ 5 28 a8 Fa ES 538 1924 1024 Requirements 1924 Requirements
Slide 29: Overview of restatements: published on April 2024
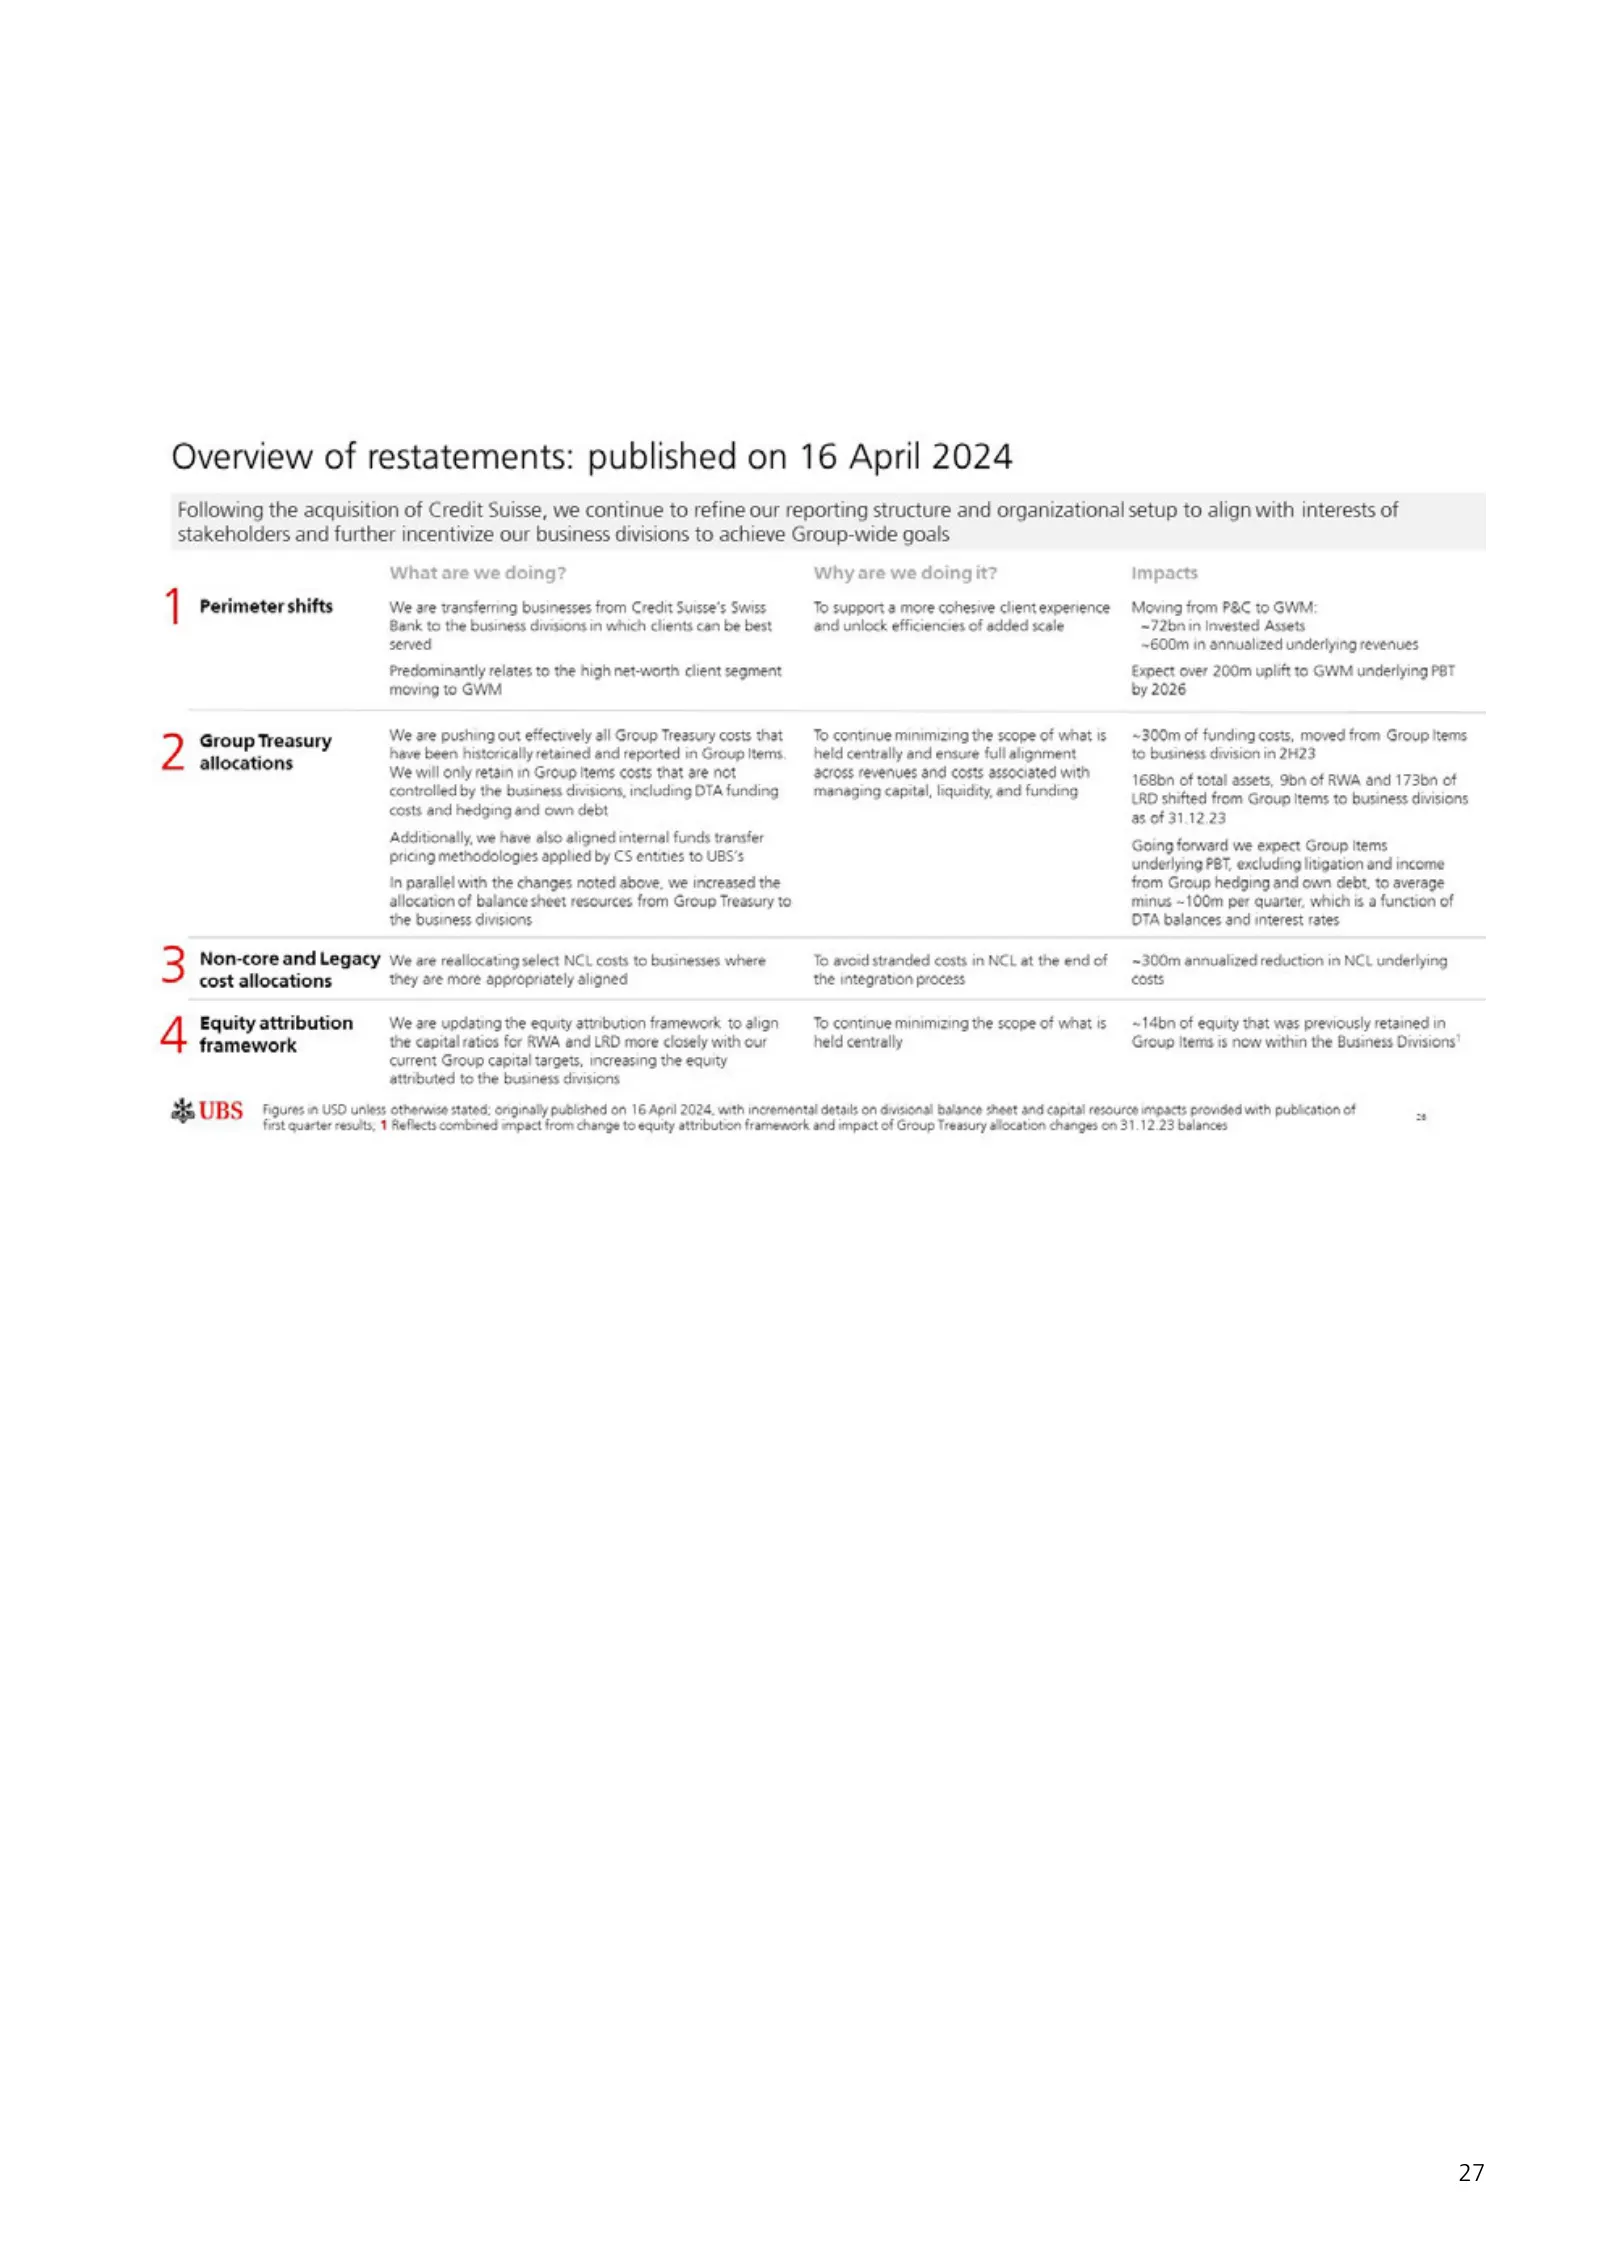
Overview of restatements: published on 16 April 2024 Following the acquisition of Credit Suisse, we continue to refine our reporting structure and organizational setup to align with interests of stakeholders and further incentivize our business divisions to achieve Group-wide goals What are we doing
Slide 30: Reconciliation of estimated underlying combined results for 1Q23
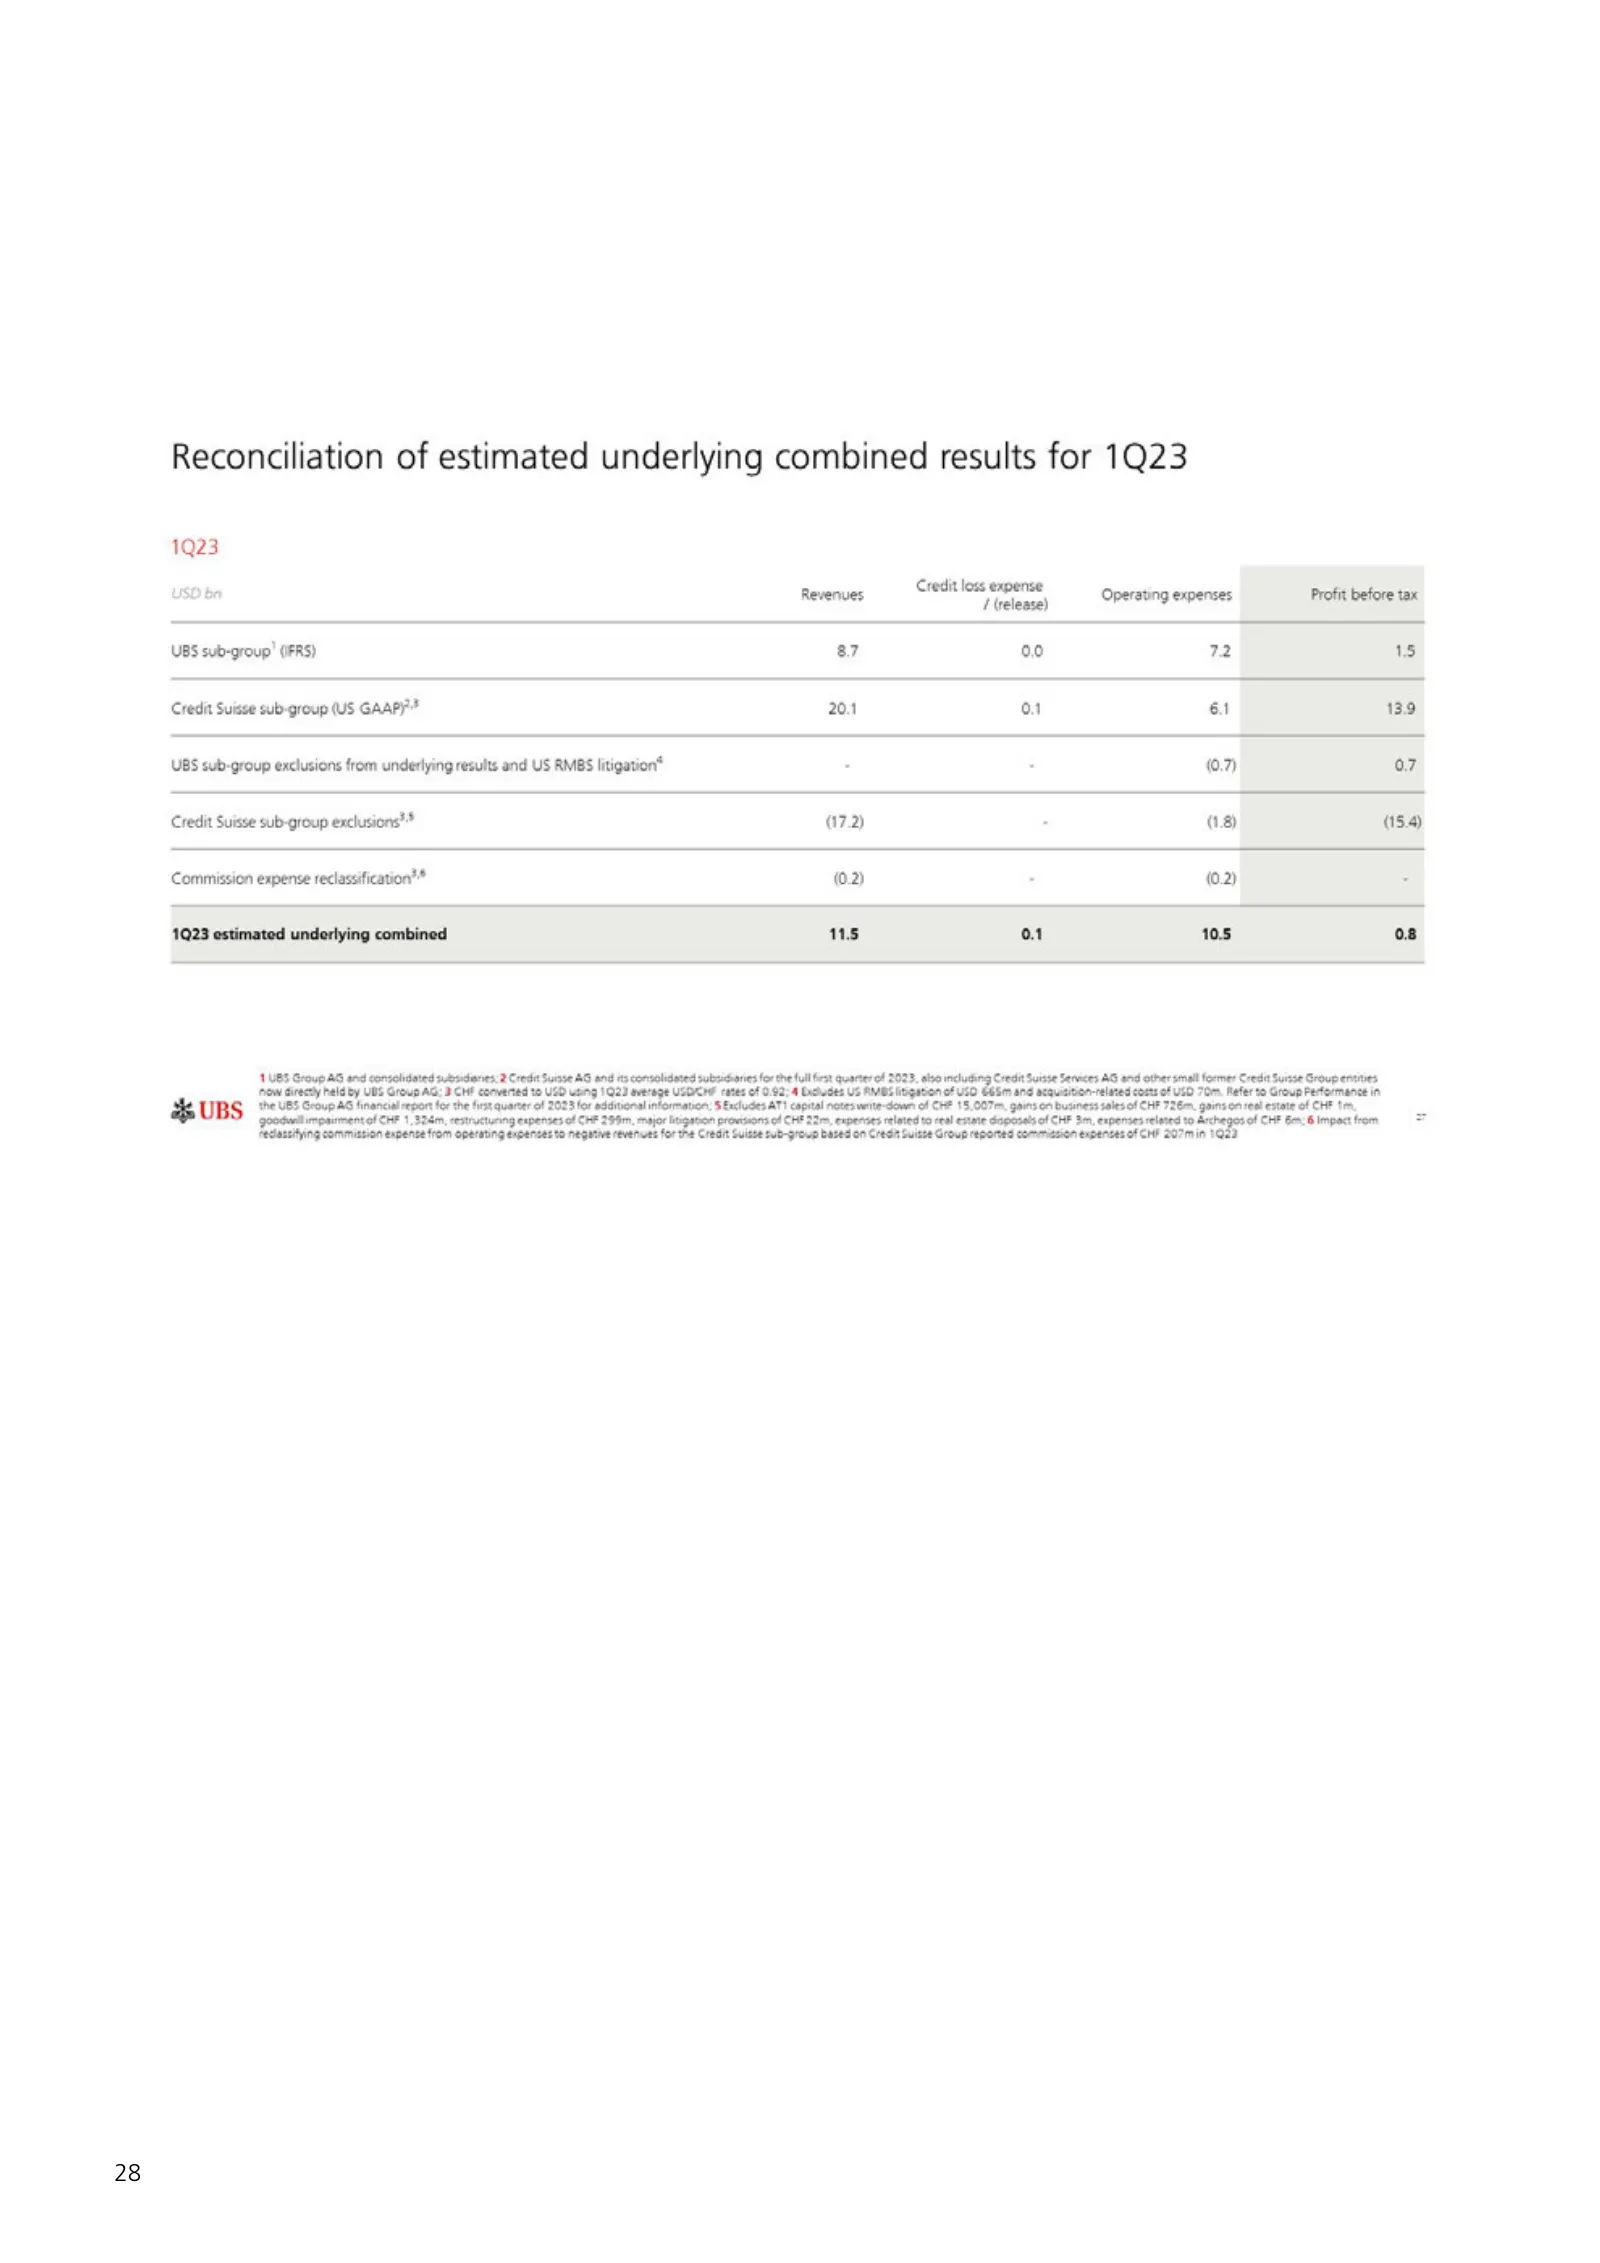
Reconciliation of estimated underlying combined results for 1Q23 1Q23 usp Credit loss expense USD ba Revenues a Glecsal Operating expenses Profit before tax UBS sub-group! (IFRS) a7 0.0 72 1S Credit Suisse sub-group (US GAAP" 201 04 64 139 UBS sub-group exclusions from underlying results and US RMBS
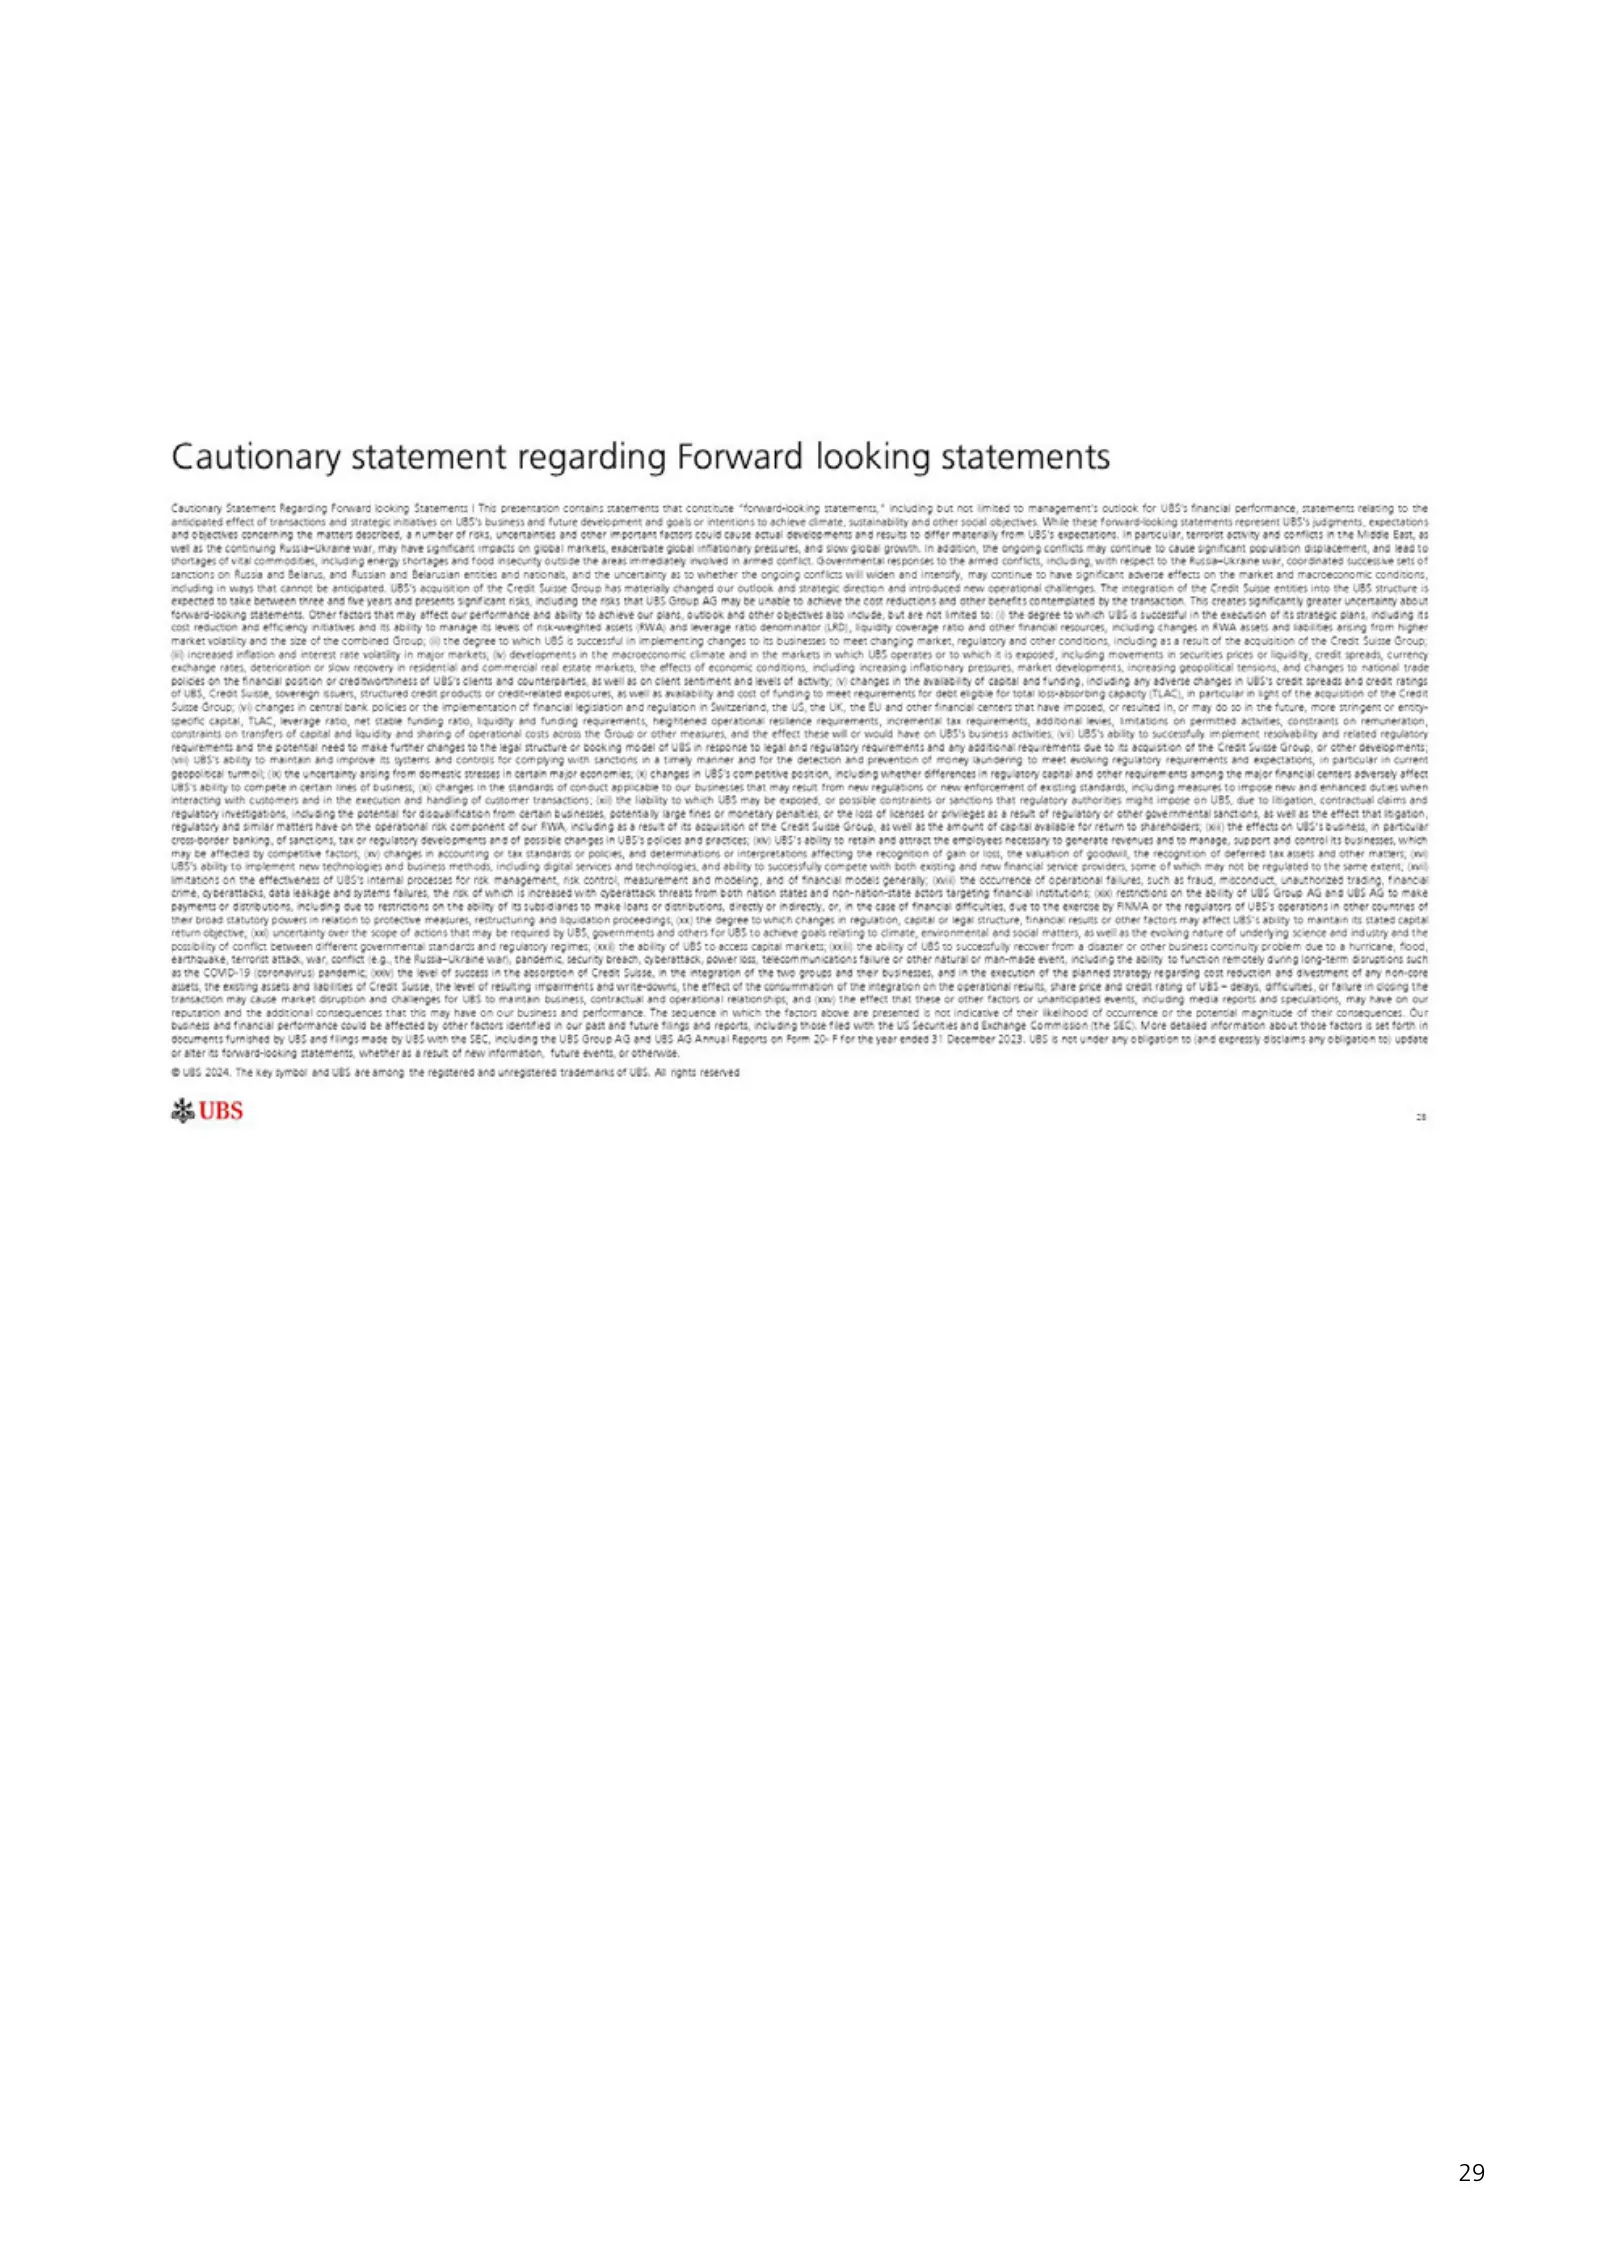
Slide 31: Cautionary statement regarding forward looking statements
Cautionary statement regarding Forward looking statements Cauronary Sunemert Regersng Forward locking re comains: at 5, cing bu nx tad w menepaare ootck fe UBS) franc peccrnete, mmesens rg © URS tanctons on Ruse ora Beta and Rcssan sta BoaTcian erste: wd nasonae, andthe wcertanty ast whether De Snga
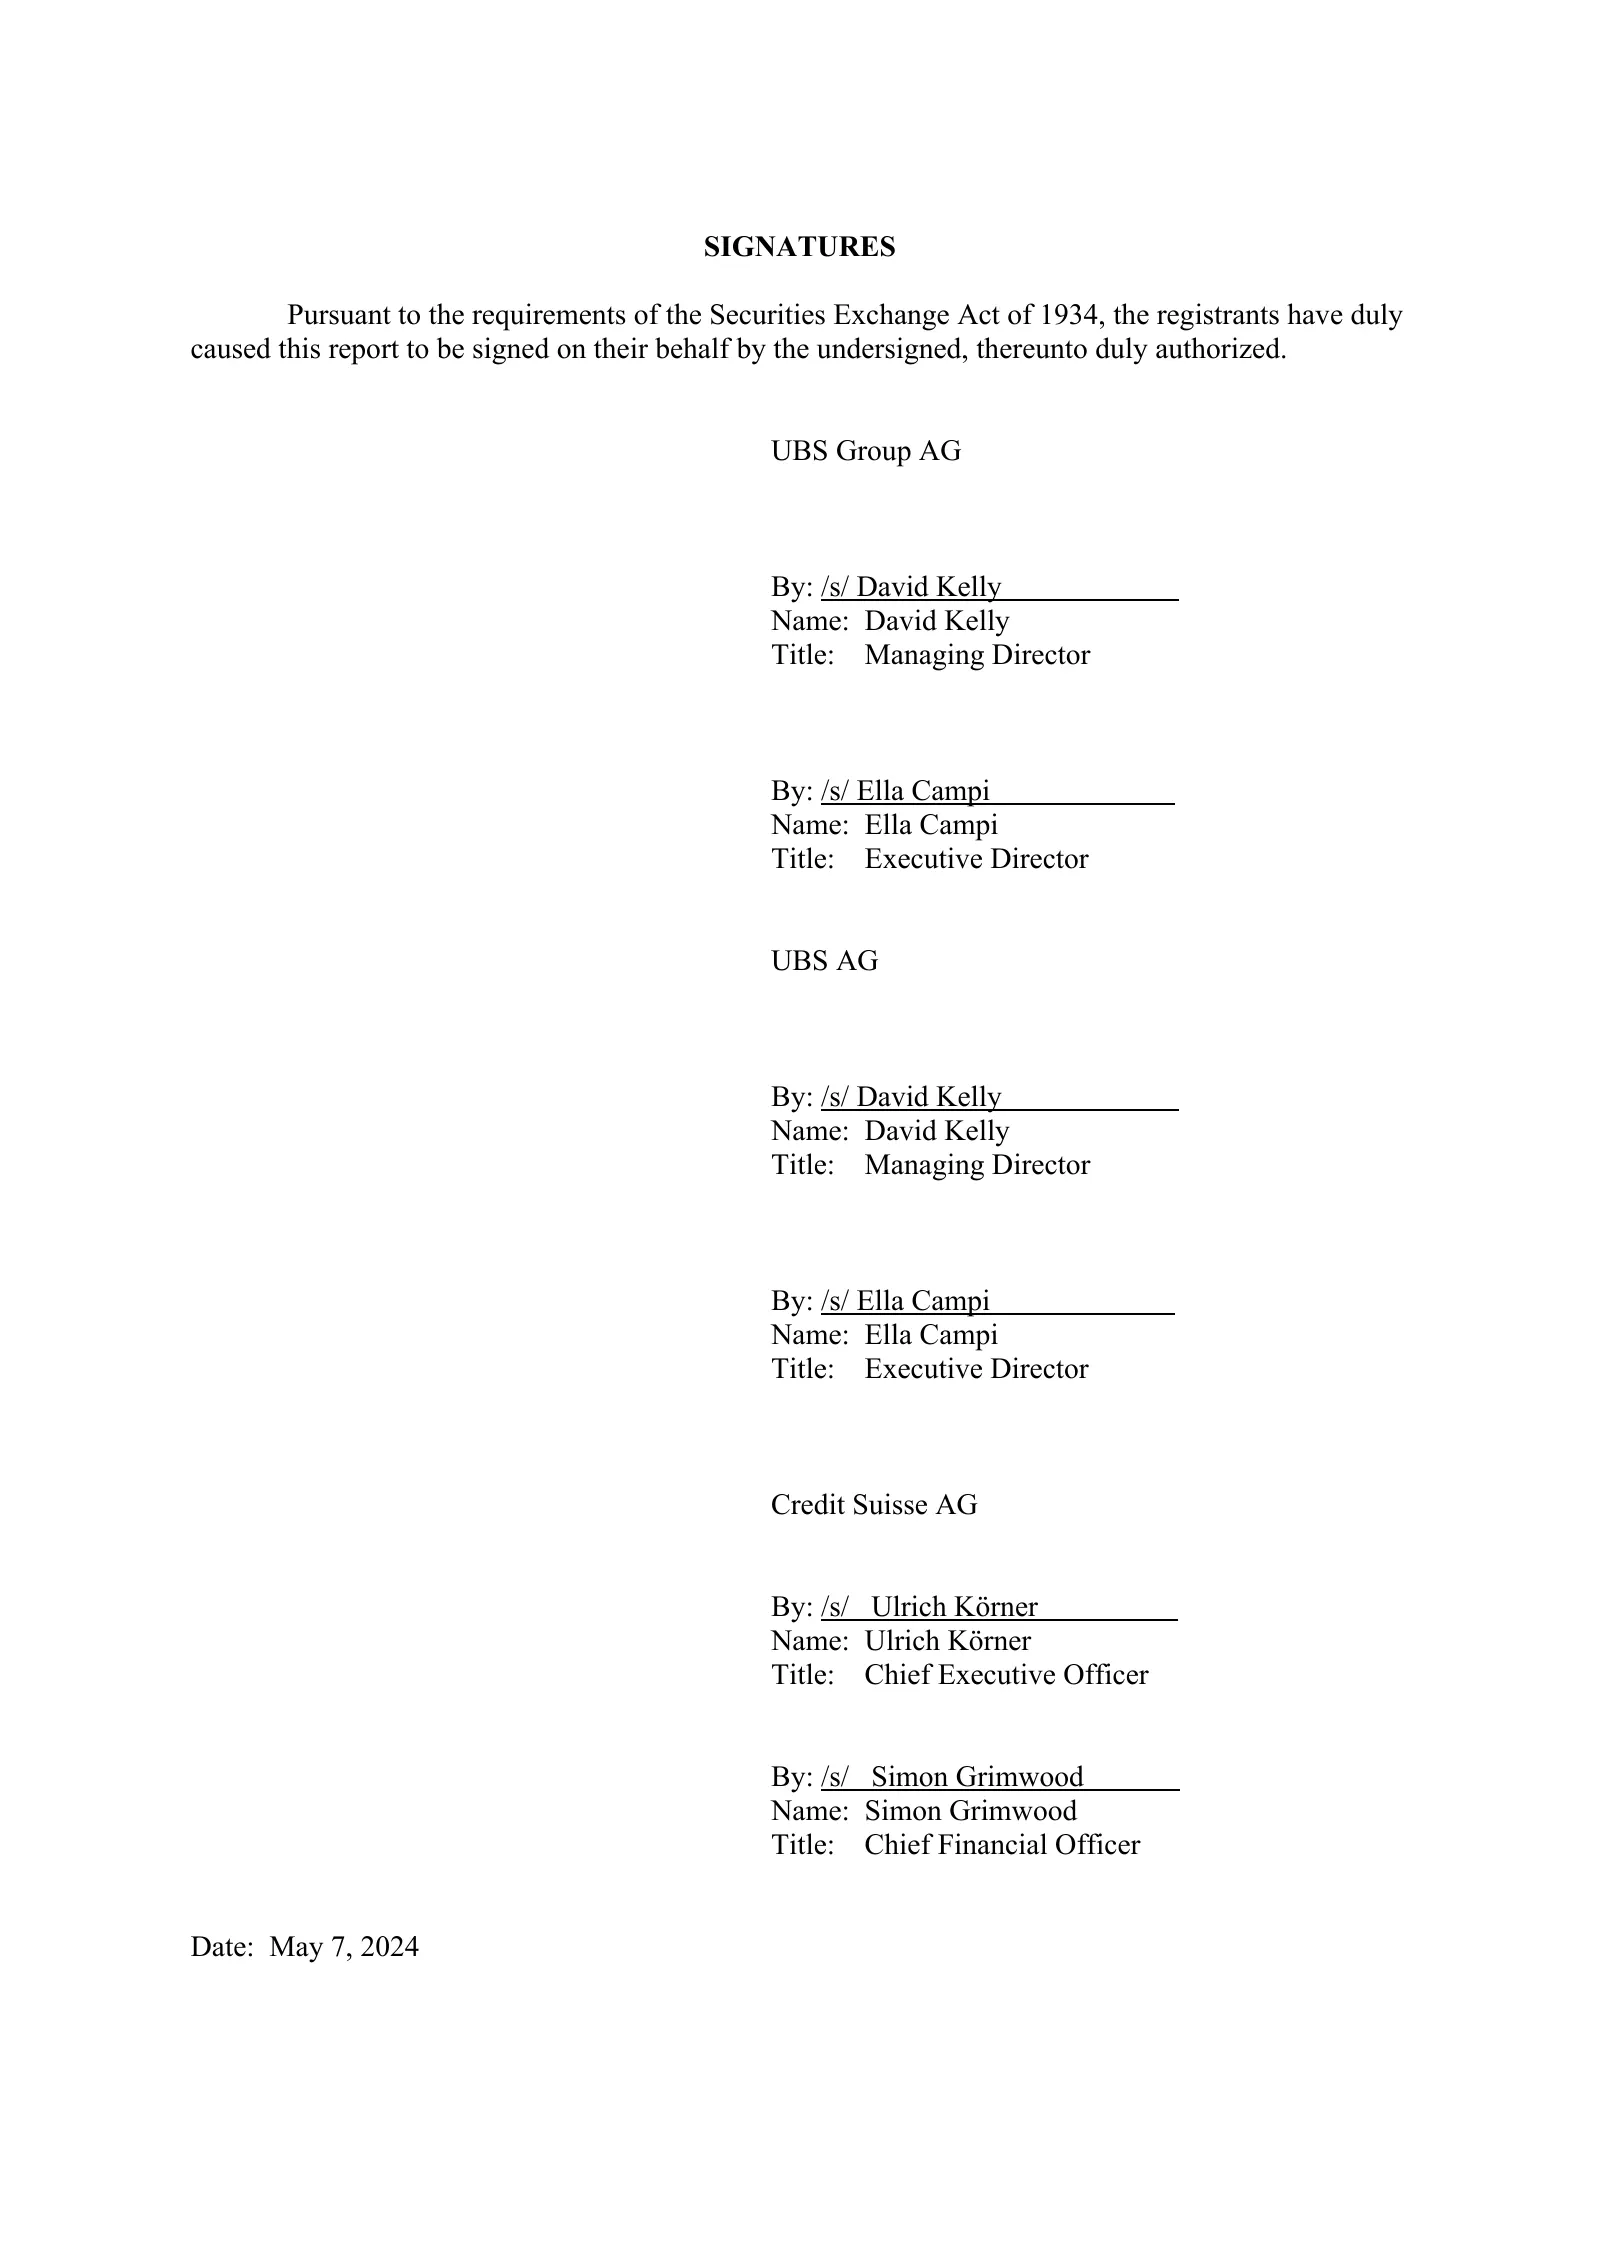
Slide 32: Signatures
SIGNATURES Pursuant to the requirements of the Securities Exchange Act of 1934, the registrants have duly caused this report to be signed on their behalf by the undersigned, thereunto duly authorized. UBS Group AG By: /s/ David Kelly _ Name: David Kelly Title: Managing Director By: /s/ Ella Campi _
Source: Internet Archive copy of ubs.com
More decks from UBS Group AG
 Debt Investor Presentation (October 2026)42 slides · Oct 28, 2026
 Q3 2026 Earnings Presentation28 slides · Oct 28, 2026
 Debt Investor Presentation (July 2026)42 slides · Jul 29, 2026
 Q2 2026 Earnings Presentation27 slides · Jul 29, 2026
 Q1 2026 Earnings Presentation27 slides · Apr 29, 2026
 Q1 2026 Earnings Presentation39 slides · Apr 29, 2026