Silvergate Capital Corp. · OTC:SICP
Silvergate Capital — Q1 2020 Earnings Presentation
16 slides from Silvergate Capital's earnings presentation, Apr 29, 2020

Slide 1: Silvergate Capital Corporation 1Q20 Earnings Presentation
Exhibit 99.2 Silvergate Capital Corporation 1Q20 Earnings Presentation April 29, 2020
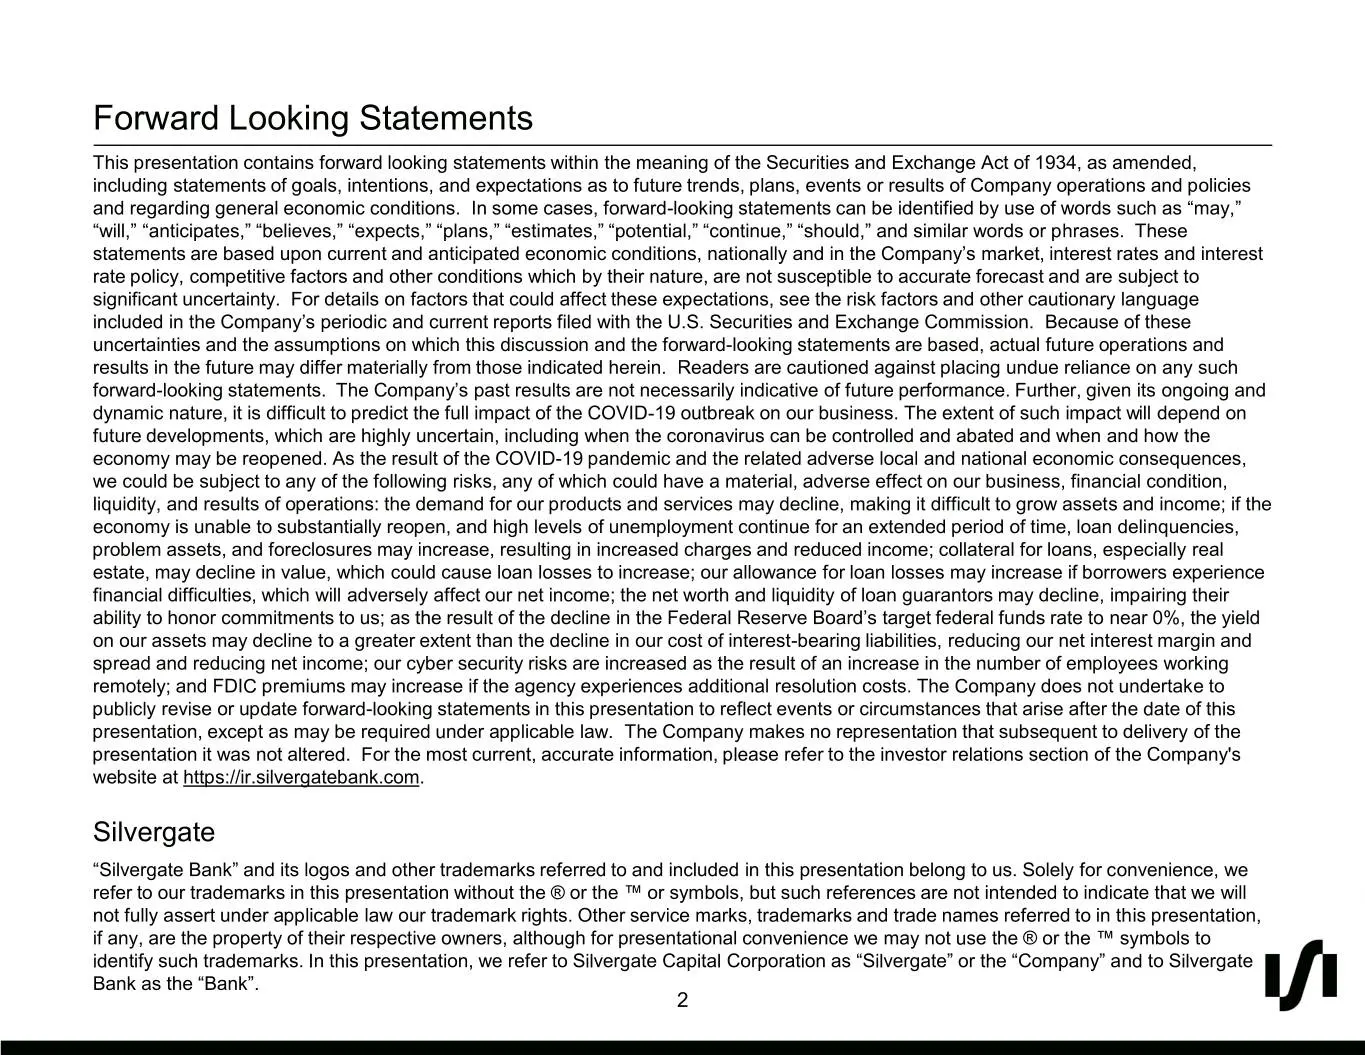
Slide 2: Forward Looking Statements
Forward Looking Statements This presentation contains forward looking statements within the meaning of the Securities and Exchange Act of 1934, as amended, including statements of goals, intentions, and expectations as to future trends, plans, events or results of Company operations and policies and
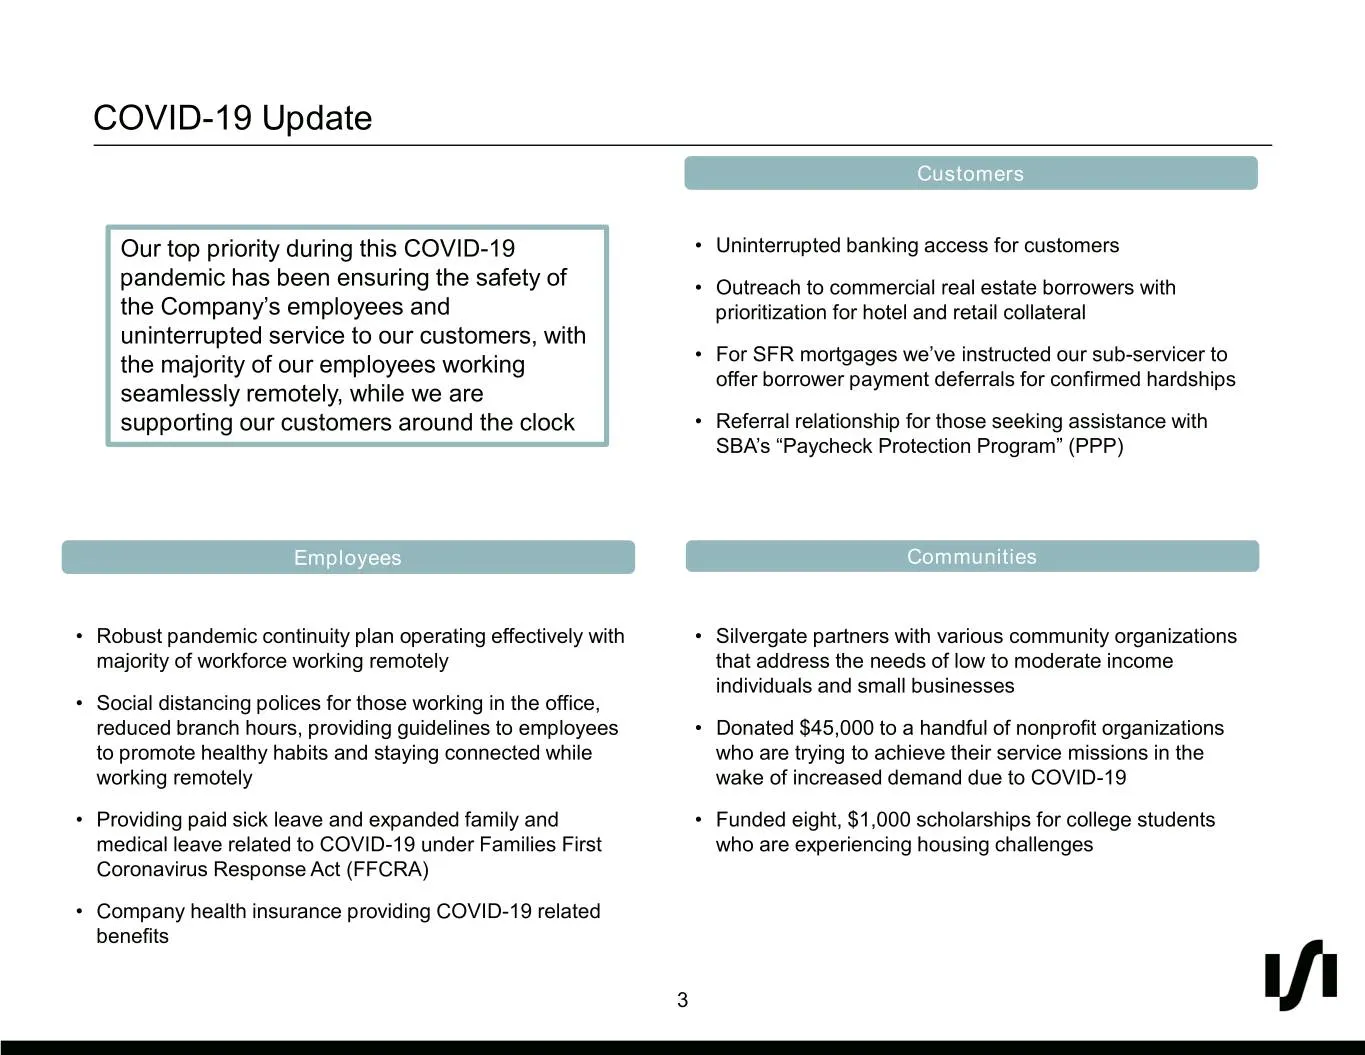
Slide 3: COVID-19 Update
COVID-19 Update Customers Our top priority during this COVID-19 • Uninterrupted banking access for customers pandemic has been ensuring the safety of • Outreach to commercial real estate borrowers with the Company’s employees and prioritization for hotel and retail collateral uninterrupted service t
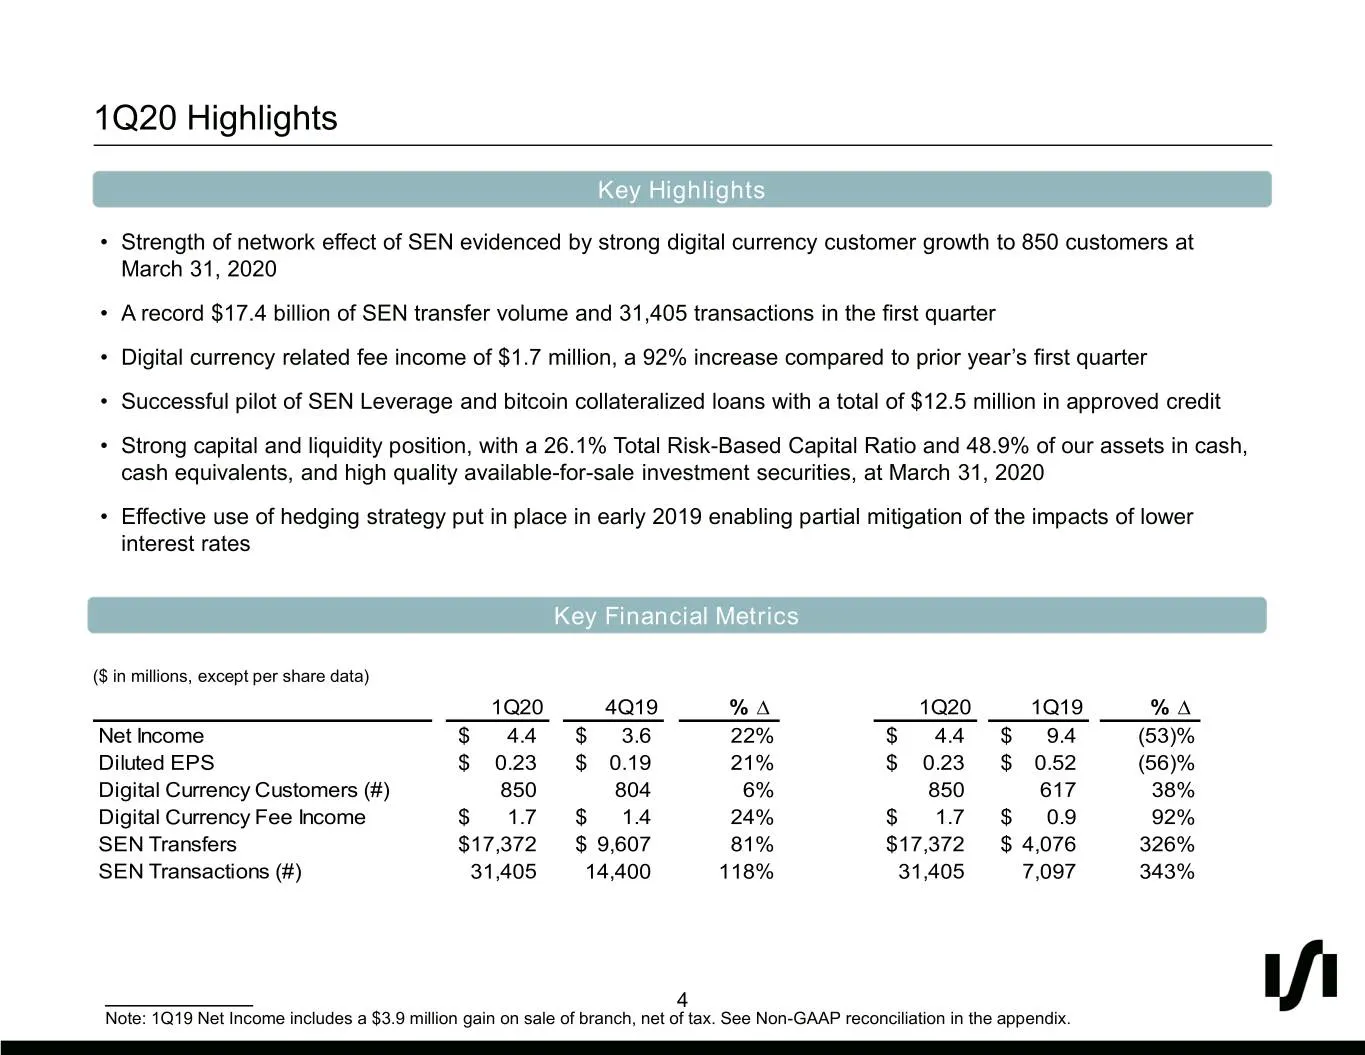
Slide 4: 1Q20 Highlights
1Q20 Highlights Key Highlights • Strength of network effect of SEN evidenced by strong digital currency customer growth to 850 customers at March 31, 2020 • A record $17.4 billion of SEN transfer volume and 31,405 transactions in the first quarter • Digital currency related fee income of $1.7 millio
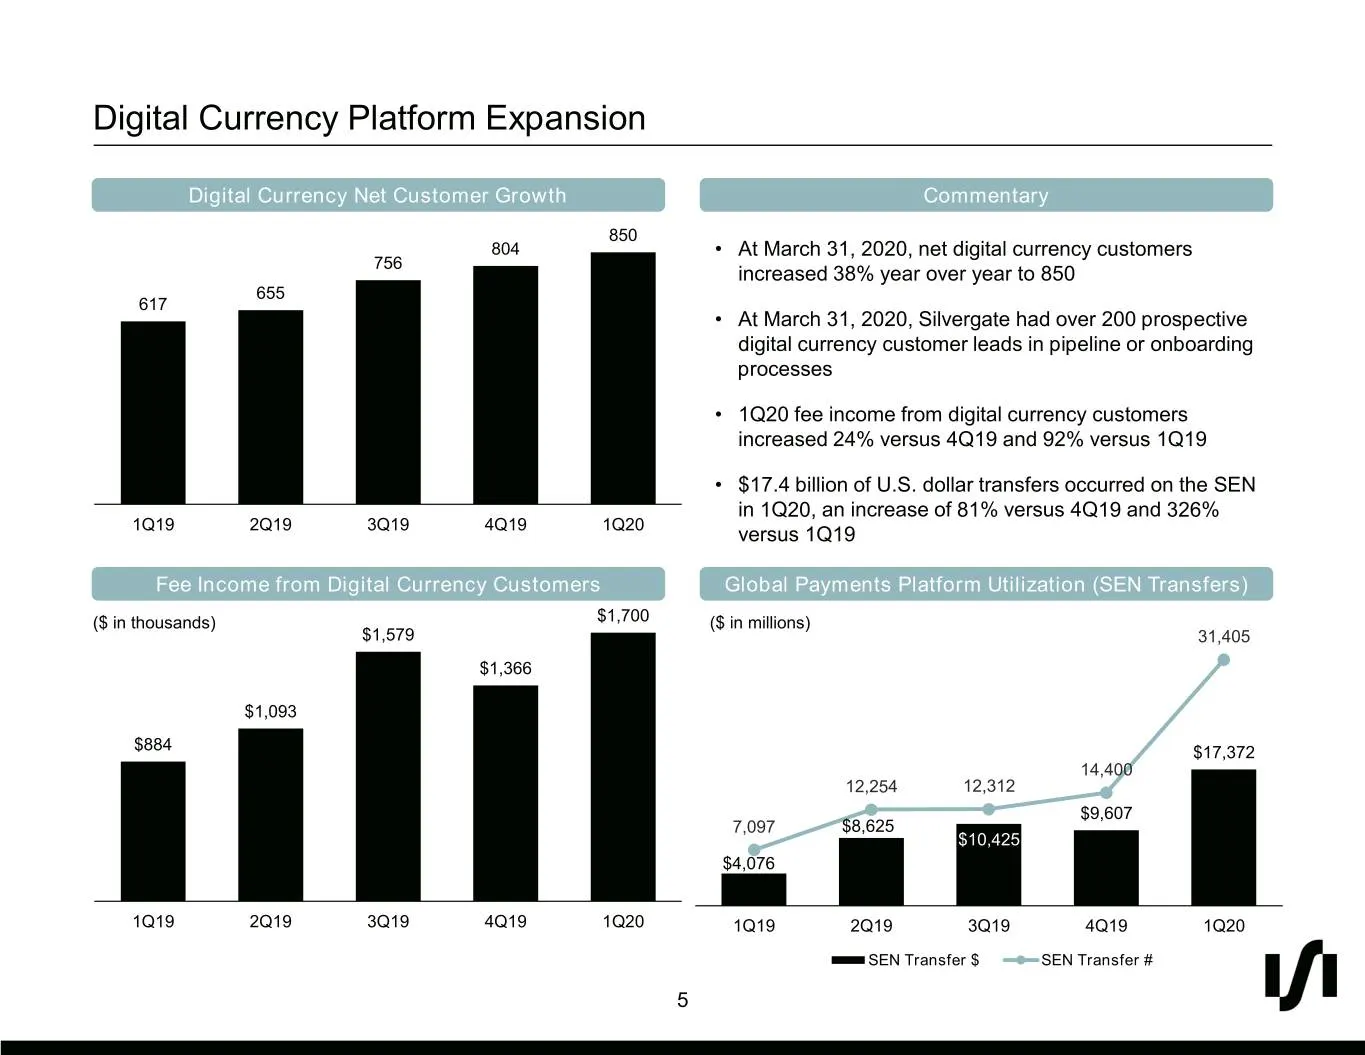
Slide 5: Digital Currency Platform Expansion
Digital Currency Platform Expansion Digital Currency Net Customer Growth Commentary 850 804 • At March 31, 2020, net digital currency customers 756 increased 38% year over year to 850 655 617 • At March 31, 2020, Silvergate had over 200 prospective digital currency customer leads in pipeline or onbo
Slide 6: Deposits
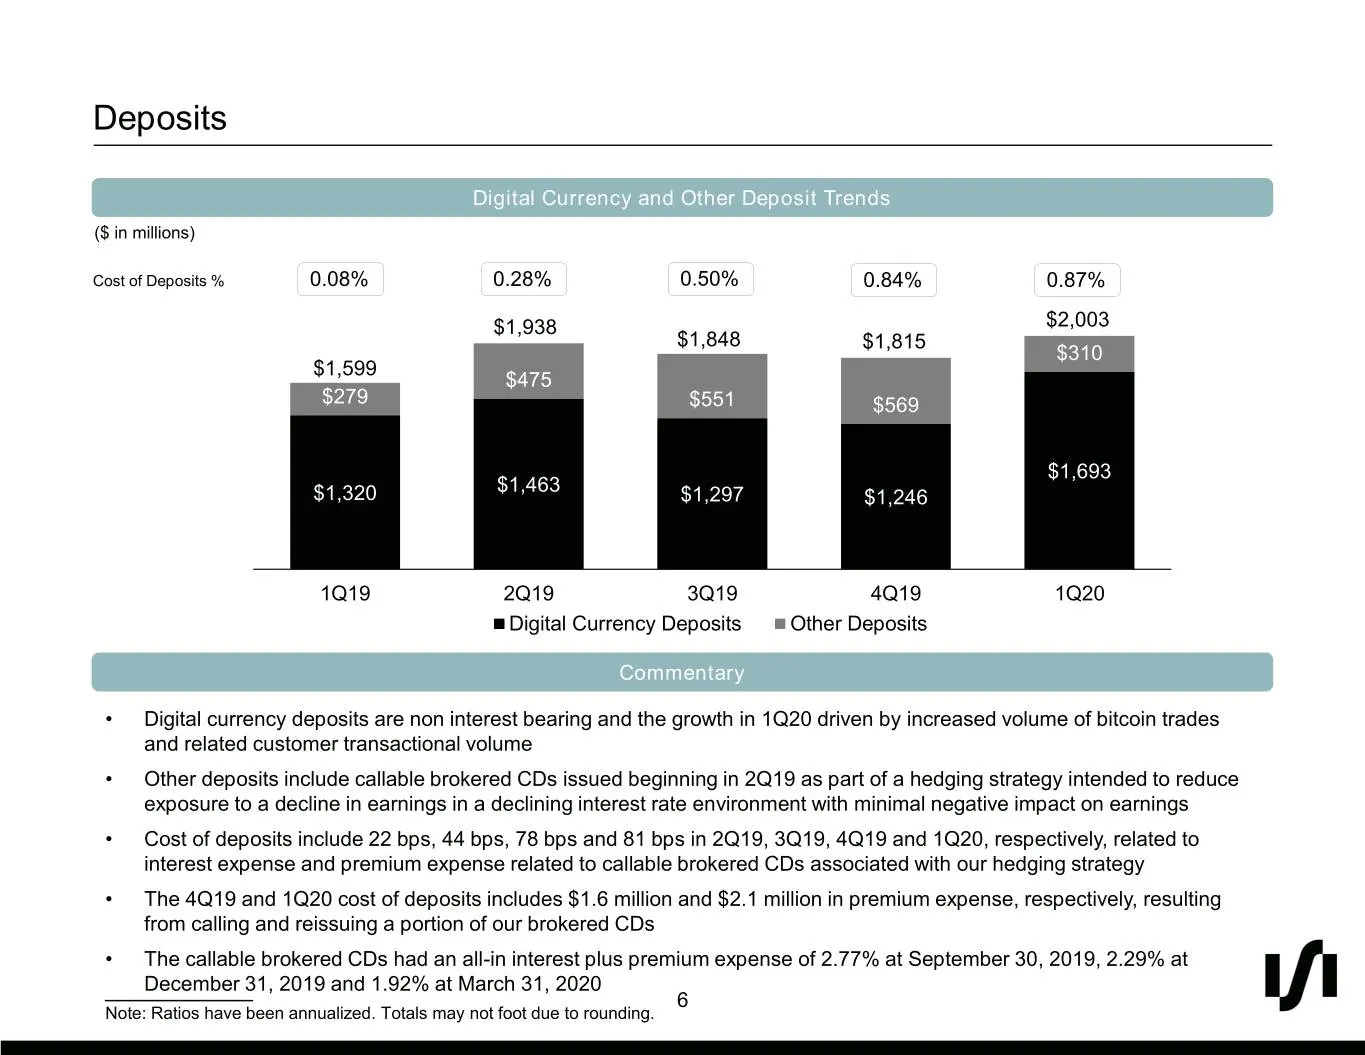
Deposits Digital Currency and Other Deposit Trends ($ in millions) Cost of Deposits % 0.08% 0.28% 0.50% 0.84% 0.87% $1,938 $2,003 $1,848 $1,815 $310 $1,599 $475 $279 $551 $569 $1,693 $1,463 $1,320 $1,297 $1,246 1Q19 2Q19 3Q19 4Q19 1Q20 Digital Currency Deposits Other Deposits Commentary • Digital cu
Slide 7: Yields, Cost of Funds and Net Interest Margin
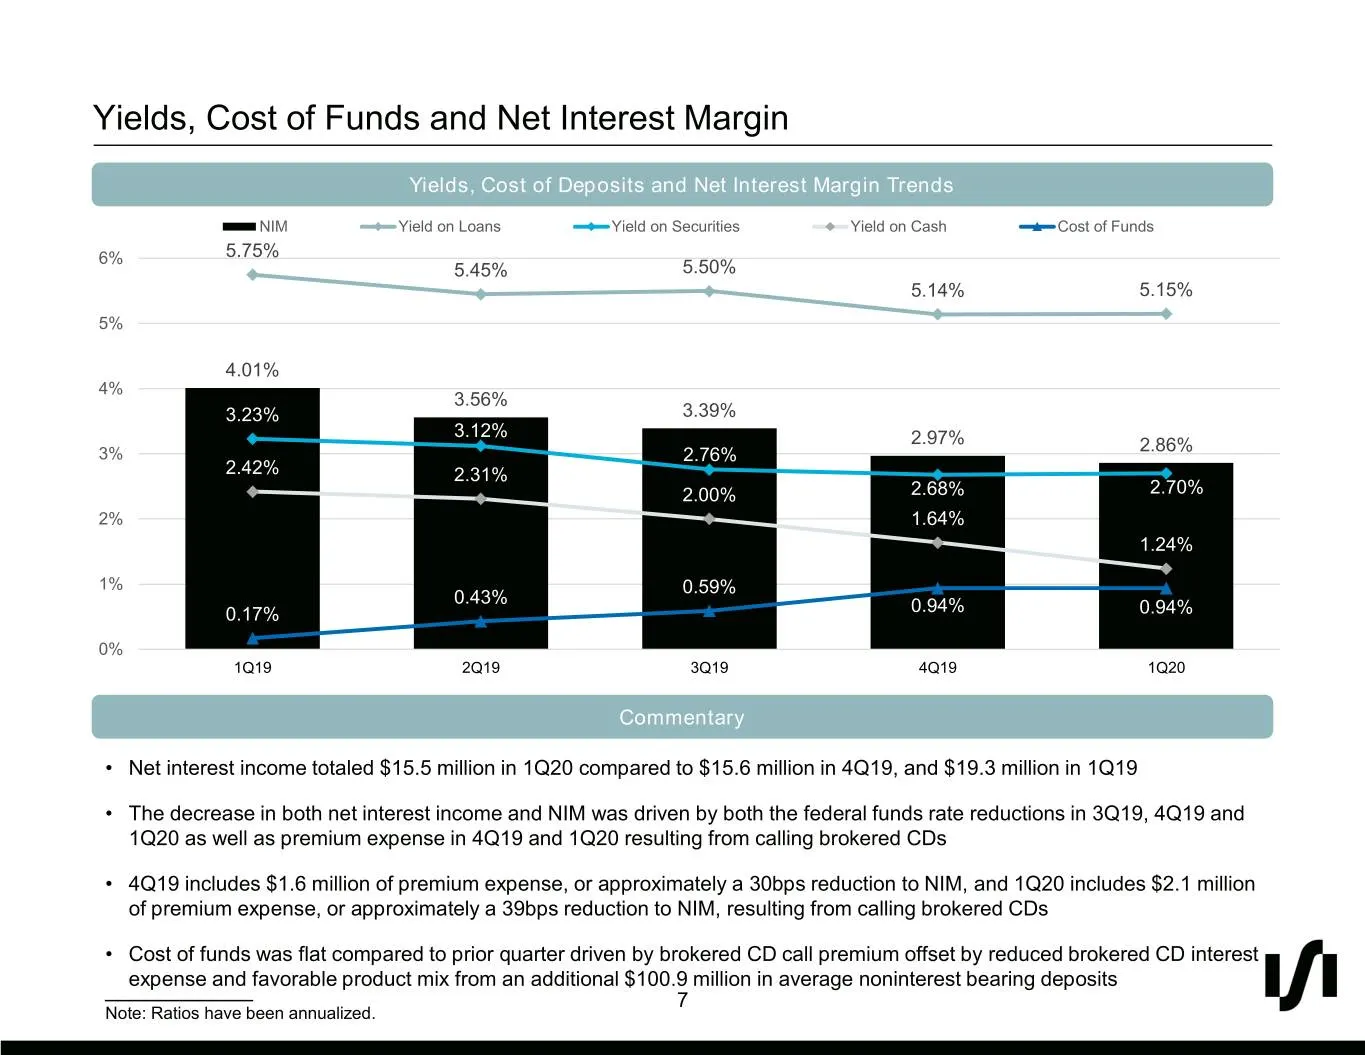
Yields, Cost of Funds and Net Interest Margin Yields, Cost of Deposits and Net Interest Margin Trends NIM Yield on Loans Yield on Securities Yield on Cash Cost of Funds 6% 5.75% 5.45% 5.50% 5.14% 5.15% 5% 4.01% 4% 3.56% 3.23% 3.39% 3.12% 2.97% 2.86% 3% 2.76% 2.42% 2.31% 2.00% 2.68% 2.70% 2% 1.64% 1.
Slide 8: Noninterest Income
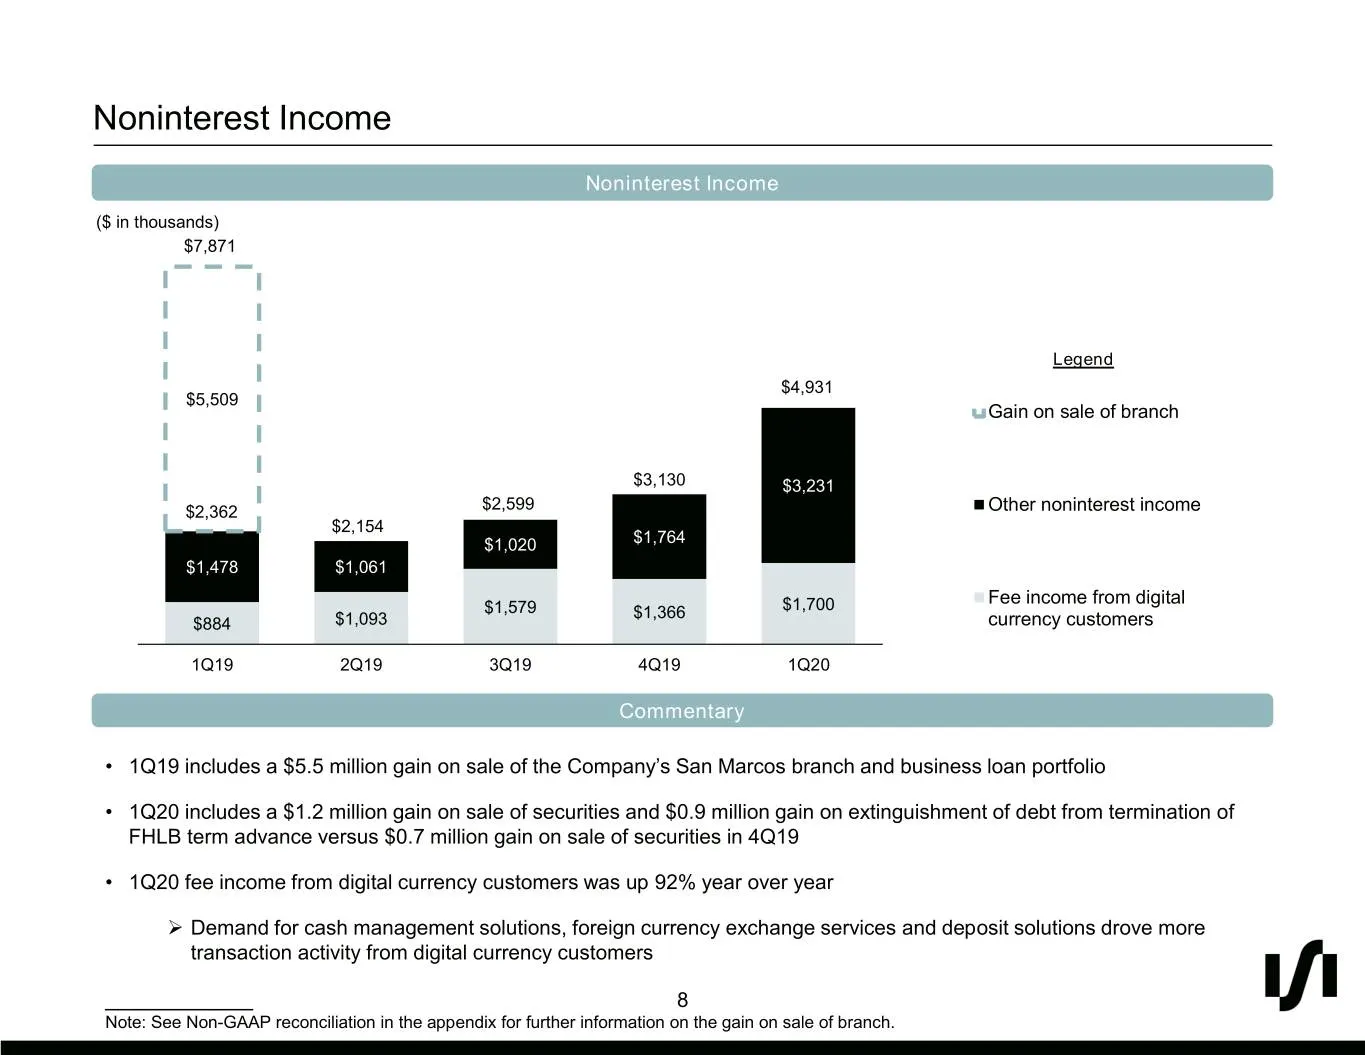
Noninterest Income Noninterest Income 9000 ($ in thousands) $7,871 8000 7000 6000 Legend $4,931 5000 $5,509 Gain on sale of branch 4000 $3,130 $3,231 3000 $2,362 $2,599 Other noninterest income $2,154 $1,764 2000 $1,020 $1,478 $1,061 1000 Fee income from digital $1,579 $1,366 $1,700 $884 $1,093 curr
Slide 9: Noninterest Expense
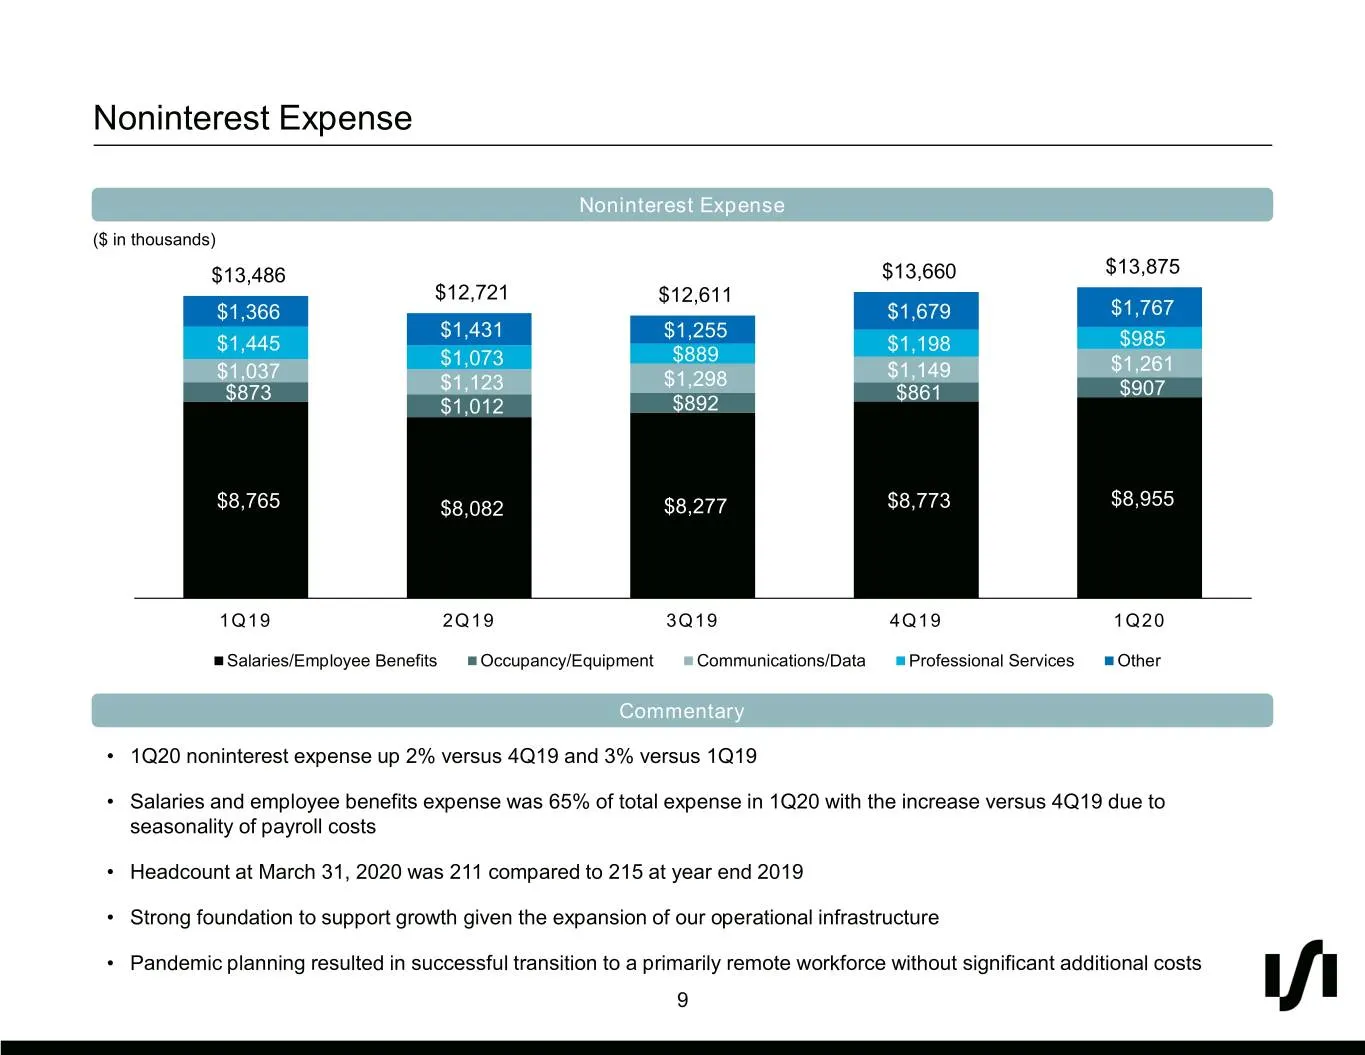
Noninterest Expense Noninterest Expense ($ in thousands) $13,486 $13,660 $13,875 $12,721 $12,611 $1,366 $1,679 $1,767 $1,431 $1,255 $1,445 $1,198 $985 $1,073 $889 $1,261 $1,037 $1,298 $1,149 $873 $1,123 $861 $907 $1,012 $892 $8,765 $8,082 $8,277 $8,773 $8,955 1Q19 2Q19 3Q19 4Q19 1Q20 Salaries/Employ
Slide 10: Securities and Loan Portfolio
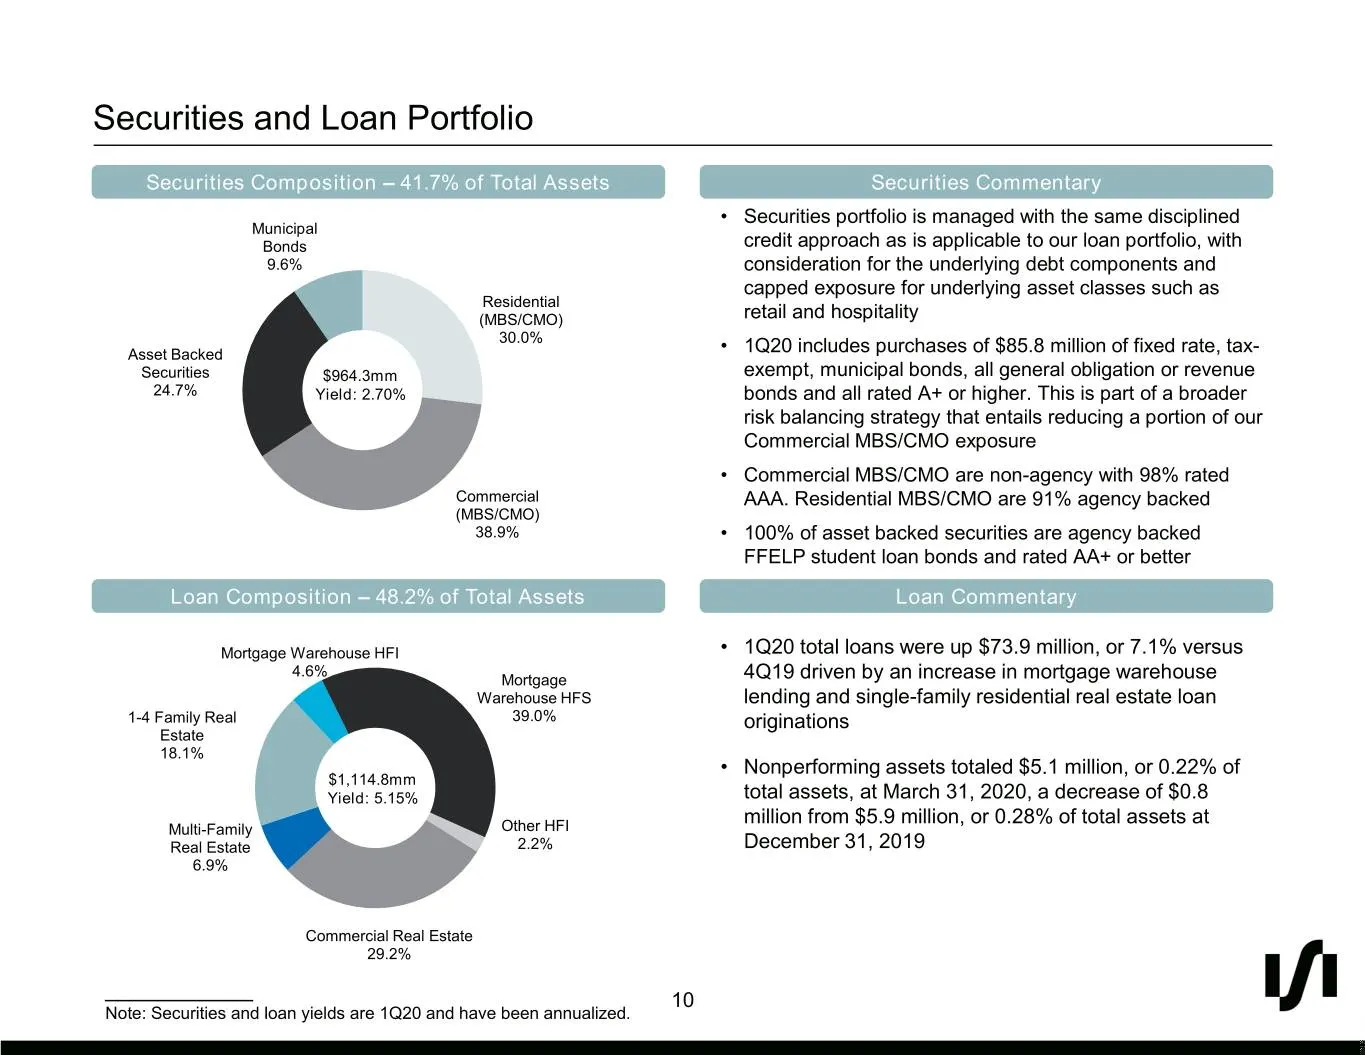
Securities and Loan Portfolio Securities Composition – 41.7% of Total Assets Securities Commentary • Securities portfolio is managed with the same disciplined Municipal Bonds credit approach as is applicable to our loan portfolio, with 9.6% consideration for the underlying debt components and capped
Slide 11: Credit Quality
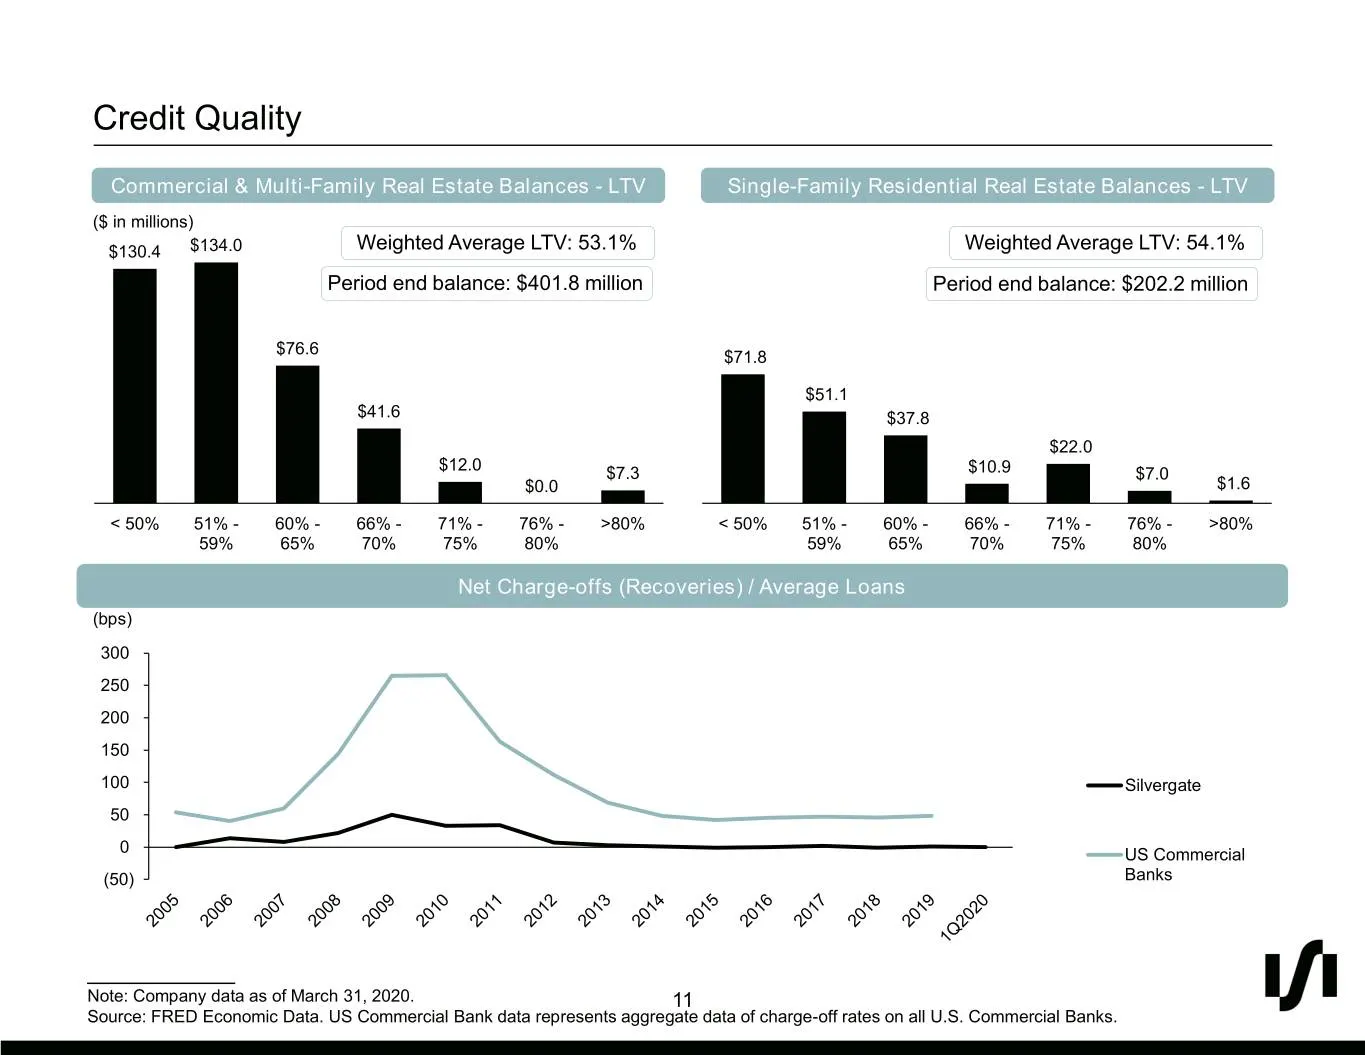
Credit Quality Commercial & Multi-Family Real Estate Balances - LTV Single-Family Residential Real Estate Balances - LTV ($ in millions) $130.4 $134.0 Weighted Average LTV: 53.1% Weighted Average LTV: 54.1% Period end balance: $401.8 million Period end balance: $202.2 million $76.6 $71.8 $51.1 $41.6
Slide 12: Additional Loan Portfolio Information
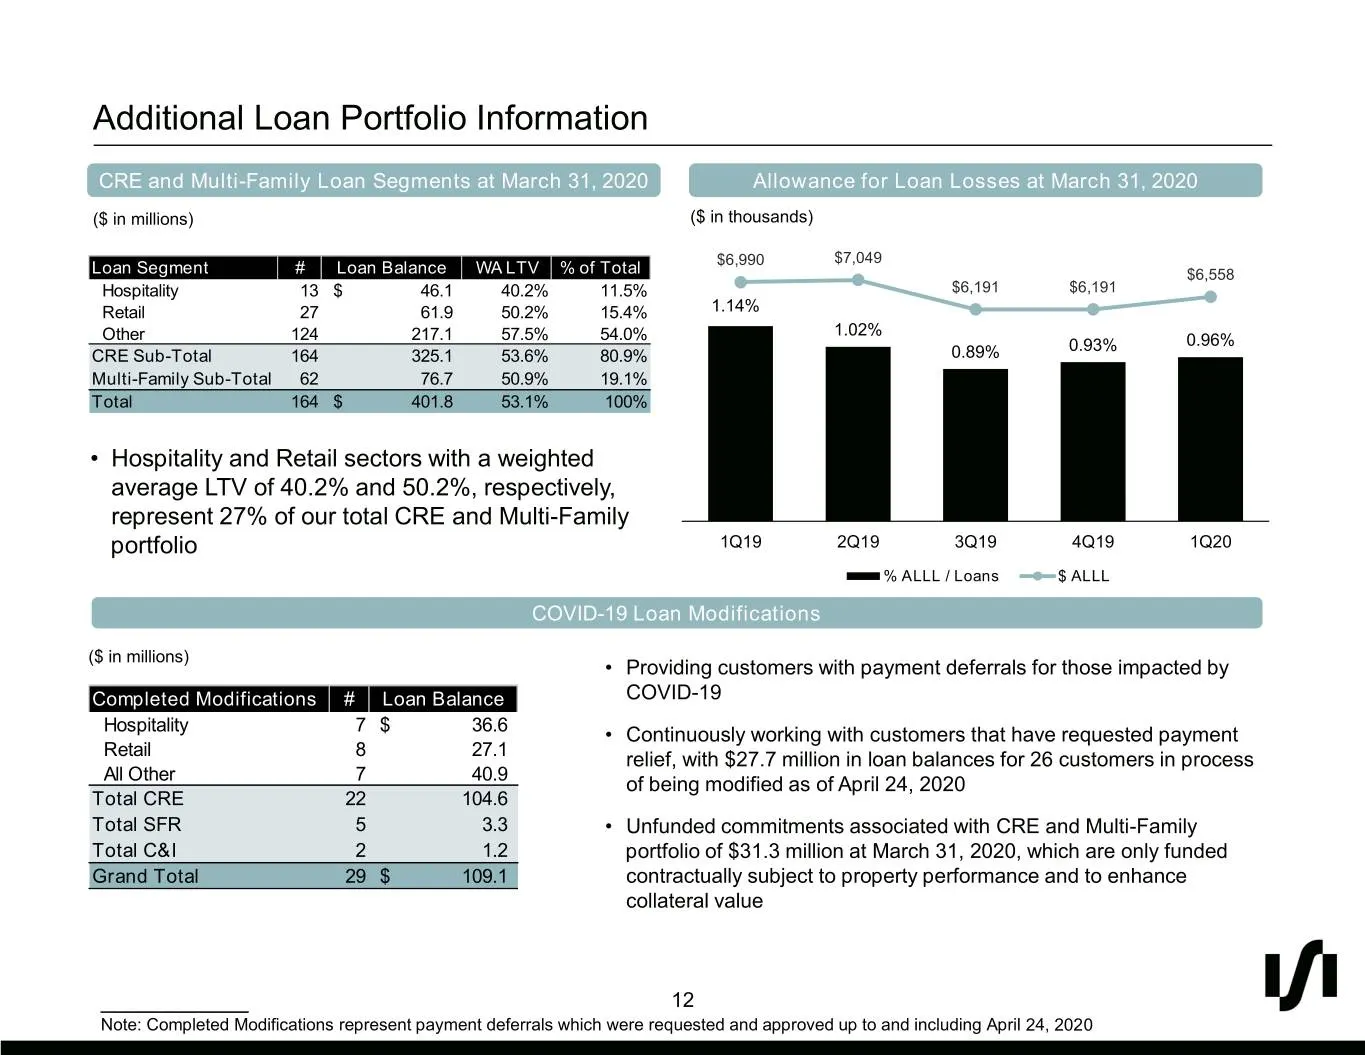
Additional Loan Portfolio Information CRE and Multi-Family Loan Segments at March 31, 2020 Allowance for Loan Losses at March 31, 2020 ($ in millions) ($ in thousands) $6,990 $7,049 Loan Segment # Loan Balance WA LTV % of Total $6,558 Hospitality 13 $ 46.1 40.2% 11.5% $6,191 $6,191 Retail 27 61.9 50
Slide 13: Capital and Liquidity Ratios
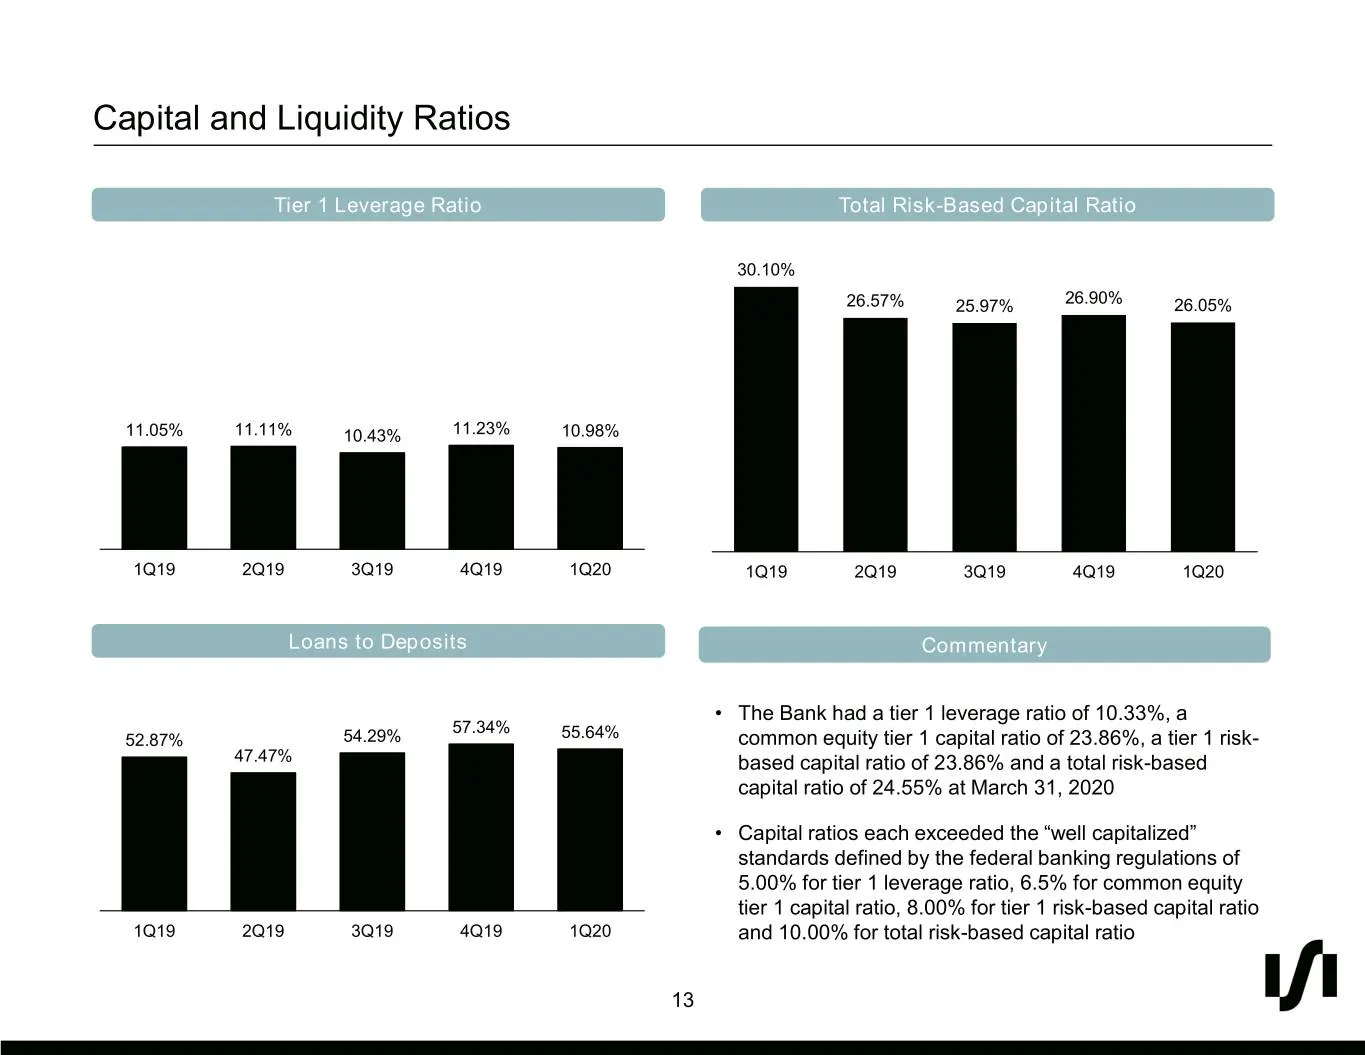
Capital and Liquidity Ratios Tier 1 Leverage Ratio Total Risk-Based Capital Ratio 30.10% 26.57% 25.97% 26.90% 26.05% 11.05% 11.11% 10.43% 11.23% 10.98% 1Q19 2Q19 3Q19 4Q19 1Q20 1Q19 2Q19 3Q19 4Q19 1Q20 Loans to Deposits Commentary • The Bank had a tier 1 leverage ratio of 10.33%, a 57.34% 52.87% 54.

Slide 14: Appendix
Appendix
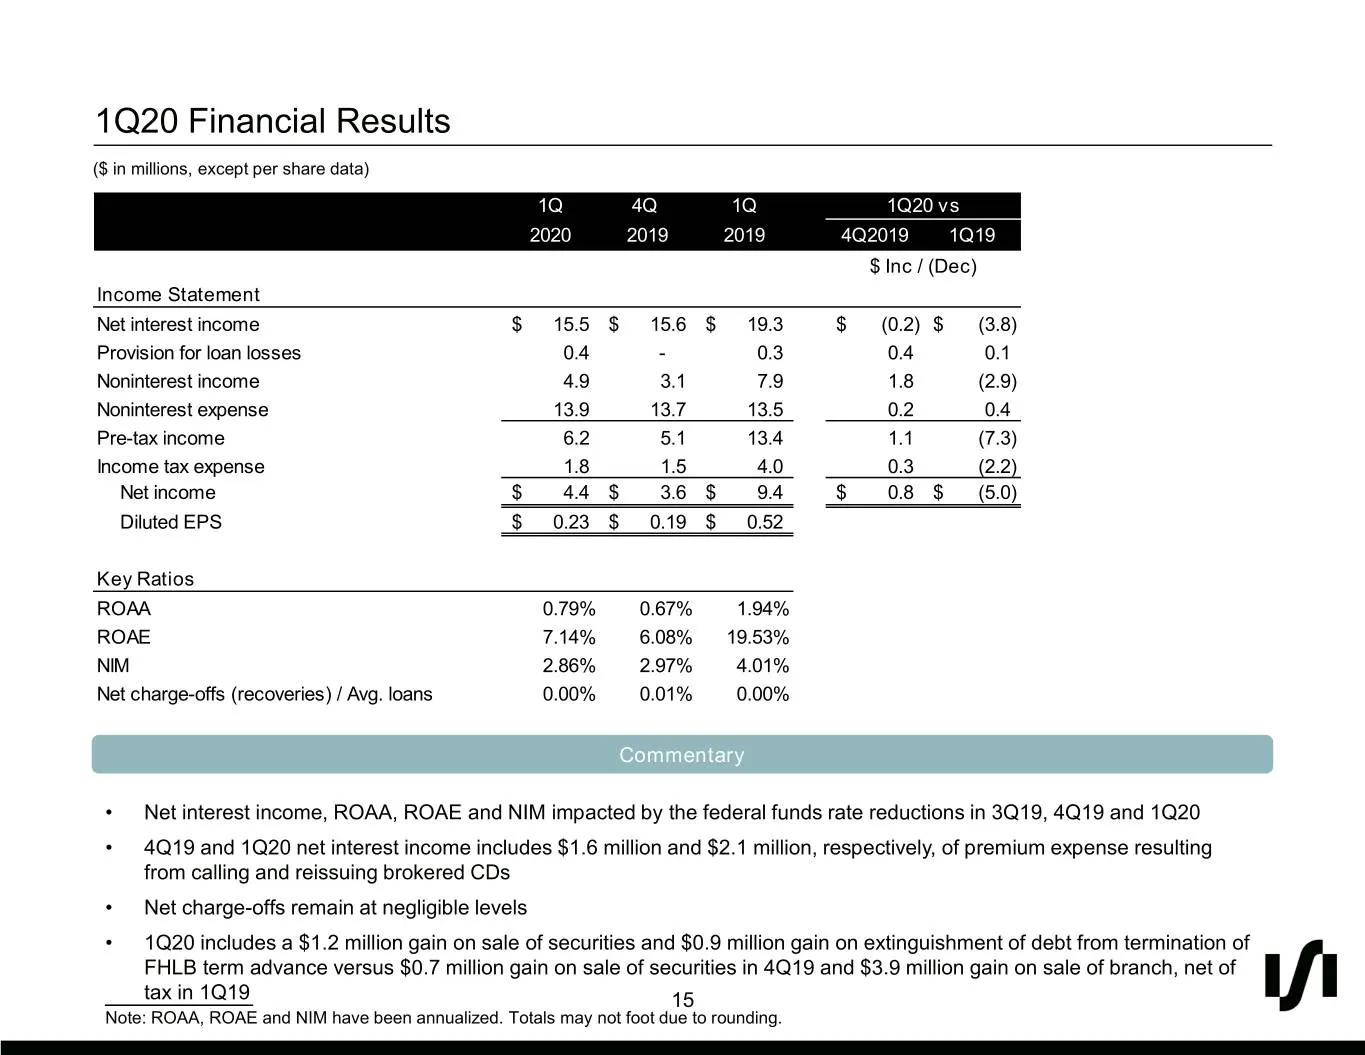
Slide 15: 1Q20 Financial Results
1Q20 Financial Results ($ in millions, except per share data) 1Q 4Q 1Q 1Q20 vs 2020 2019 2019 4Q2019 1Q19 $ Inc / (Dec) Income Statement Net interest income $ 15.5 $ 15.6 $ 19.3 $ (0.2) $ (3.8) Provision for loan losses 0.4 - 0.3 0.4 0.1 Noninterest income 4.9 3.1 7.9 1.8 (2.9) Noninterest expense 1
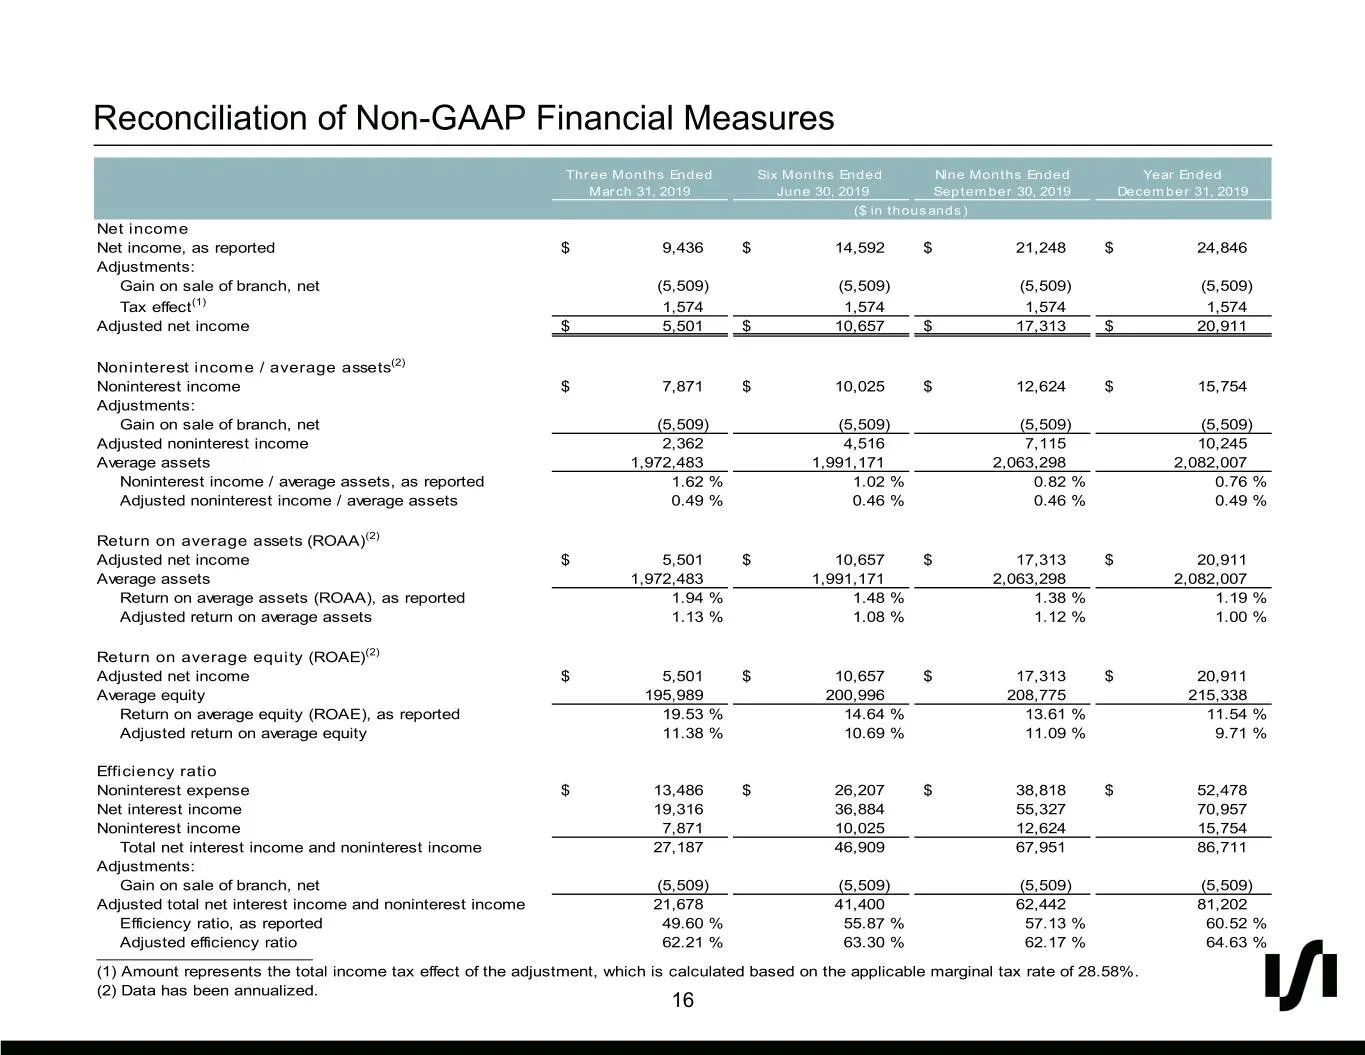
Slide 16: Reconciliation of Non-GAAP Financial Measures
Reconciliation of Non-GAAP Financial Measures Three Months Ended Six Months Ended Nine Months Ended Year Ended March 31, 2019 June 30, 2019 September 30, 2019 December 31, 2019 ($ in thousands) Net income Net income, as reported $ 9,436 $ 14,592 $ 21,248 $ 24,846 Adjustments: Gain on sale of branch,
Source: SEC EDGAR · 8-K filed Apr 29, 2020
More decks from Silvergate Capital Corp.
 Q4 2022 Earnings Presentation11 slides · Jan 17, 2023
 Investor Presentation (November 2022)13 slides · Nov 1, 2022
 Q3 2022 Earnings Presentation10 slides · Oct 18, 2022
 Investor Presentation (August 2022)14 slides · Aug 8, 2022
 Q2 2022 Earnings Presentation10 slides · Jul 19, 2022
 Investor Presentation (May 2022)15 slides · May 10, 2022