Calian Group Ltd. · TSX:CGY
Calian — Canaccord Virtual Roadshow (Outside Canada) (March 2024)
15 slides from Calian's conference presentation, Mar 22, 2024
Slide 1: Investor Presentation
Investor Presentation Canaccord Virtual Roadshow (Outside Canada) March 22, 2024
Slide 2: Caution Regarding Forward Looking Statements
Caution Regarding Forward Looking Statements Certain information included in this document is forward-looking and is subject to important risks and uncertainties. The results or events predicted in these statements may differ materially from actual results or events. Such statements are generally ac
Slide 3: Calian FY23 Snapshot
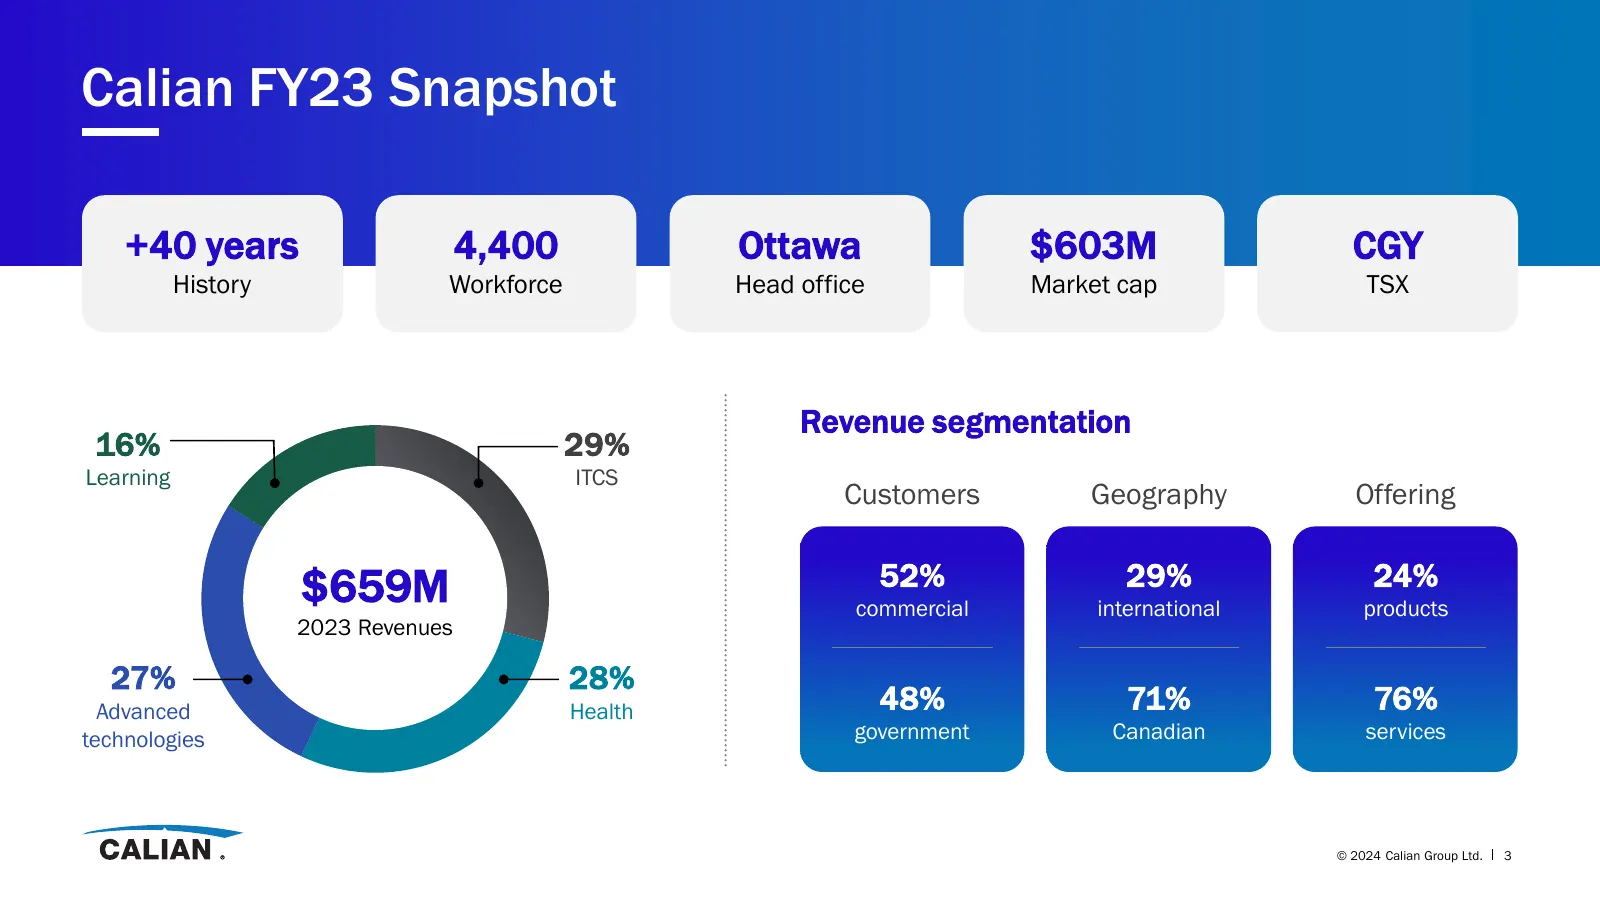
Calian FY23 Snapshot +40 years 4,400 Ottawa $603M CGY History Workforce Head office Market cap TSX Revenue segmentation 16% 29% Learning ITCS Customers Geography Offering $659M 52% 29% 24% commercial international products 2023 Revenues 27% 28% Advanced Health 48% 71% 76% technologies government Can
Slide 4: FY24 Guidance
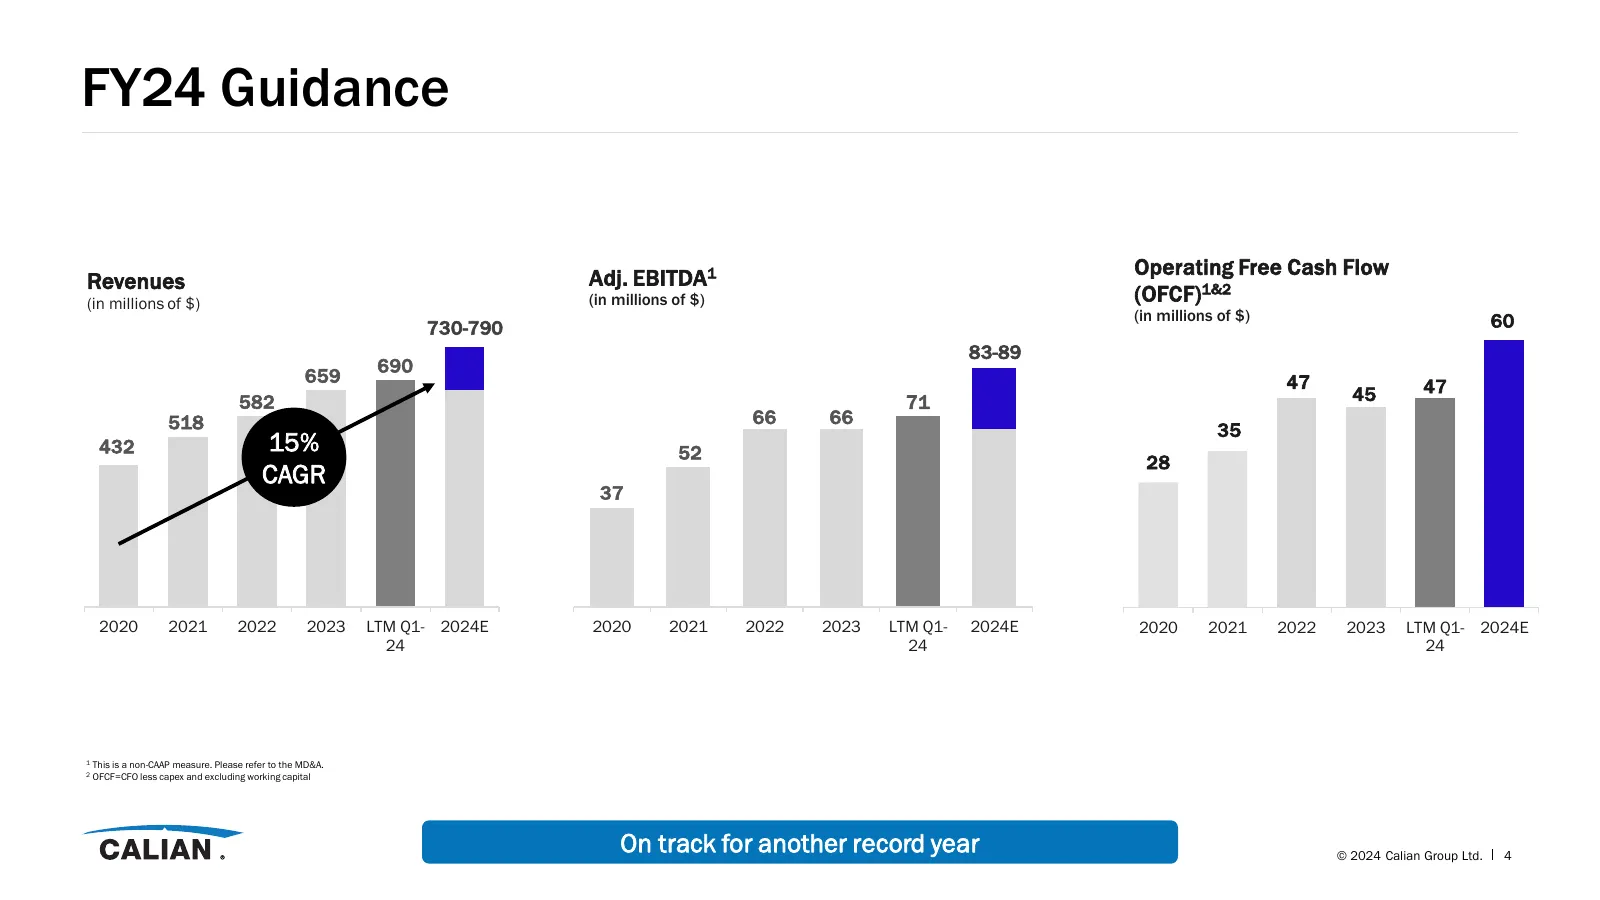
FY24 Guidance Adj. EBITDA1 Operating Free Cash Flow Revenues (in millions of $) (in millions of $) (OFCF)1&2 (in millions of $) 60 730-790 83-89 690 659 47 45 47 582 71 518 66 66 35 432 15% 52 28 CAGR 37 2020 2021 2022 2023 LTM Q1- 2024E 2020 2021 2022 2023 LTM Q1- 2024E 2020 2021 2022 2023 LTM Q1-
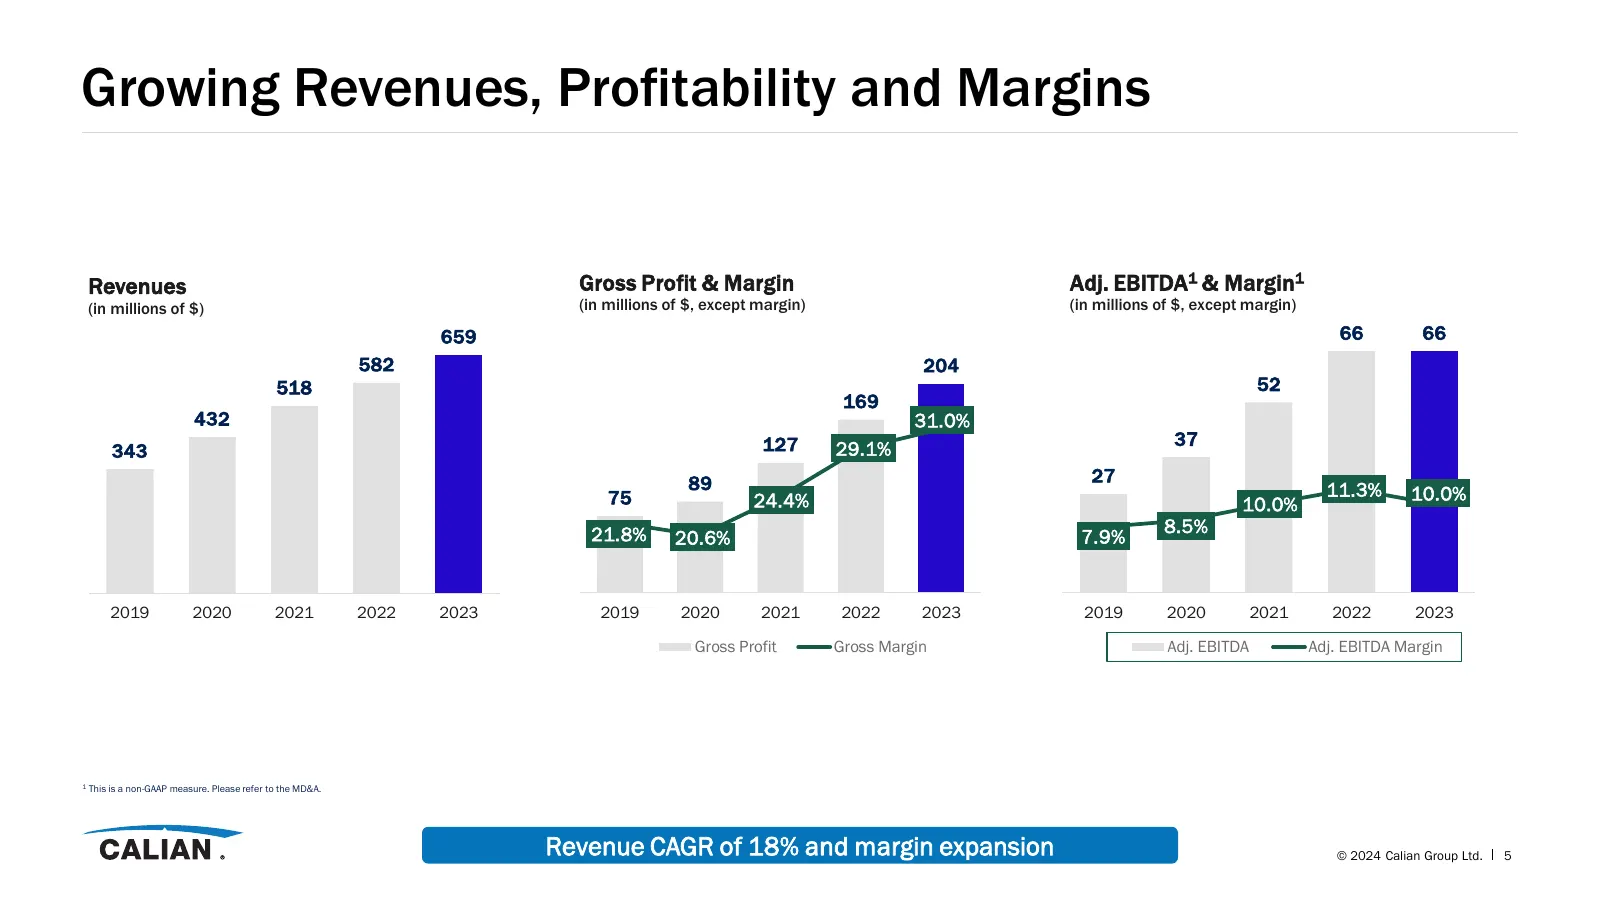
Slide 5: Growing Revenues, Profitability and Margins
Growing Revenues, Profitability and Margins Revenues Gross Profit & Margin Adj. EBITDA1 & Margin1 (in millions of $) (in millions of $, except margin) (in millions of $, except margin) 700 659 250 40.0% 70 66 66 582 204 60 22.0% 600 52 518 200 35.0% 169 50 500 432 31.0% 17.0% 400 150 127 29.1% 30.0%
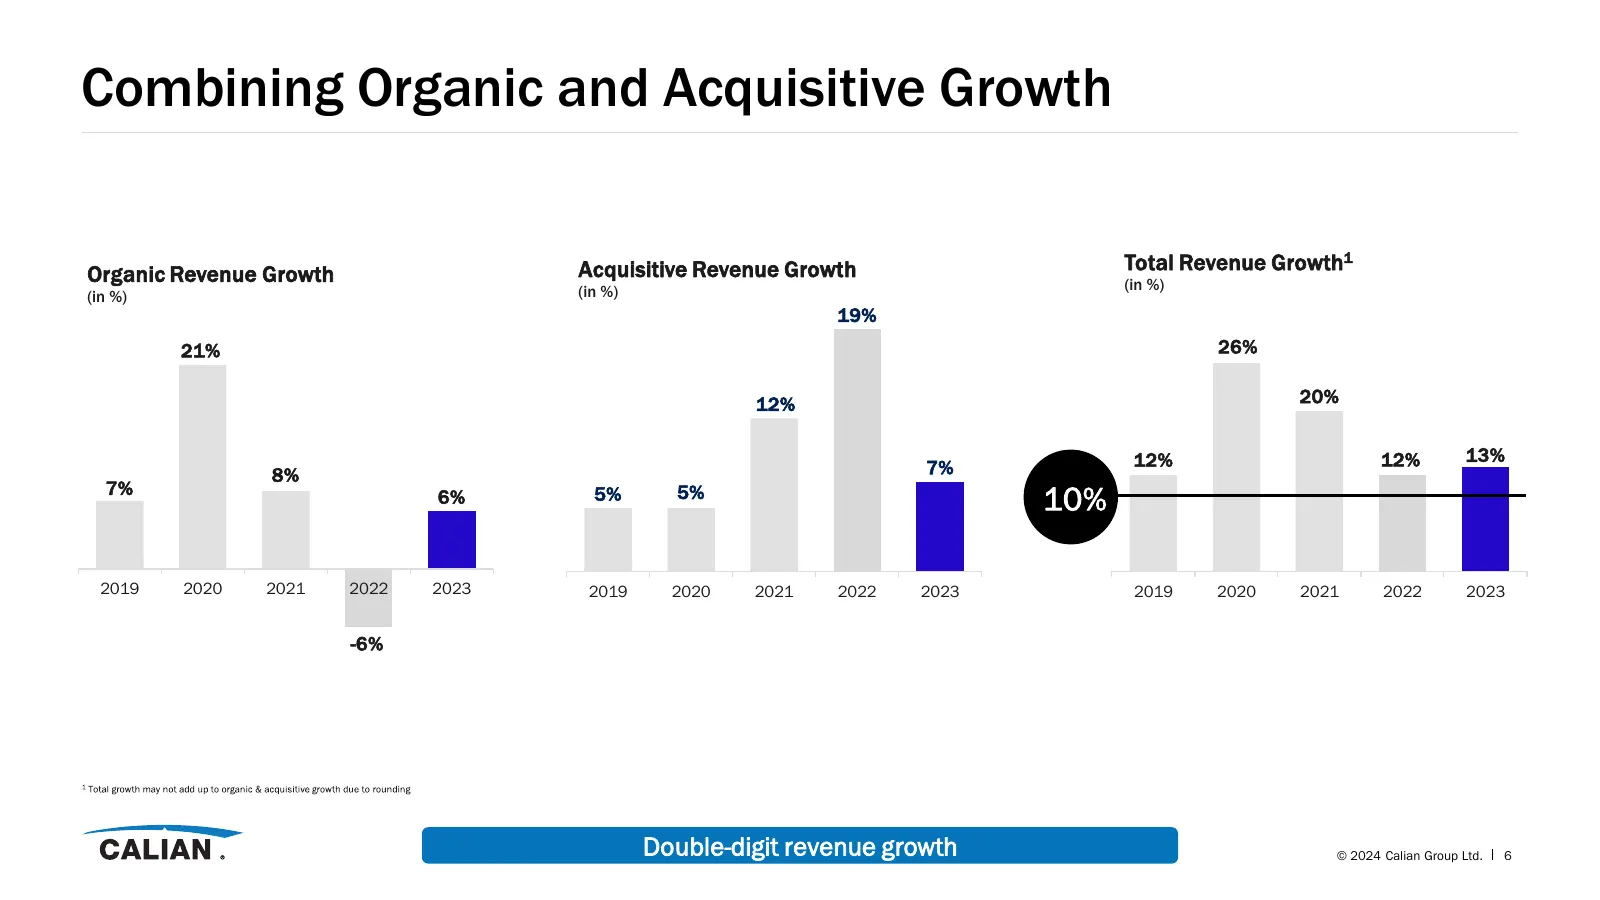
Slide 6: Combining Organic and Acquisitive Growth
Combining Organic and Acquisitive Growth Acquisitive Revenue Growth Total Revenue Growth1 Organic Revenue Growth (in %) (in %) (in %) 19% 21% 26% 12% 20% 12% 12% 13% 8% 7% 7% 6% 5% 5% 10% 2019 2020 2021 2022 2023 2019 2020 2021 2022 2023 2019 2020 2021 2022 2023 -6% 1 Total growth may not add up to
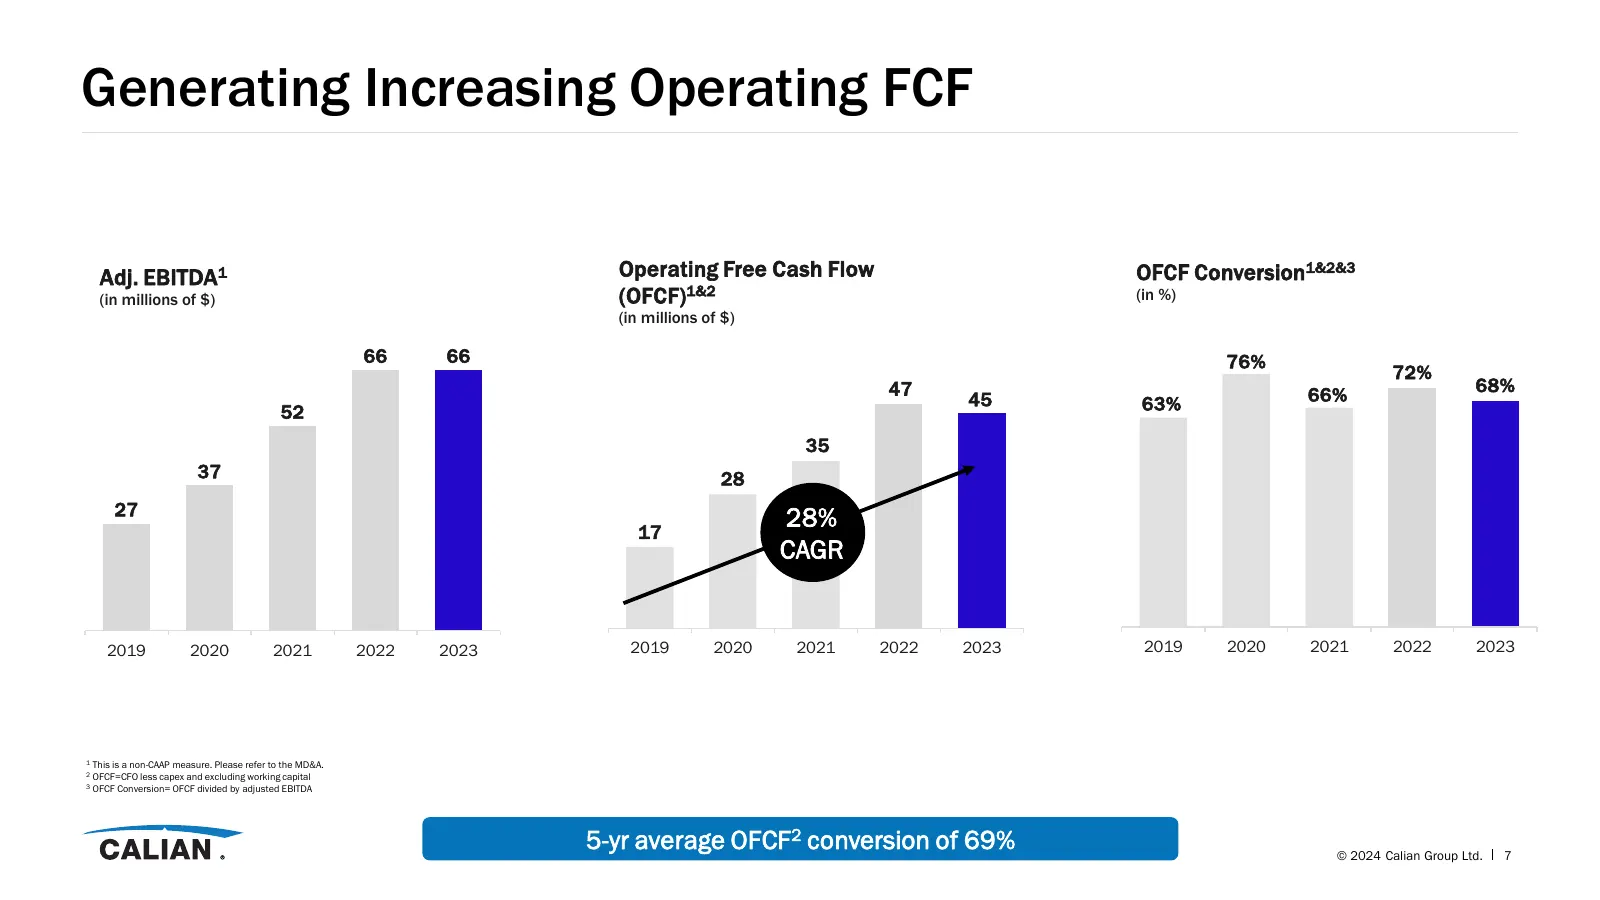
Slide 7: Generating Increasing Operating FCF
Generating Increasing Operating FCF Adj. EBITDA1 Operating Free Cash Flow OFCF Conversion1&2&3 (in millions of $) (OFCF)1&2 (in %) (in millions of $) 66 66 76% 72% 47 66% 68% 45 63% 52 35 37 28 27 17 28% CAGR 2019 2020 2021 2022 2023 2019 2020 2021 2022 2023 2019 2020 2021 2022 2023 1 This is a non-
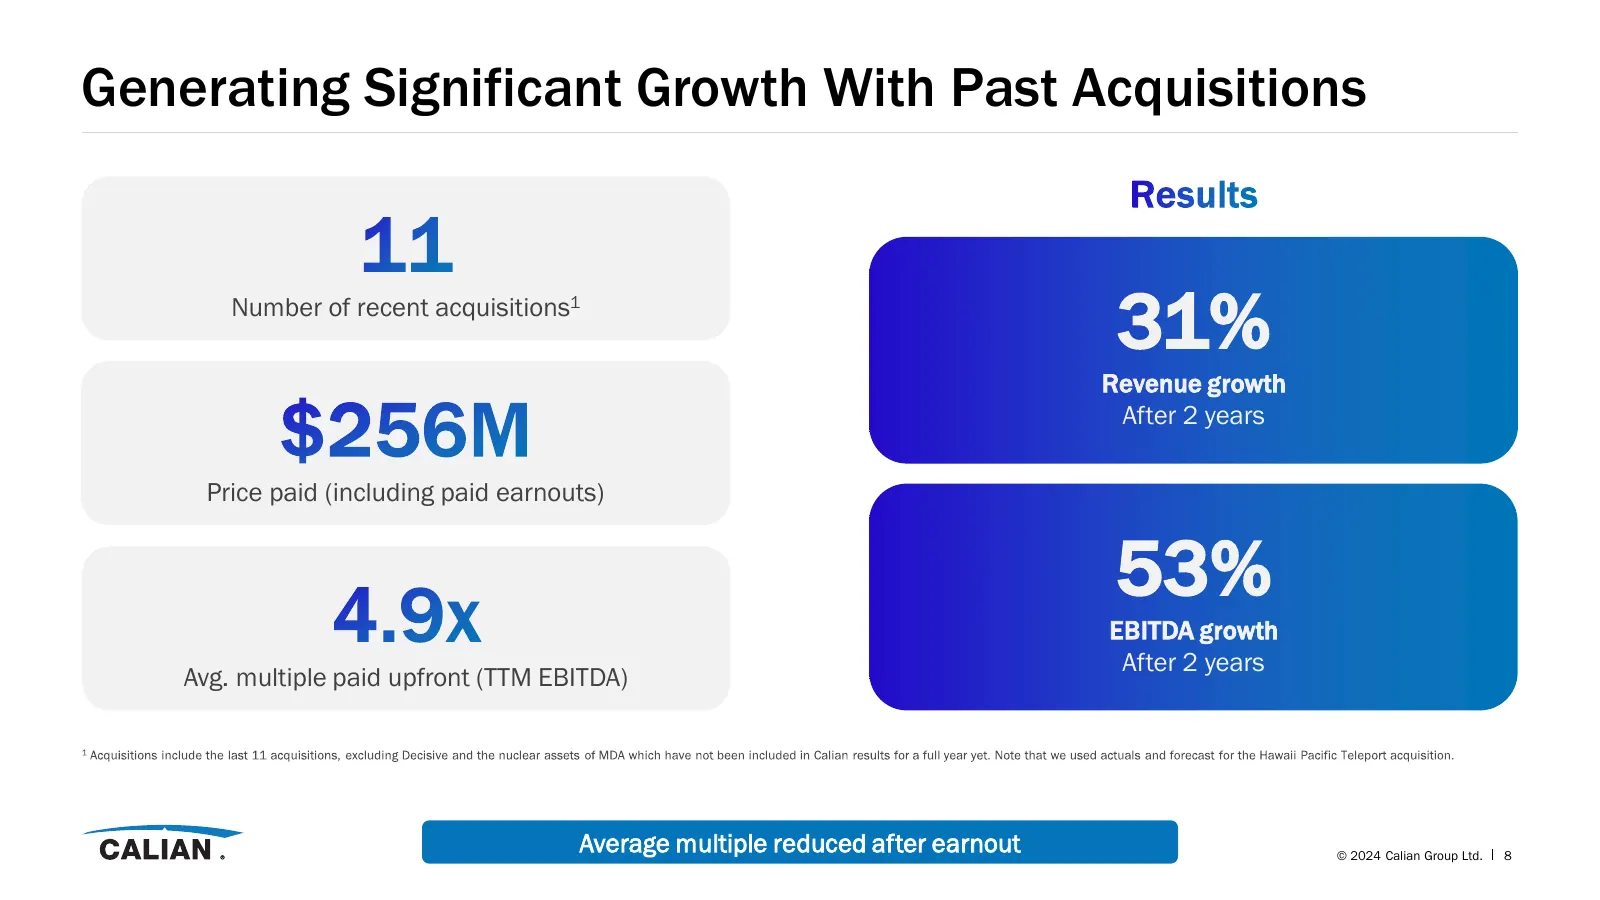
Slide 8: Generating Significant Growth With Past Acquisitions
Generating Significant Growth With Past Acquisitions Results 11 Number of recent acquisitions1 31% Revenue growth $256M After 2 years Price paid (including paid earnouts) 53% 4.9x EBITDA growth After 2 years Avg. multiple paid upfront (TTM EBITDA) Average multiple reduced after earnout © 2024 Calian
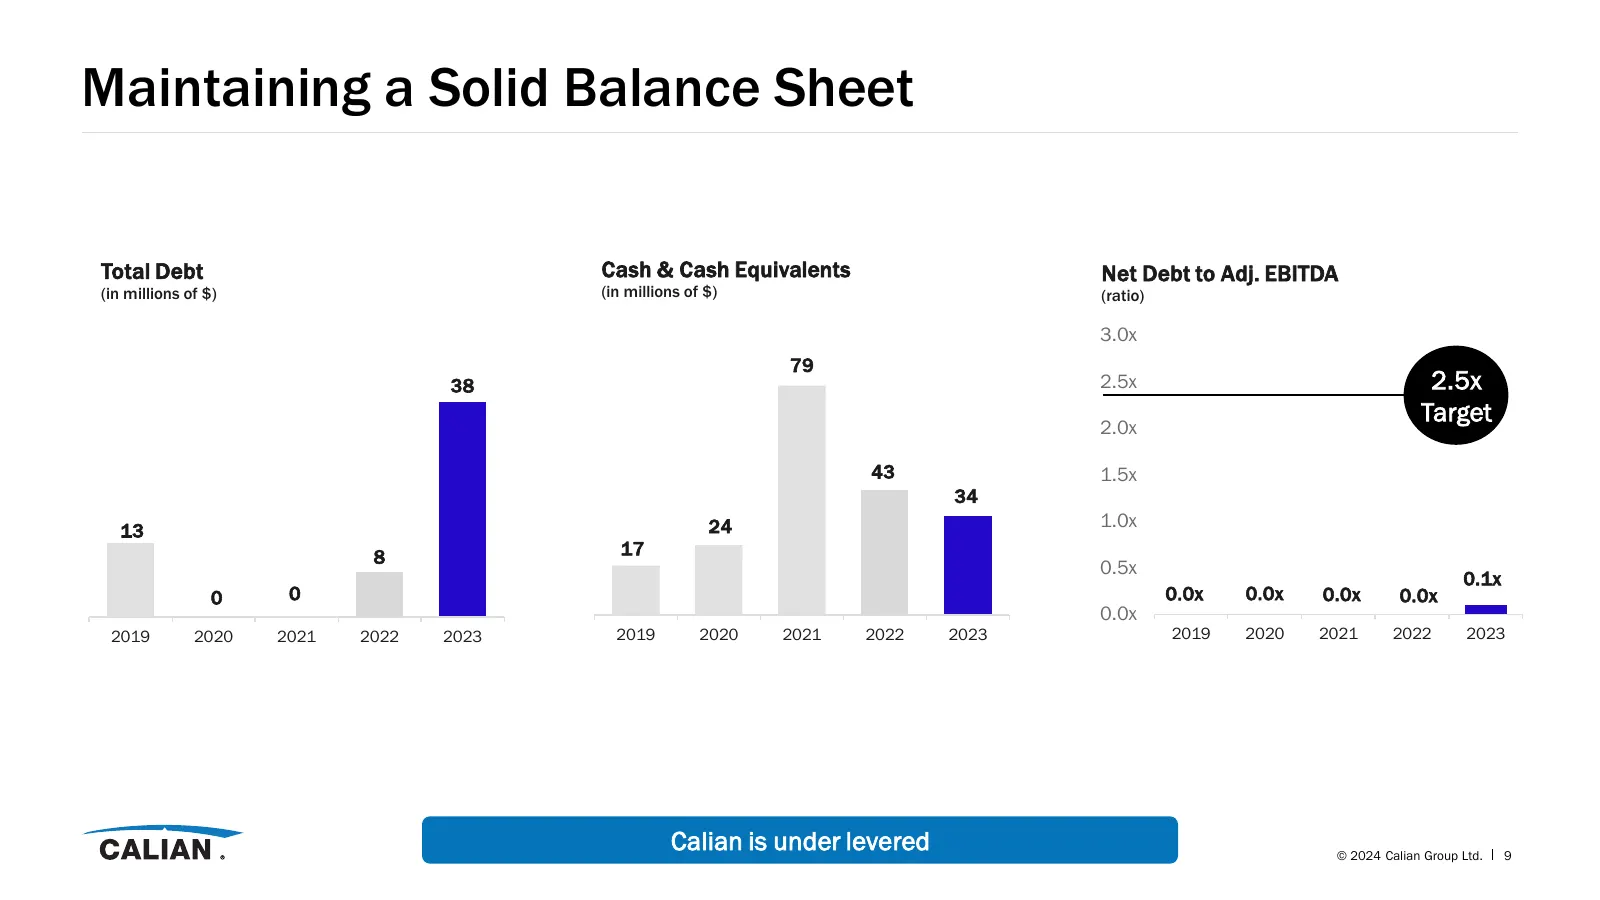
Slide 9: Maintaining a Solid Balance Sheet
Maintaining a Solid Balance Sheet Total Debt Cash & Cash Equivalents Net Debt to Adj. EBITDA (in millions of $) (in millions of $) (ratio) 3.0x 79 38 2.5x 2.5x Target 2.0x 43 1.5x 34 13 24 1.0x 8 17 0.5x 0.1x 0 0 0.0x 0.0x 0.0x 0.0x 0.0x 2019 2020 2021 2022 2023 2019 2020 2021 2022 2023 2019 2020 20
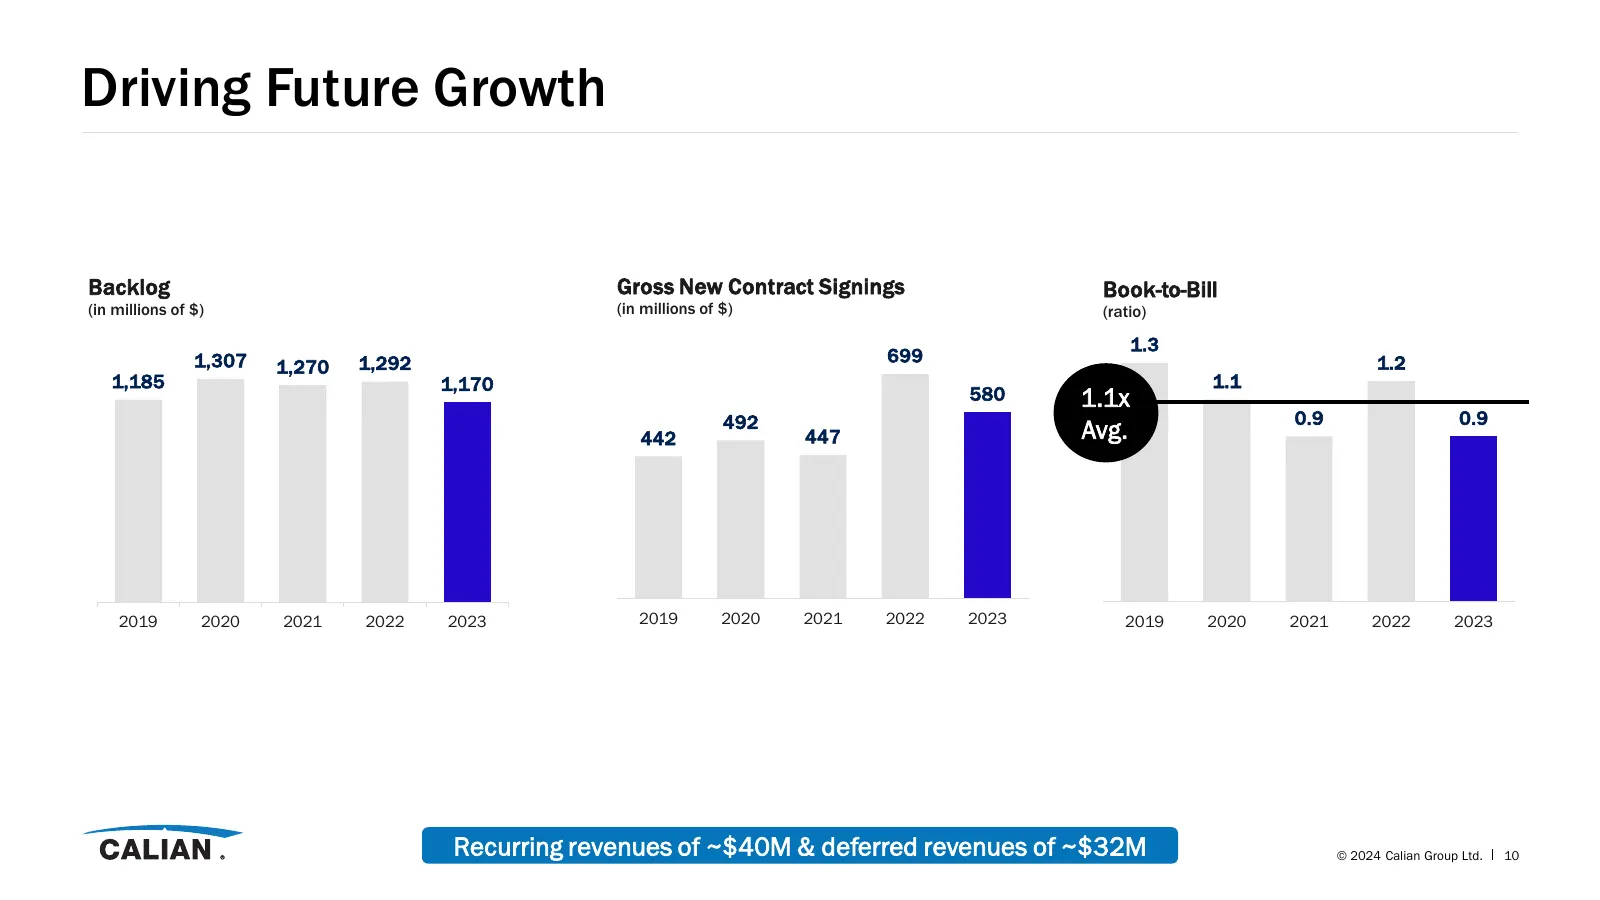
Slide 10: Driving Future Growth
Driving Future Growth Backlog Gross New Contract Signings Book-to-Bill (in millions of $) (in millions of $) (ratio) 1,500 800 1.4 1.3 1,307 1,292 699 1.2 1,270 700 1,300 1,185 1,170 1.2 1.1 600 580 1.1x 1,100 492 1 0.9 0.9 500 442 447 Avg. 900 0.8 400 700 0.6 300 500 200 0.4 300 100 0.2 100 0 0 -10
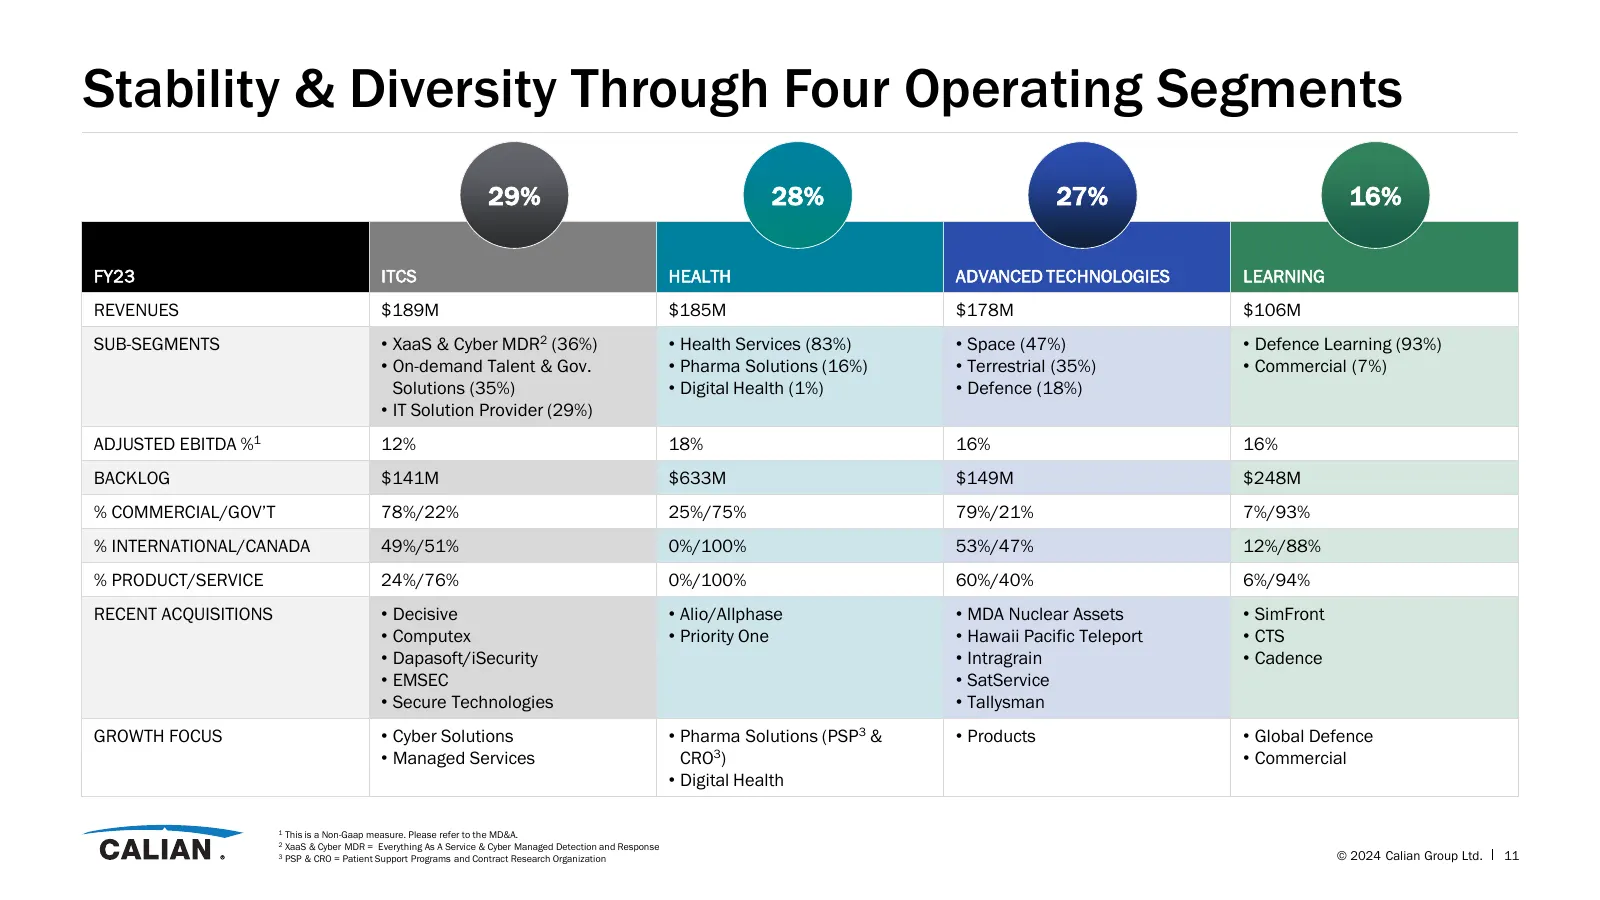
Slide 11: Stability & Diversity Through Four Operating Segments
Stability & Diversity Through Four Operating Segments 29% 28% 27% 16% FY23 ITCS HEALTH ADVANCED TECHNOLOGIES LEARNING REVENUES $189M $185M $178M $106M SUB-SEGMENTS • XaaS & Cyber MDR2 (36%) • Health Services (83%) • Space (47%) • Defence Learning (93%) • On-demand Talent & Gov. • Pharma Solutions (1
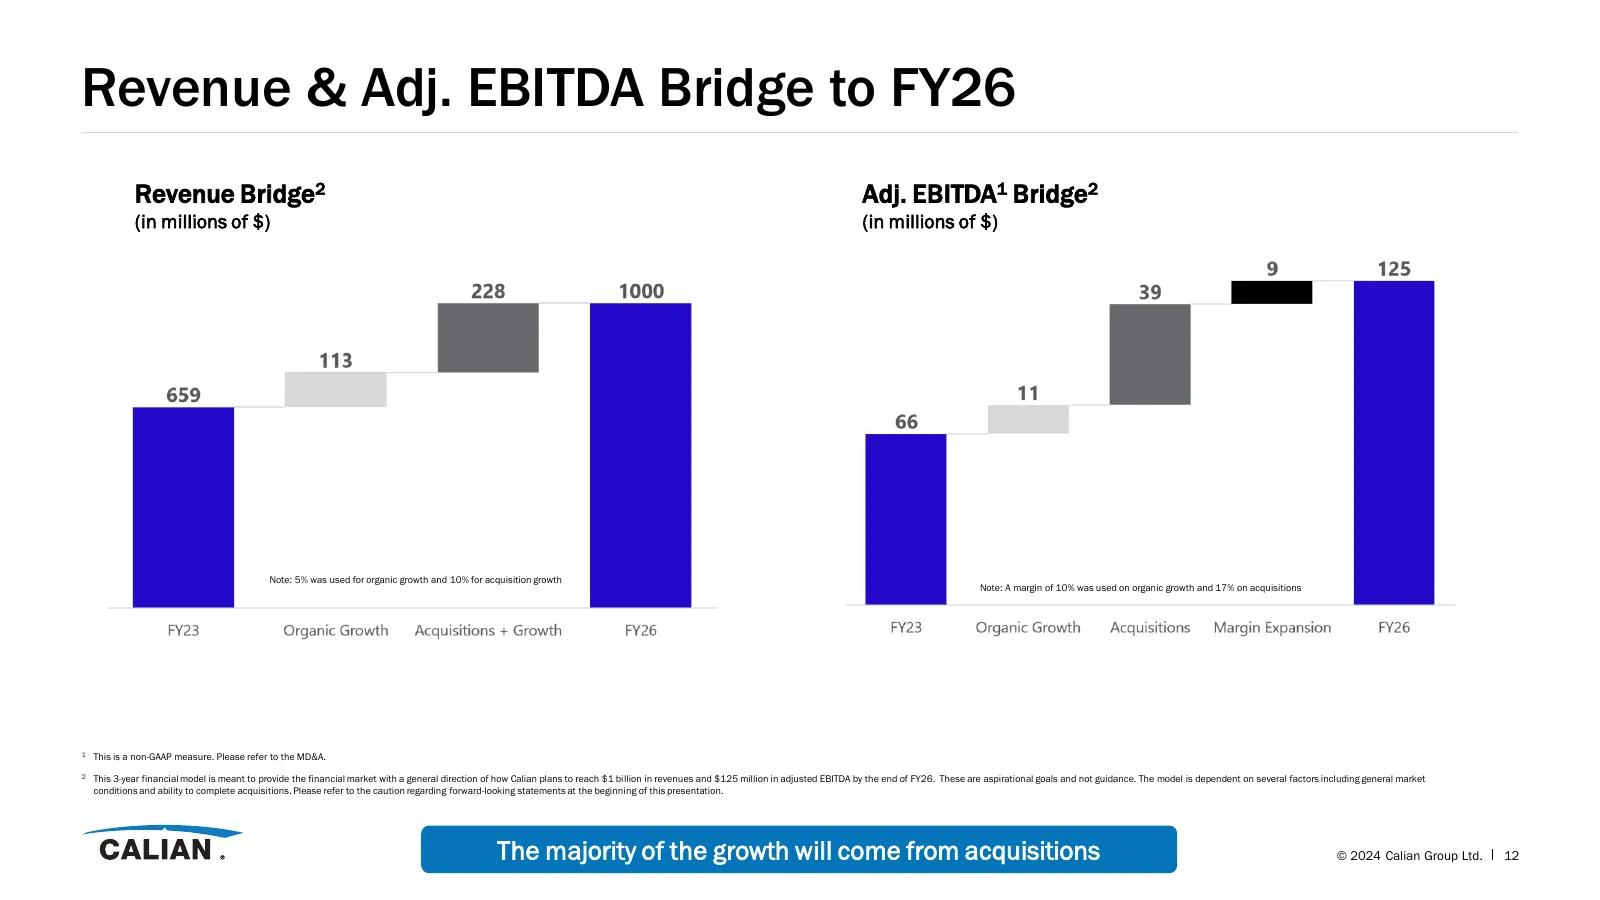
Slide 12: Revenue & Adj. EBITDA Bridge to FY26
Revenue & Adj. EBITDA Bridge to FY26 Revenue Bridge2 Adj. EBITDA1 Bridge2 (in millions of $) (in millions of $) Note: 5% was used for organic growth and 10% for acquisition growth Note: A margin of 10% was used on organic growth and 17% on acquisitions 1 This is a non-GAAP measure. Please refer to t
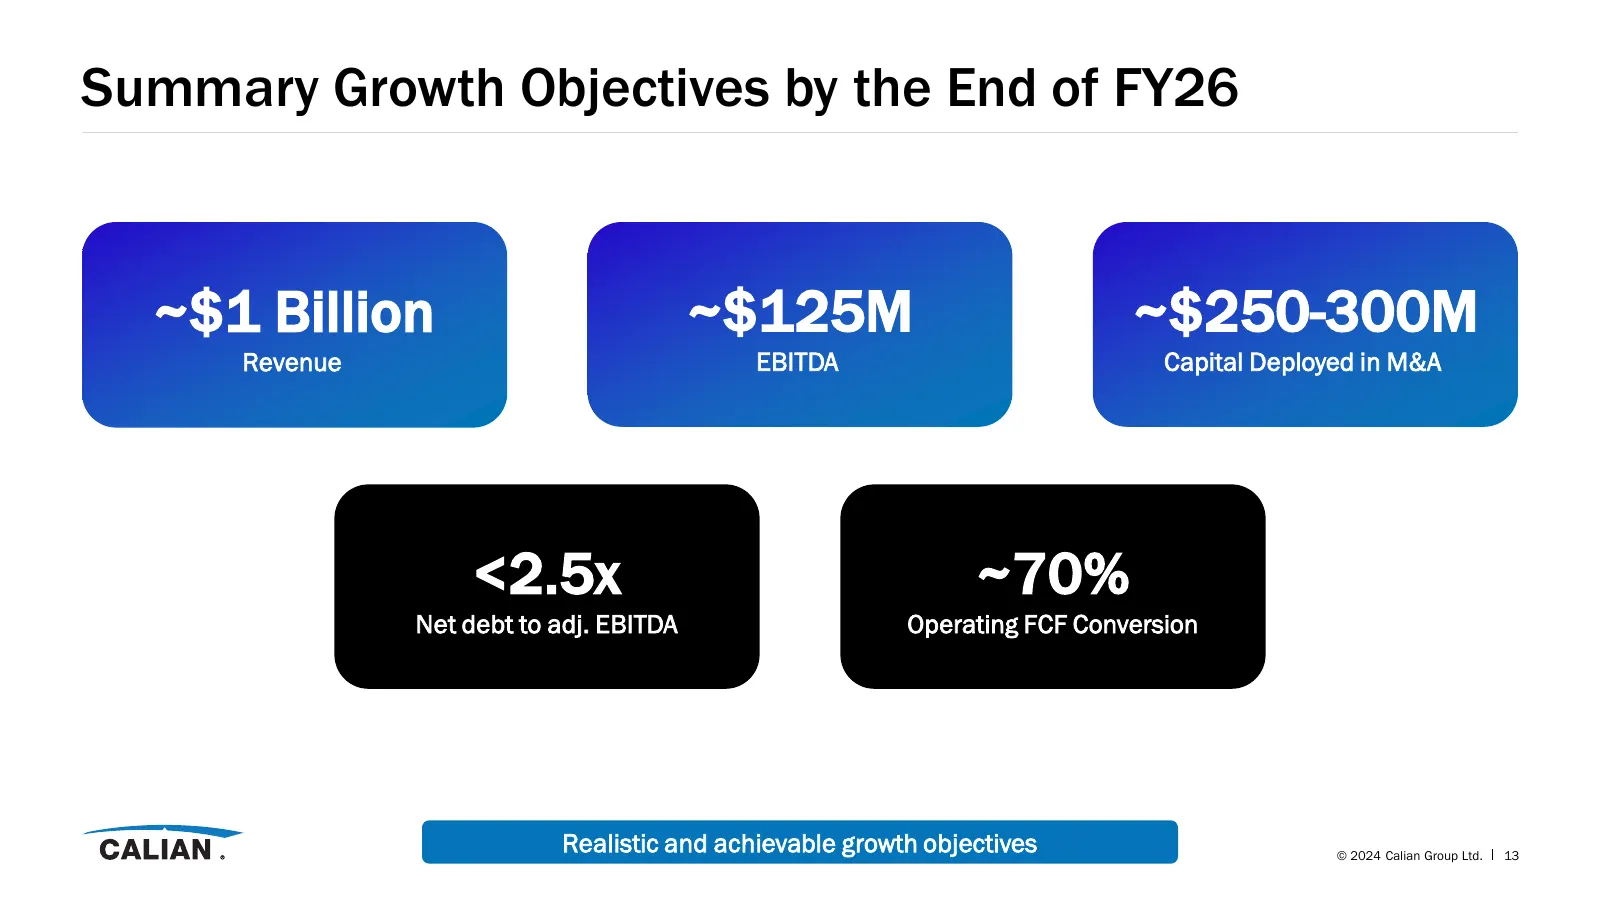
Slide 13: Summary Growth Objectives by the End of FY26
Summary Growth Objectives by the End of FY26 ~$1 Billion ~$125M ~$250-300M Revenue EBITDA Capital Deployed in M&A <2.5x ~70% Net debt to adj. EBITDA Operating FCF Conversion Realistic and achievable growth objectives © 2024 Calian Group Ltd. 13
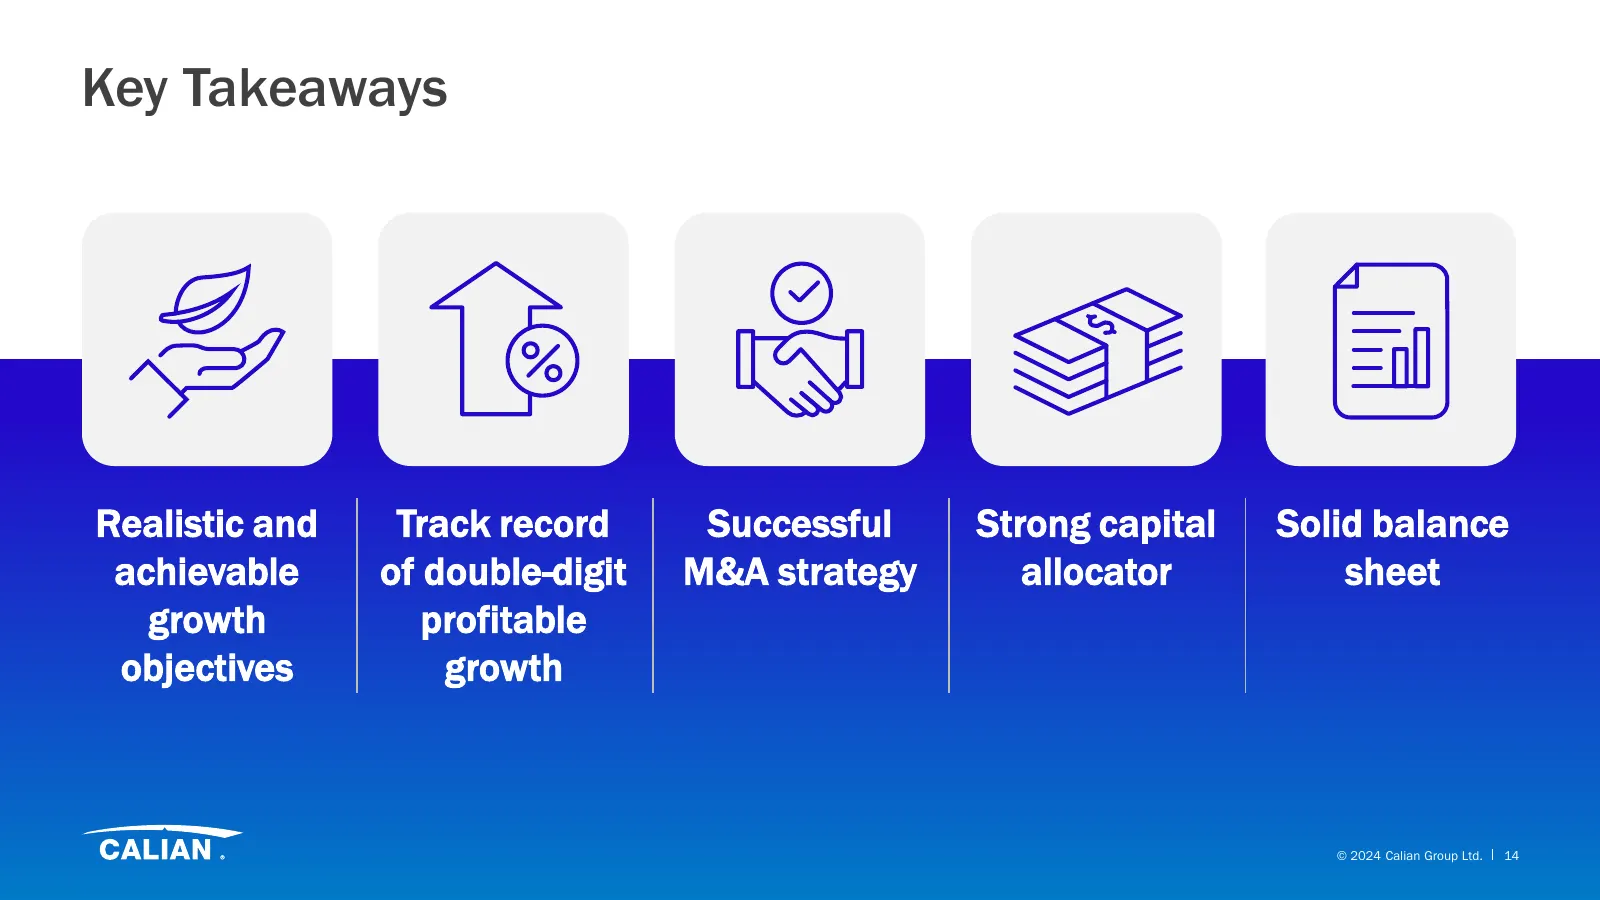
Slide 14: Key Takeaways
Key Takeaways Realistic and Track record Successful Strong capital Solid balance achievable of double-digit M&A strategy allocator sheet growth profitable objectives growth © 2024 Calian Group Ltd. 14

Slide 15: Thank you
Thank you Jennifer McCaughey, CFA, F.CIRI Director, Investor Relations ir@calian.com
Source: company website
More decks from Calian Group Ltd.
 Investor Presentation (September 2026)18 slides · Sep 24, 2026
 Q3 2026 Earnings Presentation17 slides · Aug 13, 2026
 Q2 2026 Earnings Presentation18 slides · May 2026
 Q1 2026 Earnings Presentation18 slides · Feb 12, 2026
 Defence Webinar with Ventum Capital Markets (October 2025)11 slides · Oct 7, 2025
 Q4 2025 Earnings Presentation21 slides · Sep 30, 2025