RAIT Financial Trust — 2007 NAREIT Investor Forum
16 slides from RAIT Financial Trust's conference presentation, Jun 5, 2007
Slide 1: A Diversified Real Estate Finance REIT
Exhibit 99.1 A Diversified Real Estate Finance REIT 2007 NAREIT Investor Forum June 5, 2007 www.raitft.com
Slide 2: Forward Looking Disclosure and Use of Non-GAAP Financial Measures
Forward Looking Disclosure and Use of Non- GAAP Financial Measures This document and the related presentation may contain forward-looking statements within the meaning of the Private Securities Litigation Reform Act of 1995. These forward-looking statements include, but are not limited to, statement
Slide 3: Diversified Real Estate Finance REIT
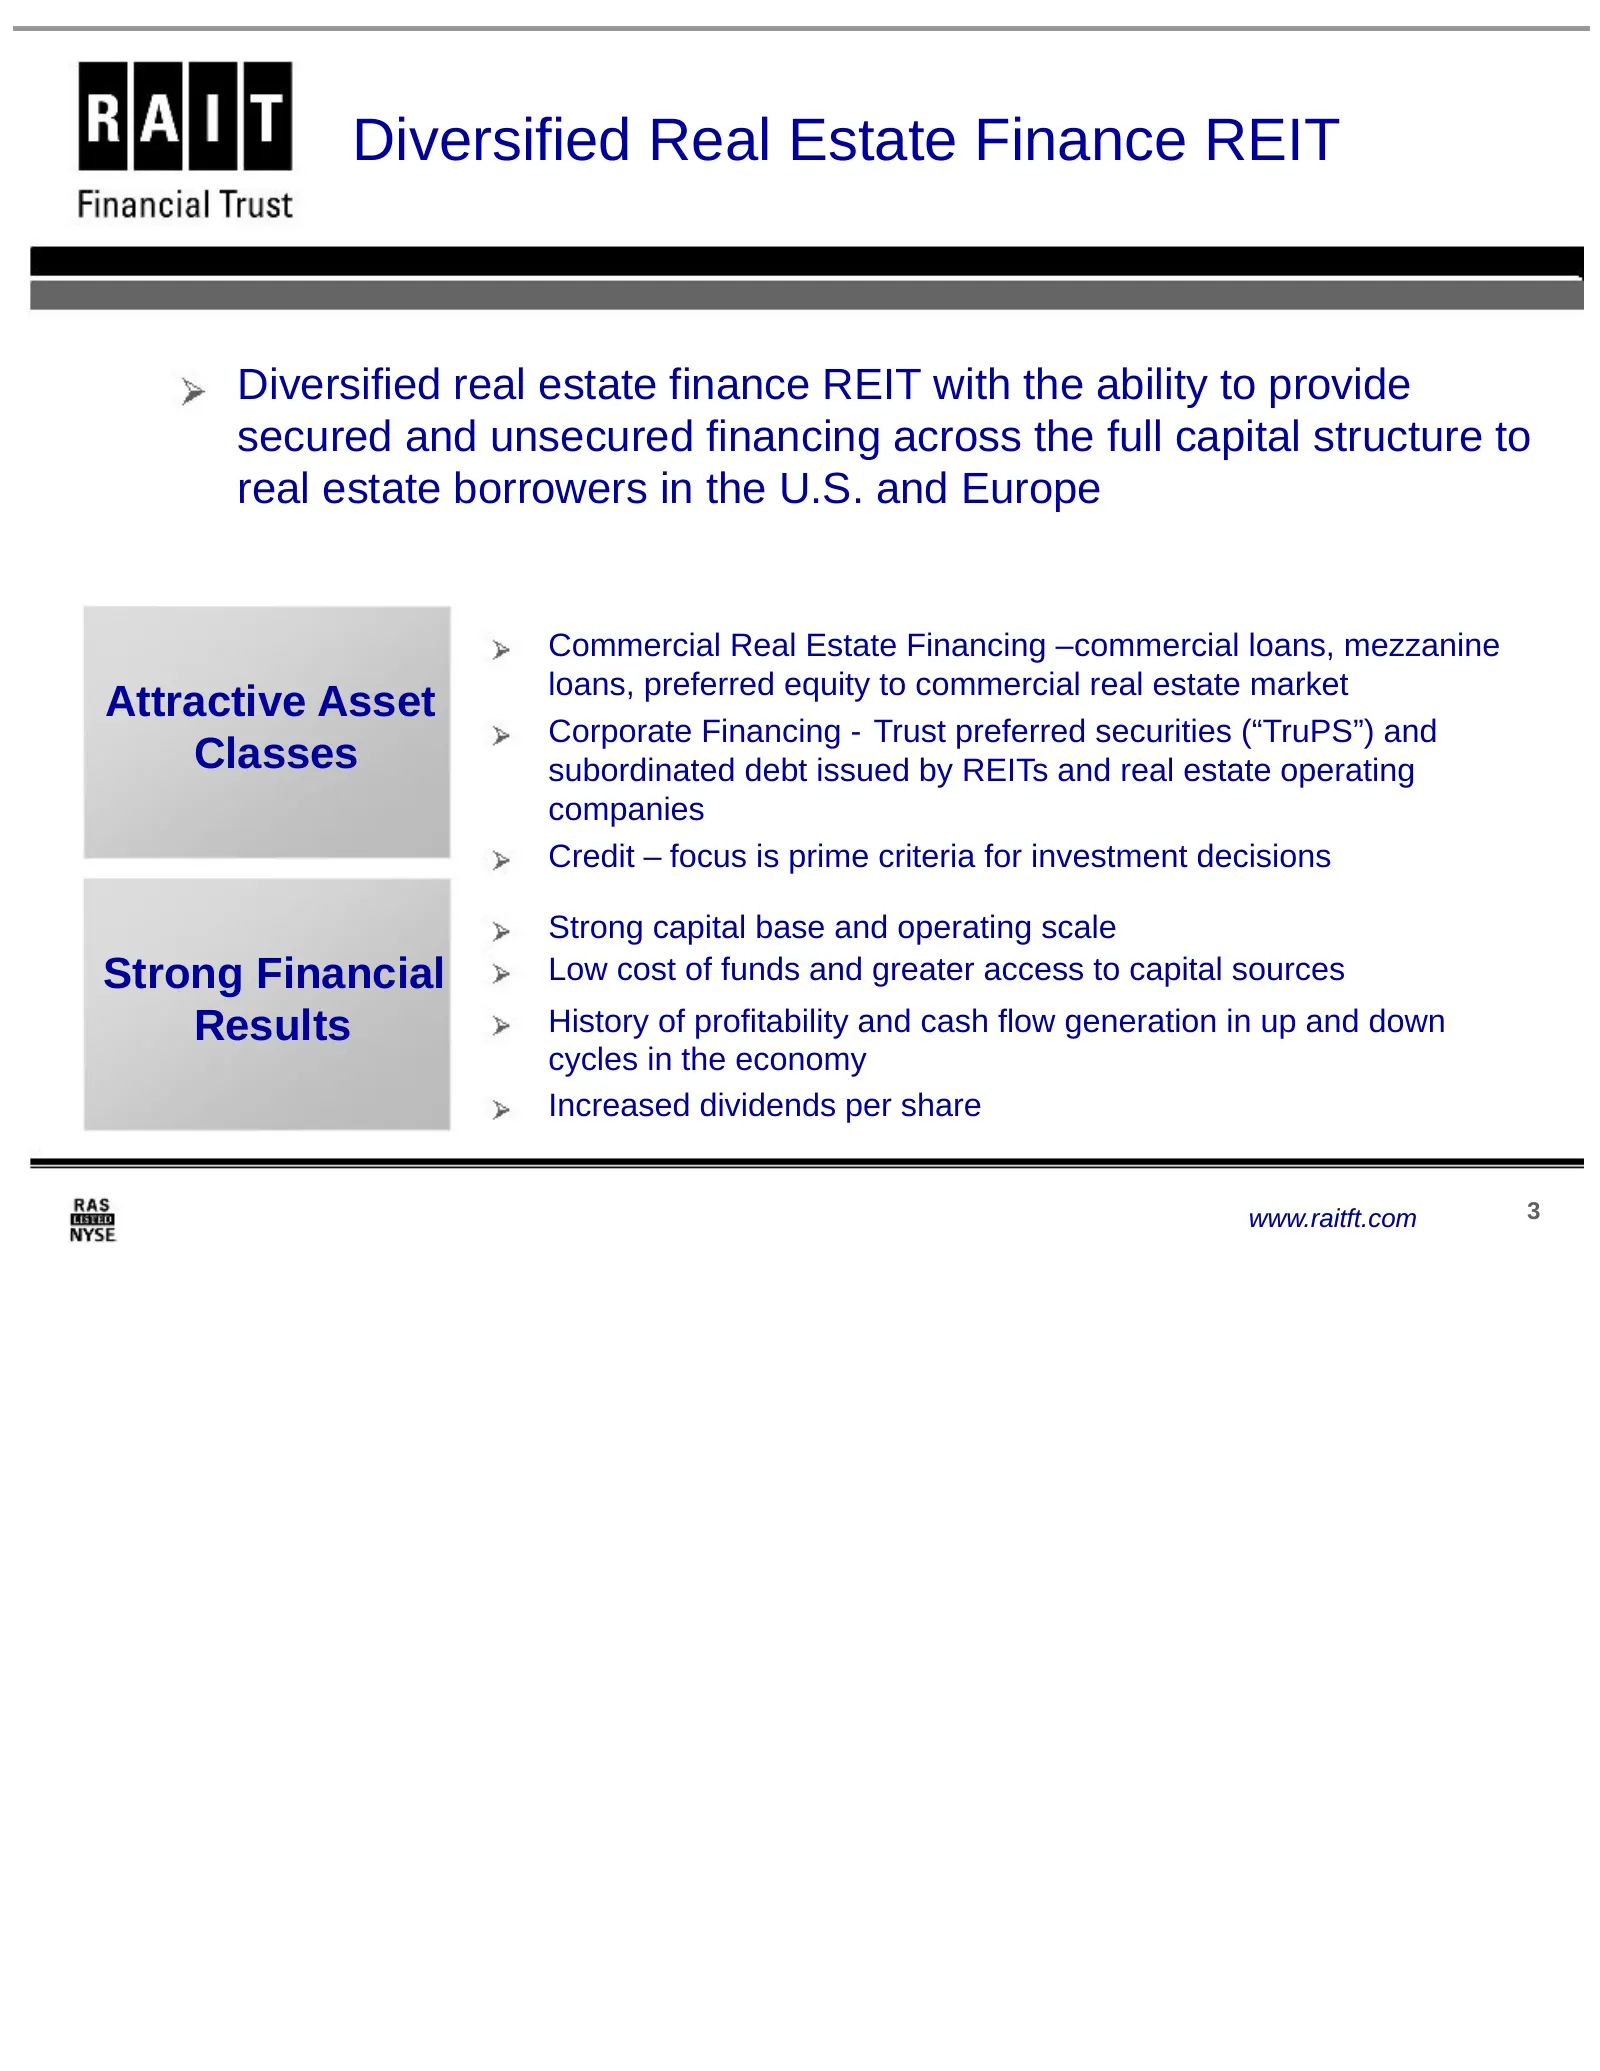
Diversified Real Estate Finance REIT Diversified real estate finance REIT with the ability to provide secured and unsecured financing across the full capital structure to real estate borrowers in the U.S. and Europe Commercial Real Estate Financing –commercial loans, mezzanine loans, preferred equit
Slide 4: Proven Structured Finance Expertise
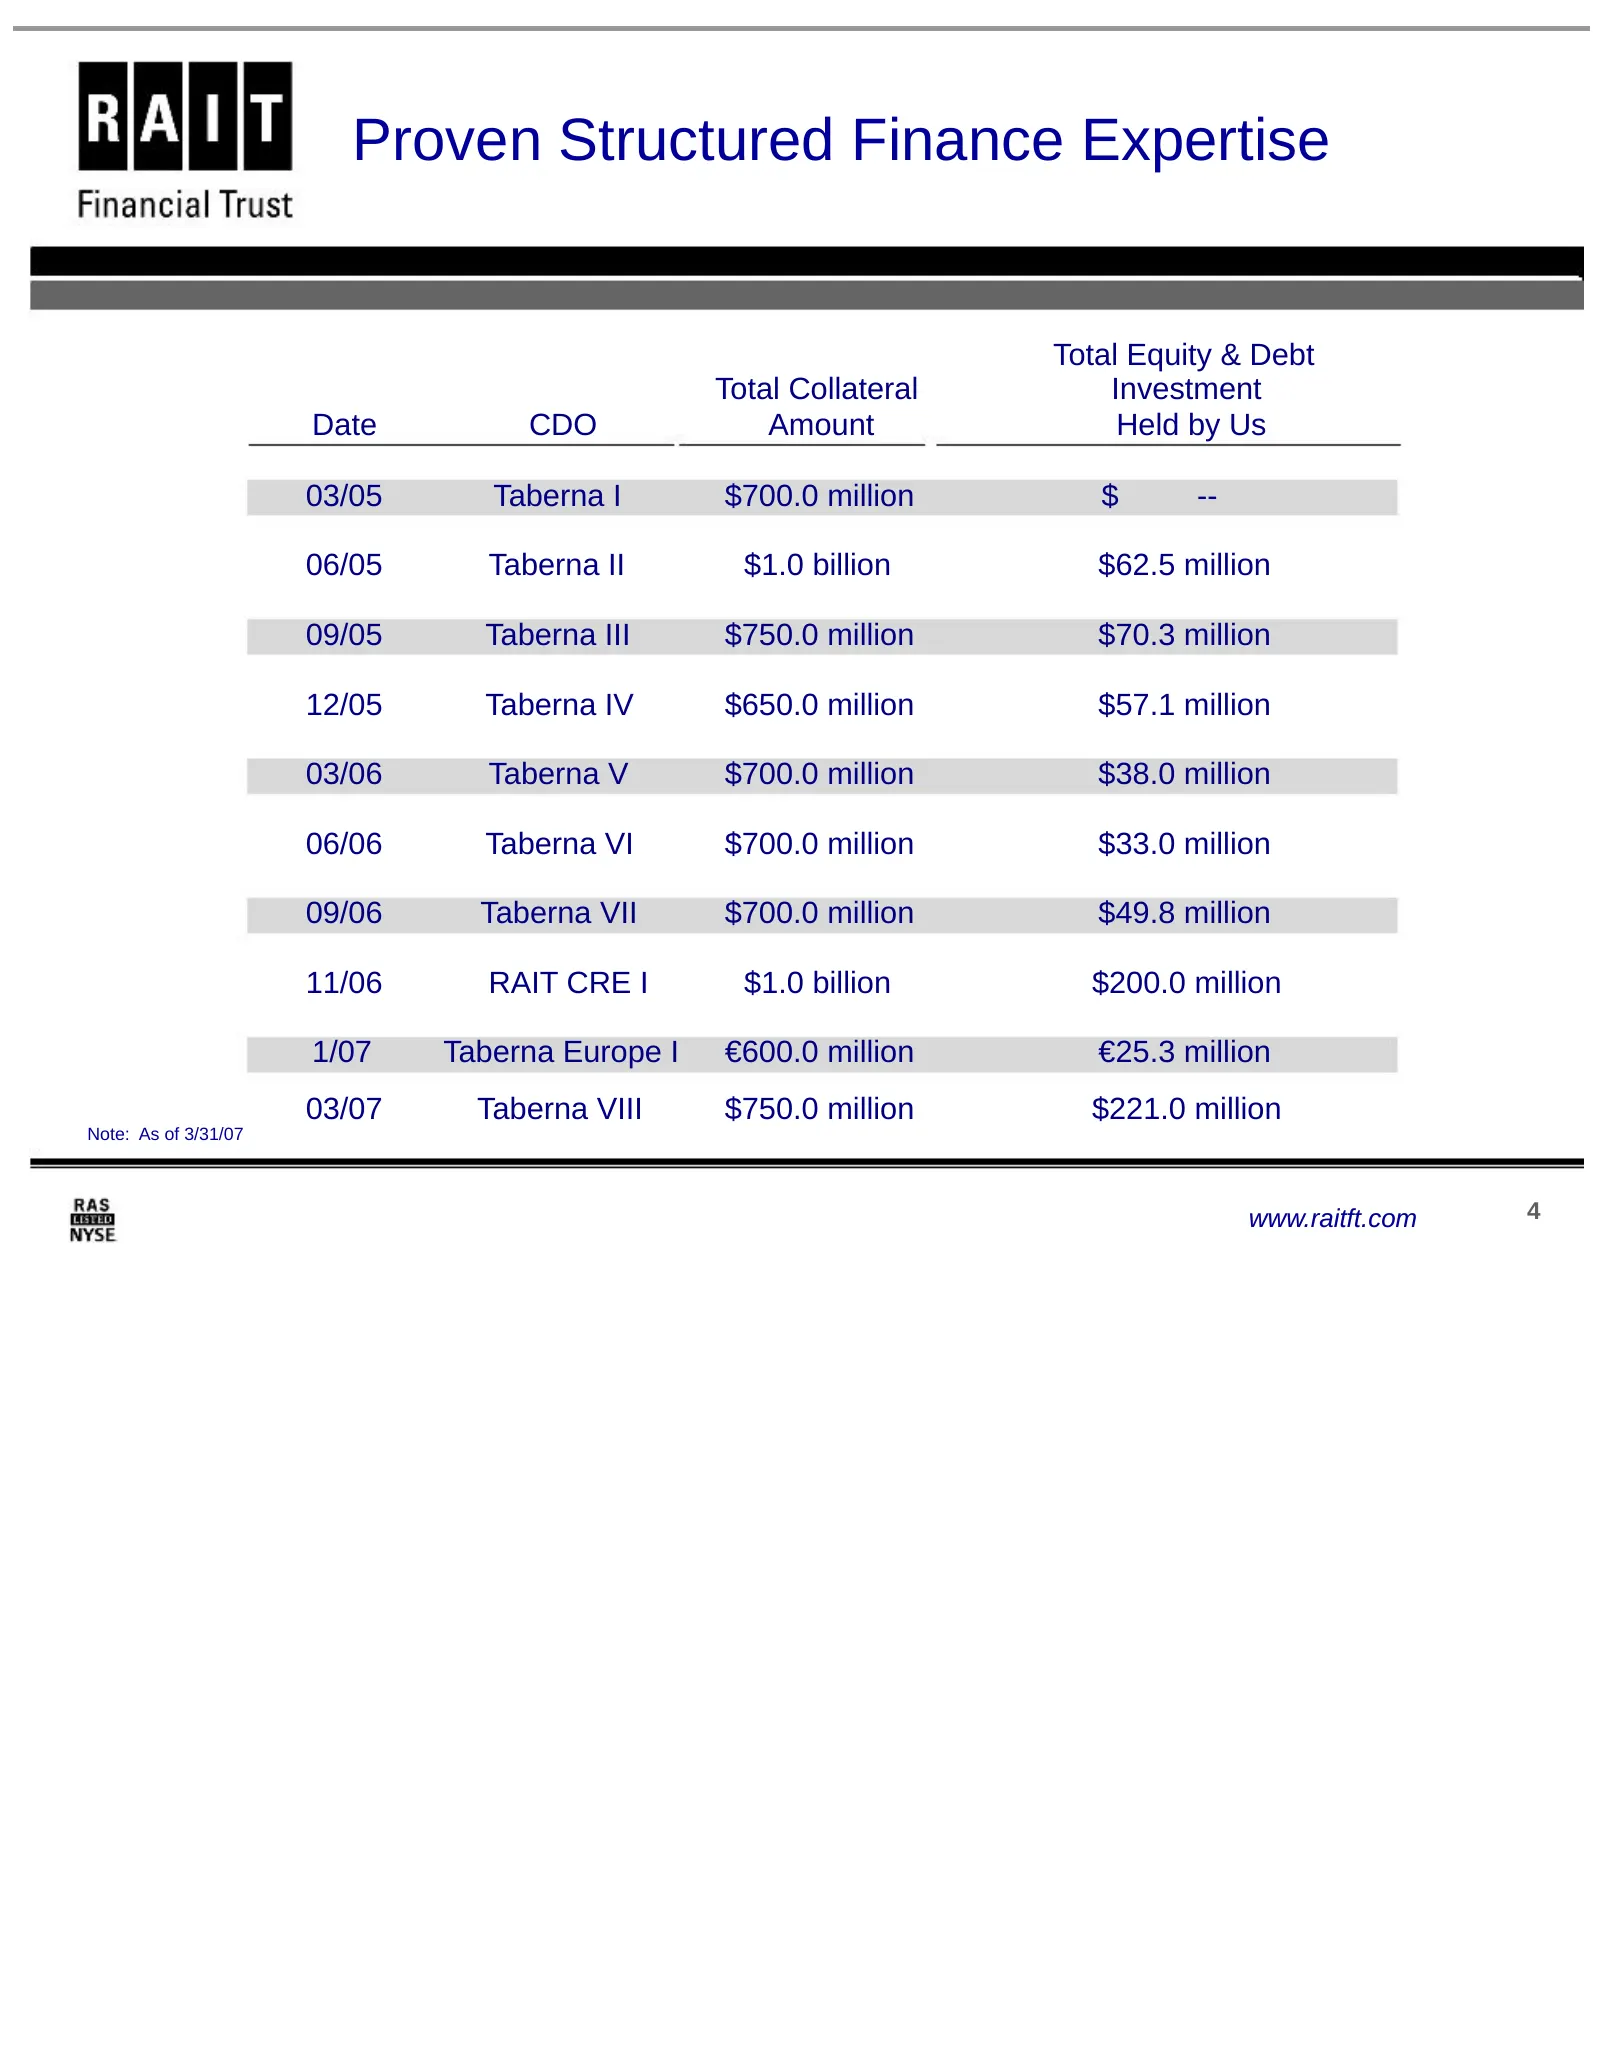
Proven Structured Finance Expertise Total Equity & Debt Total Collateral Investment Date CDO Amount Held by Us 03/05 Taberna I $700.0 million $ -- 06/05 Taberna II $1.0 billion $62.5 million 09/05 Taberna III $750.0 million $70.3 million 12/05 Taberna IV $650.0 million $57.1 million 03/06 Taberna V
Slide 5: Financing Considerations
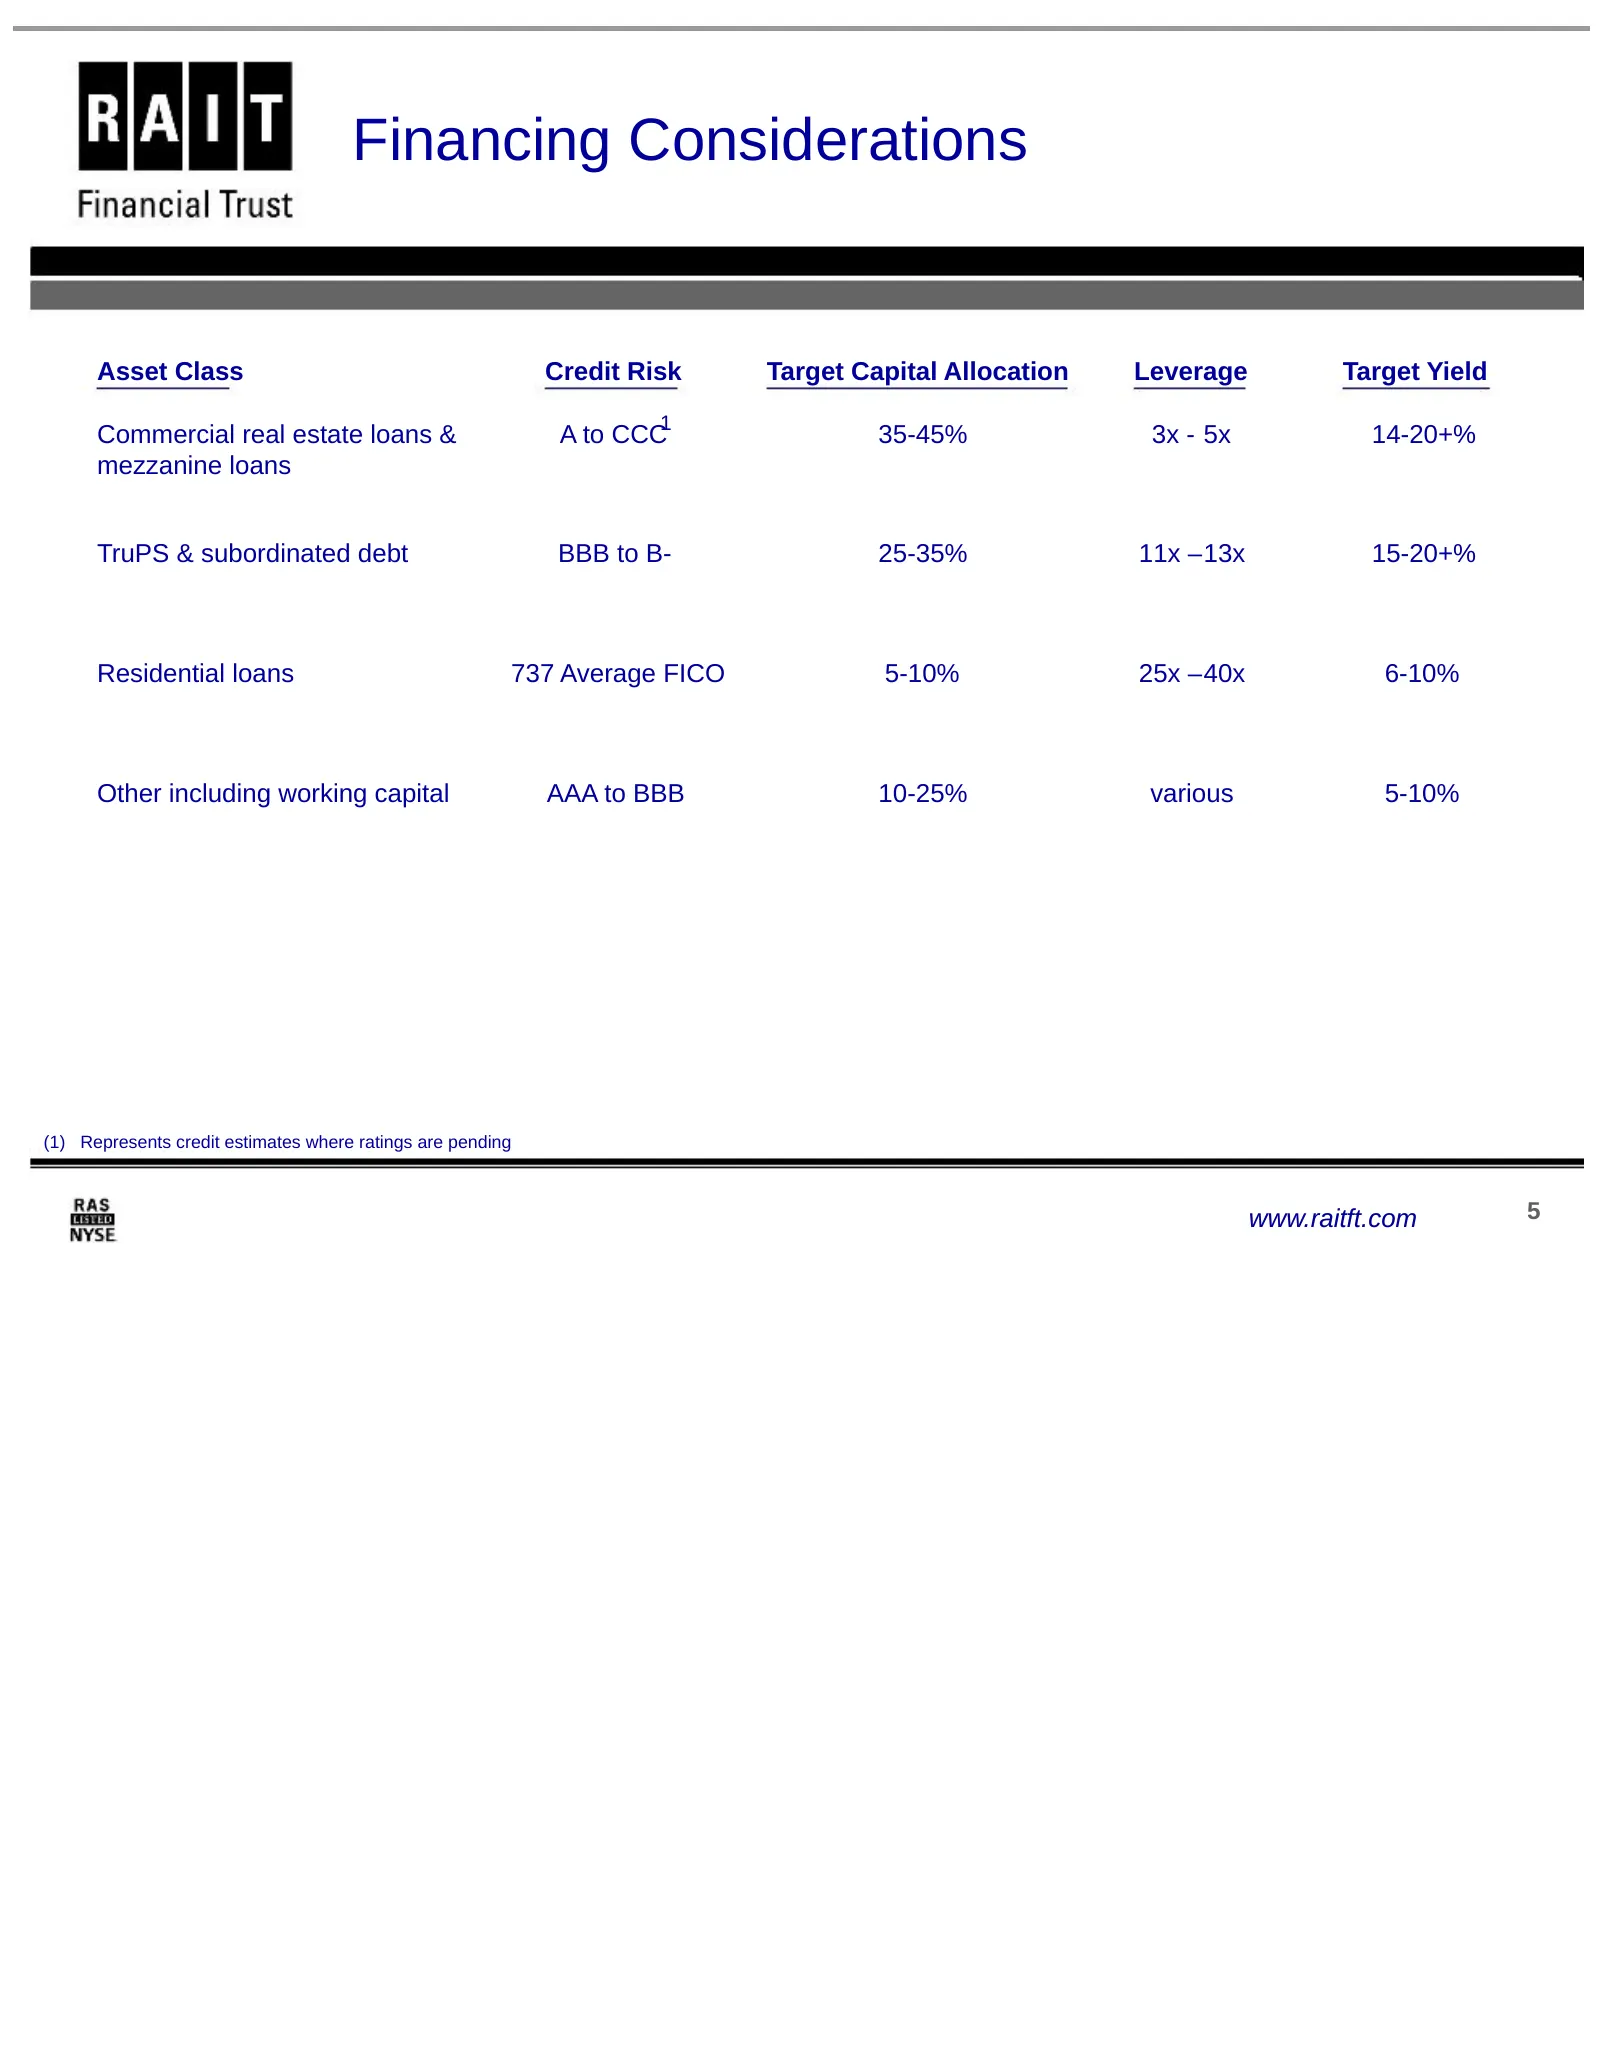
Financing Considerations Asset Class Credit Risk Target Capital Allocation Leverage Target Yield Commercial real estate loans & A to CCC1 35-45% 3x - 5x 14-20+% mezzanine loans TruPS & subordinated debt BBB to B- 25-35% 11x –13x 15-20+% Residential loans 737 Average FICO 5-10% 25x –40x 6-10% Other i
Slide 6: Commercial Mortgage Loans and Mezzanine Lending Programs – Secured Lending
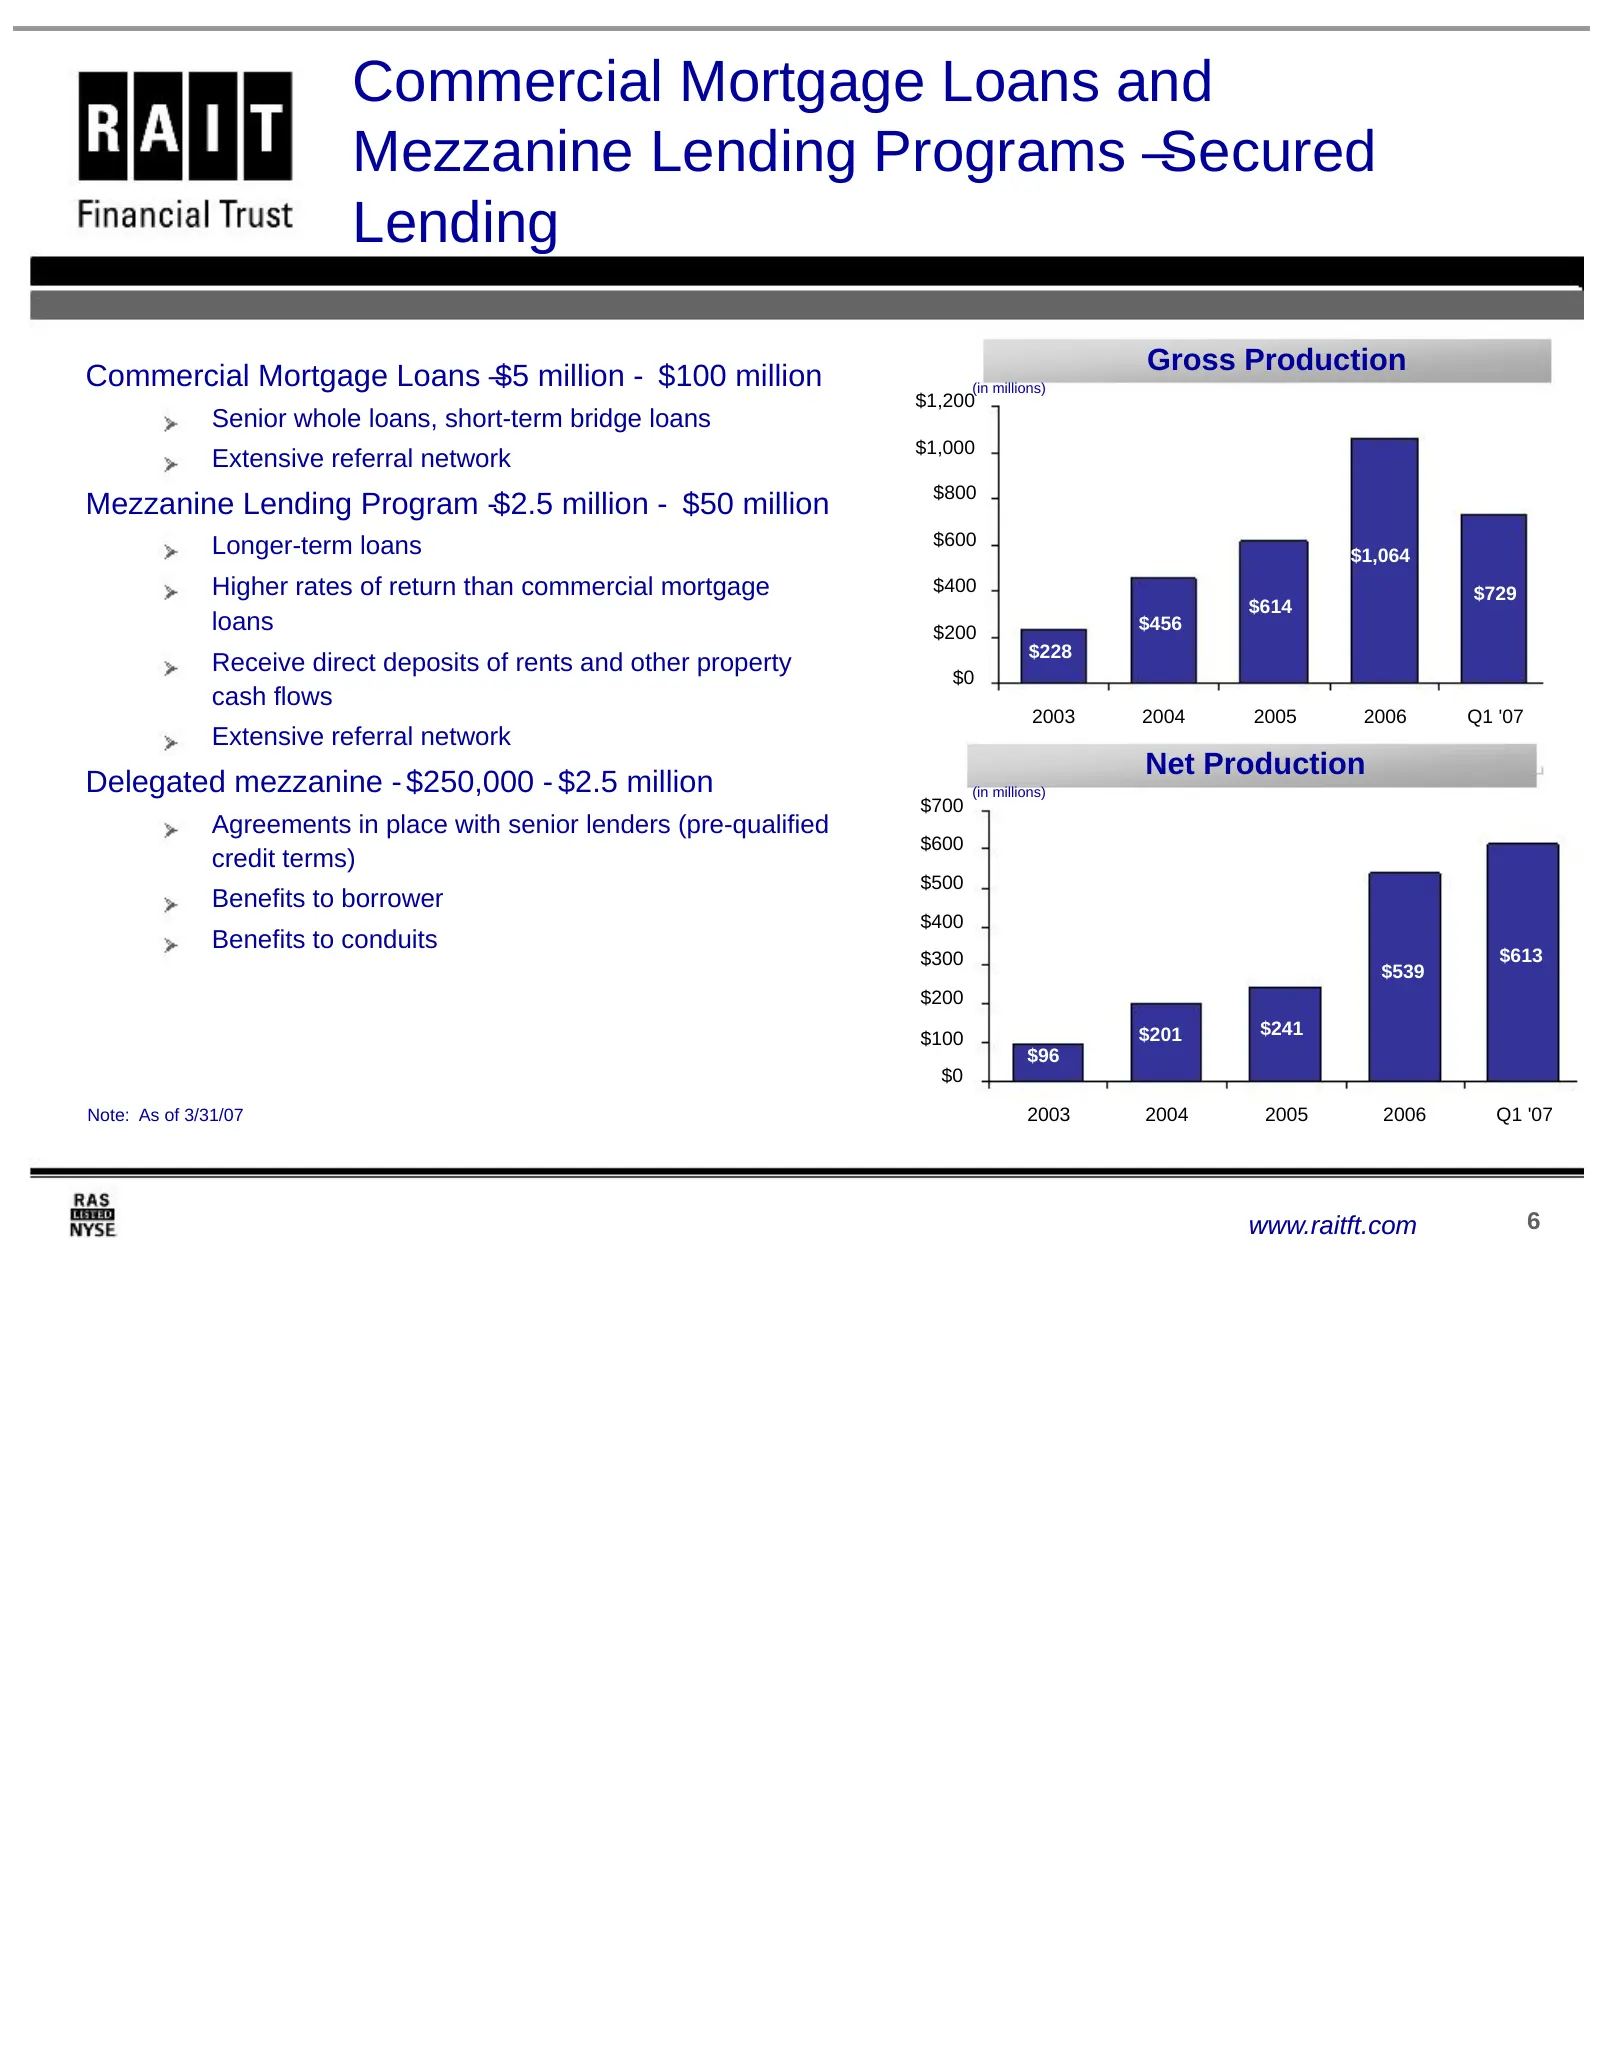
Commercial Mortgage Loans and Mezzanine Lending Programs –Secured Lending Gross Production Commercial Mortgage Loans –$5 million - $100 million (in millions) $1,200 Senior whole loans, short-term bridge loans $1,000 Extensive referral network $800 Mezzanine Lending Program -$2.5 million - $50 millio
Slide 7: Commercial Loan Portfolio
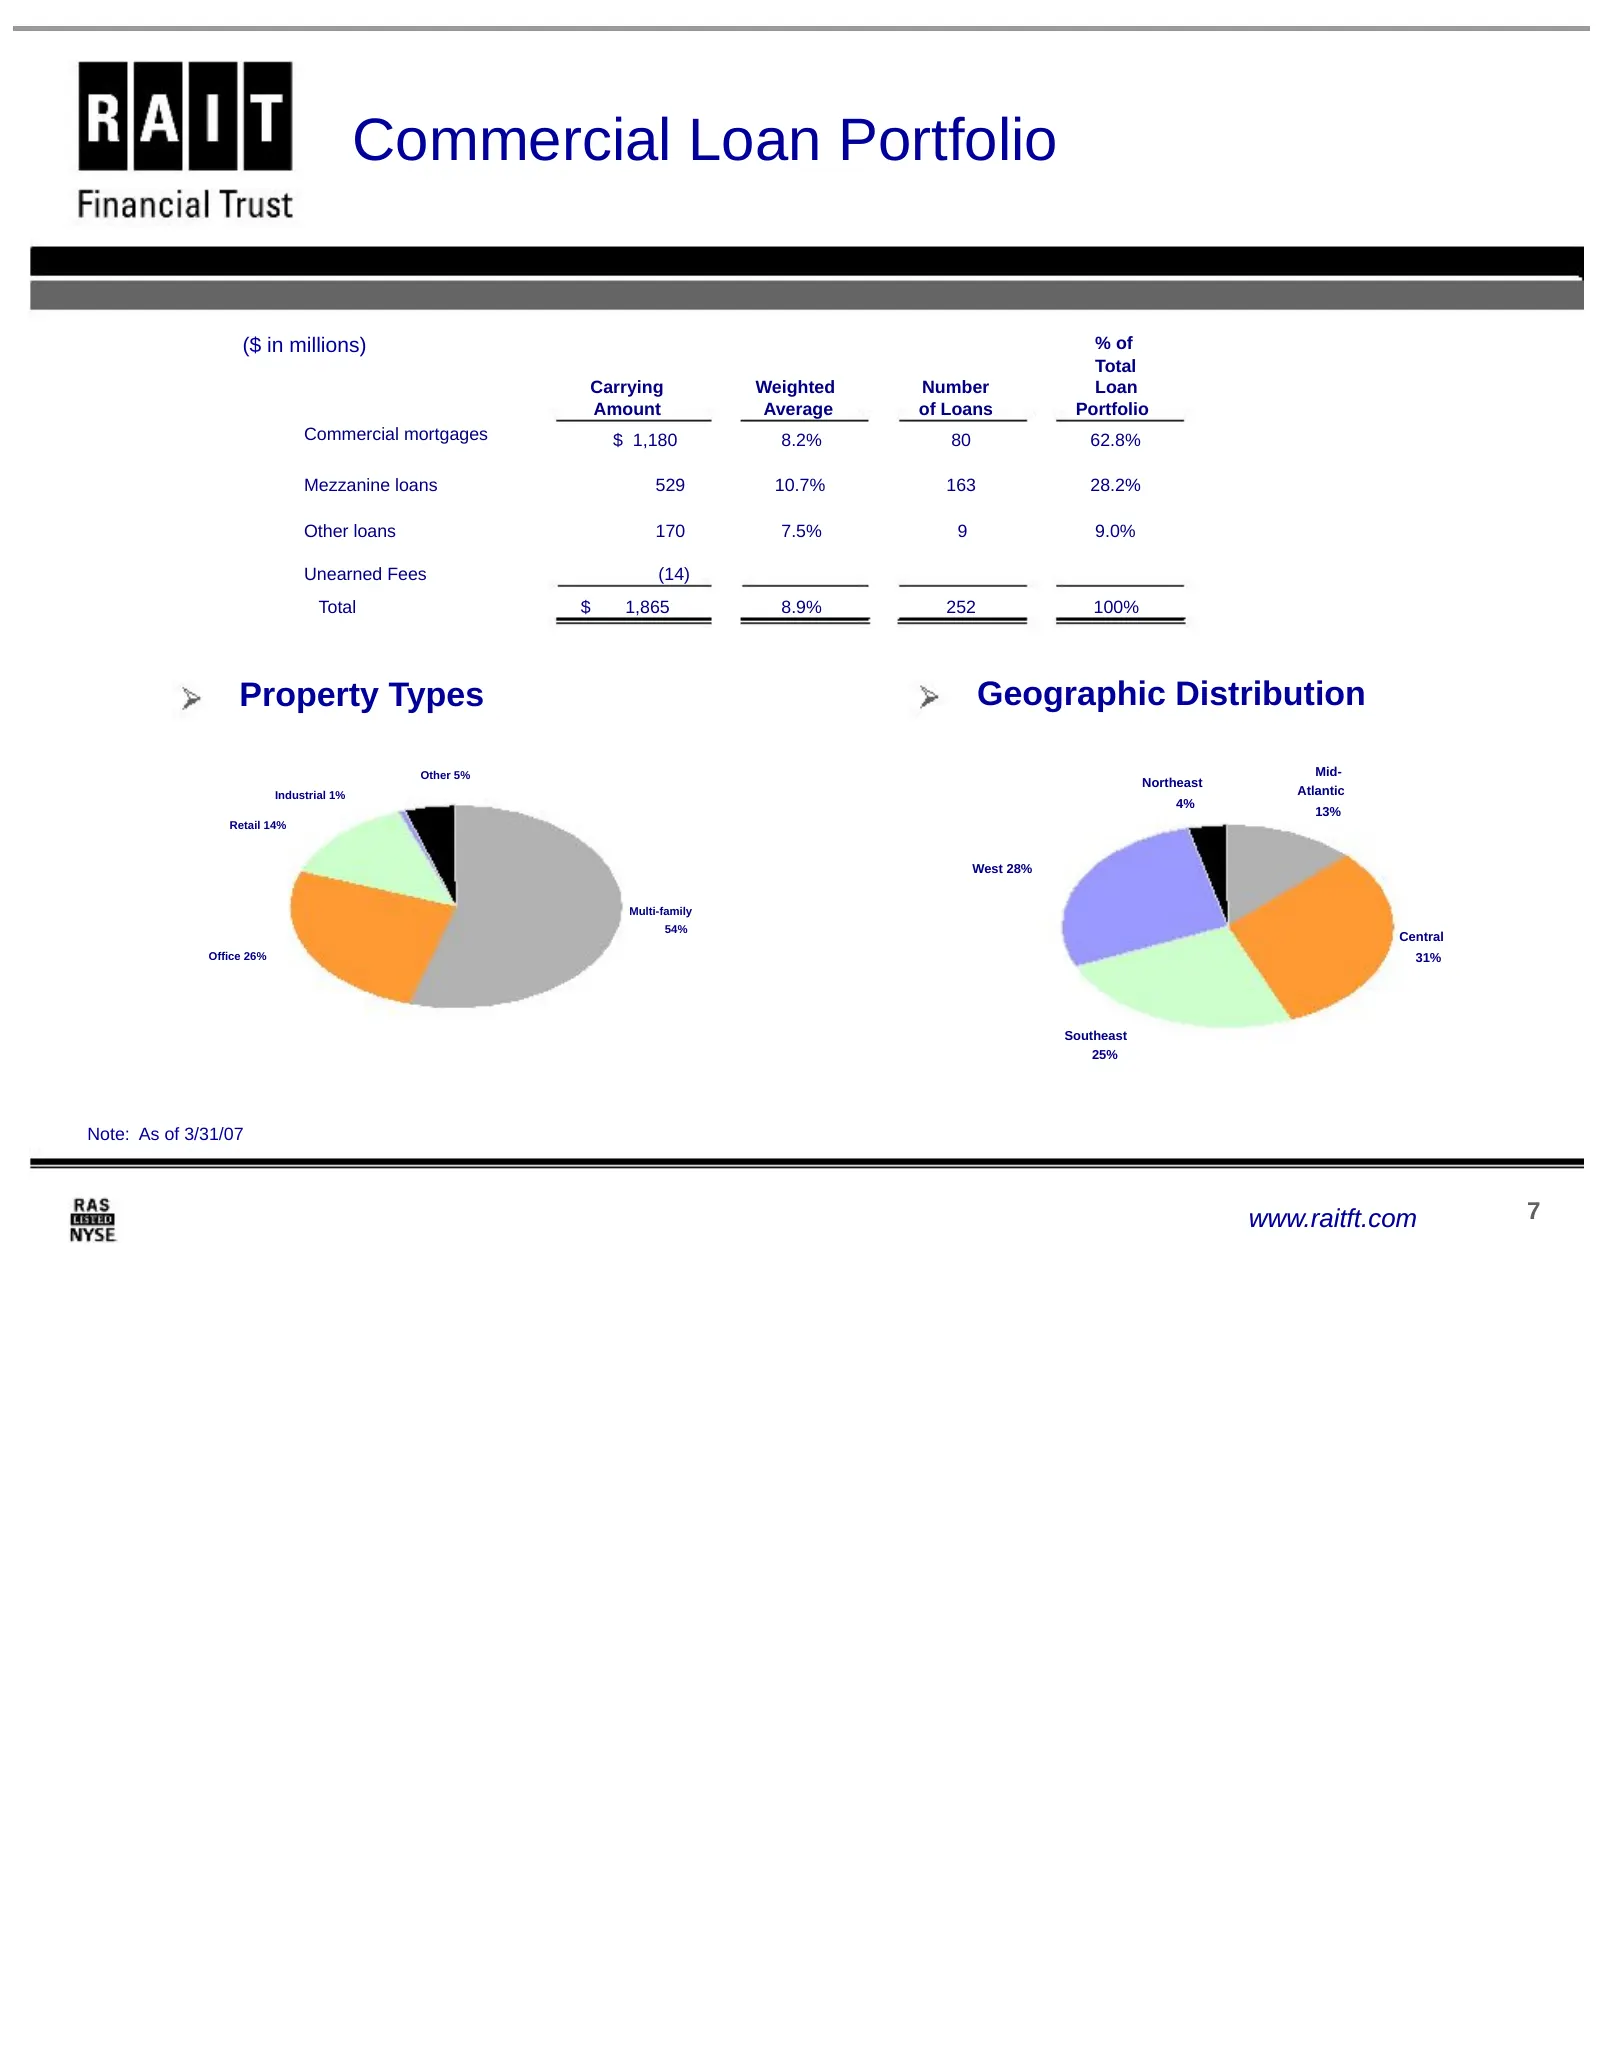
Commercial Loan Portfolio ($ in millions) % of Total Carrying Weighted Number Loan Amount Average of Loans Portfolio Commercial mortgages $ 1,180 8.2% 80 62.8% Mezzanine loans 529 10.7% 163 28.2% Other loans 170 7.5% 9 9.0% Unearned Fees (14) Total $ 1,865 8.9% 252 100% Property Types Geographic Dis
Slide 8: TruPS & Subordinated Debt
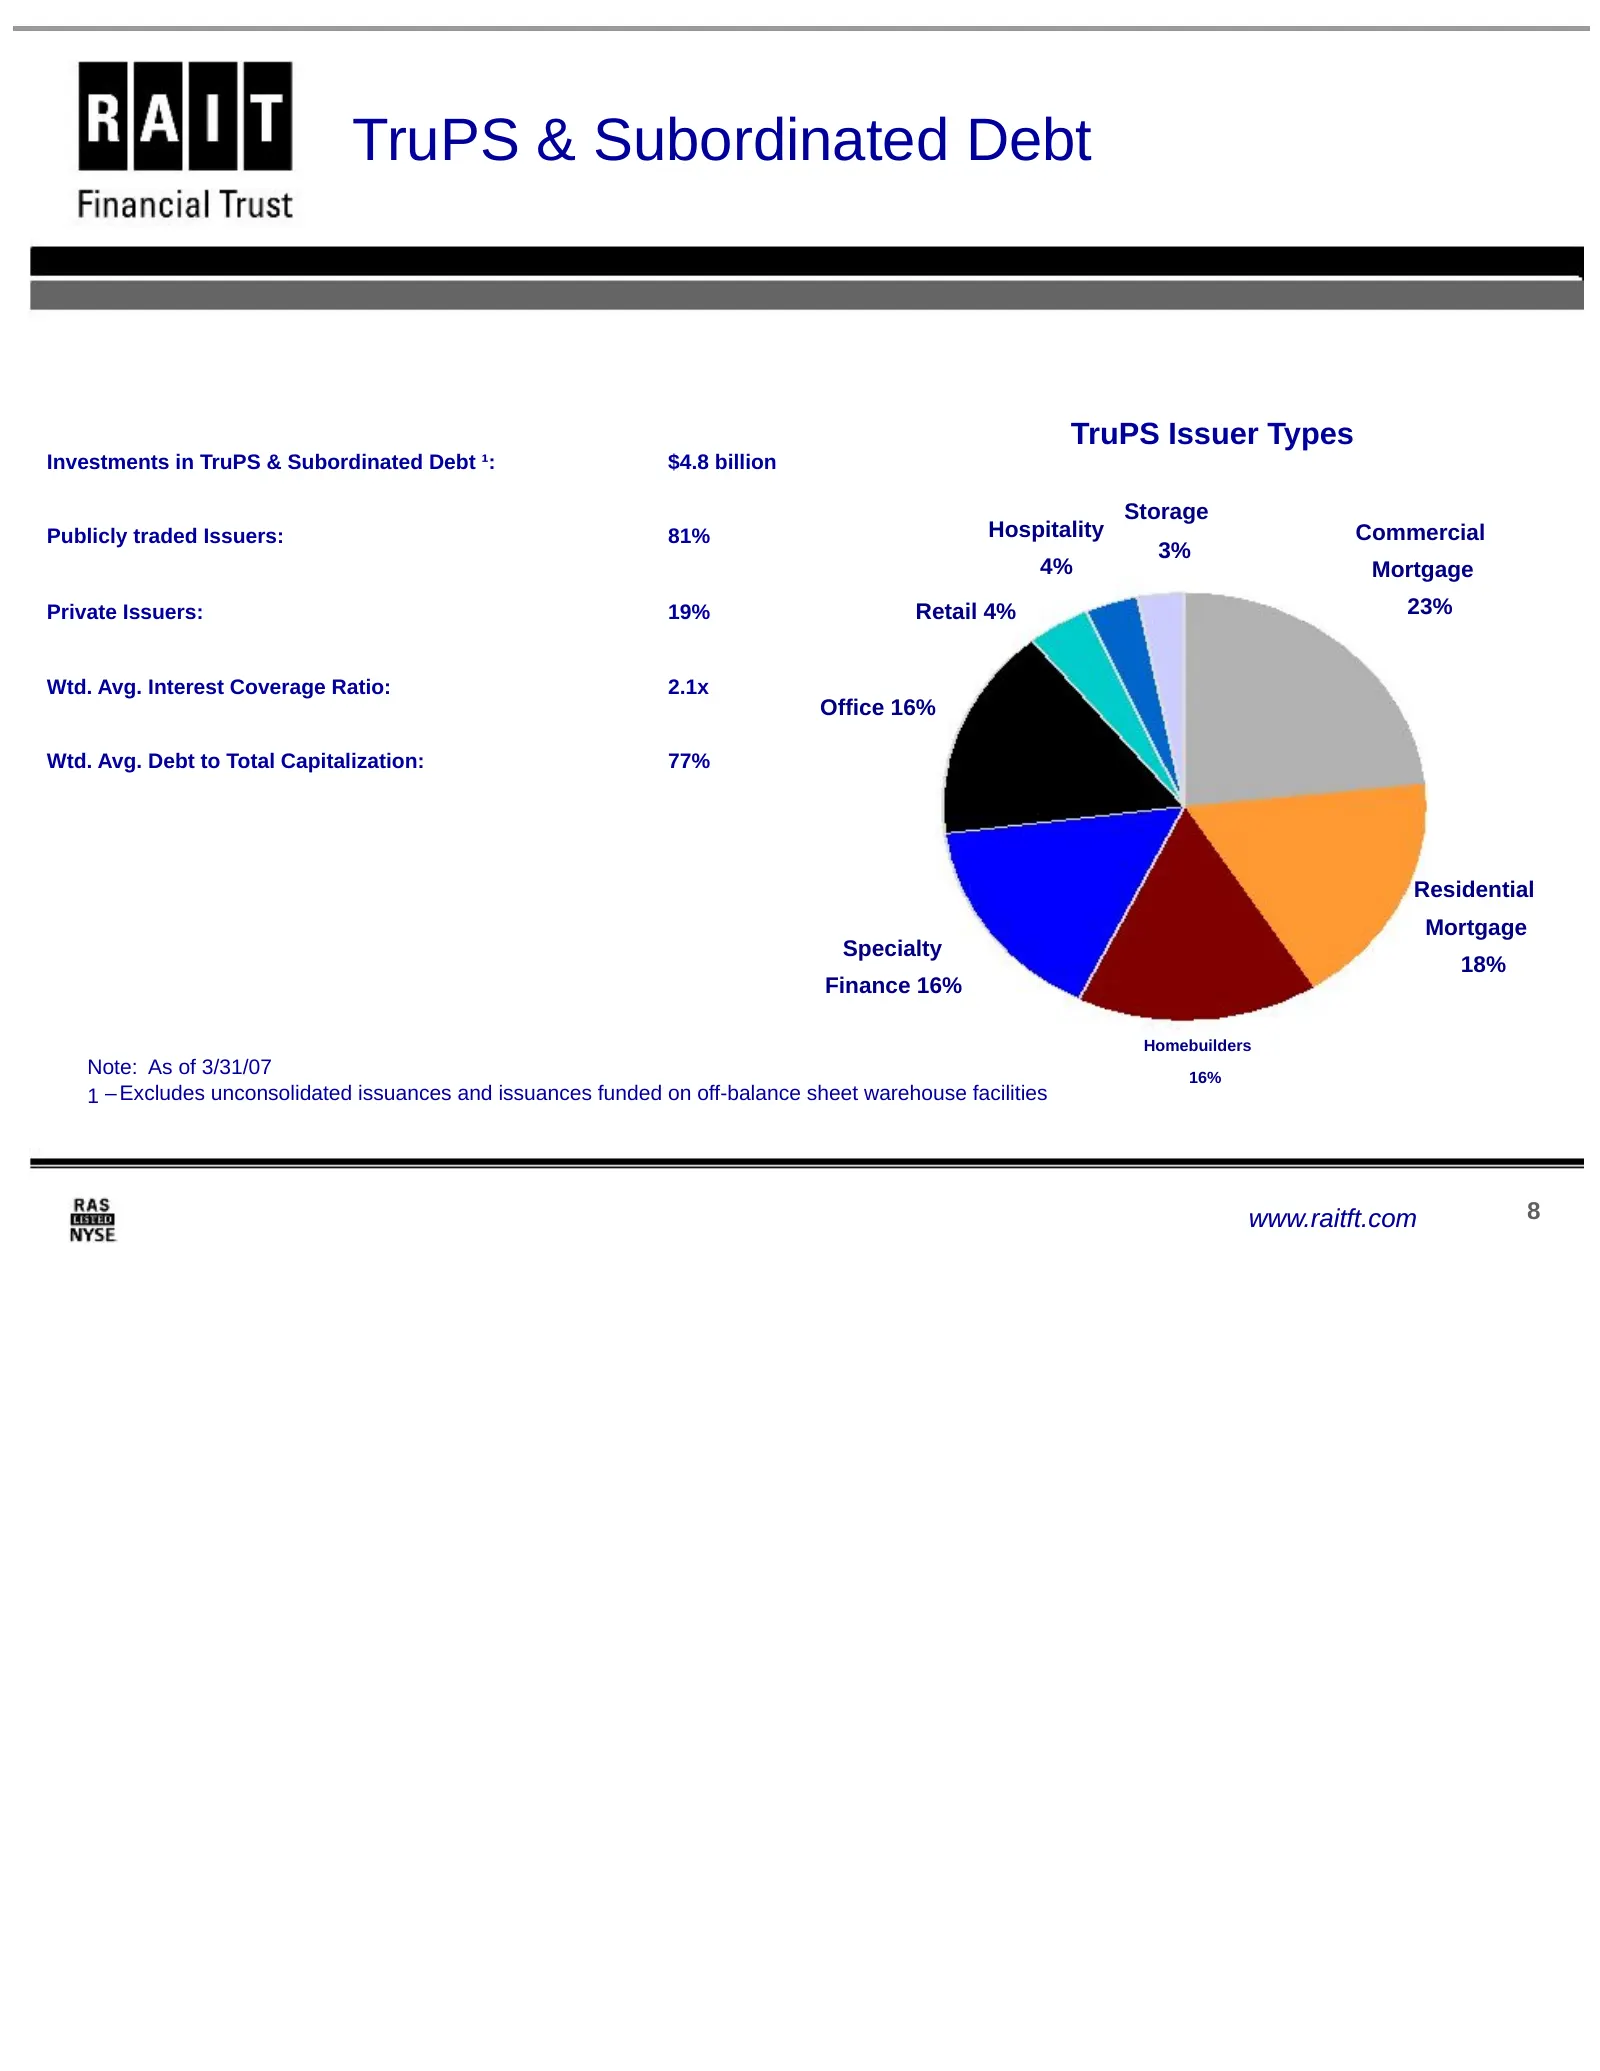
TruPS & Subordinated Debt TruPS Issuer Types Investments in TruPS & Subordinated Debt ¹: $4.8 billion Storage Publicly traded Issuers: 81% Hospitality Commercial 3% 4% Mortgage Private Issuers: 19% Retail 4% 23% Wtd. Avg. Interest Coverage Ratio: 2.1x Office 16% Wtd. Avg. Debt to Total Capitalizatio
Slide 9: Residential Mortgage Loan Portfolio
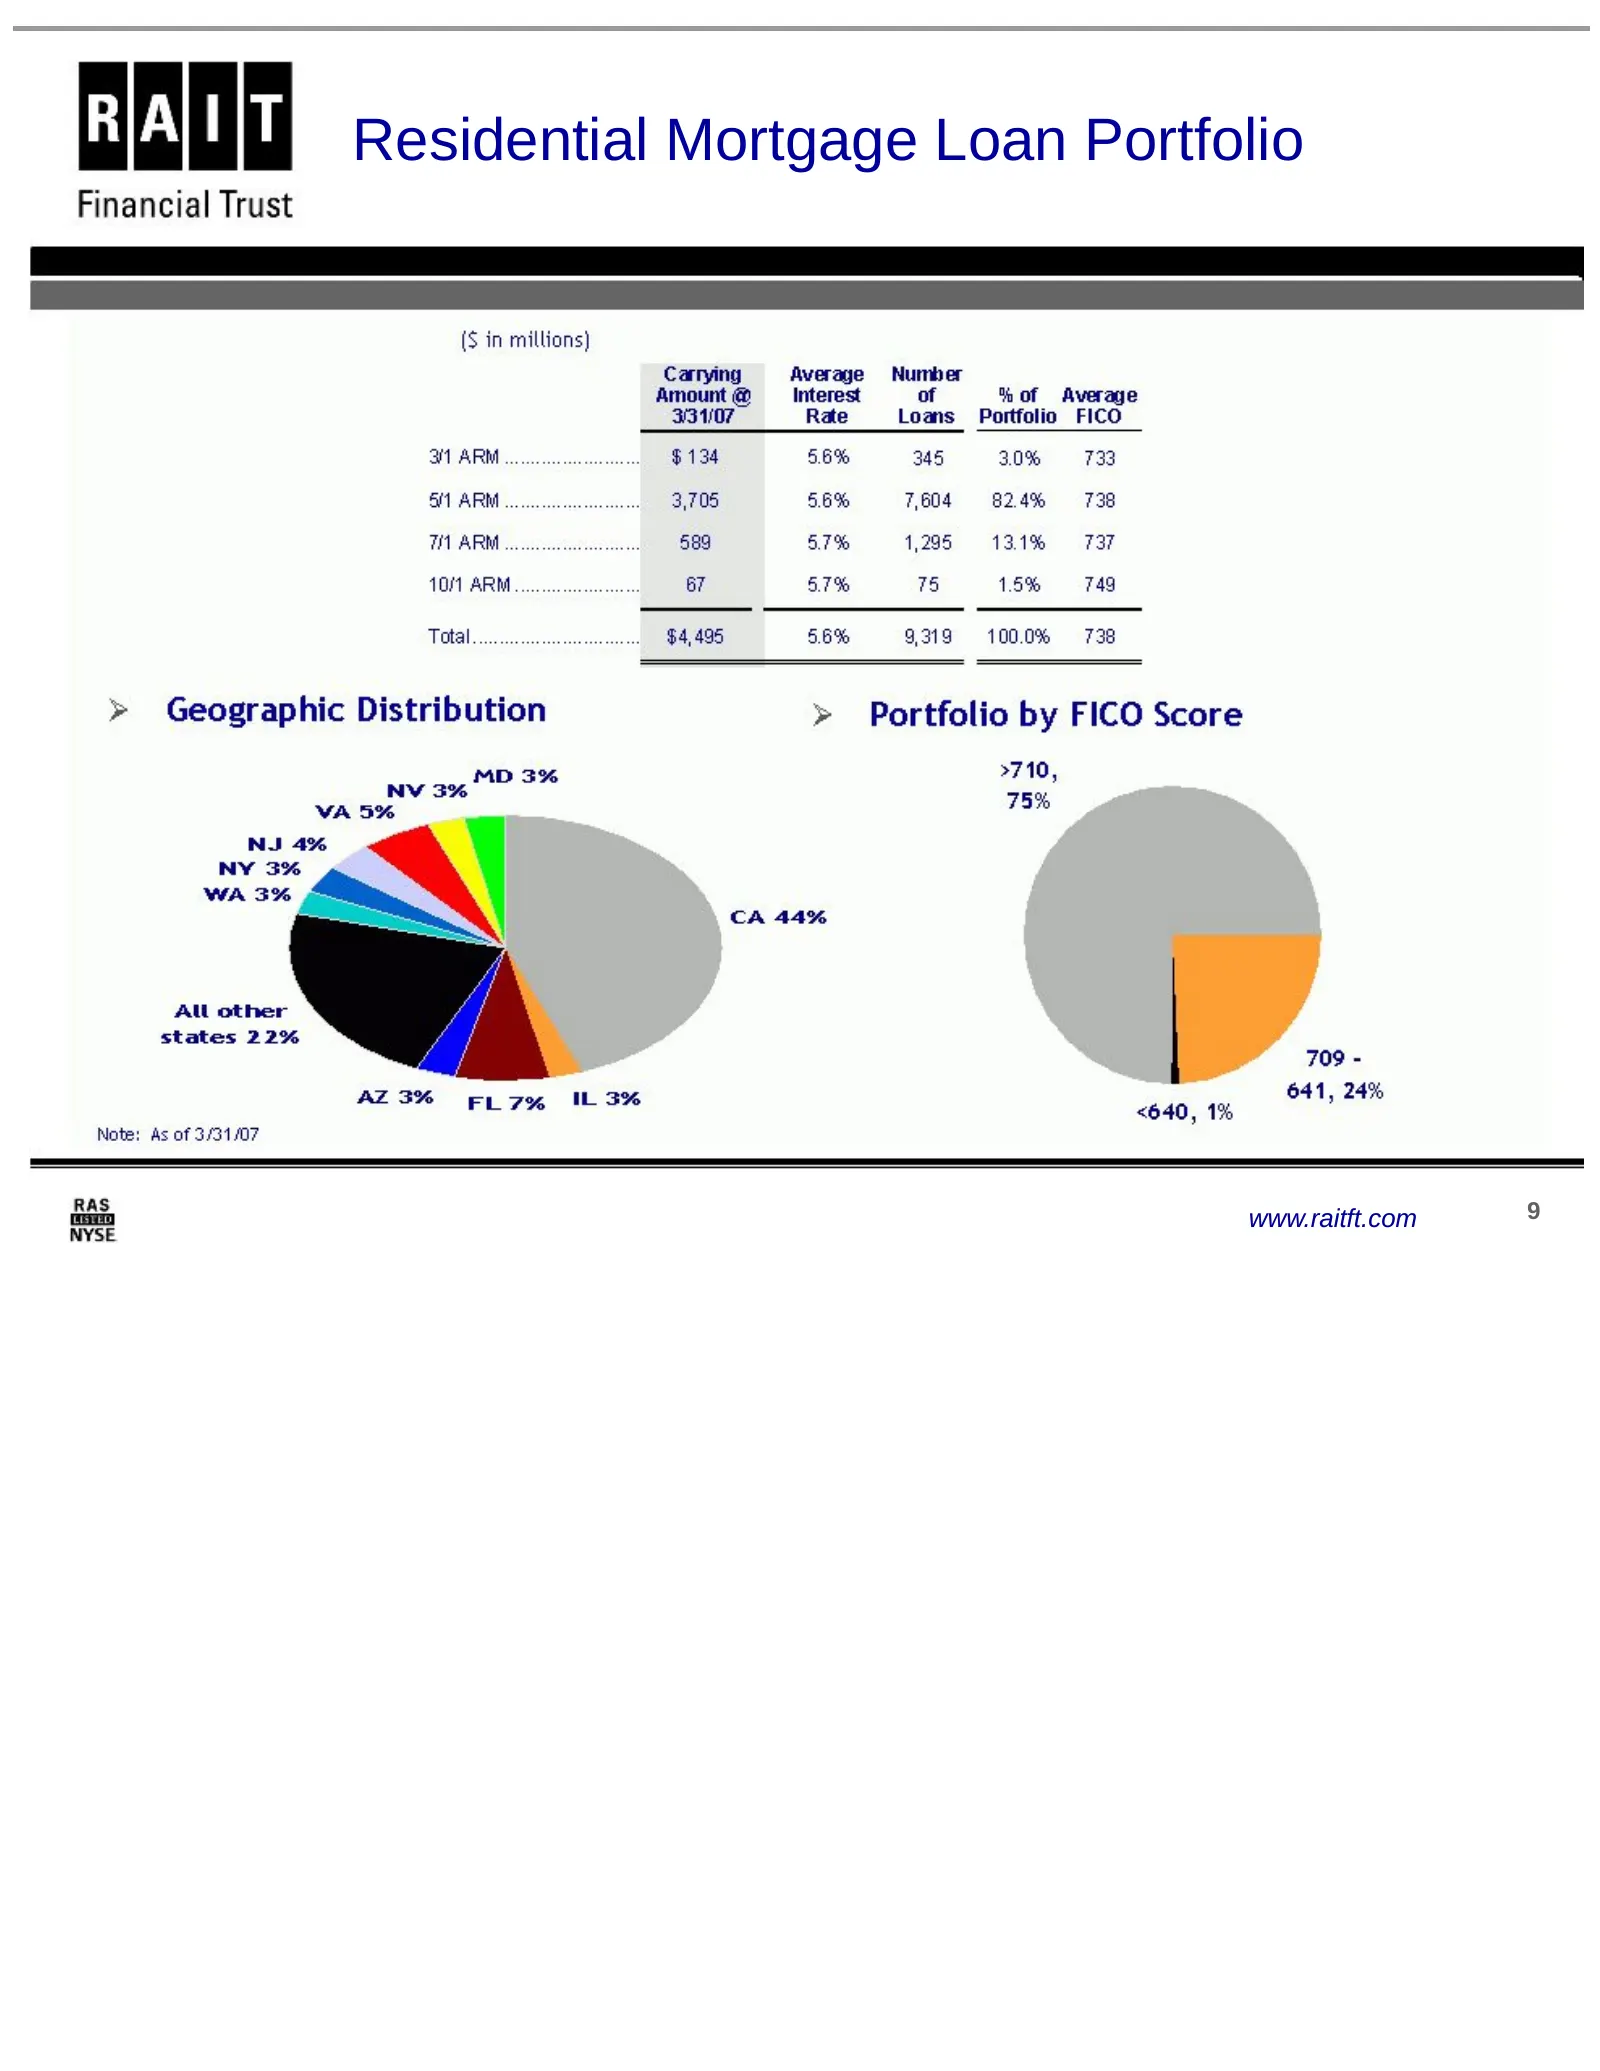
Residential Mortgage Loan Portfolio www.raitft.com 9
Slide 10: Mortgage-Backed Securities & Other Real Estate Related Debt Securities
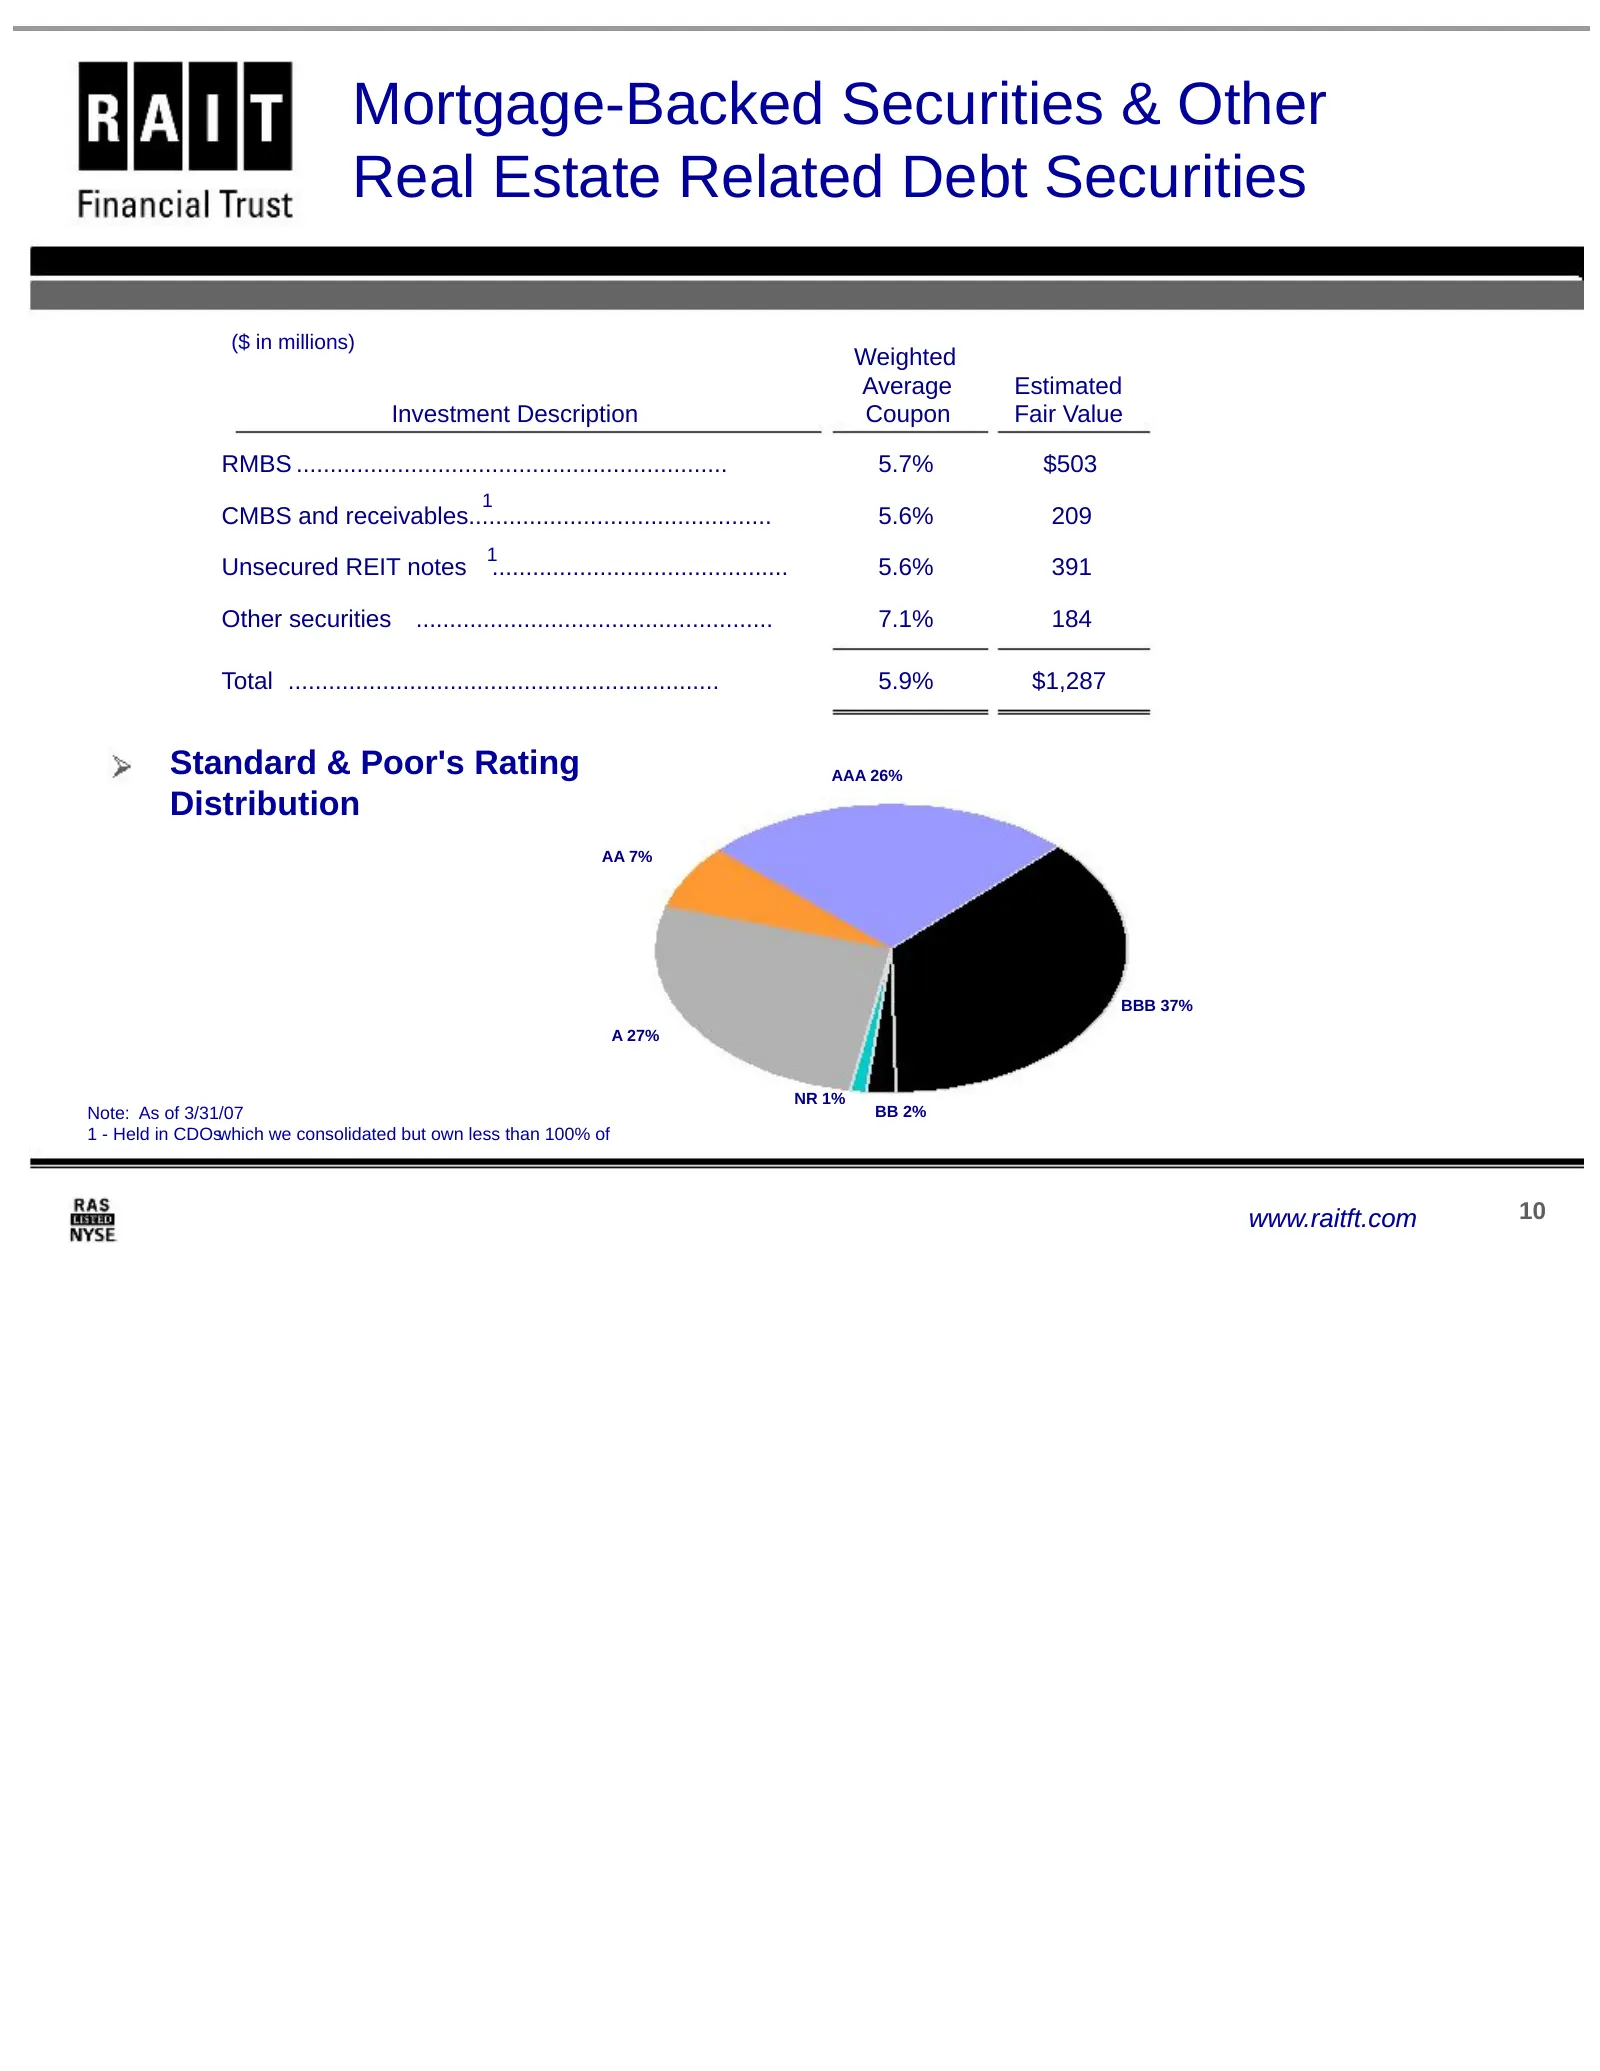
Mortgage-Backed Securities & Other Real Estate Related Debt Securities ($ in millions) Weighted Average Estimated Investment Description Coupon Fair Value RMBS ................................................................ 5.7% $503 1 CMBS and receivables...........................................
Slide 11: Portfolio Diversification: Investment Summary
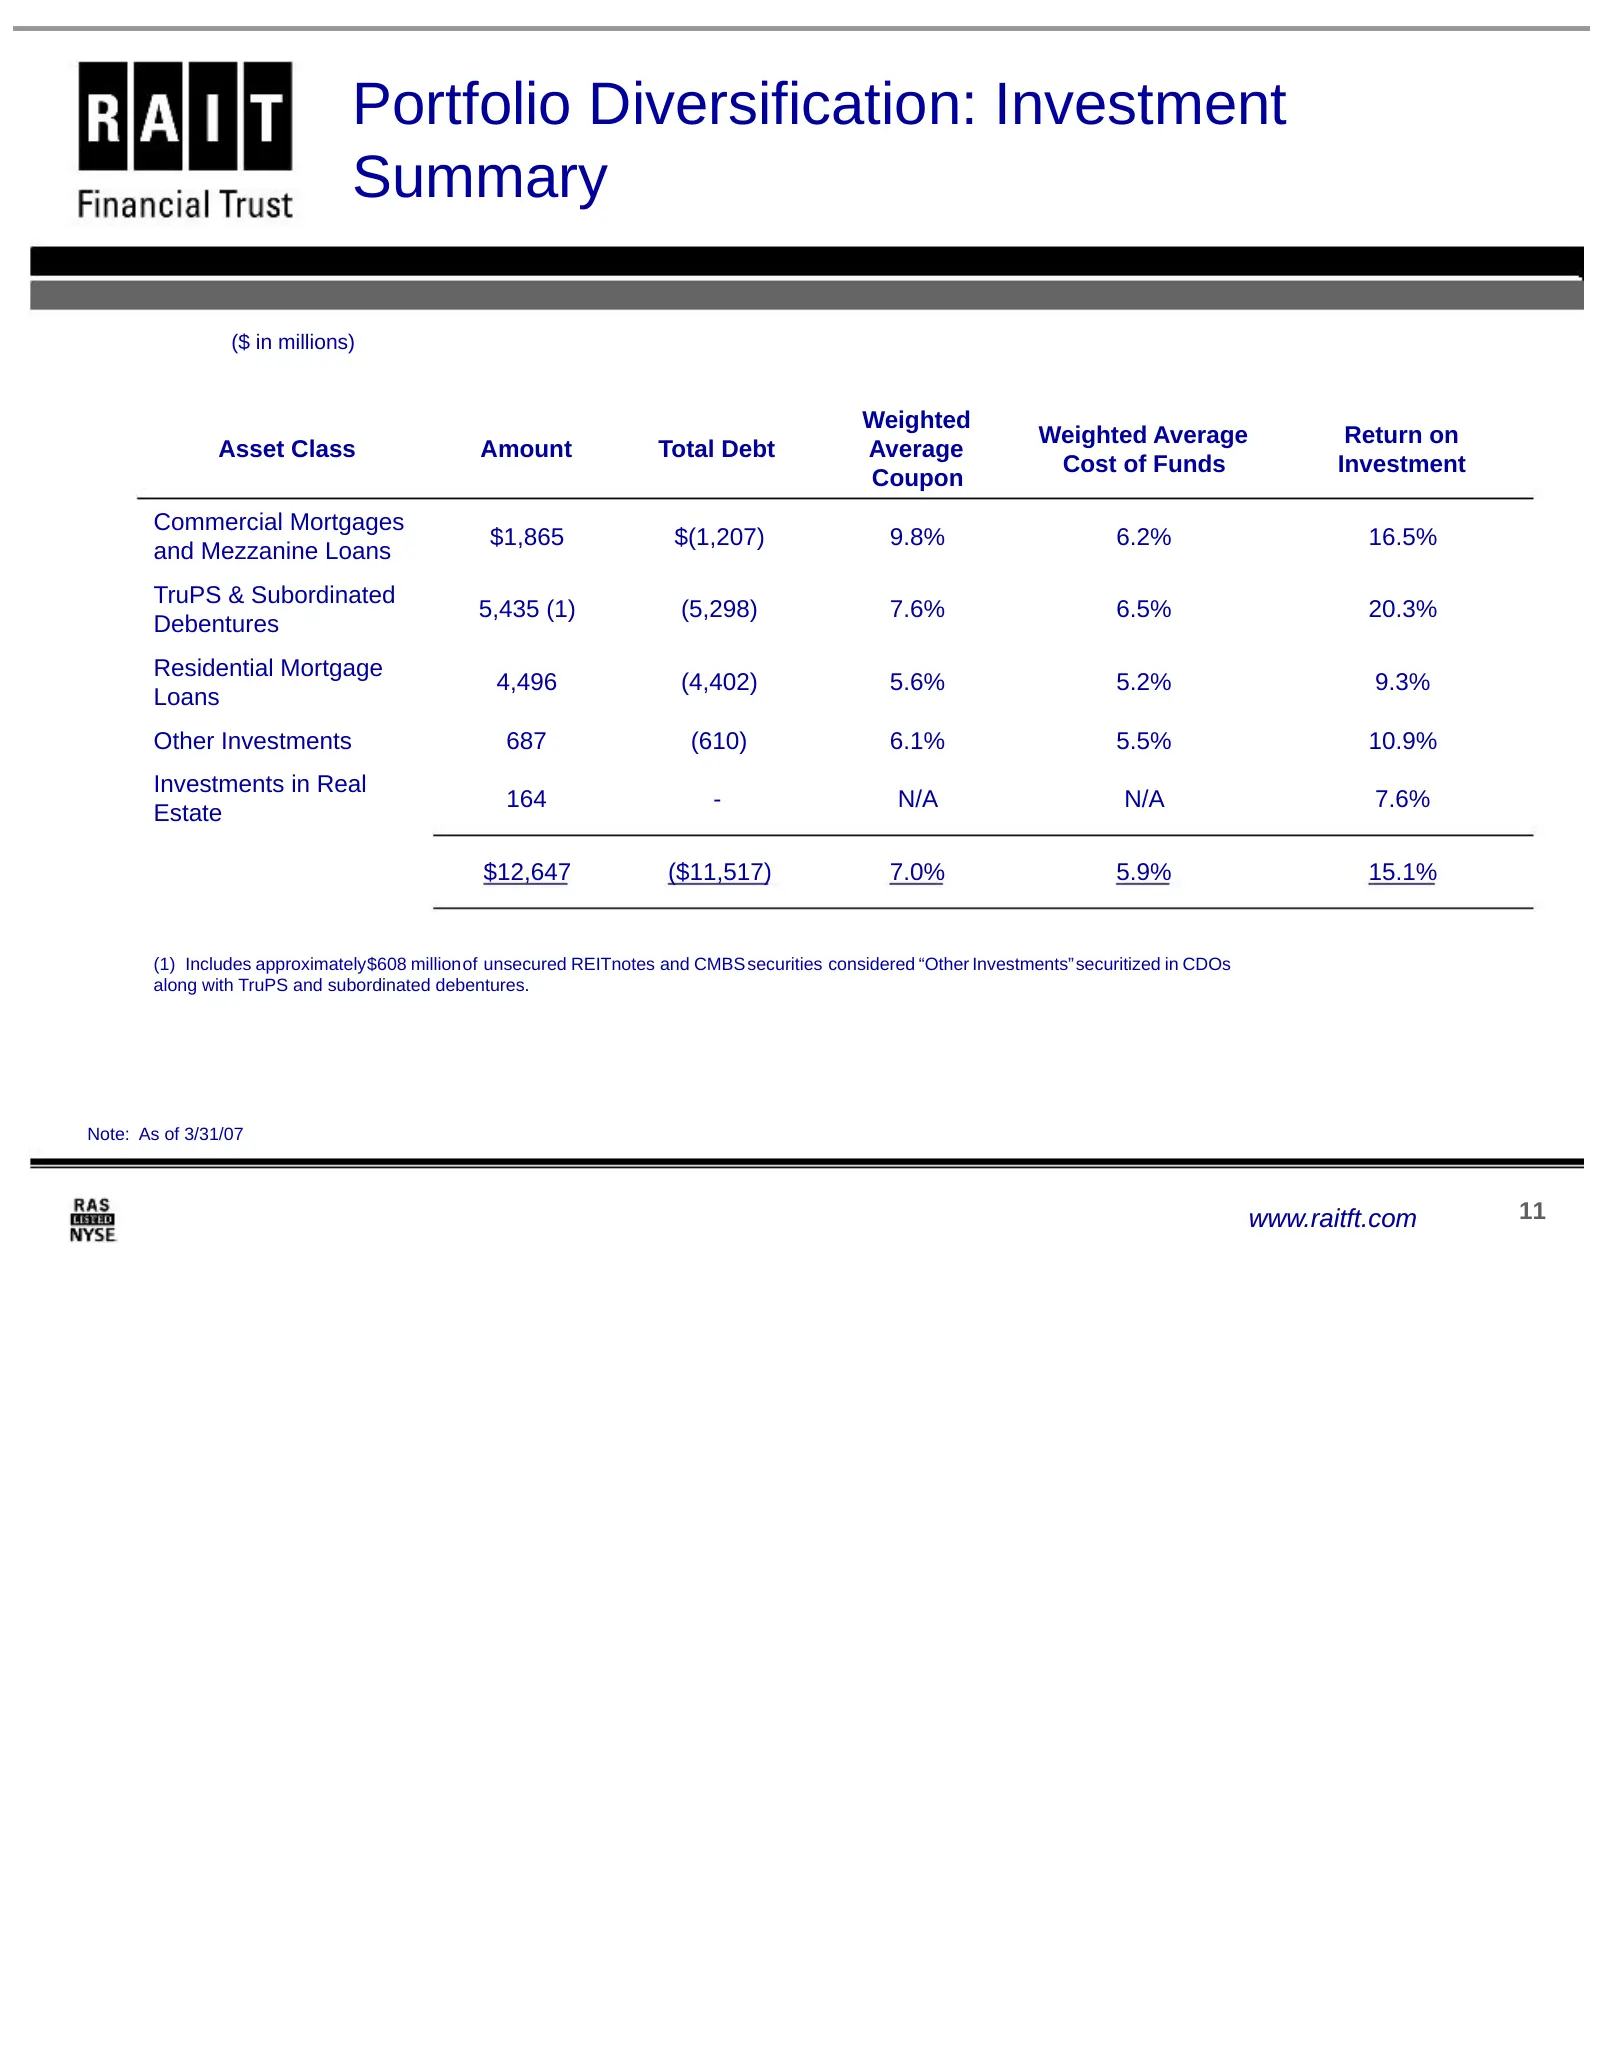
Portfolio Diversification: Investment Summary ($ in millions) Weighted Weighted Average Return on Asset Class Amount Total Debt Average Cost of Funds Investment Coupon Commercial Mortgages $1,865 $(1,207) 9.8% 6.2% 16.5% and Mezzanine Loans TruPS & Subordinated 5,435 (1) (5,298) 7.6% 6.5% 20.3% Debe
Slide 12: Dividend History
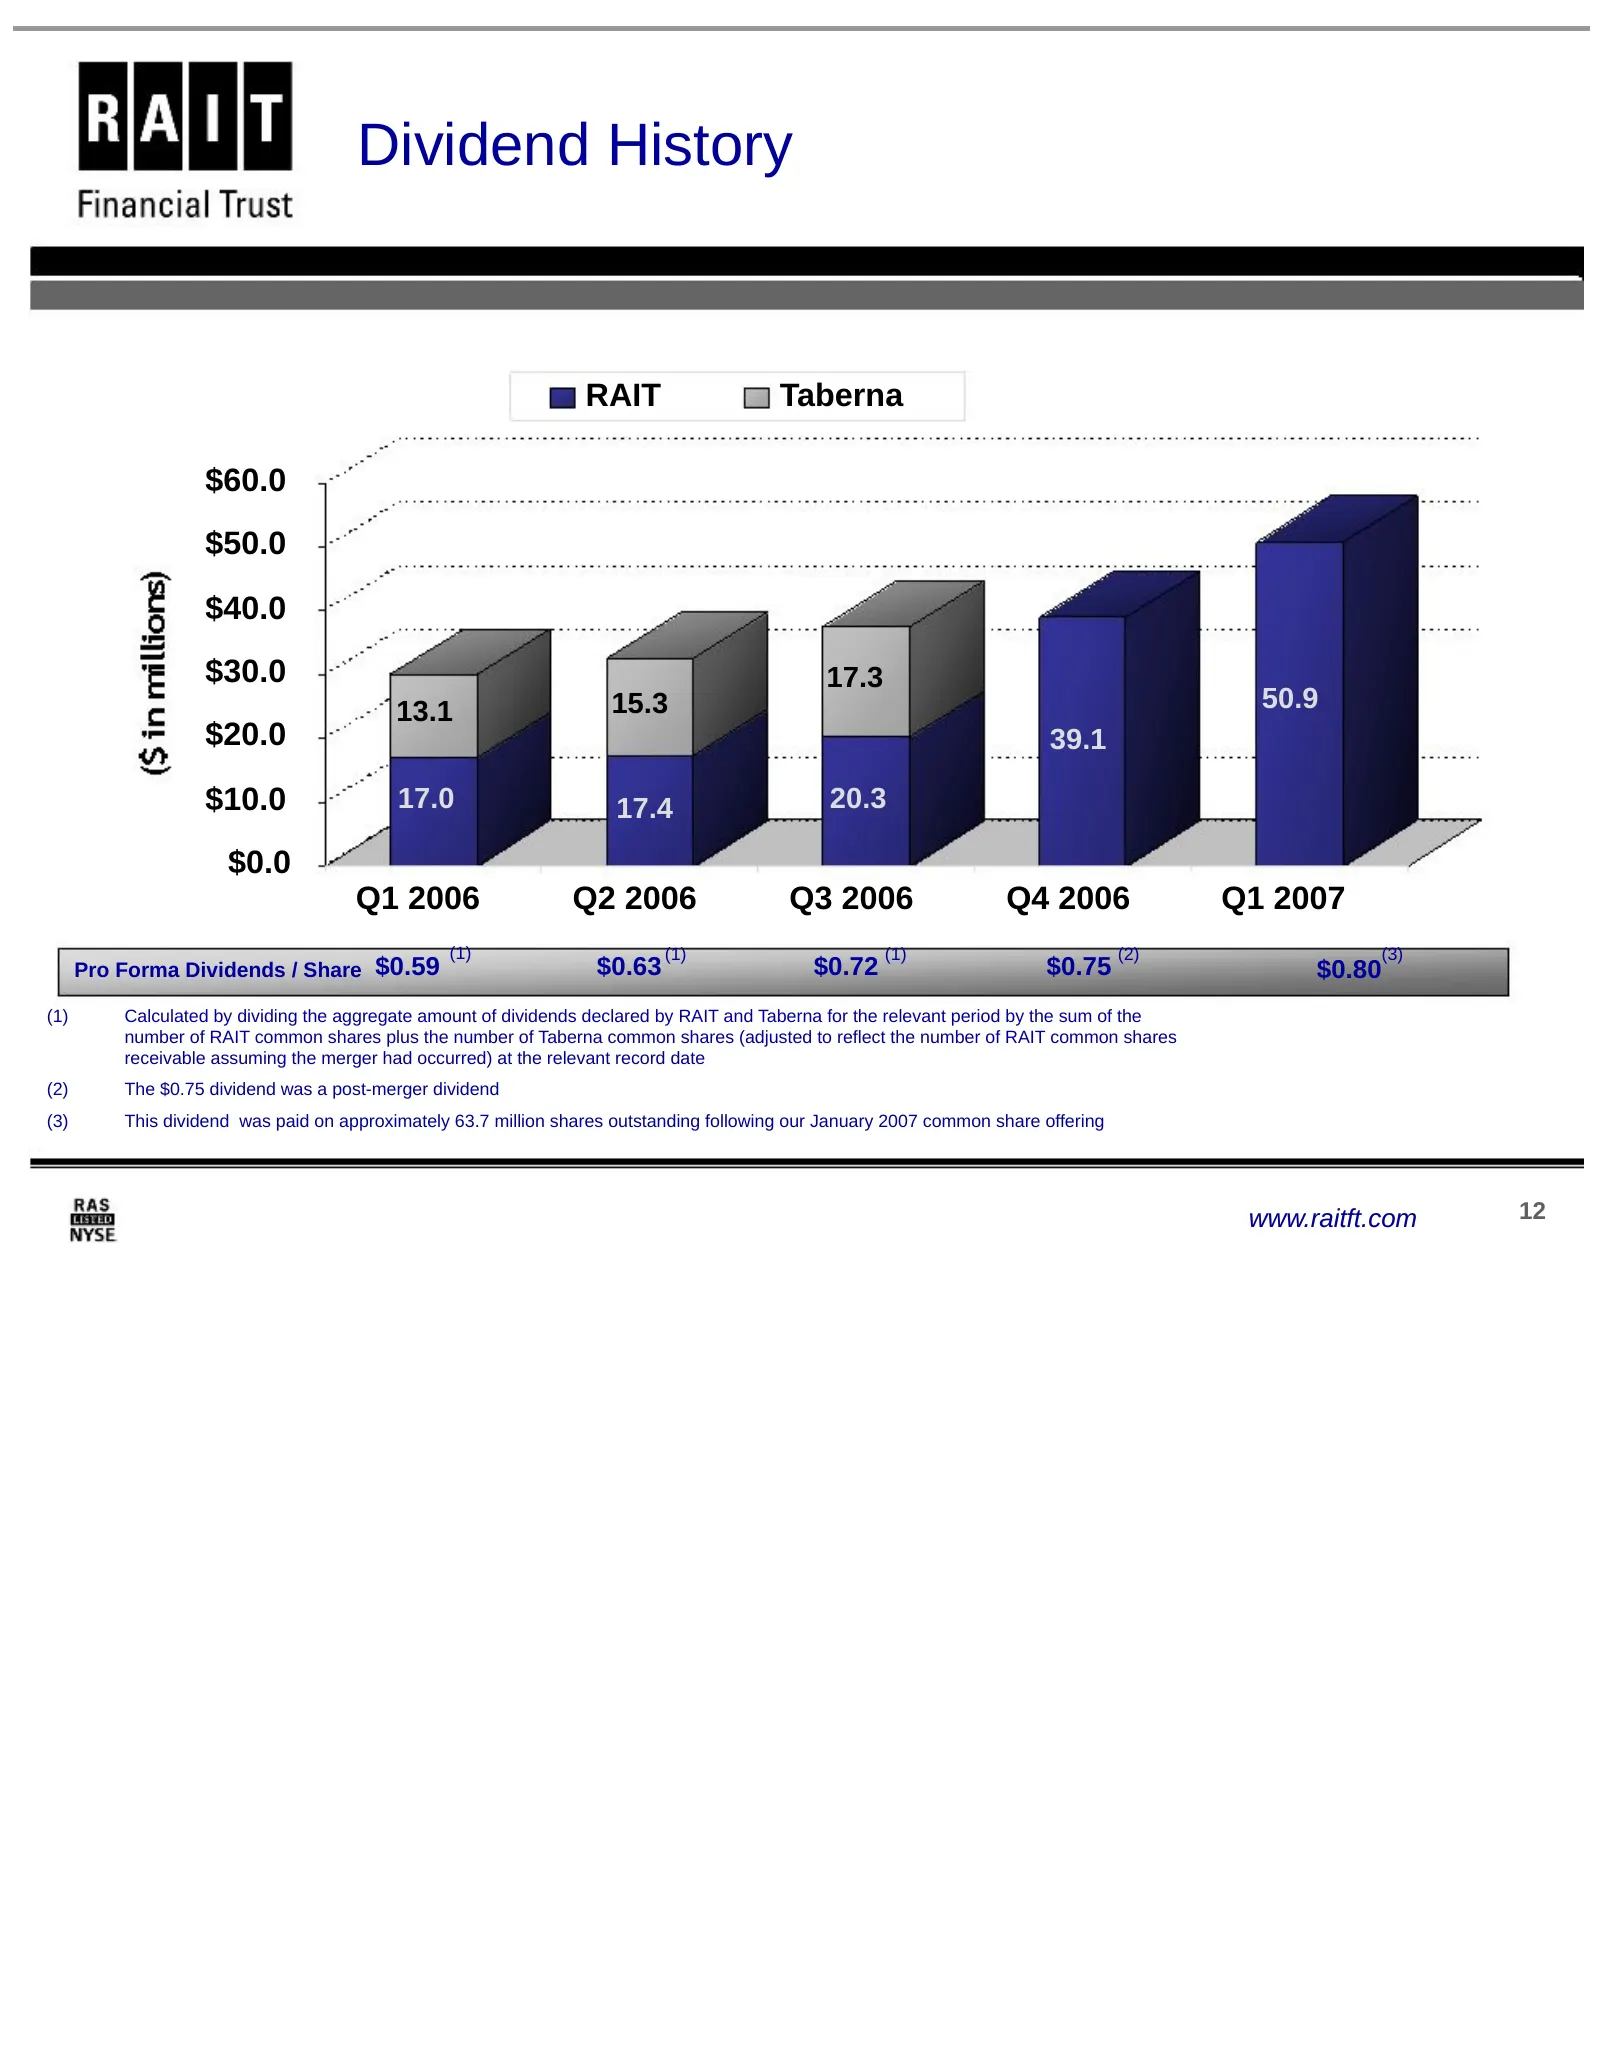
Dividend History RAIT Taberna $60.0 $50.0 $40.0 $30.0 17.3 13.1 15.3 50.9 $20.0 39.1 $10.0 17.0 17.4 20.3 $0.0 Q1 2006 Q2 2006 Q3 2006 Q4 2006 Q1 2007 (1) (1) (1) (2) (3) Pro Forma Dividends / Share $0.59 $0.63 $0.72 $0.75 $0.80 (1) Calculated by dividing the aggregate amount of dividends declared b
Slide 13: Selected Financial Data
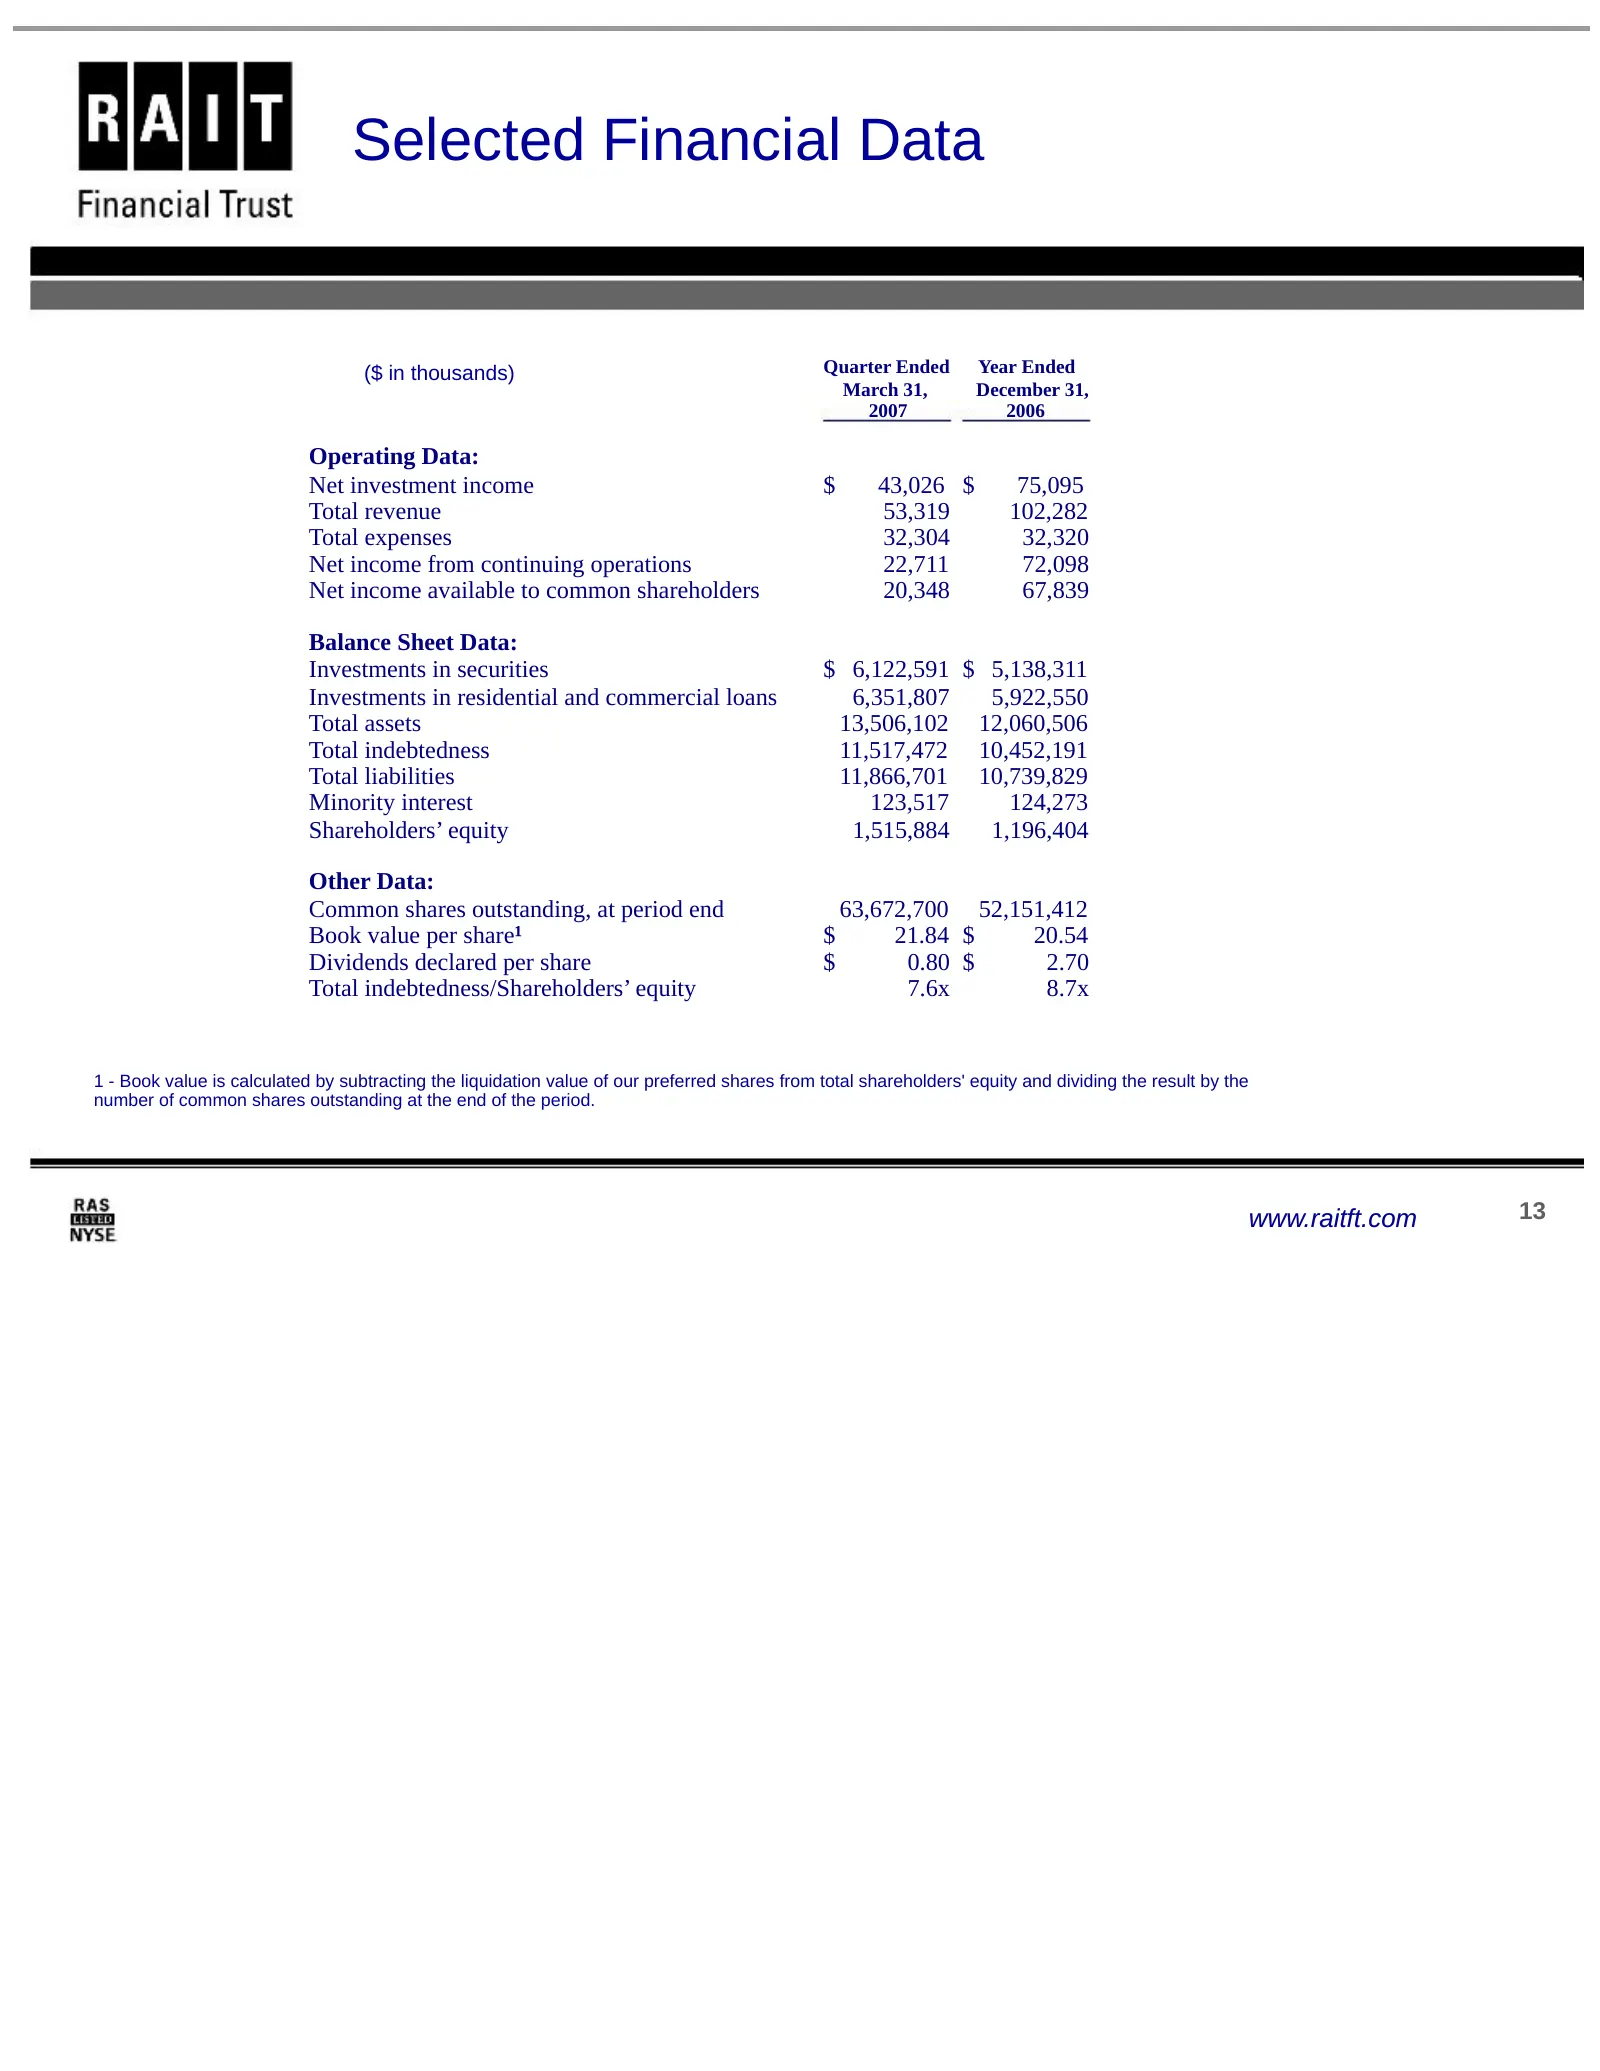
Selected Financial Data ($ in thousands) Quarter Ended Year Ended March 31, December 31, 2007 2006 Operating Data: Net investment income $ 43,026 $ 75,095 Total revenue 53,319 102,282 Total expenses 32,304 32,320 Net income from continuing operations 22,711 72,098 Net income available to common shar
Slide 14: Adjusted Earnings
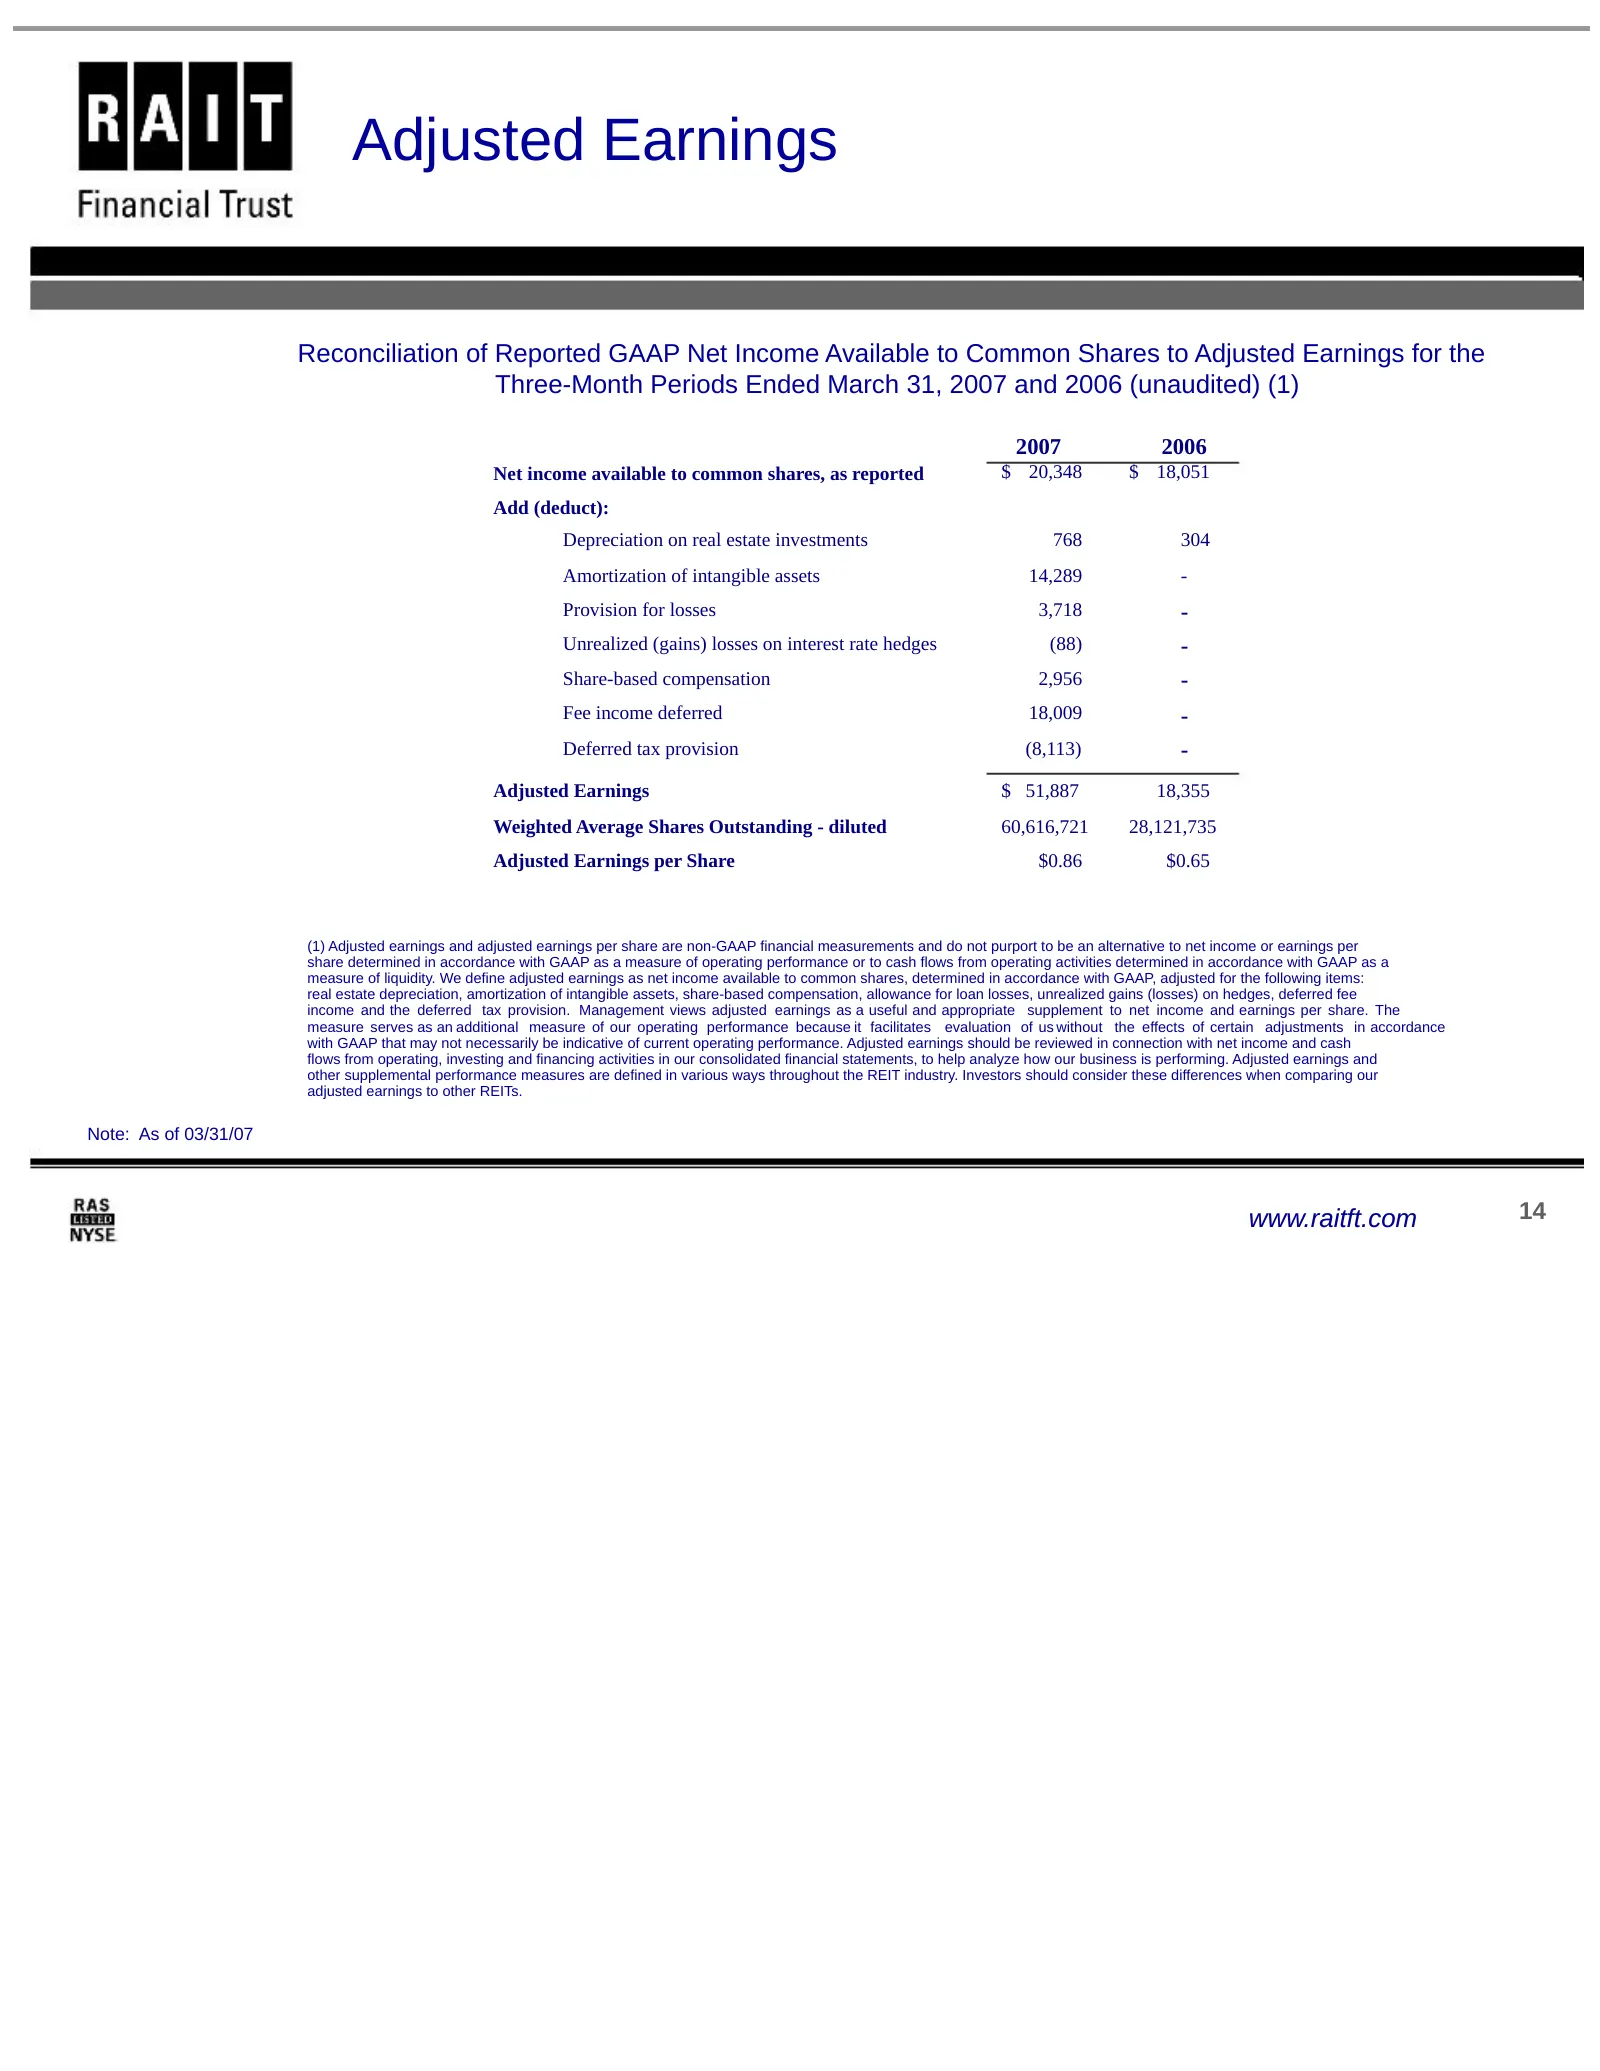
Adjusted Earnings Reconciliation of Reported GAAP Net Income Available to Common Shares to Adjusted Earnings for the Three-Month Periods Ended March 31, 2007 and 2006 (unaudited) (1) 2007 2006 Net income available to common shares, as reported $ 20,348 $ 18,051 Add (deduct): Depreciation on real est
Slide 15: Total Fees Generated
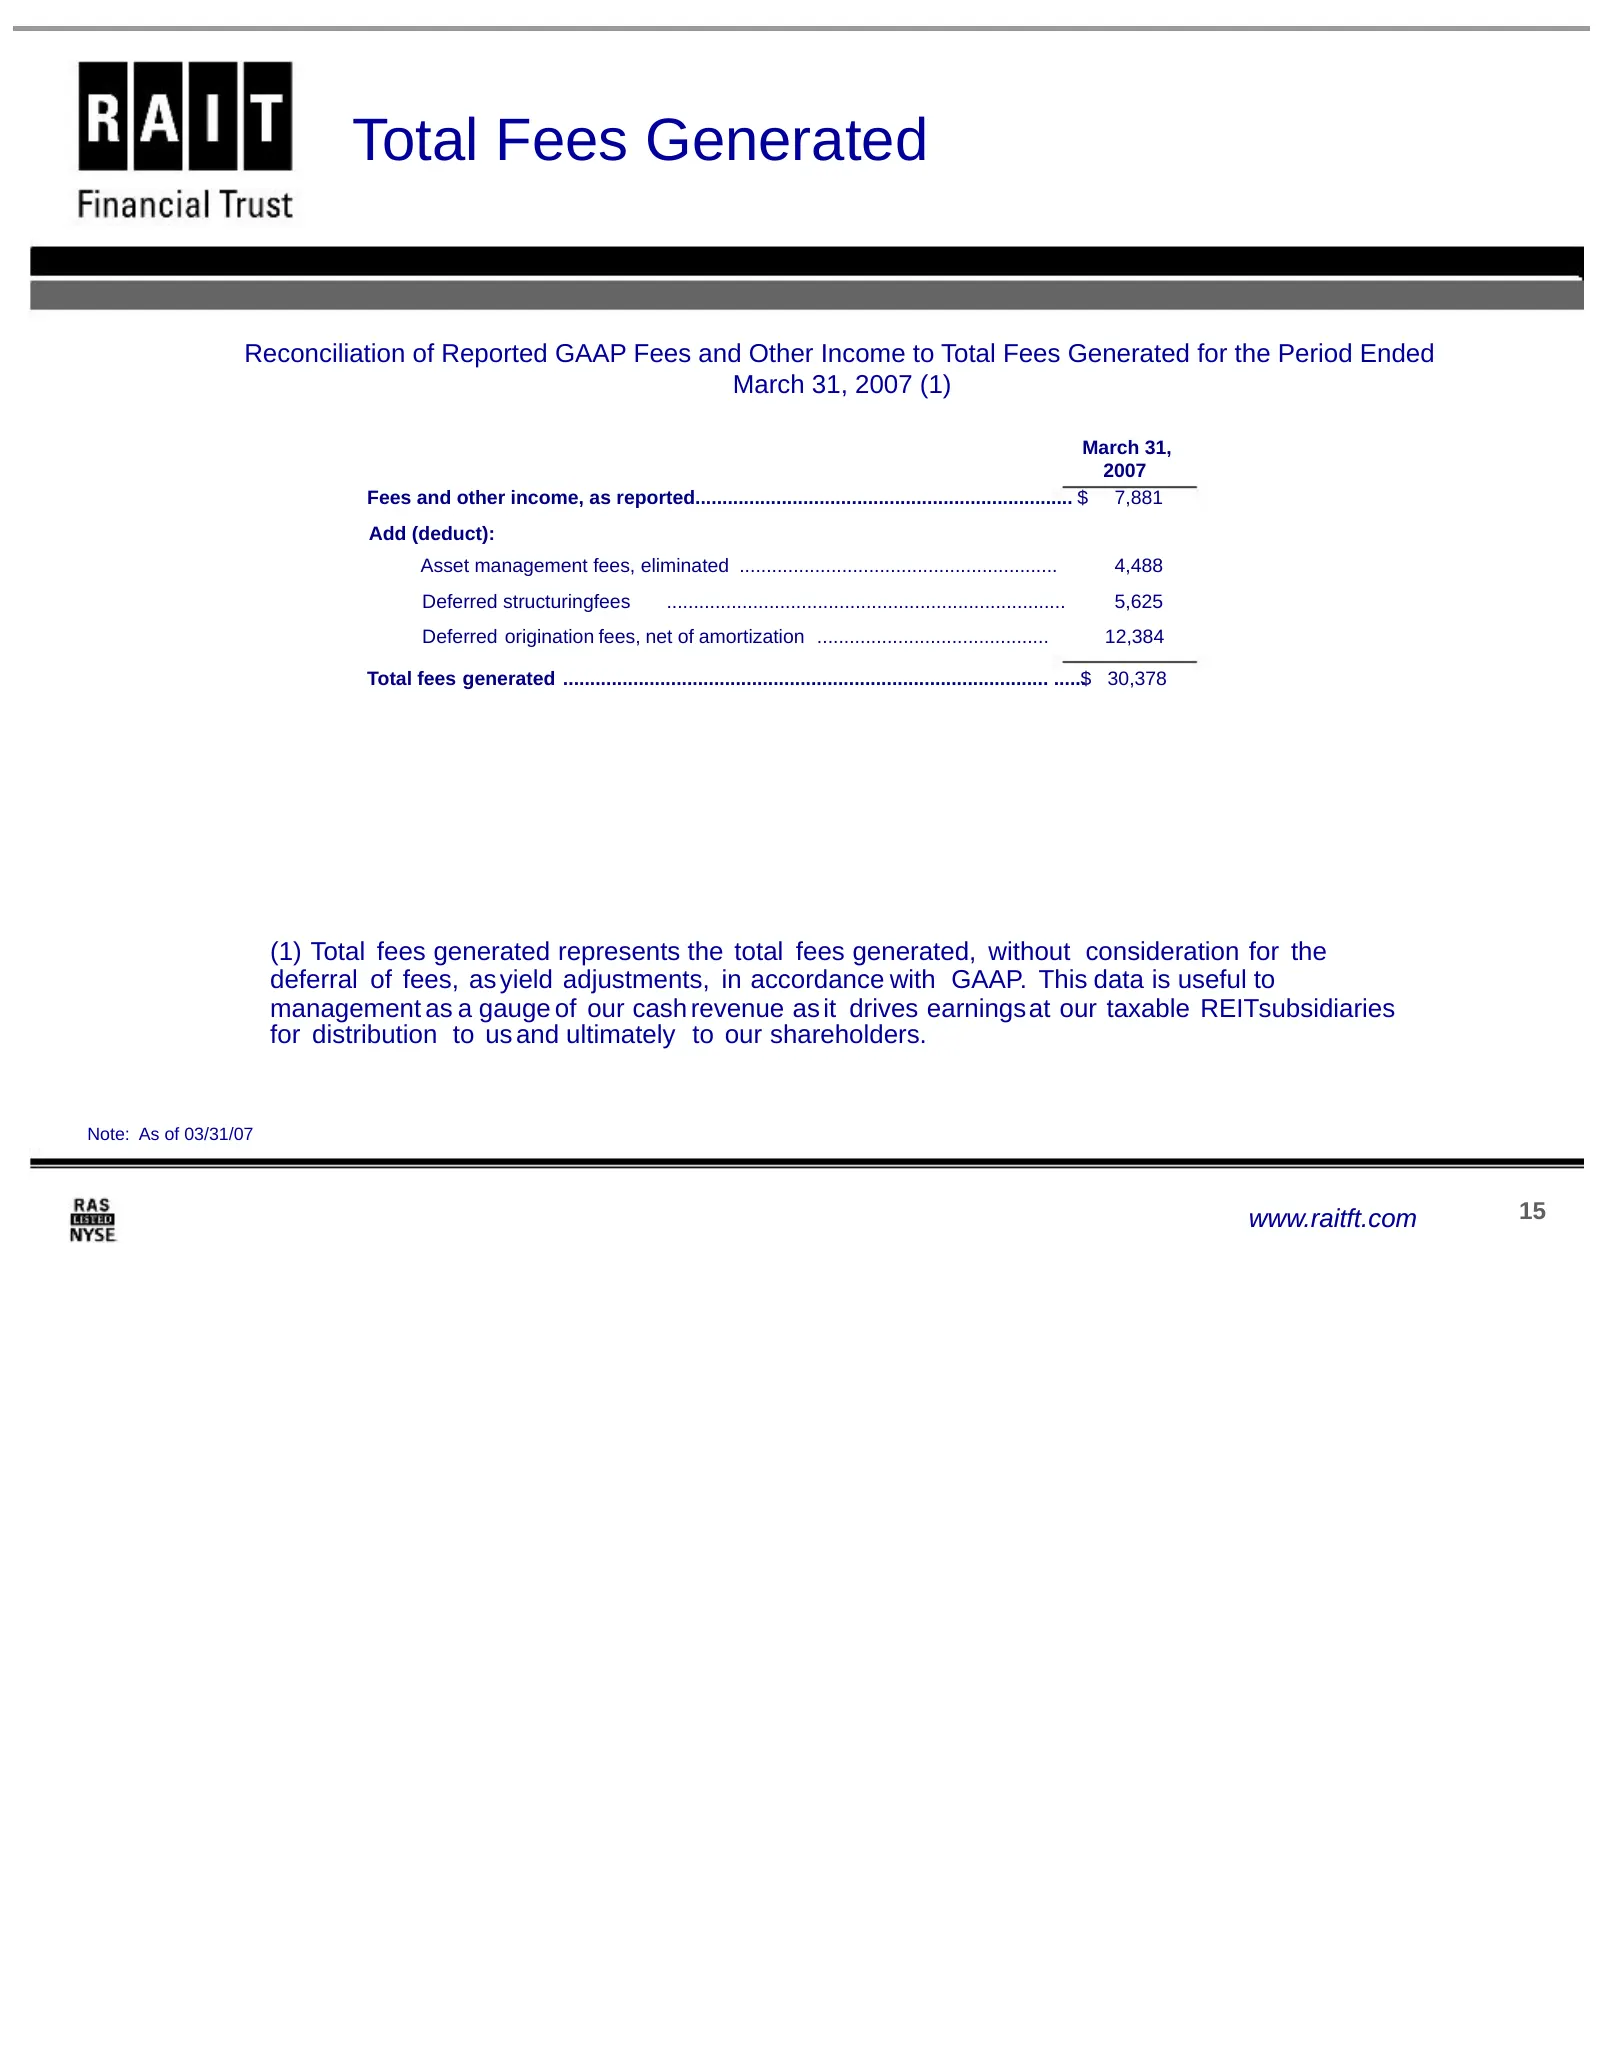
Total Fees Generated Reconciliation of Reported GAAP Fees and Other Income to Total Fees Generated for the Period Ended March 31, 2007 (1) March 31, 2007 Fees and other income, as reported...................................................................... $ 7,881 Add (deduct): Asset management fe
Slide 16: Key Drivers of Value Creation
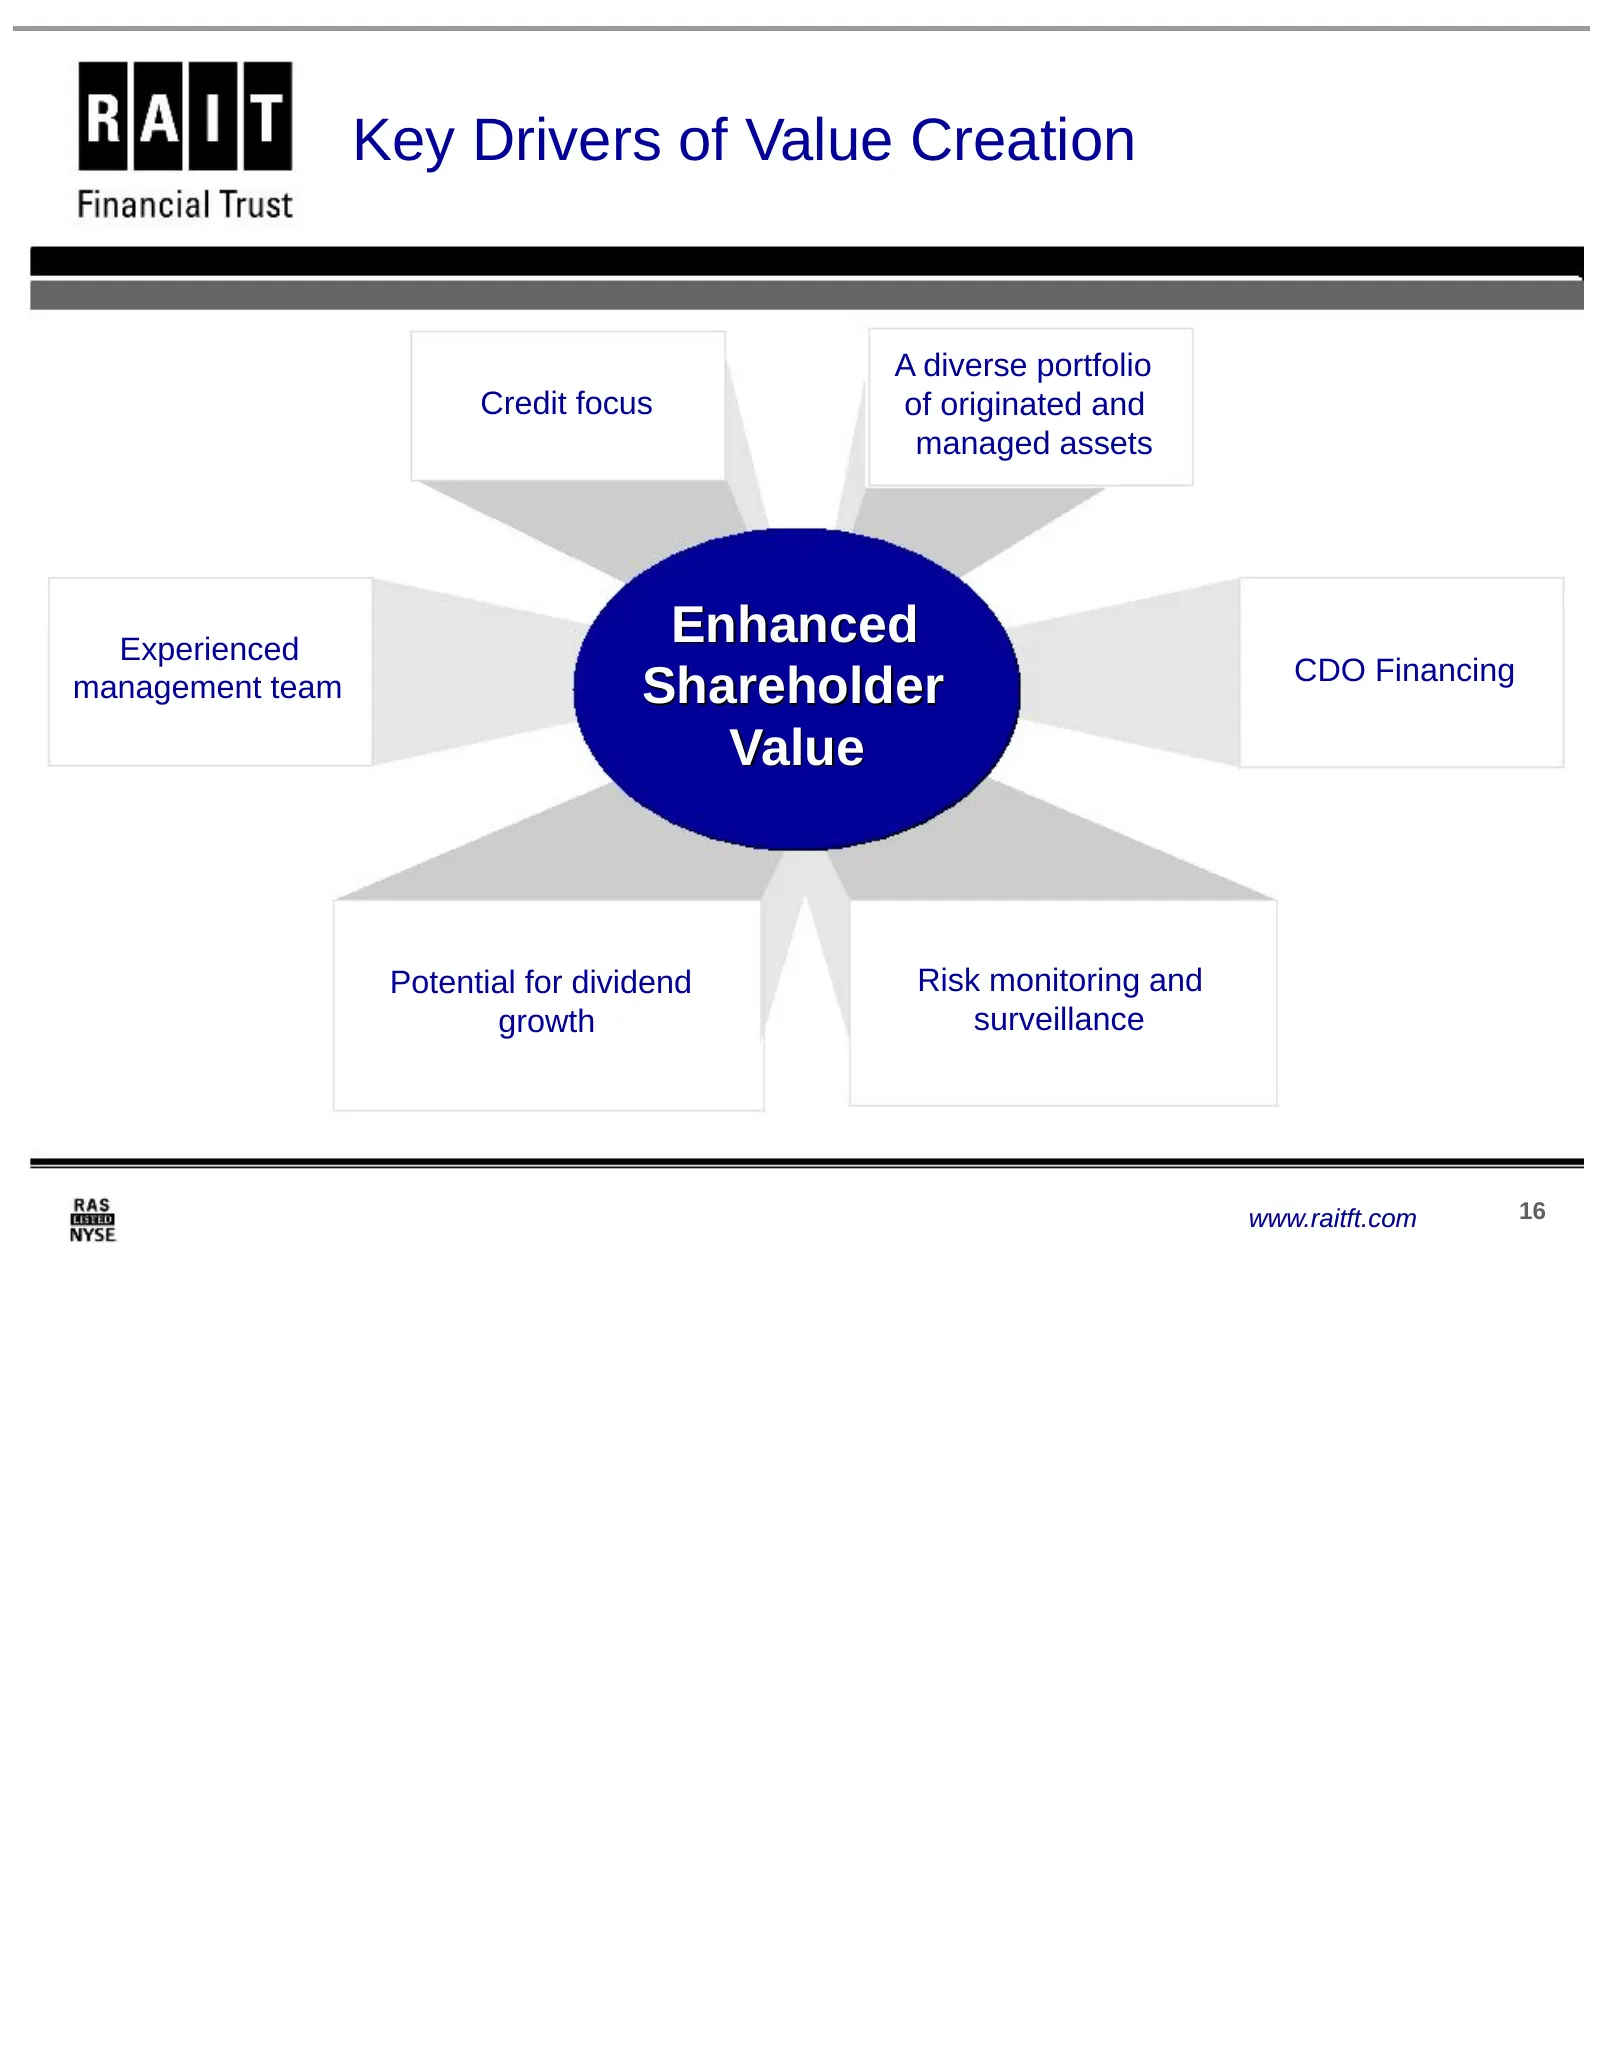
Key Drivers of Value Creation A diverse portfolio Credit focus of originated and managed assets Experienced Enhanced CDO Financing management team Shareholder Value Potential for dividend Risk monitoring and growth surveillance www.raitft.com 16
Source: SEC EDGAR · 8-K filed Jun 5, 2007
More decks from RAIT Financial Trust
 Investor Presentation (February 2017)27 slides · Feb 24, 2017
 Investor Presentation (September 2015)21 slides · Sep 18, 2015
 Investor Presentation (May 2015)20 slides · May 29, 2015
 Investor Presentation (March 2015)18 slides · Mar 27, 2015
 Investor Presentation (September 2014)28 slides · Sep 25, 2014
 Investor Presentation (August 2014)22 slides · Aug 26, 2014