Entravision Communications Corporation · NYSE:EVC
Entravision Communications — Investor Presentation (August 2023)
39 slides from Entravision Communications's investor presentation, August 2023
Slide 1: Investor Deck
YOUR = ic] GROWTH, Ae entravision | sk PURPOSE Investor Deck August 2023
Slide 2: About this Presentation
About this Presentation Use of Non-GAAP Financial Measures This presentation includes certain non-GAAP financial measures. The company has previously provided a reconciliation between these non-GAAP financial measures and the most directly comparable GAAP measure. That reconciliation was included in
Slide 3: About Entravision
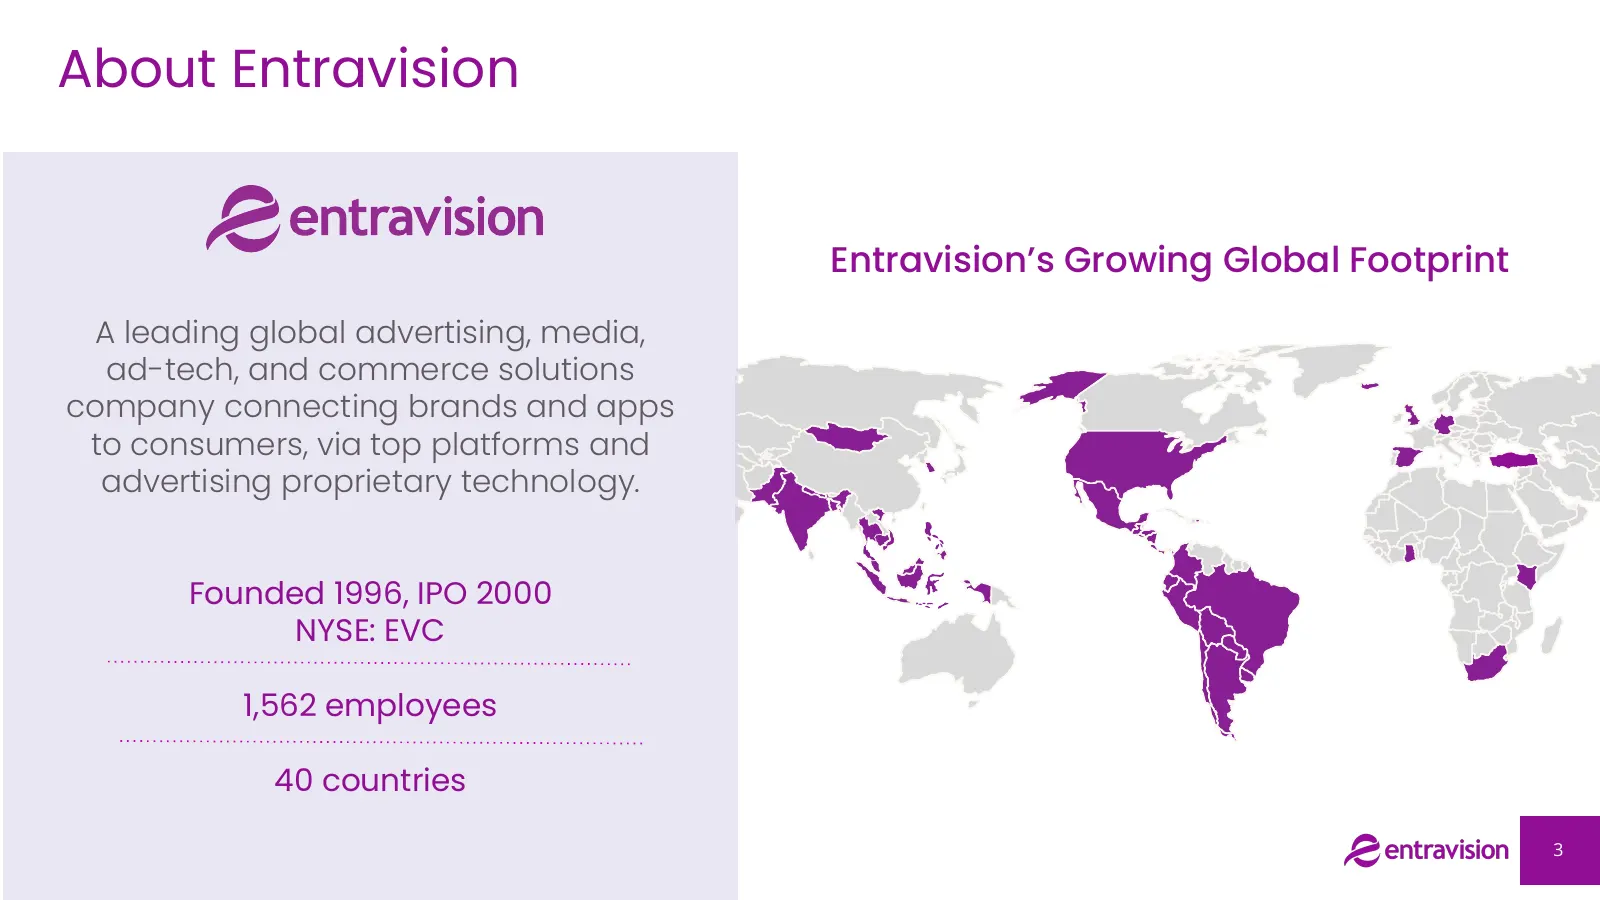
About Entravision Entravision’s Growing Global Footprint A leading global advertising, media, ad-tech, and commerce solutions company connecting brands and apps to consumers, via top platforms and advertising proprietary technology. Founded 1996, IPO 2000 NYSE: EVC 1,562 employees 40 countries 3
Slide 4: Transformation of Entravision
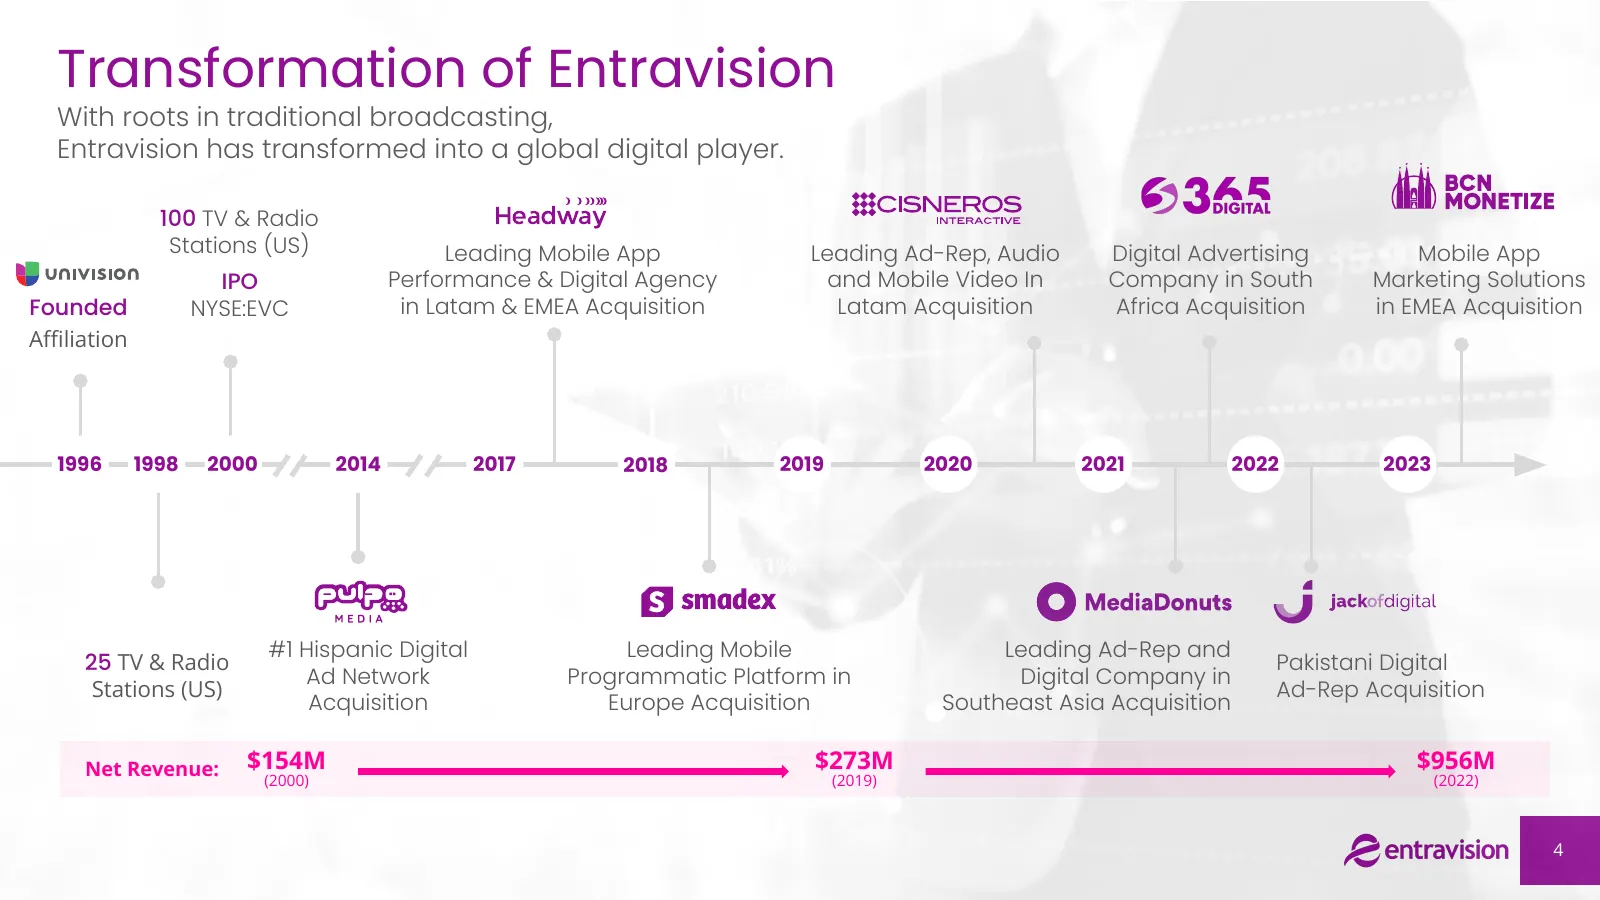
Transformation of Entravision With roots in traditional broadcasting, Entravision has transformed into a global digital player. 100 TV & Radio Stations (US) Leading Mobile App Leading Ad-Rep, Audio Digital Advertising Mobile App IPO Performance & Digital Agency and Mobile Video In Company in South M
Slide 5: Investment Highlights
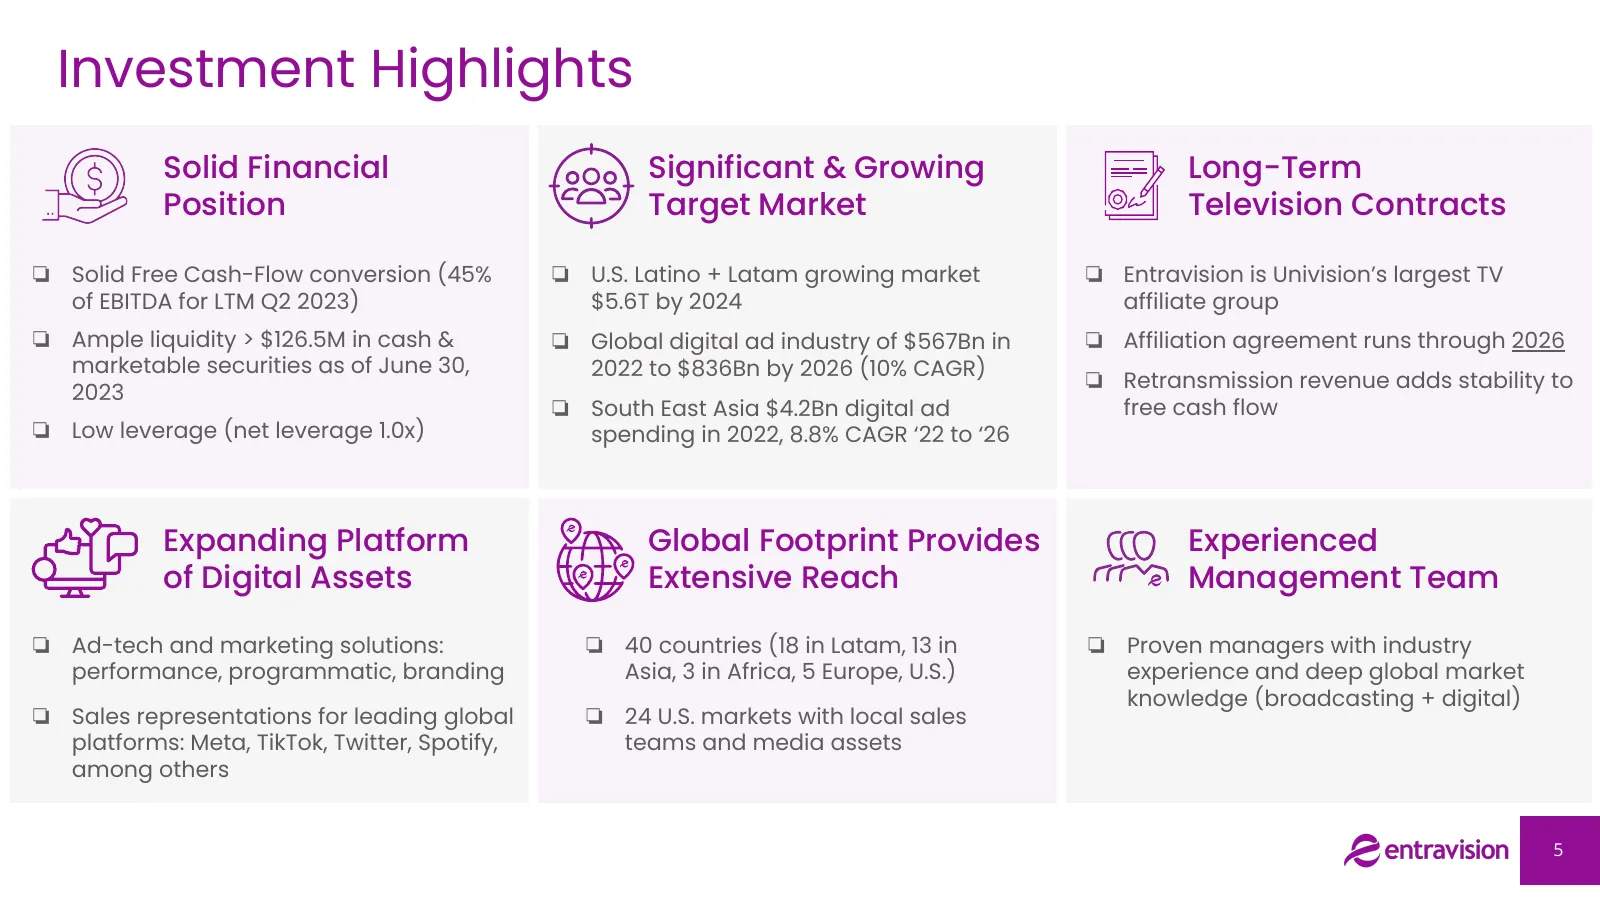
Investment Highlights Solid Financial Significant & Growing Long-Term Position Target Market Television Contracts ❏ Solid Free Cash-Flow conversion (45% ❏ U.S. Latino + Latam growing market ❏ Entravision is Univision’s largest TV of EBITDA for LTM Q2 2023) $5.6T by 2024 affiliate group ❏ Ample liqui
Slide 6: Experienced Management Team
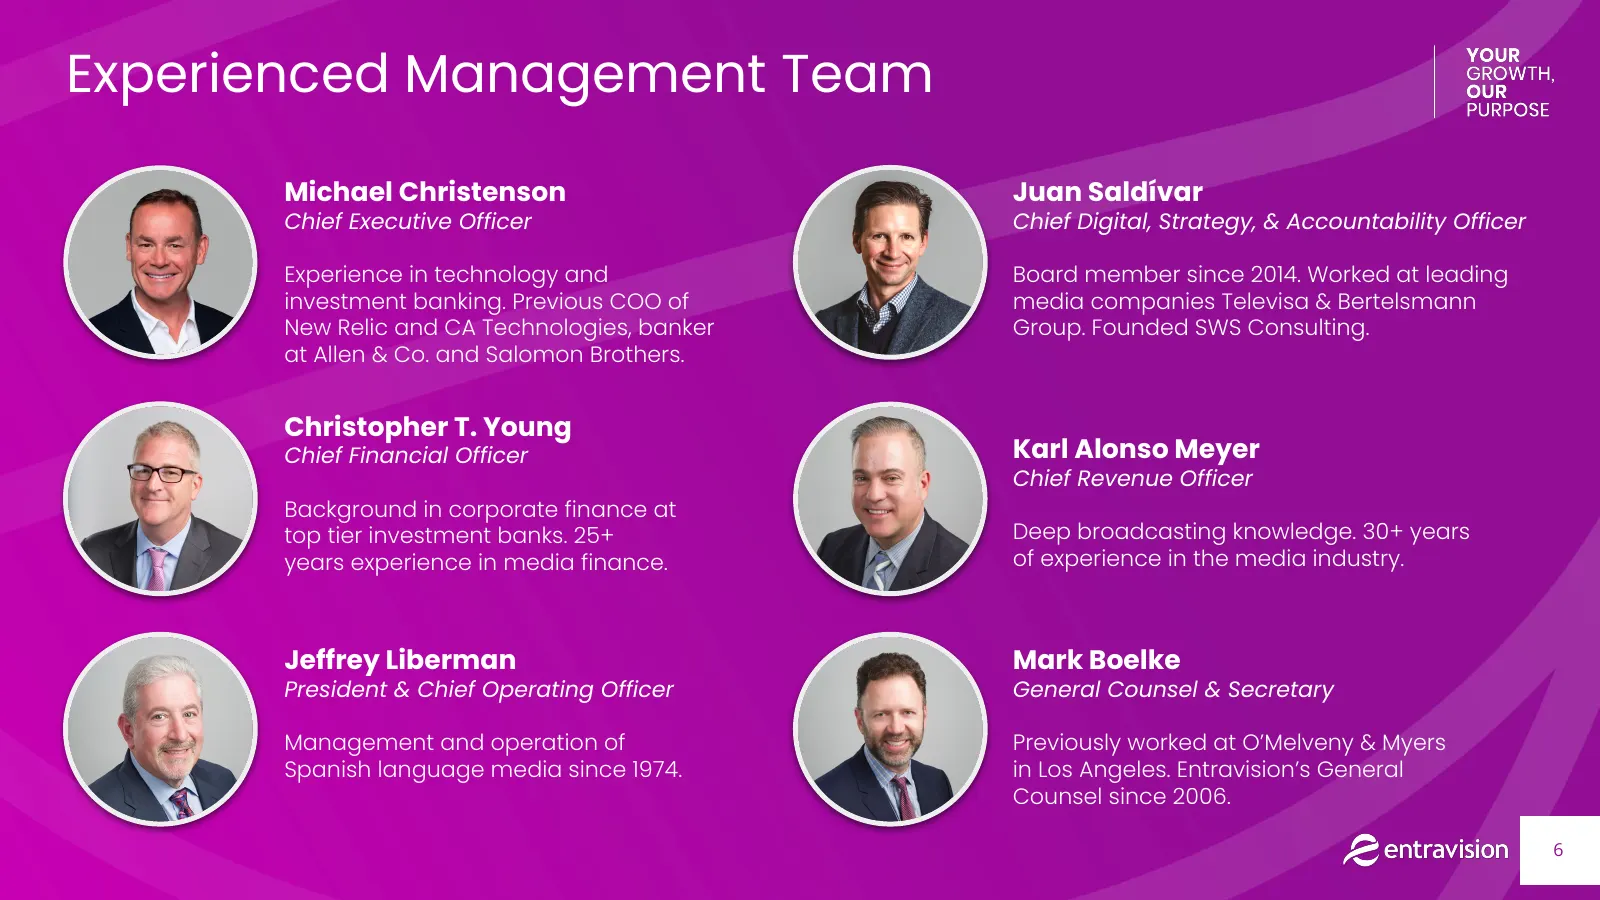
Experienced Management Team Michael Christenson Juan Saldívar Chief Executive Officer Chief Digital, Strategy, & Accountability Officer Experience in technology and Board member since 2014. Worked at leading investment banking. Previous COO of media companies Televisa & Bertelsmann New Relic and CA
Slide 7: Entravision Operating Segments
01 Entravision Operating Segments
Slide 8: Entravision's Three Business Segments
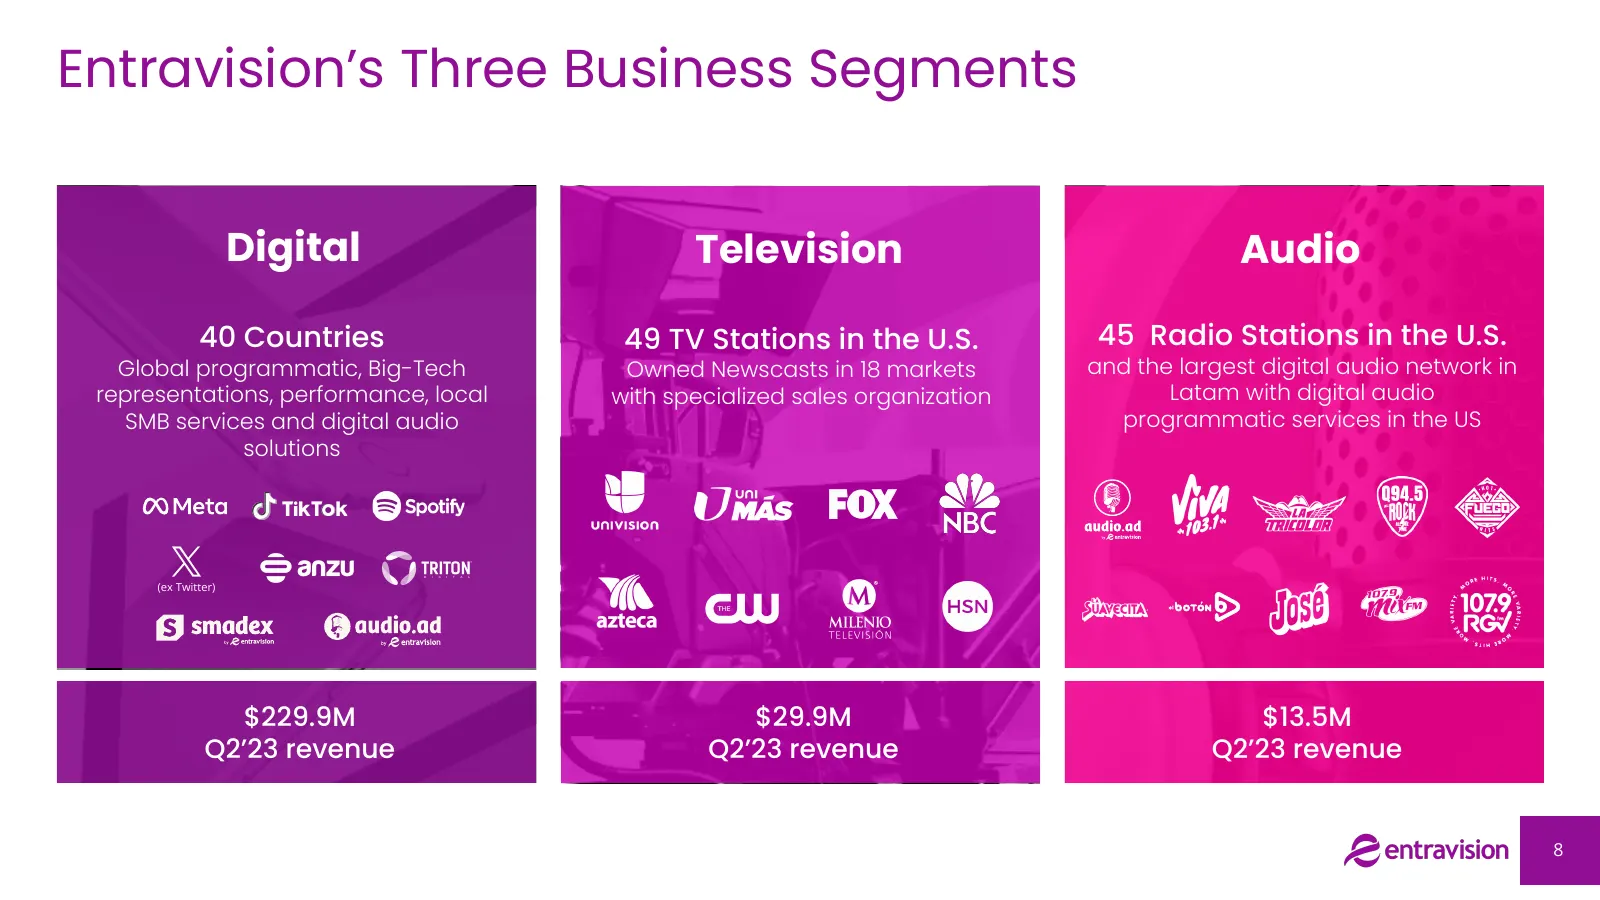
Entravision’s Three Business Segments Digital Television Audio 40 Countries 49 TV Stations in the U.S. 45 Radio Stations in the U.S. Global programmatic, Big-Tech Owned Newscasts in 18 markets and the largest digital audio network in representations, performance, local with specialized sales organiz
Slide 9: Digital Segment
a your entravision | ctr"™ PURPOSE
Slide 10: Entravision Interactive Business Segments Focus
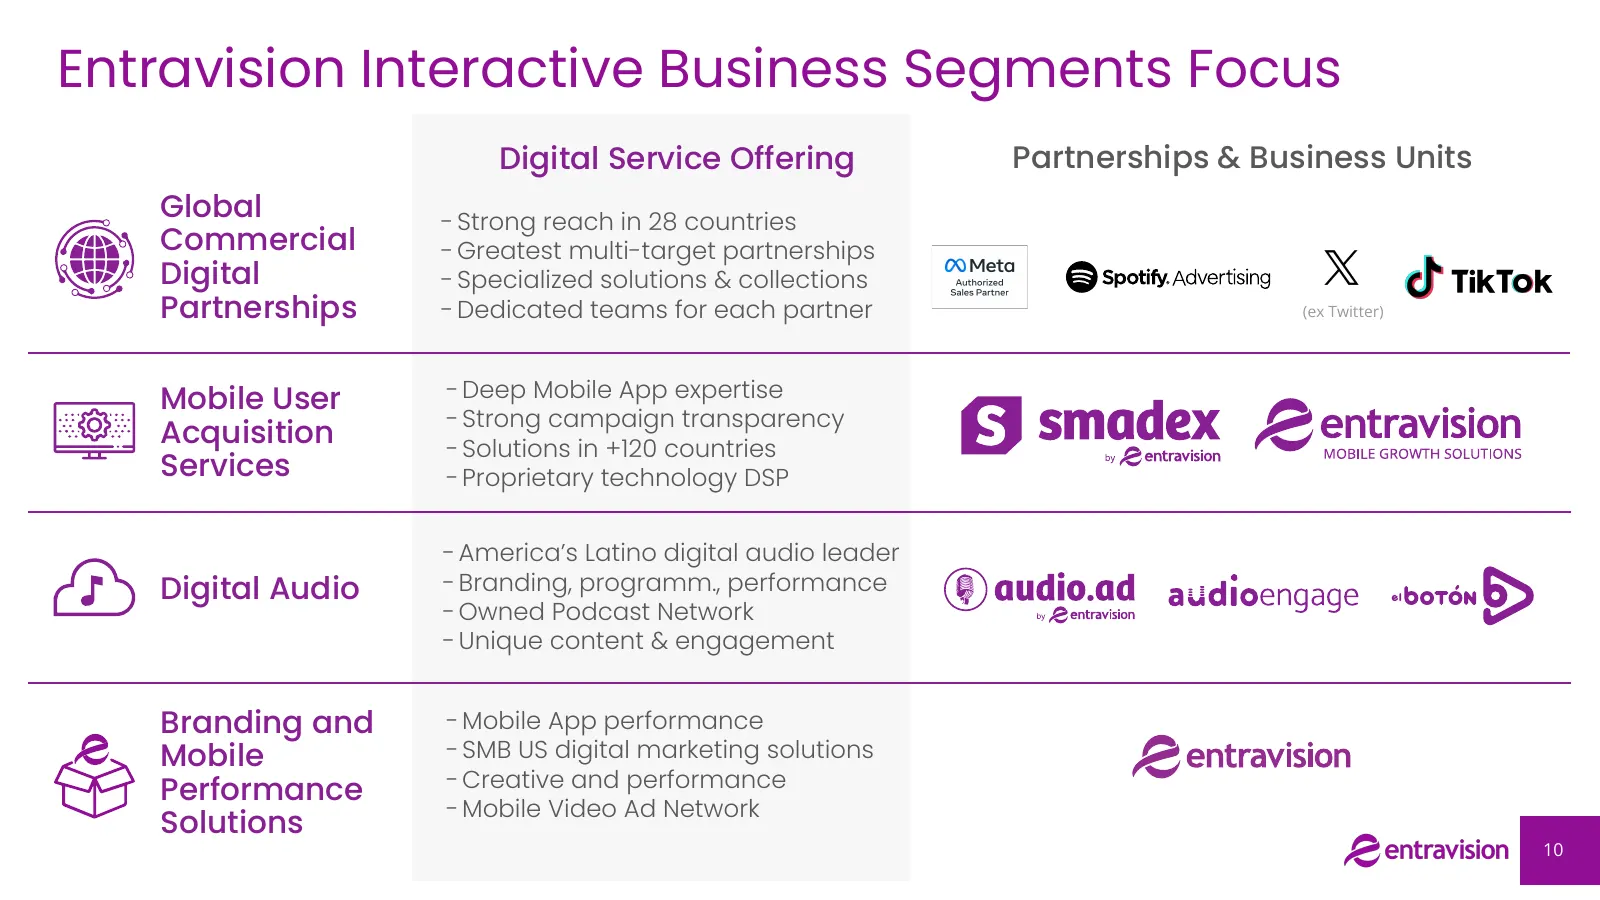
Entravision Interactive Business Segments Focus Digital Service Offering Partnerships & Business Units Global - Strong reach in 28 countries Commercial - Greatest multi-target partnerships Digital - Specialized solutions & collections Partnerships - Dedicated teams for each partner (ex Twitter) Mobi
Slide 11: Acquisition of BCNMonetize
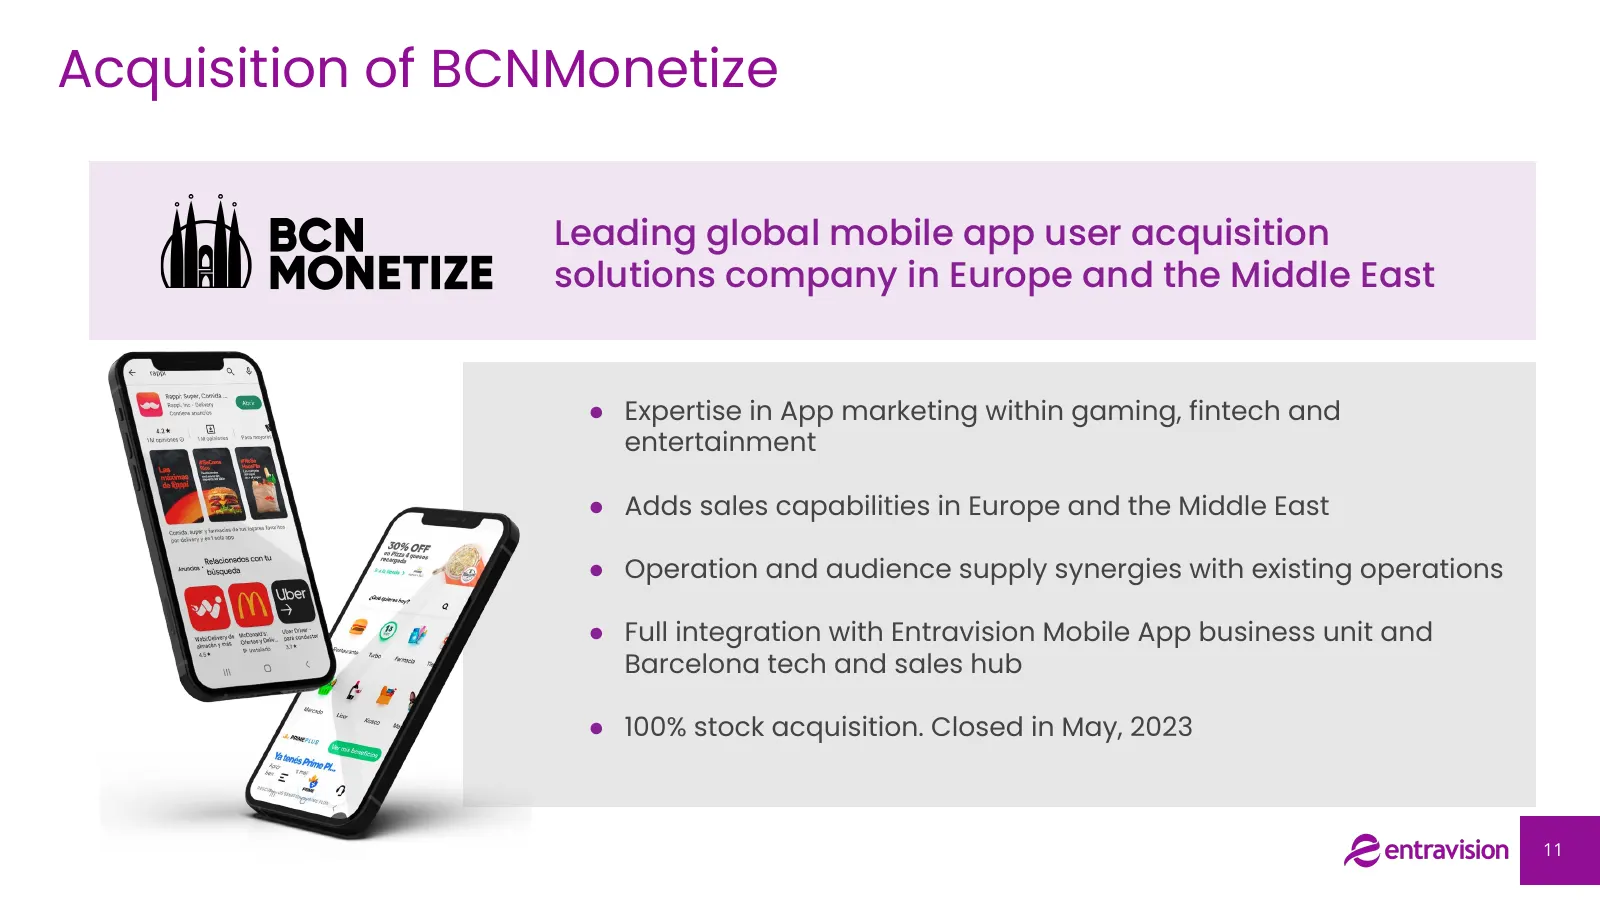
Acquisition of BCNMonetize Leading global mobile app user acquisition solutions company in Europe and the Middle East ● Expertise in App marketing within gaming, fintech and entertainment ● Adds sales capabilities in Europe and the Middle East ● Operation and audience supply synergies with existing
Slide 12: Digital Segment Industry Growth Drivers
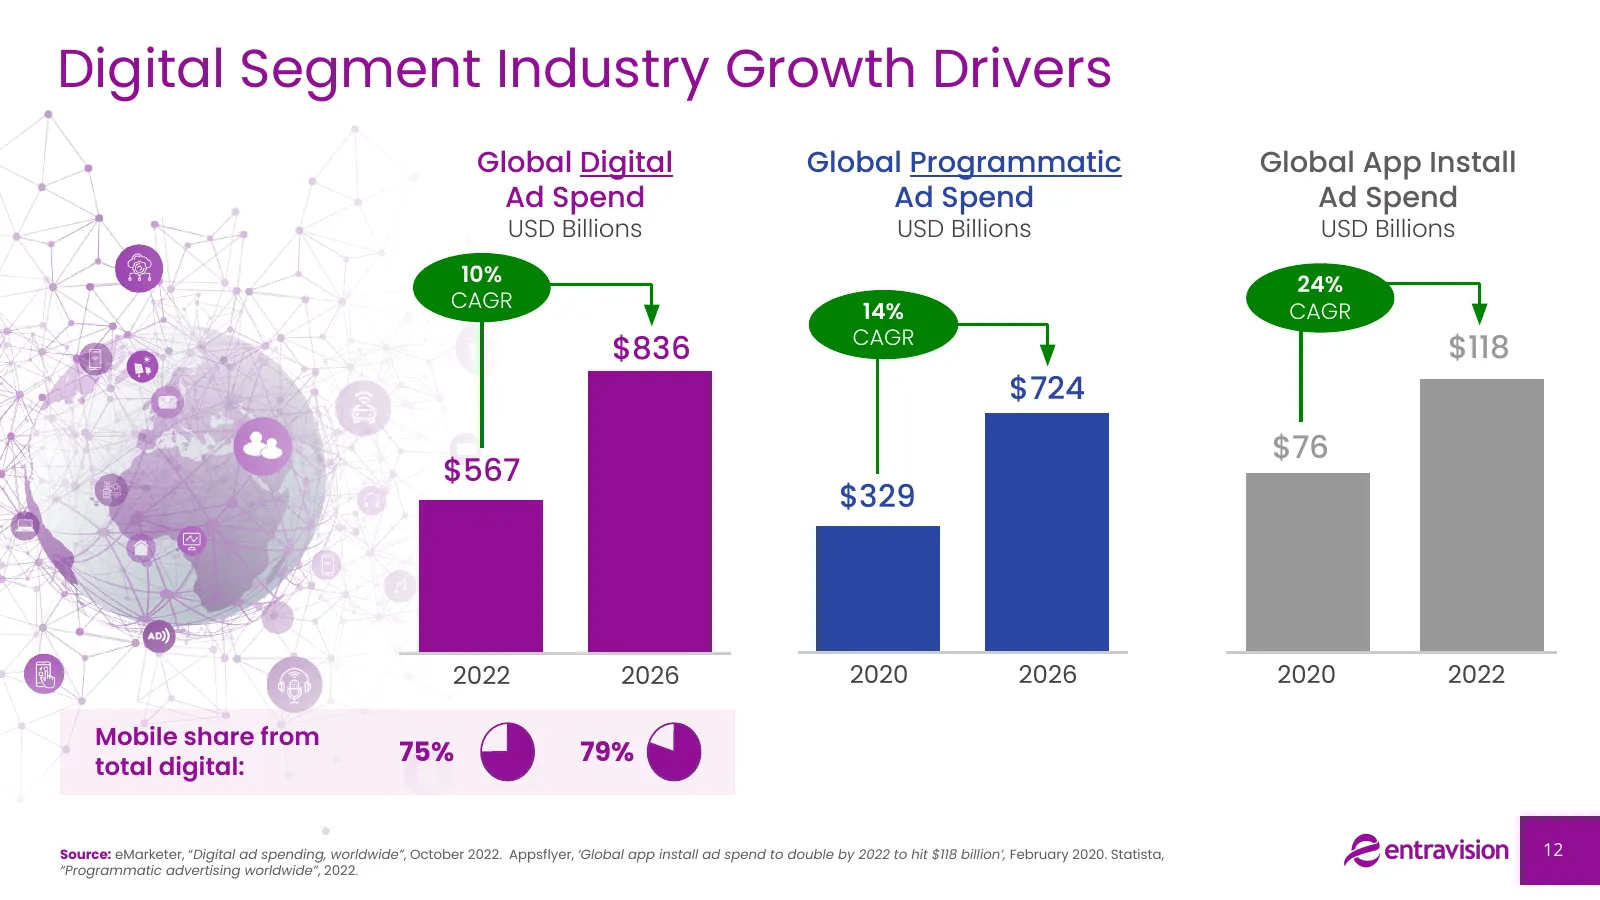
Digital Segment Industry Growth Drivers Global Digital Global Programmatic Global App Install Ad Spend Ad Spend Ad Spend USD Billions USD Billions USD Billions 10% 24% CAGR 14% CAGR CAGR $836 $118 $724 $76 $567 $329 2022 2026 2020 2026 2020 2022 Mobile share from 75% 79% total digital: Source: eMark
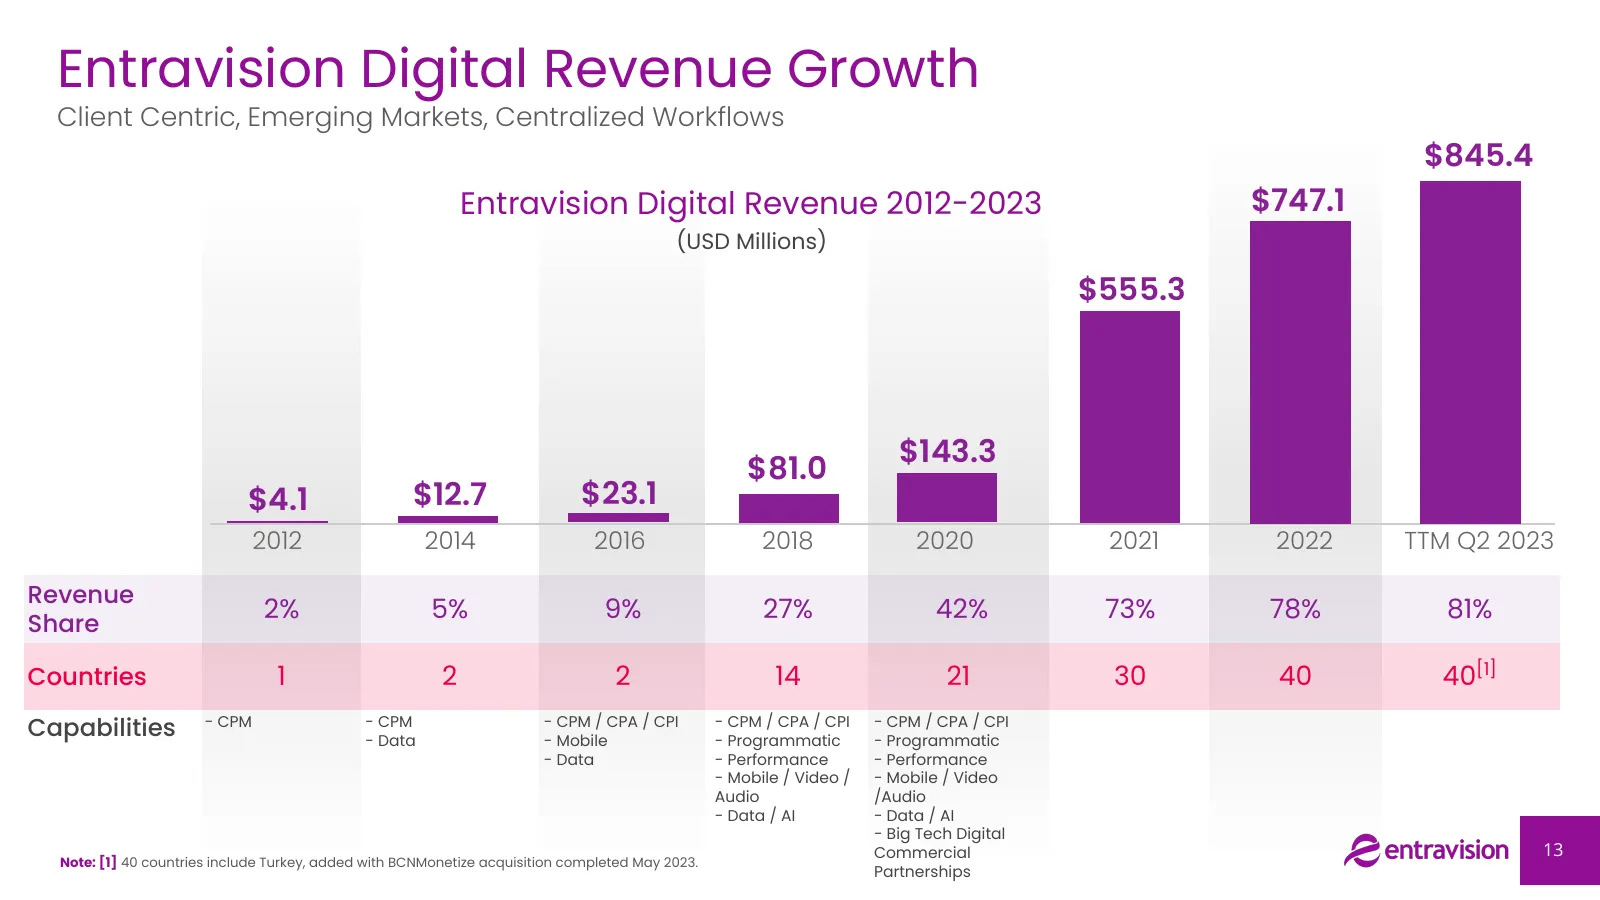
Slide 13: Entravision Digital Revenue Growth
Entravision Digital Revenue Growth Client Centric, Emerging Markets, Centralized Workflows $845.4 Entravision Digital Revenue 2012-2023 $747.1 (USD Millions) $555.3 $143.3 $81.0 $4.1 $12.7 $23.1 2012 2014 2016 2018 2020 2021 2022 TTM Q2 2023 Revenue 2% 5% 9% 27% 42% 73% 78% 81% Share Countries 1 2 2
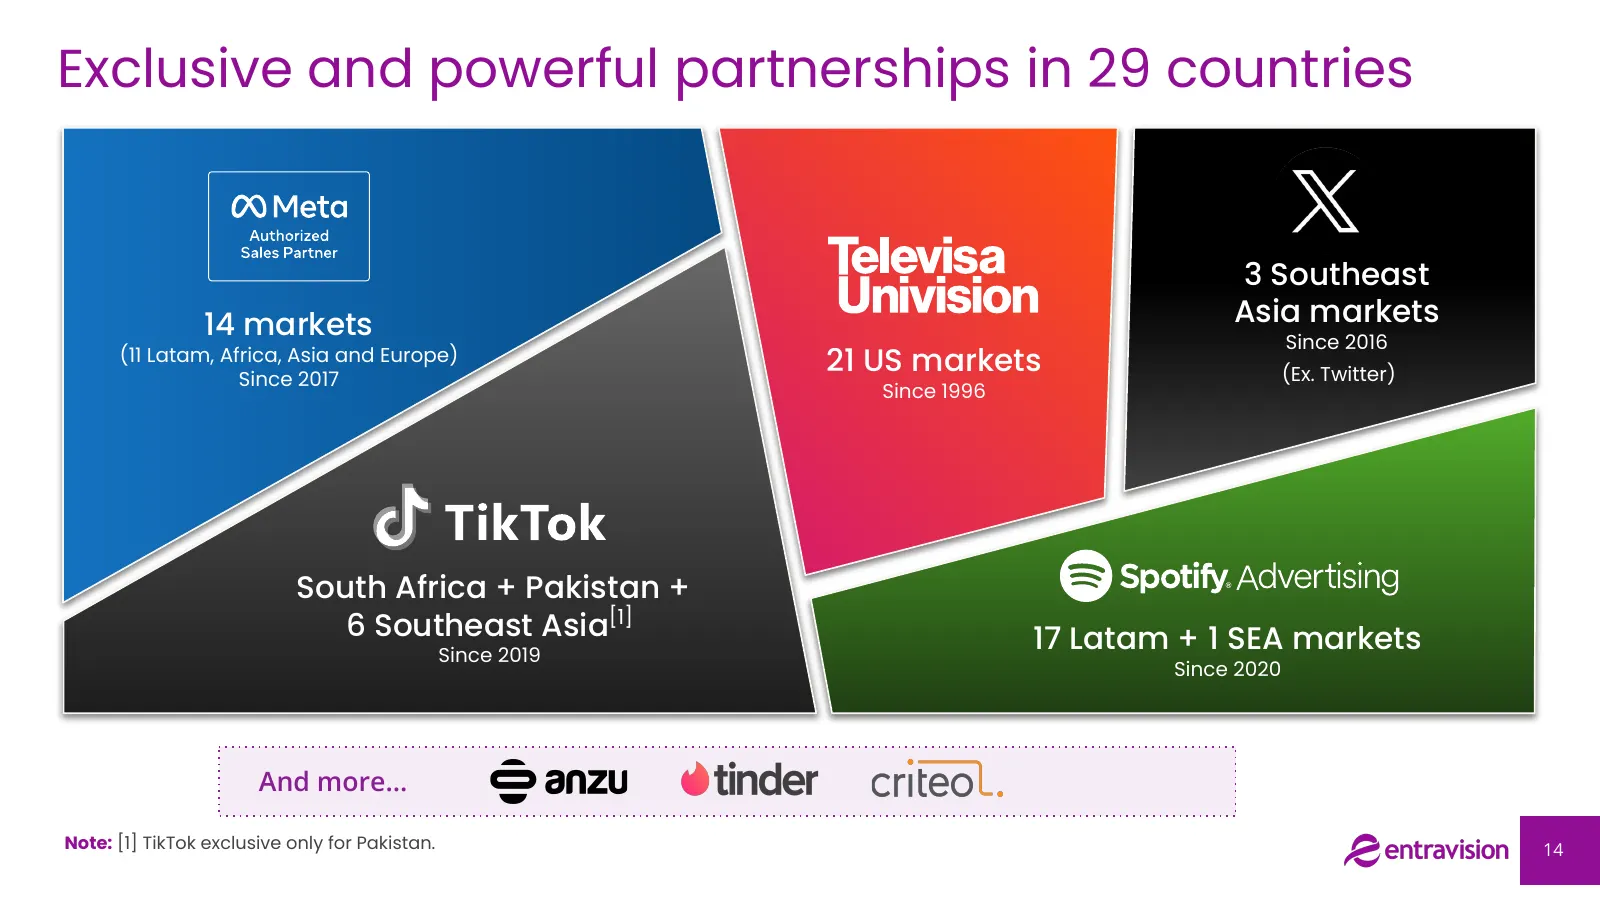
Slide 14: Exclusive and powerful partnerships in 29 countries
Exclusive and powerful partnerships in 29 countries 3 Southeast 14 markets Asia markets Since 2016 (11 Latam, Africa, Asia and Europe) Since 2017 21 US markets (Ex. Twitter) Since 1996 South Africa + Pakistan + 6 Southeast Asia[1] 17 Latam + 1 SEA markets Since 2019 Since 2020 And more... Note: [1]
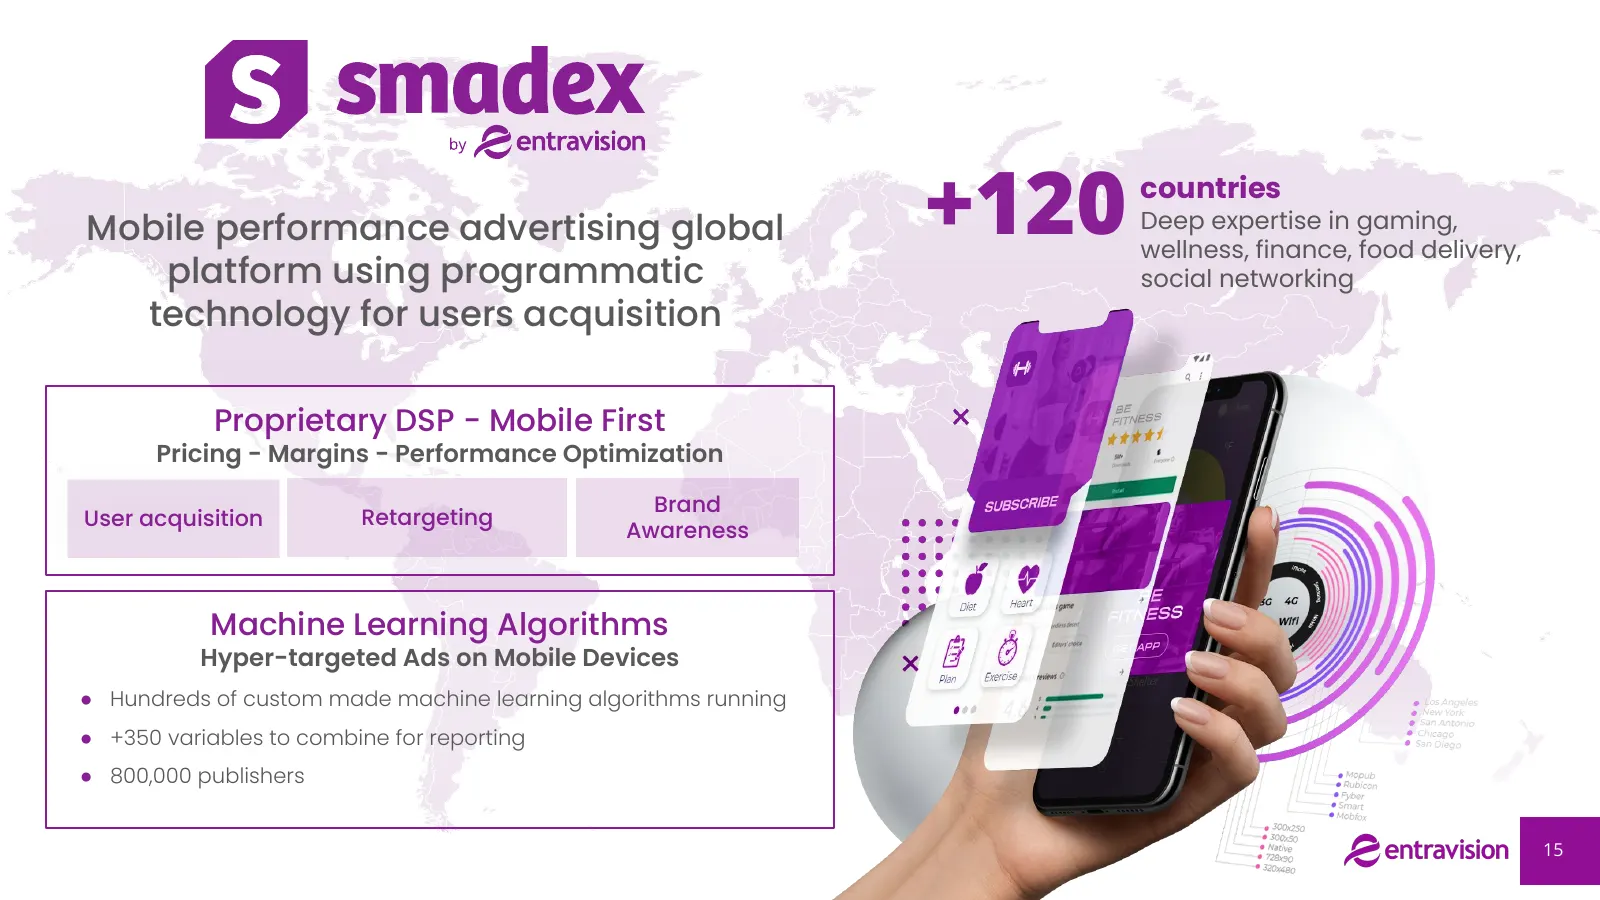
Slide 15: Mobile performance advertising global platform
Mobile performance advertising global +120 countries Deep expertise in gaming, wellness, finance, food delivery, platform using programmatic social networking technology for users acquisition Proprietary DSP - Mobile First Pricing - Margins - Performance Optimization Brand User acquisition Retargeti
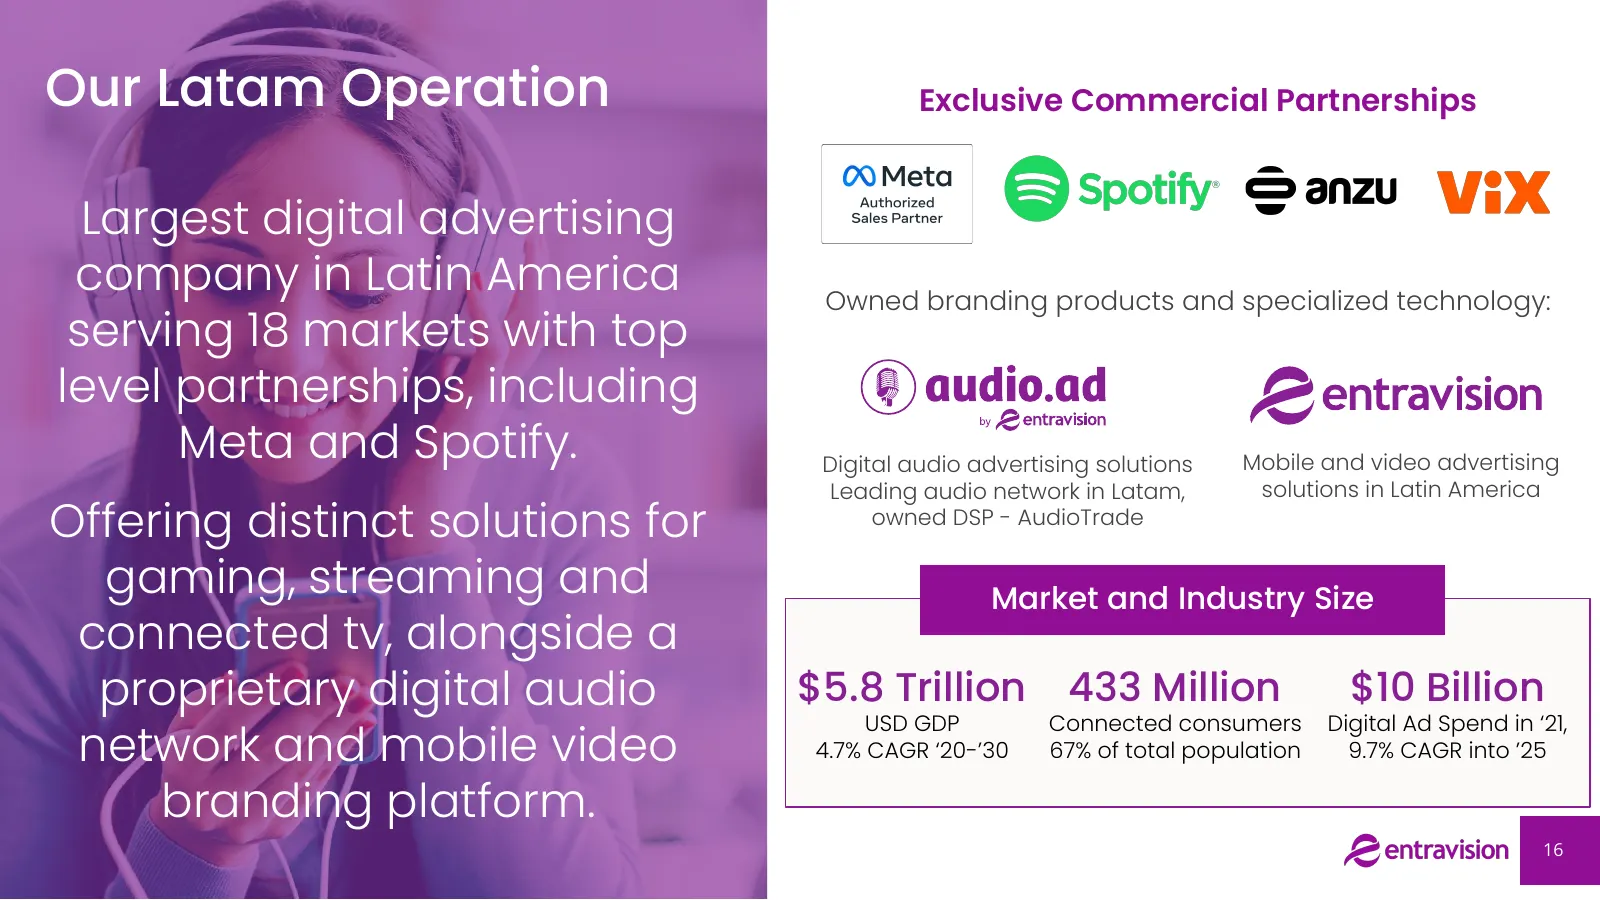
Slide 16: Our Latam Operation
Our Latam Operation Exclusive Commercial Partnerships Largest digital advertising company in Latin America Owned branding products and specialized technology: serving 18 markets with top level partnerships, including Meta and Spotify. Digital audio advertising solutions Mobile and video advertising
Slide 17: Leading Digital Marketing and Advertising Company in Southeast Asia
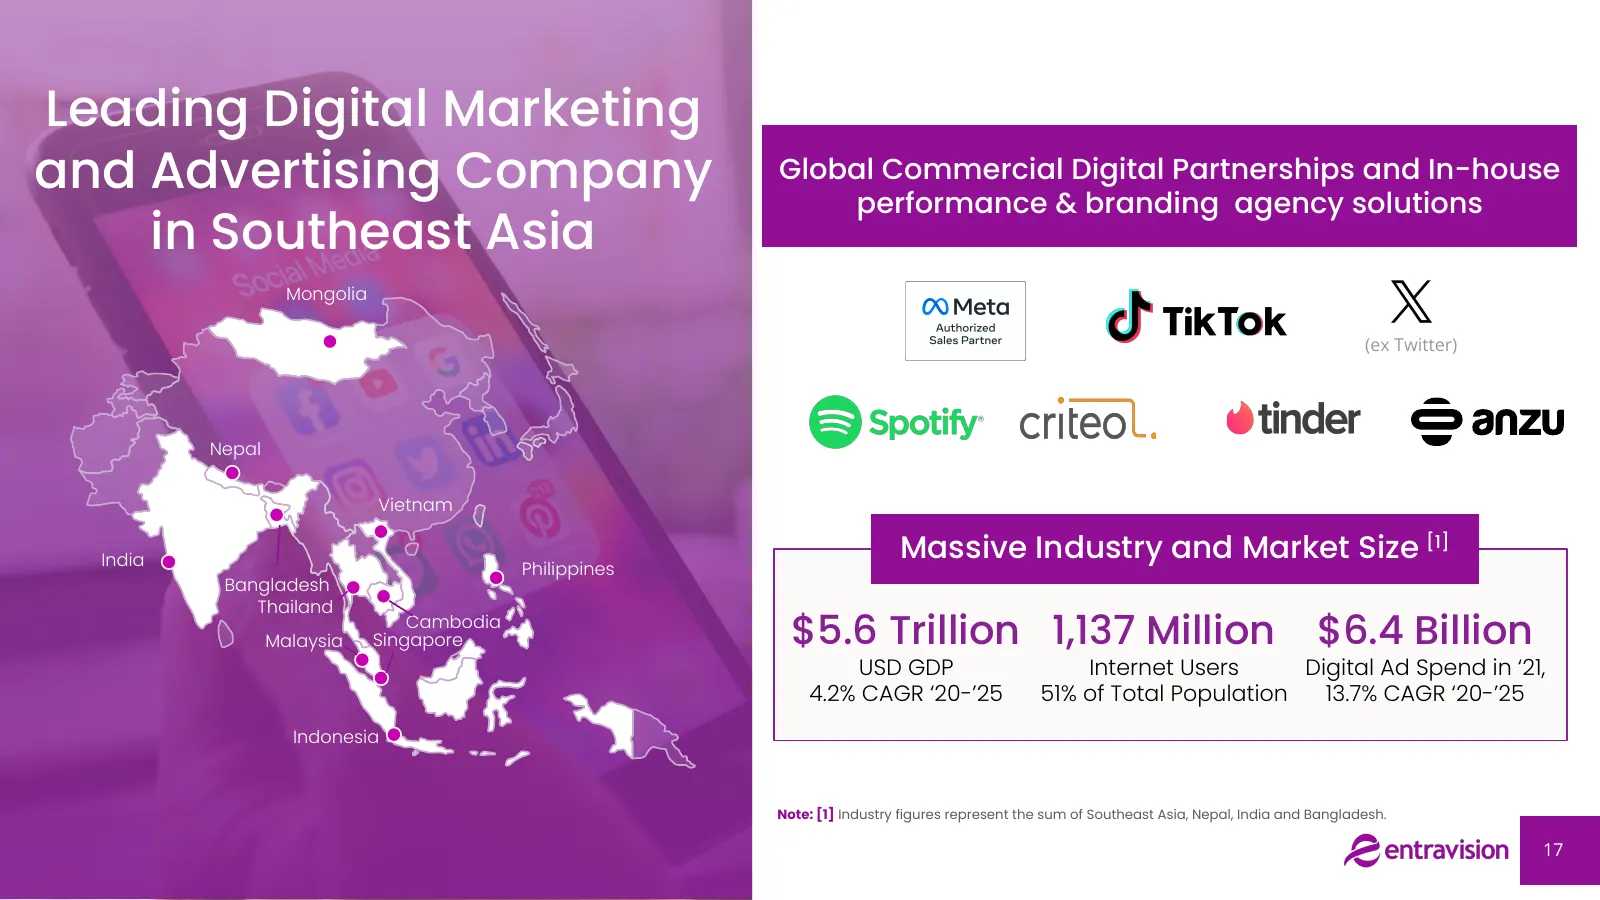
Leading Digital Marketing and Advertising Company Global Commercial Digital Partnerships and In-house performance & branding agency solutions in Southeast Asia Mongolia (ex Twitter) Nepal Vietnam India Massive Industry and Market Size [1] Philippines Bangladesh Thailand Malaysia Cambodia Singapore $
Slide 18: Television Segment
_ YOUR _ ZEentravision | sie" PURPOSE lealciale
Slide 19: Television Segment
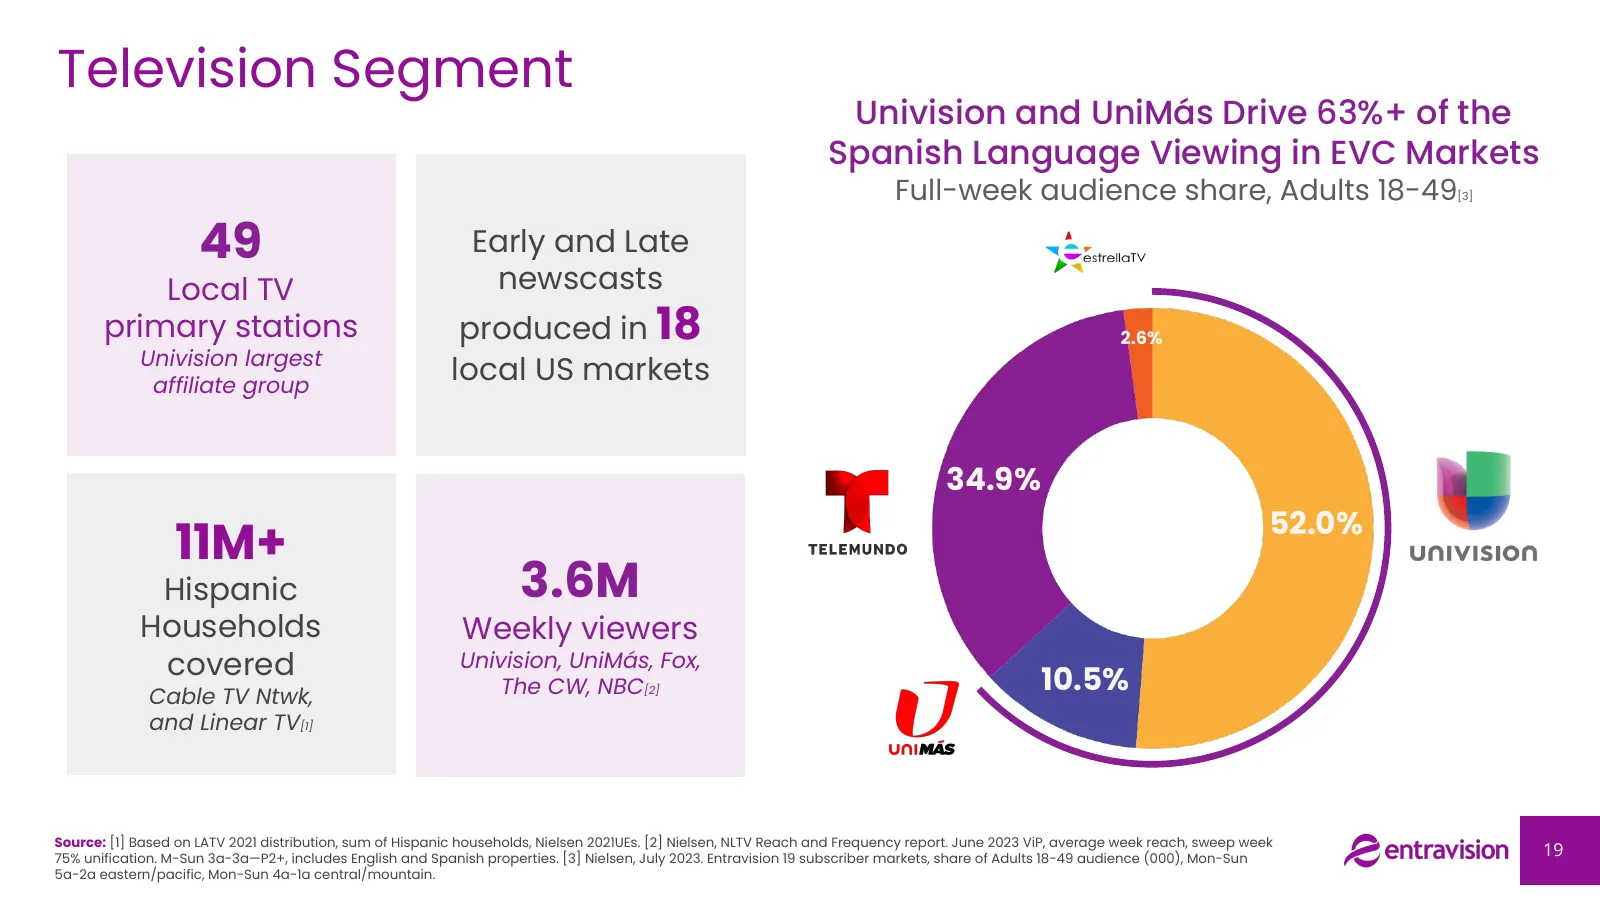
Television Segment Univision and UniMás Drive 63%+ of the Spanish Language Viewing in EVC Markets Full-week audience share, Adults 18-49 [3] 49 Early and Late Local TV newscasts primary stations produced in 18 2.6% Univision largest affiliate group local US markets 34.9% 52.0% 11M+ Hispanic 3.6M Hou
Slide 20: Audio Segment
a your entravision | ctr"™ PURPOSE
Slide 21: Audio Segment
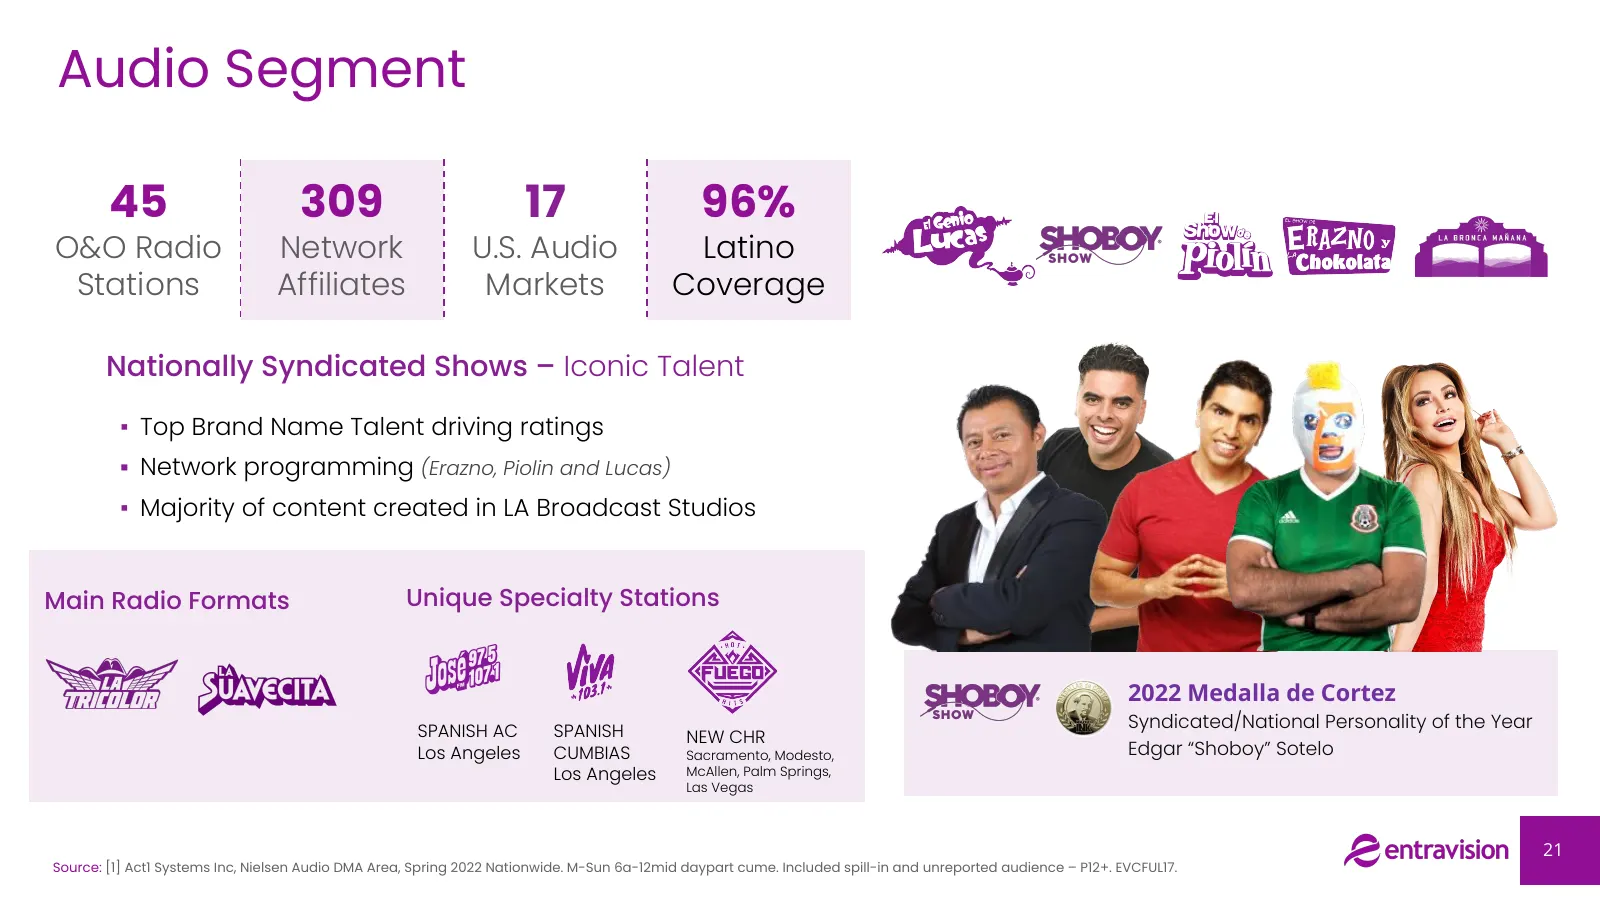
Audio Segment 45 309 17 96% O&O Radio Network U.S. Audio Latino Stations Affiliates Markets Coverage Nationally Syndicated Shows – Iconic Talent ▪ Top Brand Name Talent driving ratings ▪ Network programming (Erazno, Piolin and Lucas) ▪ Majority of content created in LA Broadcast Studios Main Radio F
Slide 22: Entravision Financials
_ YOUR _ ZEentravision | sie" PURPOSE ancials
Slide 23: Four-Year Financial Performance
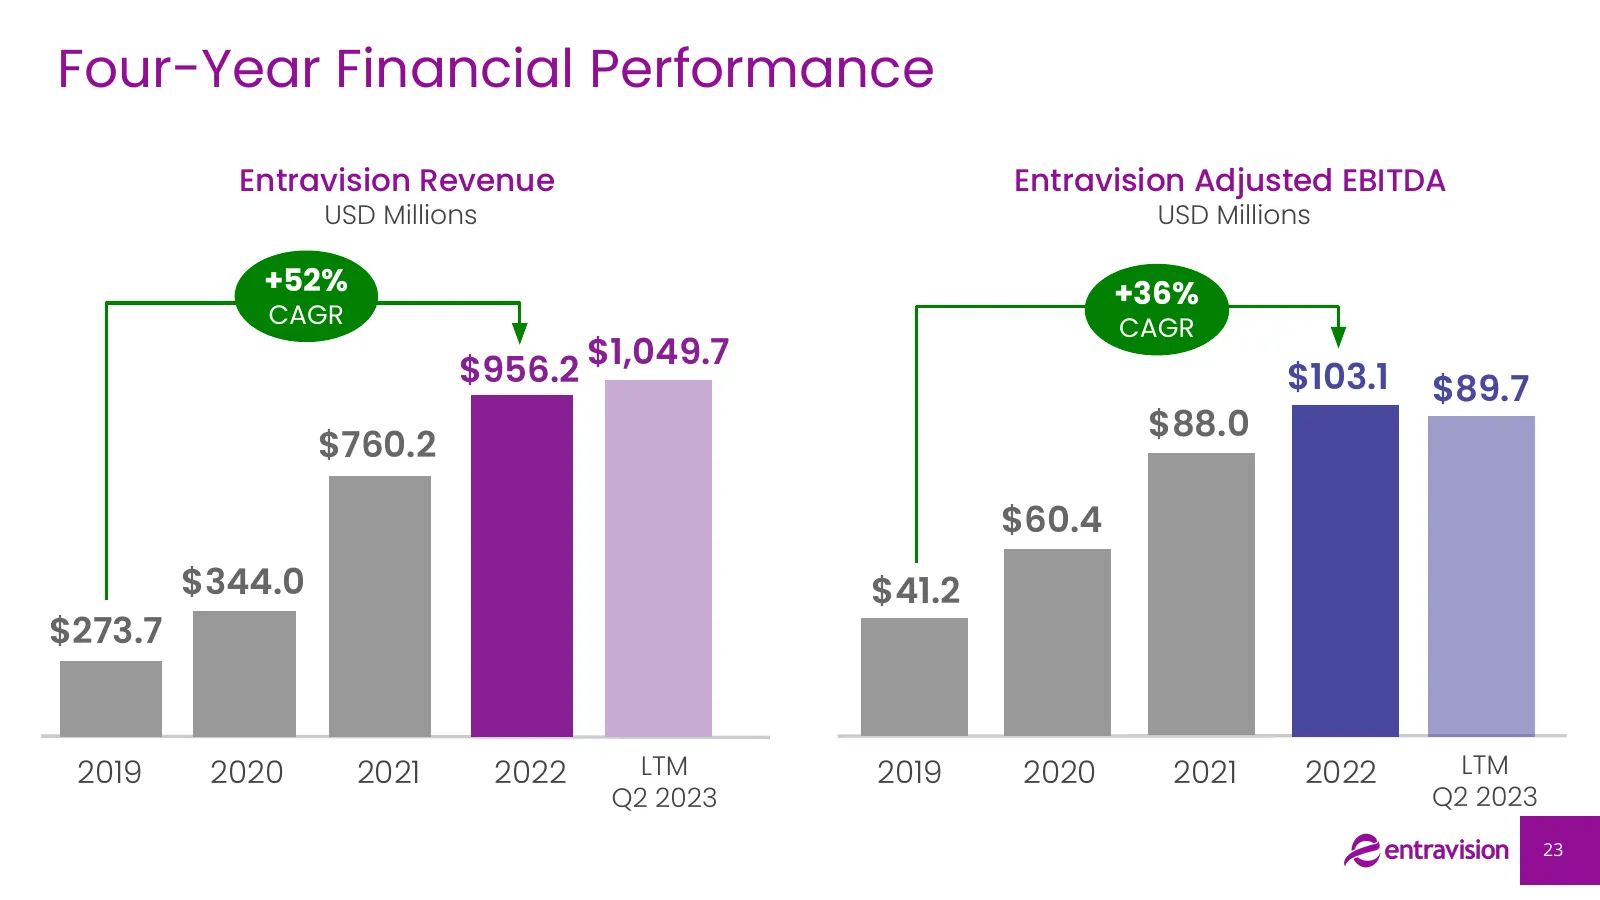
Four-Year Financial Performance Entravision Revenue Entravision Adjusted EBITDA USD Millions USD Millions +52% +36% CAGR CAGR $1,049.7 $956.2 $103.1 $89.7 $88.0 $760.2 $60.4 $344.0 $41.2 $273.7 2019 2020 2021 2022 LTM 2019 2020 2021 2022 LTM Q2 2023 Q2 2023 23
Slide 24: Q2-2023 Financials Update
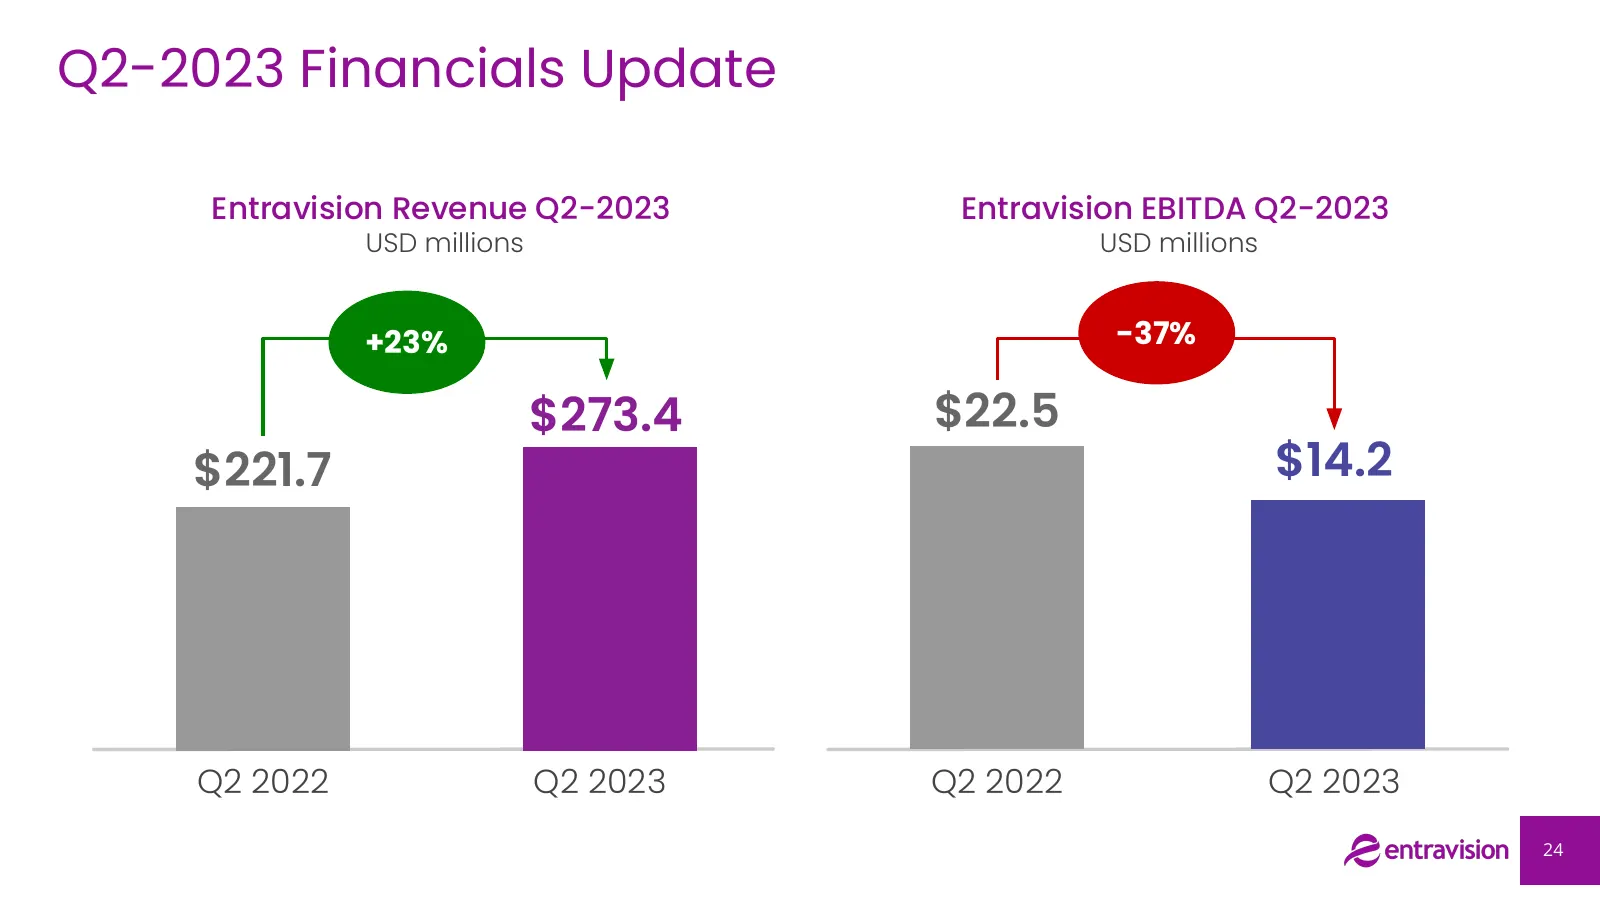
Q2-2023 Financials Update Entravision Revenue Q2-2023 Entravision EBITDA Q2-2023 USD millions USD millions +23% -37% $273.4 $22.5 $221.7 $14.2 Q2 2022 Q2 2023 Q2 2022 Q2 2023 24
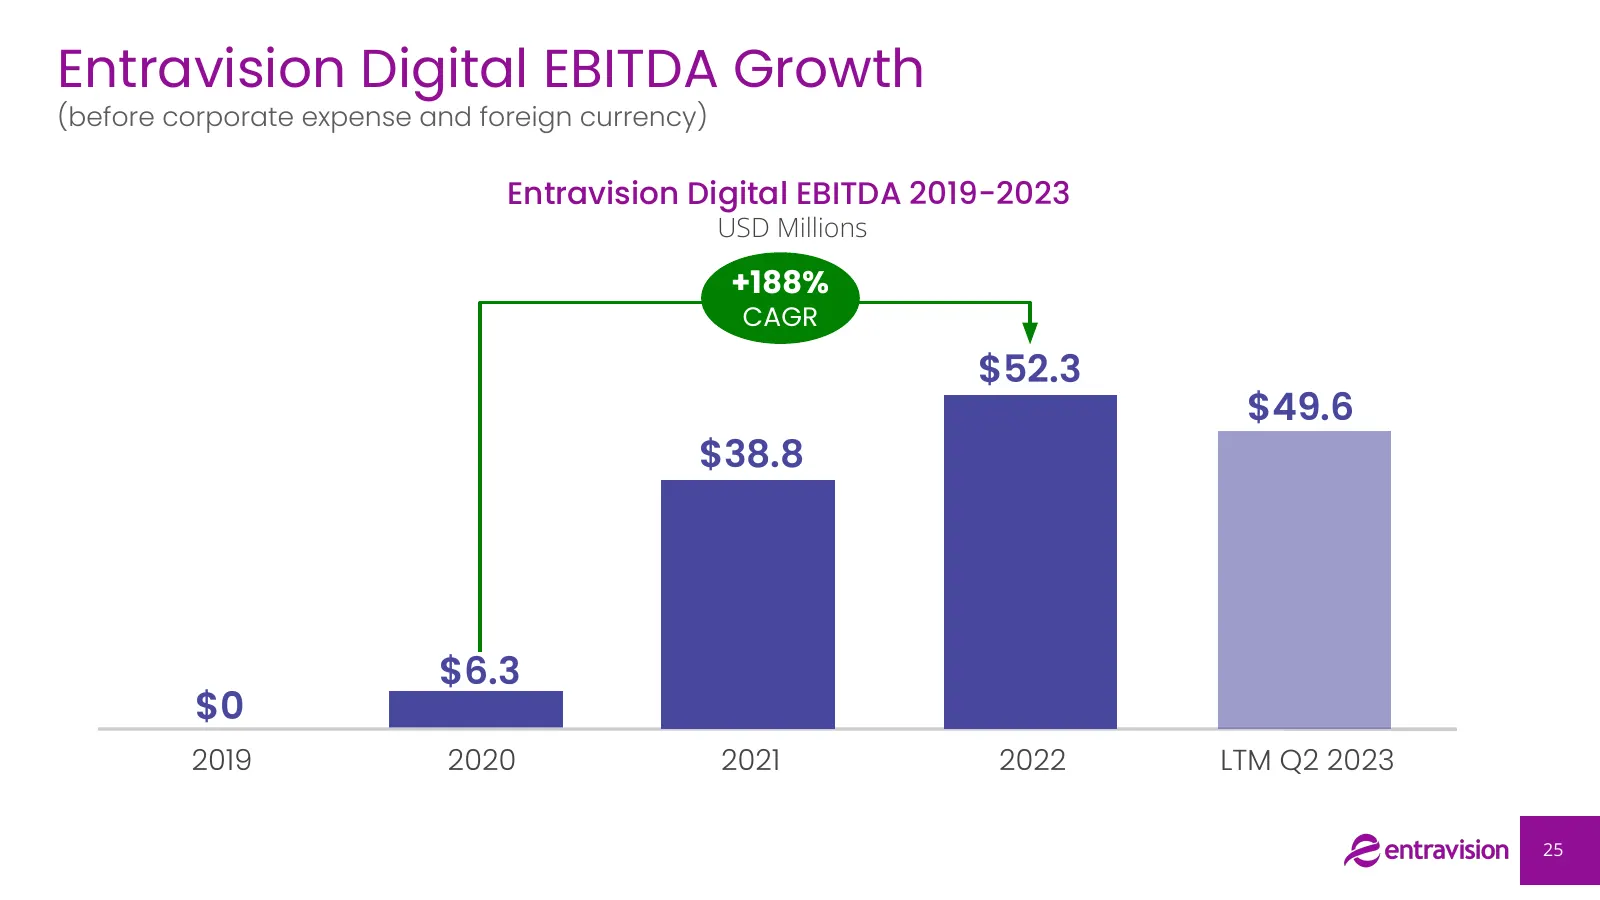
Slide 25: Entravision Digital EBITDA Growth
Entravision Digital EBITDA Growth (before corporate expense and foreign currency) Entravision Digital EBITDA 2019-2023 USD Millions +188% CAGR $52.3 $49.6 $38.8 $6.3 $0 2019 2020 2021 2022 LTM Q2 2023 25
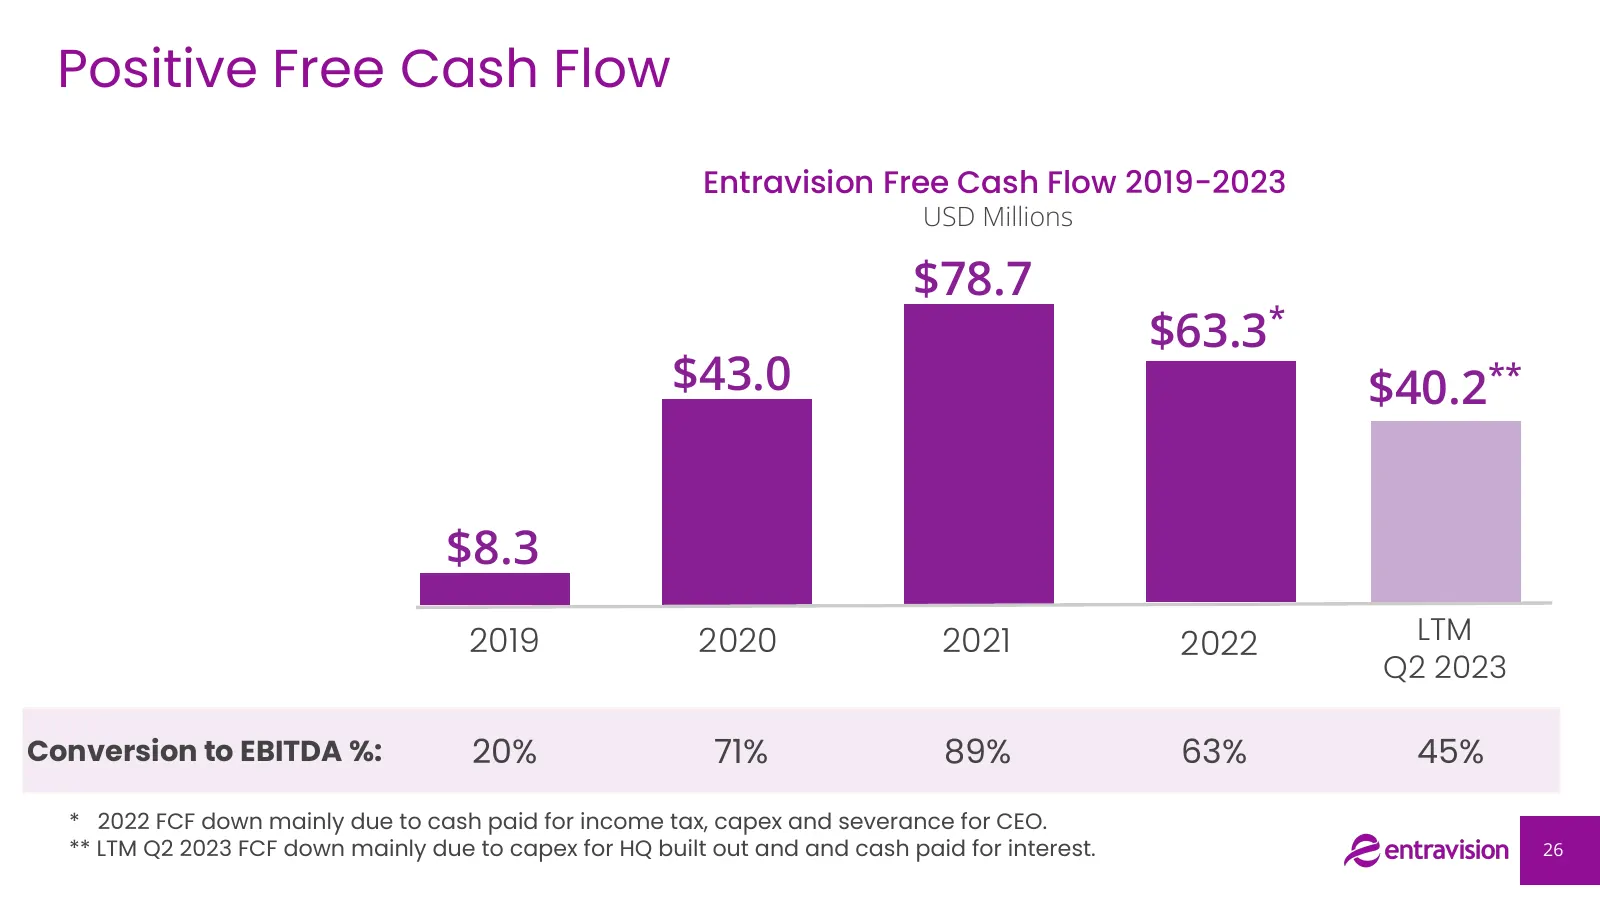
Slide 26: Positive Free Cash Flow
Positive Free Cash Flow Entravision Free Cash Flow 2019-2023 USD Millions $78.7 $63.3* $43.0 $40.2** $8.3 2019 2020 2021 2022 LTM Q2 2023 Conversion to EBITDA %: 20% 71% 89% 63% 45% * 2022 FCF down mainly due to cash paid for income tax, capex and severance for CEO. ** LTM Q2 2023 FCF down mainly du
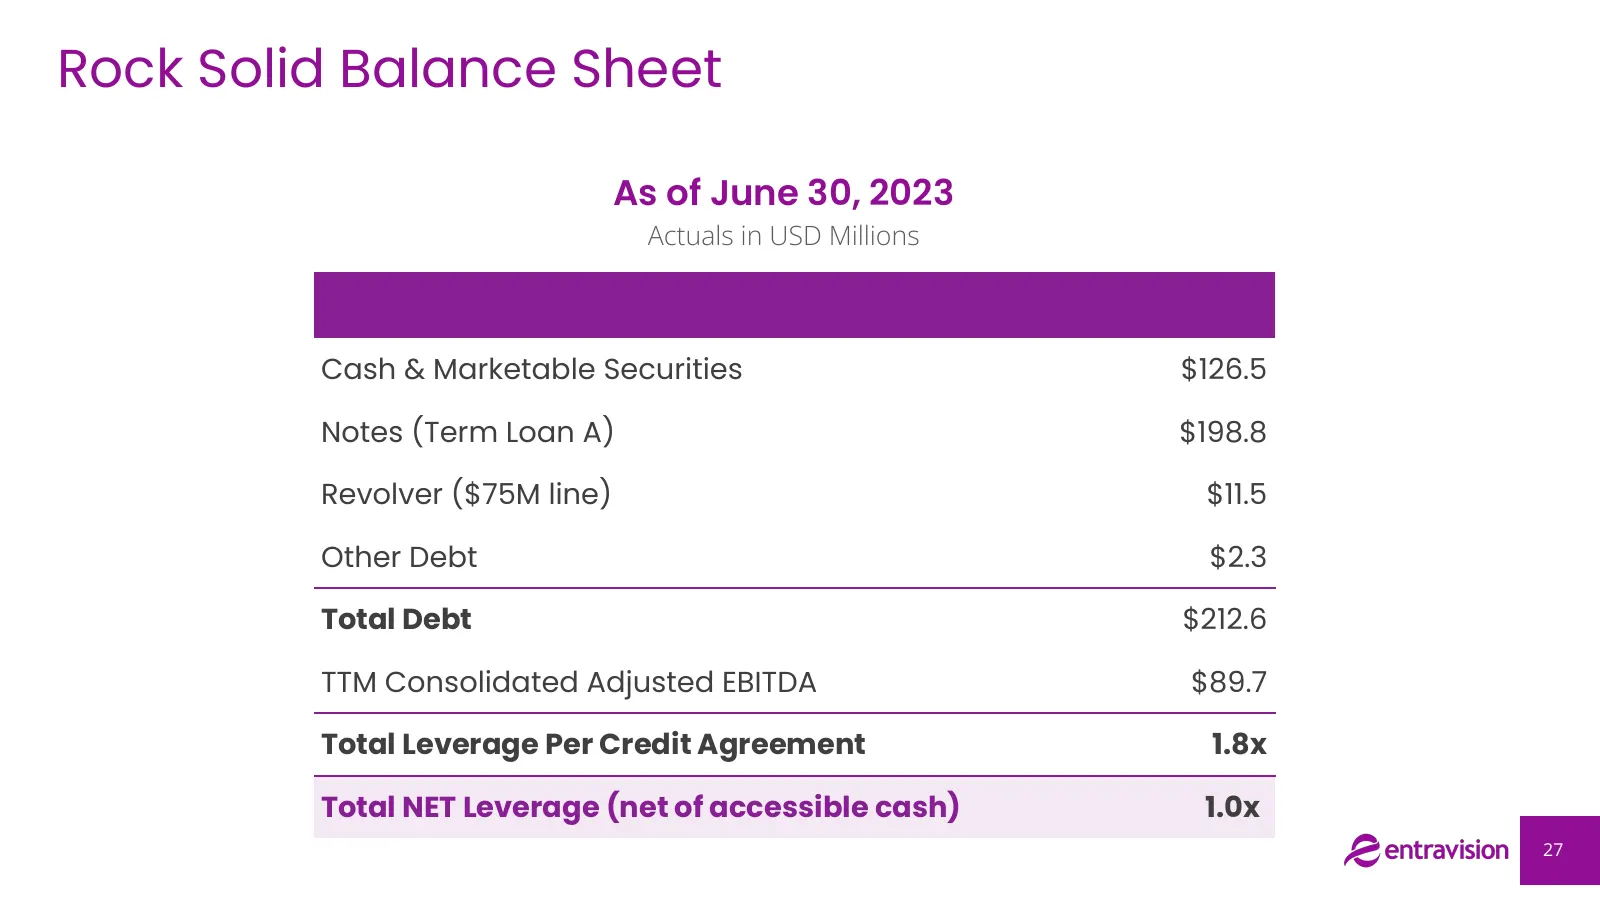
Slide 27: Rock Solid Balance Sheet
Rock Solid Balance Sheet As of June 30, 2023 Actuals in USD Millions Cash & Marketable Securities $126.5 Notes (Term Loan A) $198.8 Revolver ($75M line) $11.5 Other Debt $2.3 Total Debt $212.6 TTM Consolidated Adjusted EBITDA $89.7 Total Leverage Per Credit Agreement 1.8x Total NET Leverage (net of
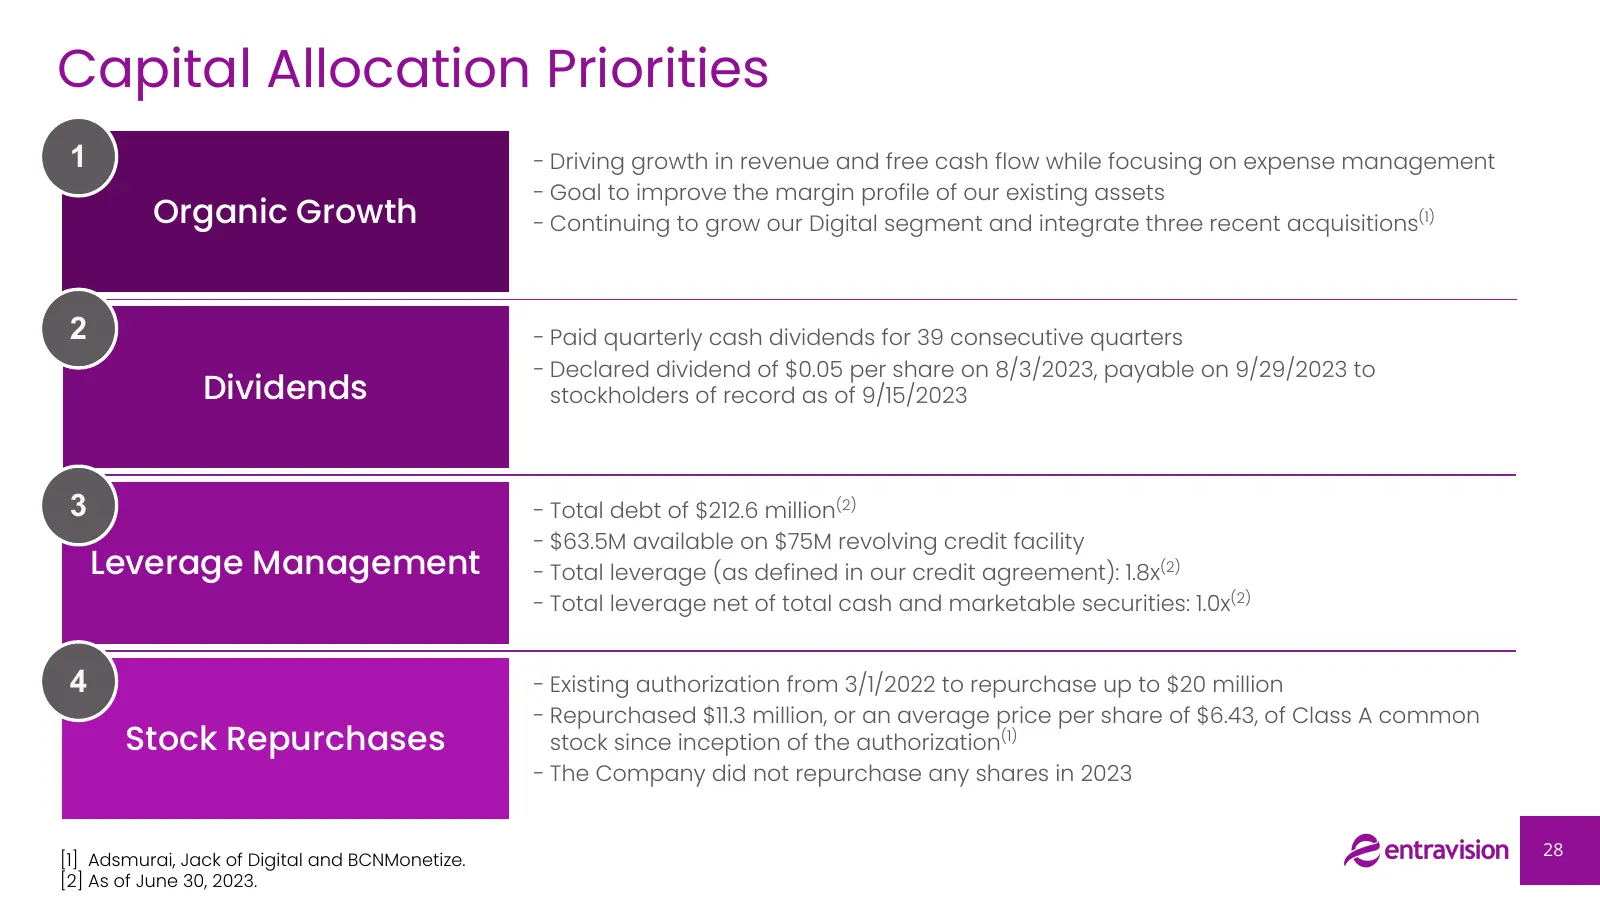
Slide 28: Capital Allocation Priorities
Capital Allocation Priorities 1 - Driving growth in revenue and free cash flow while focusing on expense management - Goal to improve the margin profile of our existing assets Organic Growth - Continuing to grow our Digital segment and integrate three recent acquisitions(1) 2 - Paid quarterly cash d
Slide 29: Appendix
=> ici GROWTH, Ae entravision | sk PURPOSE Appendix
Slide 30: Growth in Political Ad Revenue
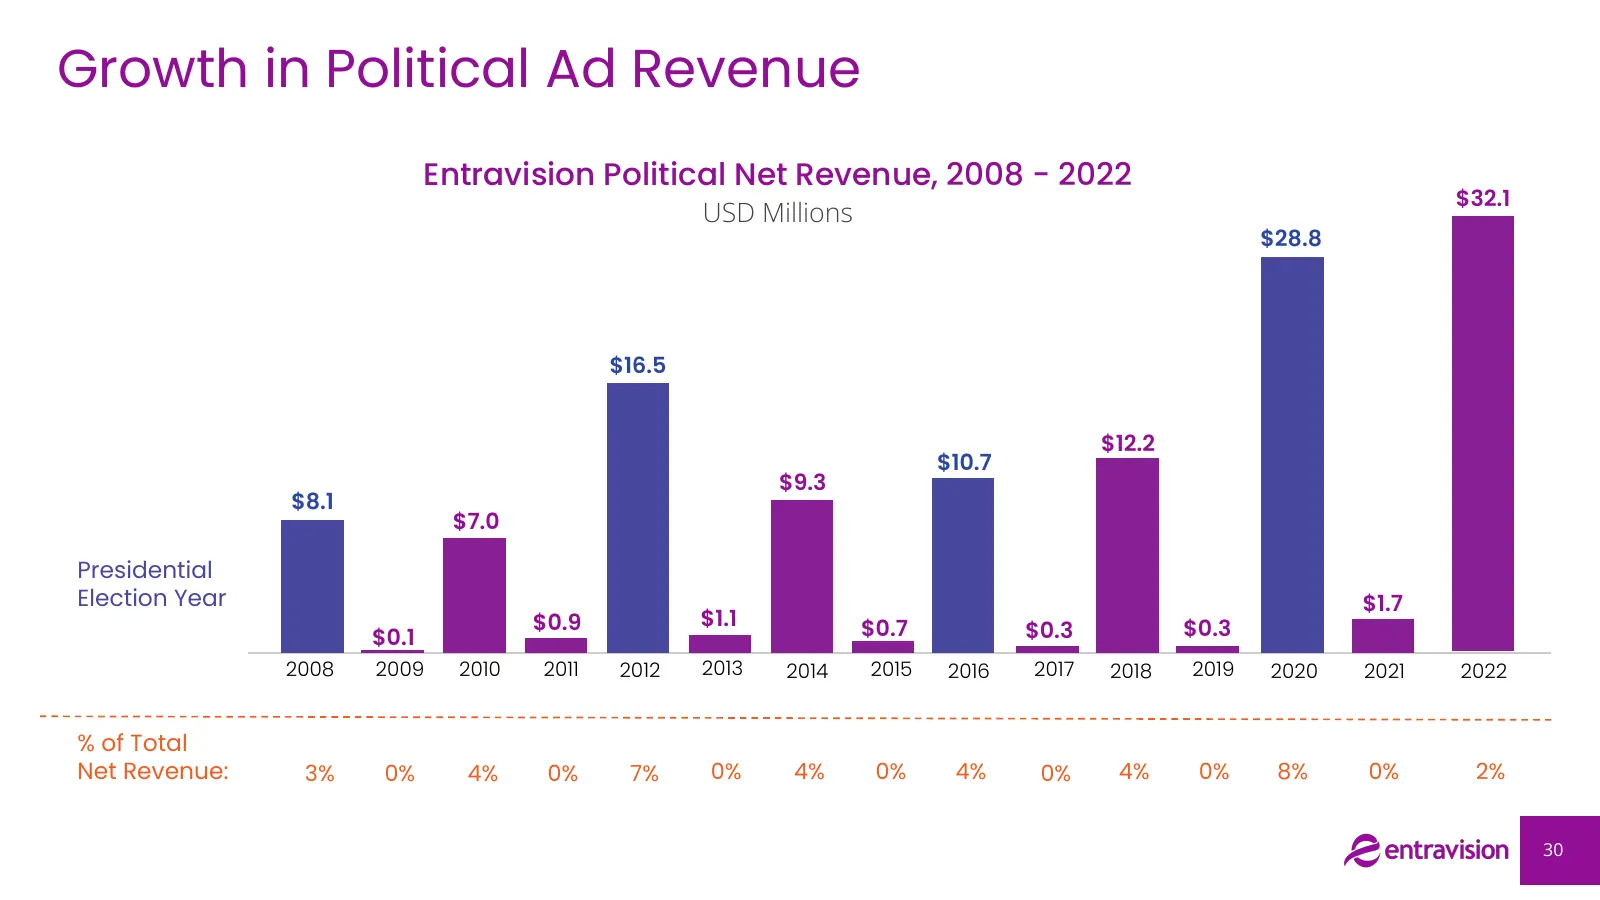
Growth in Political Ad Revenue Entravision Political Net Revenue, 2008 - 2022 $32.1 USD Millions $28.8 $16.5 $12.2 $10.7 $9.3 $8.1 $7.0 Presidential Election Year $1.7 $0.9 $1.1 $0.7 $0.3 $0.1 $0.3 2008 2009 2010 2011 2012 2013 2014 2015 2016 2017 2018 2019 2020 2021 2022 % of Total Net Revenue: 3%
Slide 31: $275M New Credit Facility as of March 2023
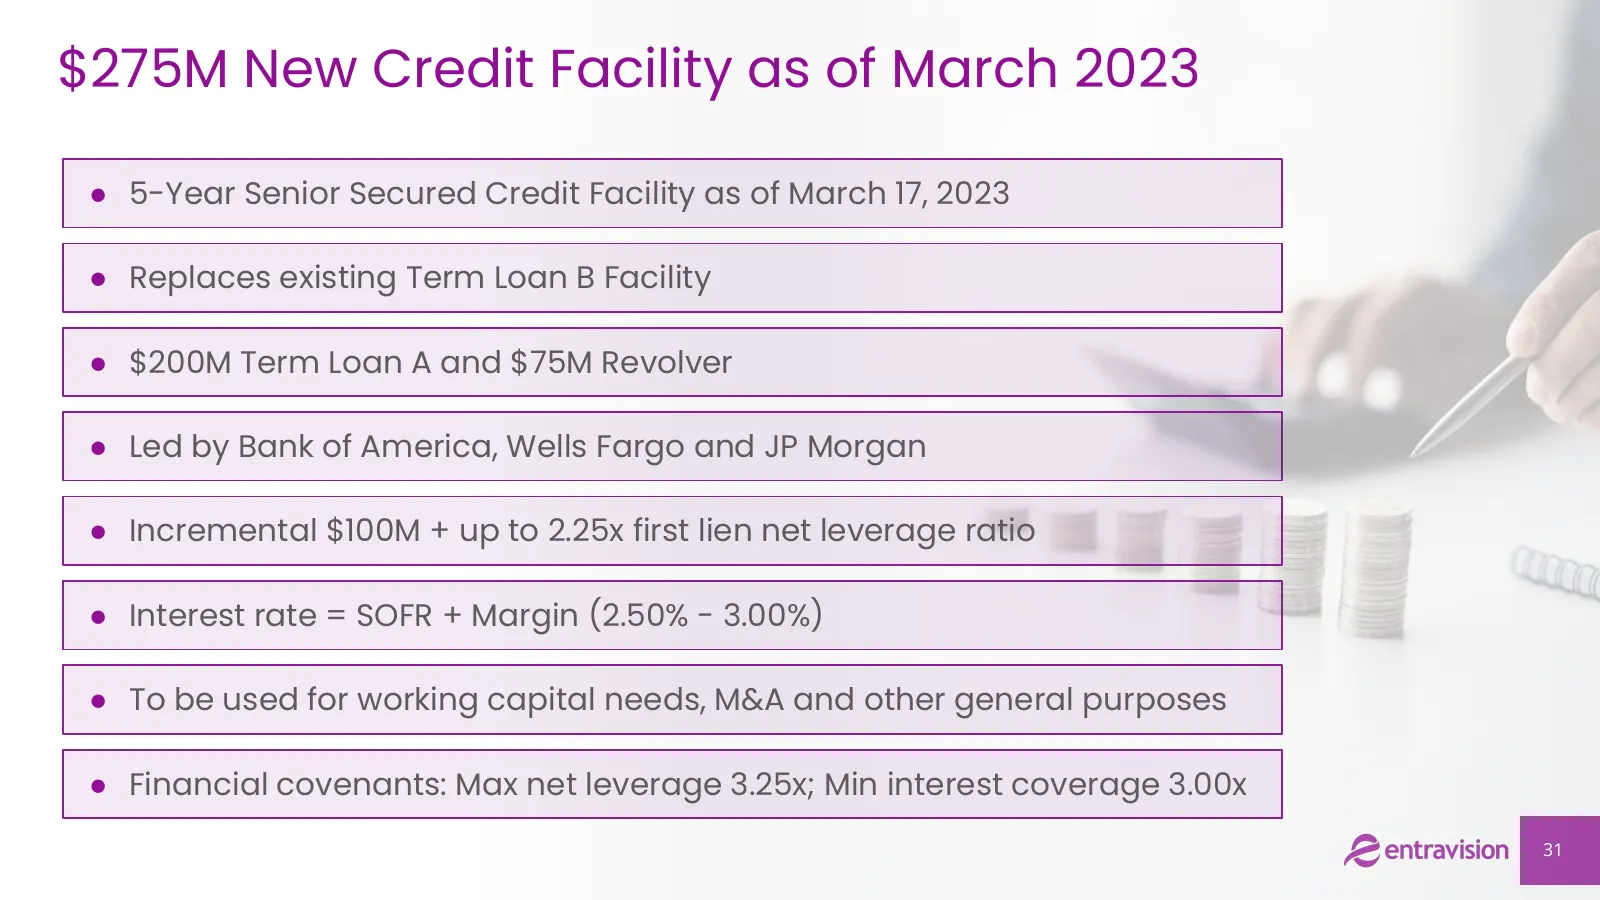
$275M New Credit Facility as of March 2023 ● 5-Year Senior Secured Credit Facility as of March 17, 2023 ● Replaces existing Term Loan B Facility ● $200M Term Loan A and $75M Revolver ● Led by Bank of America, Wells Fargo and JP Morgan ● Incremental $100M + up to 2.25x first lien net leverage ratio ●
Slide 32: Significant Global Digital Ad Industry Growth
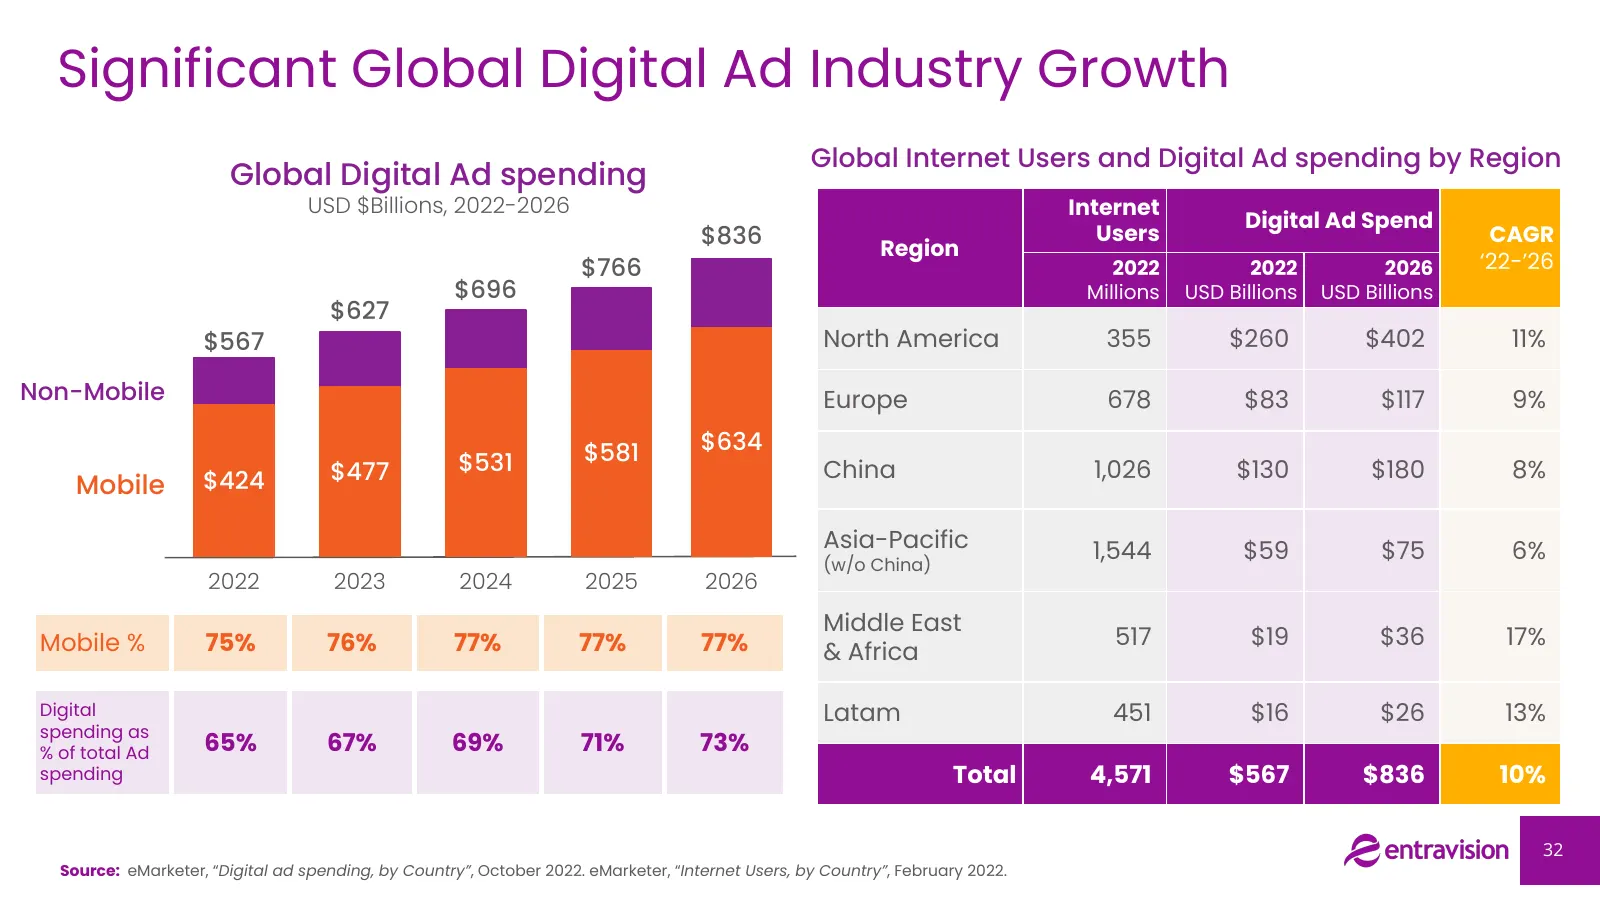
Significant Global Digital Ad Industry Growth Global Internet Users and Digital Ad spending by Region Global Digital Ad spending USD $Billions, 2022-2026 Internet Digital Ad Spend $836 Users CAGR Region $766 2022 2022 2026 ‘22-’26 $696 Millions USD Billions USD Billions $627 $567 North America 355 $
Slide 33: A Sub-Saharan African Digital Marketing Leader
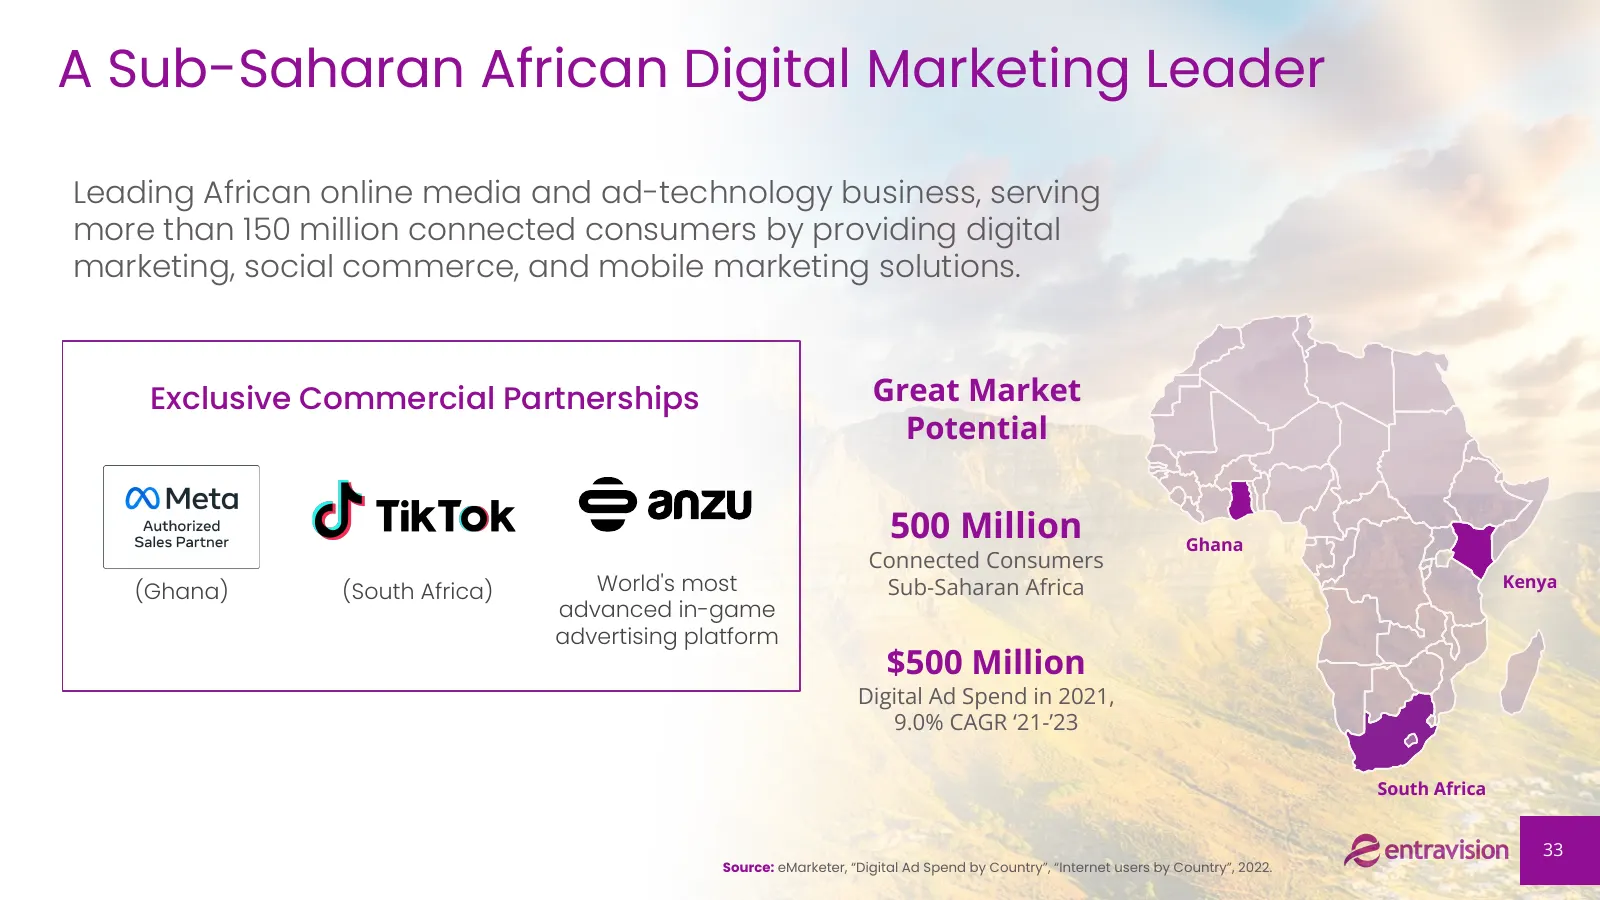
A Sub-Saharan African Digital Marketing Leader Leading African online media and ad-technology business, serving more than 150 million connected consumers by providing digital marketing, social commerce, and mobile marketing solutions. Exclusive Commercial Partnerships Great Market Potential 500 Mill
Slide 34: Digitally Transformed at the Core
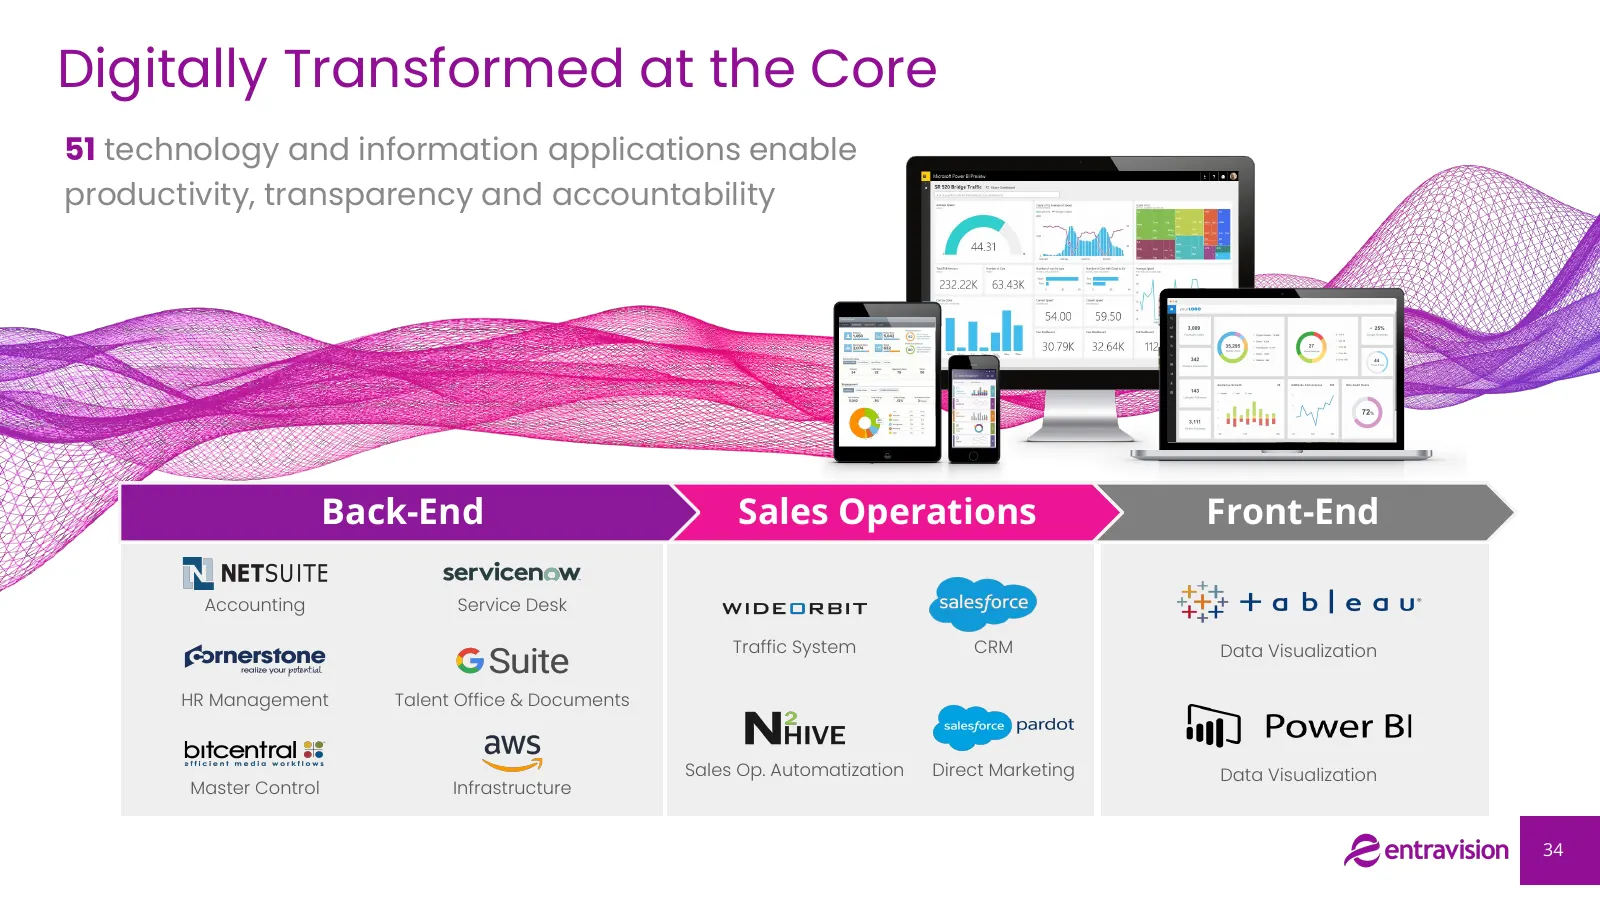
Digitally Transformed at the Core 51 technology and information applications enable productivity, transparency and accountability Back-End Sales Operations Front-End Accounting Service Desk Traffic System CRM Data Visualization HR Management Talent Office & Documents Sales Op. Automatization Direct
Slide 35: Top Ranked Local News
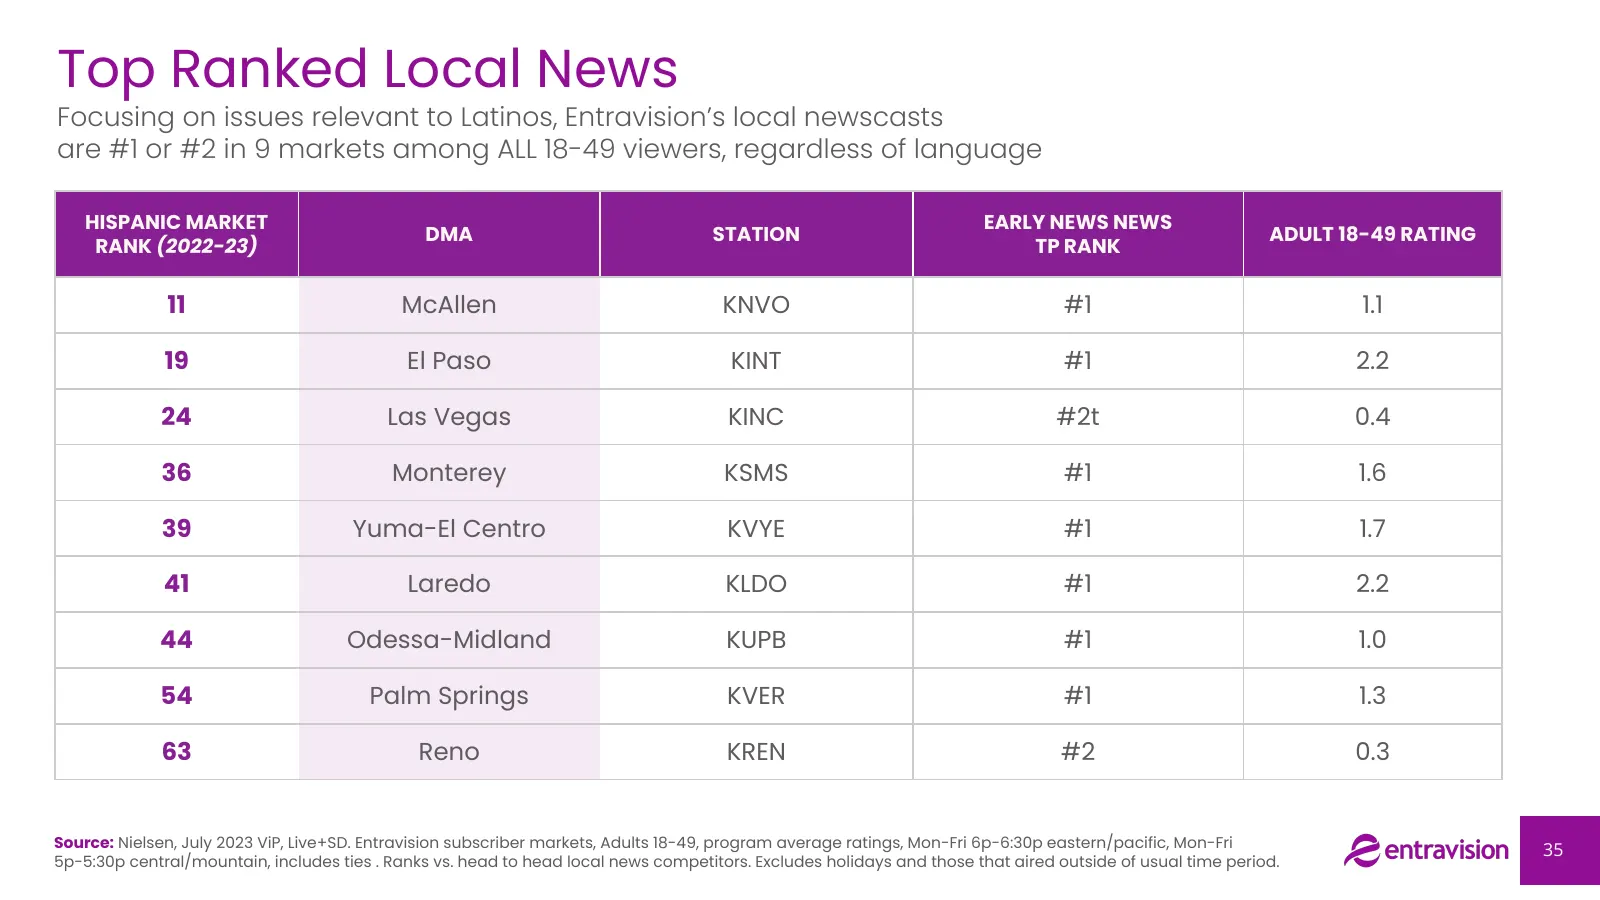
Top Ranked Local News Focusing on issues relevant to Latinos, Entravision’s local newscasts are #1 or #2 in 9 markets among ALL 18-49 viewers, regardless of language HISPANIC MARKET EARLY NEWS NEWS DMA STATION ADULT 18-49 RATING RANK (2022-23) TP RANK 11 McAllen KNVO #1 1.1 19 El Paso KINT #1 2.2 24
Slide 36: Significant and Growing US Latino Market
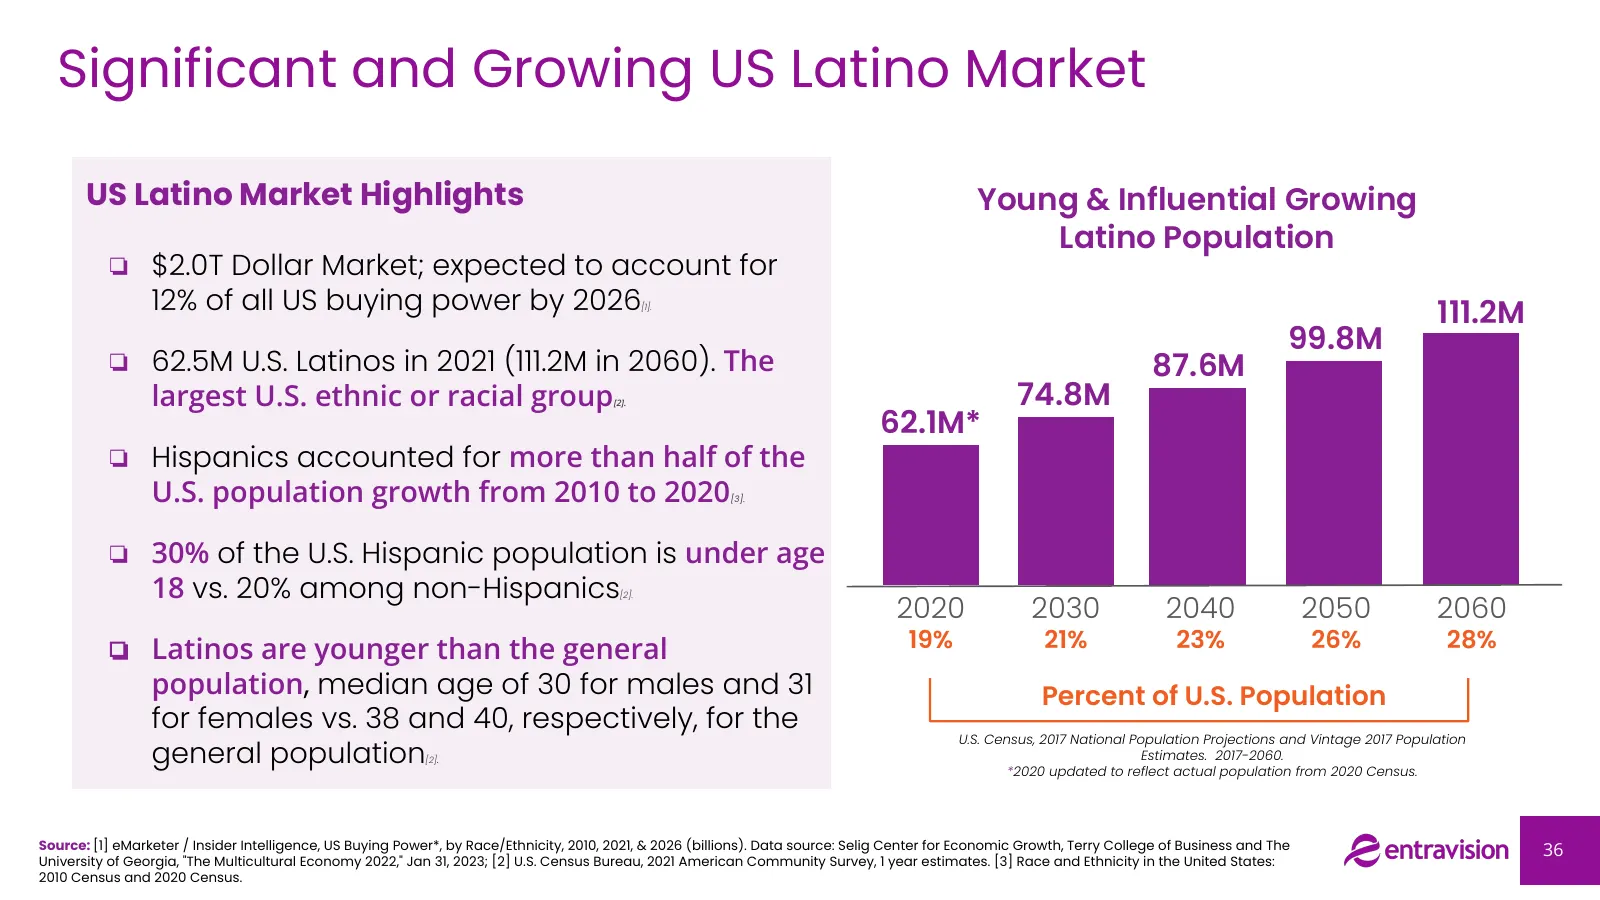
Significant and Growing US Latino Market US Latino Market Highlights Young & Influential Growing Latino Population ❏ $2.0T Dollar Market; expected to account for 12% of all US buying power by 2026 [1]. 111.2M 99.8M ❏ 62.5M U.S. Latinos in 2021 (111.2M in 2060). The 87.6M largest U.S. ethnic or racia
Slide 37: EVC Media Presence in High Density Latino Population Markets Across The US
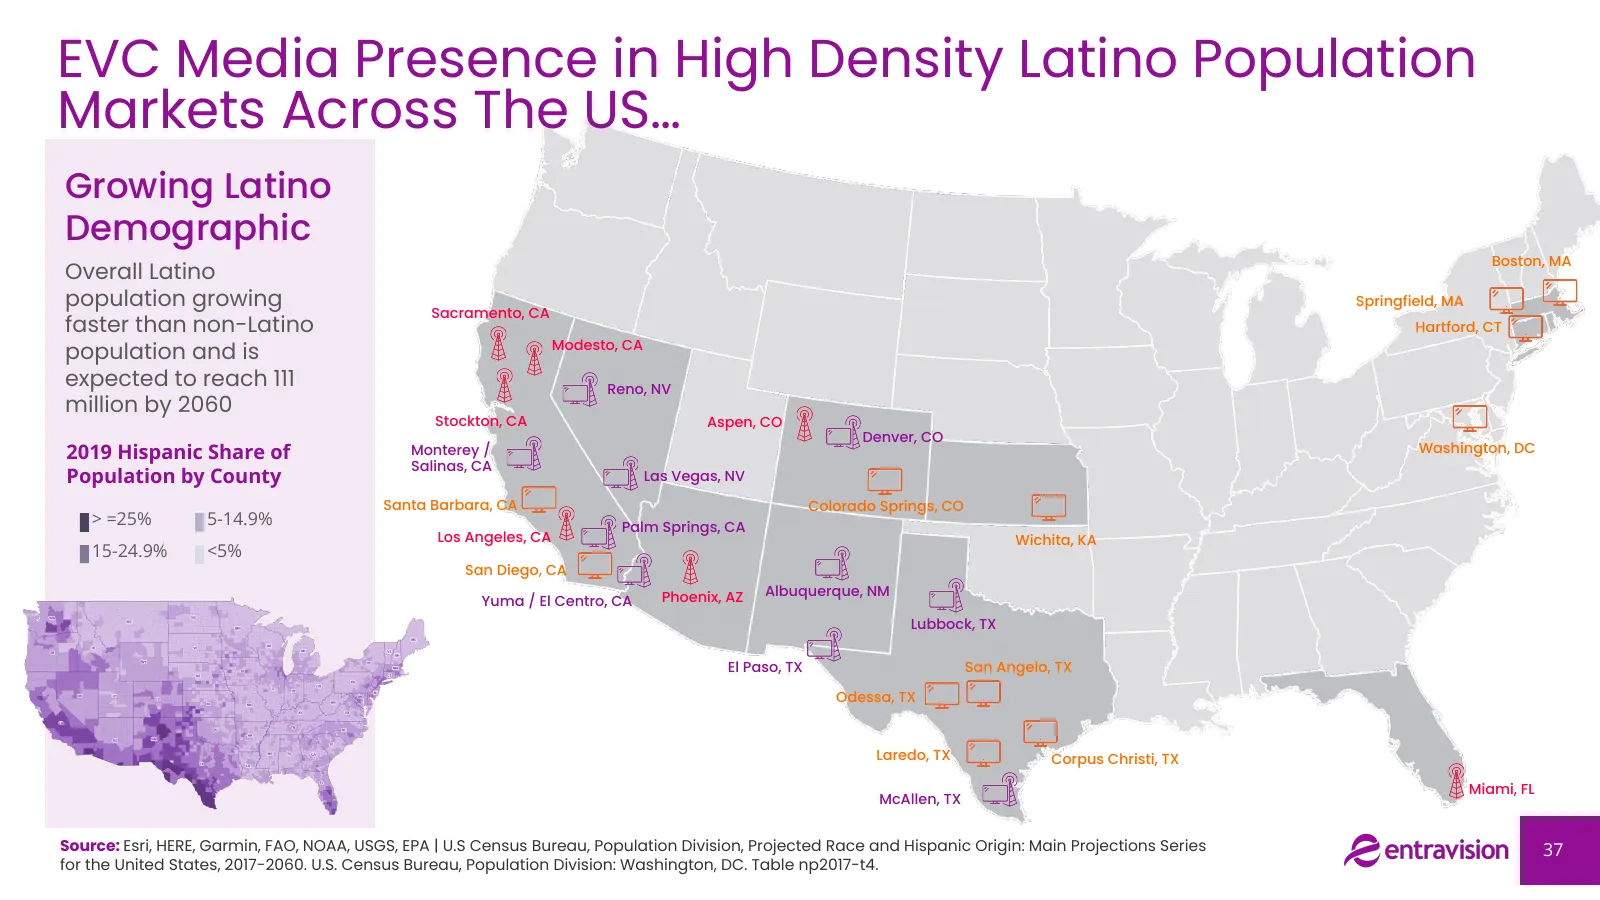
EVC Media Presence in High Density Latino Population Markets Across The US… Growing Latino Demographic Boston, MA Overall Latino population growing Springfield, MA Sacramento, CA faster than non-Latino Hartford, CT Modesto, CA population and is expected to reach 111 Reno, NV million by 2060 Stockton
Slide 38: Television Segment Growth Drivers
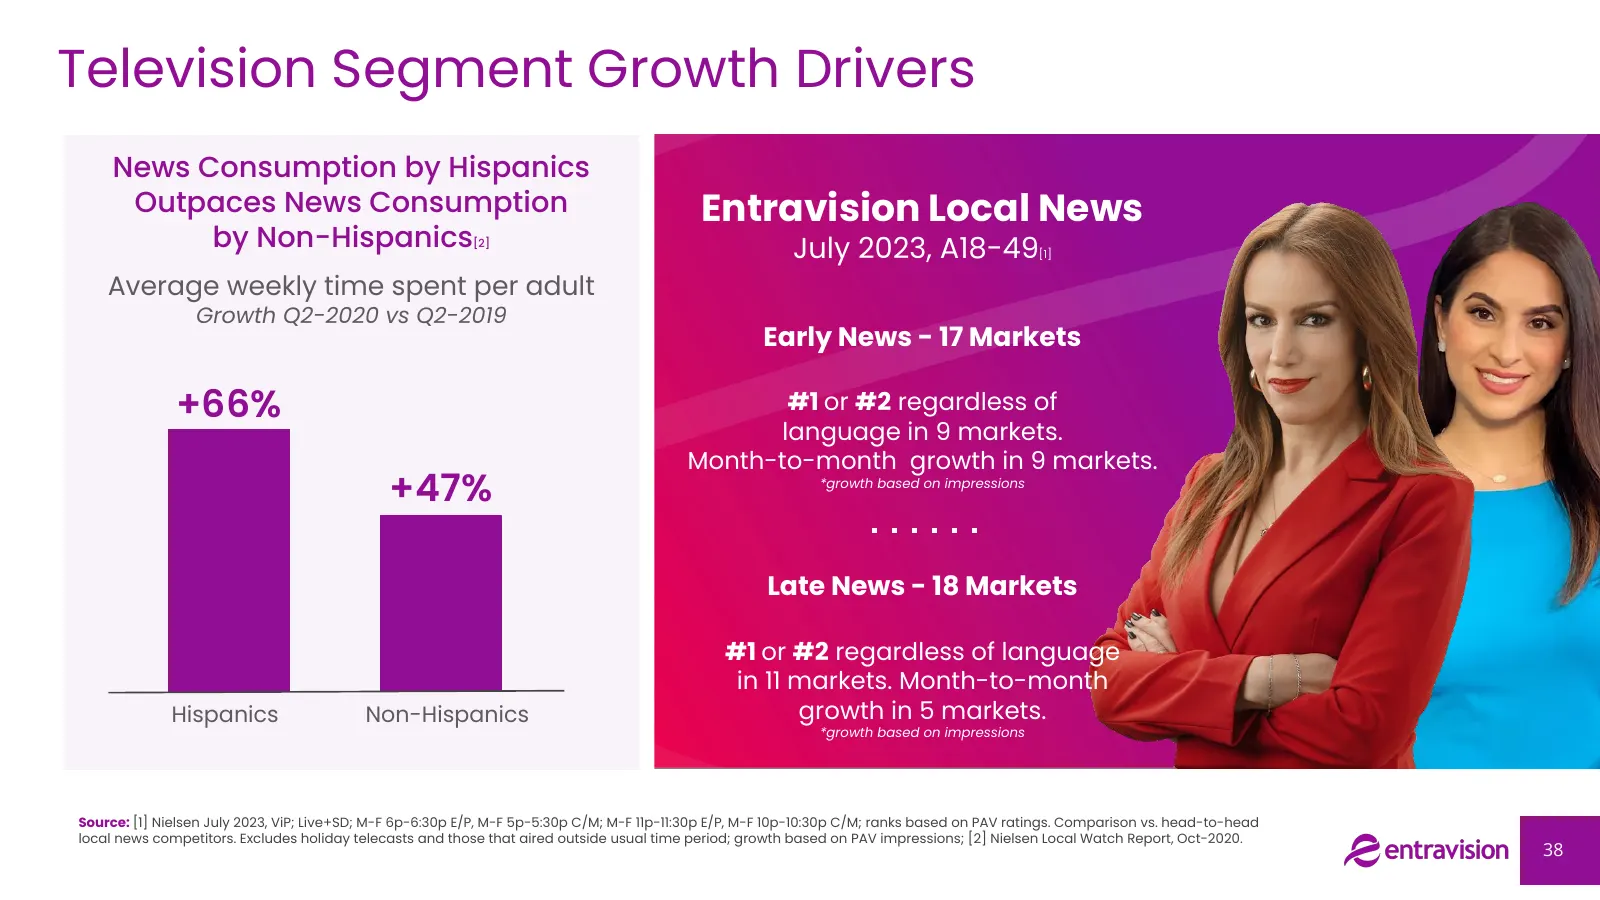
Television Segment Growth Drivers News Consumption by Hispanics Outpaces News Consumption Entravision Local News by Non-Hispanics [2] July 2023, A18-49 [1] Average weekly time spent per adult Growth Q2-2020 vs Q2-2019 Early News - 17 Markets +66% #1 or #2 regardless of language in 9 markets. Month-t
Slide 39: U.S. Hispanic Population Growth
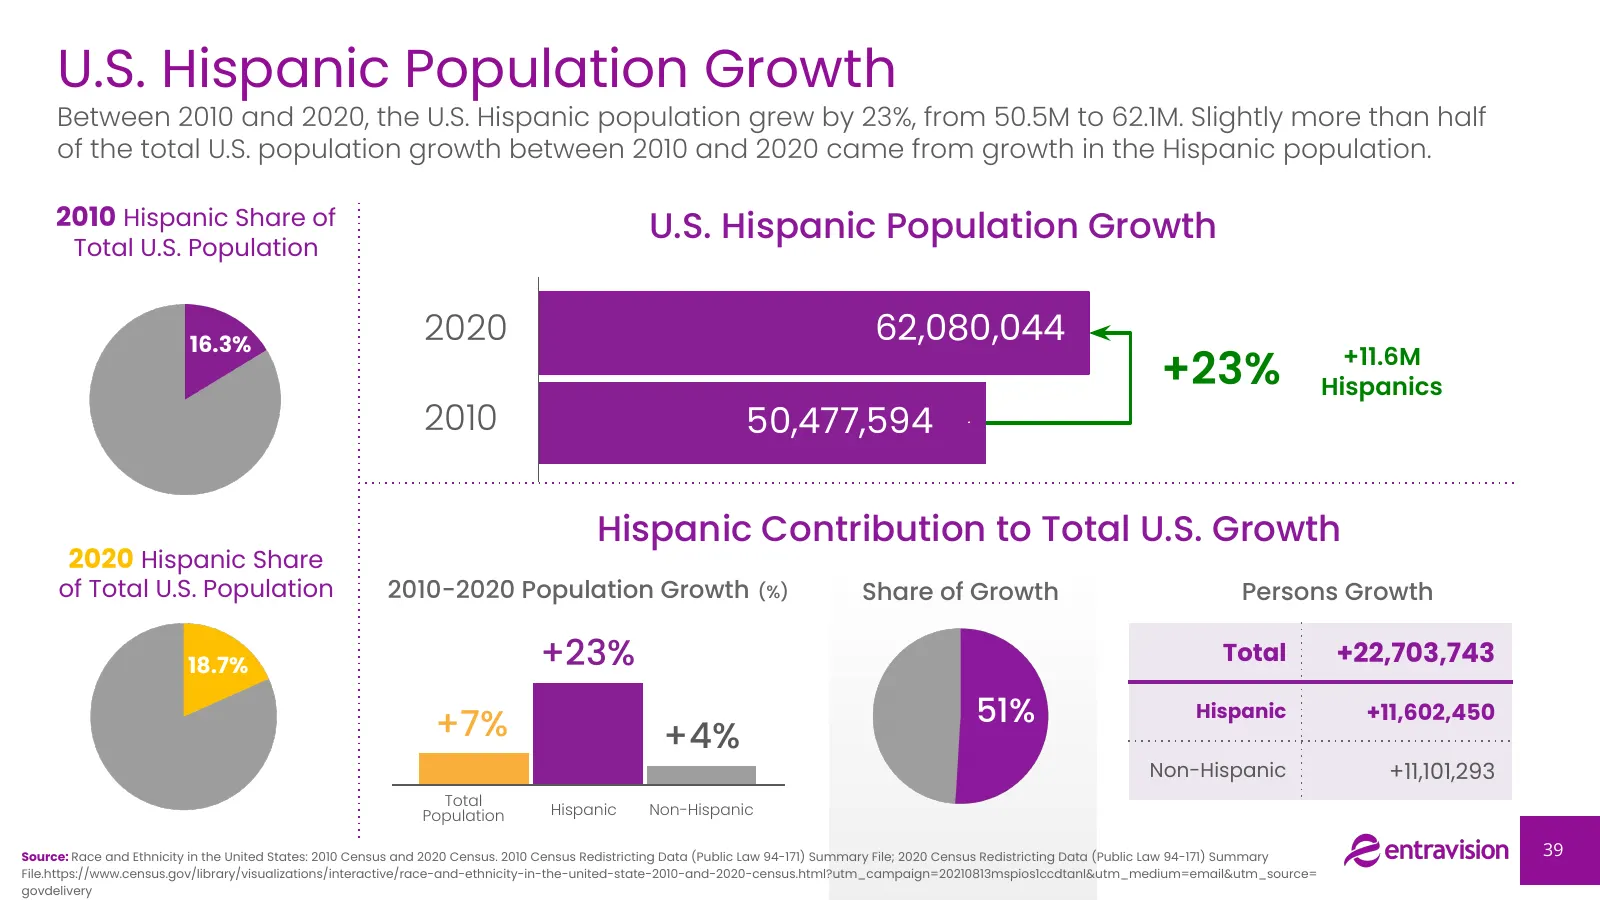
U.S. Hispanic Population Growth Between 2010 and 2020, the U.S. Hispanic population grew by 23%, from 50.5M to 62.1M. Slightly more than half of the total U.S. population growth between 2010 and 2020 came from growth in the Hispanic population. 2010 Hispanic Share of U.S. Hispanic Population Growth
Source: Internet Archive copy of s29.q4cdn.com
More decks from Entravision Communications Corporation
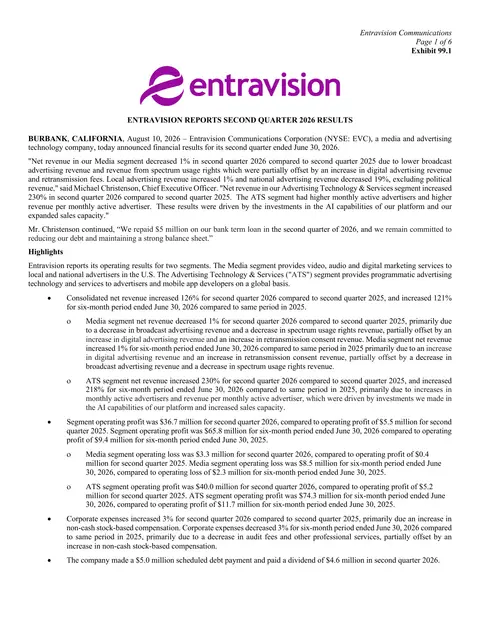 Q2 2026 Earnings Presentation6 slides · Aug 10, 2026
 Investor Presentation (December 2023)37 slides · December 2023
 Southwest IDEAS Conference 202339 slides · November 2023
 Investor Presentation (June 2023)38 slides · June 2023
 Sidoti September Small-Cap Virtual Conference 202235 slides · Sep 21, 2022
 Gabelli 14th Annual Entertainment & Broadcasting Symposium (June 2022)35 slides · Jun 2, 2022