Travelzoo · NASDAQ:TZOO
Travelzoo — Q3 2021 Earnings Presentation
16 slides from Travelzoo's earnings presentation, Oct 29, 2021
Slide 1: Third Quarter 2021 Performance
NASDAQ: TZOO Third Quarter 2021 Performance October 29, 2021
Slide 2: Important Notice to Investors
1 Important Notice to Investors Please read this management presentation together with the Company’s press release issued earlier today announcing the Company’s third quarter 2021 financial results and in conjunction with the Company’s recent Annual Report and Quarterly Results as filed with the Sec
Slide 3: Part 1: Third Quarter 2021 Performance; Part 2: Management Focus
2 Part 1: Third Quarter 2021 Performance Part 2: Management Focus Third Quarter 2021 Performance
Slide 4: Revenue from North America was negatively impacted by press coverage about the COVID-19 Delta variant
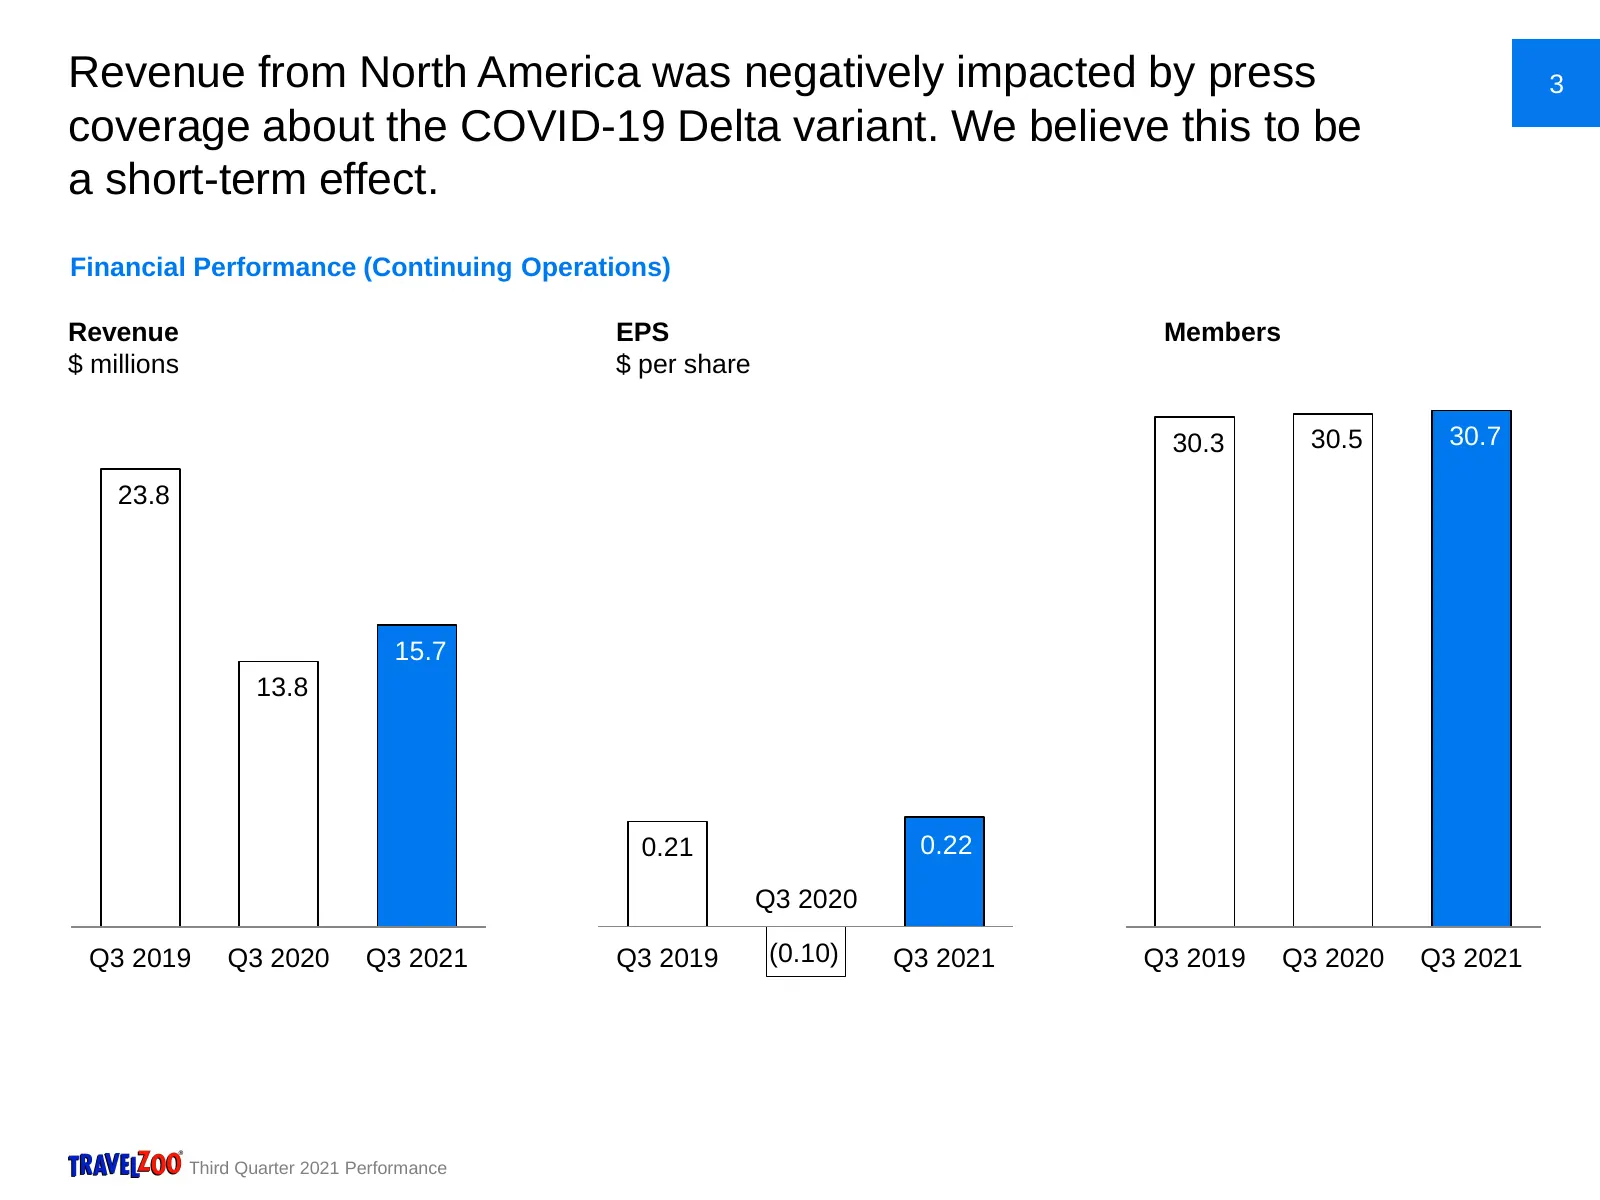
Revenue from North America was negatively impacted by press 3 coverage about the COVID-19 Delta variant. We believe this to be a short-term effect. Financial Performance (Continuing Operations) Revenue EPS Members $ millions $ per share 30.3 30.5 30.7 23.8 15.7 13.8 0.21 0.22 Q3 2020 Q3 2019 Q3 2020
Slide 5: Revenue from Europe grew faster, positively impacting operating income
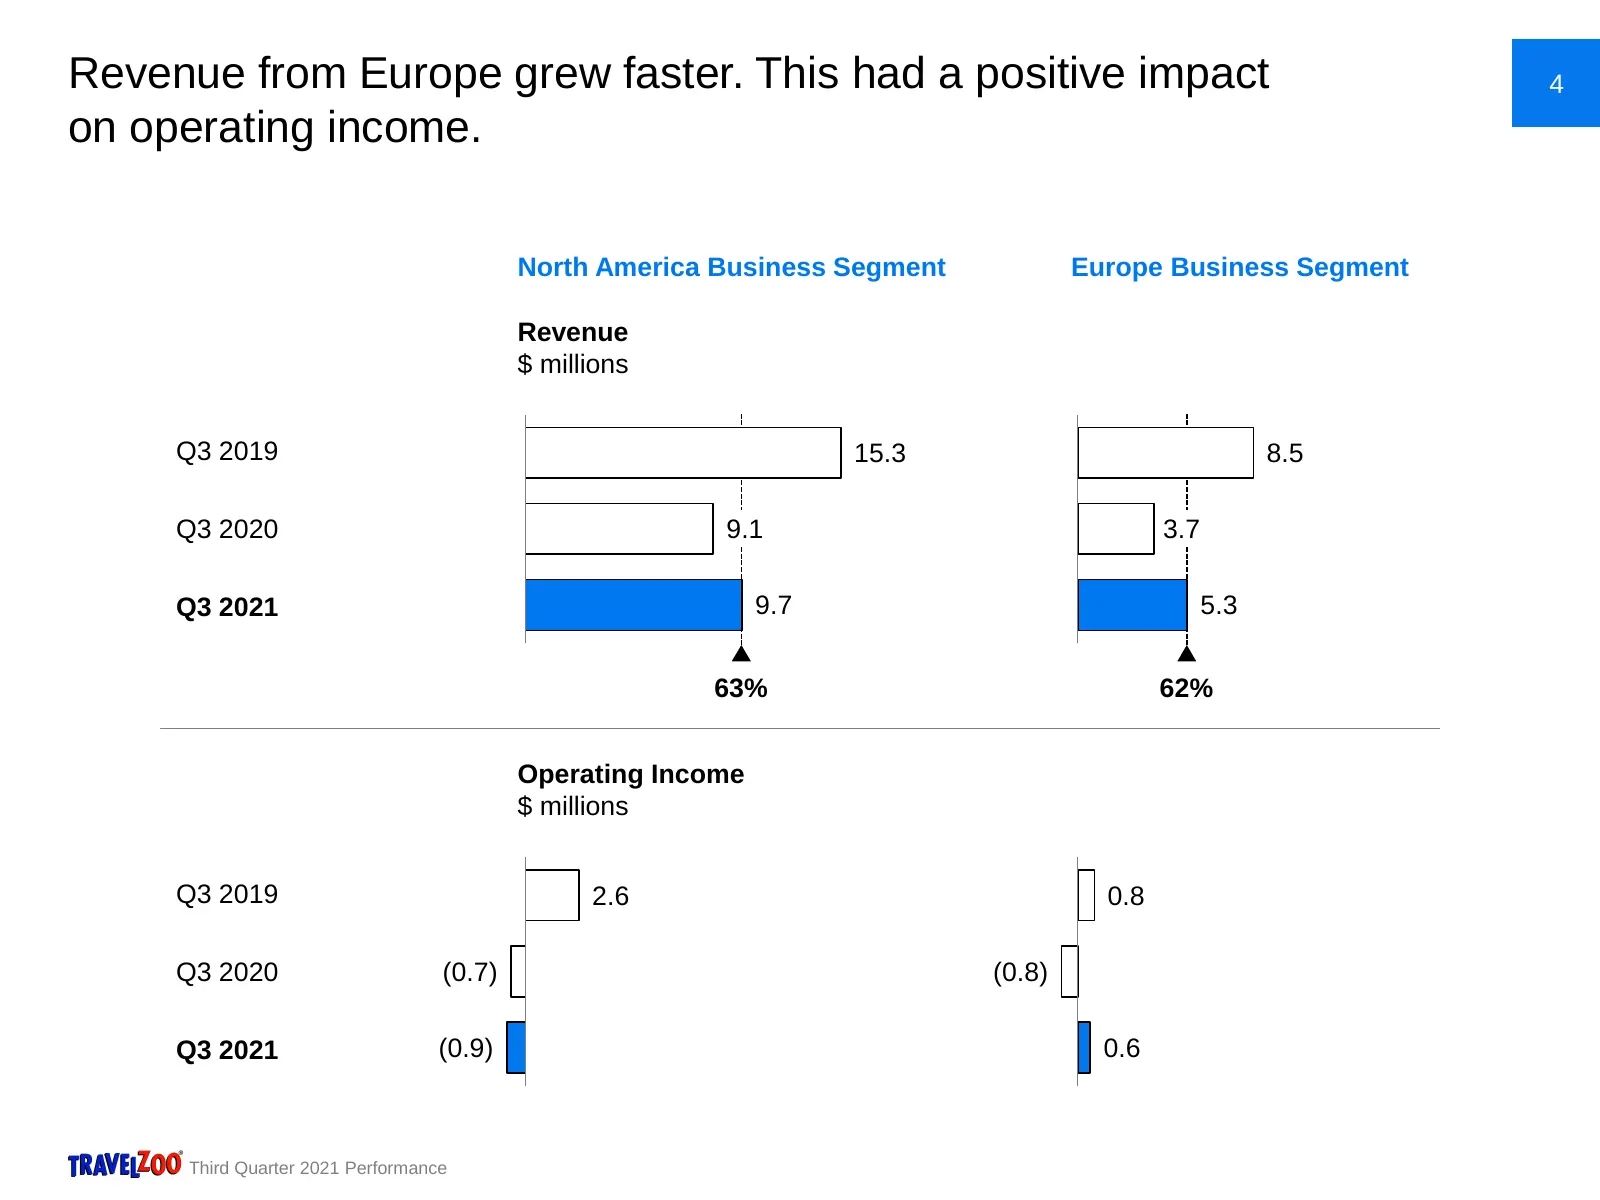
Revenue from Europe grew faster. This had a positive impact 4 on operating income. North America Business Segment Europe Business Segment Revenue $ millions Q3 2019 15.3 8.5 Q3 2020 9.1 3.7 Q3 2021 9.7 5.3 63% 62% Operating Income $ millions Q3 2019 2.6 0.8 Q3 2020 (0.7) (0.8) Q3 2021 (0.9) 0.6 Thir
Slide 6: Non-GAAP operating profit was $1.1 million
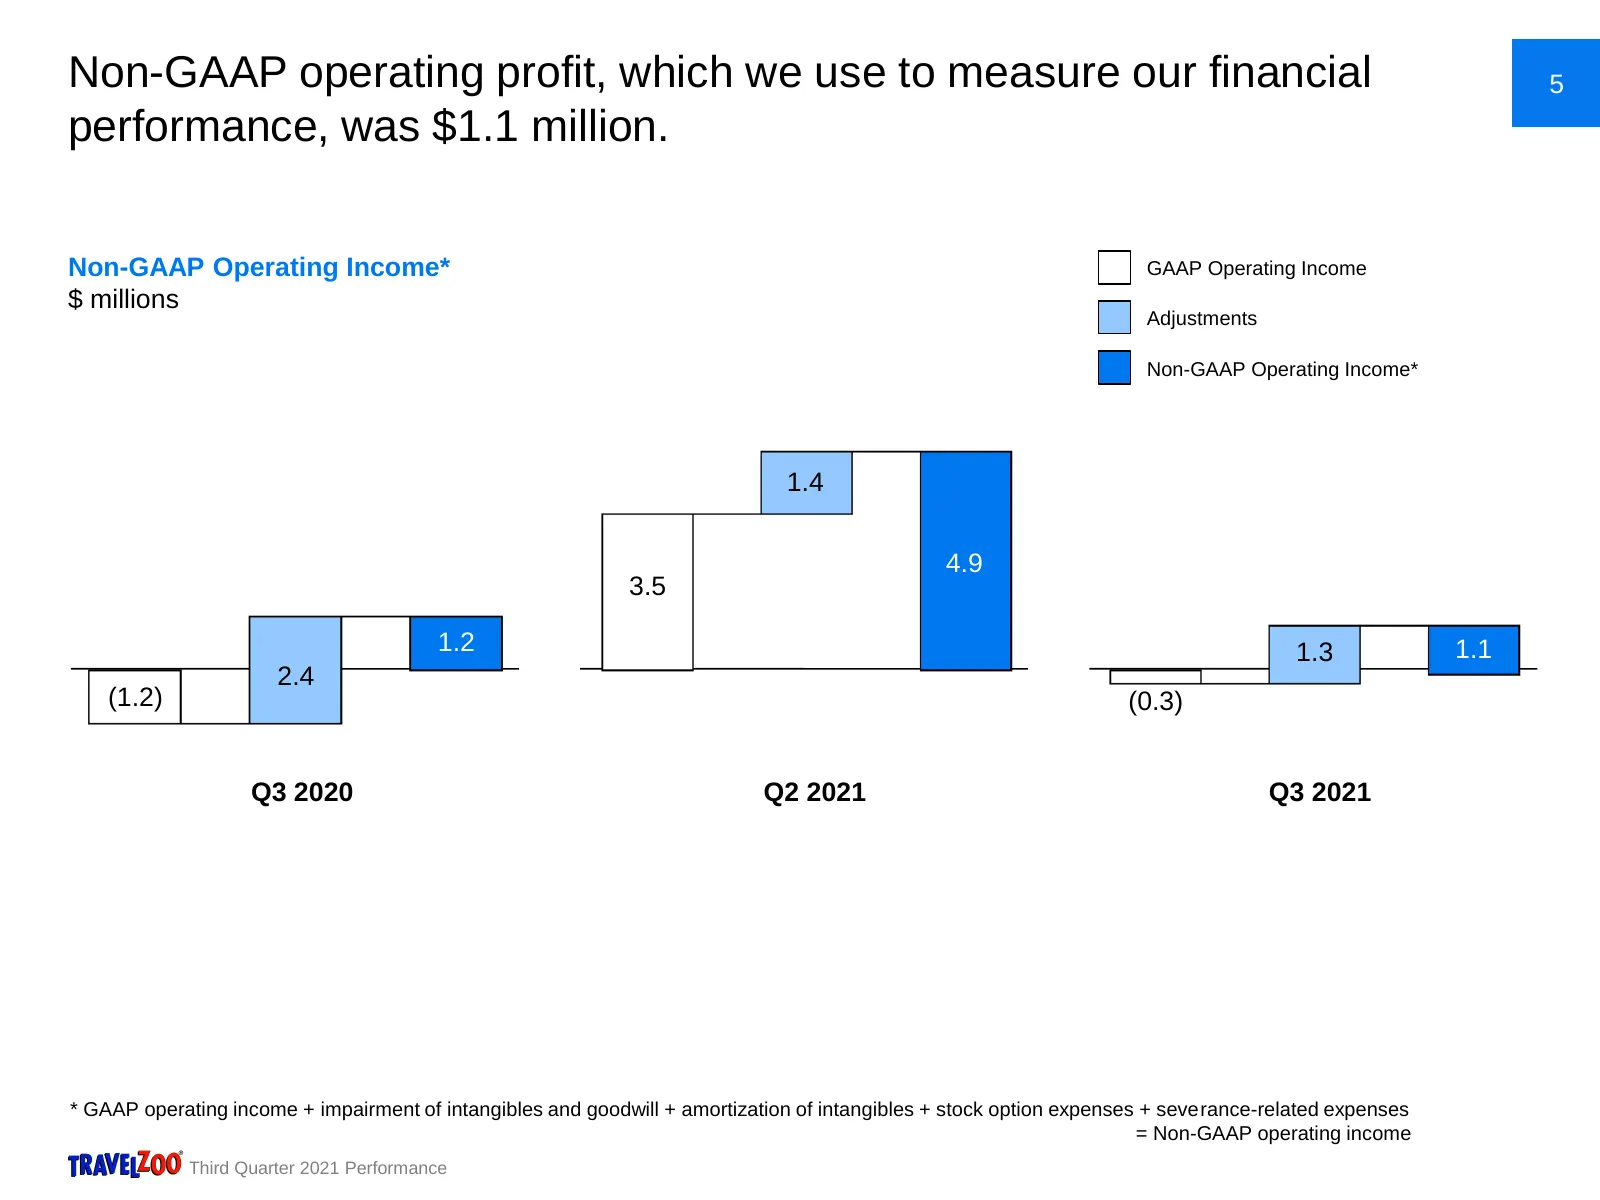
Non-GAAP operating profit, which we use to measure our financial 5 performance, was $1.1 million. Non-GAAP Operating Income* GAAP Operating Income $ millions Adjustments Non-GAAP Operating Income* 1.4 4.9 3.5 1.2 1.3 1.1 2.4 (1.2) (0.3) Q3 2020 Q2 2021 Q3 2021 * GAAP operating income + impairment of
Slide 7: Items excluded in the calculation of Non-GAAP operating profit
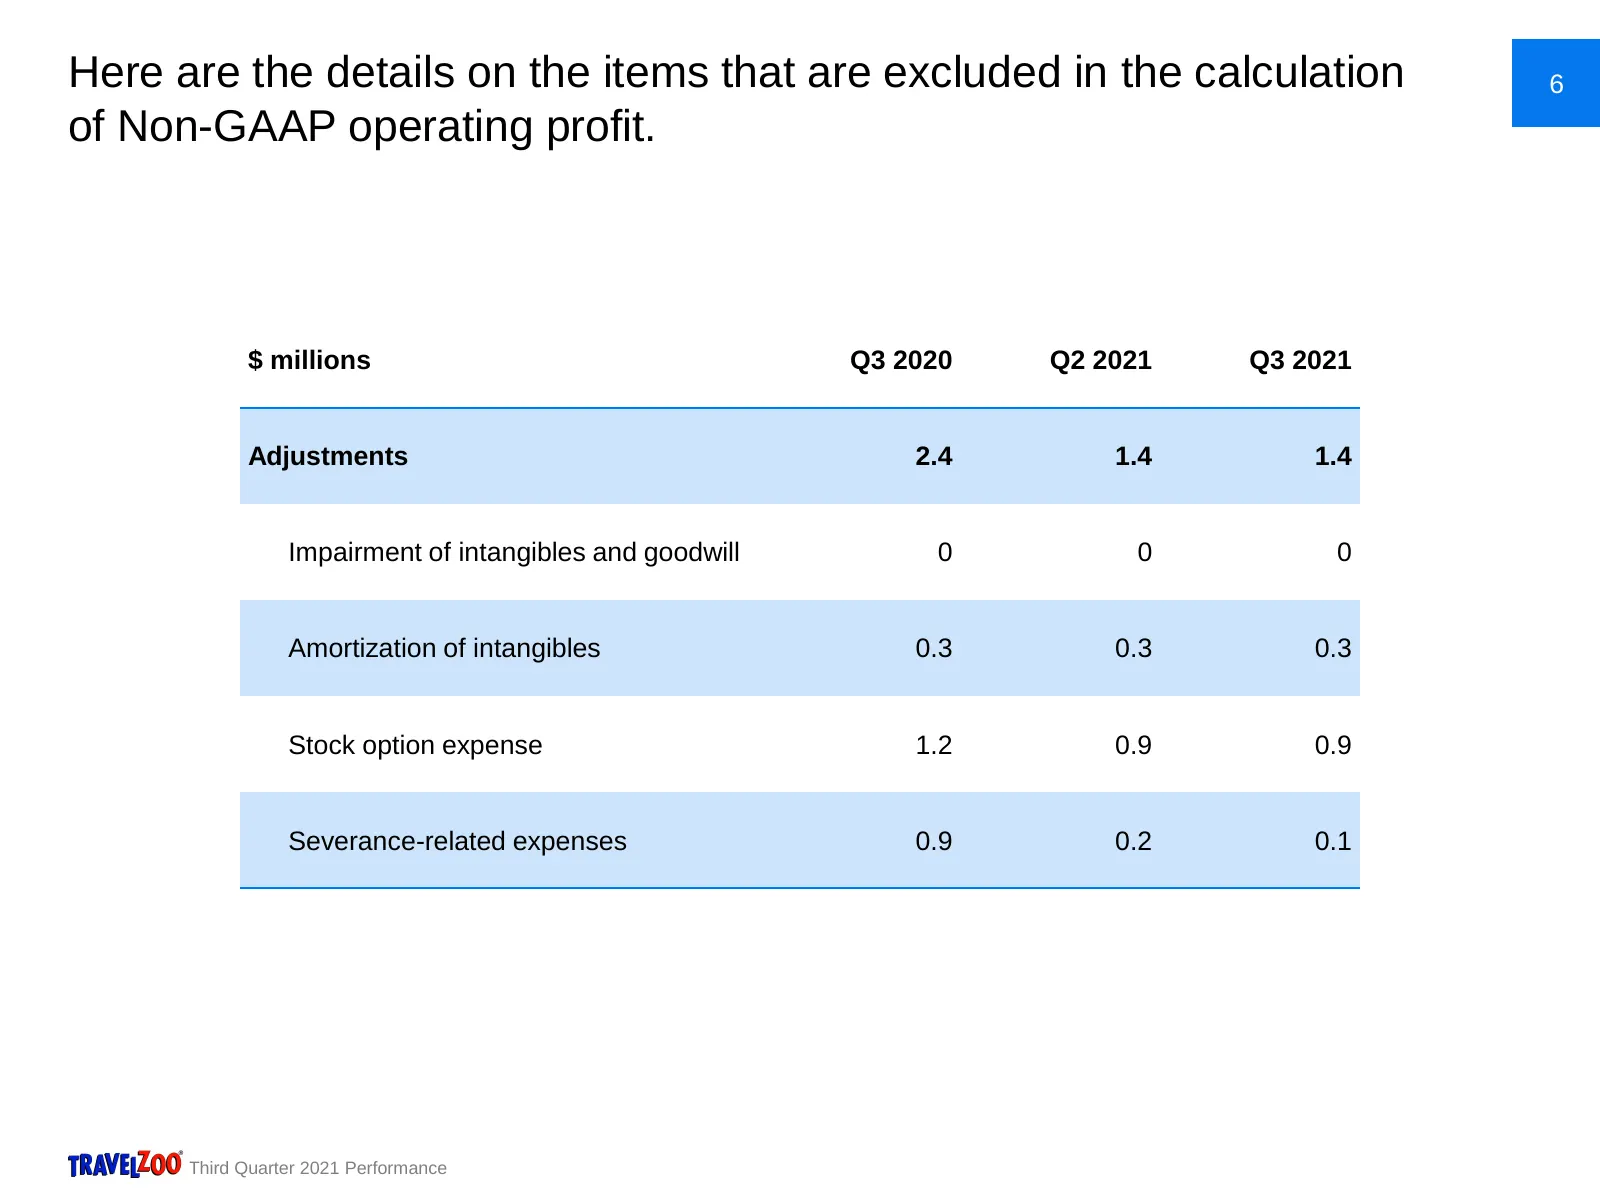
Here are the details on the items that are excluded in the calculation 6 of Non-GAAP operating profit. $ millions Q3 2020 Q2 2021 Q3 2021 Adjustments 2.4 1.4 1.4 Impairment of intangibles and goodwill 0 0 0 Amortization of intangibles 0.3 0.3 0.3 Stock option expense 1.2 0.9 0.9 Severance-related ex
Slide 8: The cash balance reached the expected level
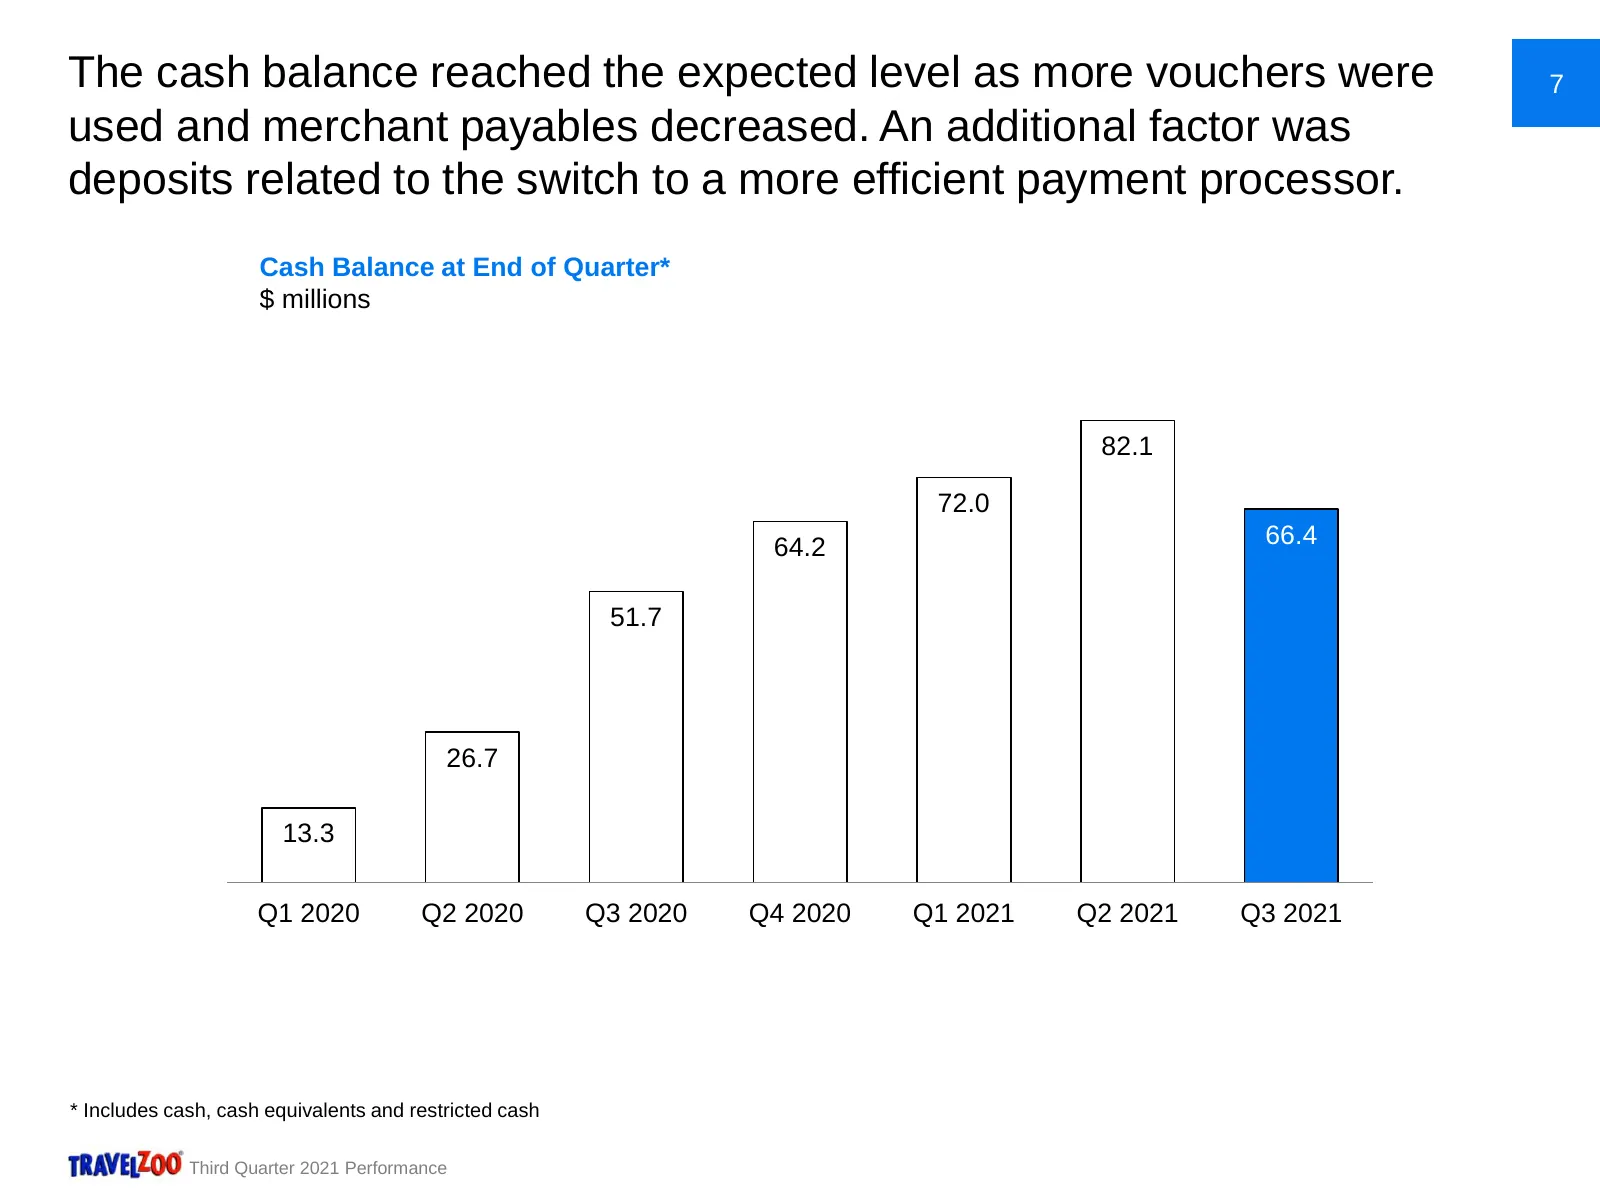
The cash balance reached the expected level as more vouchers were 7 used and merchant payables decreased. An additional factor was deposits related to the switch to a more efficient payment processor. Cash Balance at End of Quarter* $ millions 82.1 72.0 64.2 66.4 51.7 26.7 13.3 Q1 2020 Q2 2020 Q3 20
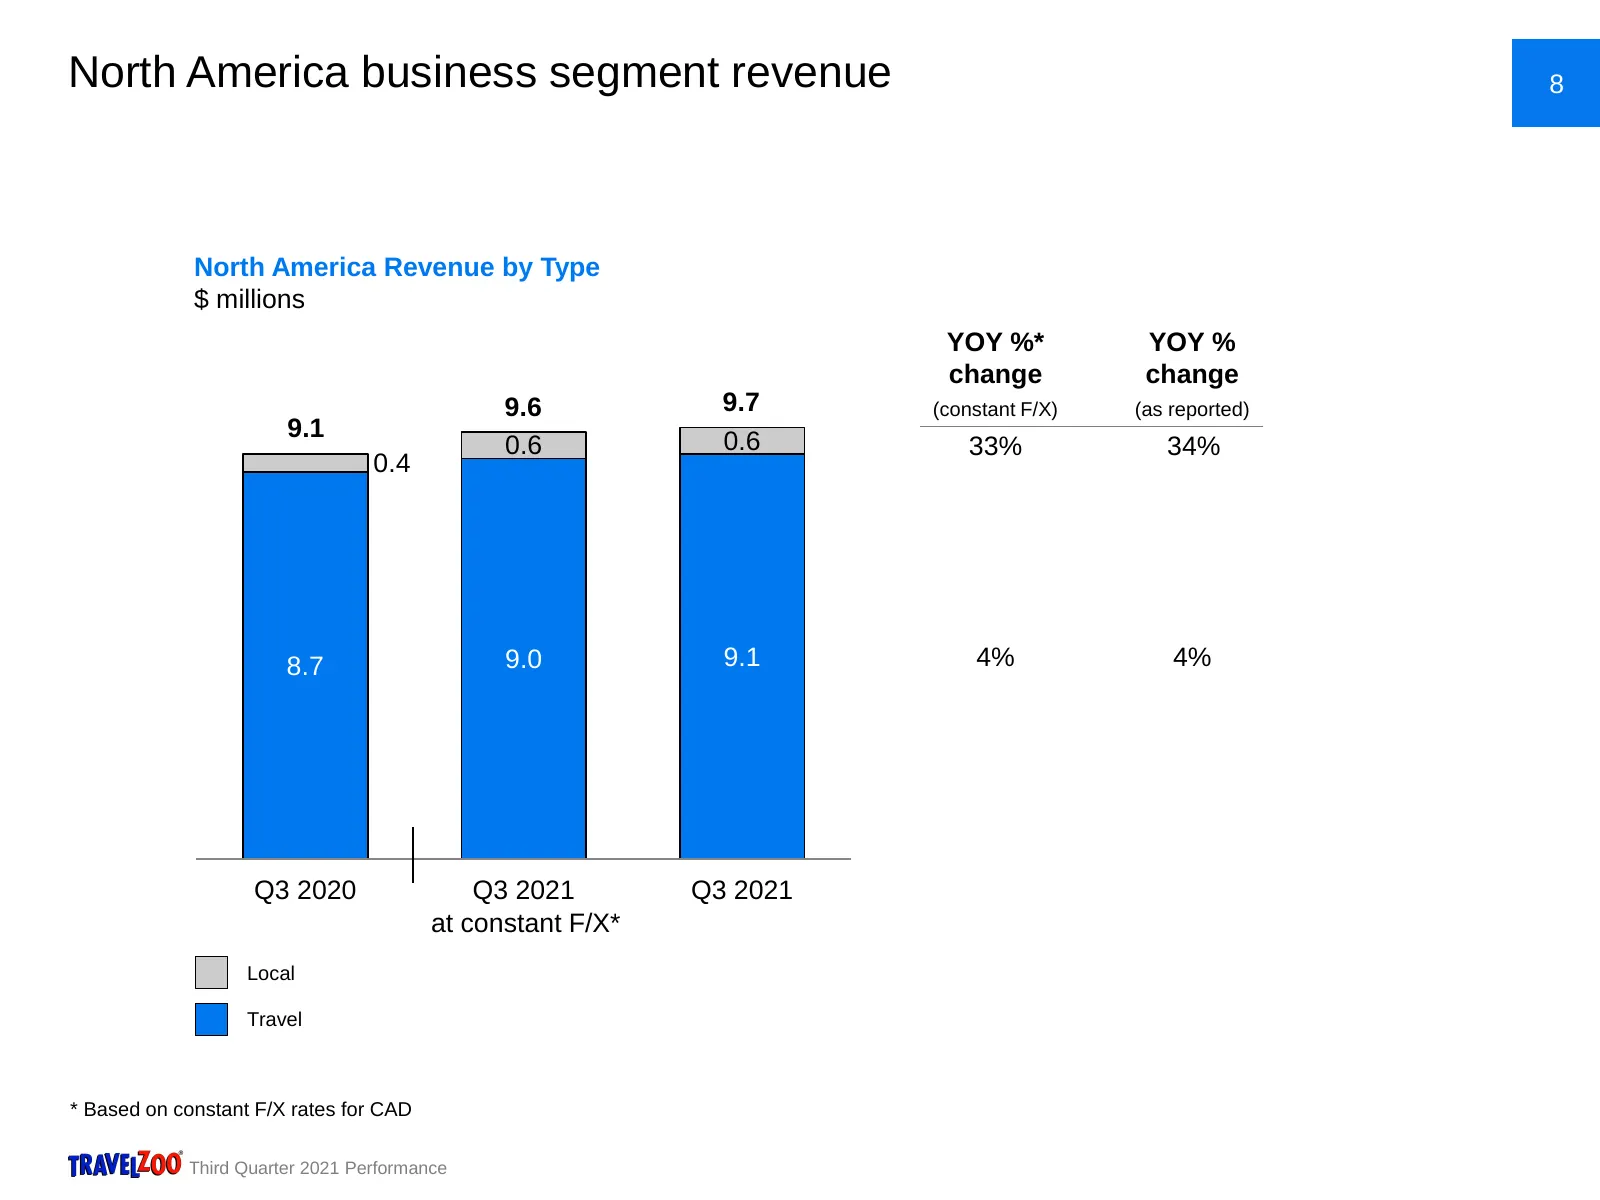
Slide 9: North America business segment revenue
North America business segment revenue 8 North America Revenue by Type $ millions YOY %* YOY % change change 9.6 9.7 (constant F/X) (as reported) 9.1 0.6 0.6 33% 34% 0.4 8.7 9.0 9.1 4% 4% Q3 2020 Q3 2021 Q3 2021 at constant F/X* Local Travel * Based on constant F/X rates for CAD Third Quarter 2021 P
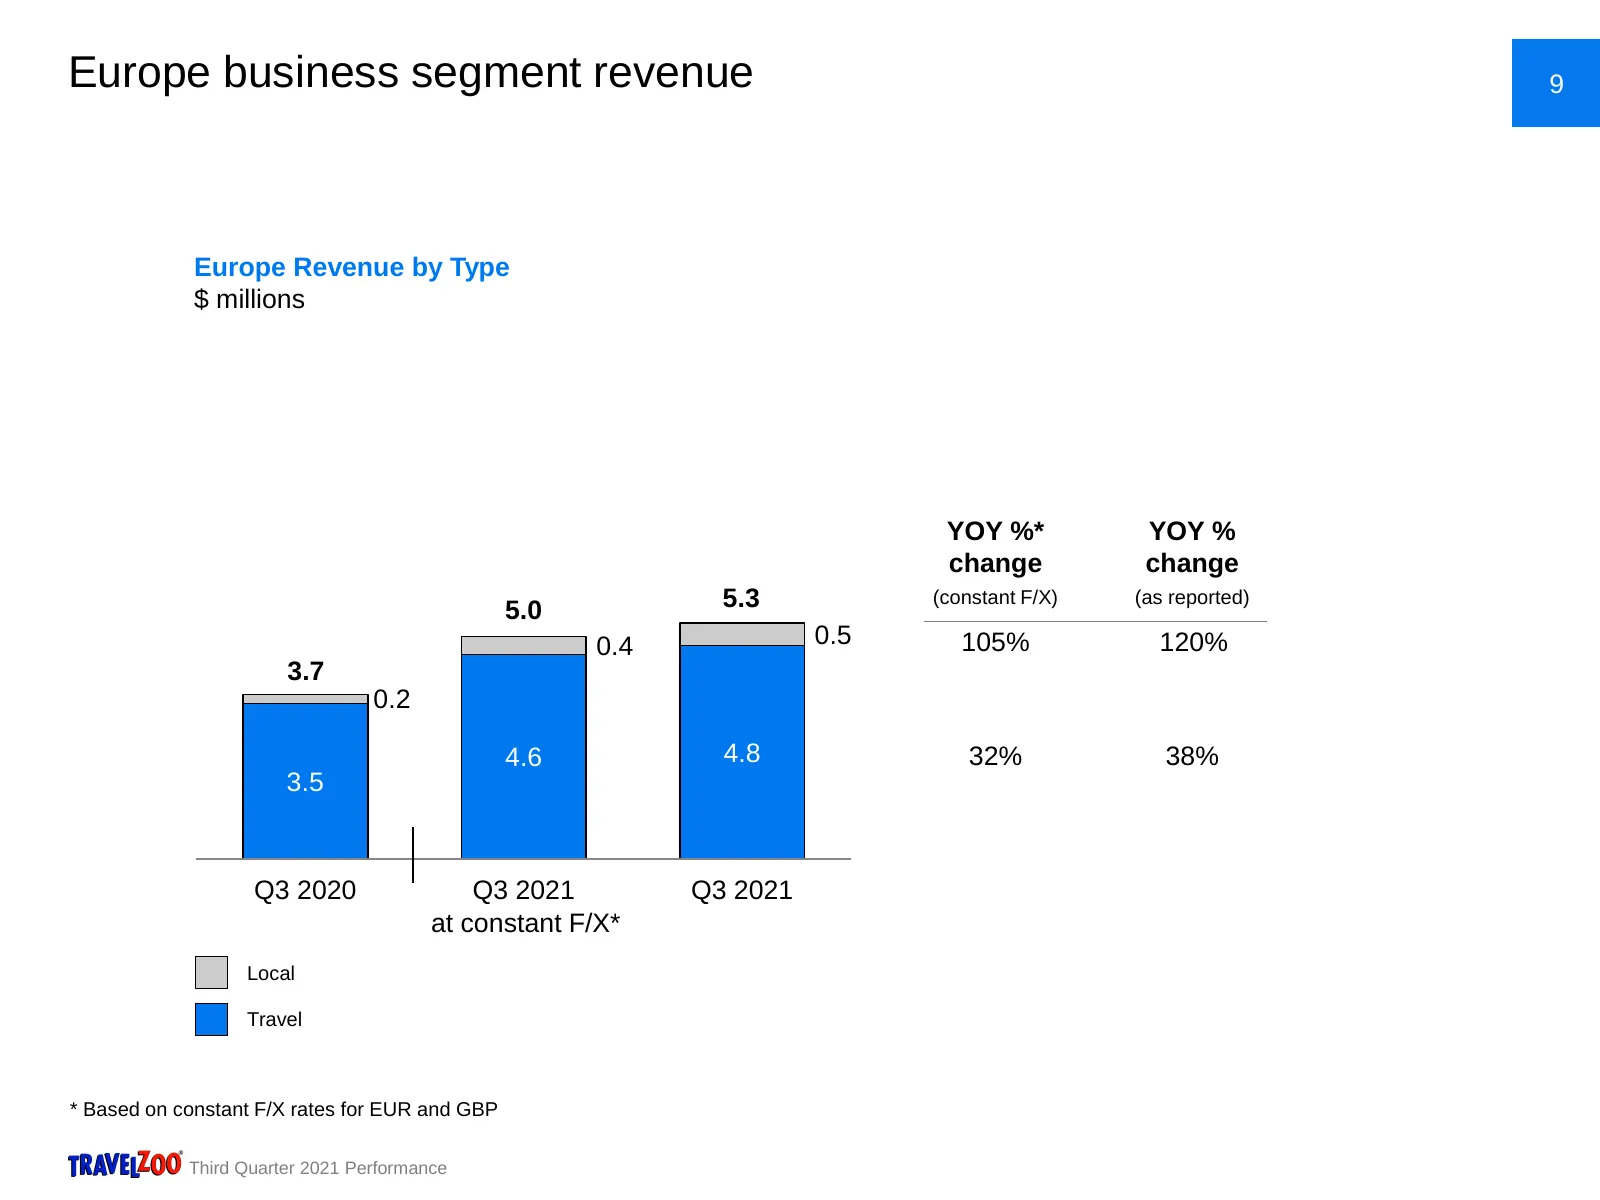
Slide 10: Europe business segment revenue
Europe business segment revenue 9 Europe Revenue by Type $ millions YOY %* YOY % change change 5.0 5.3 (constant F/X) (as reported) 0.4 0.5 105% 120% 3.7 0.2 4.6 4.8 32% 38% 3.5 Q3 2020 Q3 2021 Q3 2021 at constant F/X* Local Travel * Based on constant F/X rates for EUR and GBP Third Quarter 2021 Per
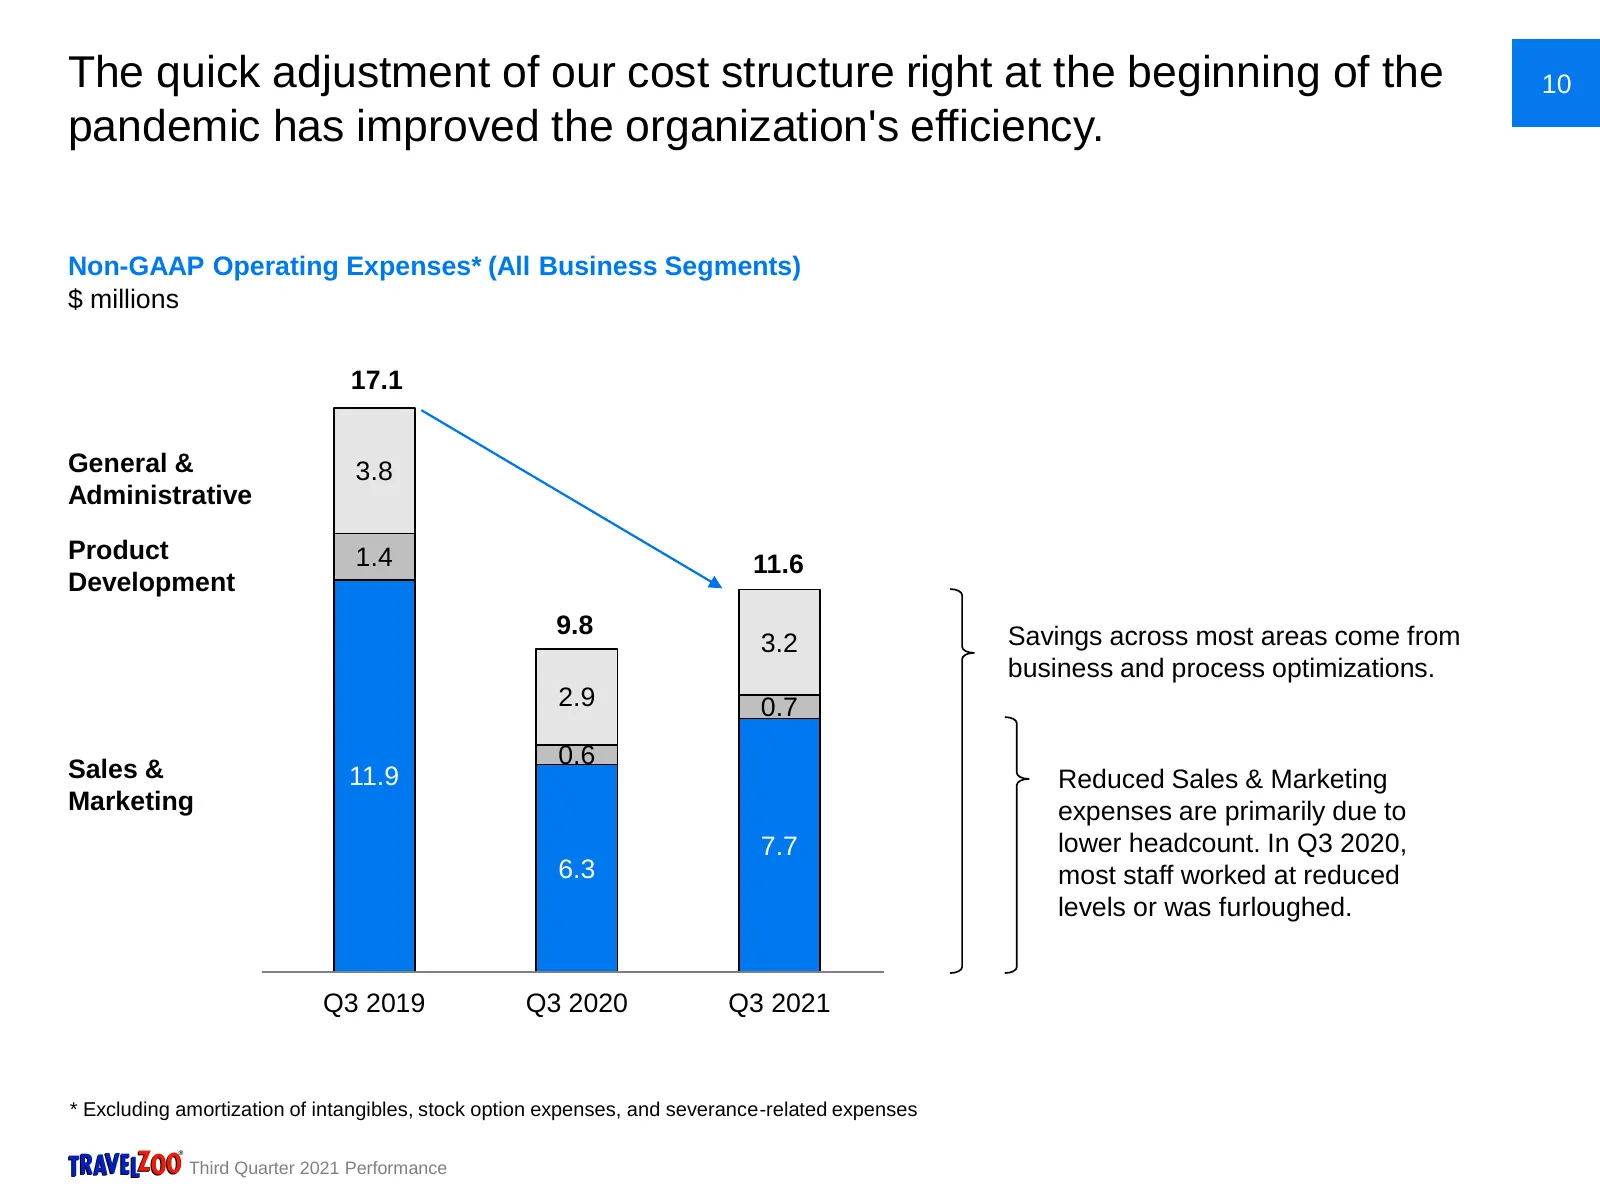
Slide 11: Quick cost structure adjustment improved the organization's efficiency
The quick adjustment of our cost structure right at the beginning of the 10 pandemic has improved the organization's efficiency. Non-GAAP Operating Expenses* (All Business Segments) $ millions 17.1 General & 3.8 Administrative Product 1.4 11.6 Development 9.8 Savings across most areas come from 3.2
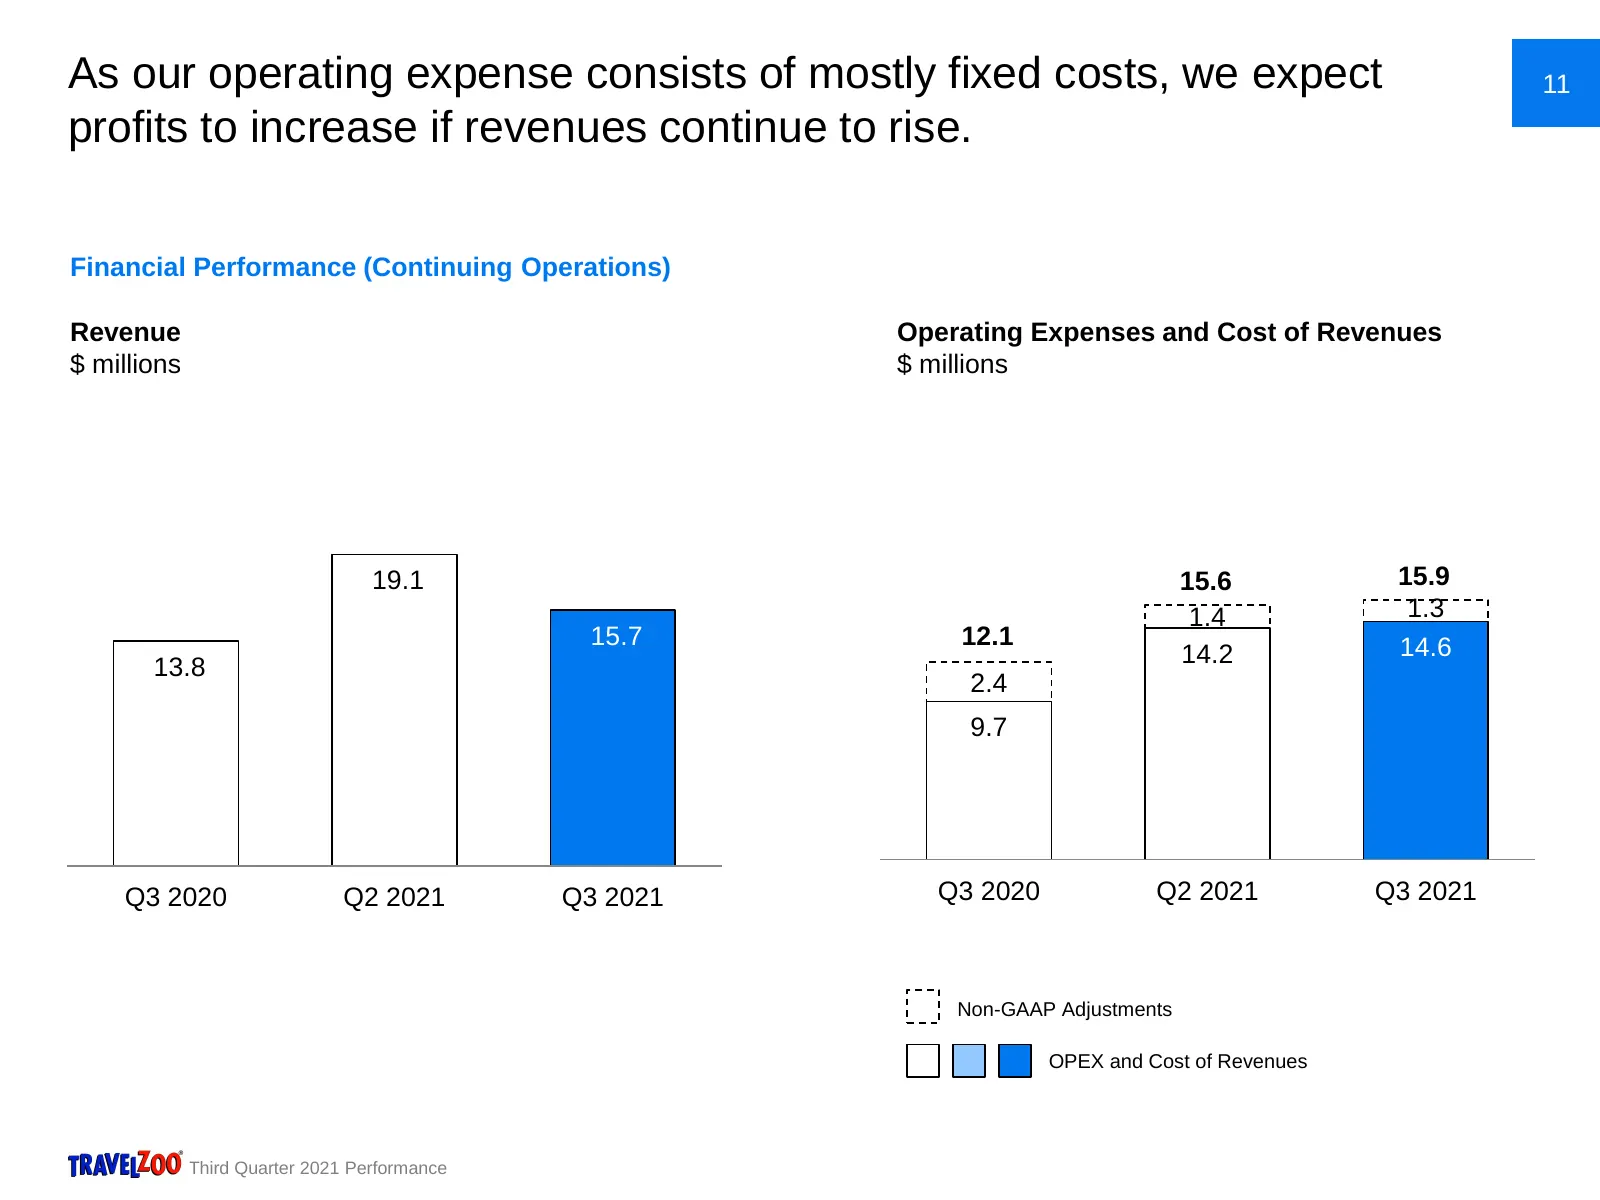
Slide 12: Mostly fixed operating expenses mean profits should increase if revenues rise
As our operating expense consists of mostly fixed costs, we expect 11 profits to increase if revenues continue to rise. Financial Performance (Continuing Operations) Revenue Operating Expenses and Cost of Revenues $ millions $ millions 19.1 15.6 15.9 1.4 1.3 15.7 12.1 14.6 13.8 14.2 2.4 9.7 Q3 2020
Slide 13: More than 30 million members, 6.8 million mobile app users, 4 million followers
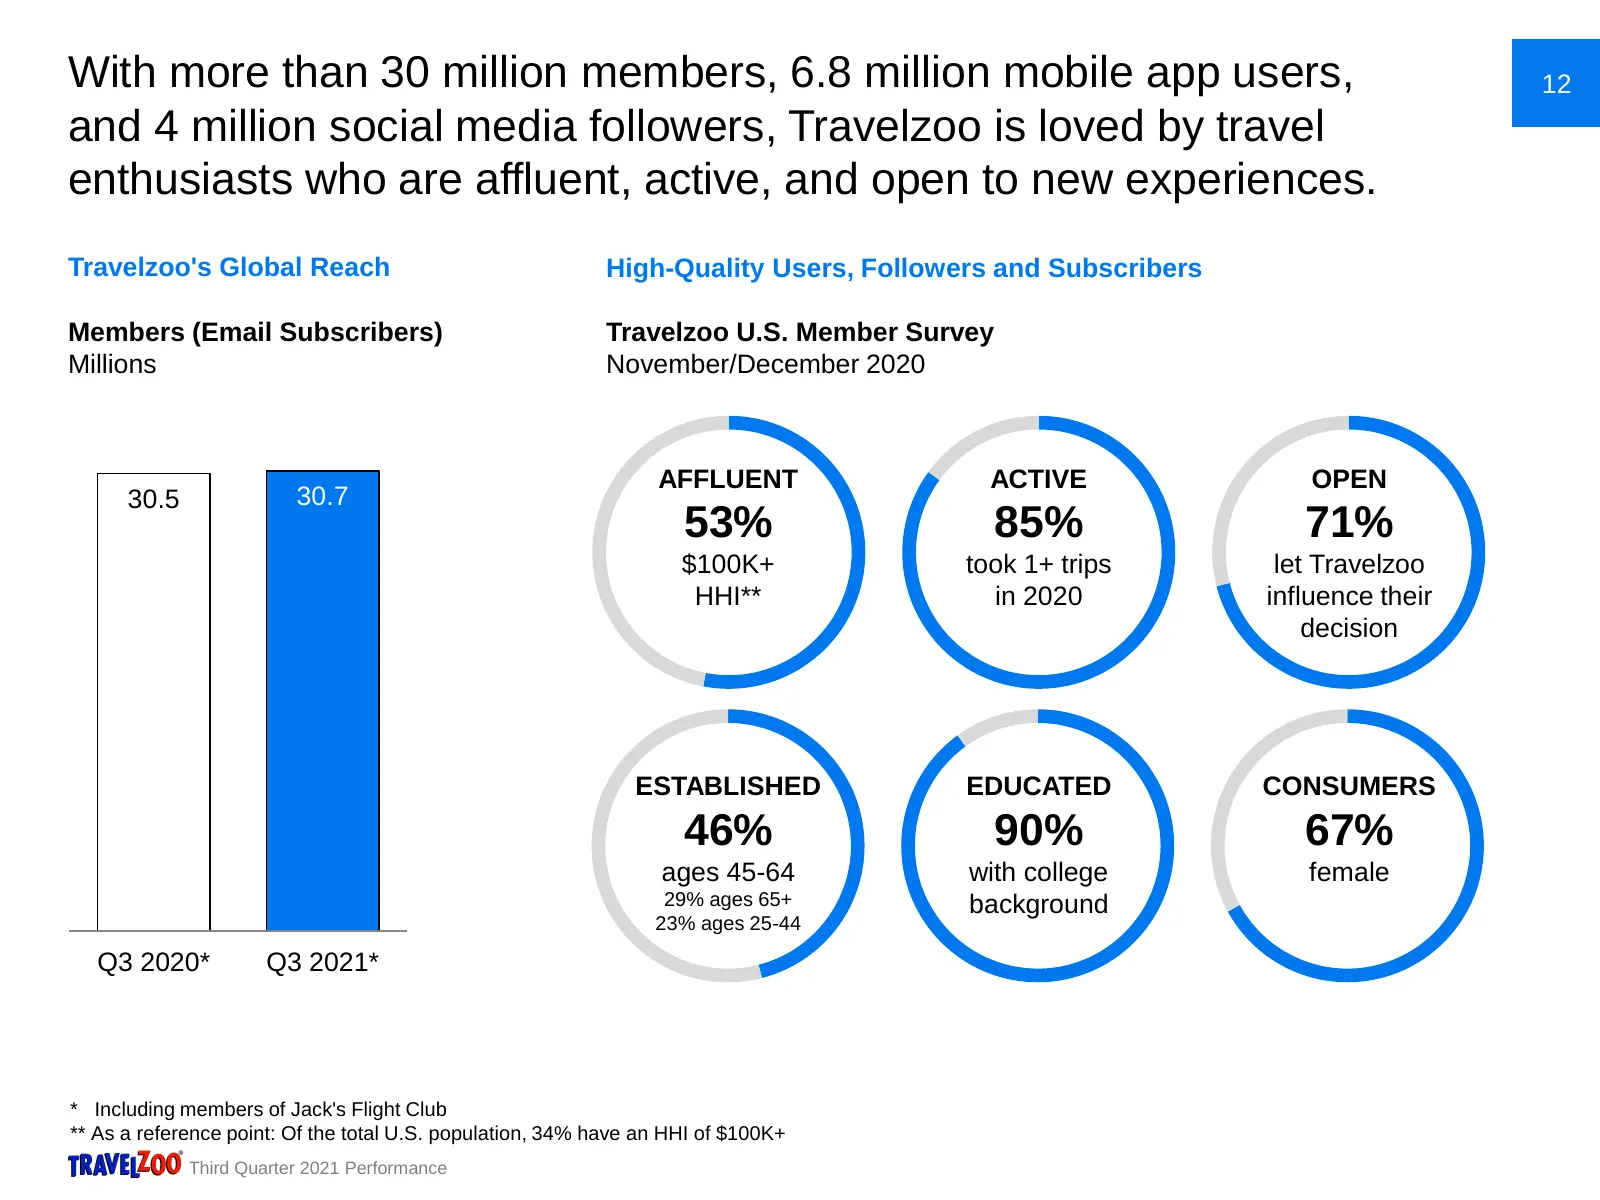
With more than 30 million members, 6.8 million mobile app users, 12 and 4 million social media followers, Travelzoo is loved by travel enthusiasts who are affluent, active, and open to new experiences. Travelzoo's Global Reach High-Quality Users, Followers and Subscribers Members (Email Subscribers)
Slide 14: Part 2: Management Focus
13 Part 1: Third Quarter 2021 Performance Part 2: Management Focus Third Quarter 2021 Performance
Slide 15: Management Focus
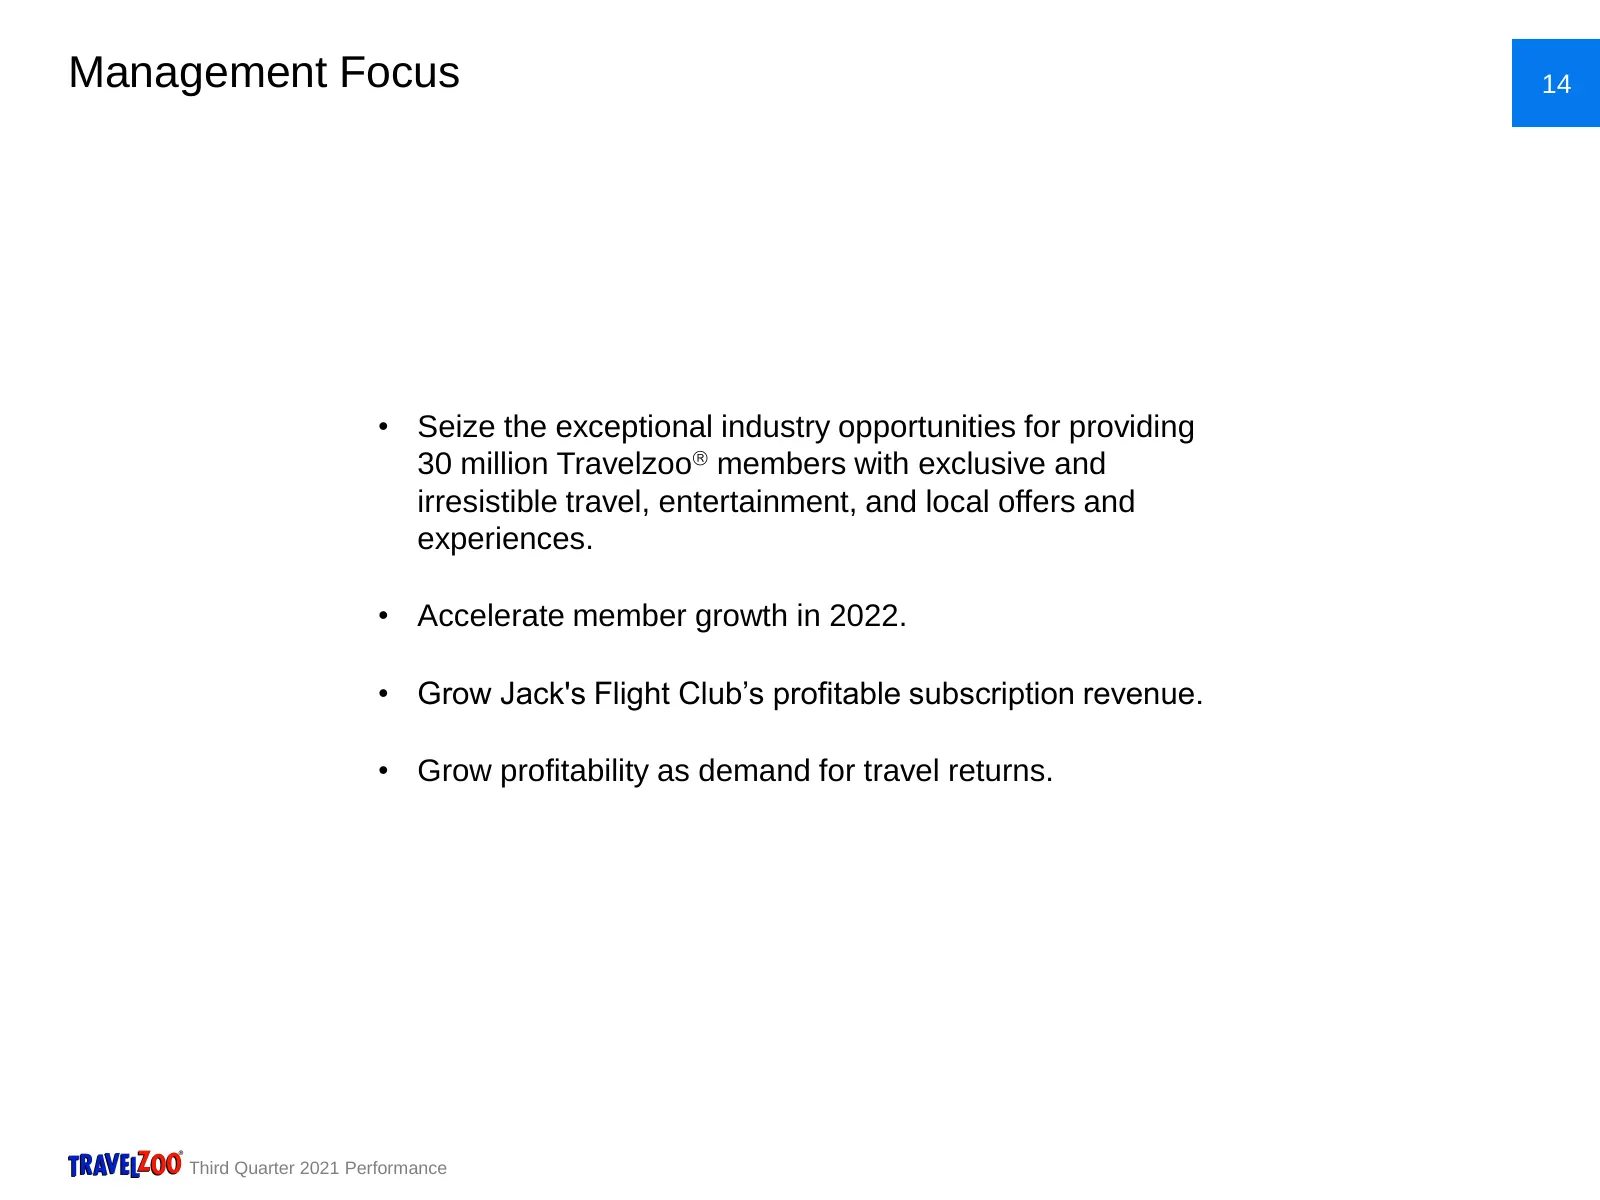
Management Focus 14 • Seize the exceptional industry opportunities for providing 30 million Travelzoo members with exclusive and irresistible travel, entertainment, and local offers and experiences. • Accelerate member growth in 2022. • Grow Jack's Flight Club’s profitable subscription revenue. • G

Slide 16: Have a nice day!
NASDAQ: TZOO HAVE A NICE DAY! For questions, please contact Travelzoo Investor Relations: ir@travelzoo.com
Source: company website
More decks from Travelzoo
 Q3 2026 Earnings Presentation25 slides · Oct 27, 2026
 Q2 2026 Earnings Presentation25 slides · Jul 28, 2026
 Q1 2026 Earnings Presentation25 slides · Apr 23, 2026
 Q4 2025 Earnings Presentation25 slides · Feb 19, 2026
 Q3 2025 Earnings Presentation25 slides · Oct 28, 2025
 Q2 2025 Earnings Presentation25 slides · Jul 23, 2025