TechPrecision Corporation · NASDAQ:TPCS
TechPrecision — Q1 FY2013 Earnings Presentation
11 slides from TechPrecision's earnings presentation, August 2012
Slide 1: Q1 FY13 Shareholder Conference Call
Q1 FY13 Shareholder Conference Call August 2012 © 2012. All rights reserved.
Slide 2: Safe Harbor Statement
Safe Harbor Statement Safe Harbor Statement Under the Private Securities Litigation Reform Act of 1995: Any statements set forth in this presentation that are not historical facts are forward‐looking statements that involve risks and uncertainties that could cause actual results to differ materially
Slide 3: Agenda
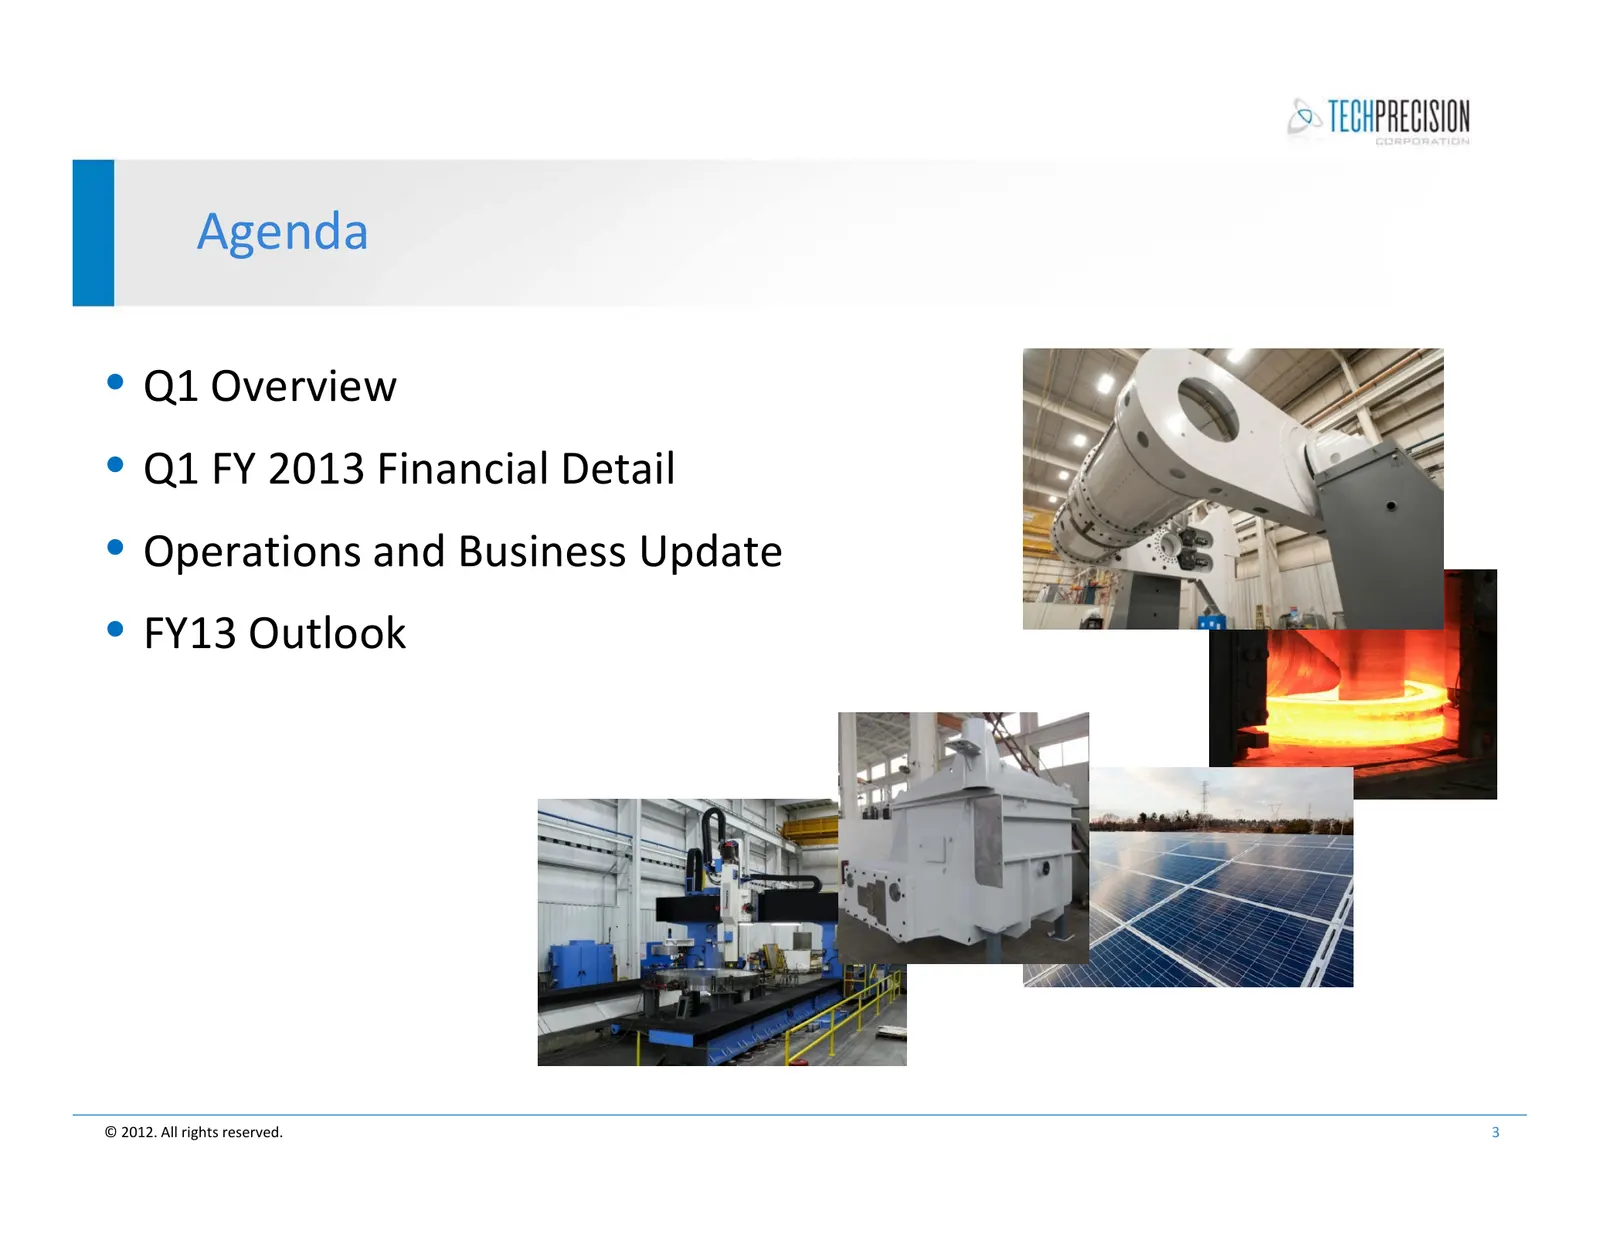
Agenda • Q1 Overview • Q1 FY 2013 Financial Detail • Operations and Business Update • FY13 Outlook © 2012. All rights reserved. 3
Slide 4: Q1 Income Statement
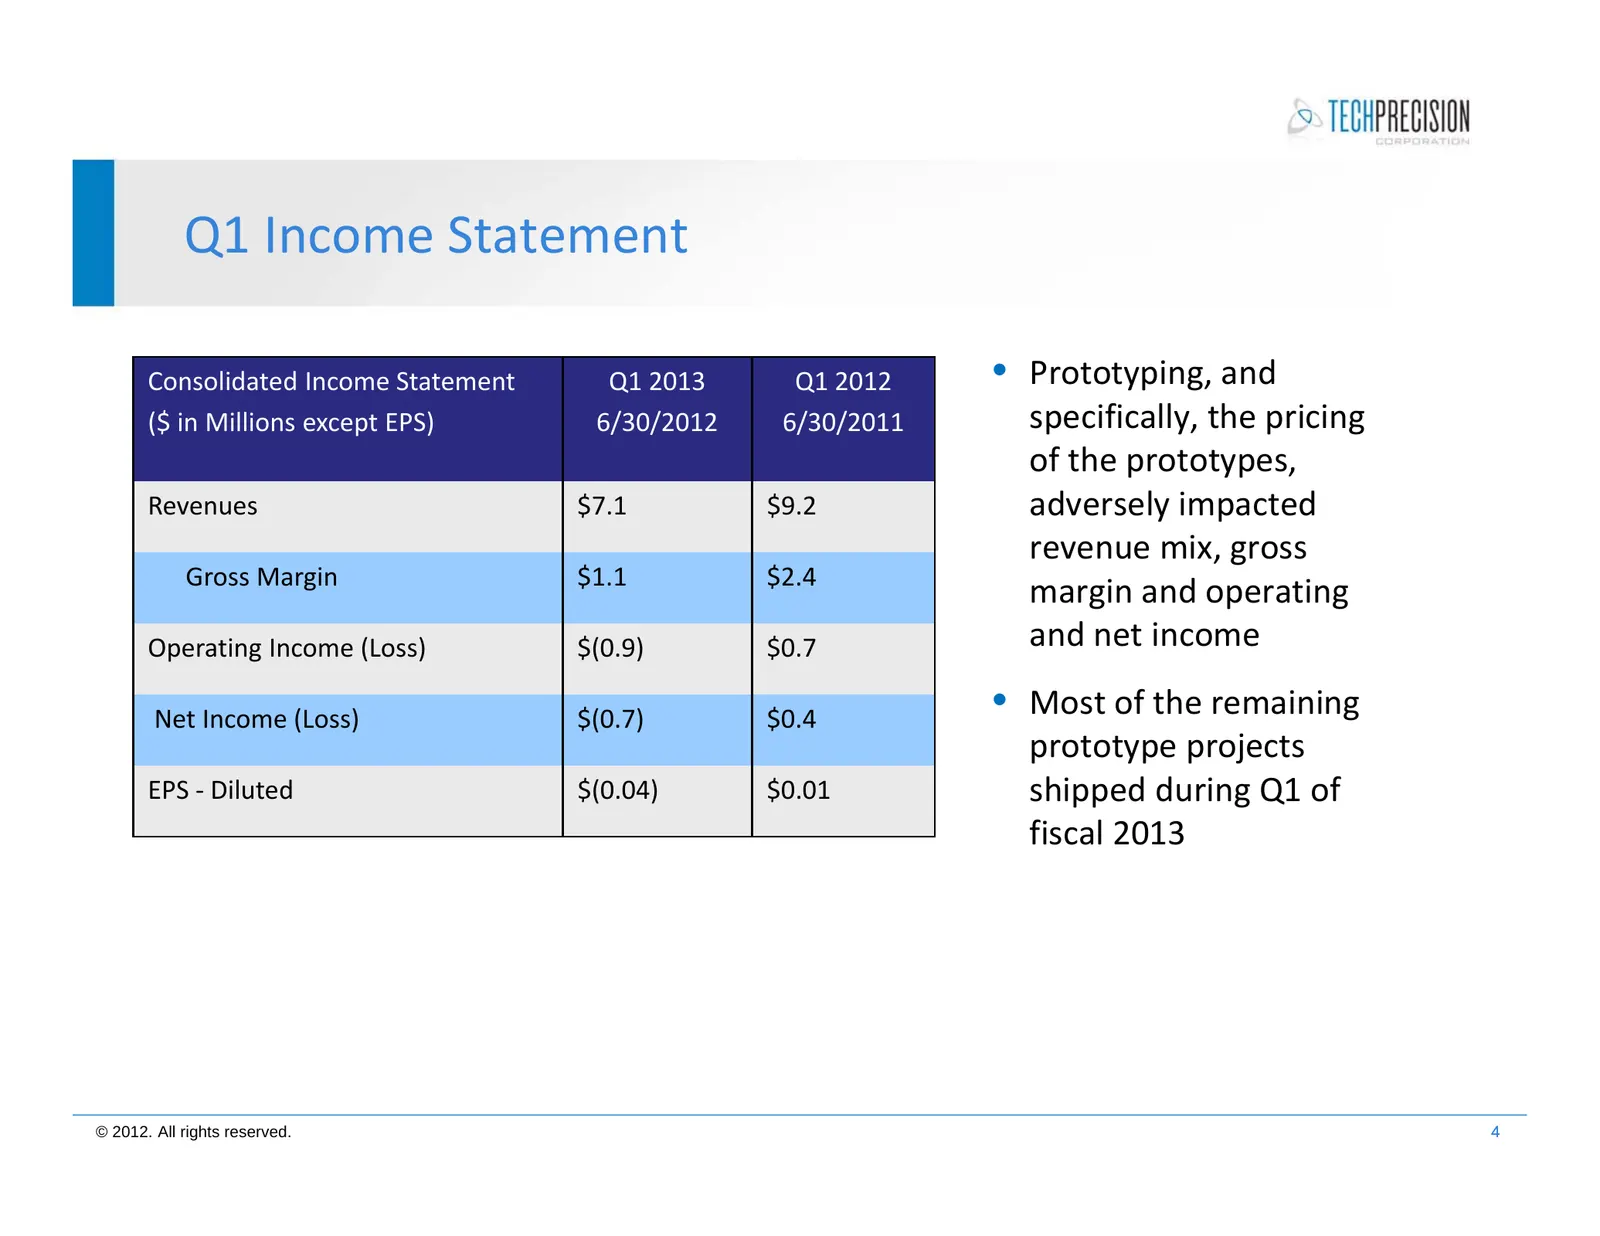
Q1 Income Statement Consolidated Income Statement Q1 2013 Q1 2012 • Prototyping, and ($ in Millions except EPS) 6/30/2012 6/30/2011 specifically, the pricing of the prototypes, Revenues $7.1 $9.2 adversely impacted revenue mix, gross Gross Margin $1.1 $2.4 margin and operating Operating Income (Loss
Slide 5: Revenue Distribution
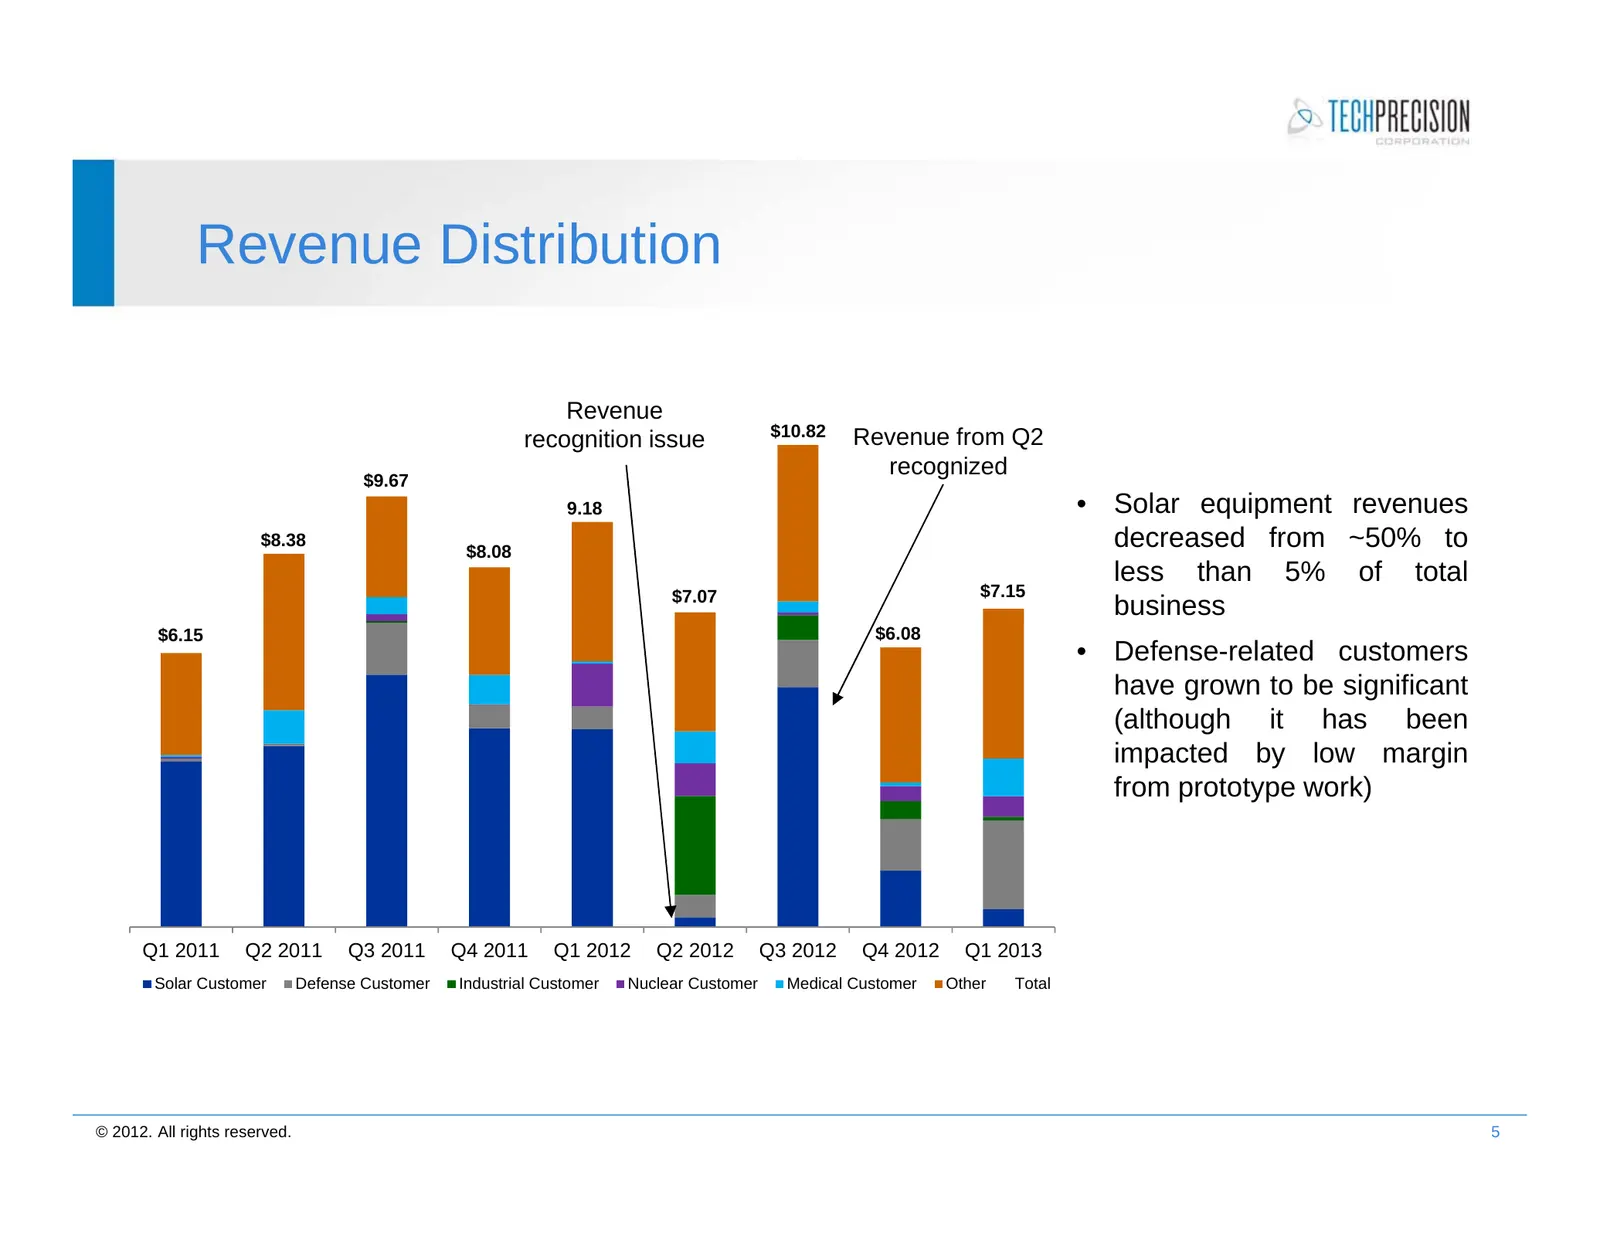
Revenue Distribution Revenue $10.82 Revenue from Q2 recognition issue recognized $9.67 9.18 • Solar equipment revenues $8.38 $8.08 decreased from ~50% to less than 5% of total $7.07 $7.15 business $6.15 $6.08 • Defense-related customers have grown to be significant (although it has been impacted by
Slide 6: Q1 Income Statement
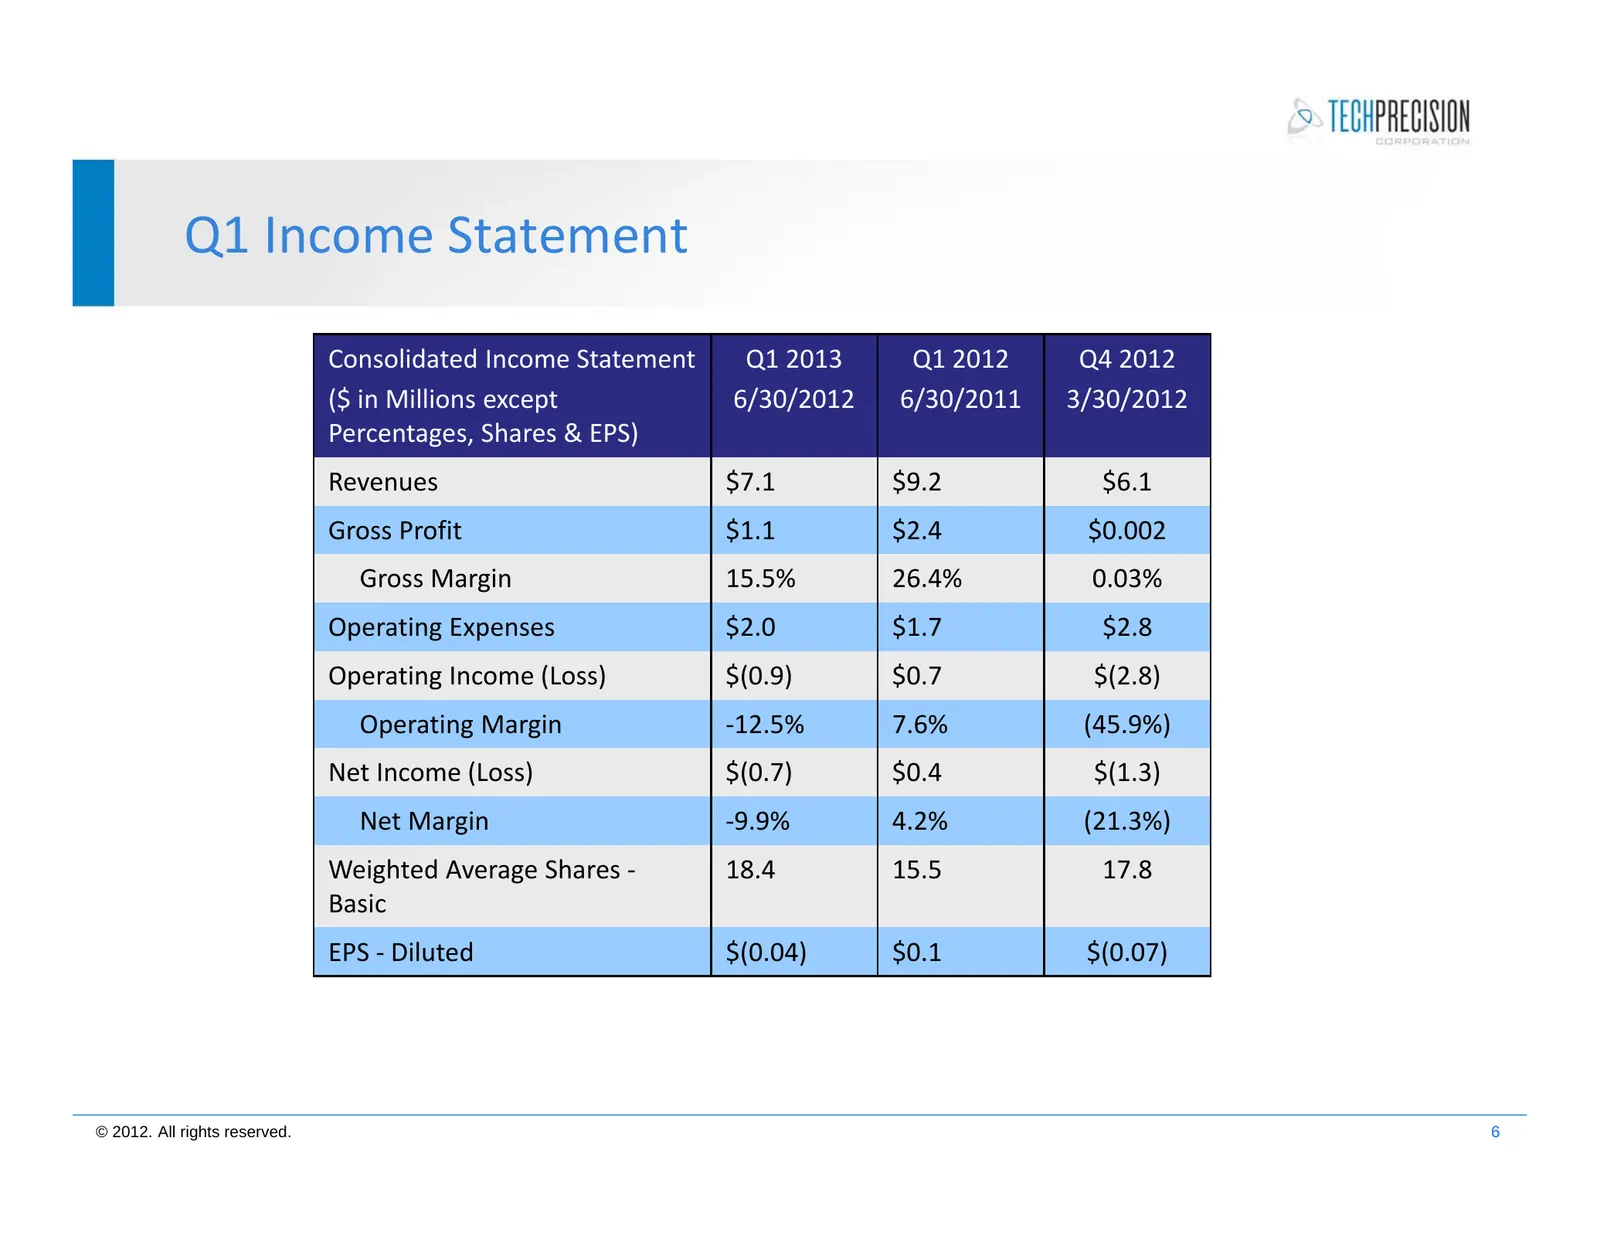
Q1 Income Statement Consolidated Income Statement Q1 2013 Q1 2012 Q4 2012 ($ in Millions except 6/30/2012 6/30/2011 3/30/2012 Percentages, Shares & EPS) Revenues $7.1 $9.2 $6.1 Gross Profit $1.1 $2.4 $0.002 Gross Margin 15.5% 26.4% 0.03% Operating Expenses $2.0 $1.7 $2.8 Operating Income (Loss) $(0.
Slide 7: Balance Sheet Highlights
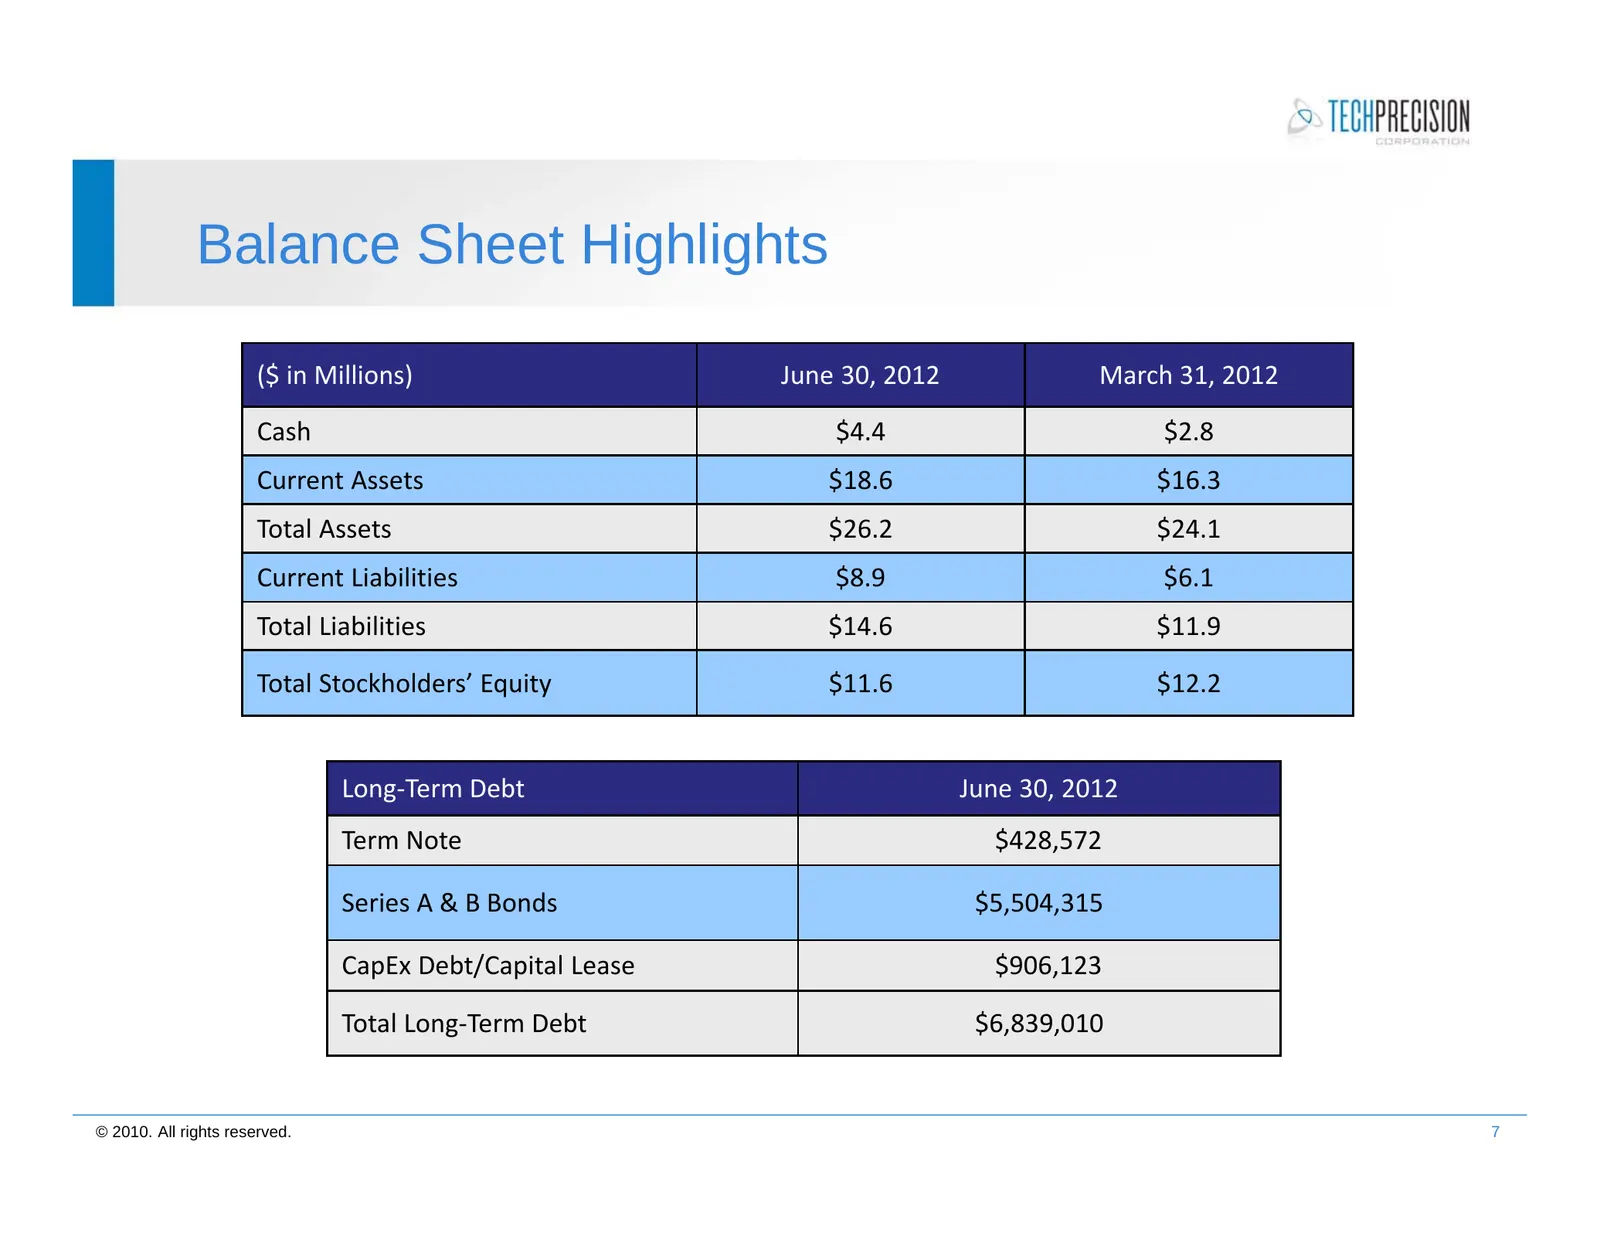
Balance Sheet Highlights ($ in Millions) June 30, 2012 March 31, 2012 Cash $4.4 $2.8 Current Assets $18.6 $16.3 Total Assets $26.2 $24.1 Current Liabilities $8.9 $6.1 Total Liabilities $14.6 $11.9 Total Stockholders’ Equity $11.6 $12.2 Long‐Term Debt June 30, 2012 Term Note $428,572 Series A & B Bon
Slide 8: Strategic Production Solutions for Profitable Growth
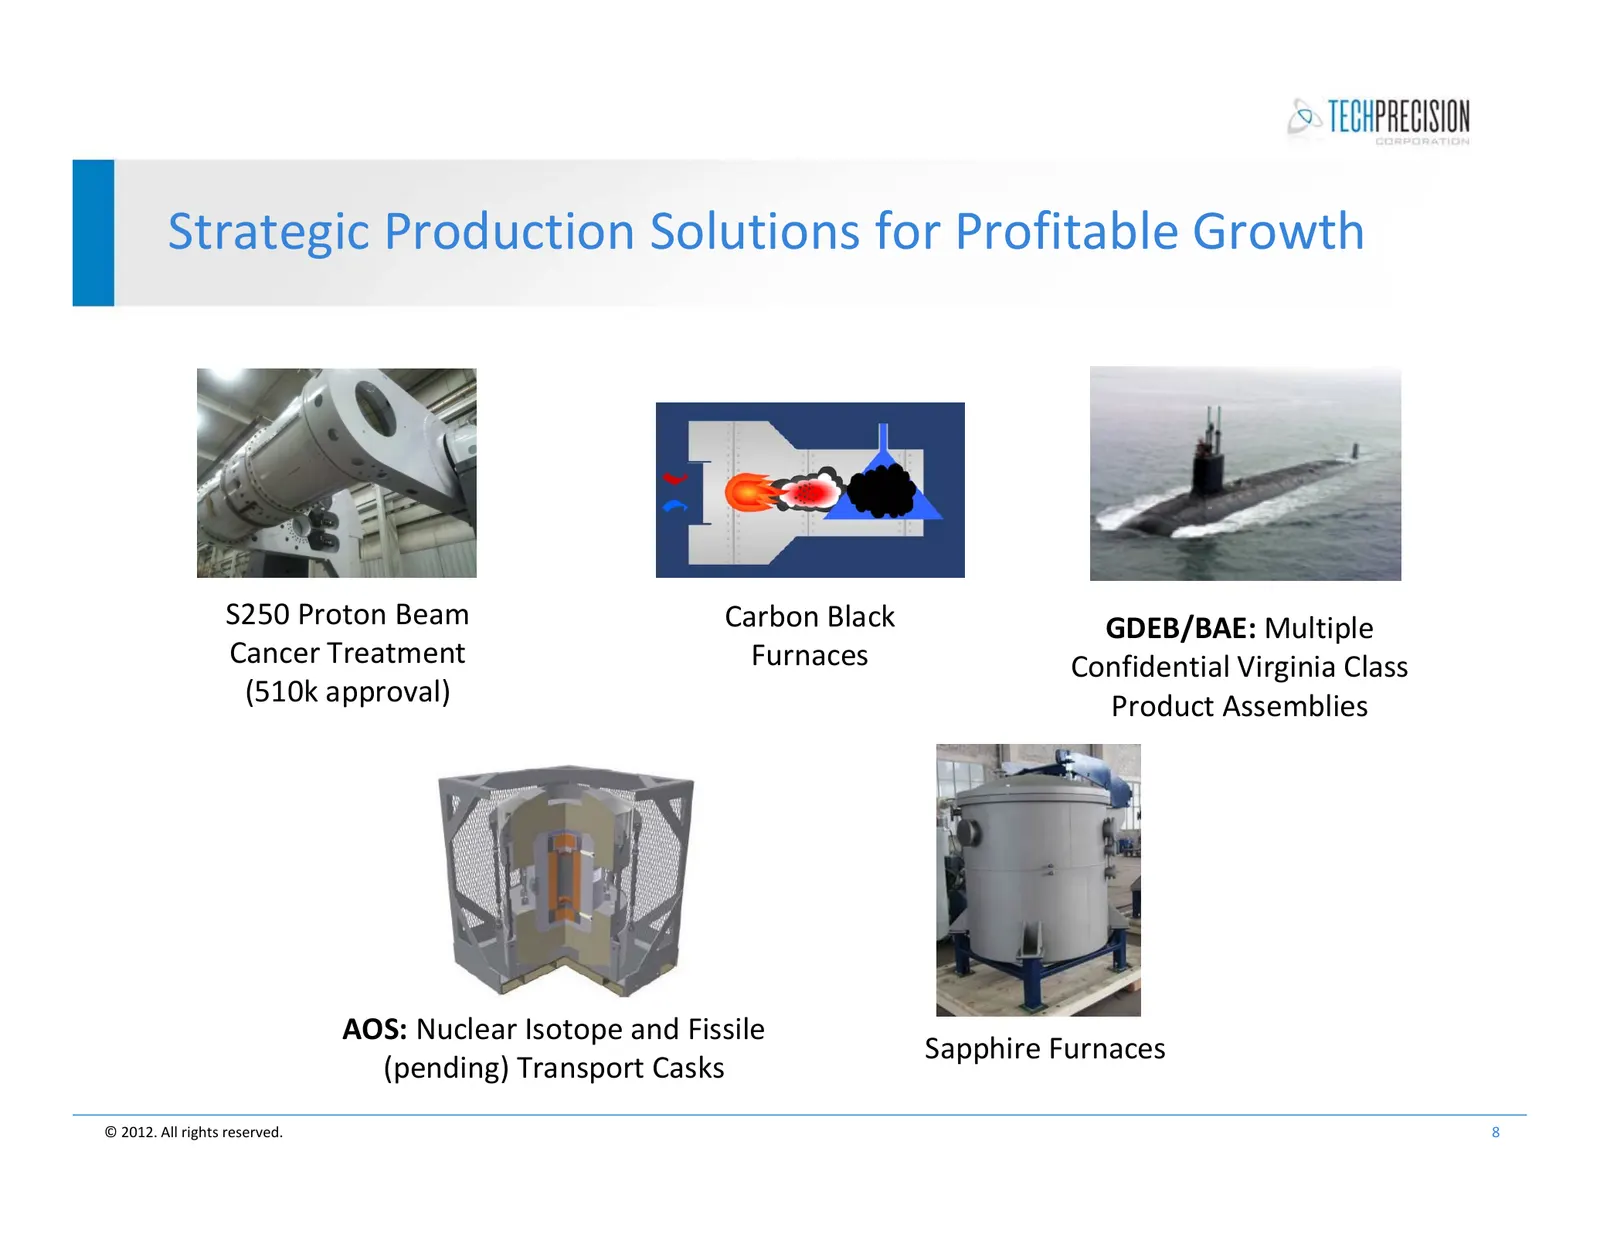
Strategic Production Solutions for Profitable Growth S250 Proton Beam Carbon Black GDEB/BAE: Multiple Cancer Treatment Furnaces Confidential Virginia Class (510k approval) Product Assemblies AOS: Nuclear Isotope and Fissile Sapphire Furnaces (pending) Transport Casks © 2012. All rights reserved. 8
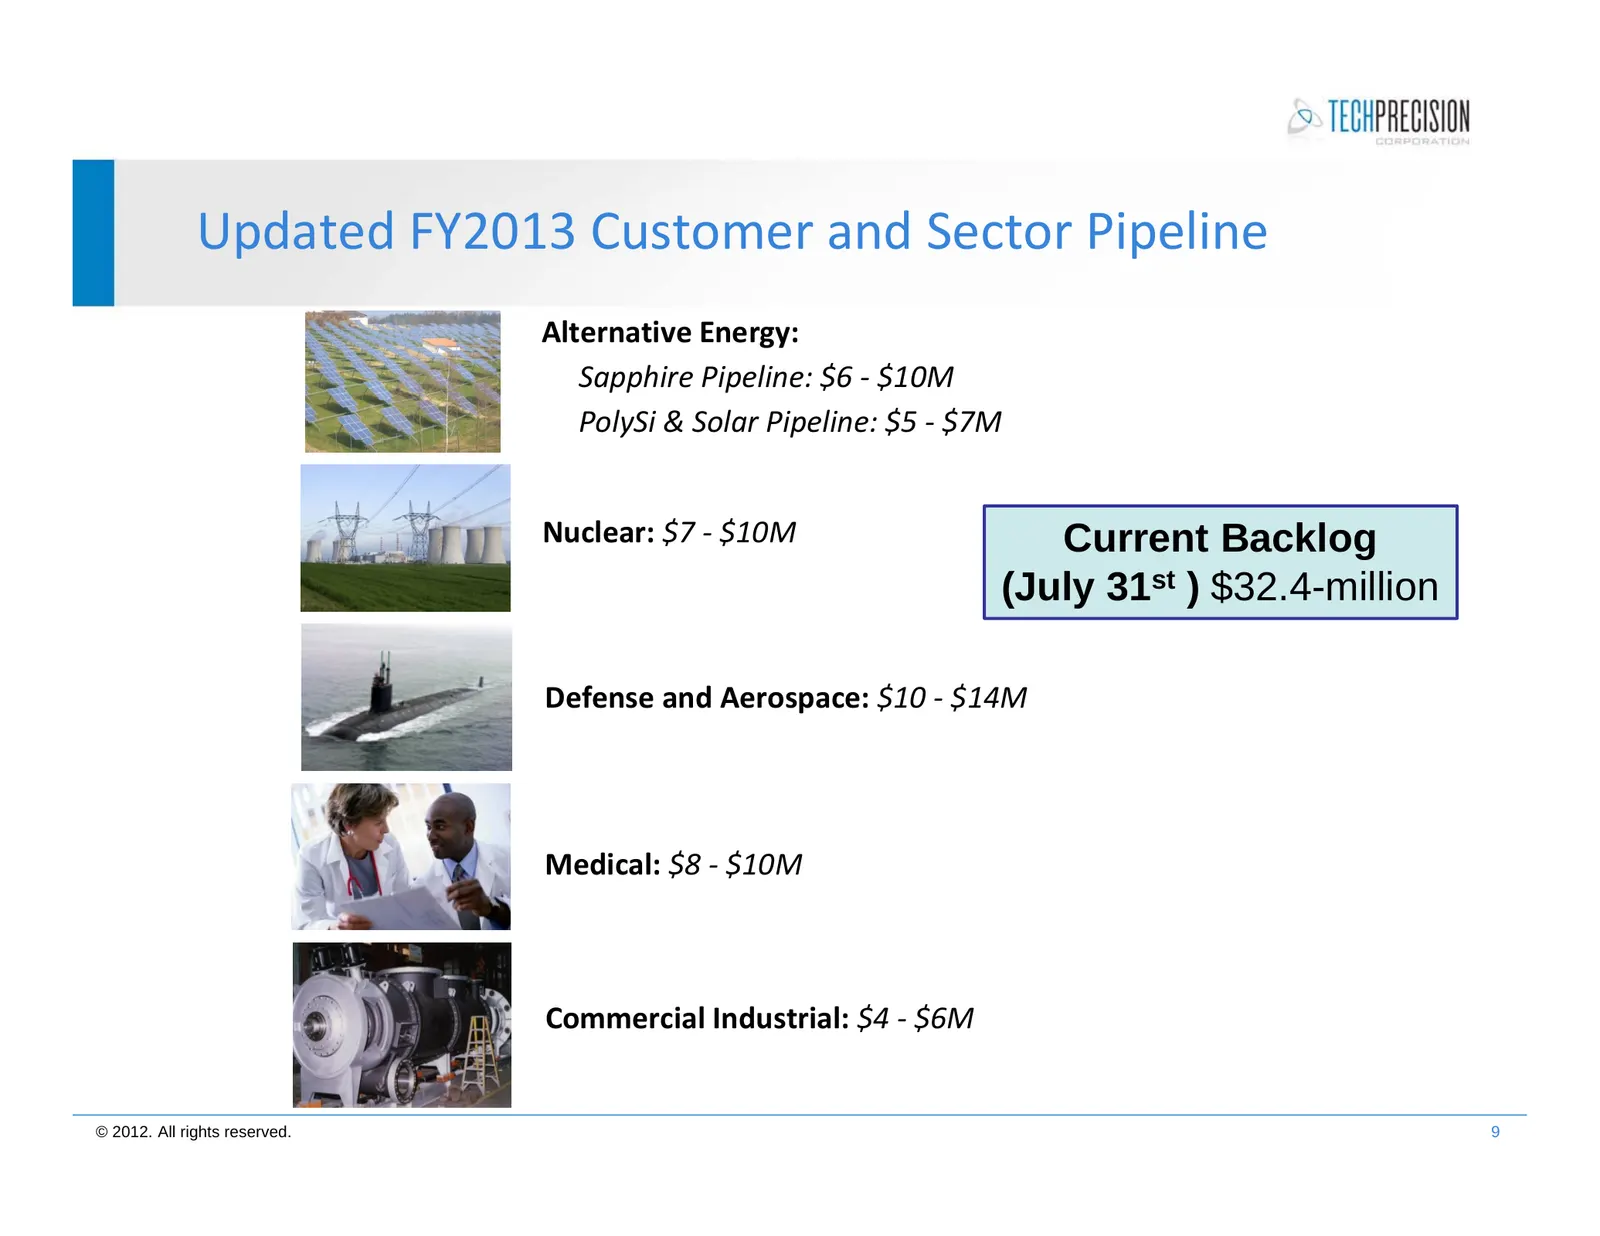
Slide 9: Updated FY2013 Customer and Sector Pipeline
Updated FY2013 Customer and Sector Pipeline Alternative Energy: Sapphire Pipeline: $6 ‐ $10M PolySi & Solar Pipeline: $5 ‐ $7M Nuclear: $7 ‐ $10M Current Backlog (July 31st ) $32.4-million Defense and Aerospace: $10 ‐ $14M Medical: $8 ‐ $10M Commercial Industrial: $4 ‐ $6M © 2012. All rights reserve
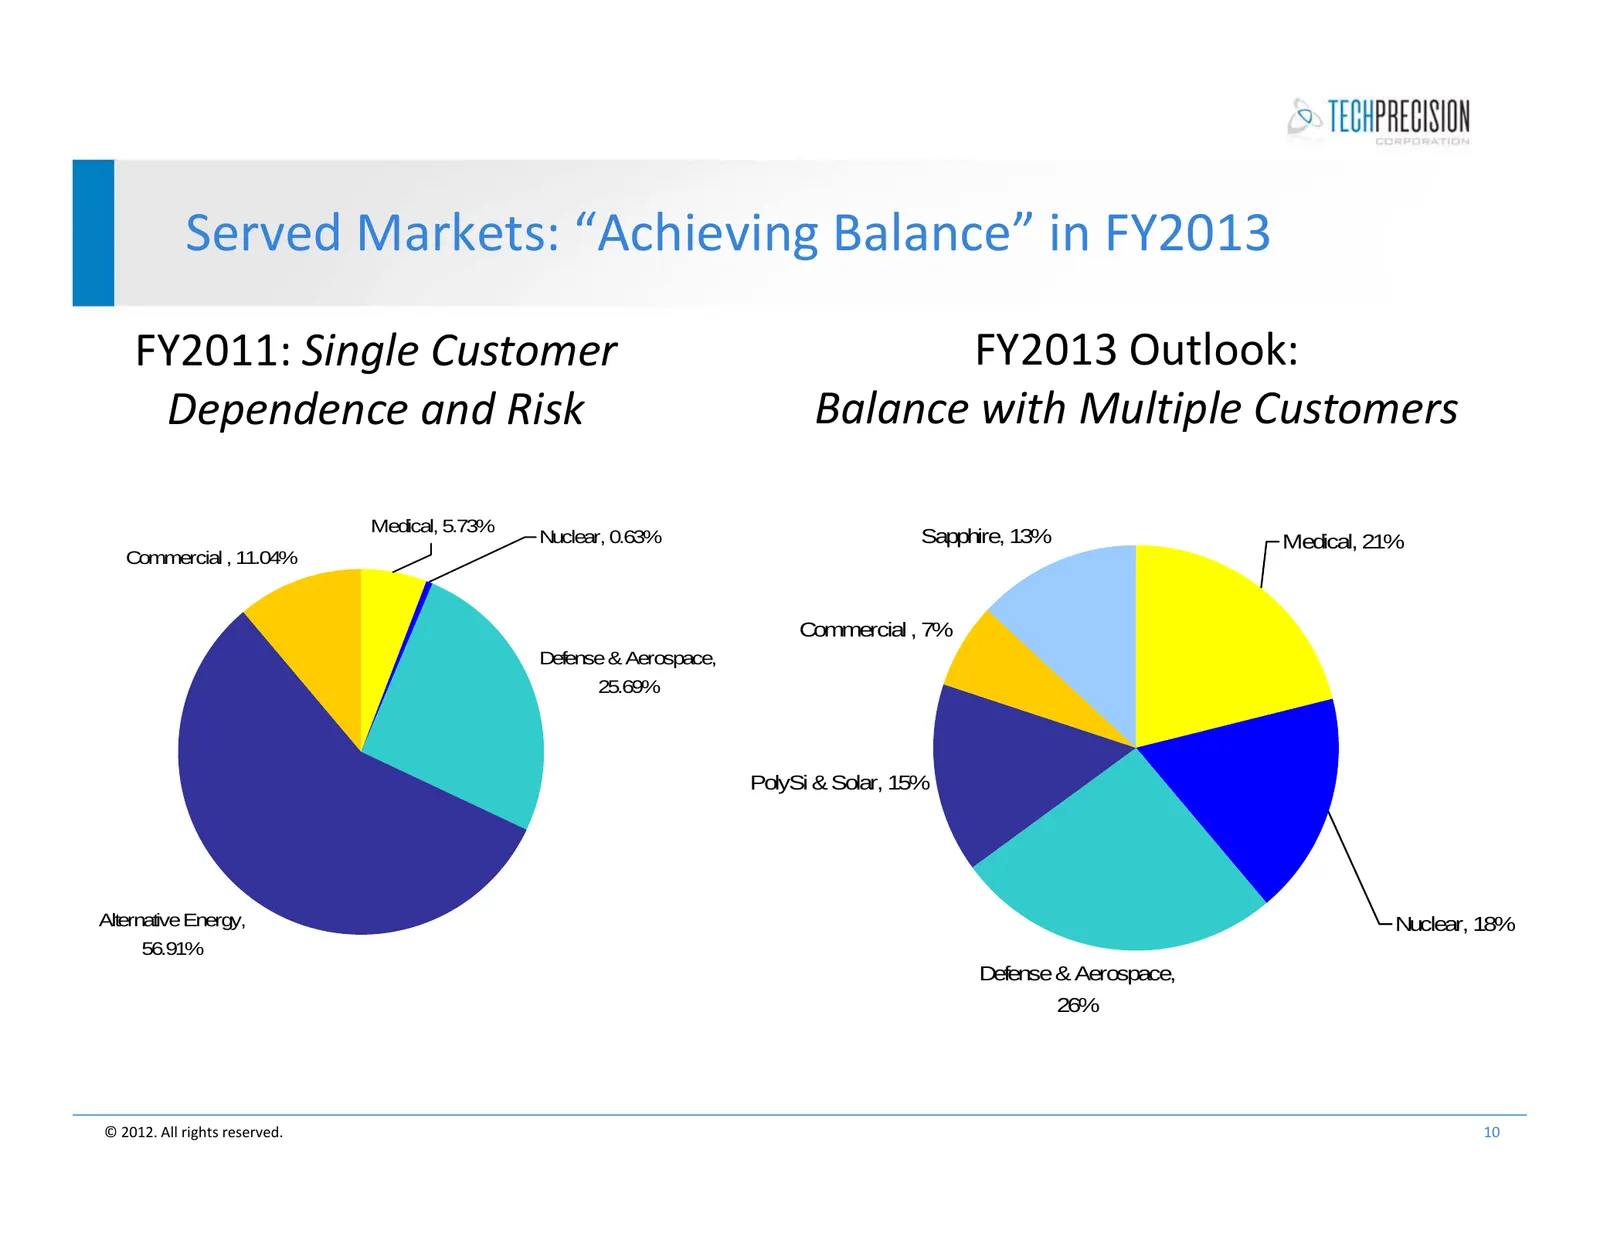
Slide 10: Served Markets: "Achieving Balance" in FY2013
Served Markets: “Achieving Balance” in FY2013 FY2011: Single Customer FY2013 Outlook: Dependence and Risk Balance with Multiple Customers M edical, 5.73% Sapphire, 13% Nuclear, 0.63% M edical, 21% Commercial , 11.04% Commercial , 7% Defense & Aerospace, 25.69% PolySi & Solar, 15% Alternative Energy,
Slide 11: www.TechPrecision.com www.ranor.com www.wcmcsolutions.com
www.TechPrecision.com www.ranor.com www.wcmcsolutions.com © 2012. All rights reserved. 11
Source: Internet Archive copy of techprecision.com
More decks from TechPrecision Corporation
 Proxy Contest (November 2024)37 slides · Nov 22, 2024
 Investor Presentation (March 2024)8 slides · March 2024
 Merger or Acquisition (September 2021)14 slides · Sep 29, 2021
 Investor Presentation (May 2018)21 slides · May 8, 2018
 Q3 FY2013 Earnings Presentation11 slides · Feb 19, 2013
 Q3 FY2013 Earnings Presentation11 slides · February 2013