Vectren — Goldman Sachs Power and Utility Conference 2012
35 slides from Vectren's conference presentation, Aug 13, 2012
Slide 1: Goldman Sachs Power and Utility Conference
Goldman Sachs Power and Utility Conference New York, NY August 14, 2012
Slide 2: Management Representatives
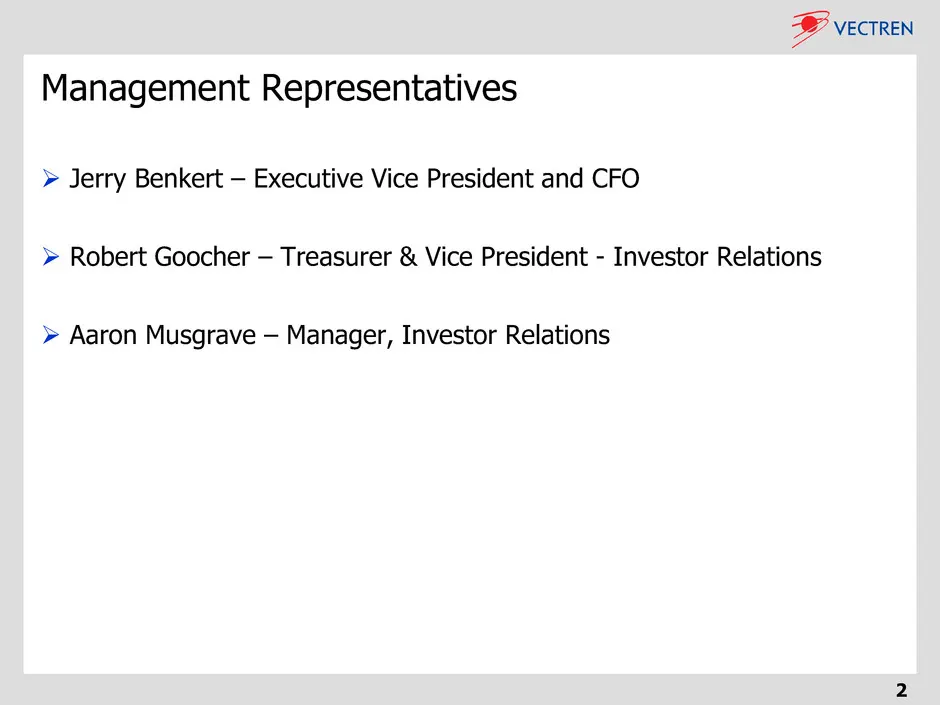
Management Representatives Jerry Benkert – Executive Vice President and CFO Robert Goocher – Treasurer & Vice President - Investor Relations Aaron Musgrave – Manager, Investor Relations 2
Slide 3: Forward-Looking Statements
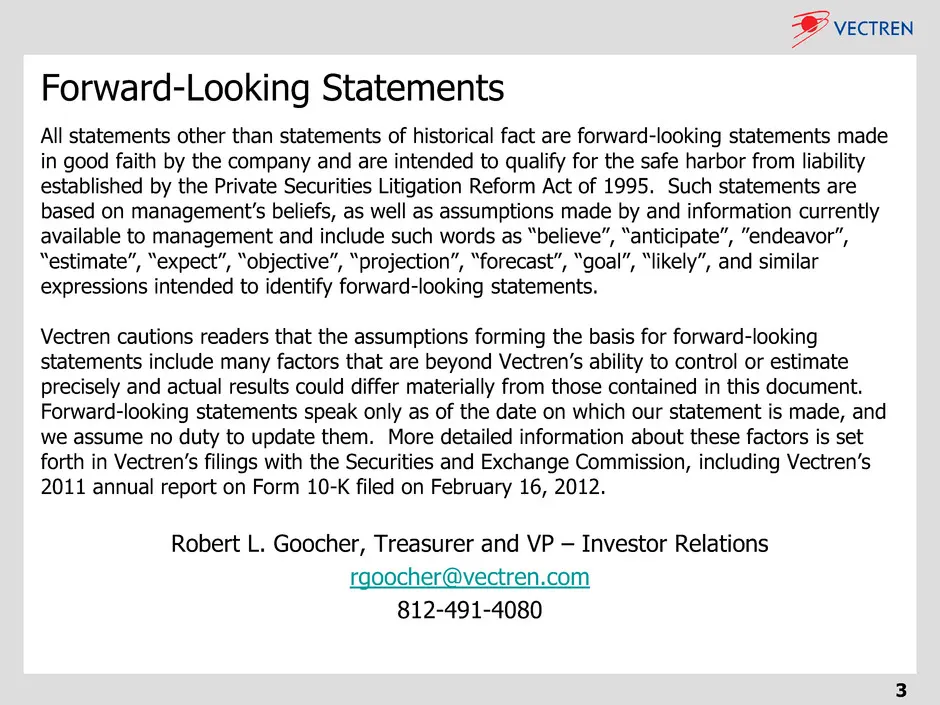
Forward-Looking Statements All statements other than statements of historical fact are forward-looking statements made in good faith by the company and are intended to qualify for the safe harbor from liability established by the Private Securities Litigation Reform Act of 1995. Such statements are
Slide 4: Vectren Overview
®@ VECTREN Vectren Overview
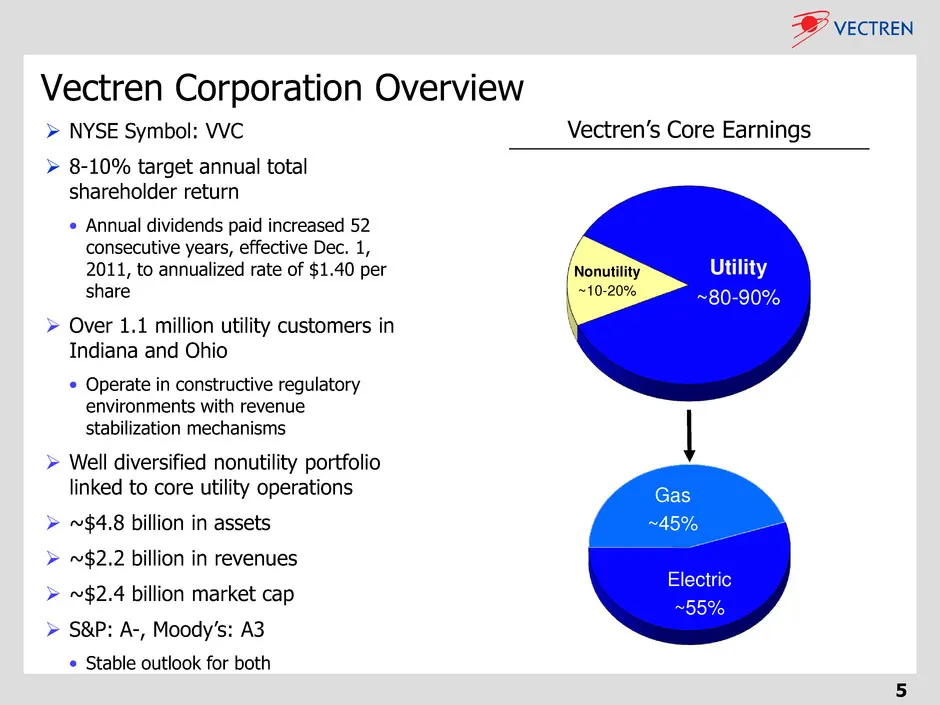
Slide 5: Vectren Corporation Overview
NYSE Symbol: VVC 8-10% target annual total shareholder return • Annual dividends paid increased 52 consecutive years, effective Dec. 1, 2011, to annualized rate of $1.40 per share Over 1.1 million utility customers in Indiana and Ohio • Operate in constructive regulatory environments with reve
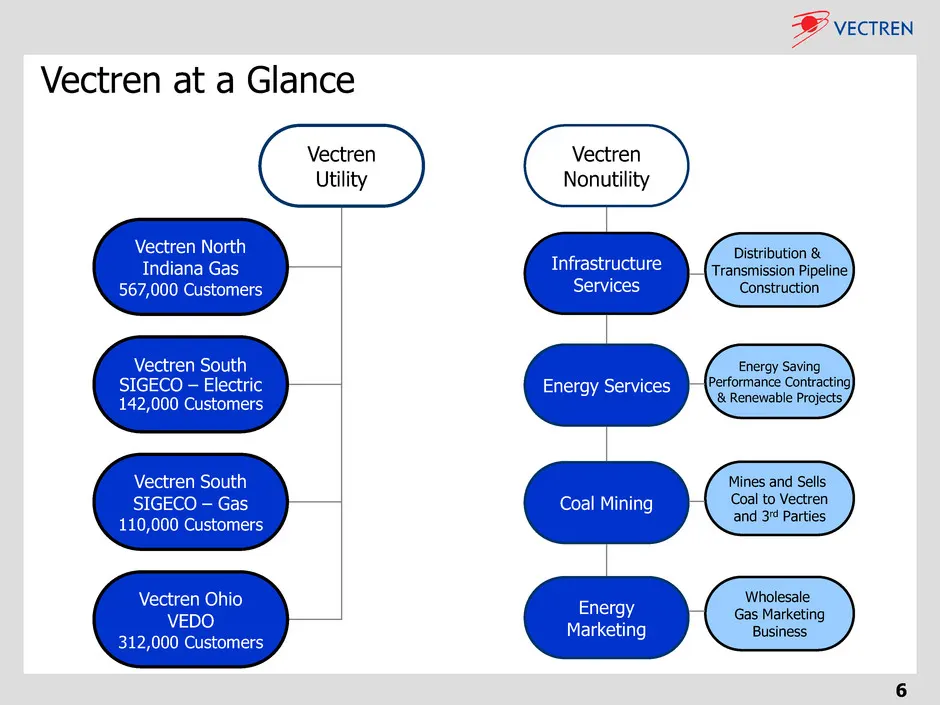
Slide 6: Vectren at a Glance
6 Vectren at a Glance Vectren Nonutility Infrastructure Services Energy Services Coal Mining Energy Marketing Distribution & Transmission Pipeline Construction Energy Saving Performance Contracting & Renewable Projects Mines and Sells Coal to Vectren and 3rd Parties Wholesale Gas Marketing Business
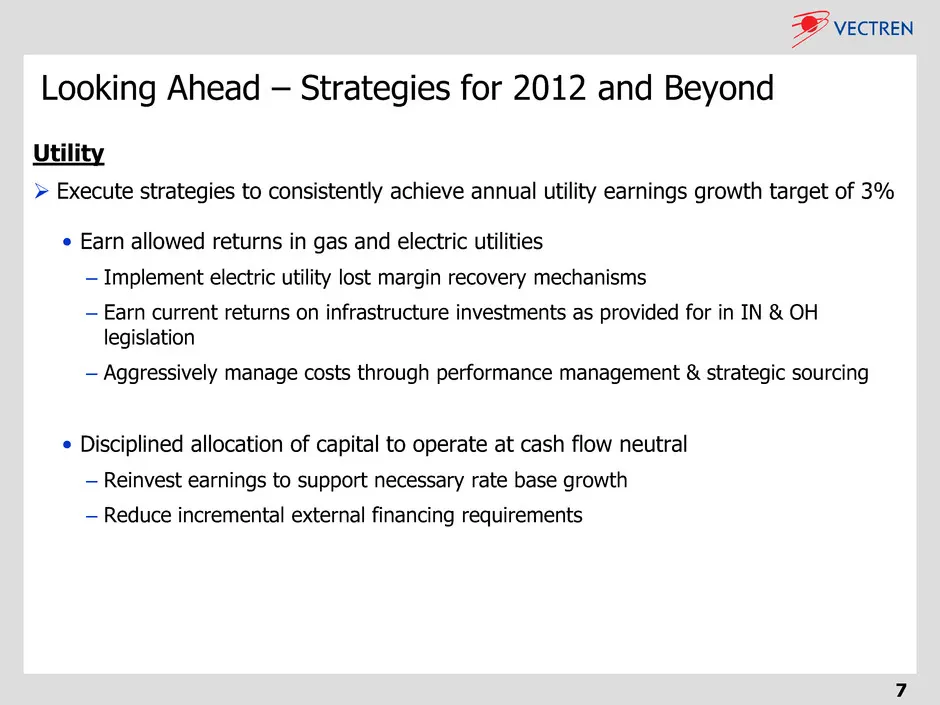
Slide 7: Looking Ahead – Strategies for 2012 and Beyond
7 Looking Ahead – Strategies for 2012 and Beyond Utility Execute strategies to consistently achieve annual utility earnings growth target of 3% • Earn allowed returns in gas and electric utilities – Implement electric utility lost margin recovery mechanisms – Earn current returns on infrastructure
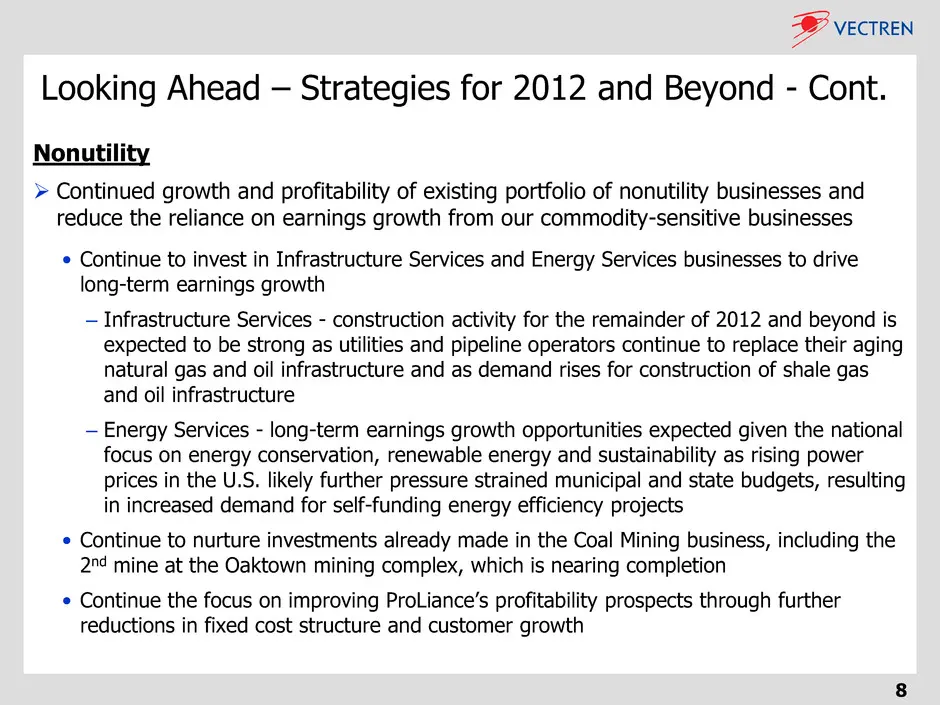
Slide 8: Looking Ahead – Strategies for 2012 and Beyond - Cont.
8 Looking Ahead – Strategies for 2012 and Beyond - Cont. Nonutility Continued growth and profitability of existing portfolio of nonutility businesses and reduce the reliance on earnings growth from our commodity-sensitive businesses • Continue to invest in Infrastructure Services and Energy Servic
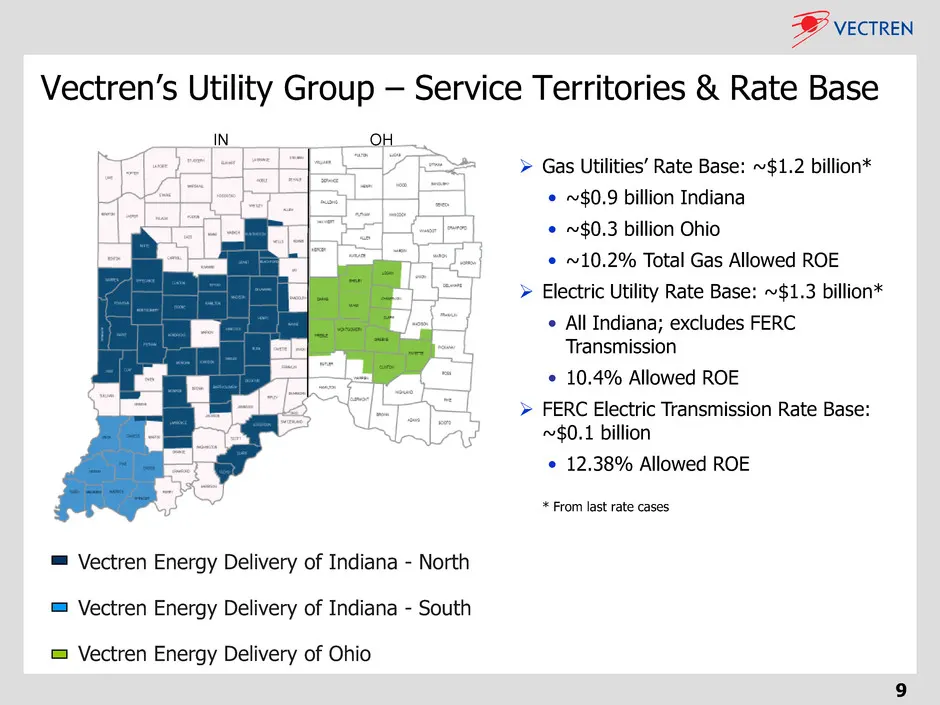
Slide 9: Vectren's Utility Group – Service Territories & Rate Base
9 Vectren Energy Delivery of Indiana - North Vectren Energy Delivery of Indiana - South Vectren Energy Delivery of Ohio Vectren’s Utility Group – Service Territories & Rate Base OH IN Gas Utilities’ Rate Base: ~$1.2 billion* • ~$0.9 billion Indiana • ~$0.3 billion Ohio • ~10.2% Total Gas Allowed R
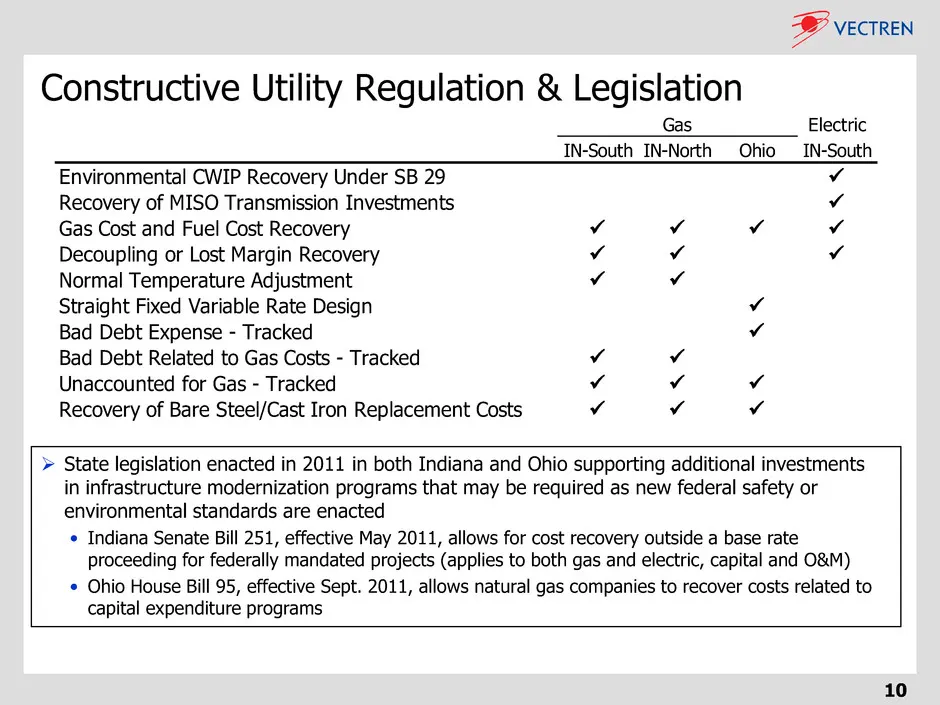
Slide 10: Constructive Utility Regulation & Legislation
10 Constructive Utility Regulation & Legislation Electric IN-South IN-North Ohio IN-South Environmental CWIP Recovery Under SB 29 Recovery of MISO Transmission Investments Gas Cost and Fuel Cost Recovery Decoupling or Lost Margin Recovery Normal Temperature Adjustment Straight
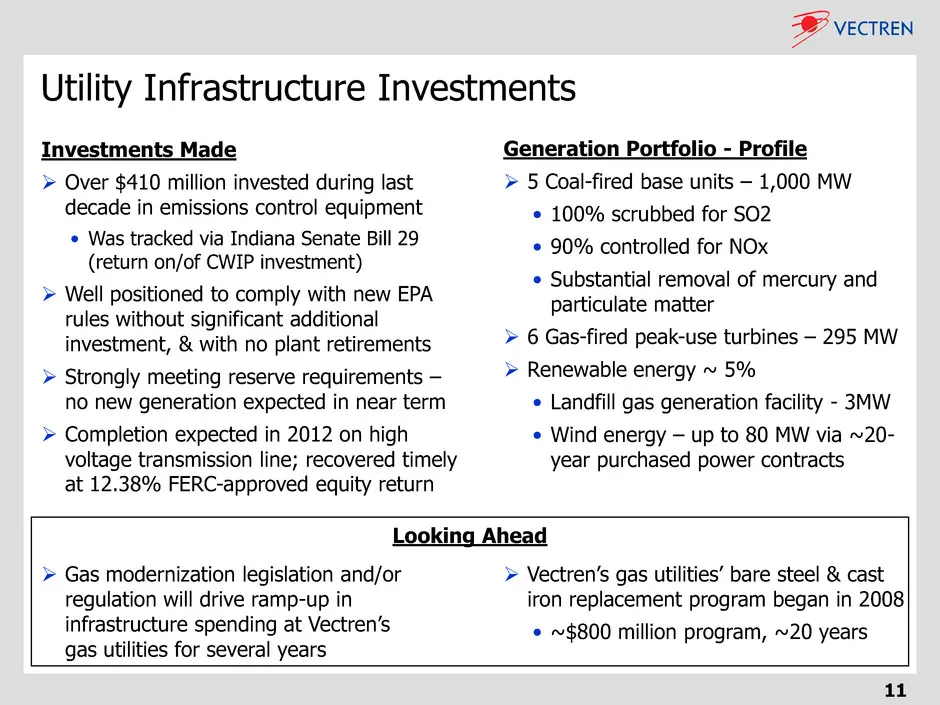
Slide 11: Generation Portfolio - Profile
11 Generation Portfolio - Profile 5 Coal-fired base units – 1,000 MW • 100% scrubbed for SO2 • 90% controlled for NOx • Substantial removal of mercury and particulate matter 6 Gas-fired peak-use turbines – 295 MW Renewable energy ~ 5% • Landfill gas generation facility - 3MW • Wind energy – up
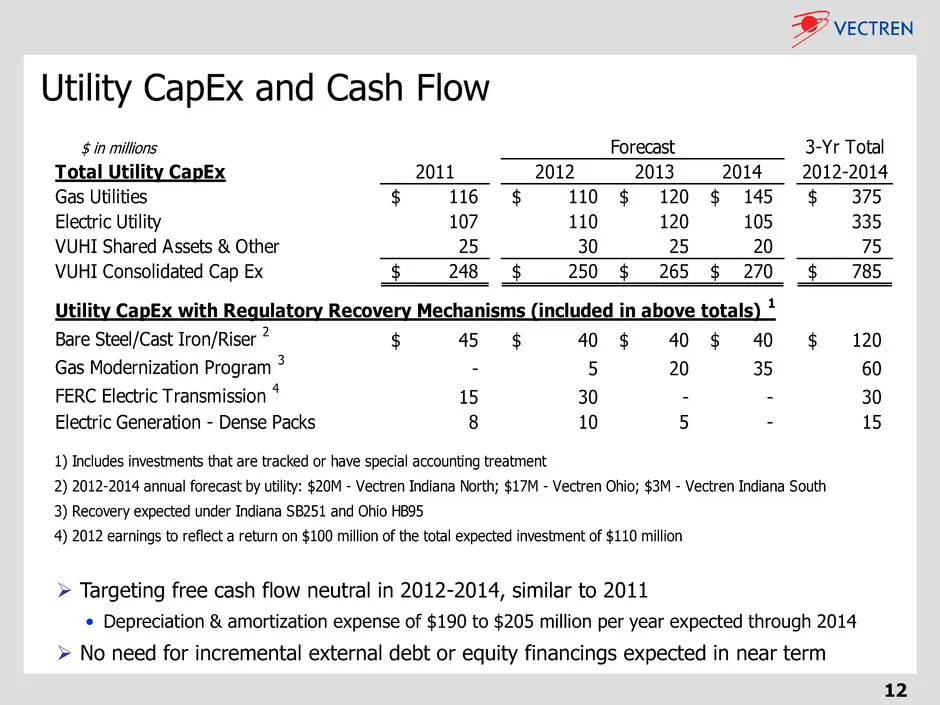
Slide 12: Utility CapEx and Cash Flow
12 Utility CapEx and Cash Flow $ in millions 3-Yr Total Total Utility CapEx 2011 2012 2013 2014 2012-2014 Gas Utilities 116$ 110$ 120$ 145$ 375$ Electric Utility 107 110 120 105 335 VUHI Shared Assets & Other 25 30 25 20 75 VUHI Consolidated Cap Ex 248$ 250$ 265$ 270$ 785$ Utility CapEx with Regulat
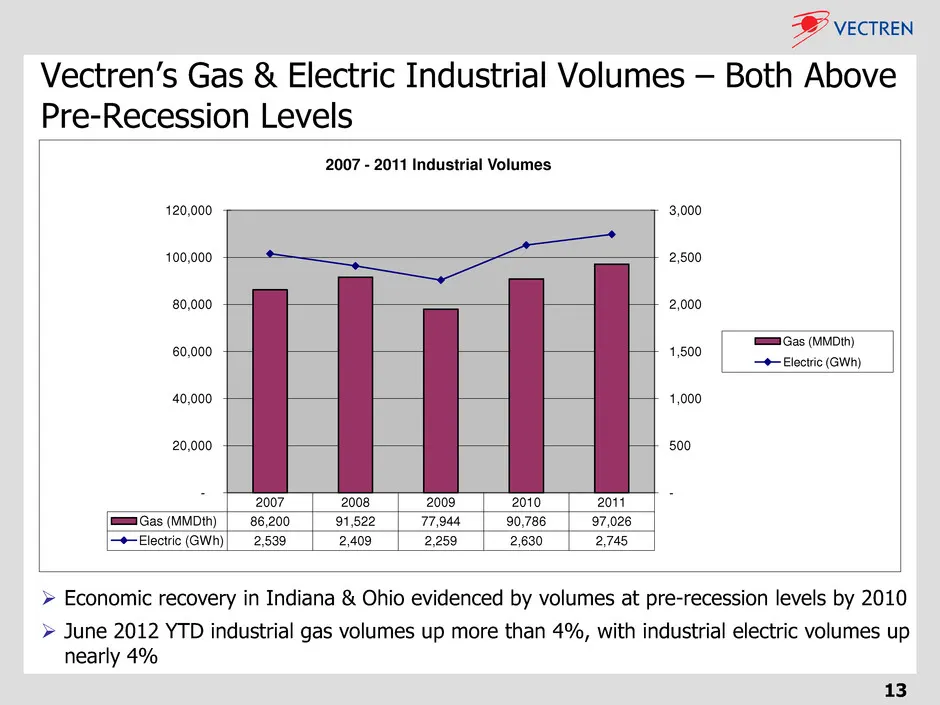
Slide 13: Industrial Volumes Above Pre-Recession Levels
Vectren’s Gas & Electric Industrial Volumes – Both Above Pre-Recession Levels 13 Economic recovery in Indiana & Ohio evidenced by volumes at pre-recession levels by 2010 June 2012 YTD industrial gas volumes up more than 4%, with industrial electric volumes up nearly 4% 2007 2008 2009 2010 2011 G
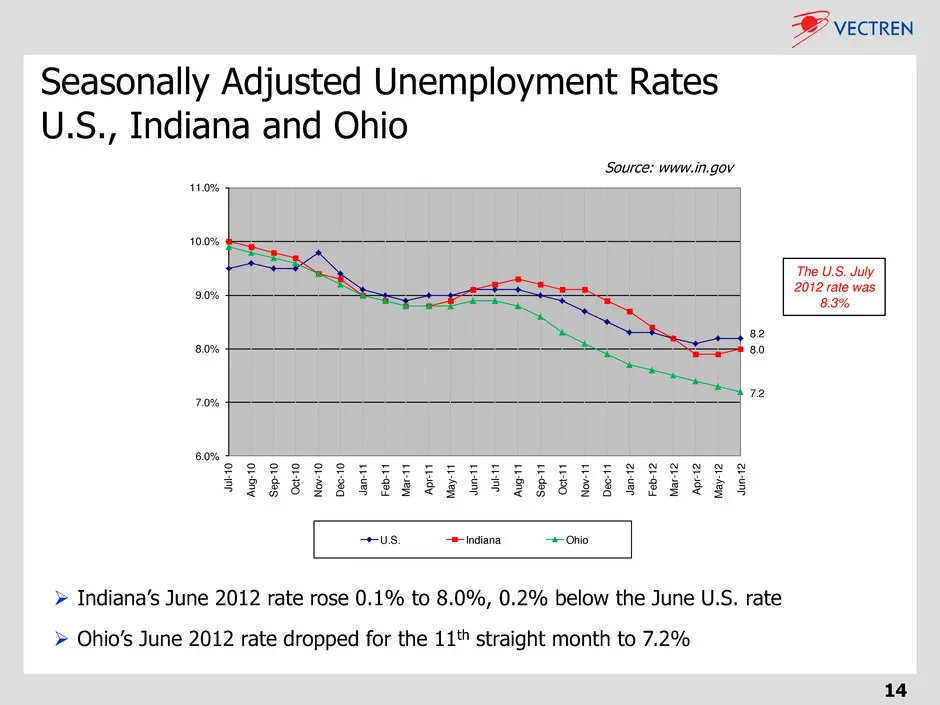
Slide 14: Seasonally Adjusted Unemployment Rates U.S., Indiana and Ohio
Seasonally Adjusted Unemployment Rates U.S., Indiana and Ohio Indiana’s June 2012 rate rose 0.1% to 8.0%, 0.2% below the June U.S. rate Ohio’s June 2012 rate dropped for the 11th straight month to 7.2% 8.2 8.0 7.2 6.0% 7.0% 8.0% 9.0% 10.0% 11.0% Ju l-1 0 Au g- 10 Se p- 10 O ct -1 0 N ov -1 0 D e
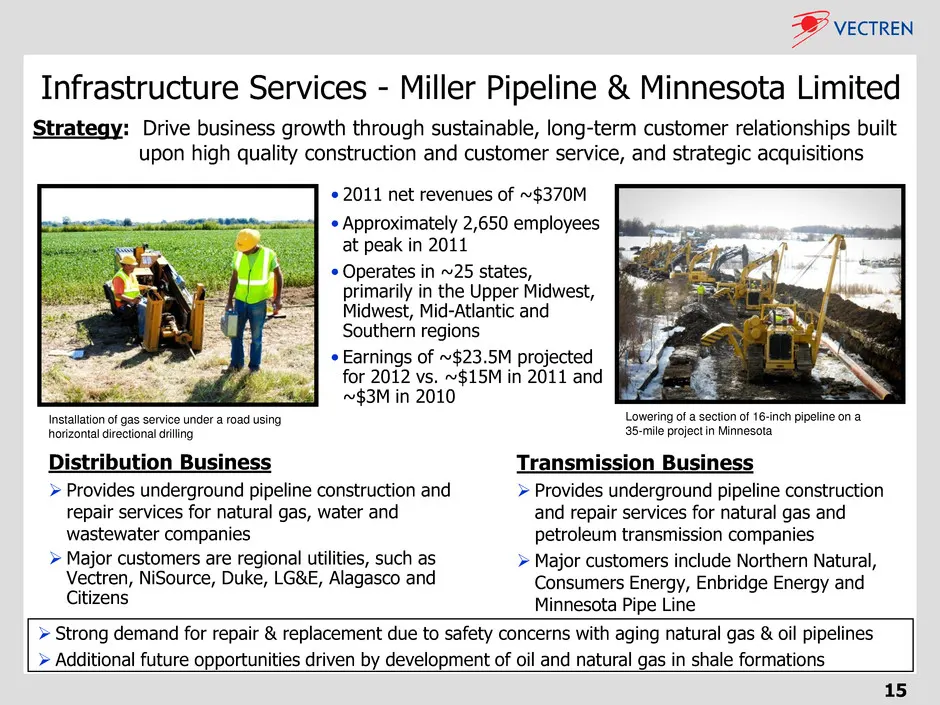
Slide 15: Infrastructure Services - Miller Pipeline & Minnesota Limited
Infrastructure Services - Miller Pipeline & Minnesota Limited Distribution Business Provides underground pipeline construction and repair services for natural gas, water and wastewater companies Major customers are regional utilities, such as Vectren, NiSource, Duke, LG&E, Alagasco and Citizens T
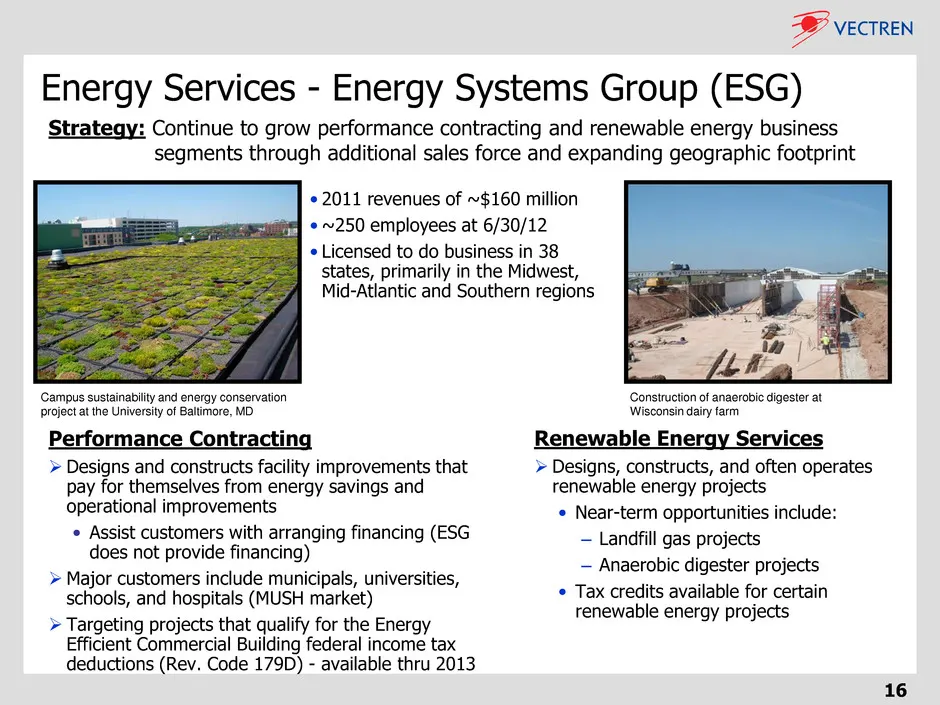
Slide 16: Energy Services - Energy Systems Group
16 Energy Services - Energy Systems Group (ESG) Performance Contracting Designs and constructs facility improvements that pay for themselves from energy savings and operational improvements • Assist customers with arranging financing (ESG does not provide financing) Major customers include munici
Slide 17: Coal Mining – Vectren Fuels
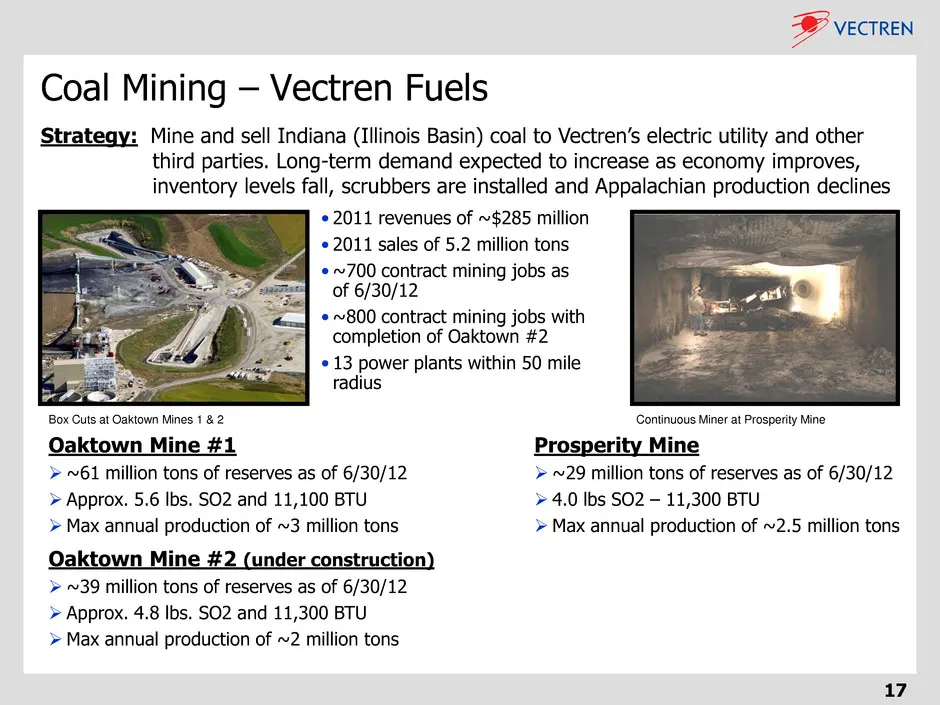
17 Coal Mining – Vectren Fuels • 2011 revenues of ~$285 million • 2011 sales of 5.2 million tons • ~700 contract mining jobs as of 6/30/12 • ~800 contract mining jobs with completion of Oaktown #2 • 13 power plants within 50 mile radius Strategy: Mine and sell Indiana (Illinois Basin) coal to Vectre
Slide 18: Energy Marketing – ProLiance
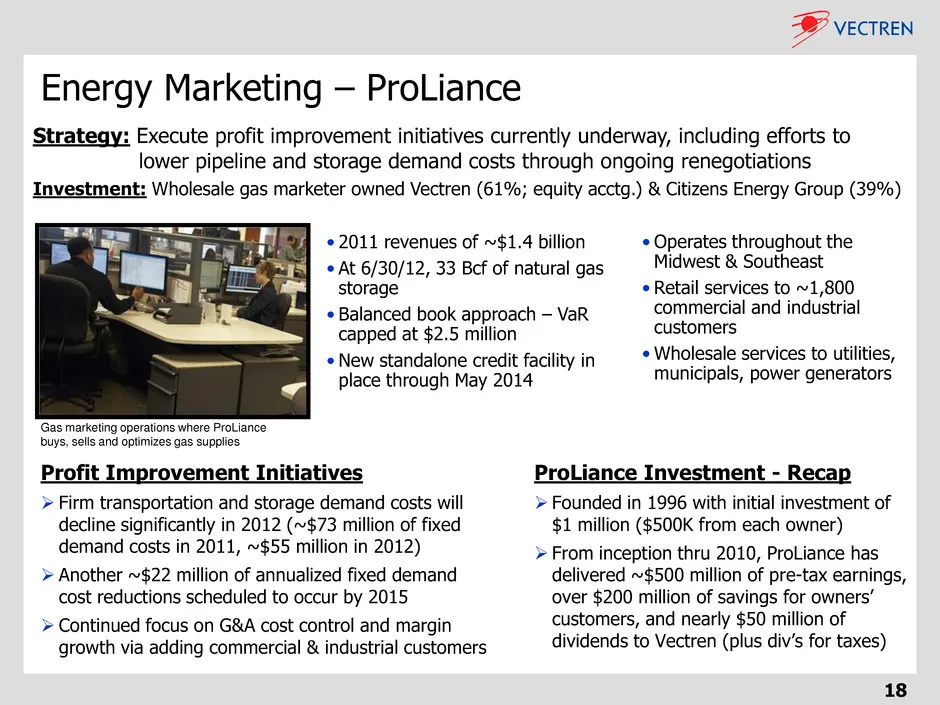
18 Energy Marketing – ProLiance Profit Improvement Initiatives Firm transportation and storage demand costs will decline significantly in 2012 (~$73 million of fixed demand costs in 2011, ~$55 million in 2012) Another ~$22 million of annualized fixed demand cost reductions scheduled to occur by
Slide 19: Vectren: Strength, Stability, Utility
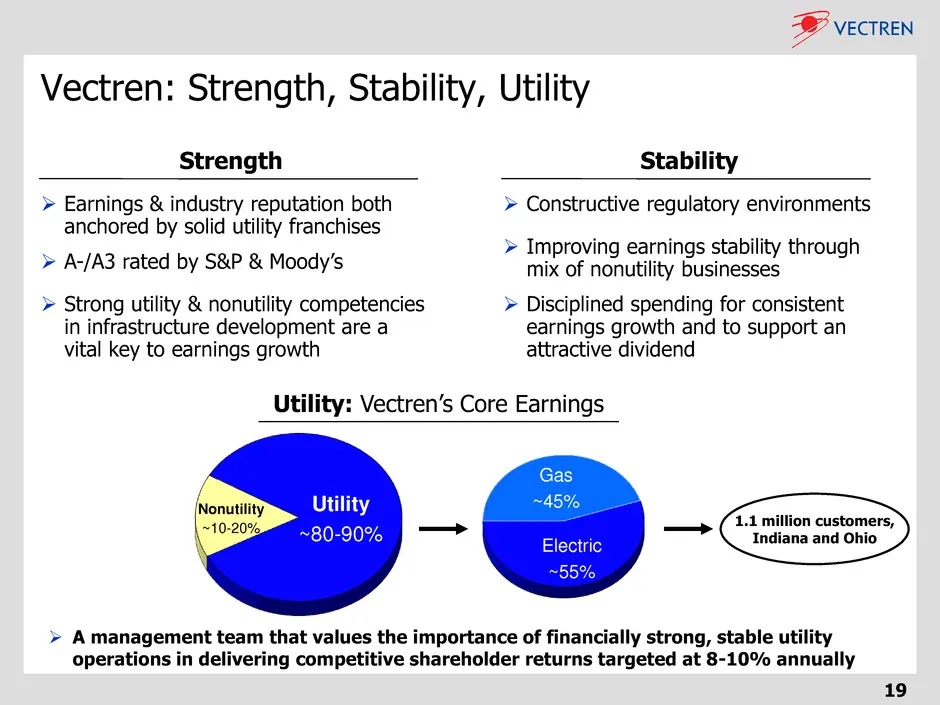
19 Vectren: Strength, Stability, Utility Utility ~80-90% Nonutility ~10-20% Utility: Vectren’s Core Earnings Electric ~55% Gas ~45% Strength Stability Earnings & industry reputation both anchored by solid utility franchises A-/A3 rated by S&P & Moody’s Strong utility & nonutility competencies
Slide 20: 20
20
Slide 21: Vectren 2nd Quarter & YTD 2012 Review
21 Vectren 2nd Quarter & YTD 2012 Review
Slide 22: Consolidated Second Quarter 2012 Results
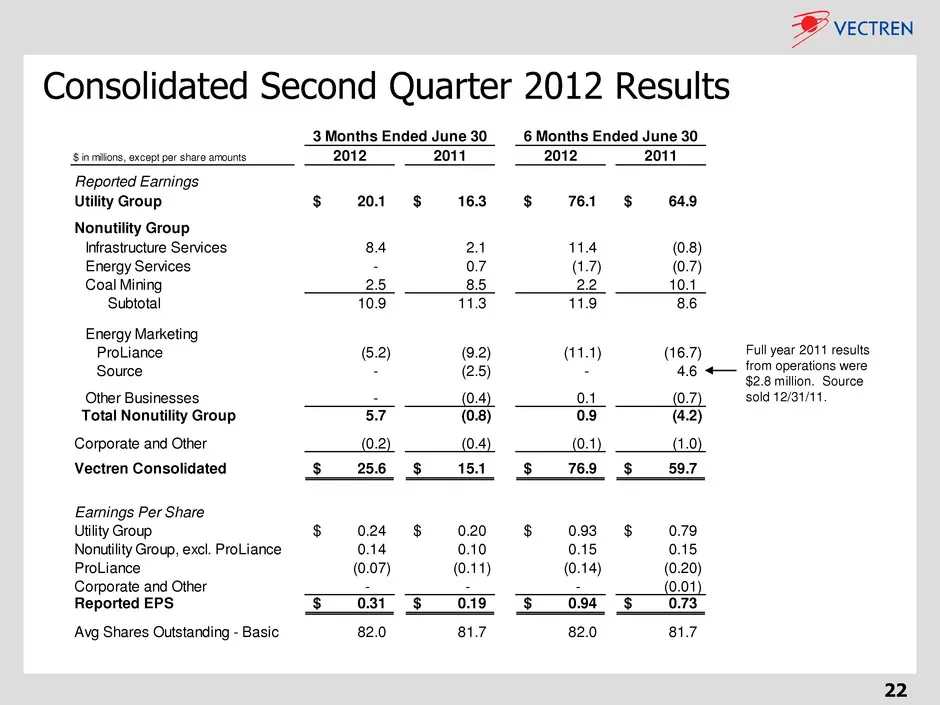
22 Consolidated Second Quarter 2012 Results $ in millions, except per share amounts 2012 2011 2012 2011 Reported Earnings Utility Group 20.1$ 16.3$ 76.1$ 64.9$ Nonutility Group Infrastructure Services 8.4 2.1 11.4 (0.8) Energy Services - 0.7 (1.7) (0.7) Coal Mining 2.5 8.5 2.2 10.1 Subtotal 10.9 11.
Slide 23: 2012 - Second Quarter Review & Outlook
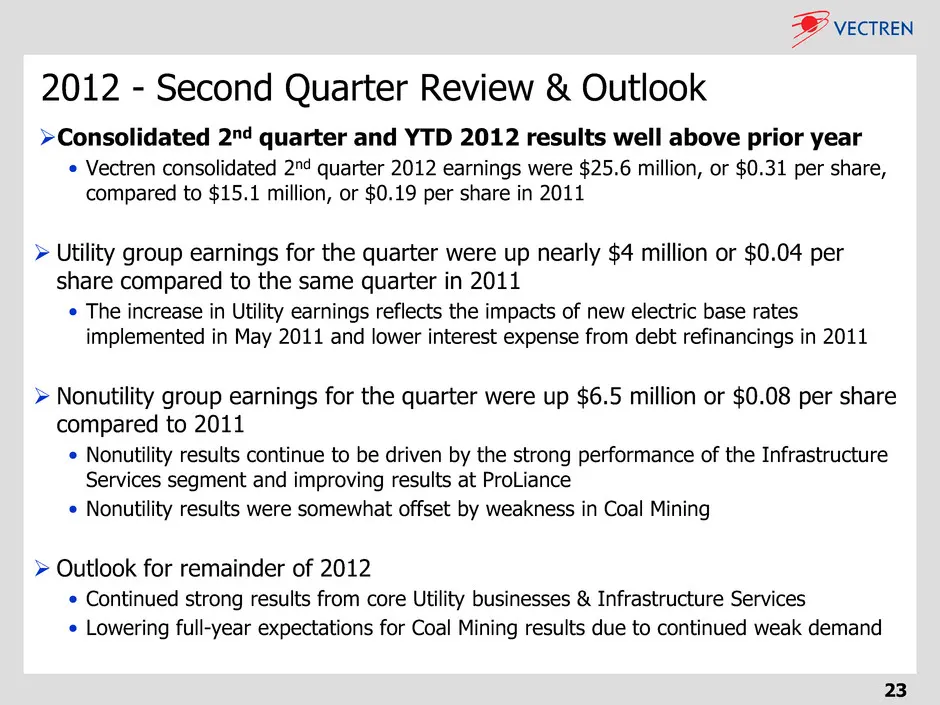
2012 - Second Quarter Review & Outlook Consolidated 2nd quarter and YTD 2012 results well above prior year • Vectren consolidated 2nd quarter 2012 earnings were $25.6 million, or $0.31 per share, compared to $15.1 million, or $0.19 per share in 2011 Utility group earnings for the quarter were up
Slide 24: 2012 EPS Guidance Update
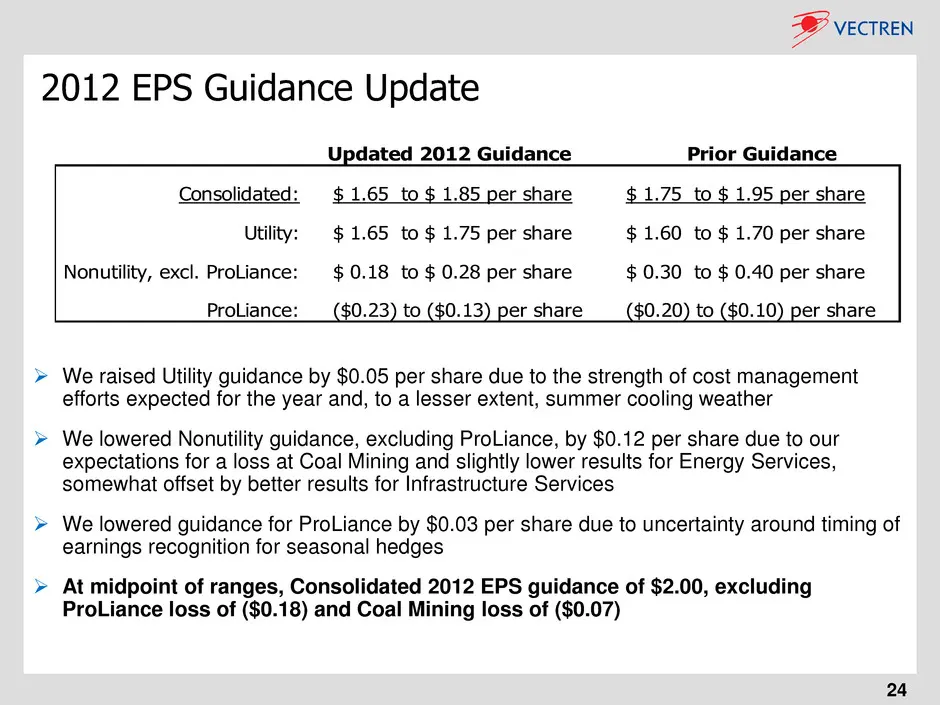
2012 EPS Guidance Update We raised Utility guidance by $0.05 per share due to the strength of cost management efforts expected for the year and, to a lesser extent, summer cooling weather We lowered Nonutility guidance, excluding ProLiance, by $0.12 per share due to our expectations for a loss a
Slide 25: ProLiance
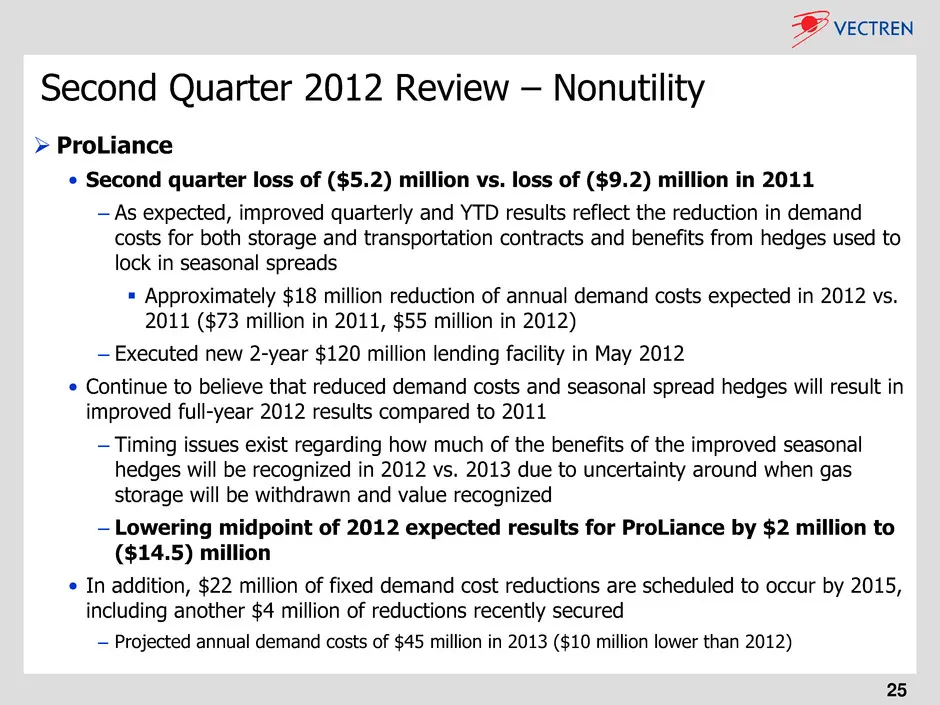
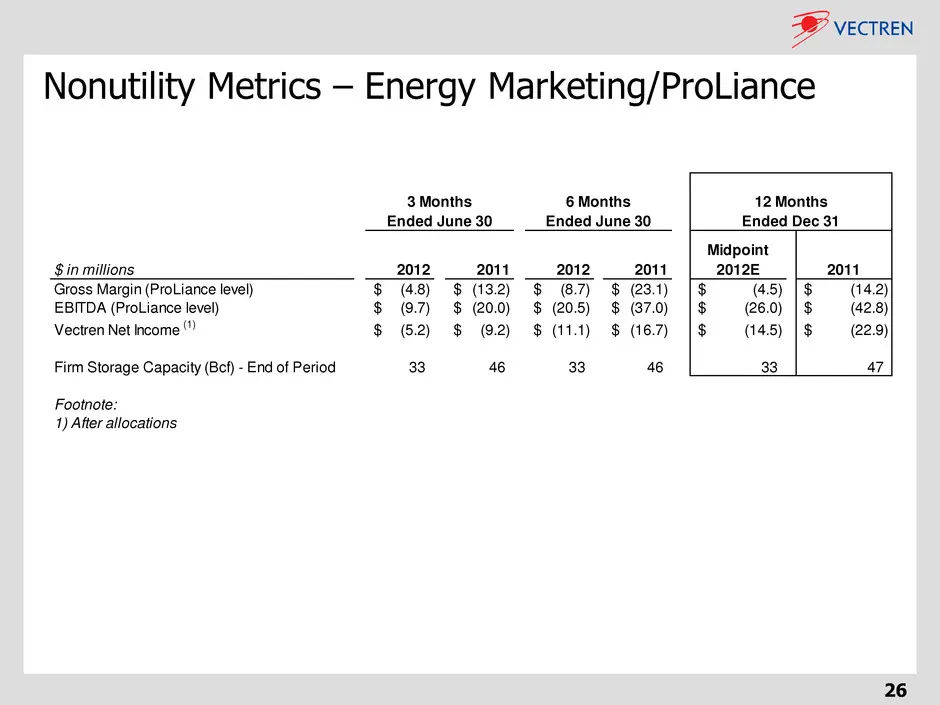
ProLiance • Second quarter loss of ($5.2) million vs. loss of ($9.2) million in 2011 – As expected, improved quarterly and YTD results reflect the reduction in demand costs for both storage and transportation contracts and benefits from hedges used to lock in seasonal spreads Approximately $18 m
Slide 26: Nonutility Metrics – Energy Marketing/ProLiance
26 Nonutility Metrics – Energy Marketing/ProLiance $ in millions 2012 2011 2012 2011 Midpoint 2012E 2011 Gross Margin (ProLiance level) (4.8)$ (13.2)$ (8.7)$ (23.1)$ (4.5)$ (14.2)$ EBITDA (ProLiance level) (9.7)$ (20.0)$ (20.5)$ (37.0)$ (26.0)$ (42.8)$ Vectr n Net Income (1) (5.2)$ (9.2)$ (11.1)$ (1
Slide 27: Coal Mining
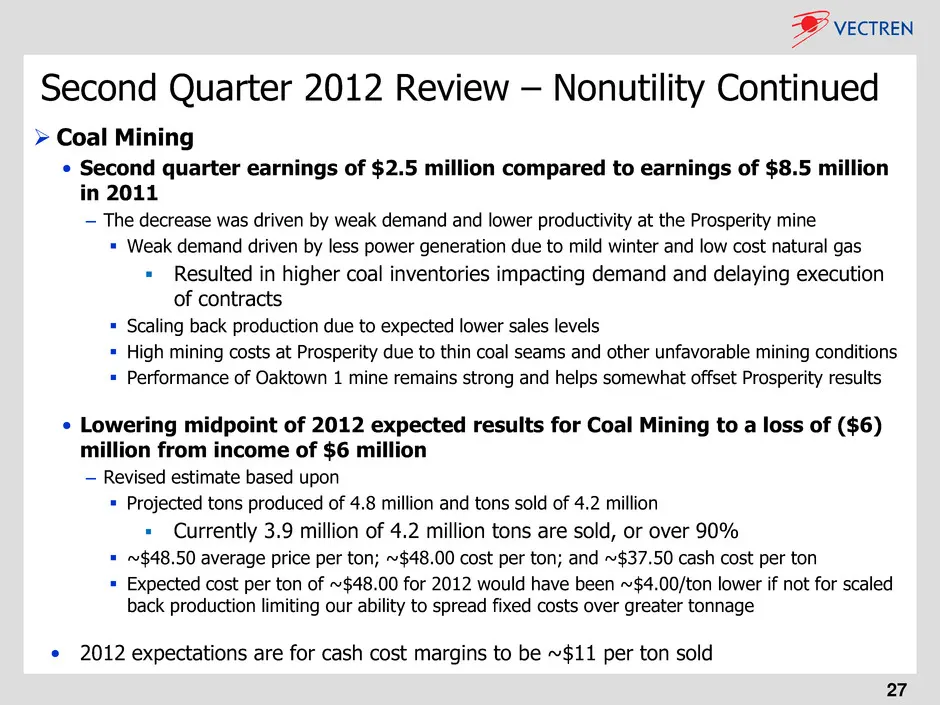
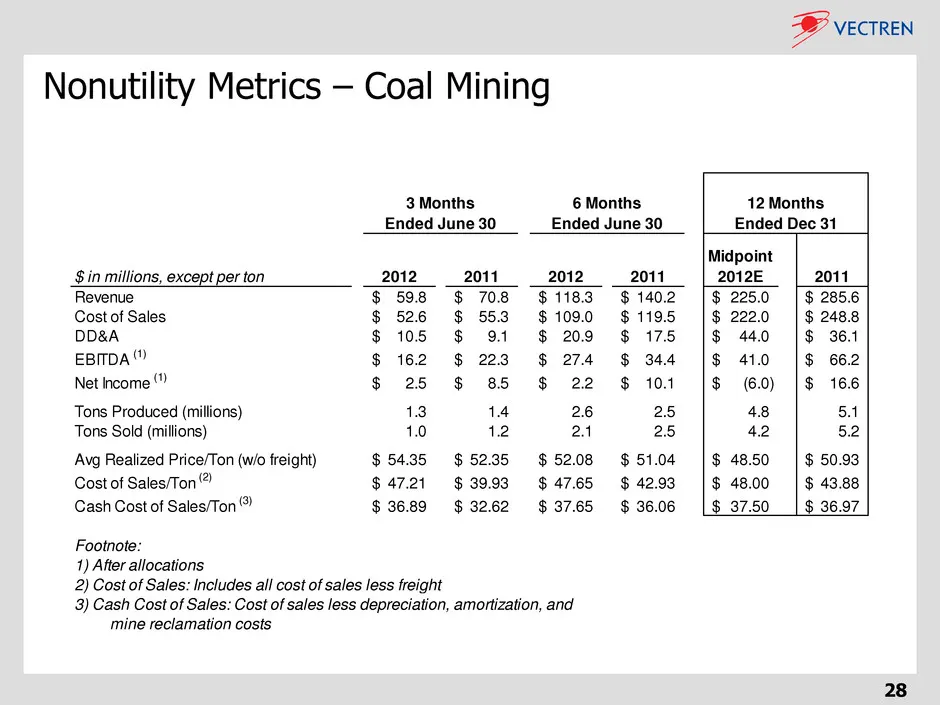
Coal Mining • Second quarter earnings of $2.5 million compared to earnings of $8.5 million in 2011 – The decrease was driven by weak demand and lower productivity at the Prosperity mine Weak demand driven by less power generation due to mild winter and low cost natural gas Resulted in higher c
Slide 28: Nonutility Metrics – Coal Mining
28 Nonutility Metrics – Coal Mining $ in millions, except per ton 2012 2011 2012 2011 Midpoint 2012E 2011 Revenue 59.8$ 70.8$ 118.3$ 140.2$ 225.0$ 285.6$ Cost of Sales 52.6$ 55.3$ 109.0$ 119.5$ 222.0$ 248.8$ DD&A 10.5$ 9.1$ 20.9$ 17.5$ 44.0$ 36.1$ EBITDA (1) 16.2$ 22.3$ 27.4$ 34.4$ 41.0$ 66.2$ Net I
Slide 29: Second Quarter 2012 Review – Nonutility Continued: Energy Services
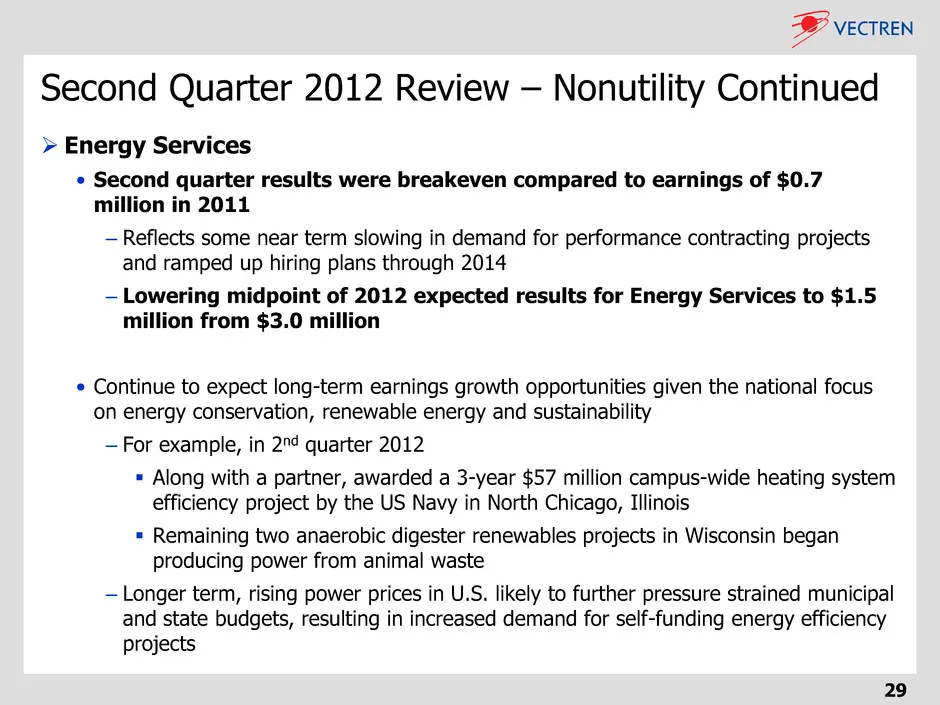
Second Quarter 2012 Review – Nonutility Continued 29 Energy Services • Second quarter results were breakeven compared to earnings of $0.7 million in 2011 – Reflects some near term slowing in demand for performance contracting projects and ramped up hiring plans through 2014 – Lowering midpoint of
Slide 30: Nonutility Metrics – Energy Services
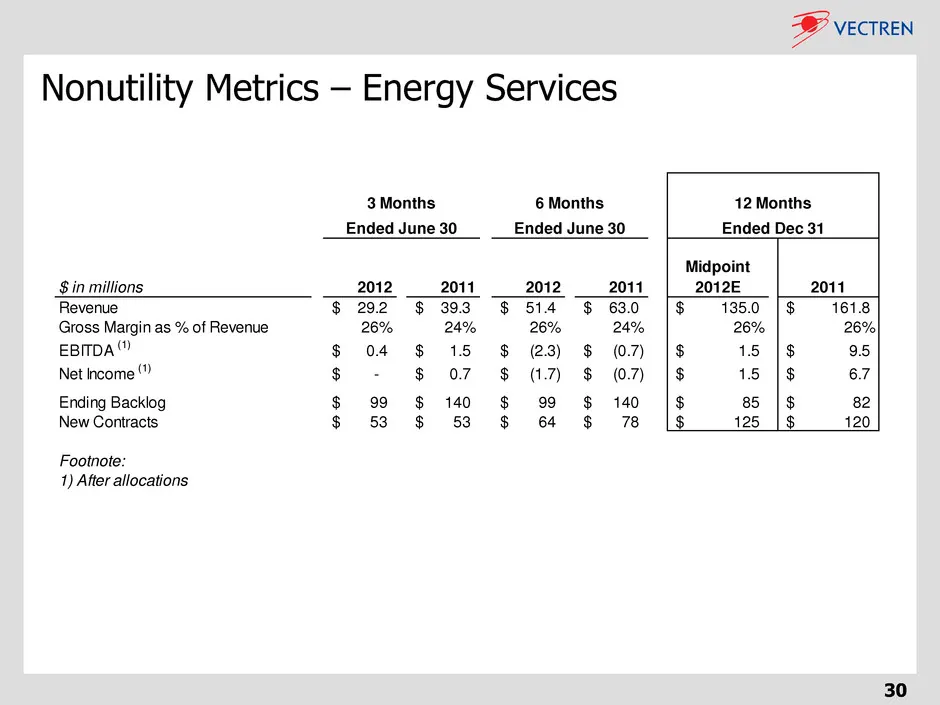
30 Nonutility Metrics – Energy Services $ in millions 2012 2011 2012 2011 Midpoint 2012E 2011 Revenue 29.2$ 39.3$ 51.4$ 63.0$ 135.0$ 161.8$ Gross Margin as % of Revenue 26% 24% 26% 24% 26% 26% EBITDA (1) 0.4$ 1.5$ (2.3)$ (0.7)$ 1.5$ 9.5$ Net Income (1) -$ 0.7$ (1.7)$ (0.7)$ 1.5$ 6.7$ Ending Backlog
Slide 31: Second Quarter 2012 Review – Nonutility Continued: Infrastructure Services
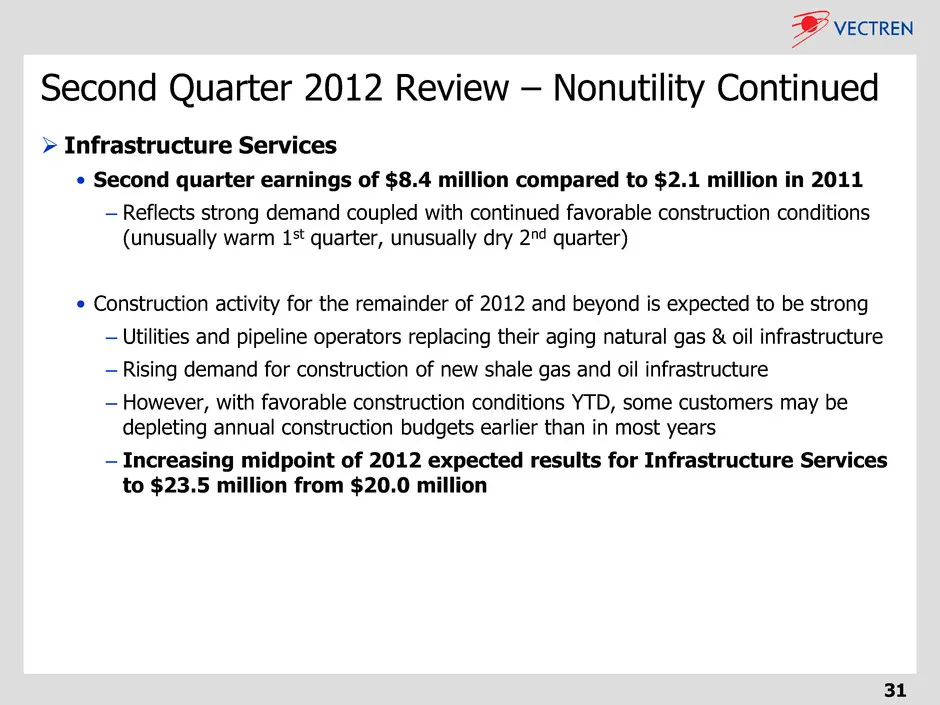
Second Quarter 2012 Review – Nonutility Continued 31 Infrastructure Services • Second quarter earnings of $8.4 million compared to $2.1 million in 2011 – Reflects strong demand coupled with continued favorable construction conditions (unusually warm 1st quarter, unusually dry 2nd quarter) • Constr
Slide 32: Nonutility Metrics – Infrastructure Services
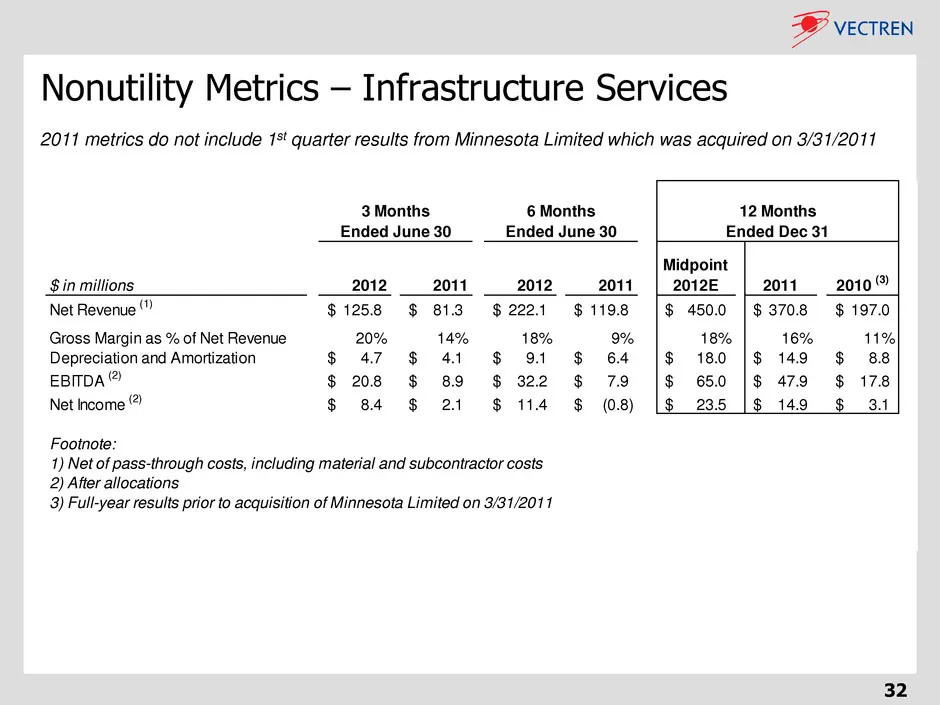
32 Nonutility Metrics – Infrastructure Services $ in millions 2012 2011 2012 2011 Midpoint 2012E 2011 2010 (3) Net Revenue (1) 125.8$ 81.3$ 222.1$ 119.8$ 450.0$ 370.8$ 197.0$ Gross Margin as % of Net Revenue 20% 14% 18% 9% 18% 16% 11% Depreciation and Amortization 4.7$ 4.1$ 9.1$ 6.4$ 18.0$ 14.9$ 8.8
Slide 33: Second Quarter 2012 Review - Utility
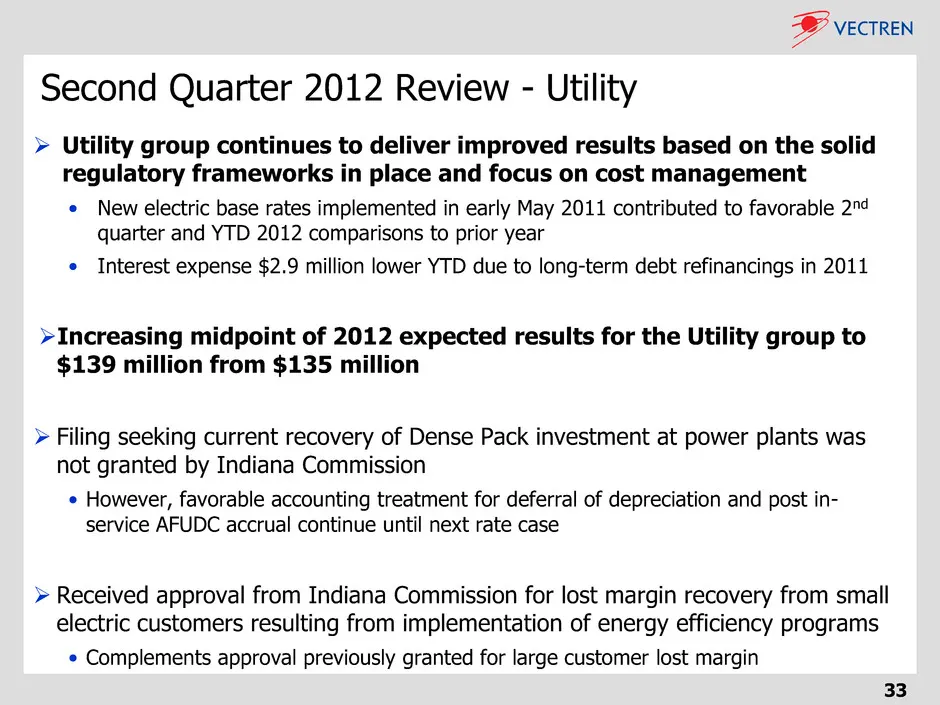
Second Quarter 2012 Review - Utility 33 Utility group continues to deliver improved results based on the solid regulatory frameworks in place and focus on cost management • New electric base rates implemented in early May 2011 contributed to favorable 2nd quarter and YTD 2012 comparisons to prior
Slide 34: Summary of 2012 YTD Results and Outlook
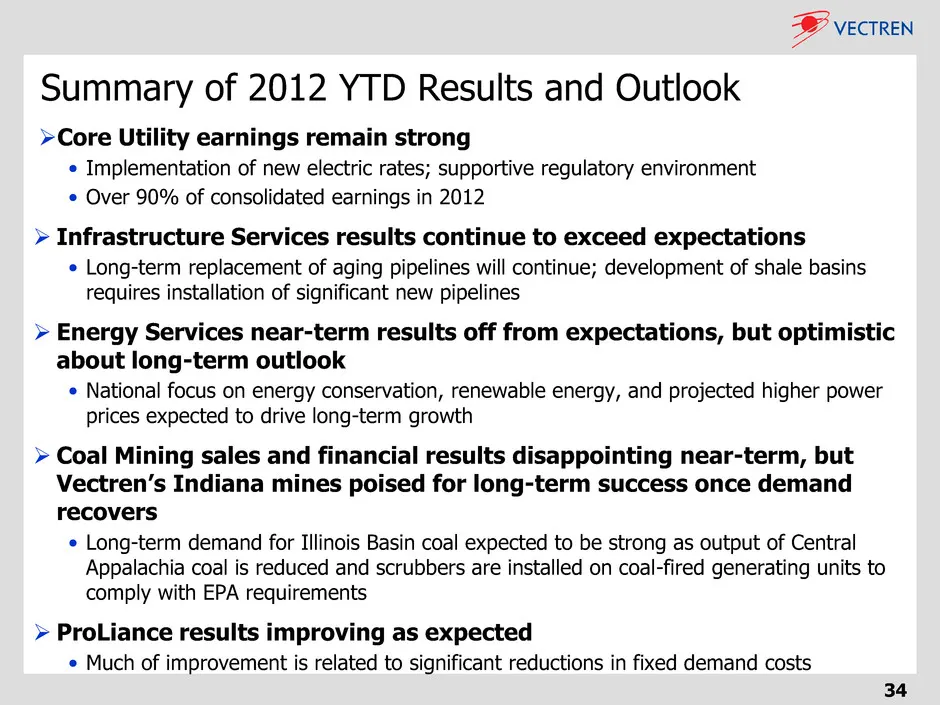
Summary of 2012 YTD Results and Outlook Core Utility earnings remain strong • Implementation of new electric rates; supportive regulatory environment • Over 90% of consolidated earnings in 2012 Infrastructure Services results continue to exceed expectations • Long-term replacement of aging pipeli
Slide 35: Use of Non-GAAP Performance Measures and Per Share Measures
35 Use of Non-GAAP Performance Measures and Per Share Measures Per share earnings contributions of the Utility Group, Nonutility Group, and Corporate and Other are presented herein and are non-GAAP measures. Such per share amounts are based on the earnings contribution of each group included in Vect
Source: SEC EDGAR · 8-K filed Aug 13, 2012
More decks from Vectren Corporation
 Edison Electric Institute Financial Conference 201833 slides · Nov 9, 2018
 Q2 2018 Earnings Presentation31 slides · Aug 3, 2018
 Merger or Acquisition (June 2018)18 slides · Jun 12, 2018
 American Gas Association Financial Forum 201855 slides · May 18, 2018
 Q1 2018 Earnings Presentation27 slides · May 4, 2018
 FY2017 Earnings Presentation43 slides · Feb 27, 2018