Huber + Suhner AG · SIX:HUBN
Huber + Suhner — FY2011 Earnings Presentation
20 slides from Huber + Suhner's earnings presentation, Mar 22, 2012
Slide 1: Business year 2011
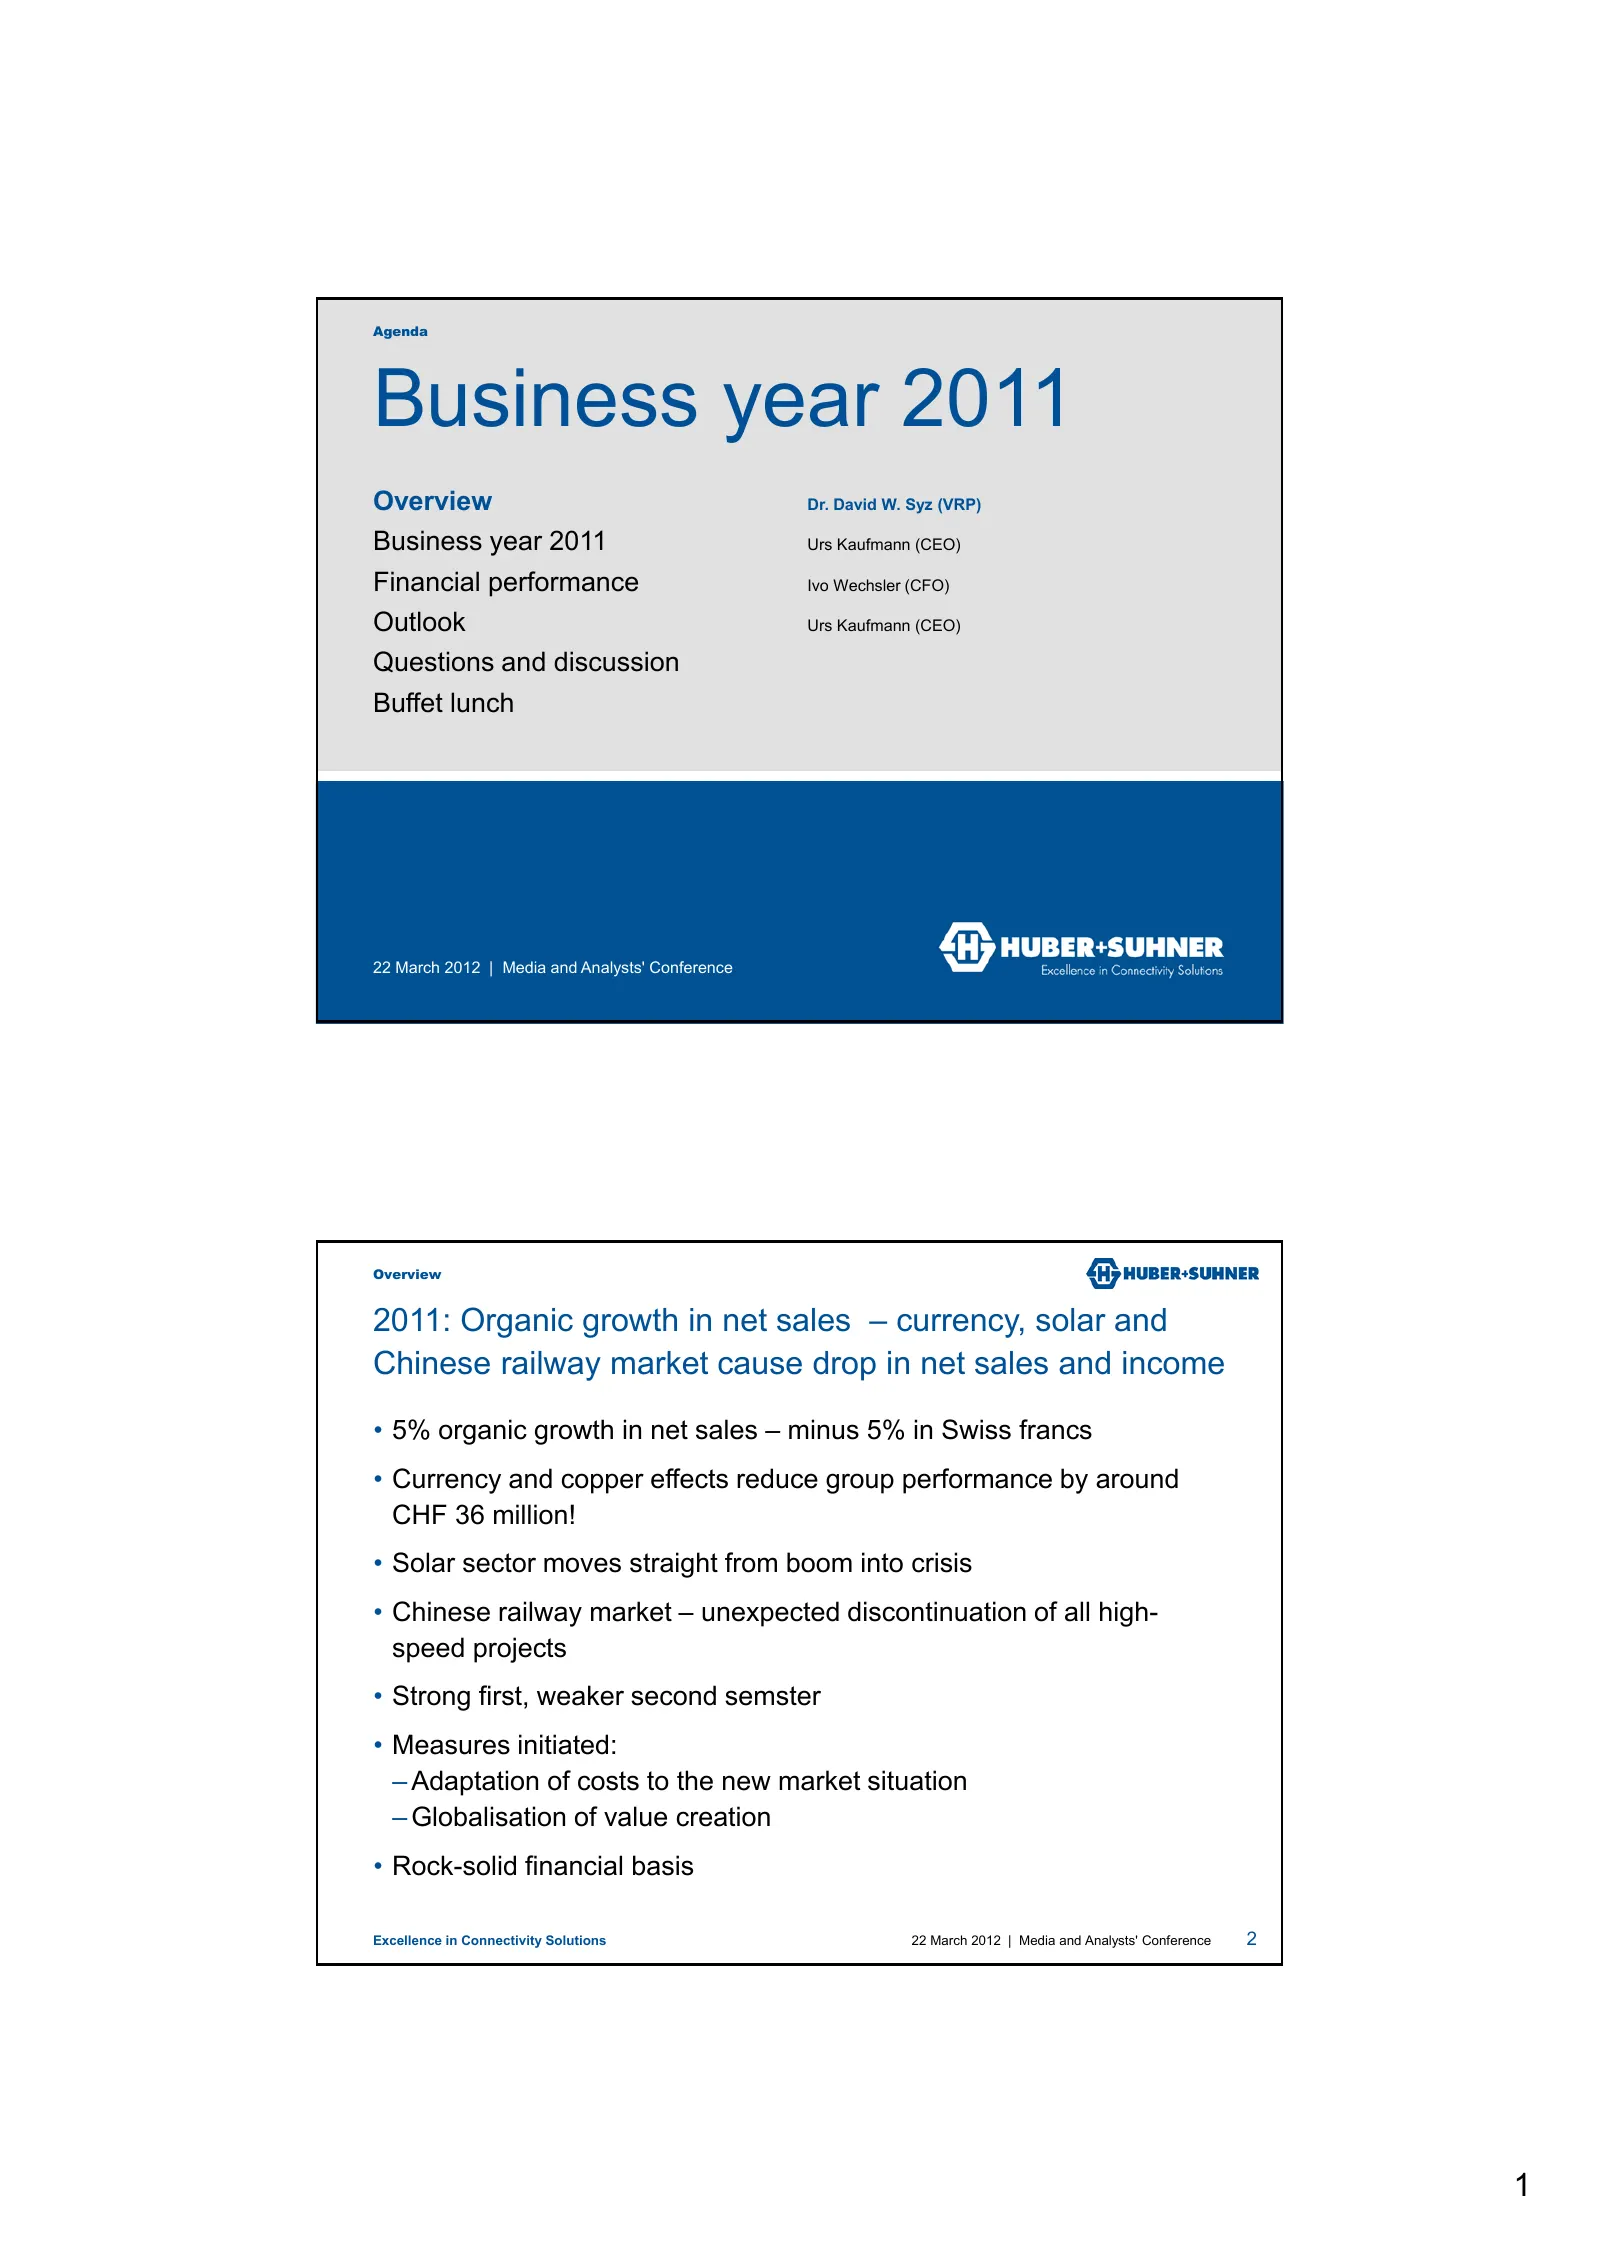
Agenda Business year 2011 Overview Dr. David W. Syz (VRP) Business year 2011 Urs Kaufmann (CEO) Financial performance Ivo Wechsler (CFO) Outlook Urs Kaufmann (CEO) Questions and discussion Buffet lunch 22 March 2012 | Media and Analysts' Conference Overview 2011: Organic growth in net sales – curren
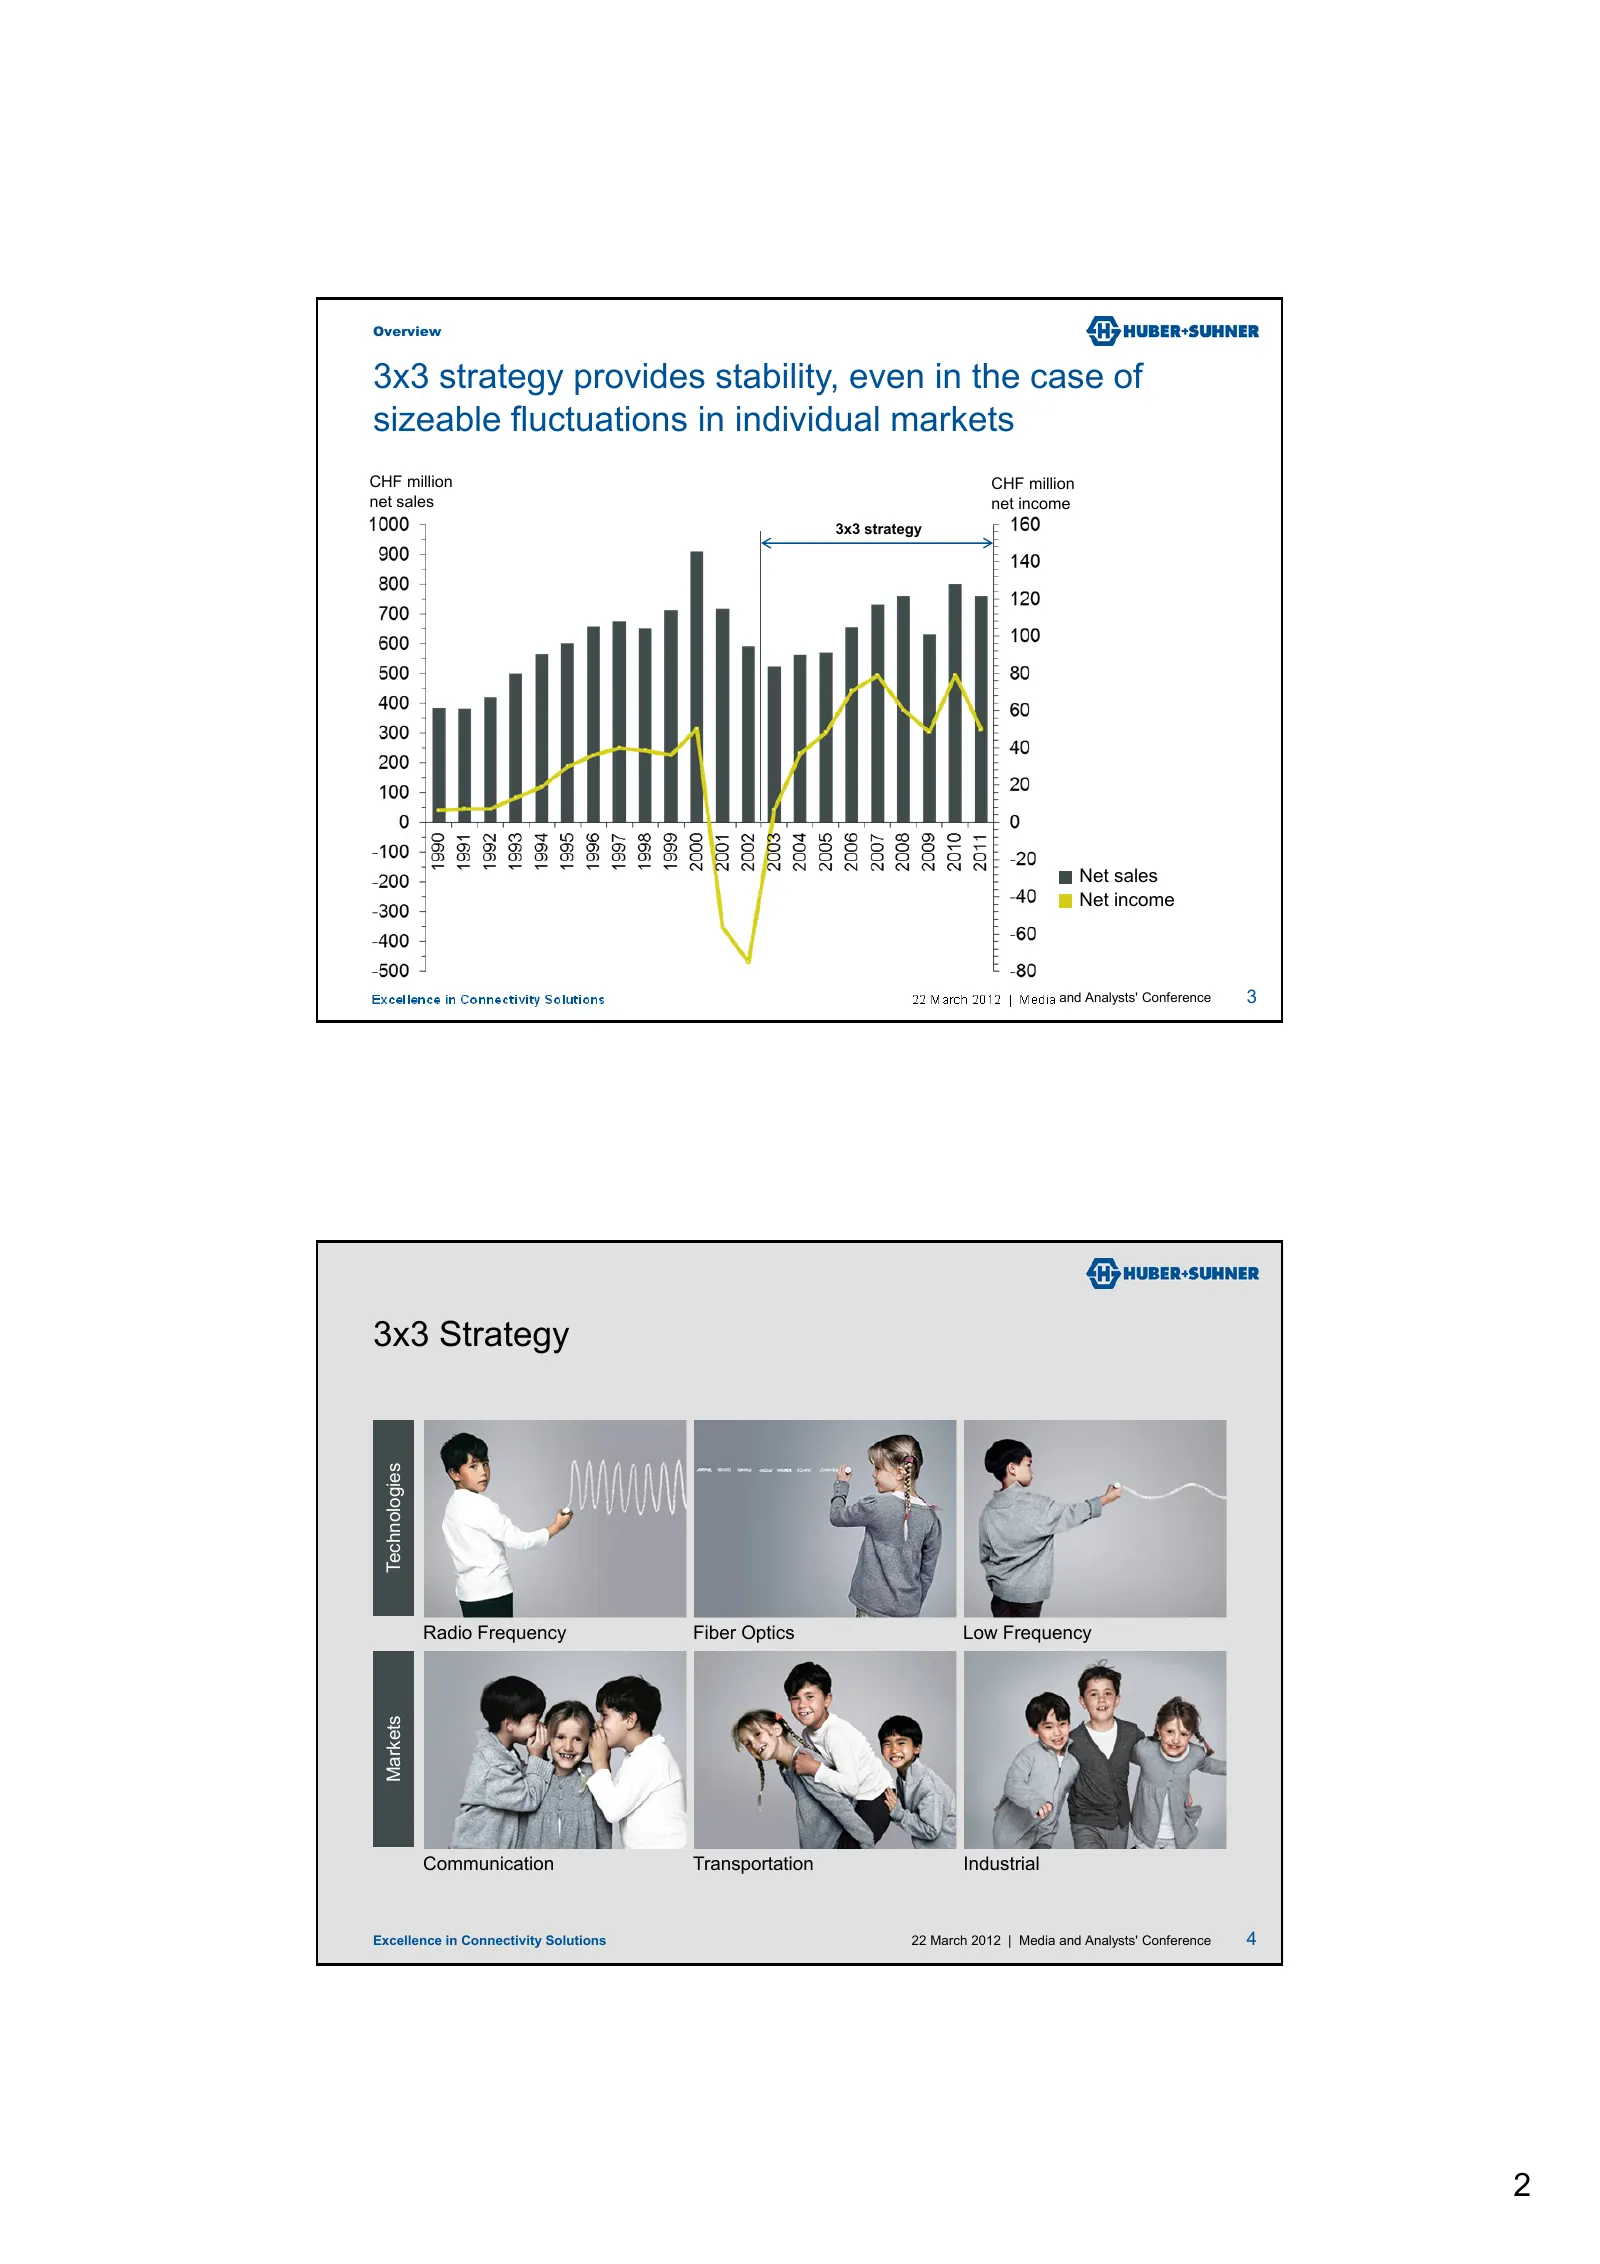
Slide 2: 3x3 strategy provides stability
Overview 3x3 strategy provides stability, even in the case of sizeable fluctuations in individual markets CHF million CHF million net sales net income 3x3 strategy Net sales Net income Excellence in Connectivity Solutions 22 March 2012 | Media and Analysts' Conference 3 3x3 Strategy Technologies Rad
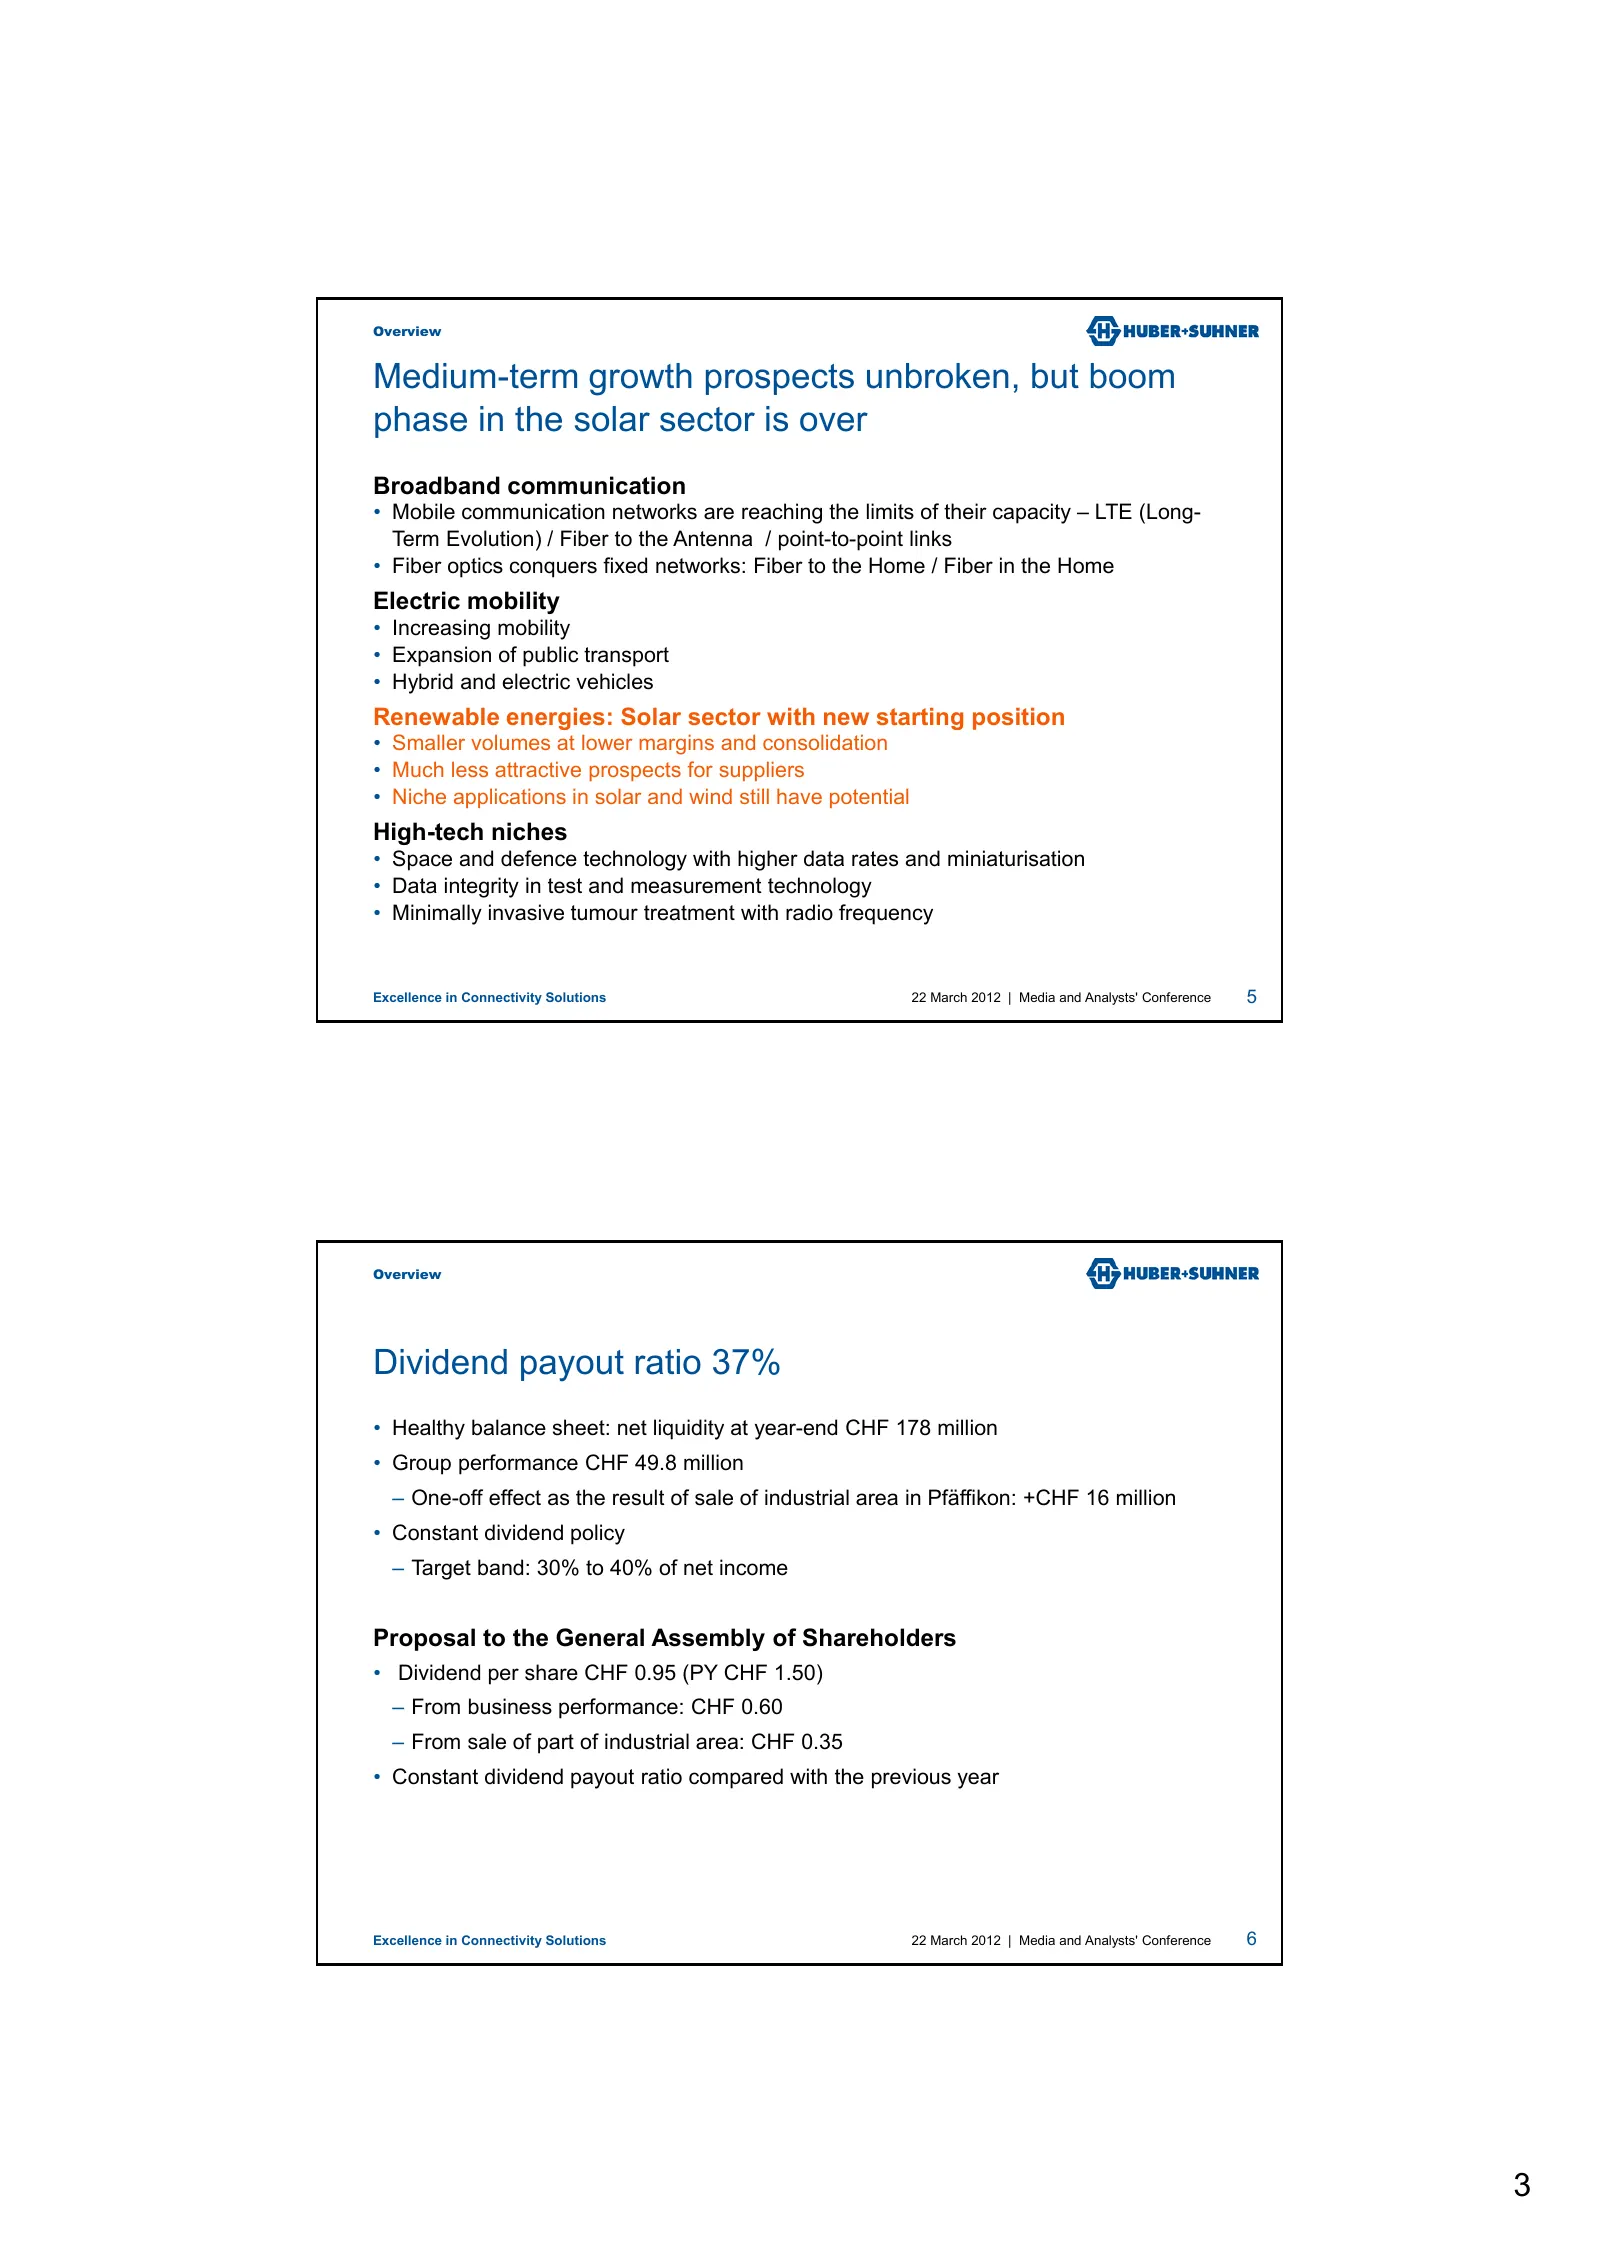
Slide 3: Medium-term growth prospects unbroken; dividend payout ratio 37%
Overview Medium-term growth prospects unbroken, but boom phase in the solar sector is over Broadband communication • Mobile communication networks are reaching the limits of their capacity – LTE (Long- Term Evolution) / Fiber to the Antenna / point-to-point links • Fiber optics conquers fixed networ
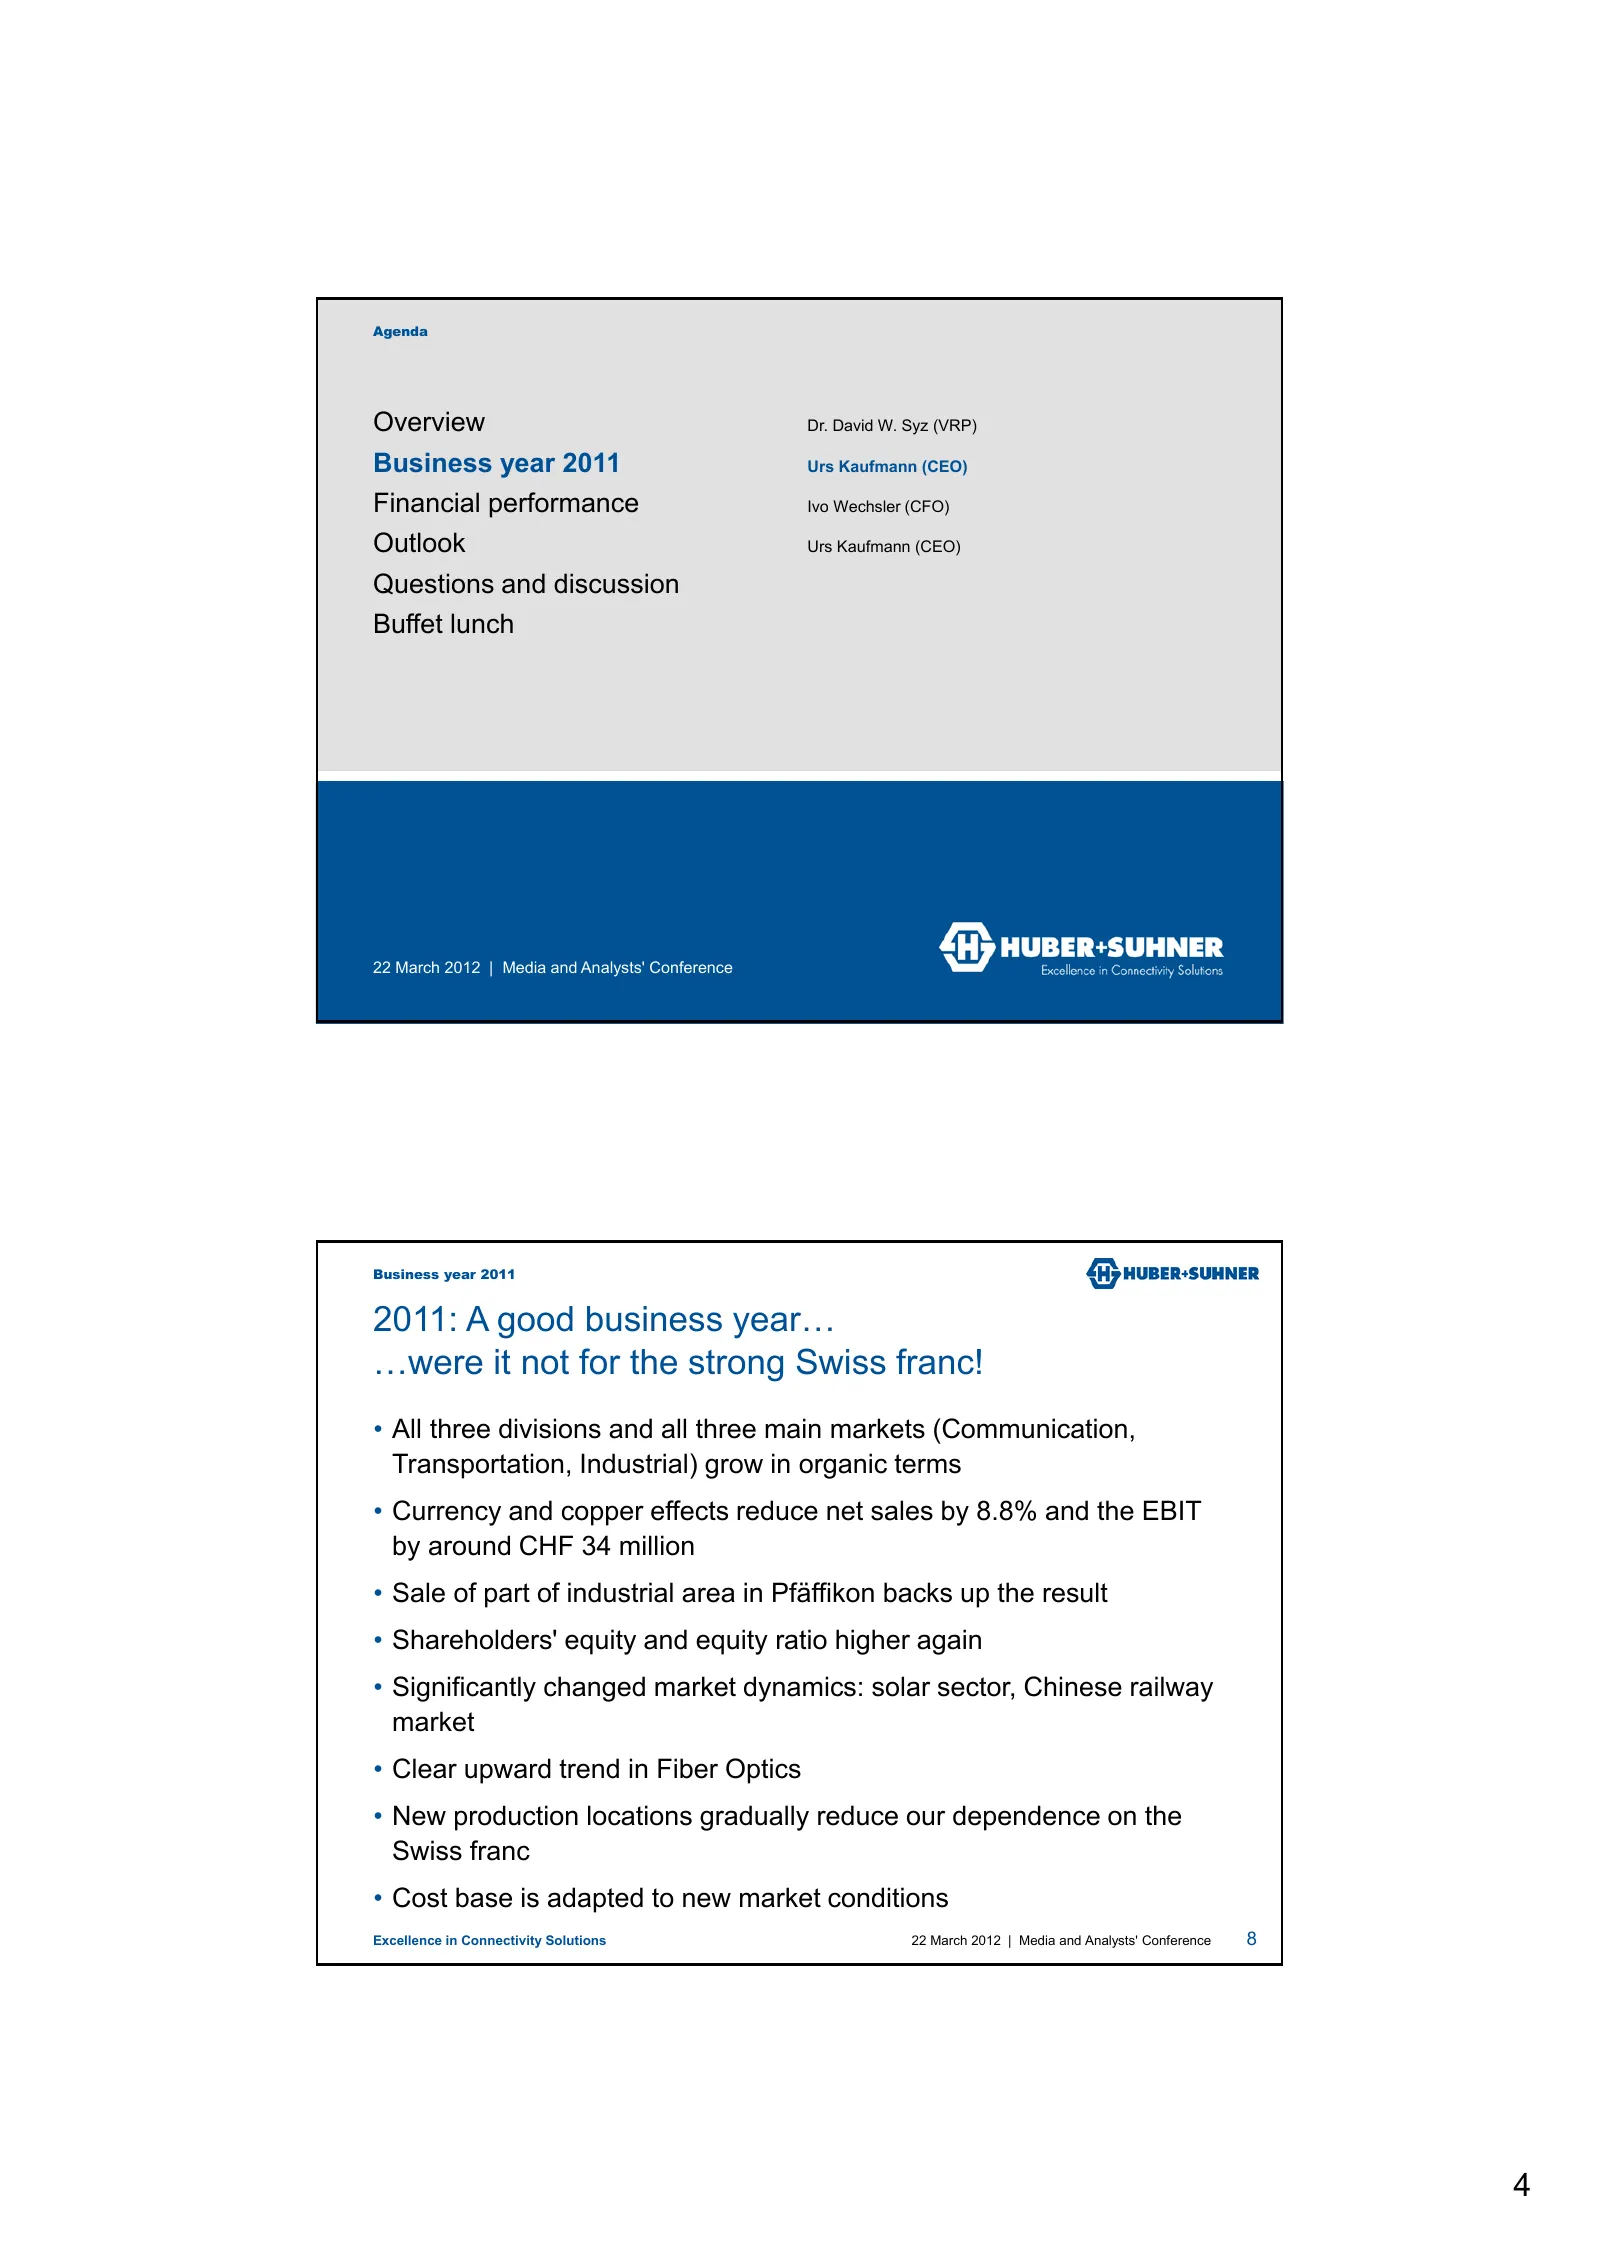
Slide 4: 2011: A good business year… were it not for the strong Swiss franc
Agenda Overview Dr. David W. Syz (VRP) Business year 2011 Urs Kaufmann (CEO) Financial performance Ivo Wechsler (CFO) Outlook Urs Kaufmann (CEO) Questions and discussion Buffet lunch 22 March 2012 | Media and Analysts' Conference Business year 2011 2011: A good business year… …were it not for the st
Slide 5: Figures at a glance
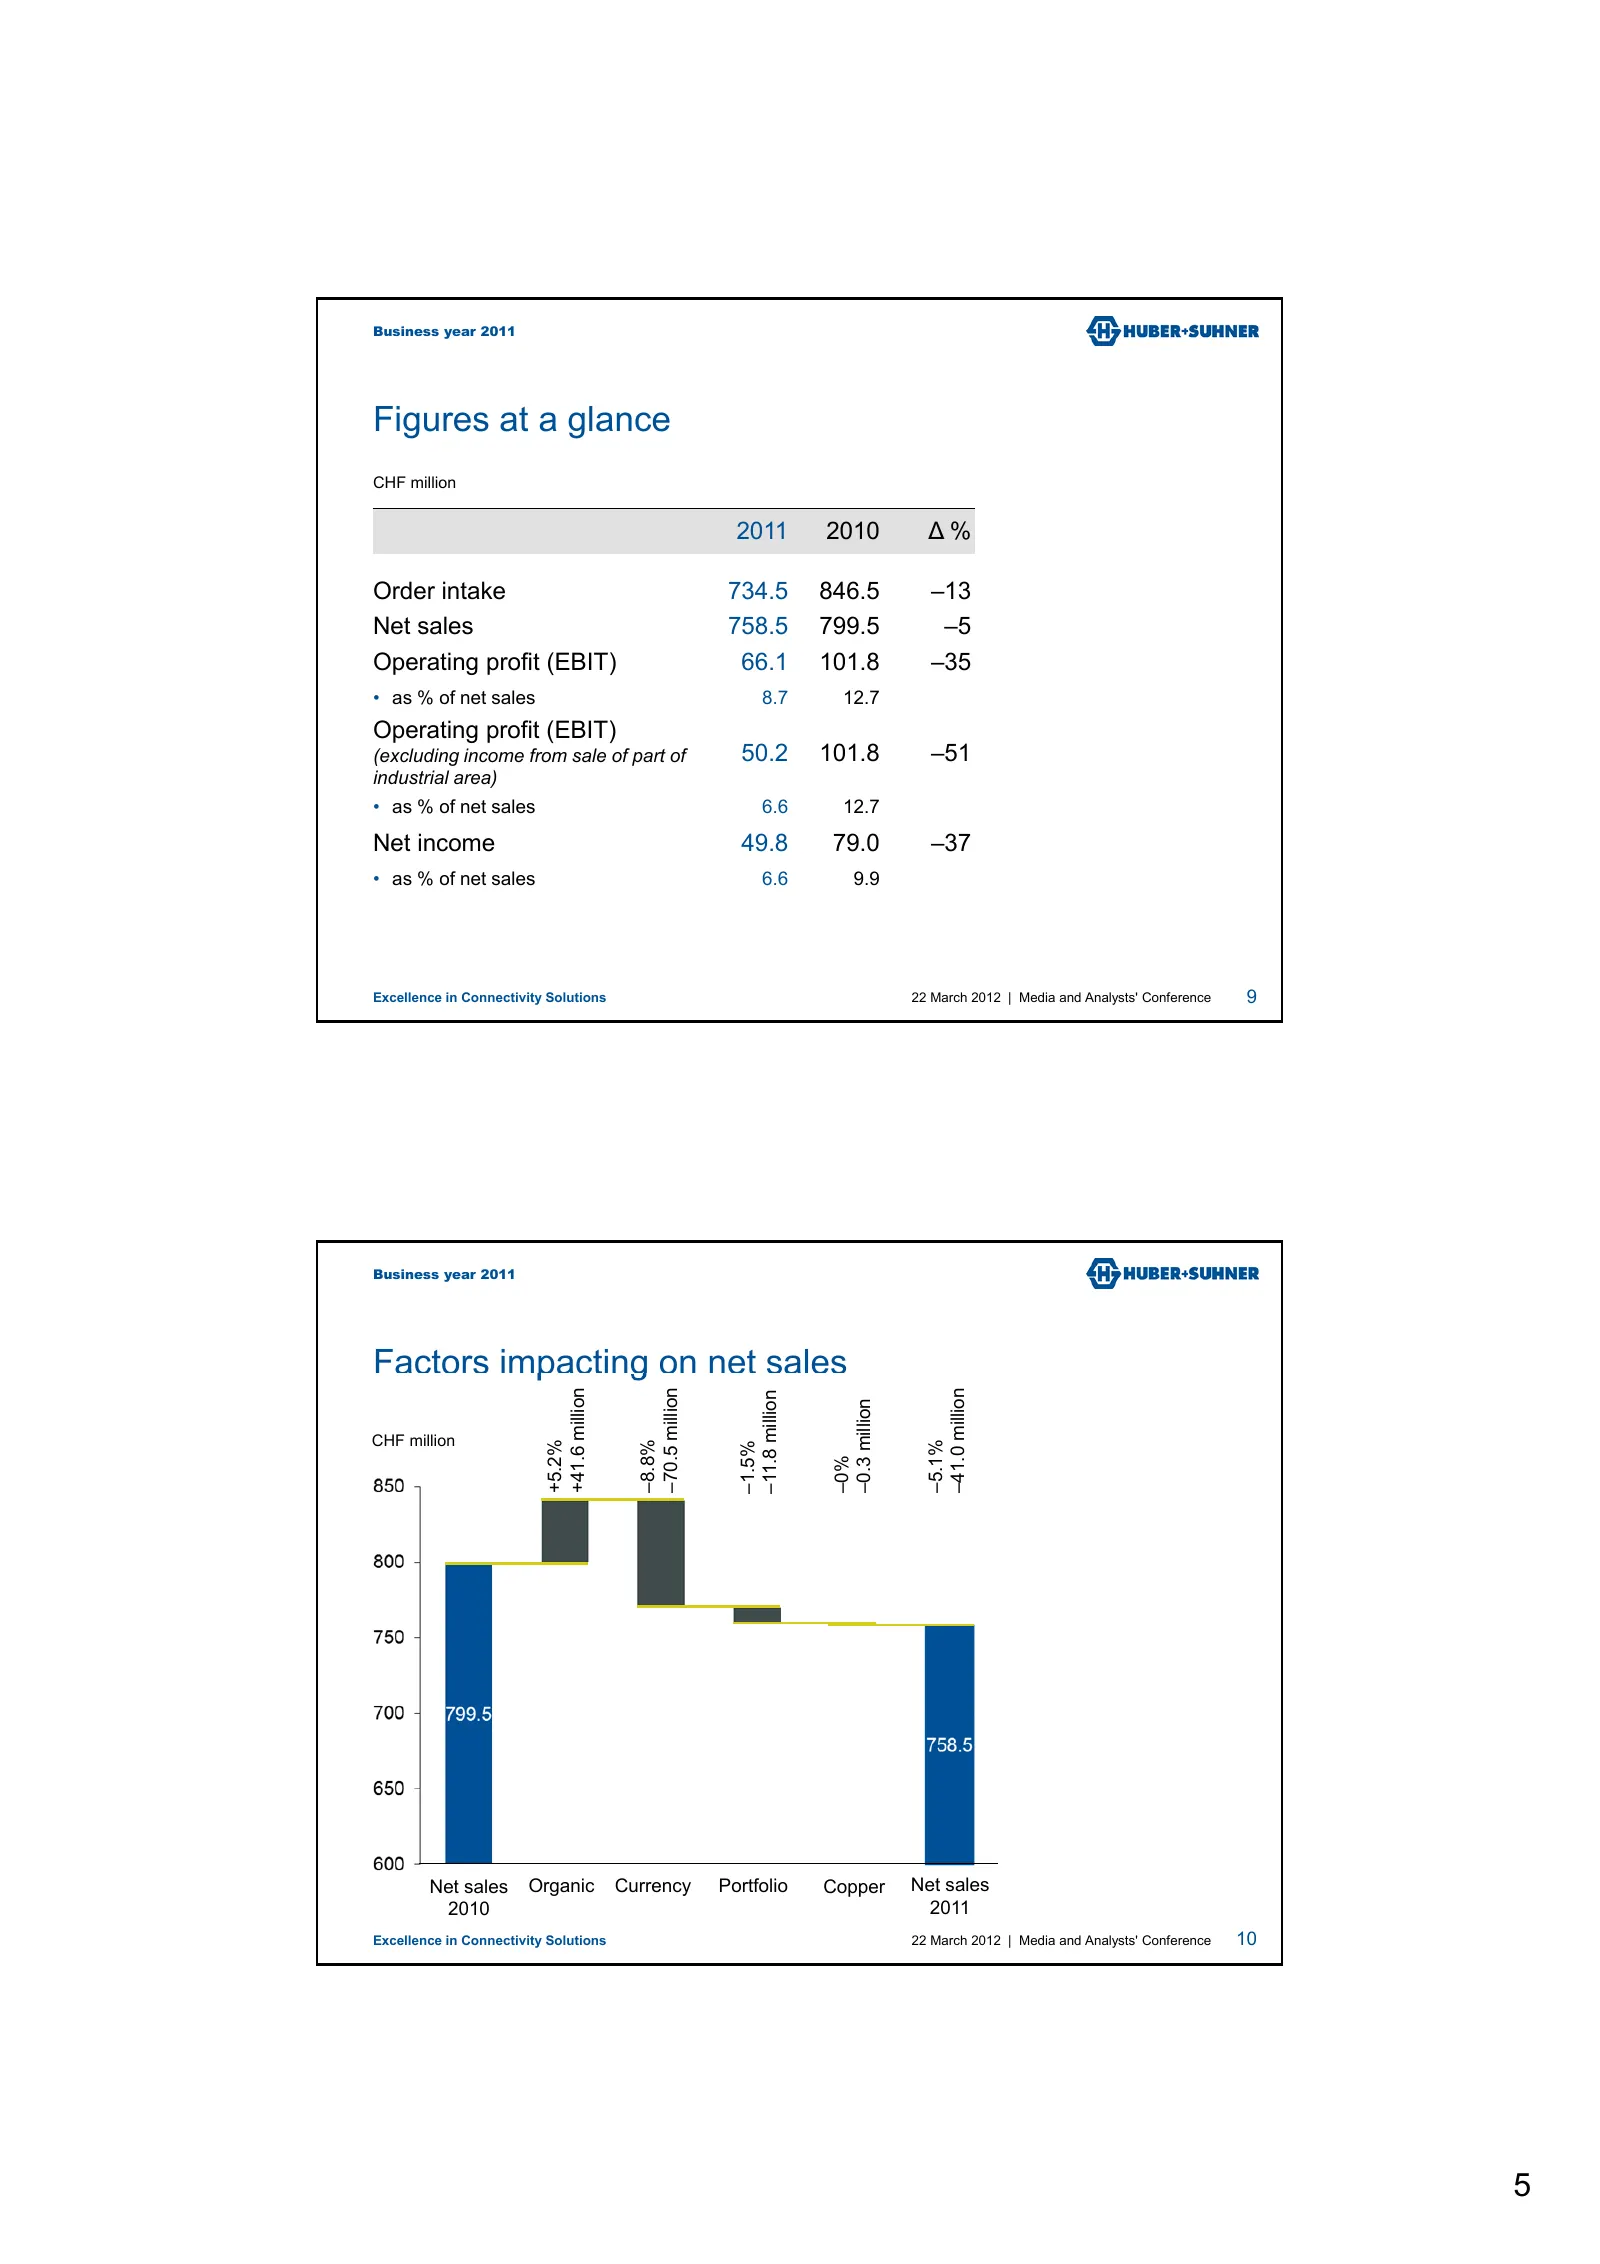
Business year 2011 Figures at a glance CHF million 2011 2010 ∆% Order intake 734.5 846.5 –13 Net sales 758.5 799.5 –5 Operating profit (EBIT) 66.1 101.8 –35 • as % of net sales 8.7 12.7 Operating profit (EBIT) (excluding income from sale of part of 50.2 101.8 –51 industrial area) • as % of net sales
Slide 6: EBIT development 2007–2011 and net sales of the divisions
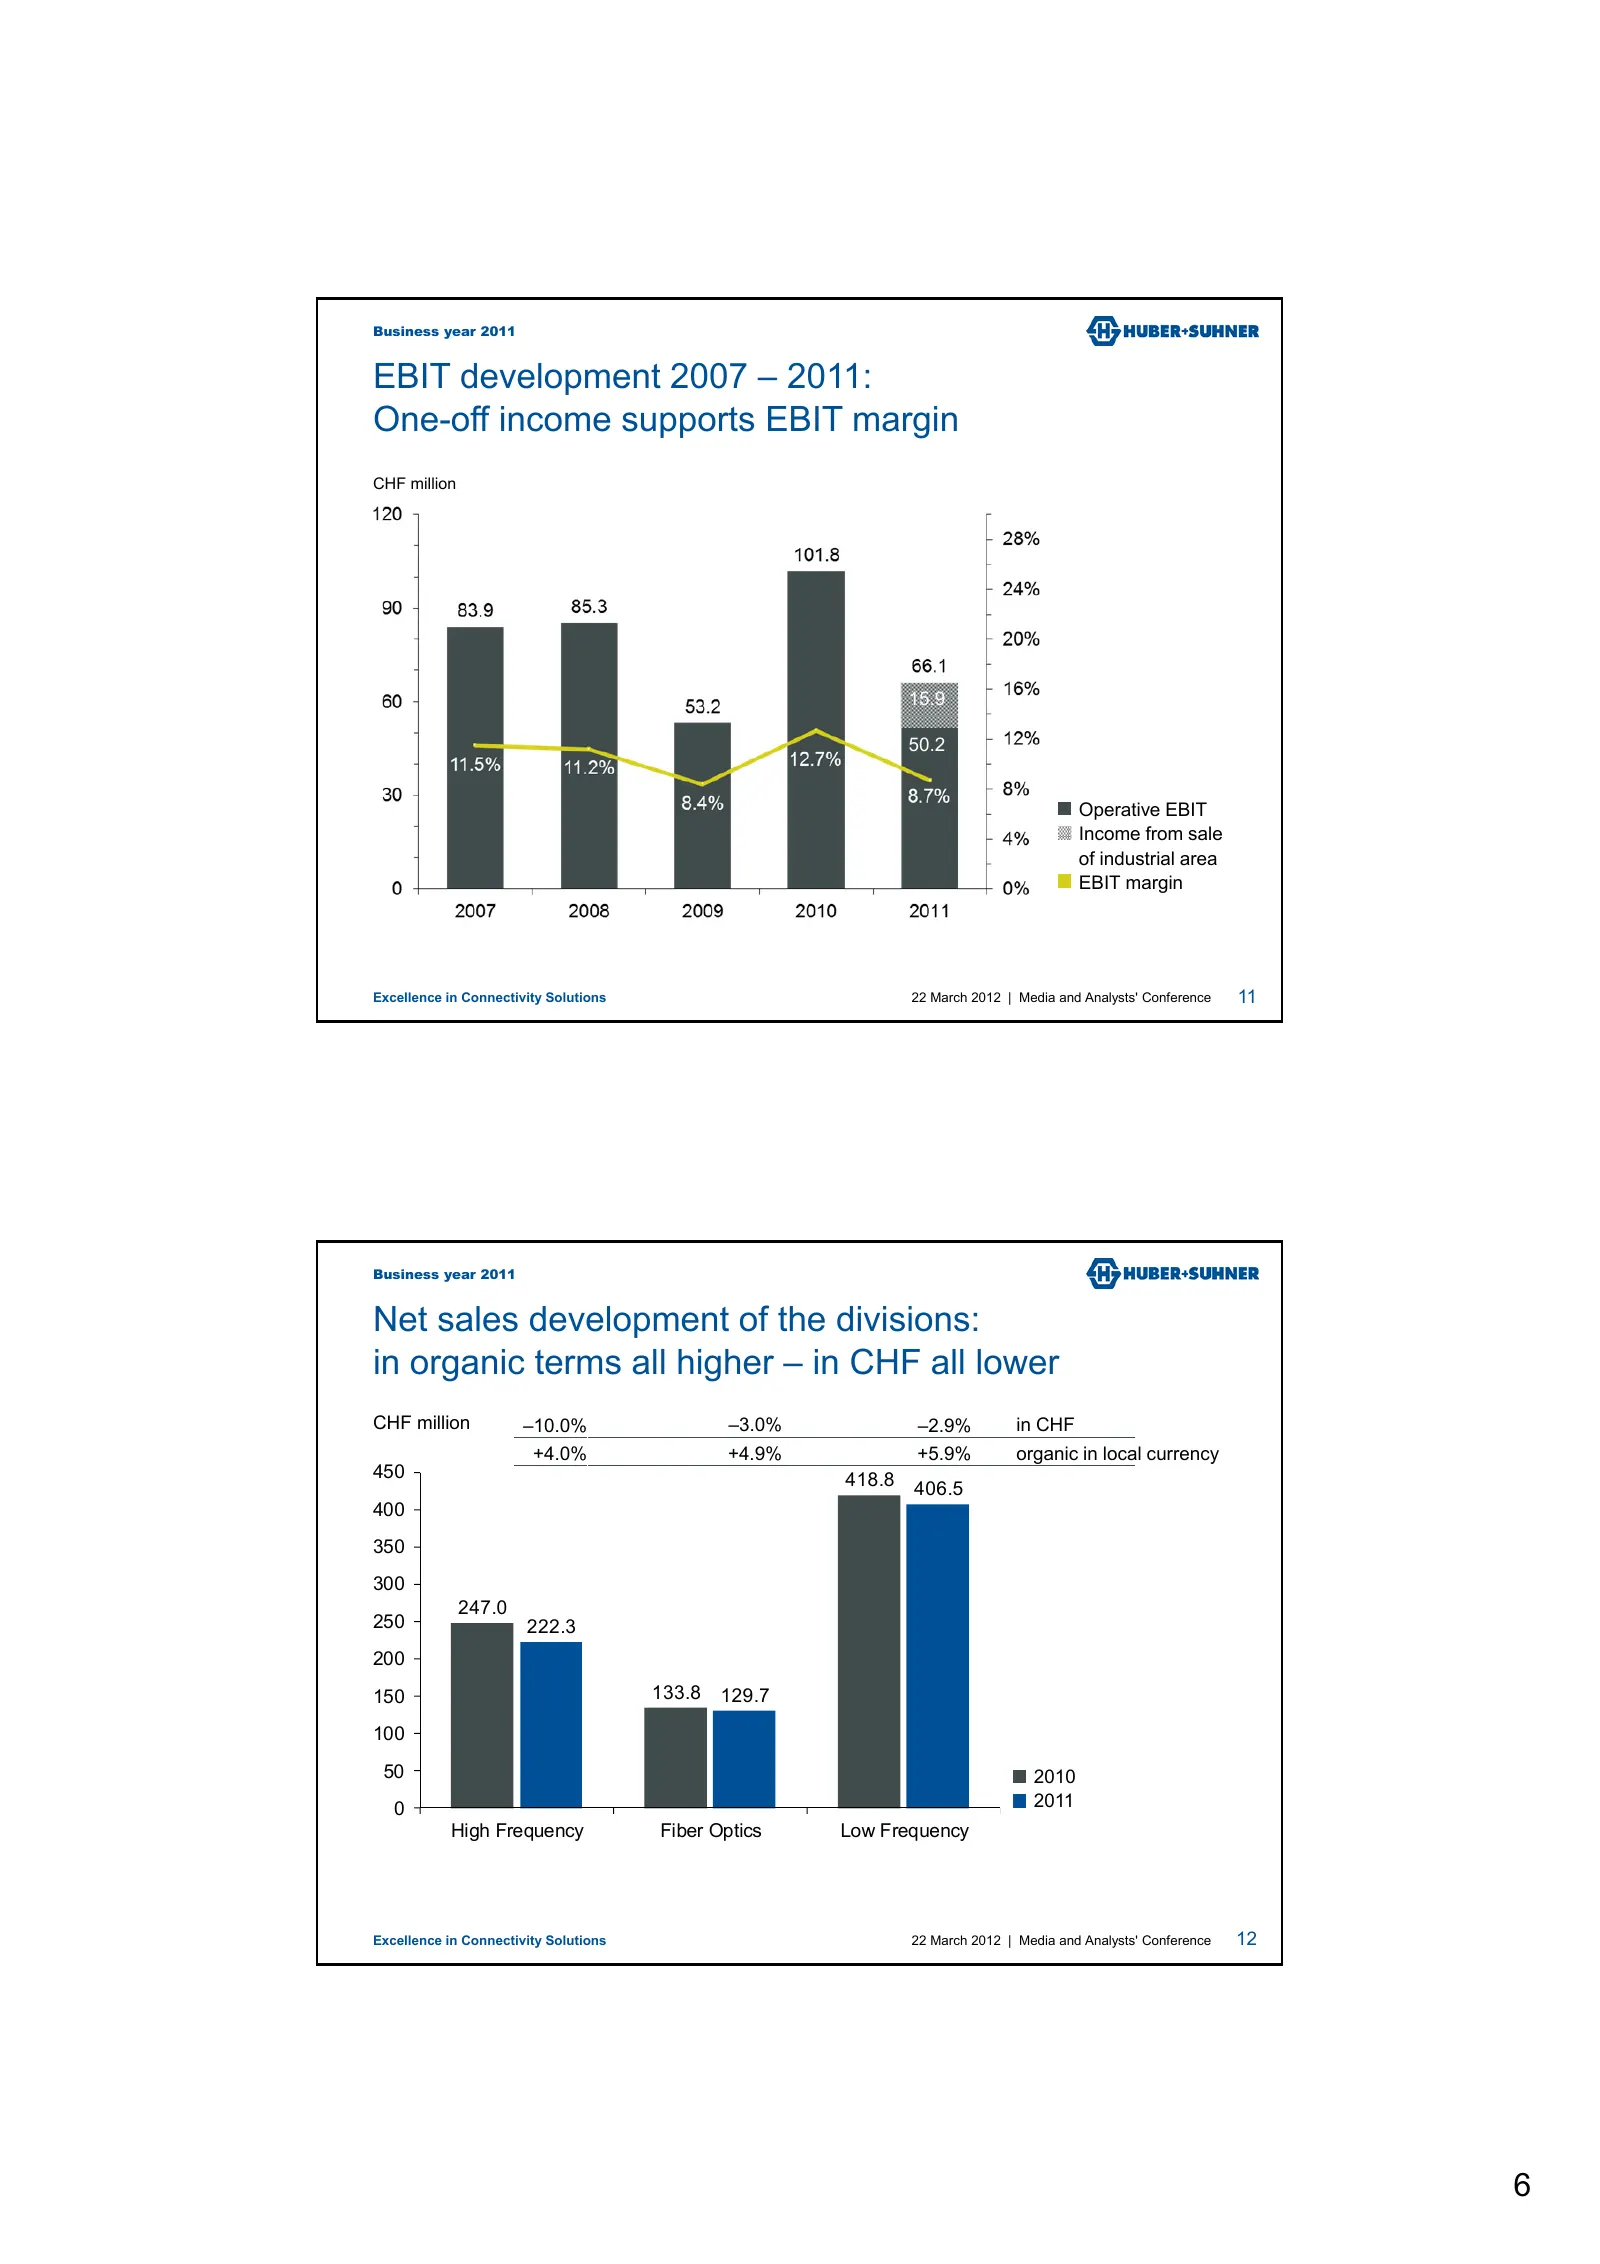
Business year 2011 EBIT development 2007 – 2011: One-off income supports EBIT margin CHF million 15.9 50.2 Operative EBIT Income from sale of industrial area EBIT margin Excellence in Connectivity Solutions 22 March 2012 | Media and Analysts' Conference 11 Business year 2011 Net sales development of
Slide 7: Radio Frequency and Fiber Optics divisions
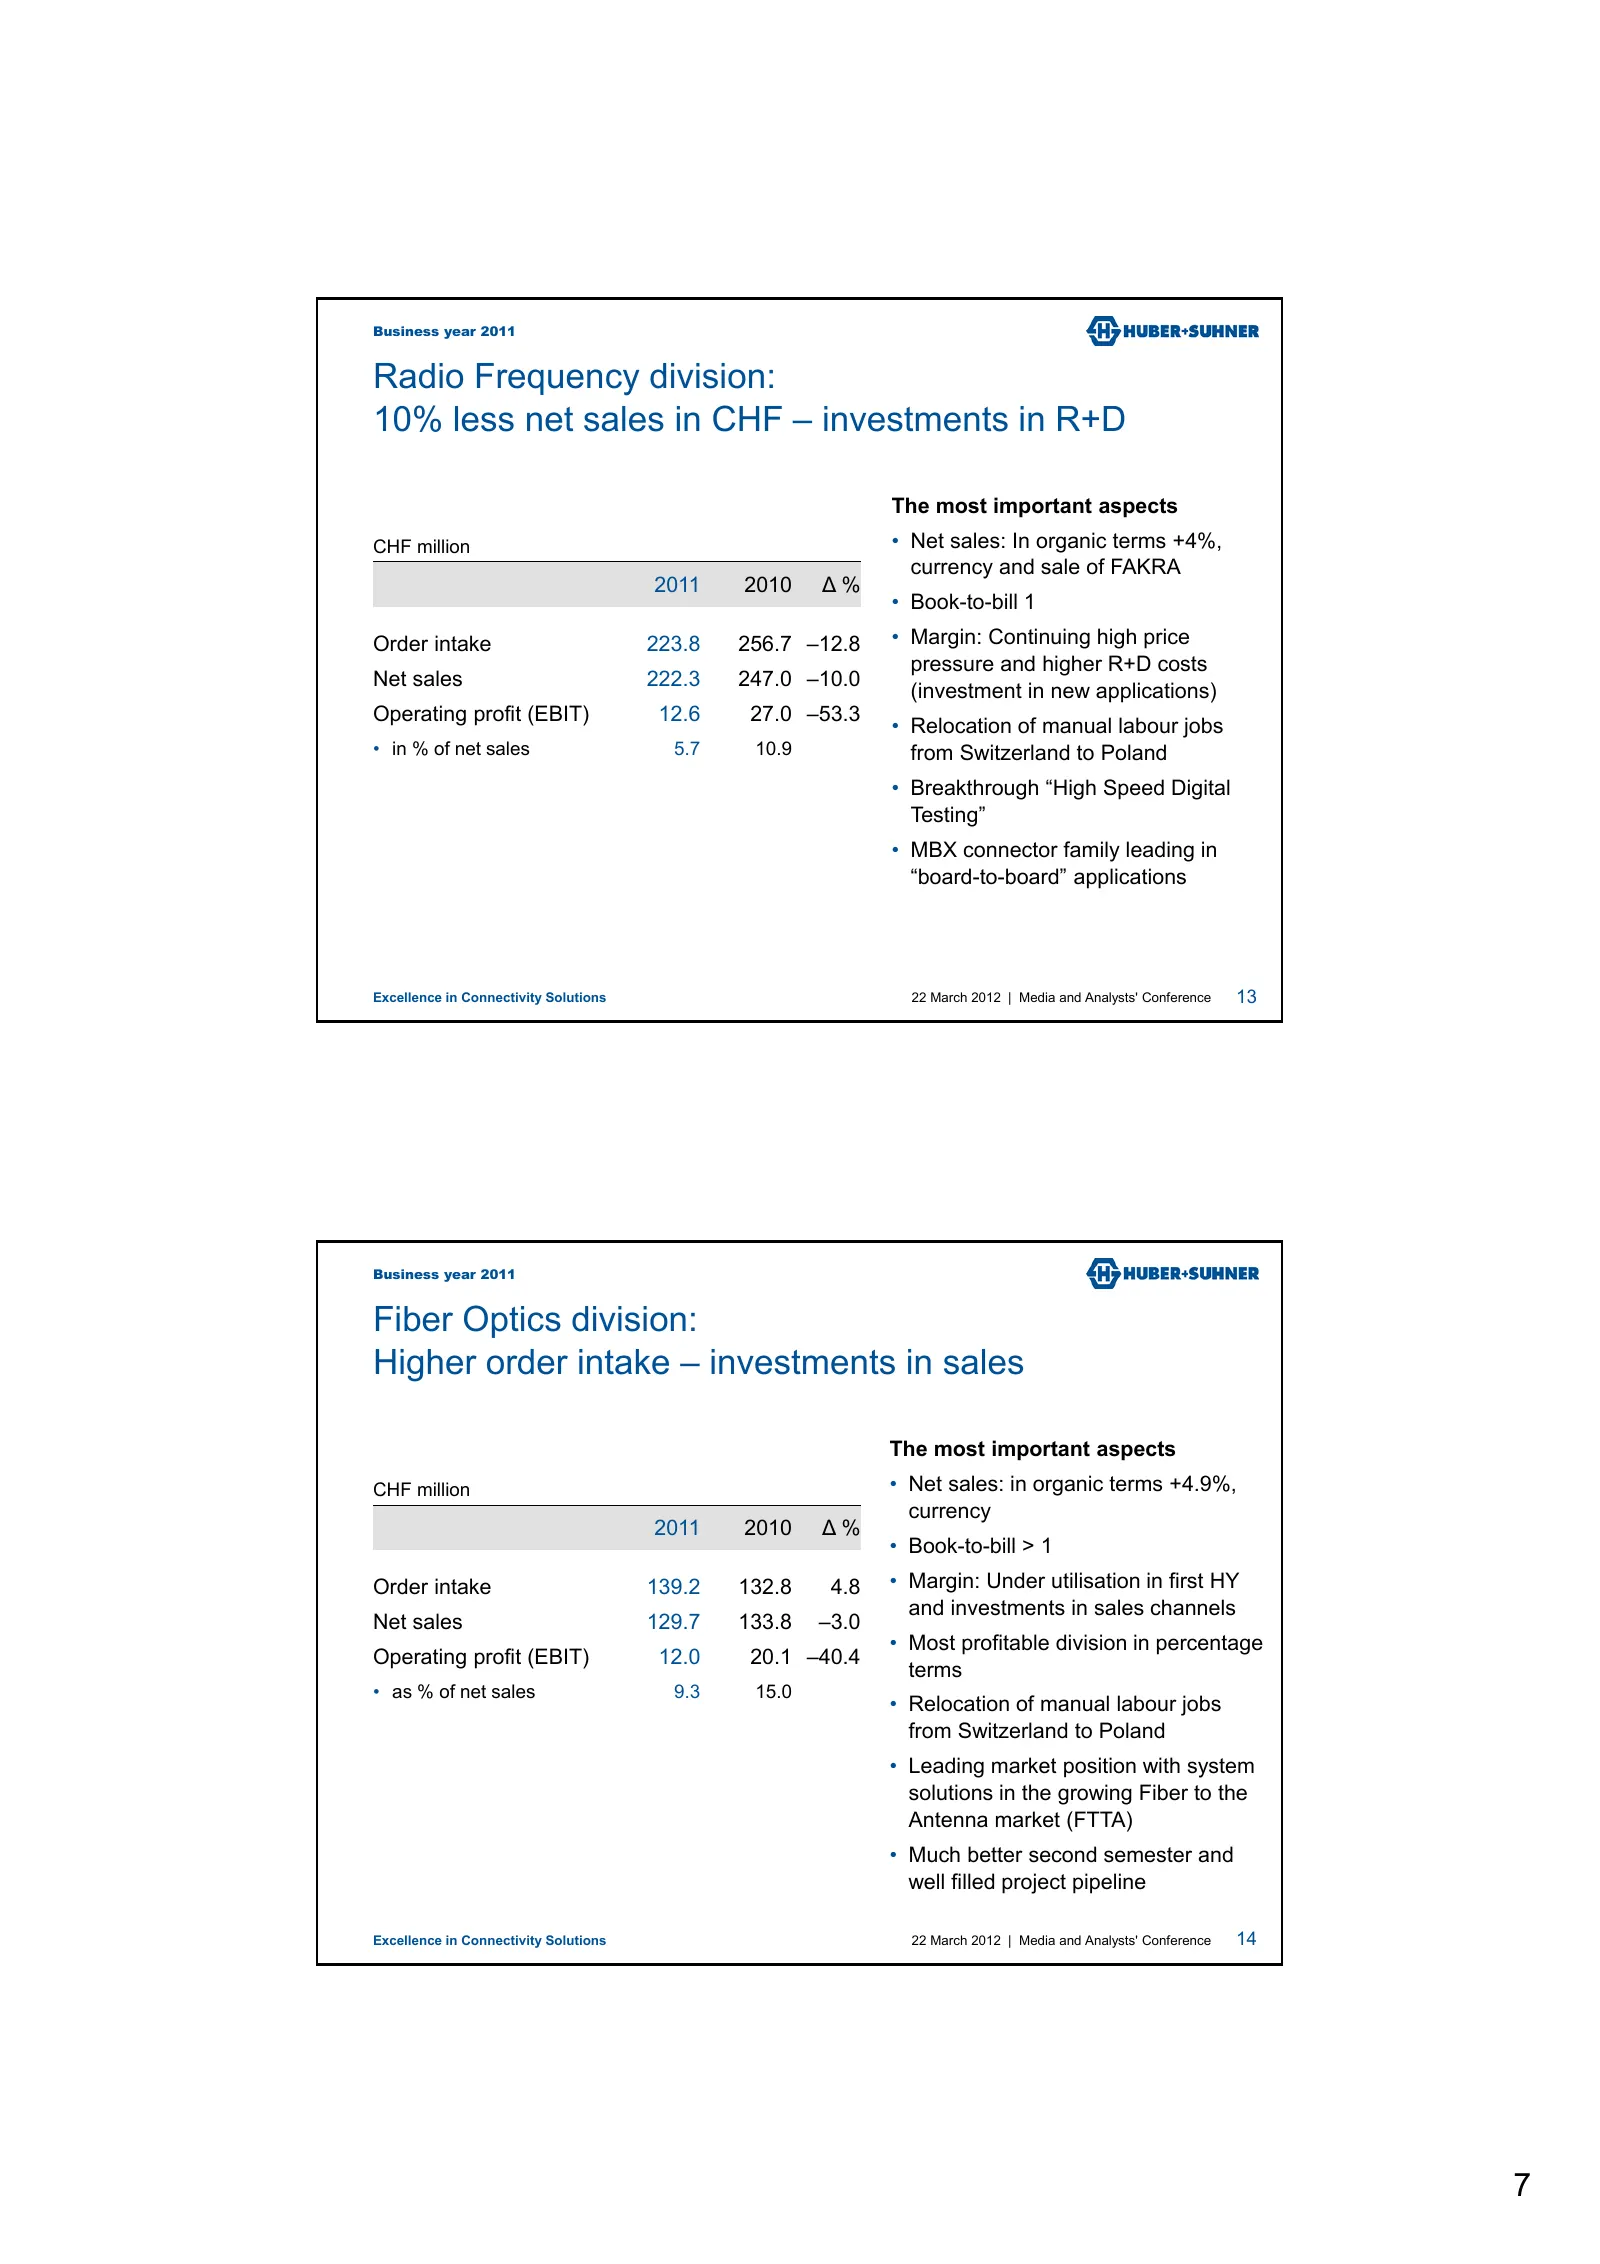
Business year 2011 Radio Frequency division: 10% less net sales in CHF – investments in R+D The most important aspects CHF million • Net sales: In organic terms +4%, currency and sale of FAKRA 2011 2010 ∆% • Book-to-bill 1 Order intake 223.8 256.7 –12.8 • Margin: Continuing high price pressure and h
Slide 8: Low Frequency division and market results
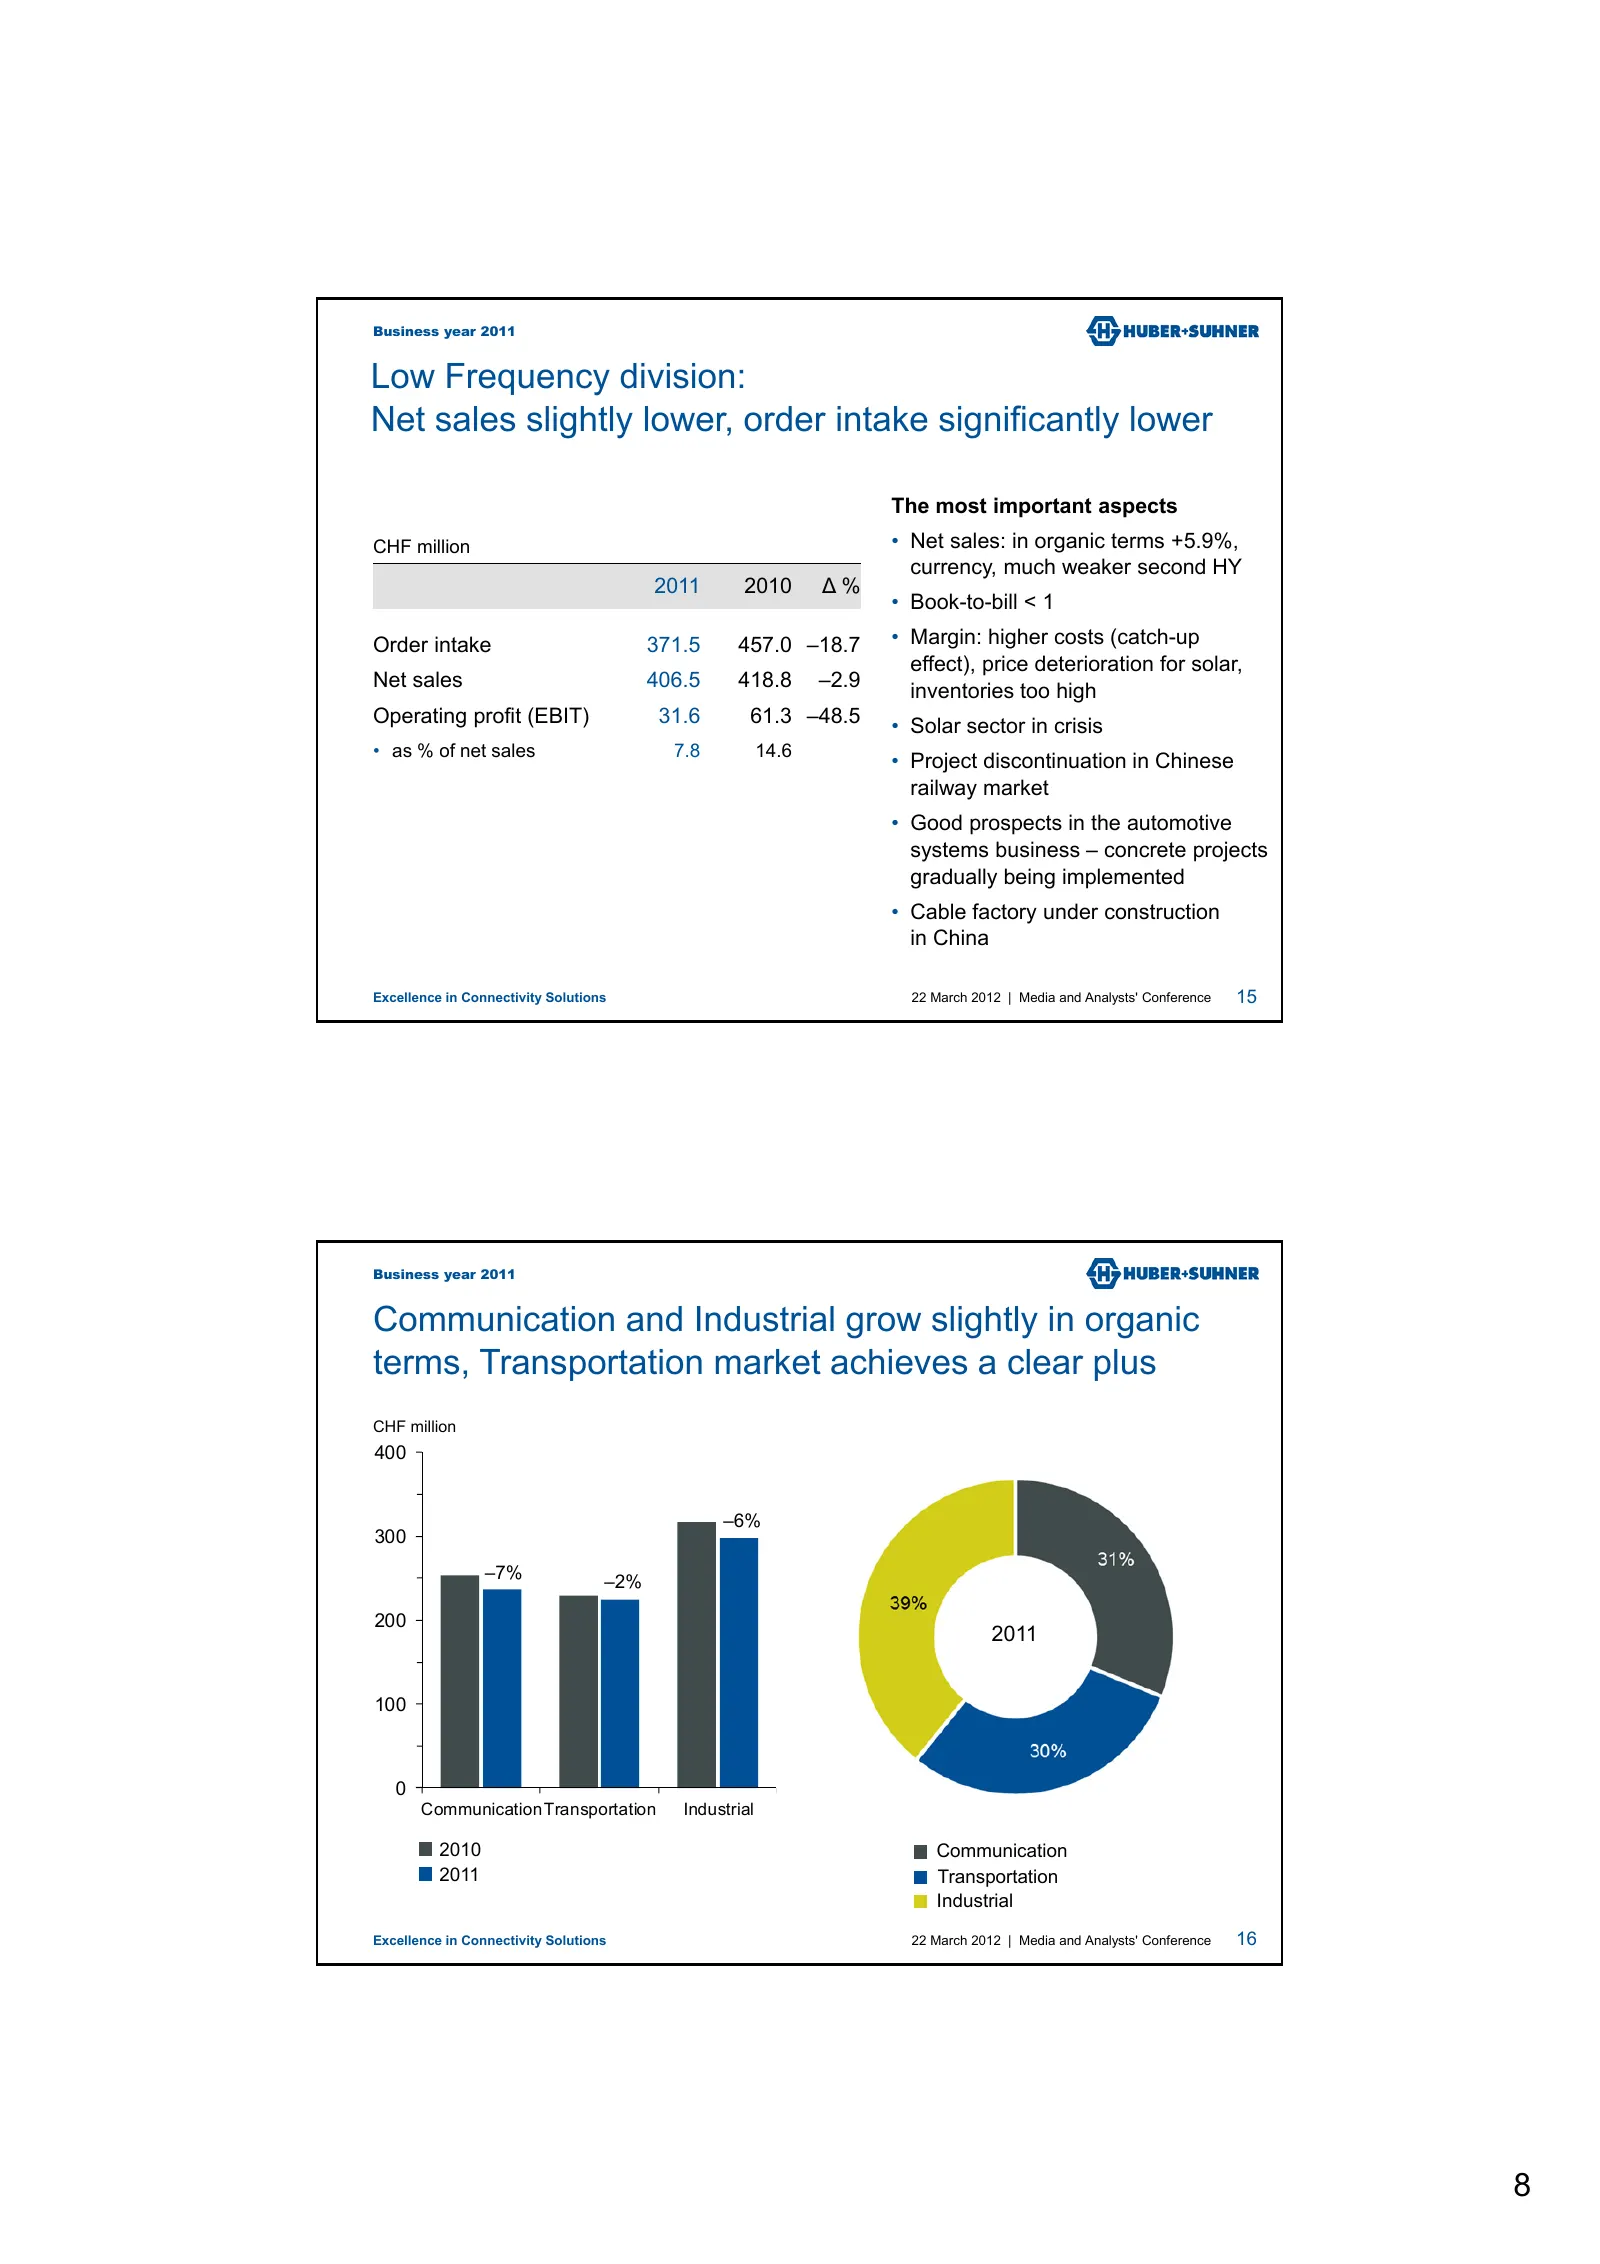
Business year 2011 Low Frequency division: Net sales slightly lower, order intake significantly lower The most important aspects CHF million • Net sales: in organic terms +5.9%, currency, much weaker second HY 2011 2010 ∆% • Book-to-bill < 1 Order intake 371.5 457.0 –18.7 • Margin: higher costs (cat
Slide 9: Net sales by regions; further important aspects of 2011
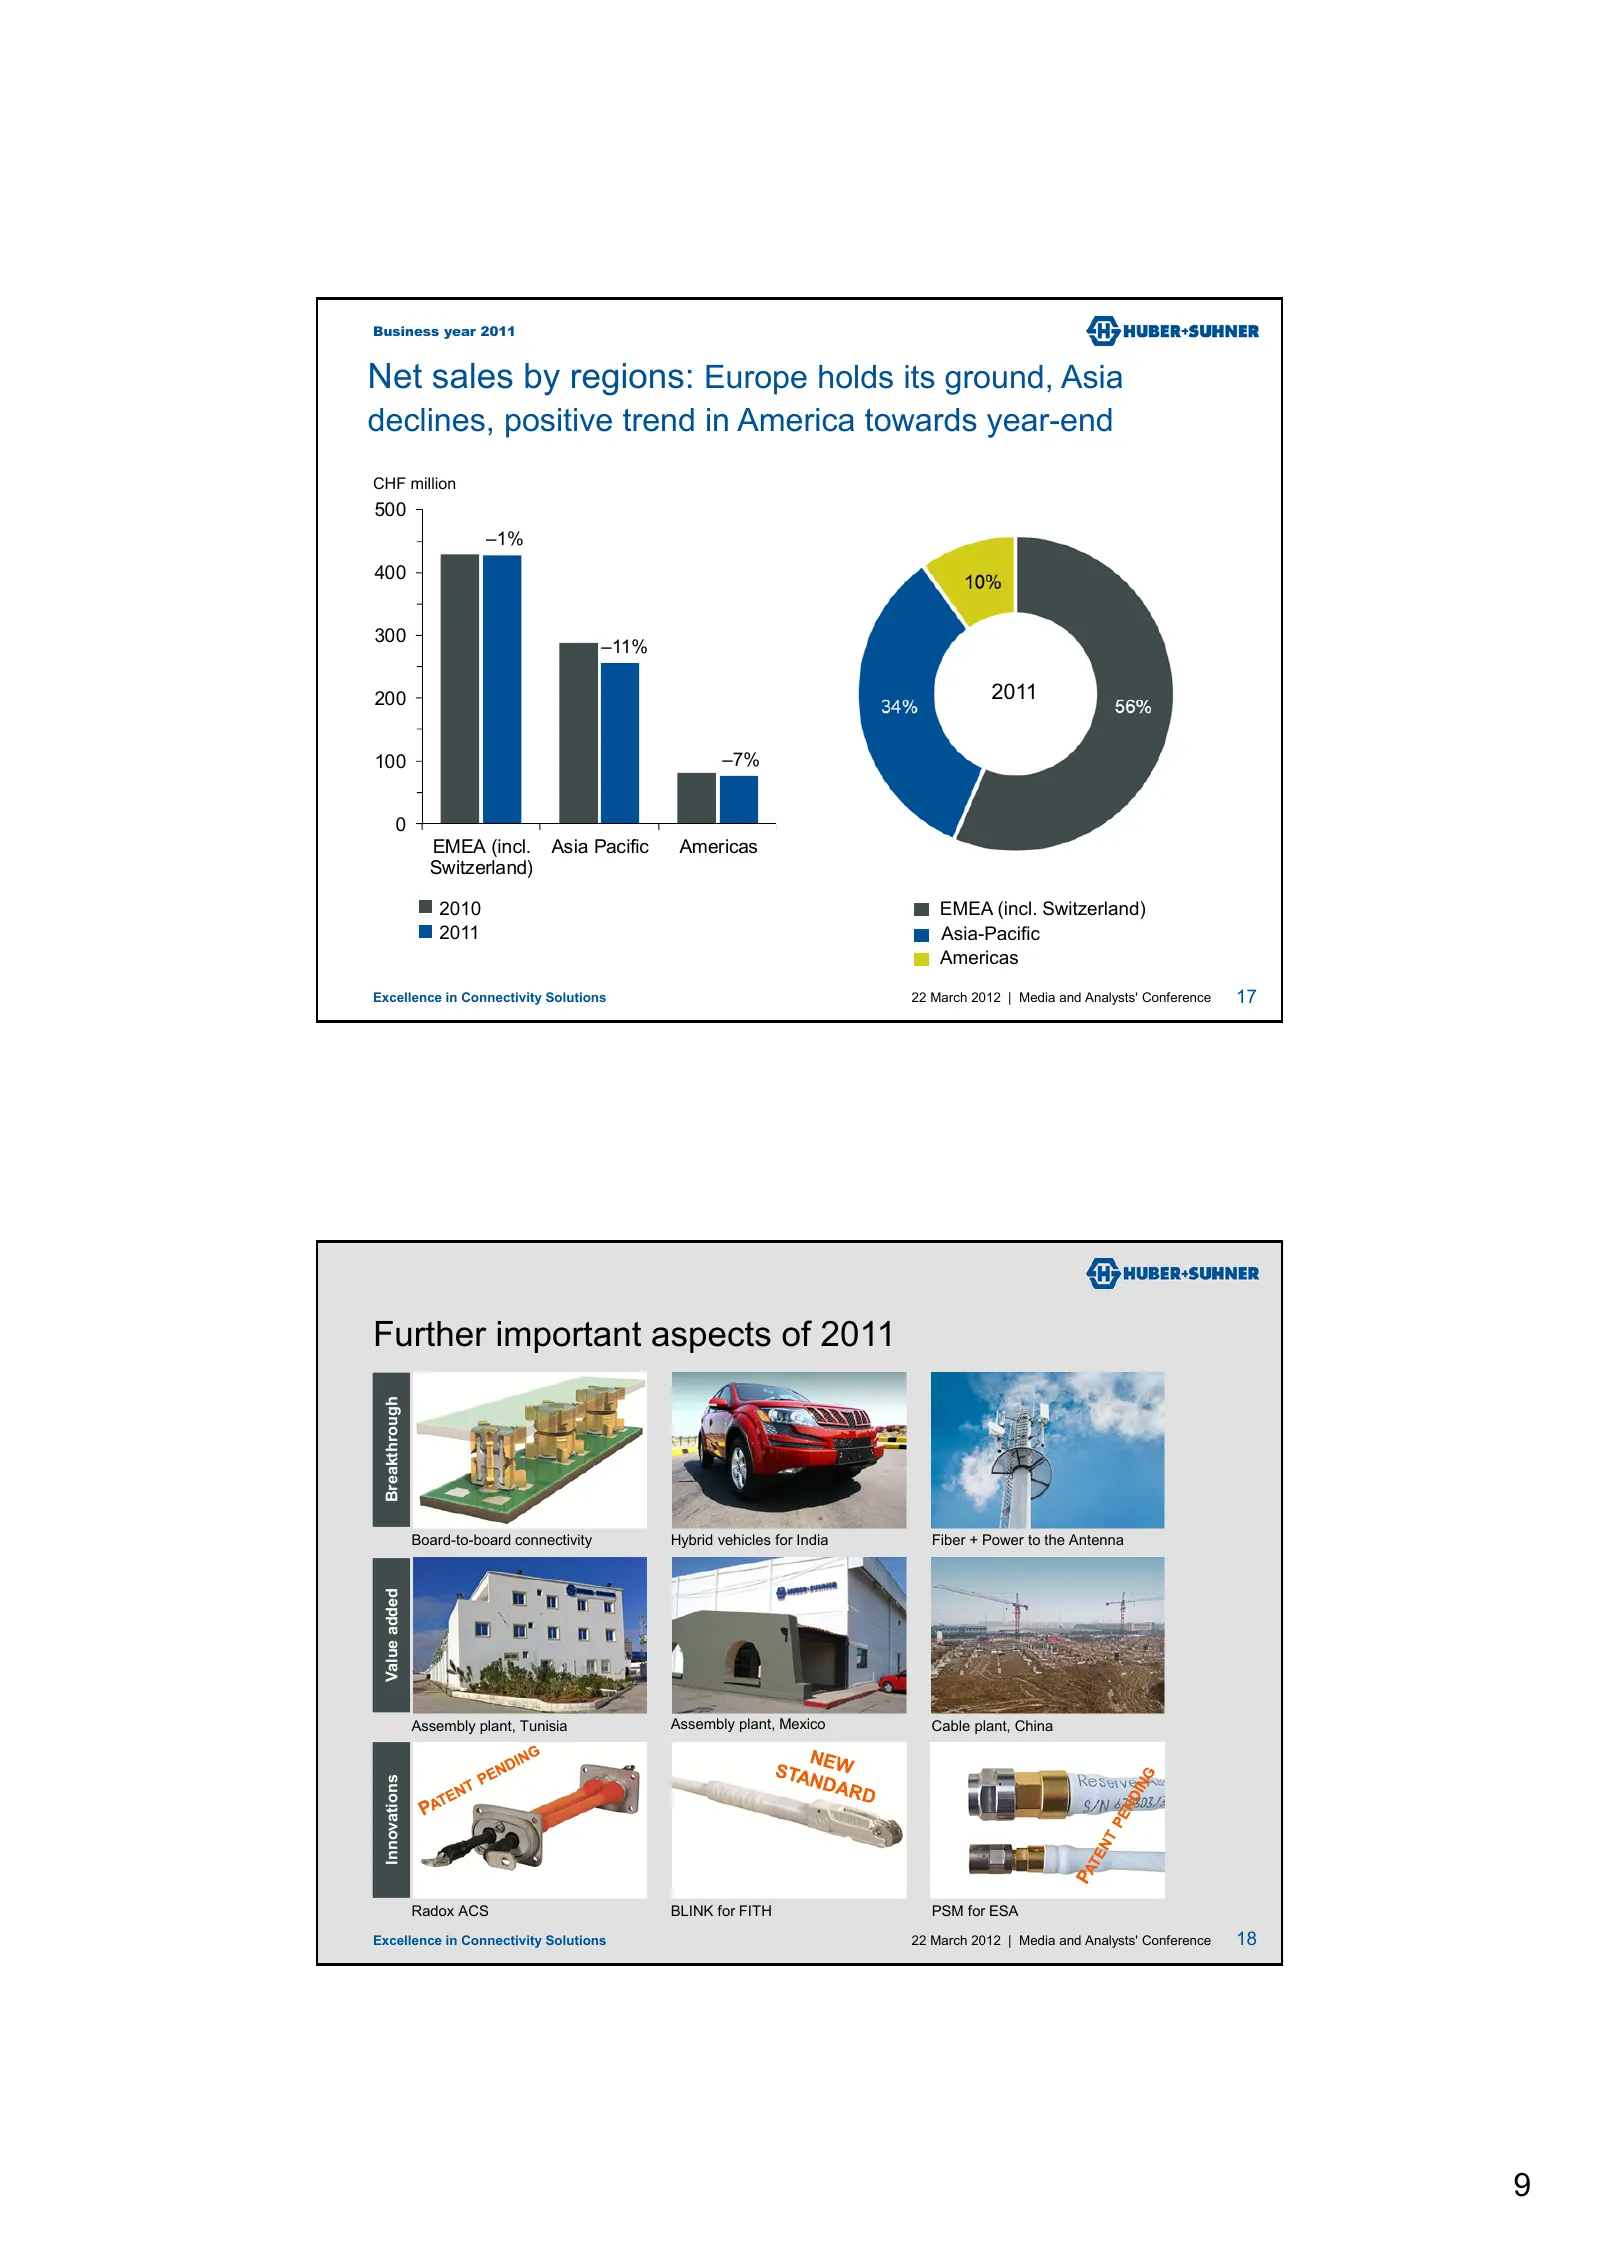
Business year 2011 Net sales by regions: Europe holds its ground, Asia declines, positive trend in America towards year-end CHF million 500 –1% 400 300 –11% 200 2011 100 –7% 0 EMEA (incl. Asia Pacific Americas Switzerland) 2010 EMEA (incl. Switzerland) 2011 Asia-Pacific Americas Excellence in Connec
Slide 10: Conclusion 2011
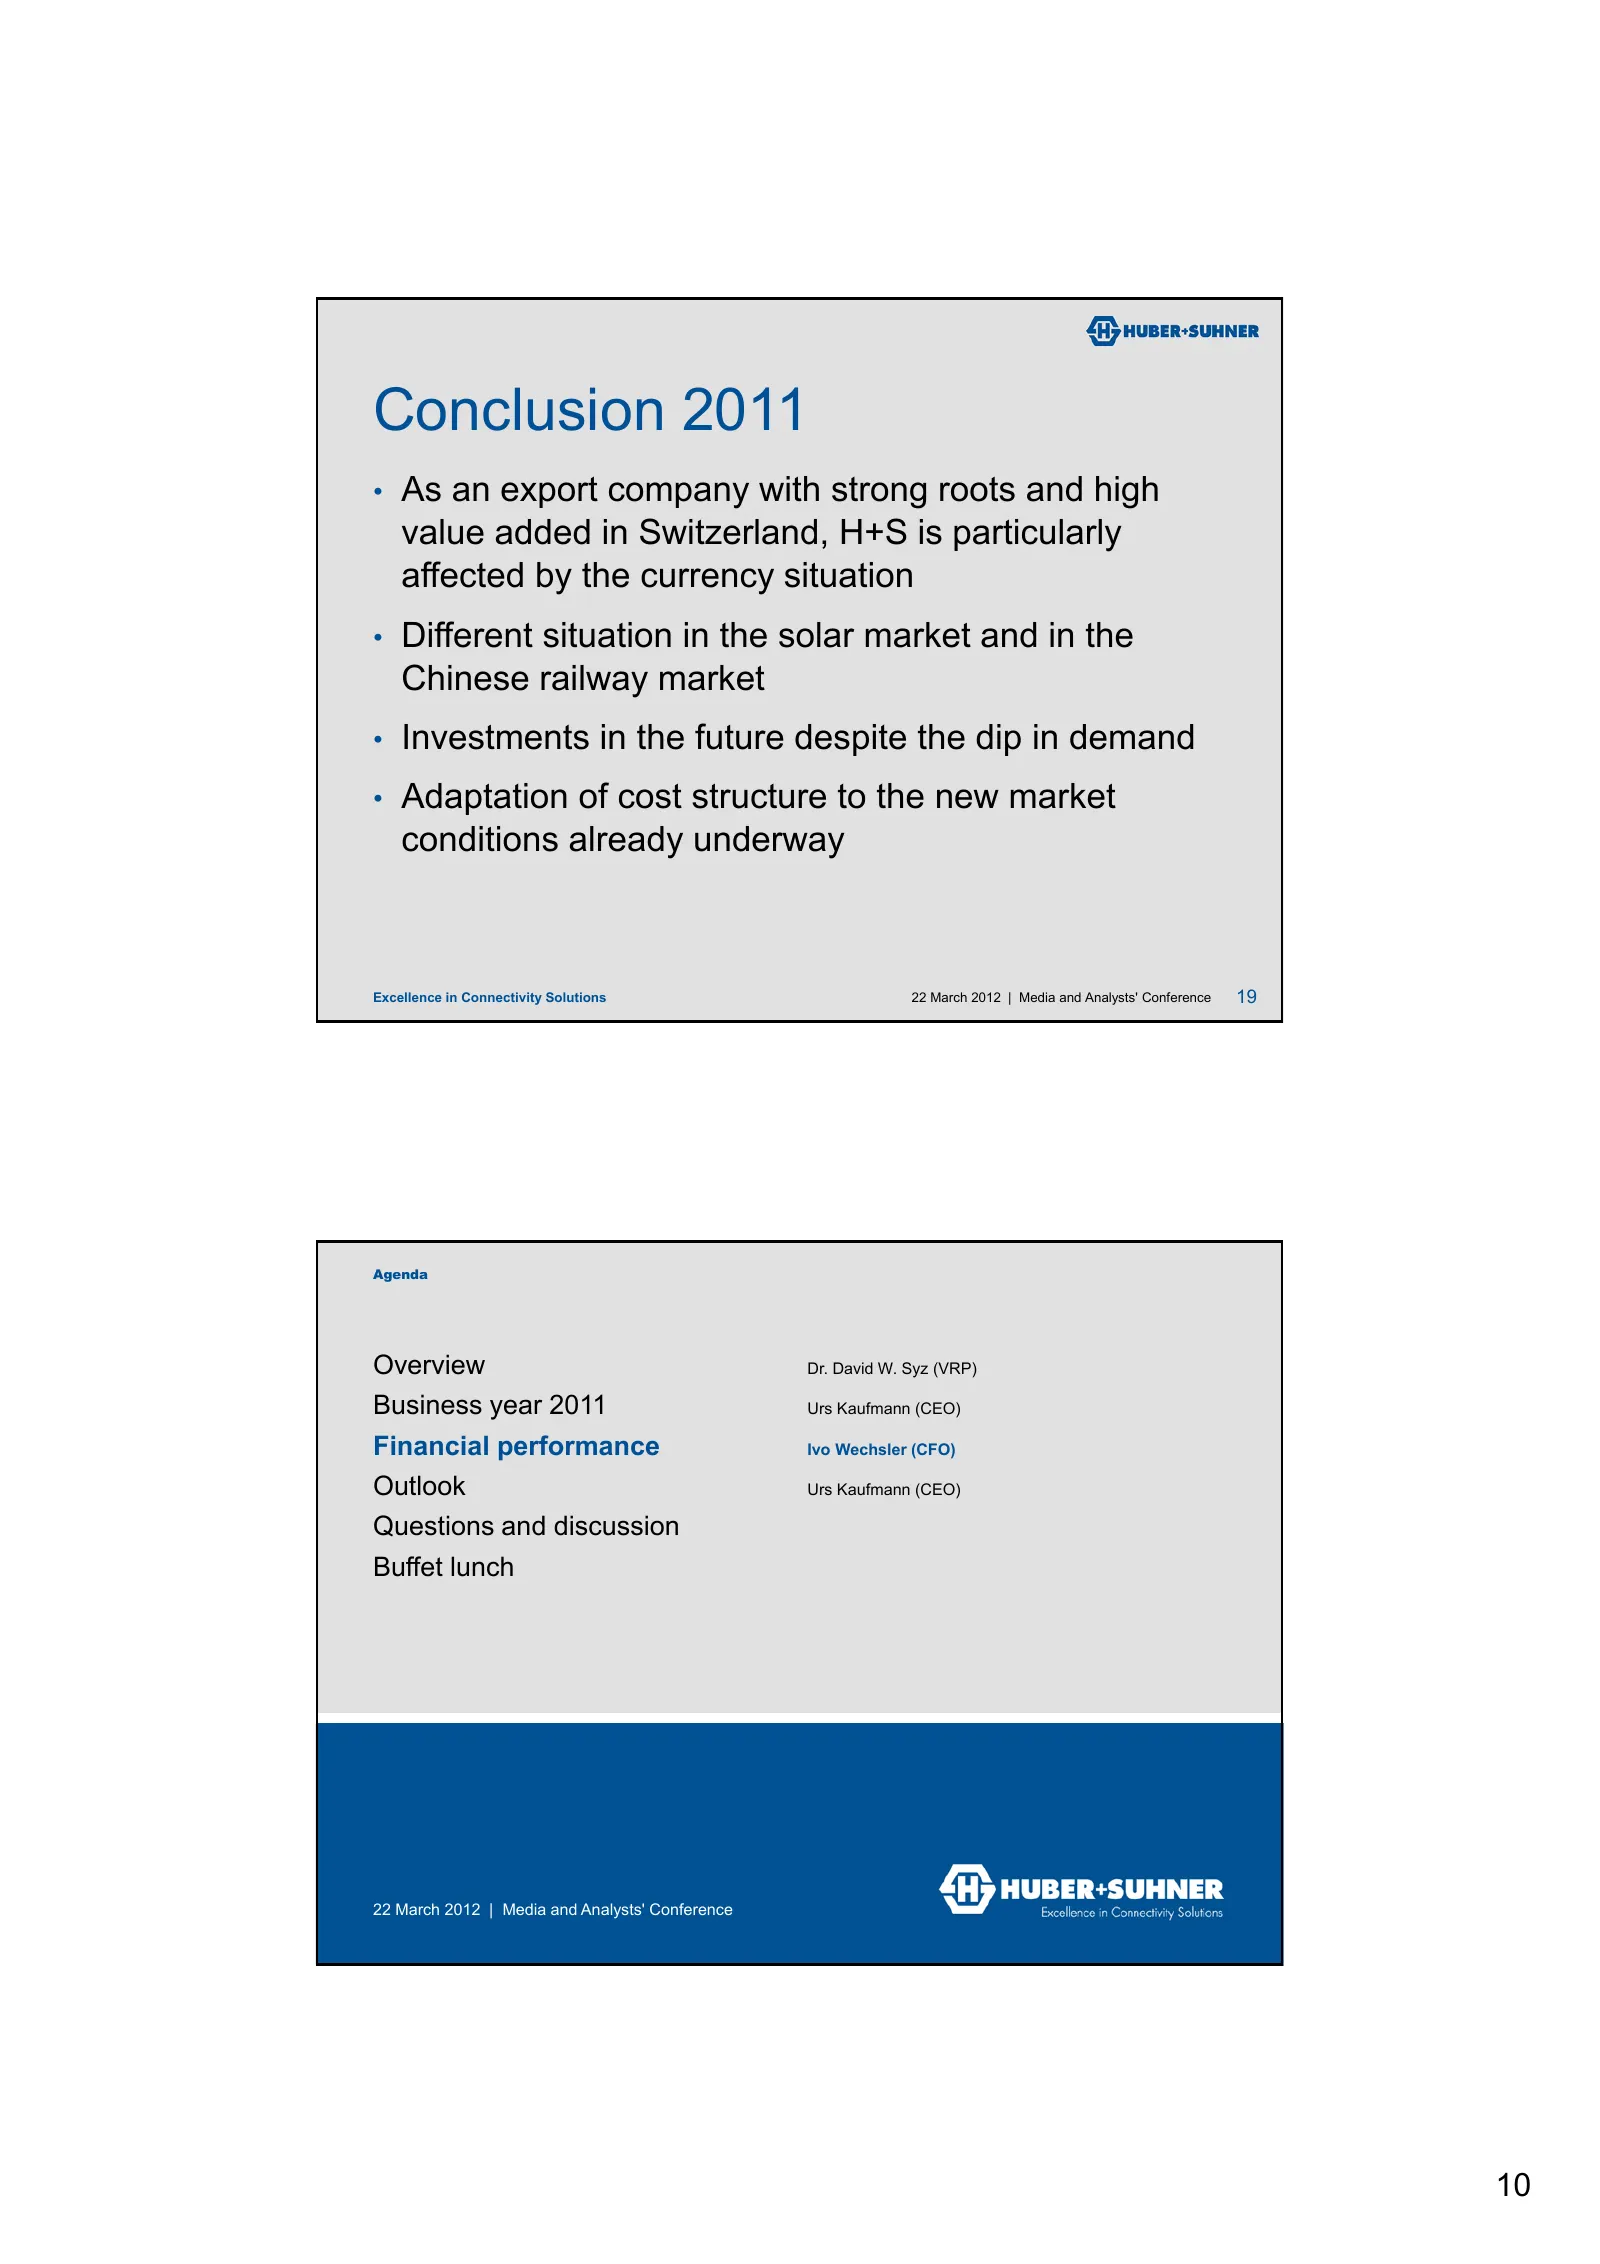
Conclusion 2011 • As an export company with strong roots and high value added in Switzerland, H+S is particularly affected by the currency situation • Different situation in the solar market and in the Chinese railway market • Investments in the future despite the dip in demand • Adaptation of cost
Slide 11: Average exchange rates and gross margin
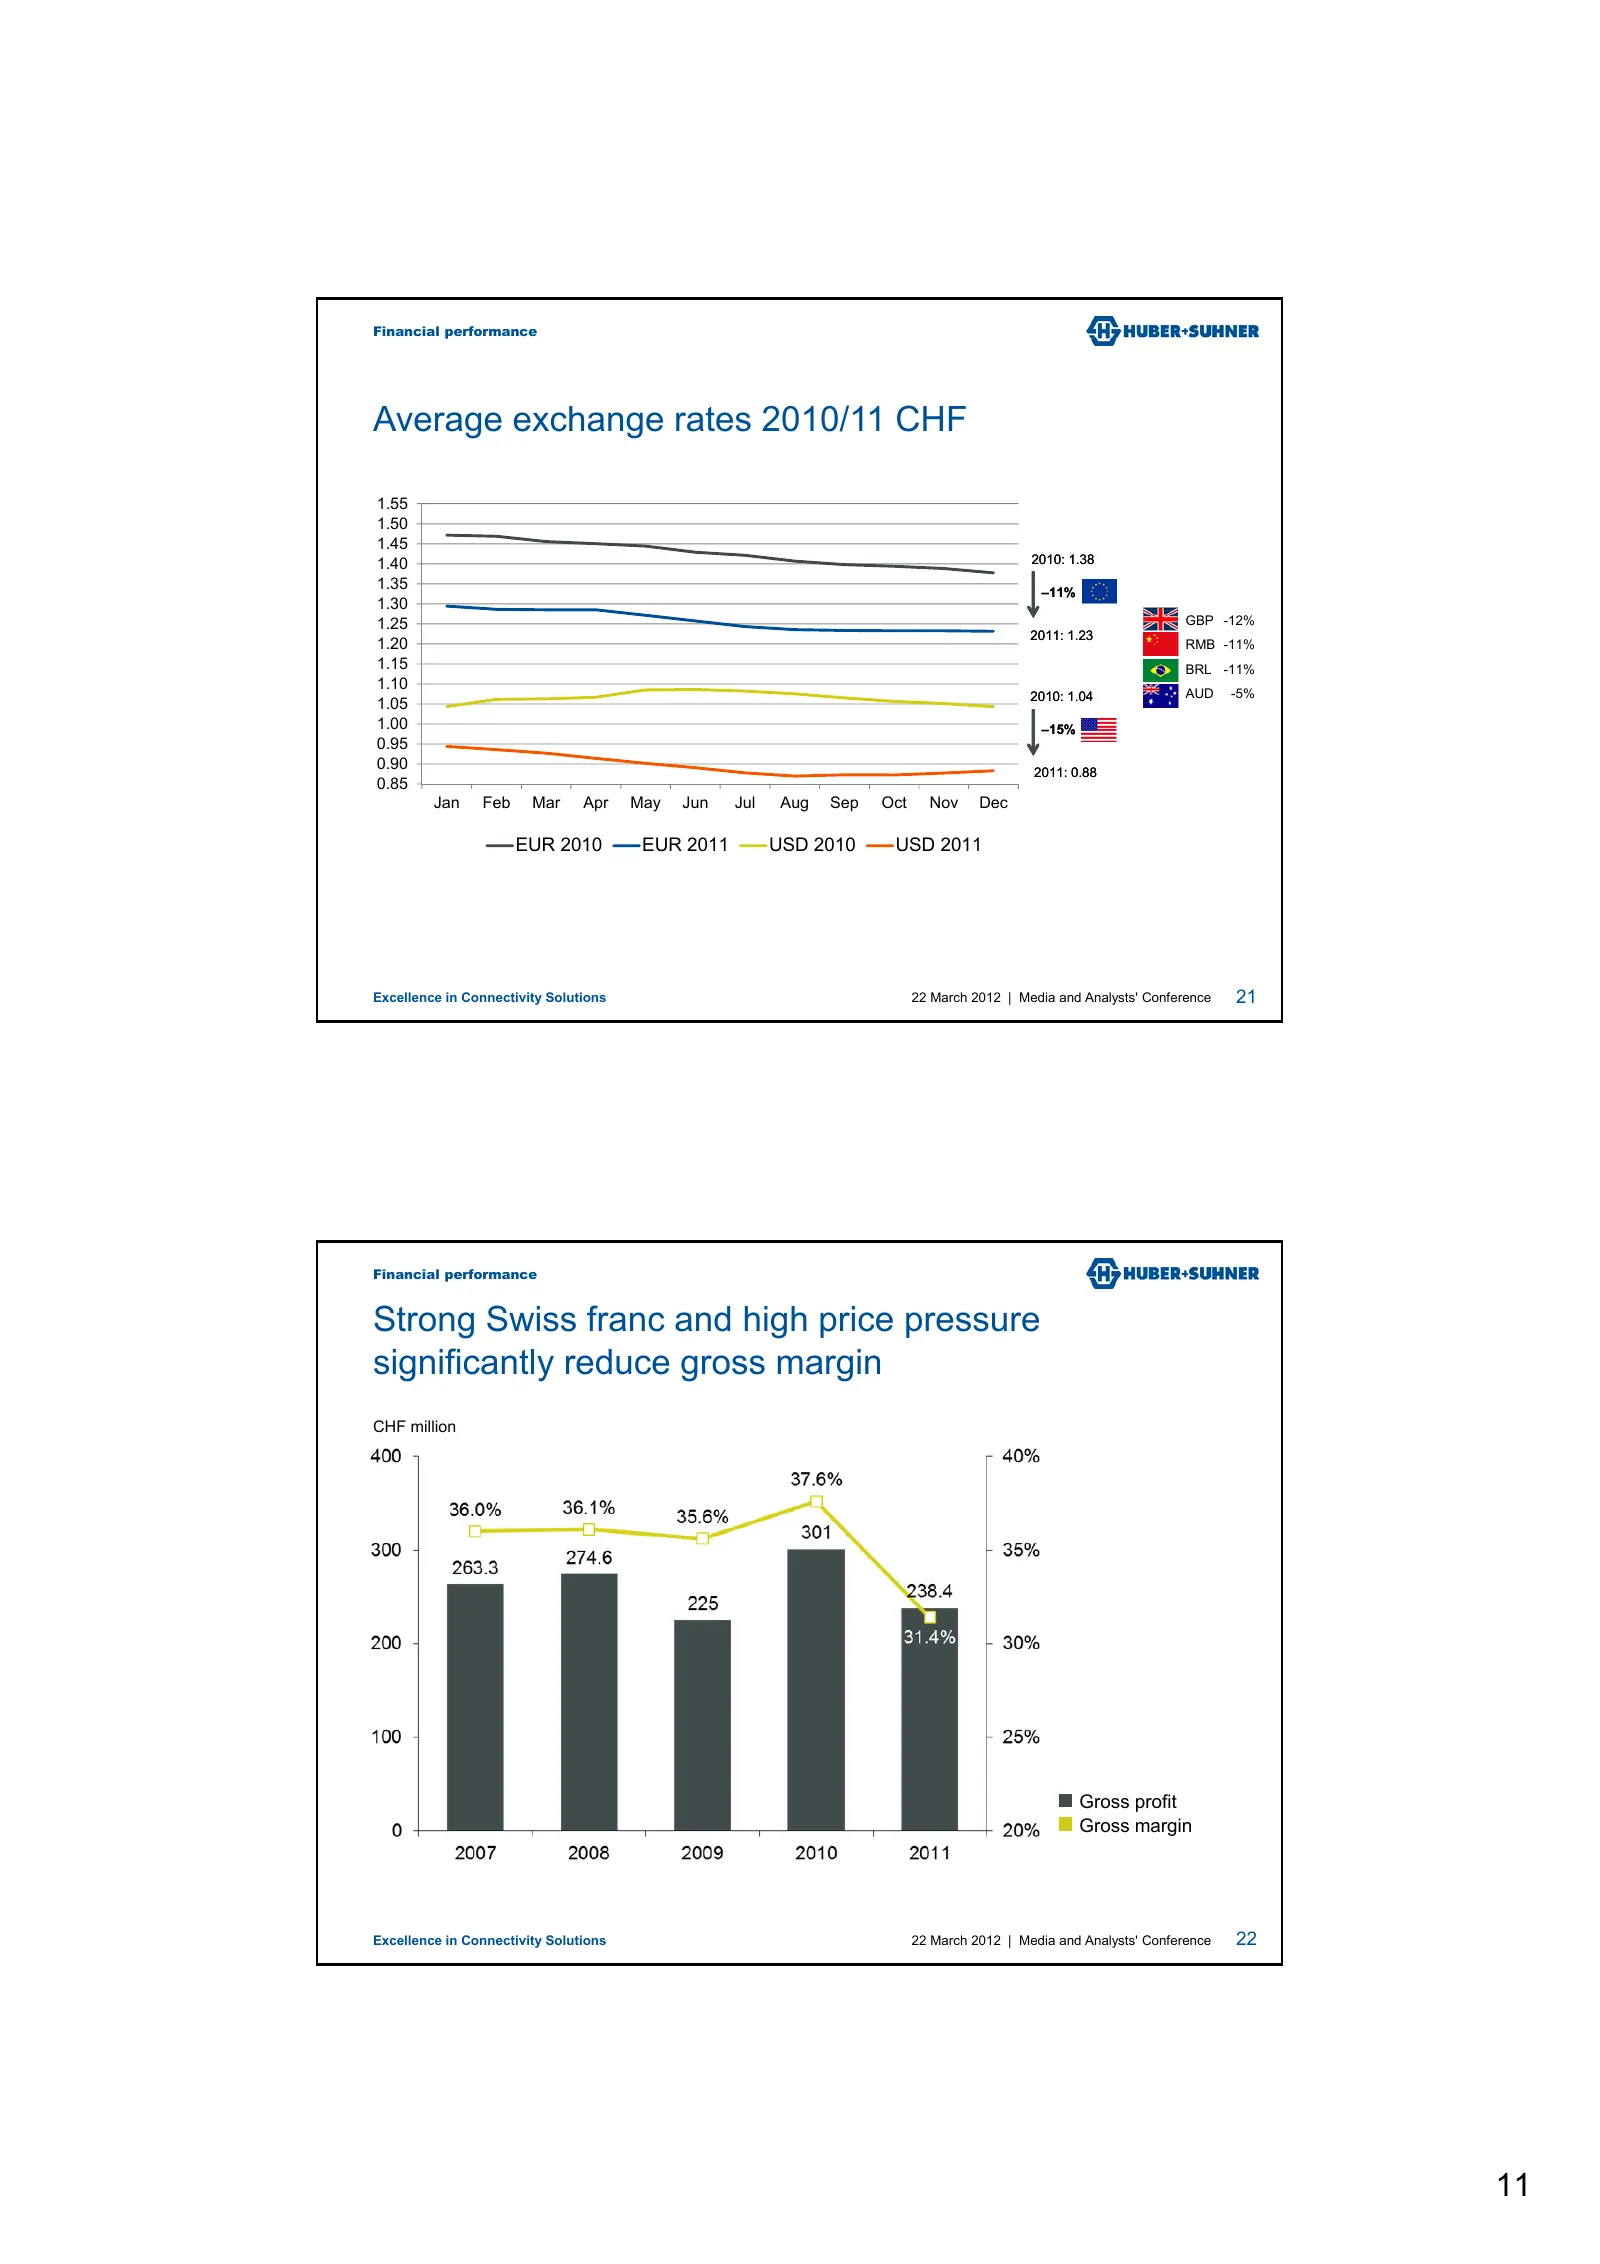
Financial performance Average exchange rates 2010/11 CHF 1.55 1.50 1.45 1.40 2010: 1.38 1.35 –11% 1.30 1.25 GBP -12% 2011: 1.23 1.20 RMB -11% 1.15 BRL -11% 1.10 2010: 1.04 AUD -5% 1.05 1.00 –15% 0.95 0.90 2011: 0.88 0.85 Jan Feb Mar Apr May Jun Jul Aug Sep Oct Nov Dec EUR 2010 EUR 2011 USD 2010 USD
Slide 12: Operating expenses and factors impacting EBIT
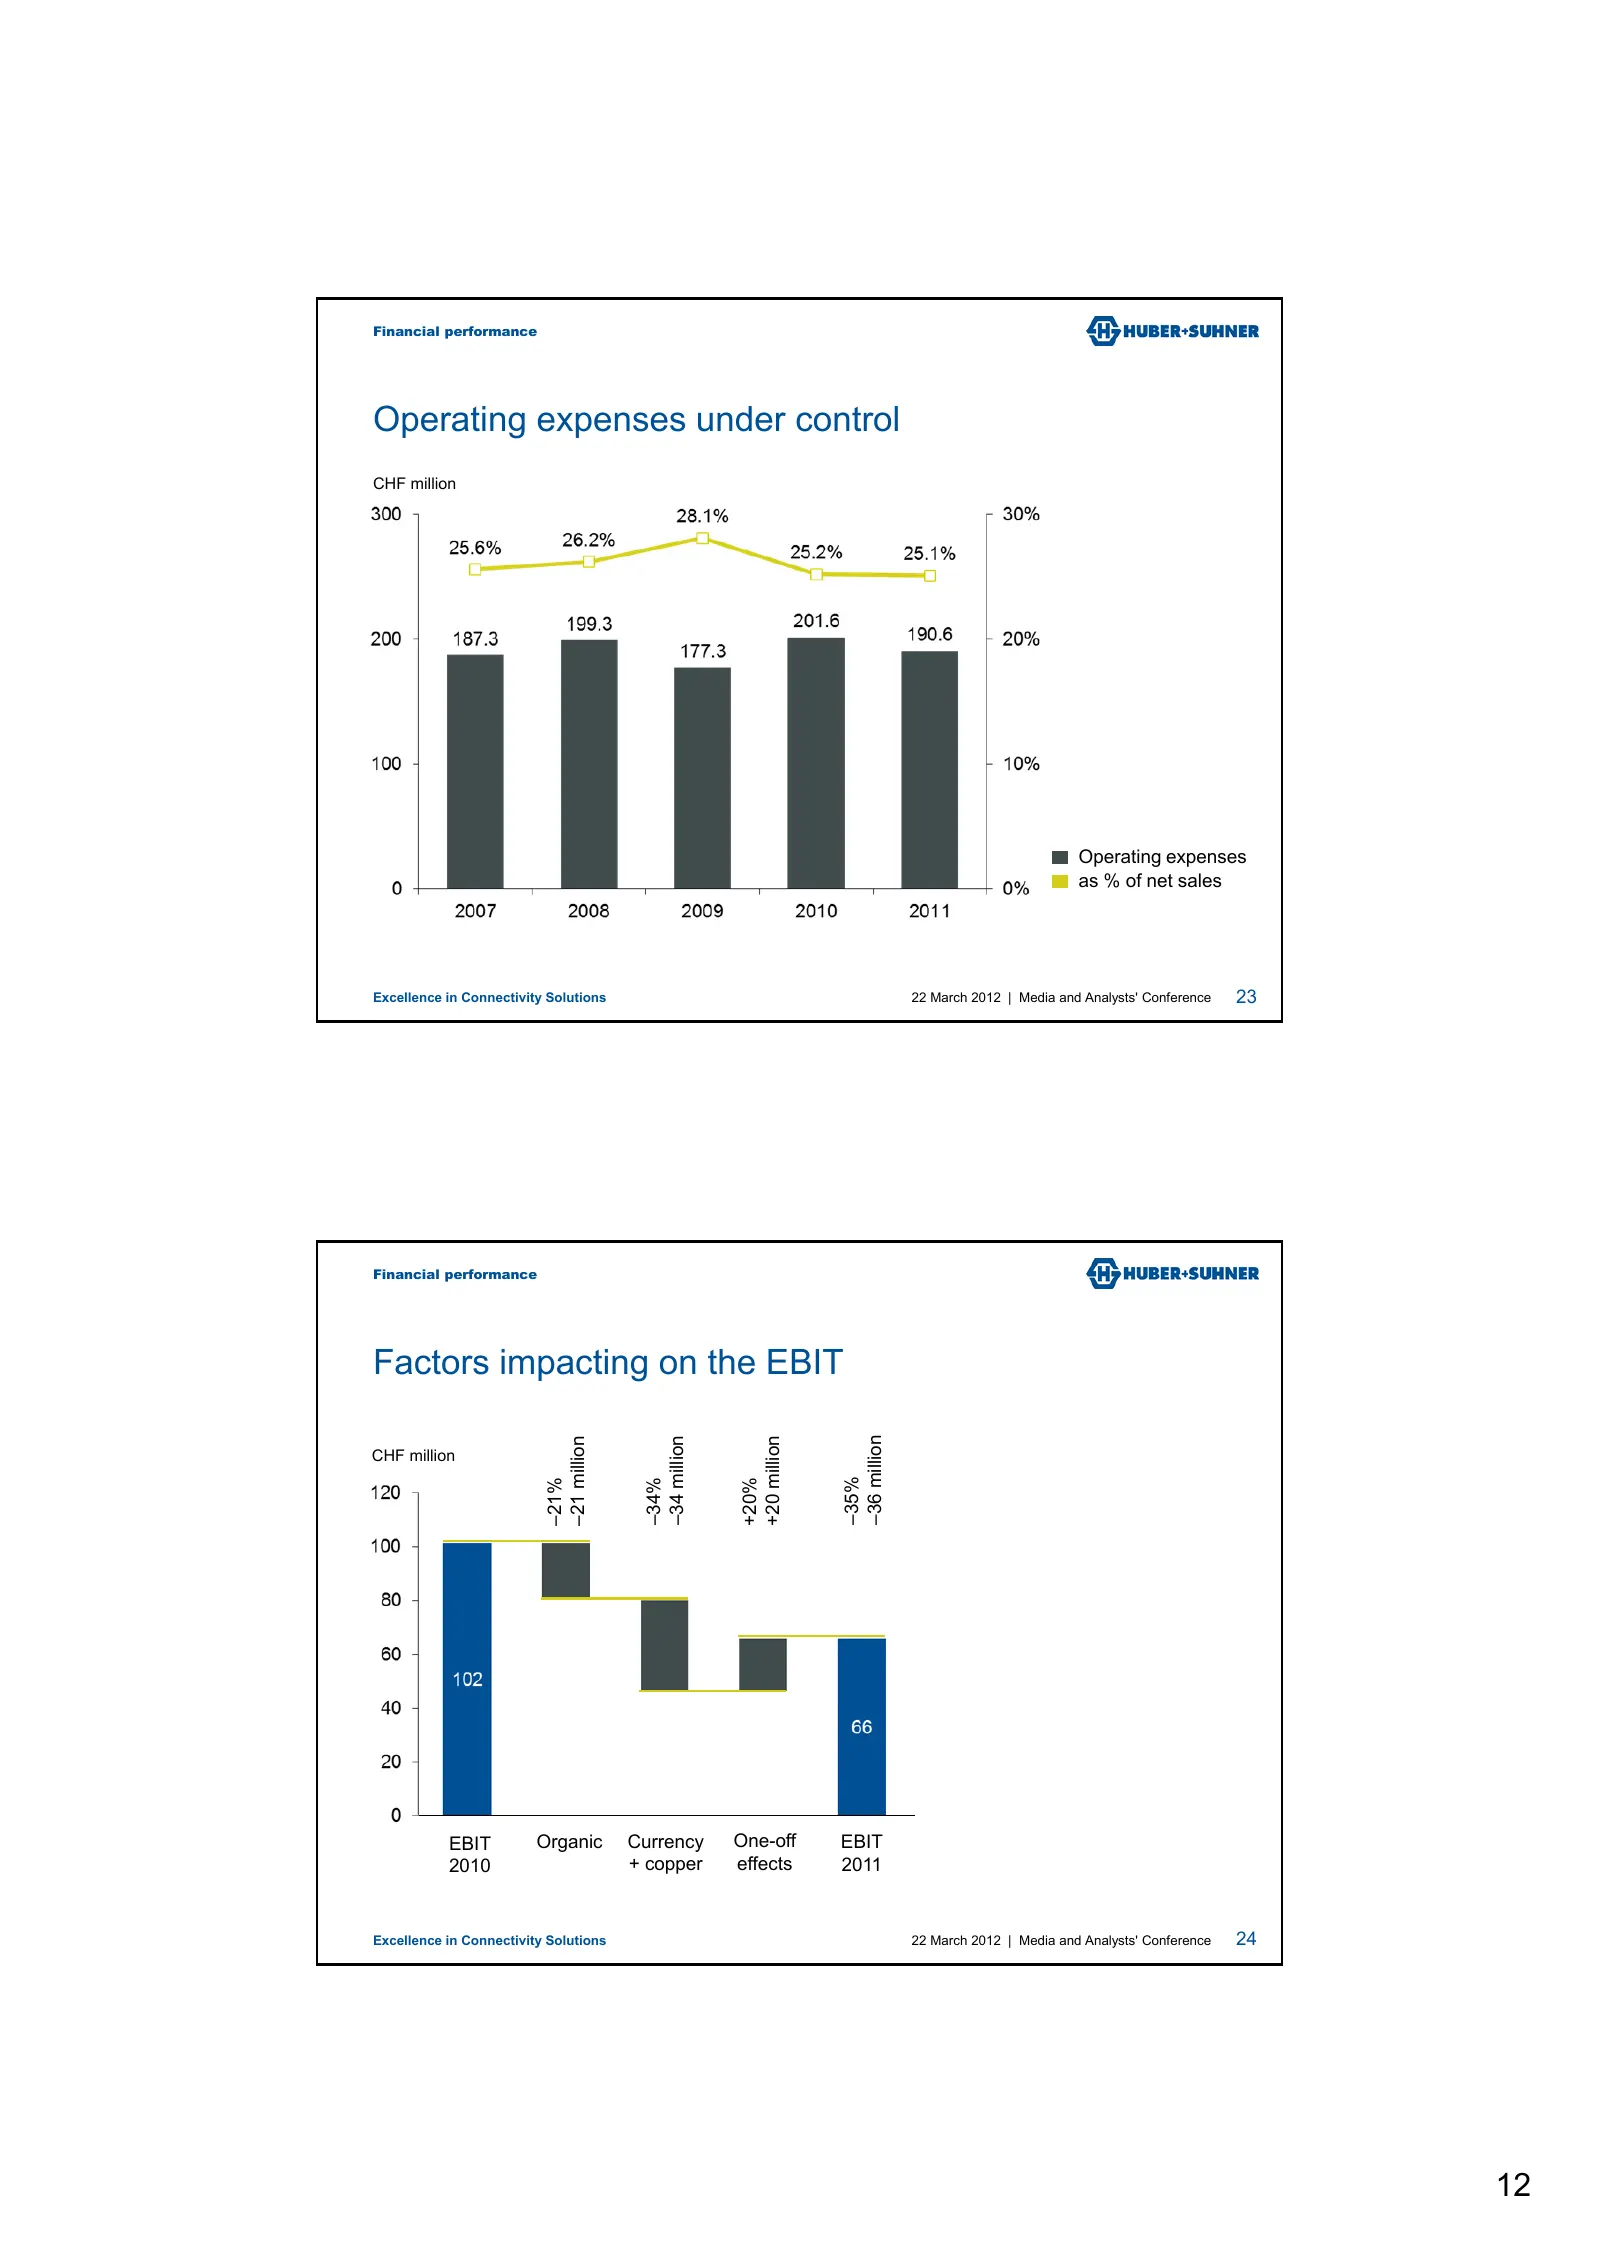
Financial performance Operating expenses under control CHF million Operating expenses as % of net sales Excellence in Connectivity Solutions 22 March 2012 | Media and Analysts' Conference 23 Financial performance Factors impacting on the EBIT –36 million –34 million +20 million –21 million CHF milli
Slide 13: Financial result and tax rate
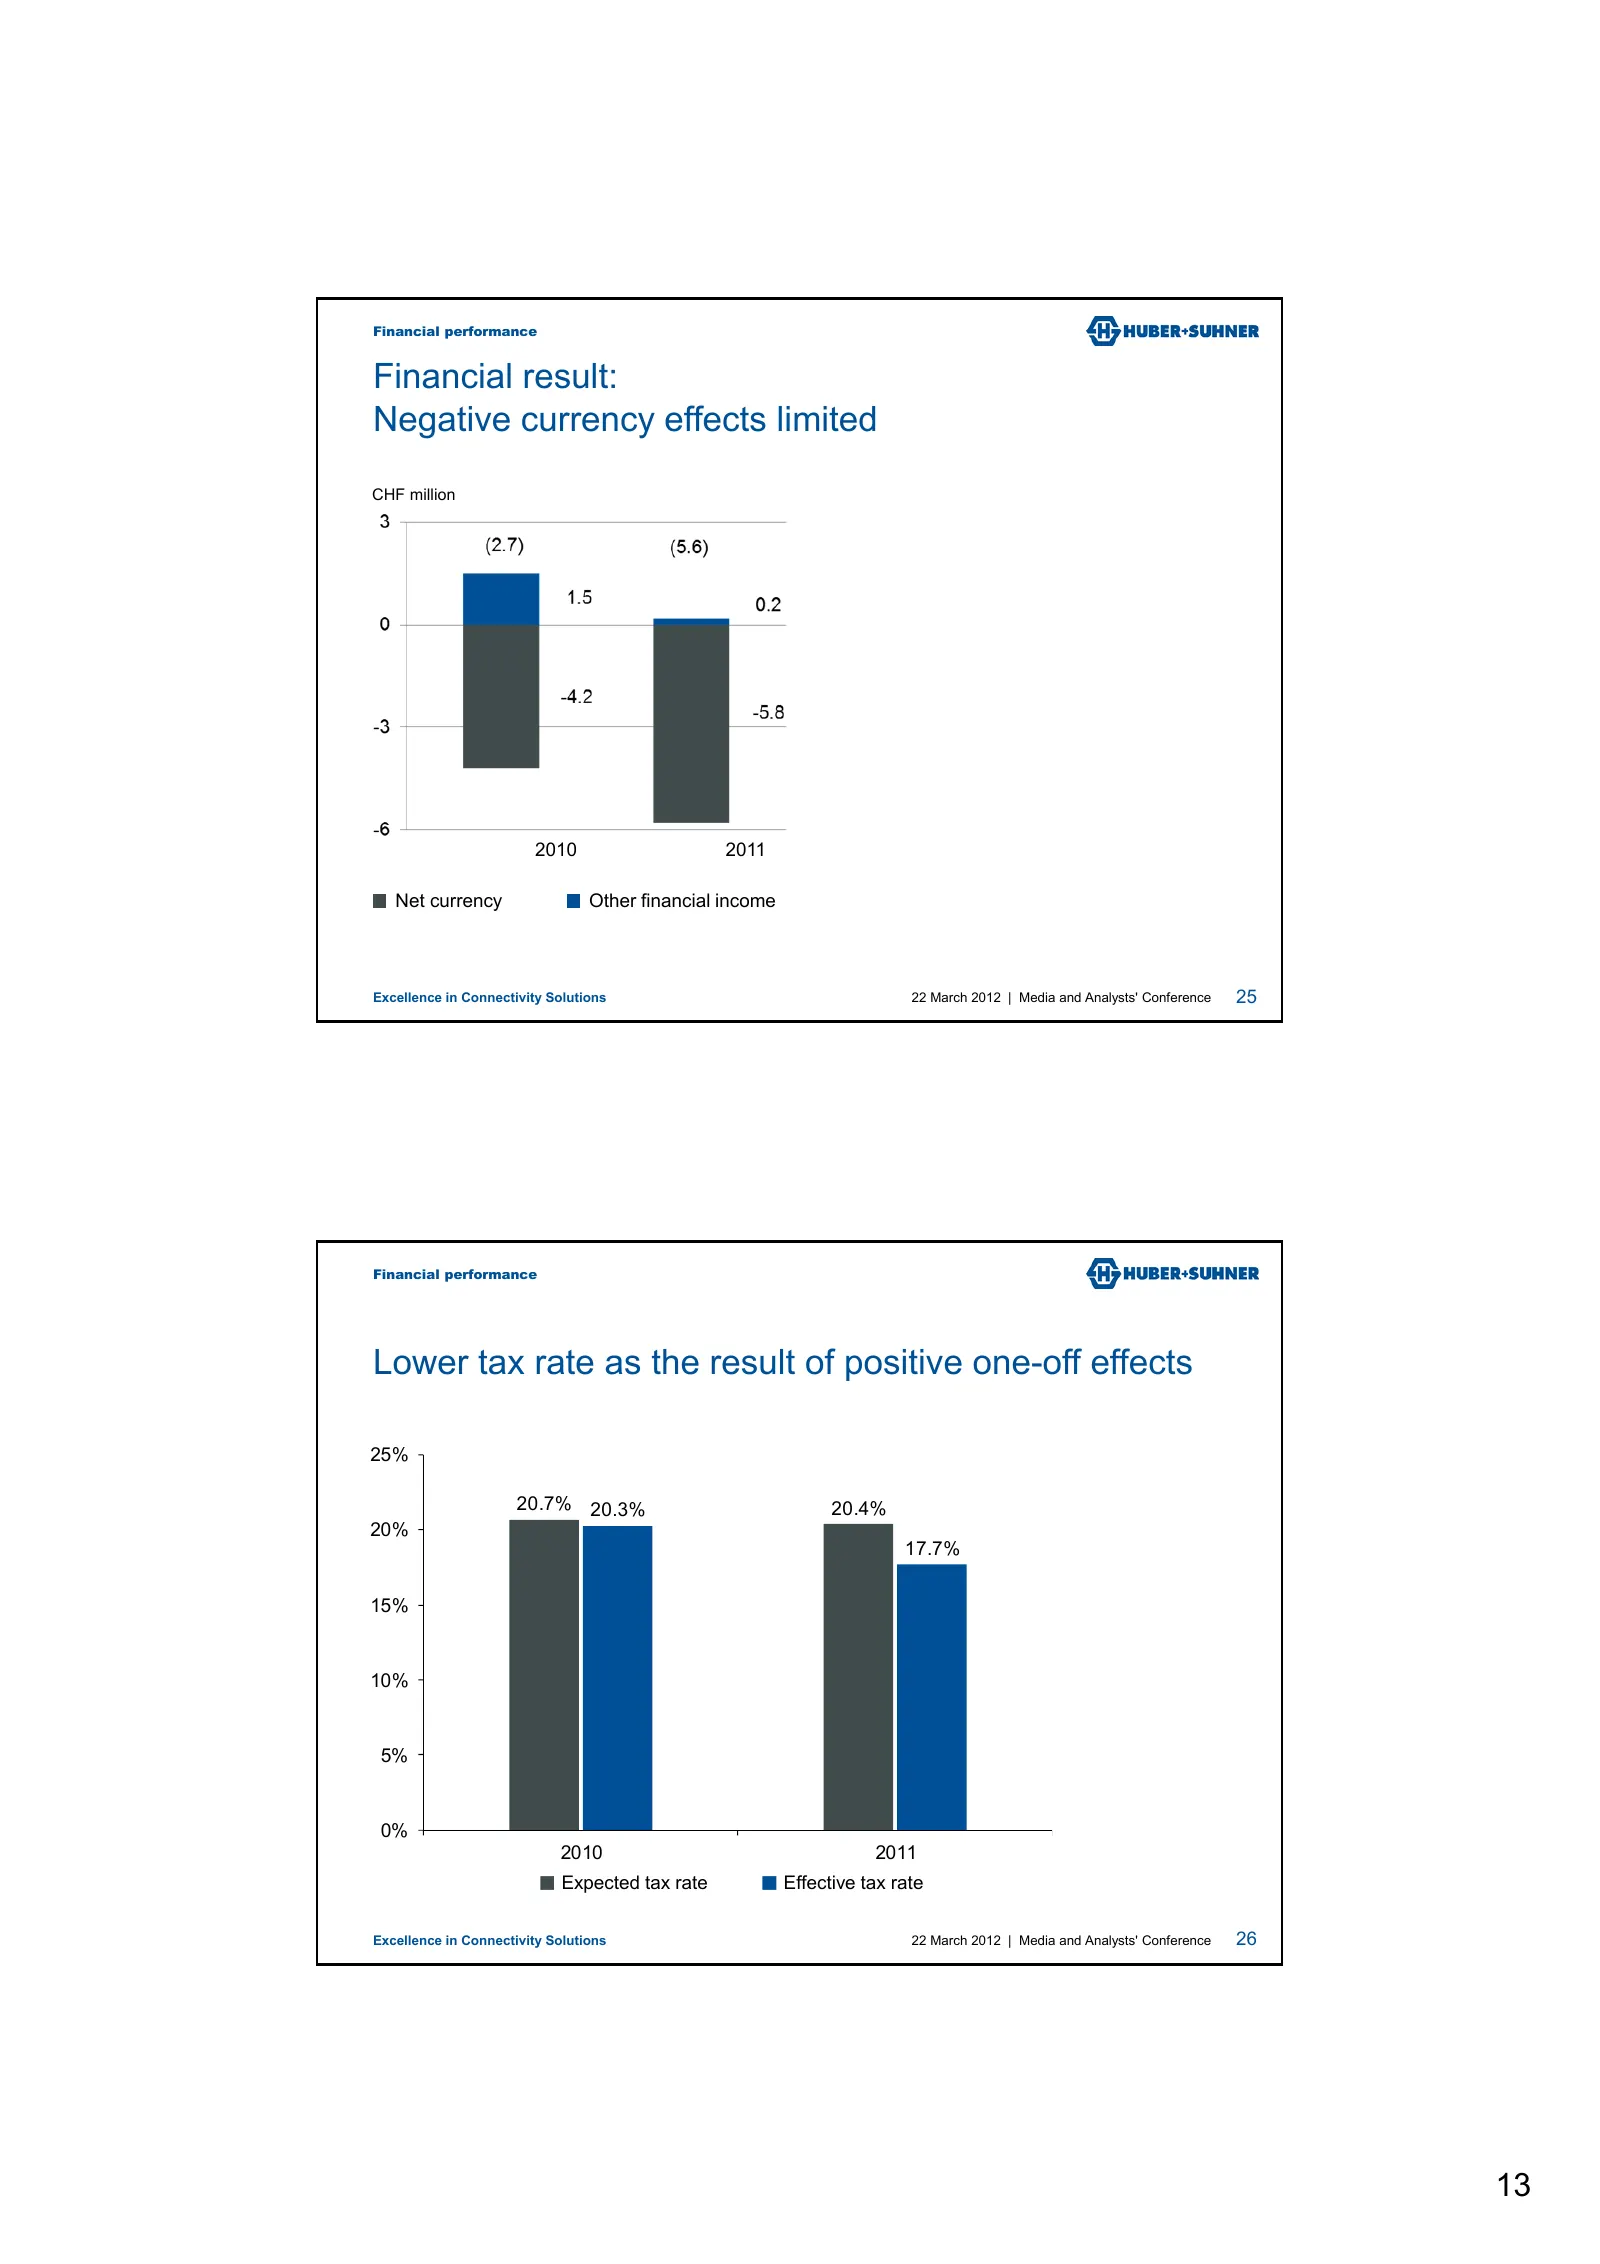
Financial performance Financial result: Negative currency effects limited CHF million 2010 2011 Net currency Other financial income Excellence in Connectivity Solutions 22 March 2012 | Media and Analysts' Conference 25 Financial performance Lower tax rate as the result of positive one-off effects 25
Slide 14: Lower net income after record year; investments
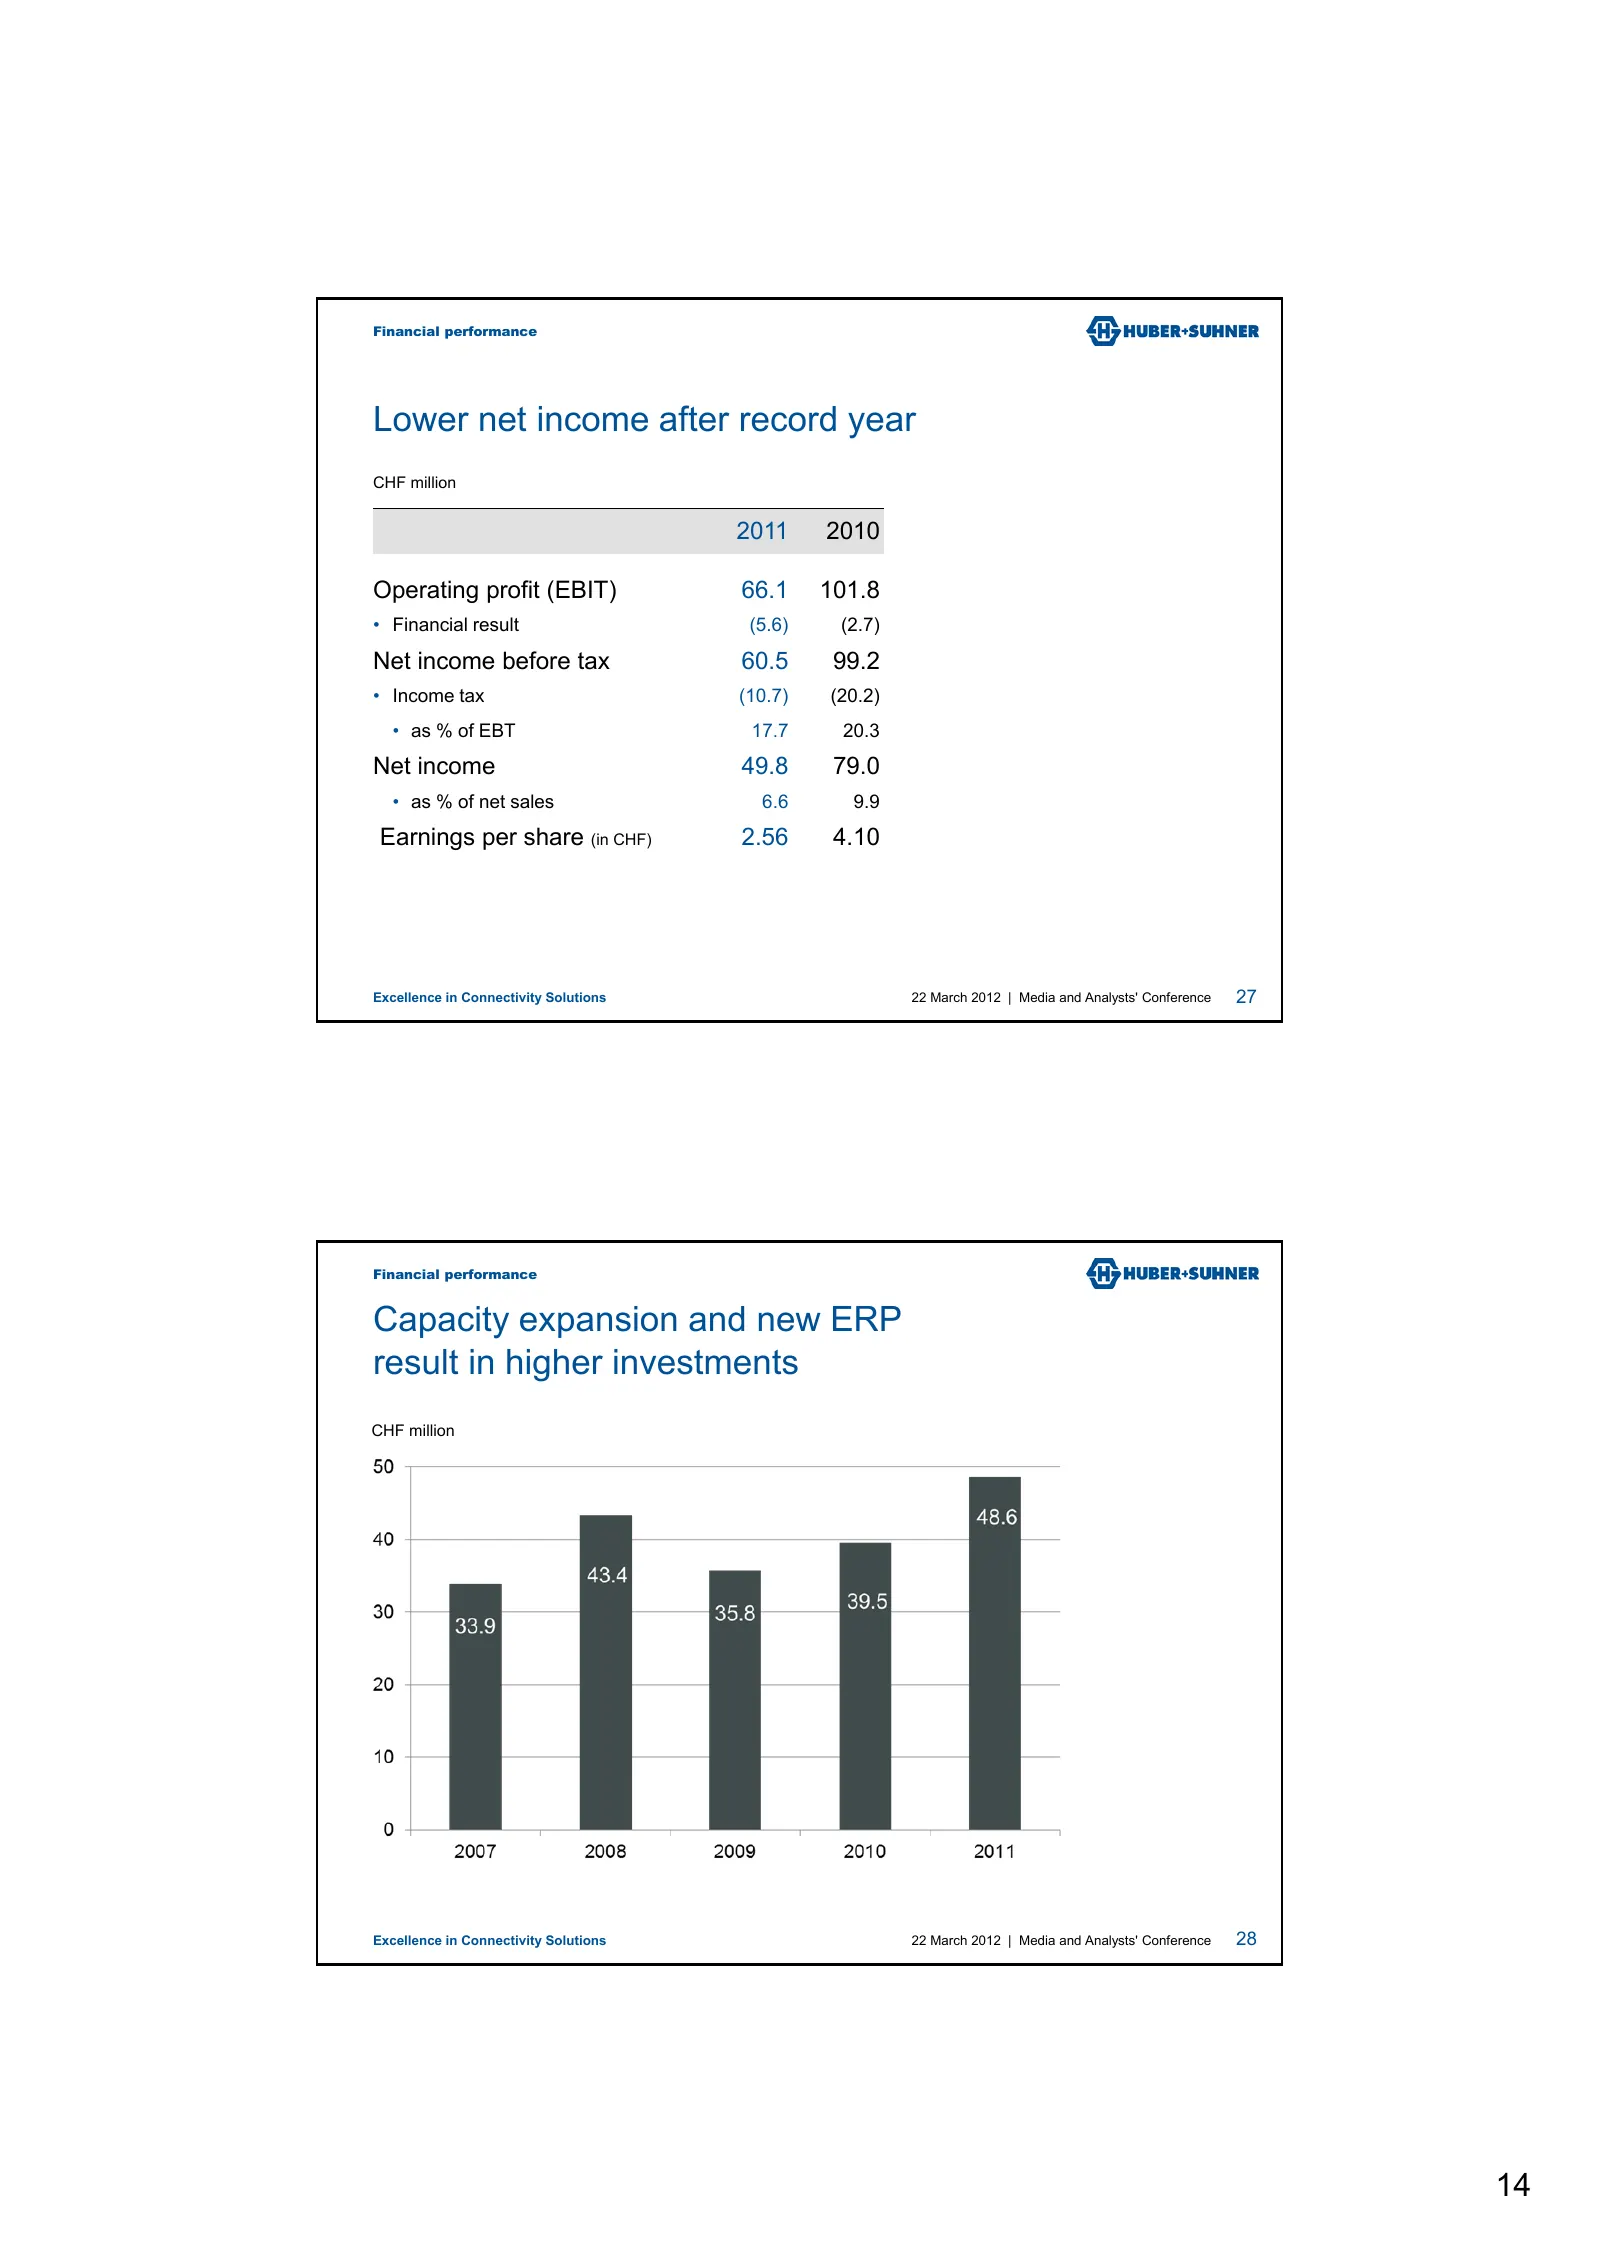
Financial performance Lower net income after record year CHF million 2011 2010 Operating profit (EBIT) 66.1 101.8 • Financial result (5.6) (2.7) Net income before tax 60.5 99.2 • Income tax (10.7) (20.2) • as % of EBT 17.7 20.3 Net income 49.8 79.0 • as % of net sales 6.6 9.9 Earnings per share (in
Slide 15: Strong consolidated balance sheet; pension accounting under IAS 19
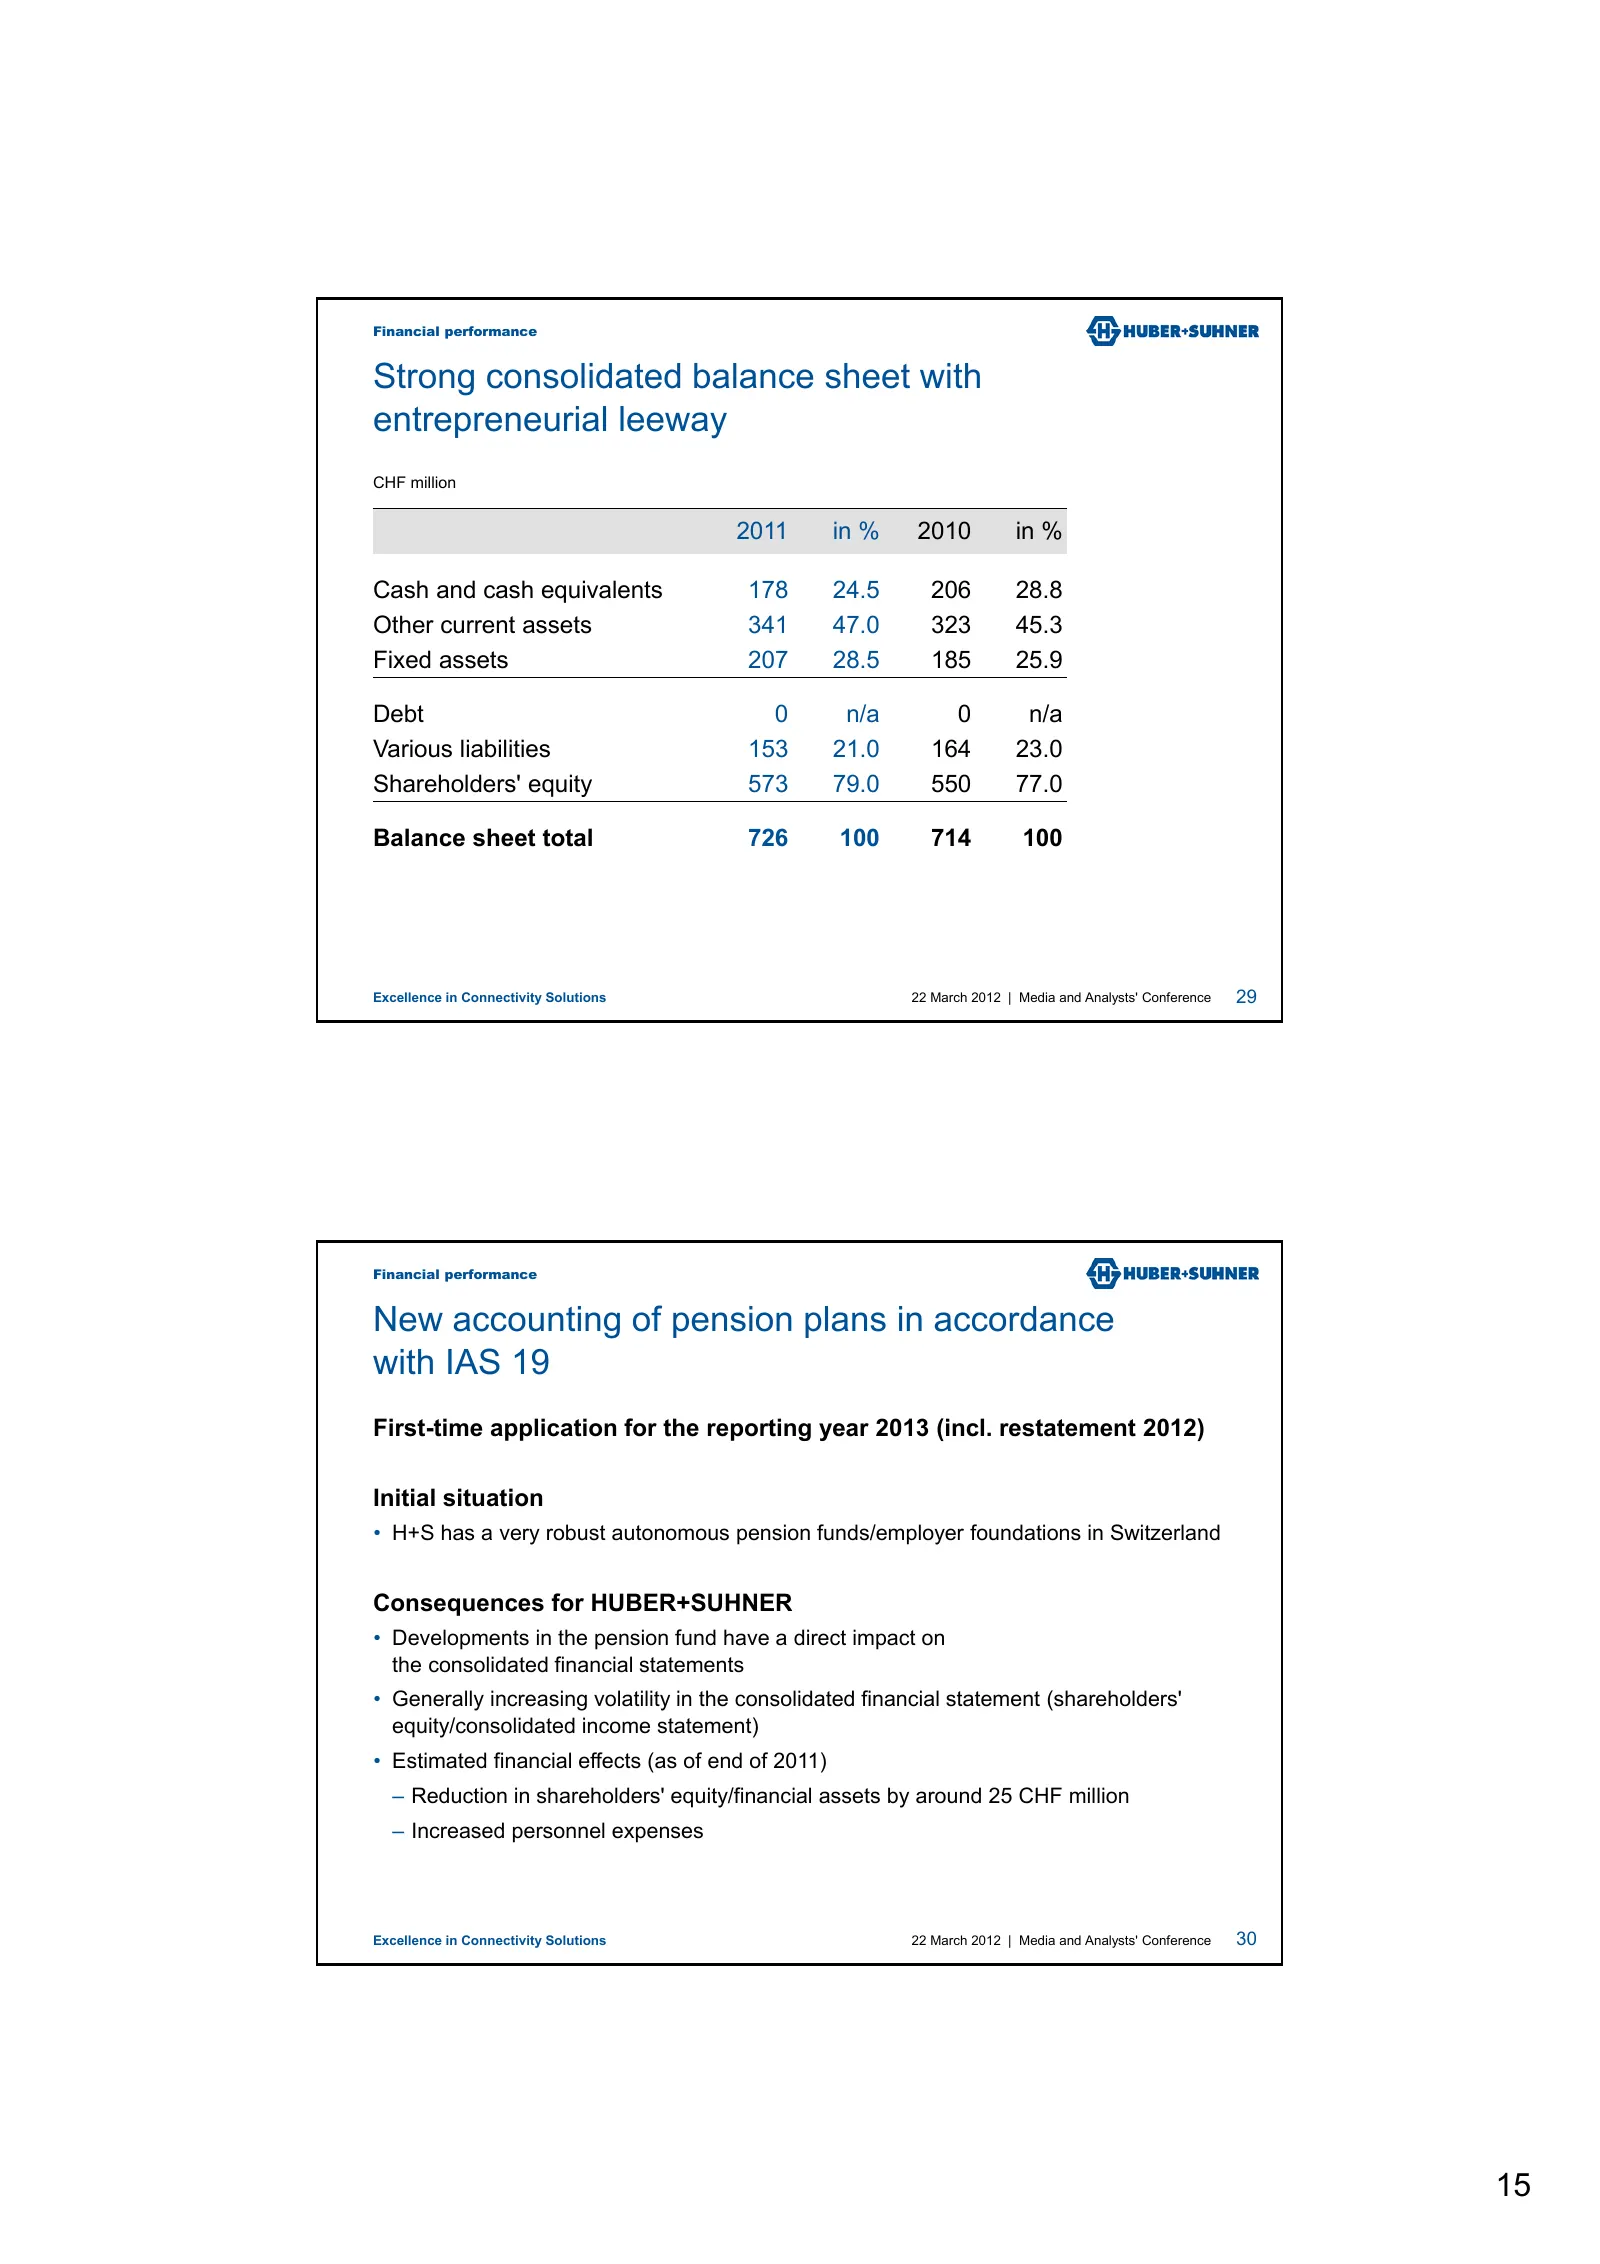
Financial performance Strong consolidated balance sheet with entrepreneurial leeway CHF million 2011 in % 2010 in % Cash and cash equivalents 178 24.5 206 28.8 Other current assets 341 47.0 323 45.3 Fixed assets 207 28.5 185 25.9 Debt 0 n/a 0 n/a Various liabilities 153 21.0 164 23.0 Shareholders' e
Slide 16: Negative free cash flow; return on invested capital
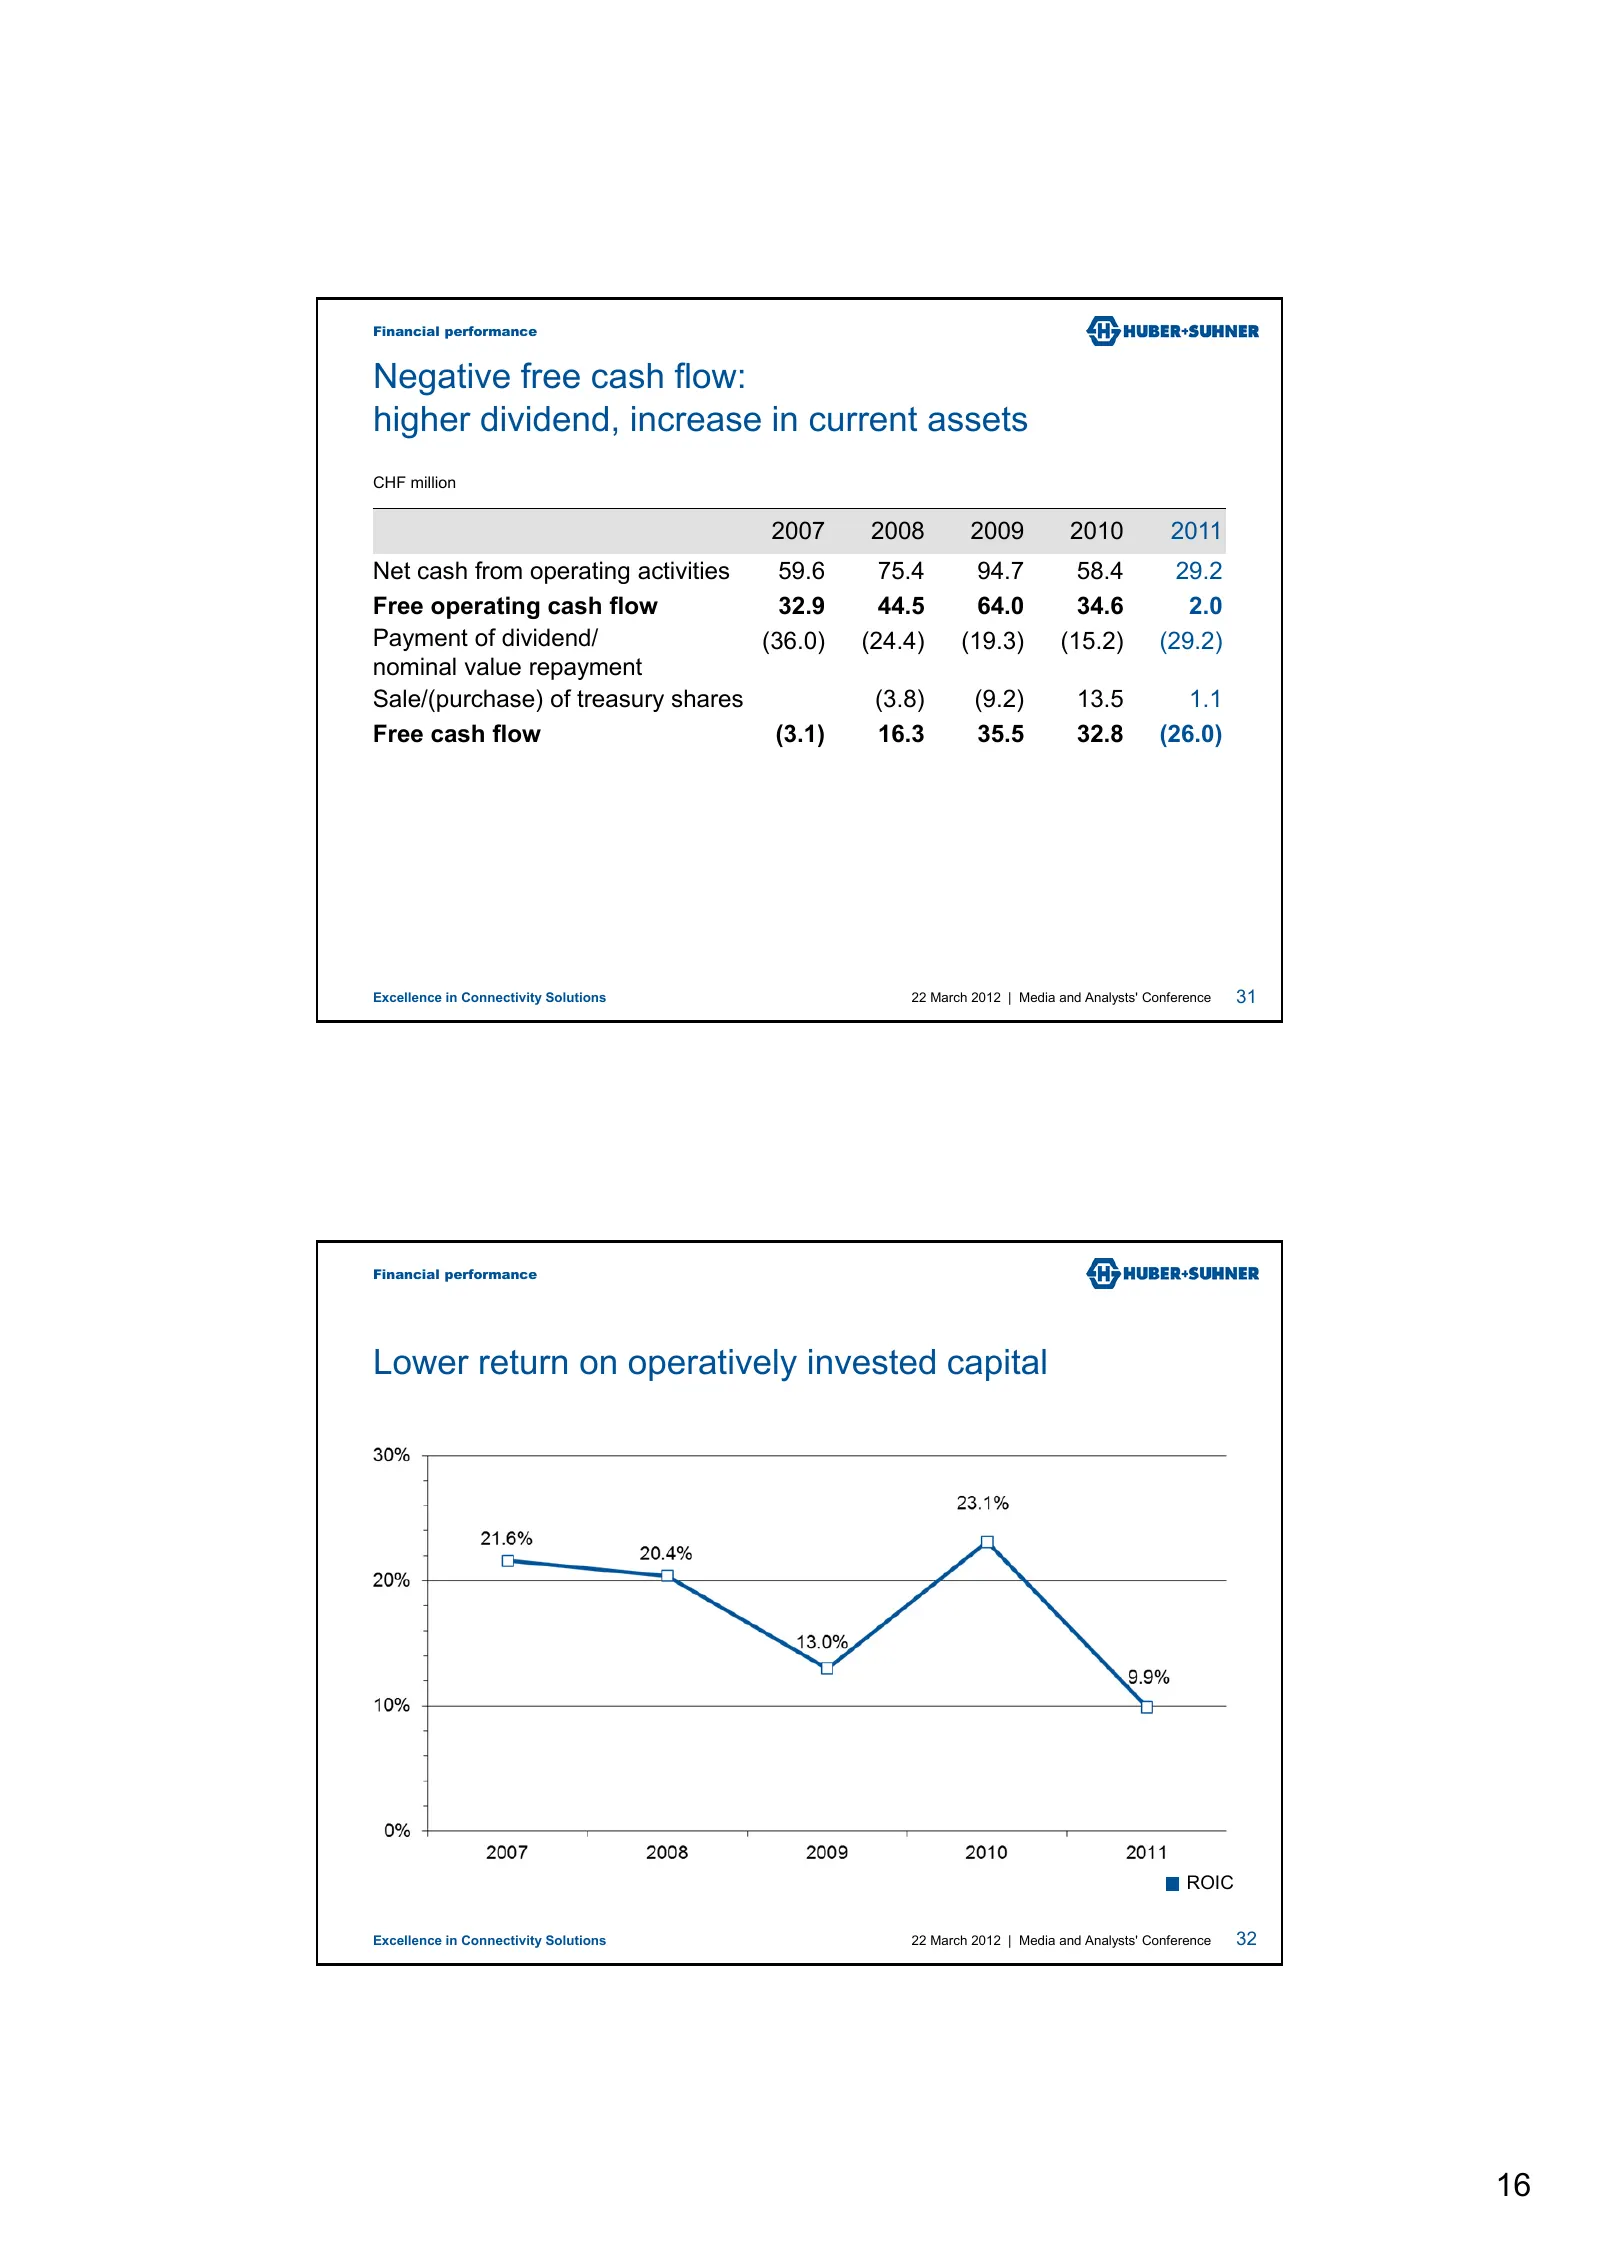
Financial performance Negative free cash flow: higher dividend, increase in current assets CHF million 2007 2008 2009 2010 2011 Net cash from operating activities 59.6 75.4 94.7 58.4 29.2 Free operating cash flow 32.9 44.5 64.0 34.6 2.0 Payment of dividend/ (36.0) (24.4) (19.3) (15.2) (29.2) nominal
Slide 17: Important factors in 2012
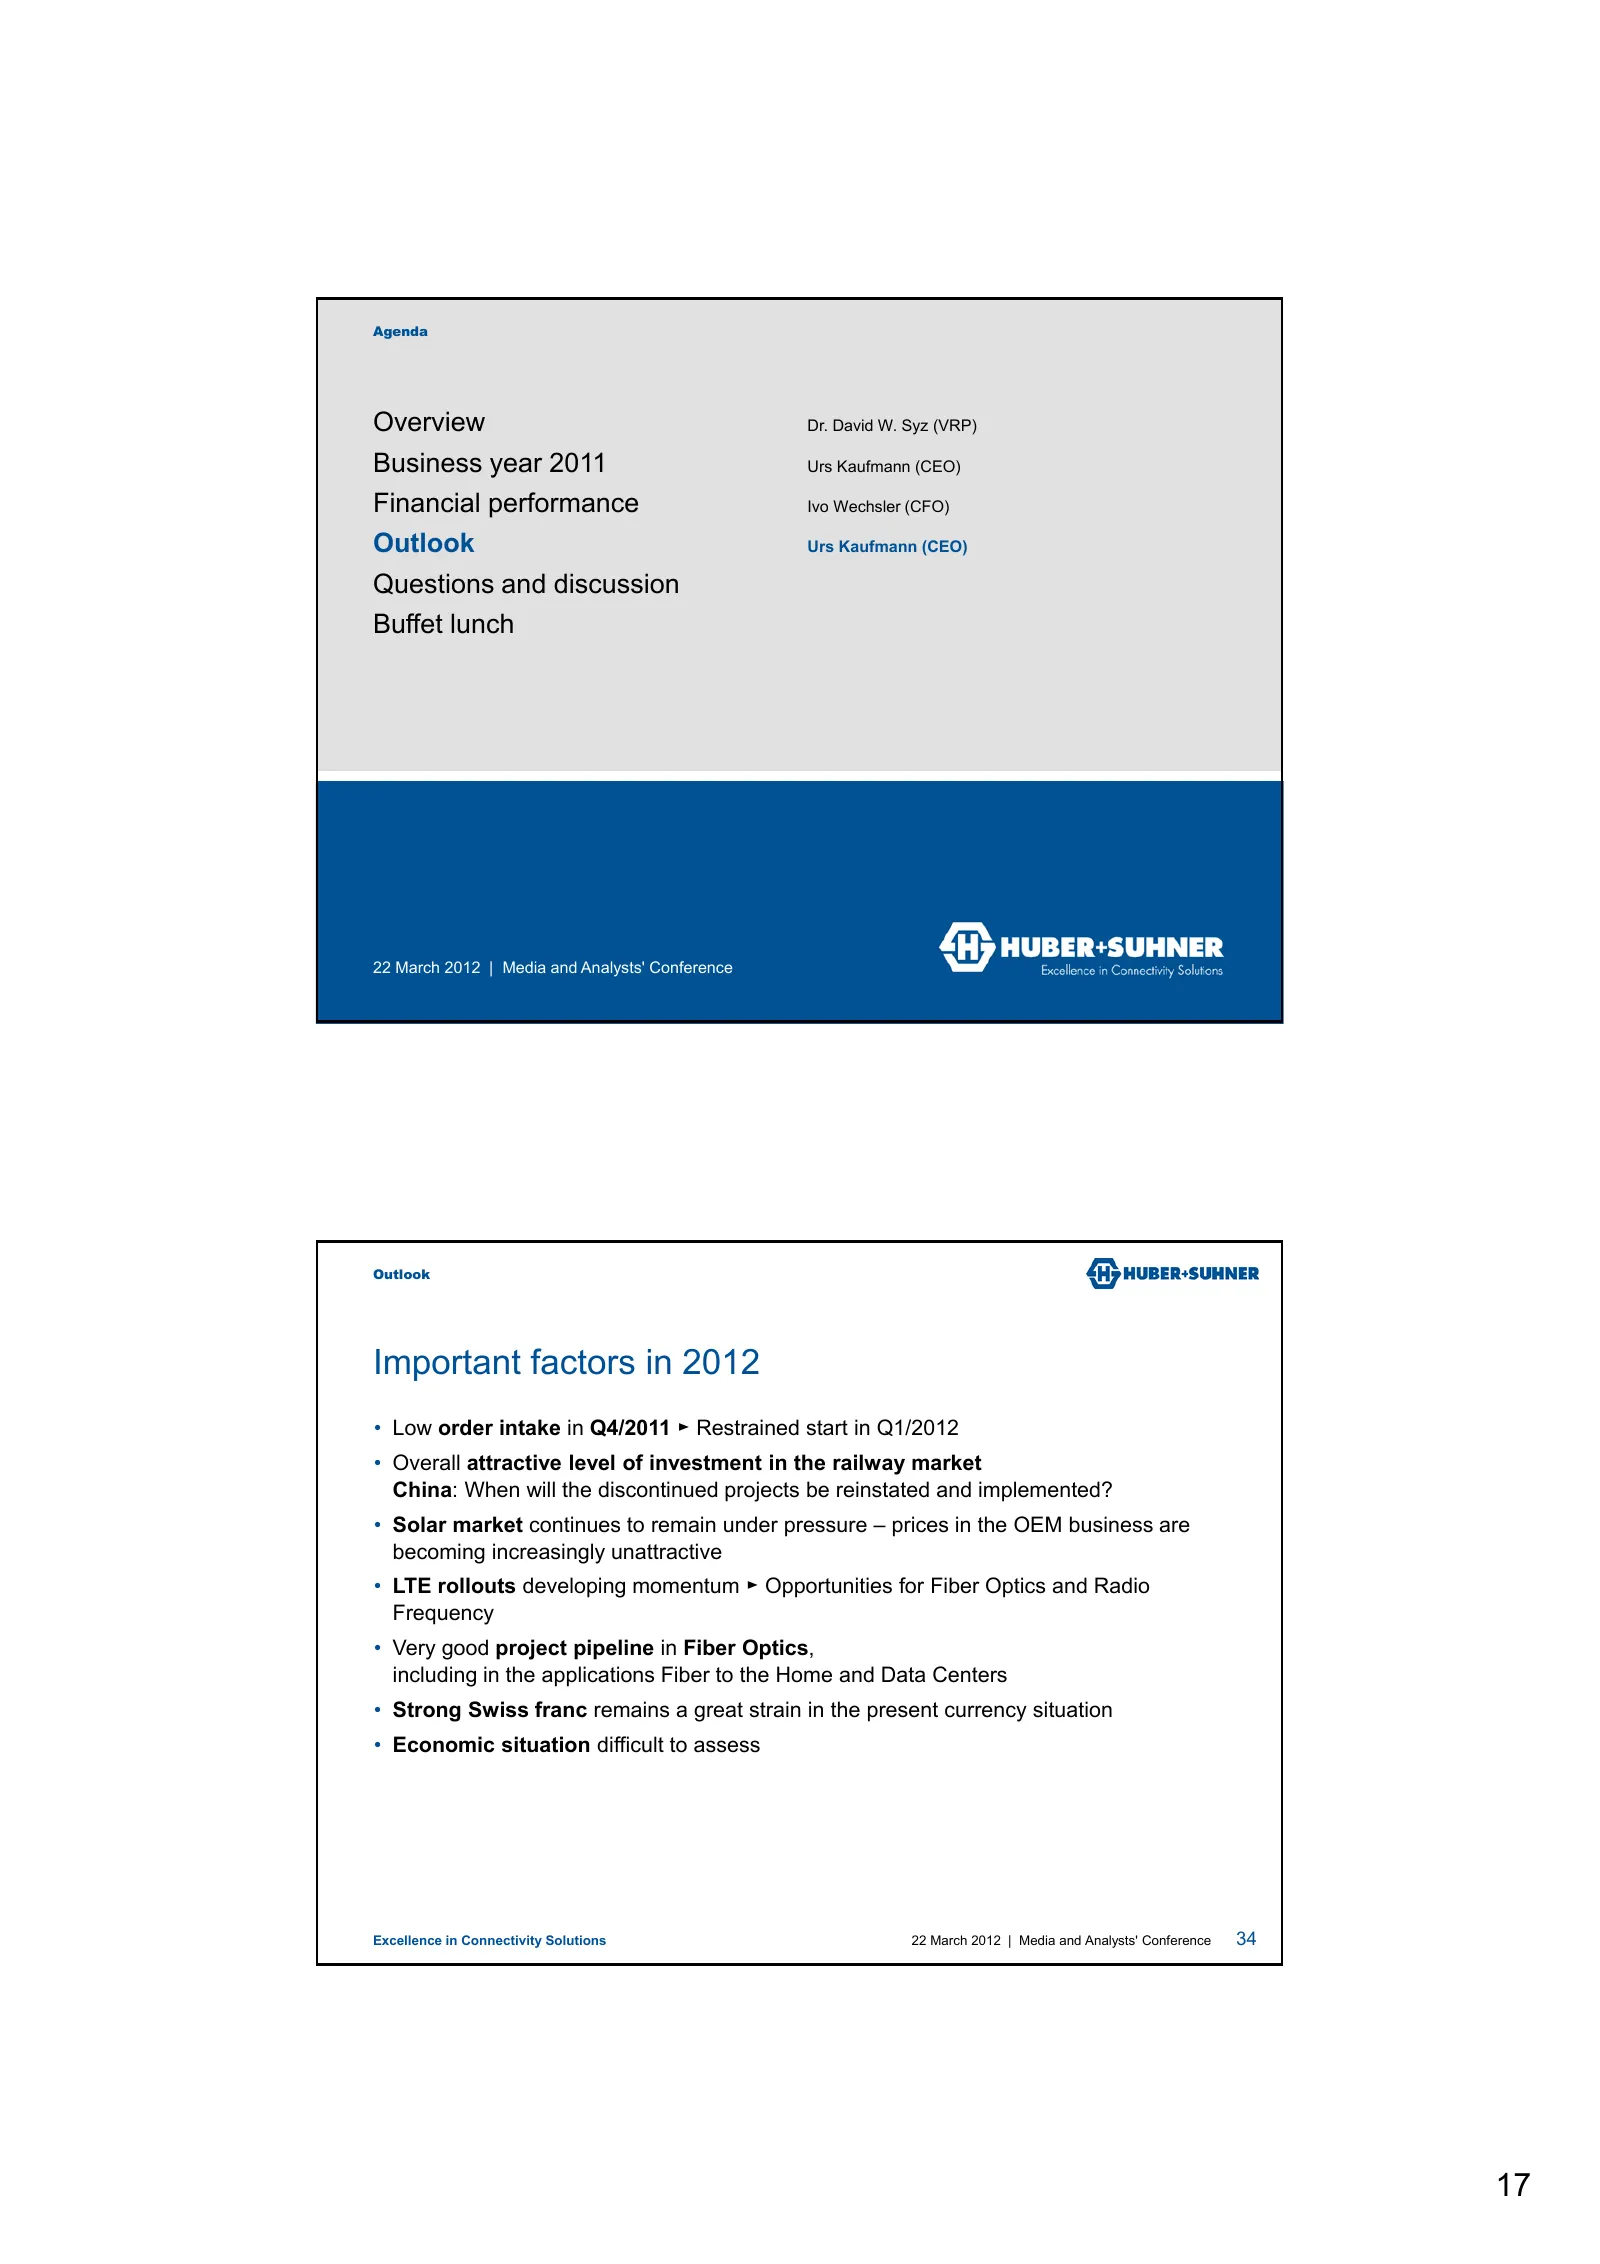
Agenda Overview Dr. David W. Syz (VRP) Business year 2011 Urs Kaufmann (CEO) Financial performance Ivo Wechsler (CFO) Outlook Urs Kaufmann (CEO) Questions and discussion Buffet lunch 22 March 2012 | Media and Analysts' Conference Outlook Important factors in 2012 • Low order intake in Q4/2011 ► Rest
Slide 18: Anticipated business development 2012; full-time equivalents
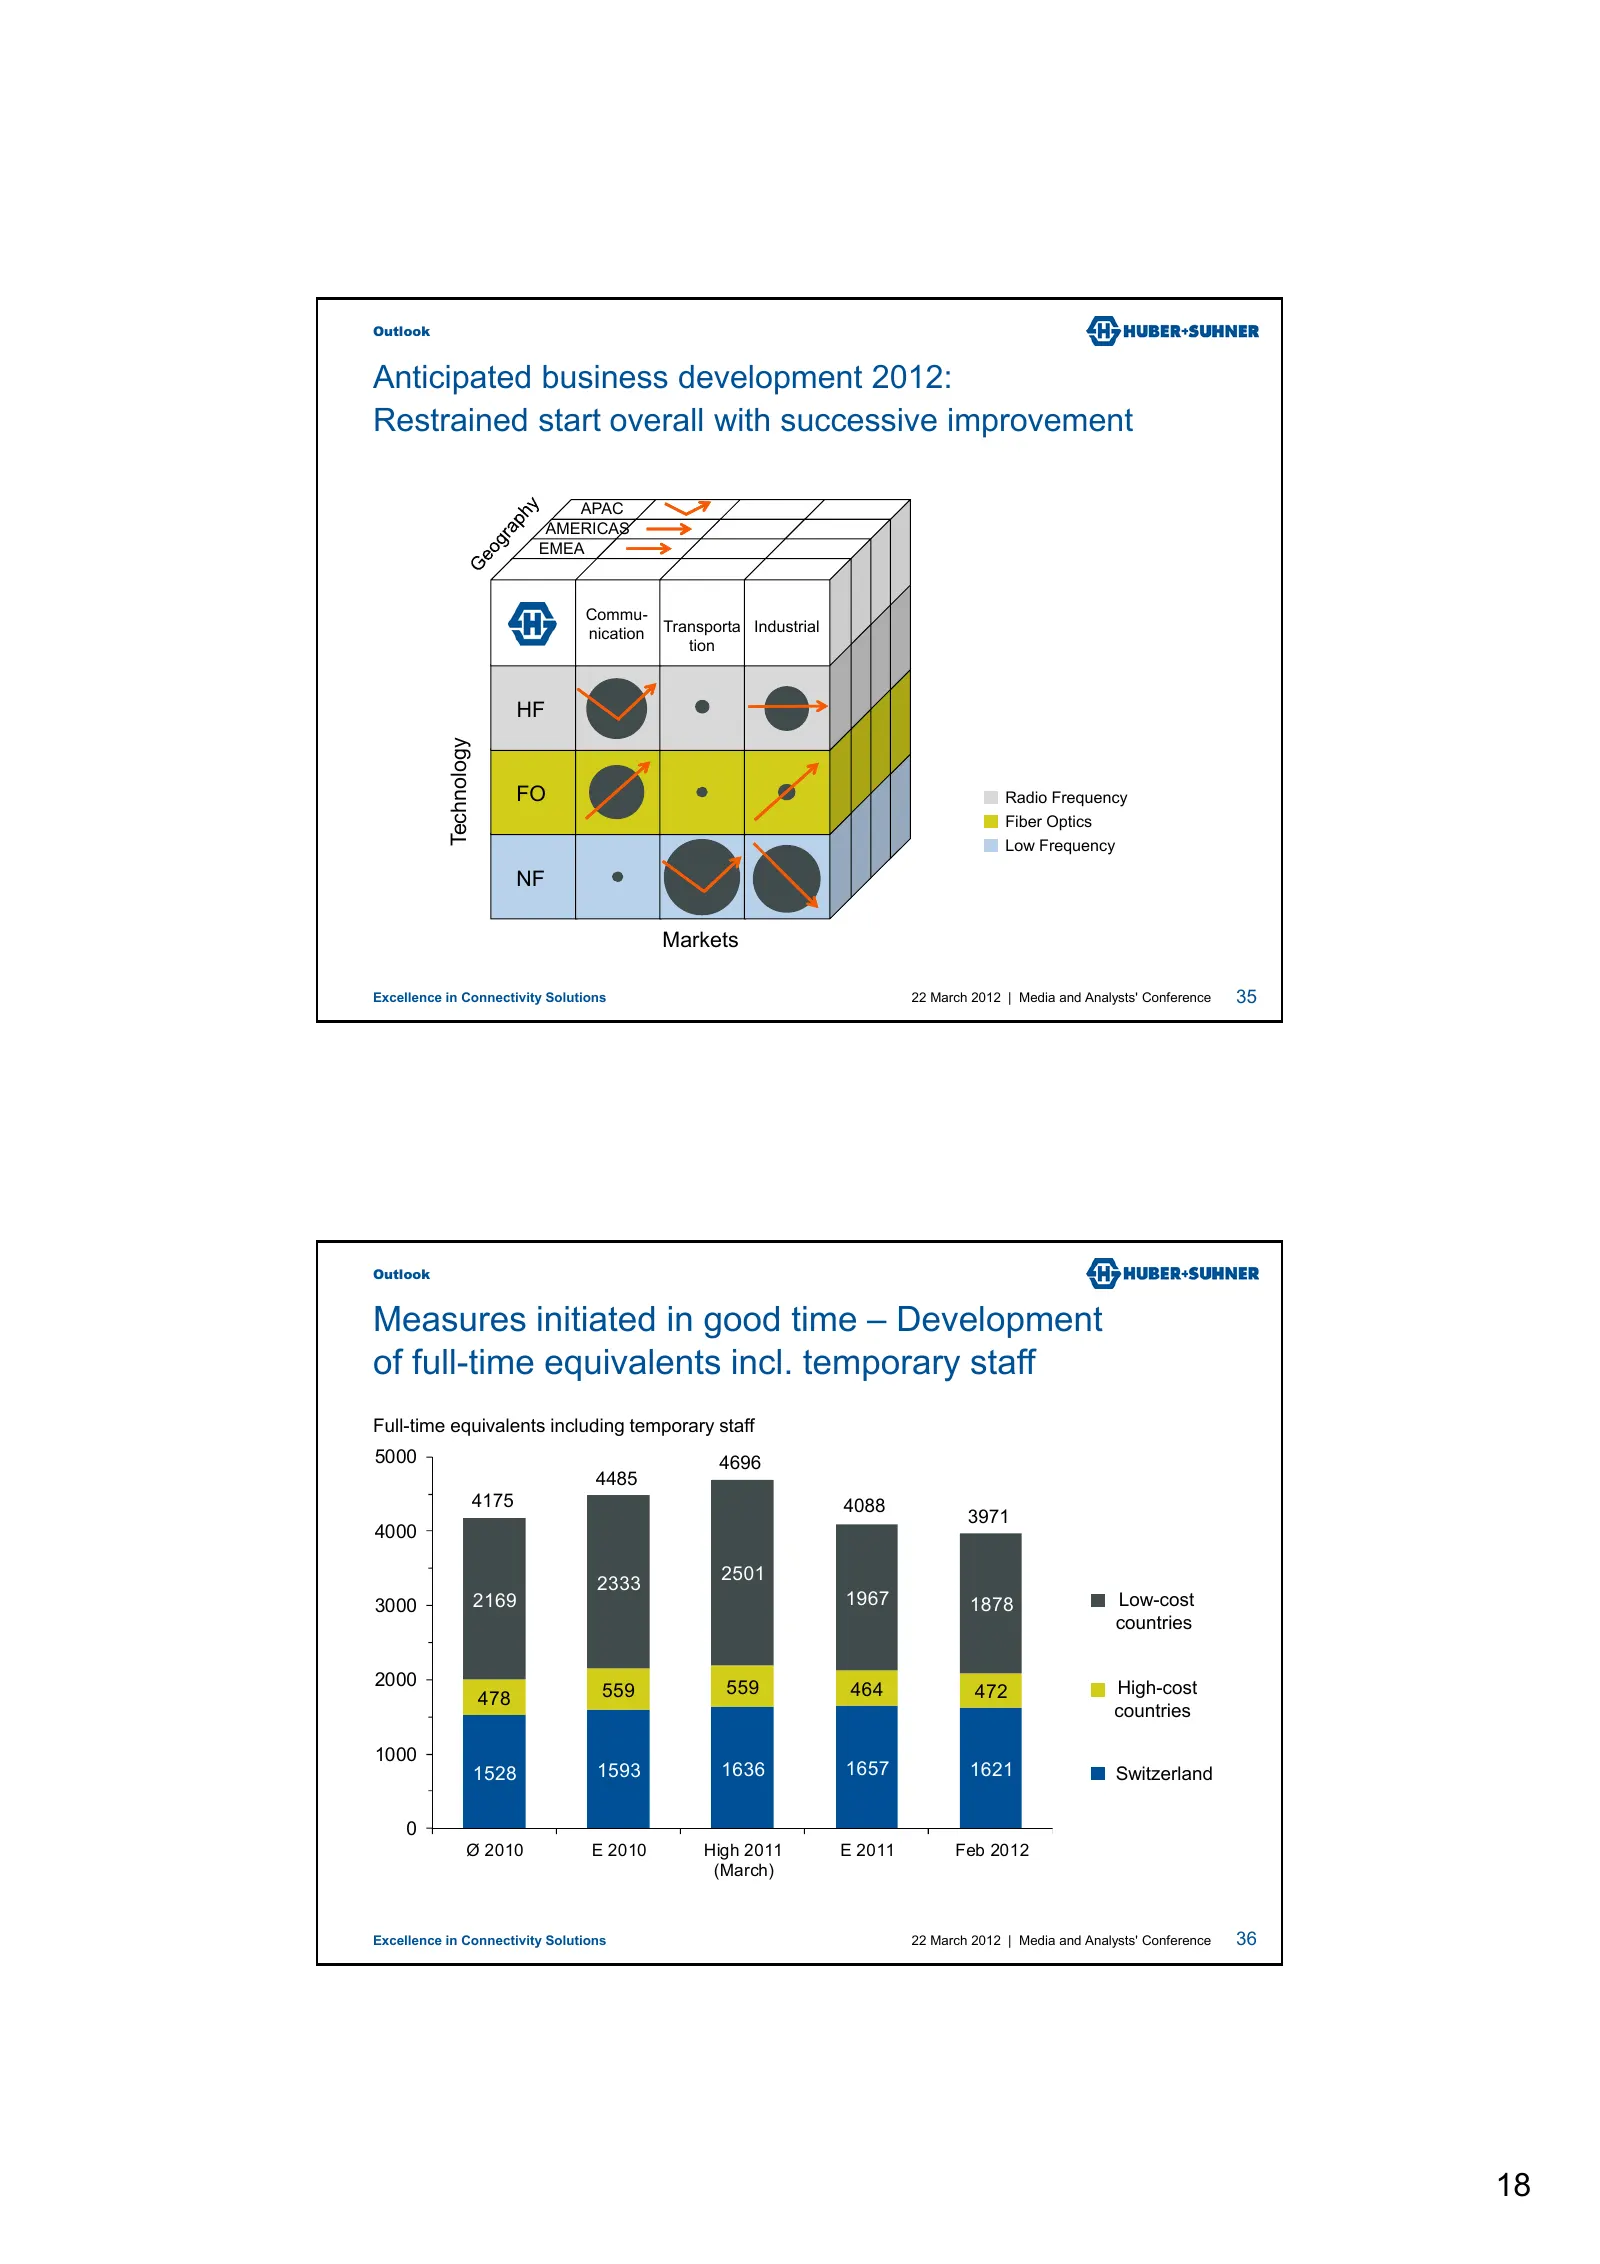
Outlook Anticipated business development 2012: Restrained start overall with successive improvement APAC AMERICAS EMEA Commu- nication Transporta Industrial tion HF Technology FO Radio Frequency Fiber Optics Low Frequency NF Markets Excellence in Connectivity Solutions 22 March 2012 | Media and Anal
Slide 19: Outlook 2012; medium-term earnings and currency impact
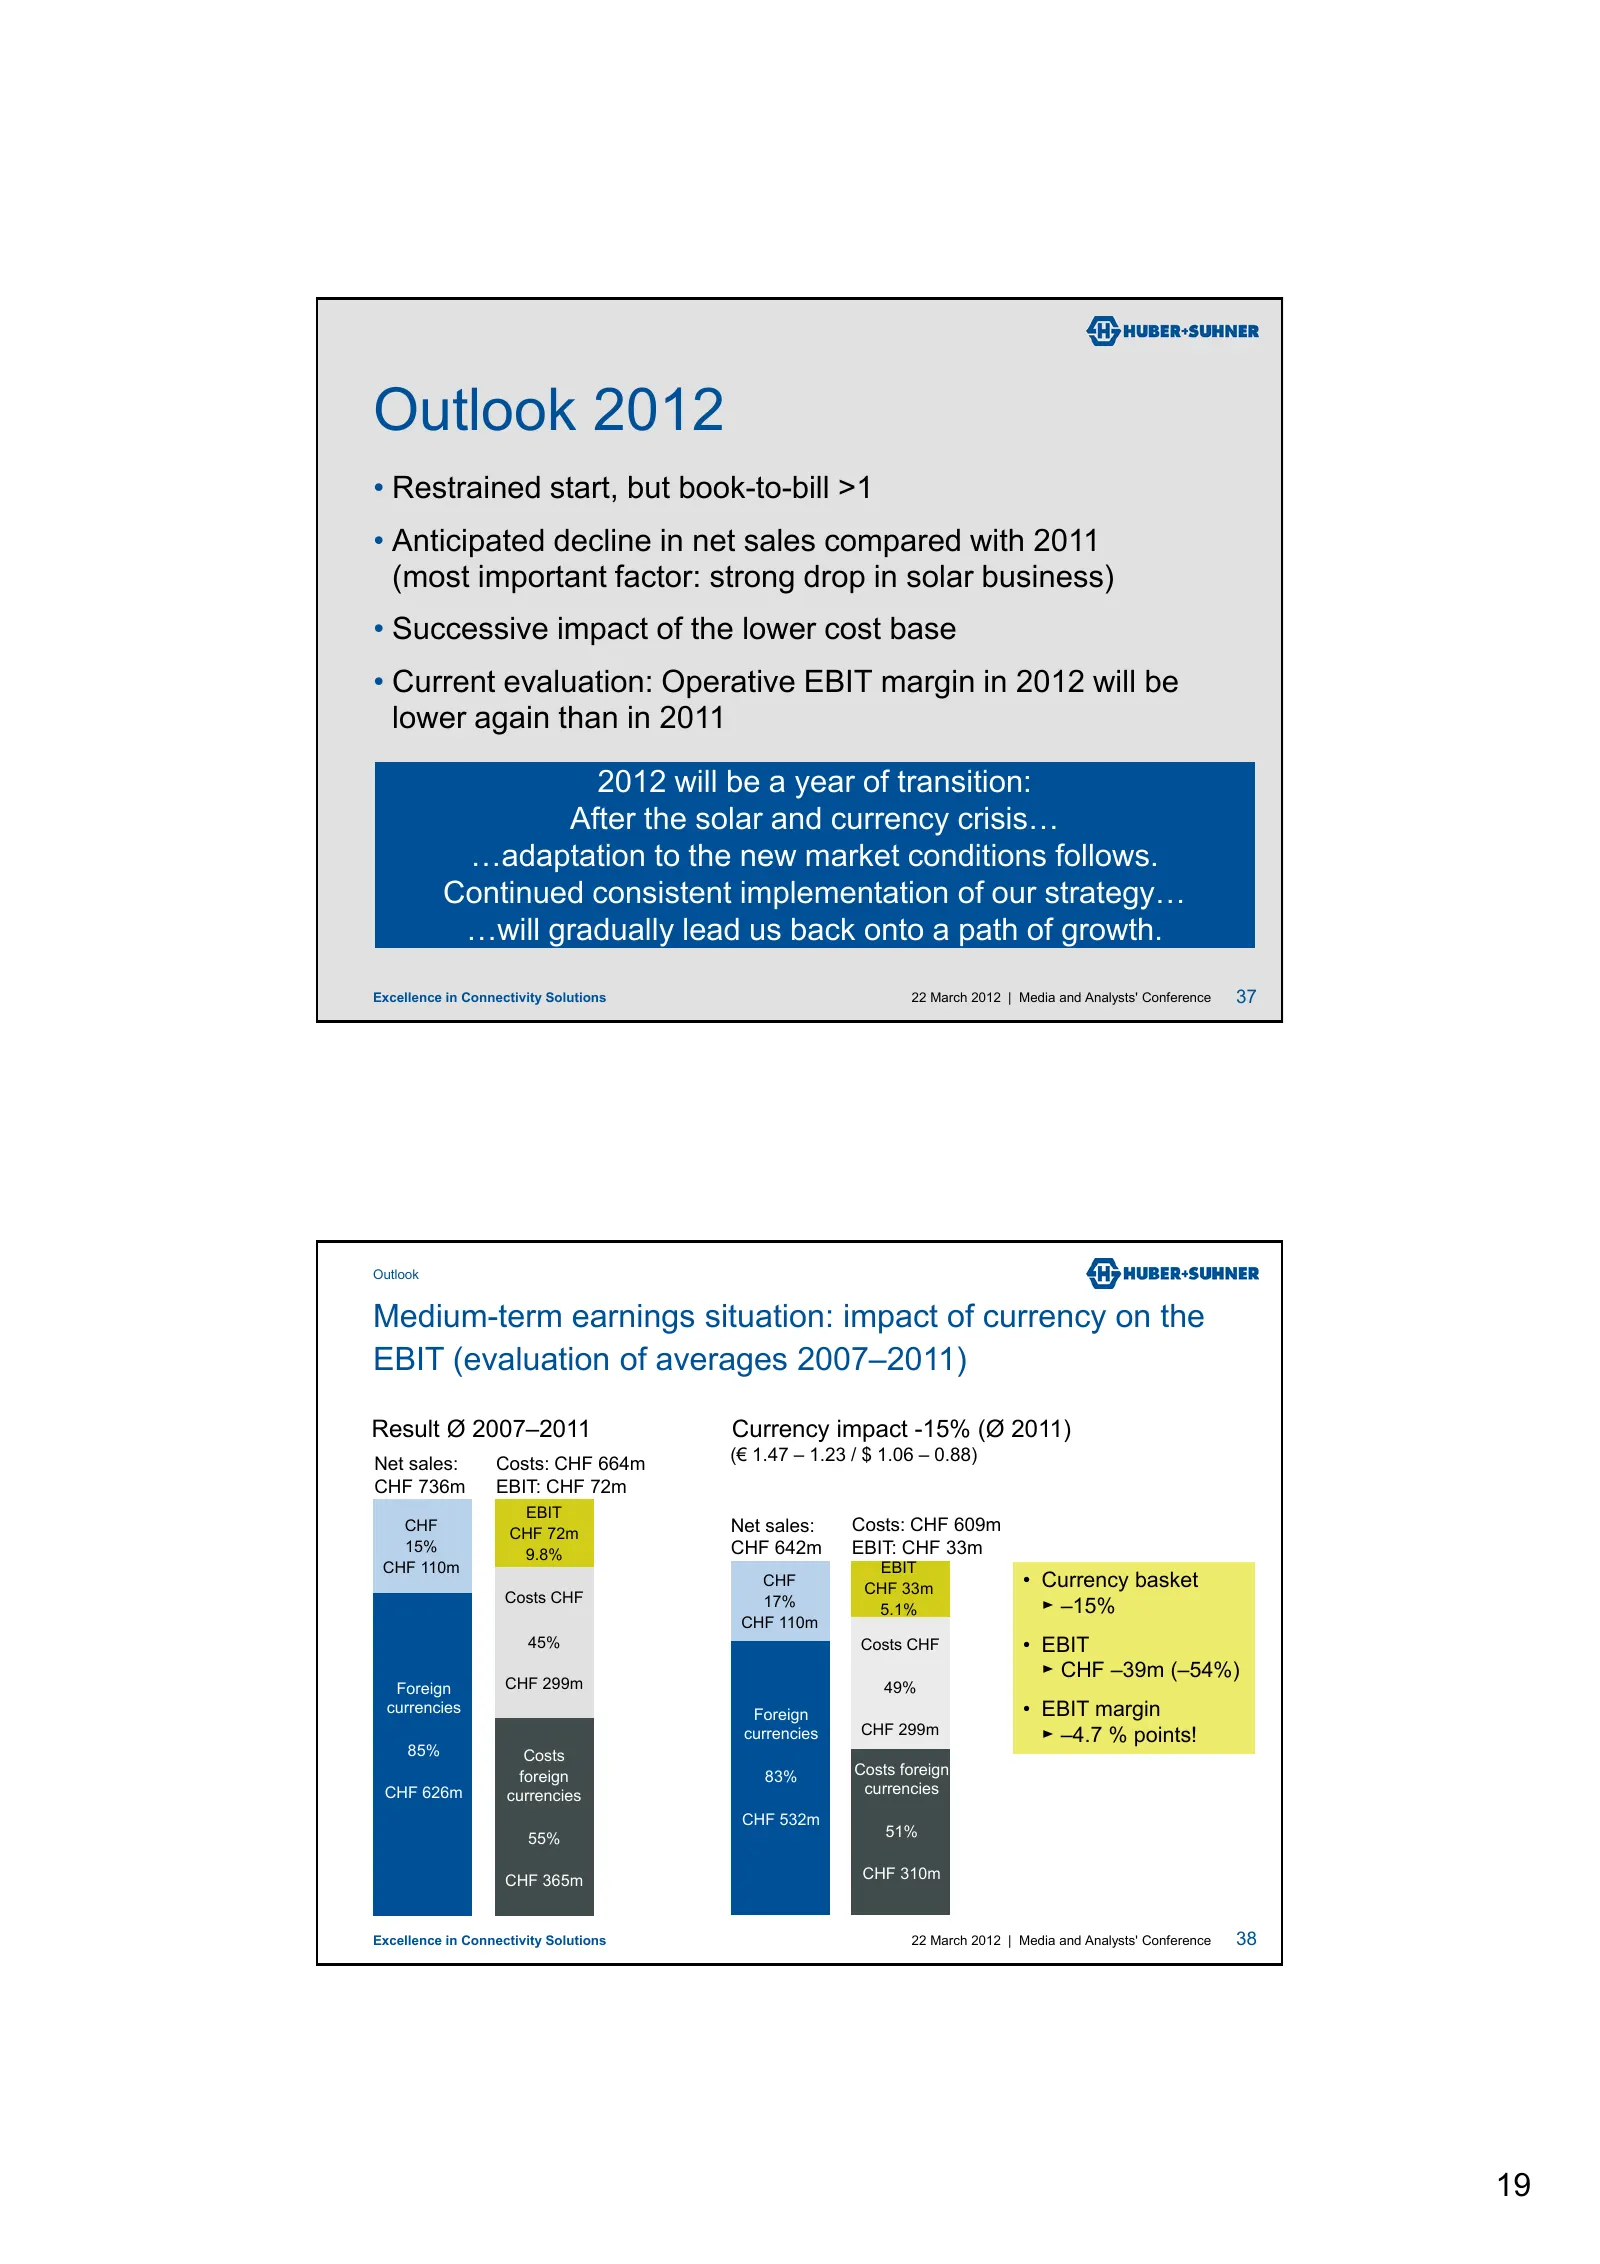
Outlook 2012 • Restrained start, but book-to-bill >1 • Anticipated decline in net sales compared with 2011 (most important factor: strong drop in solar business) • Successive impact of the lower cost base • Current evaluation: Operative EBIT margin in 2012 will be lower again than in 2011 2012 will
Slide 20: Medium-term earnings situation
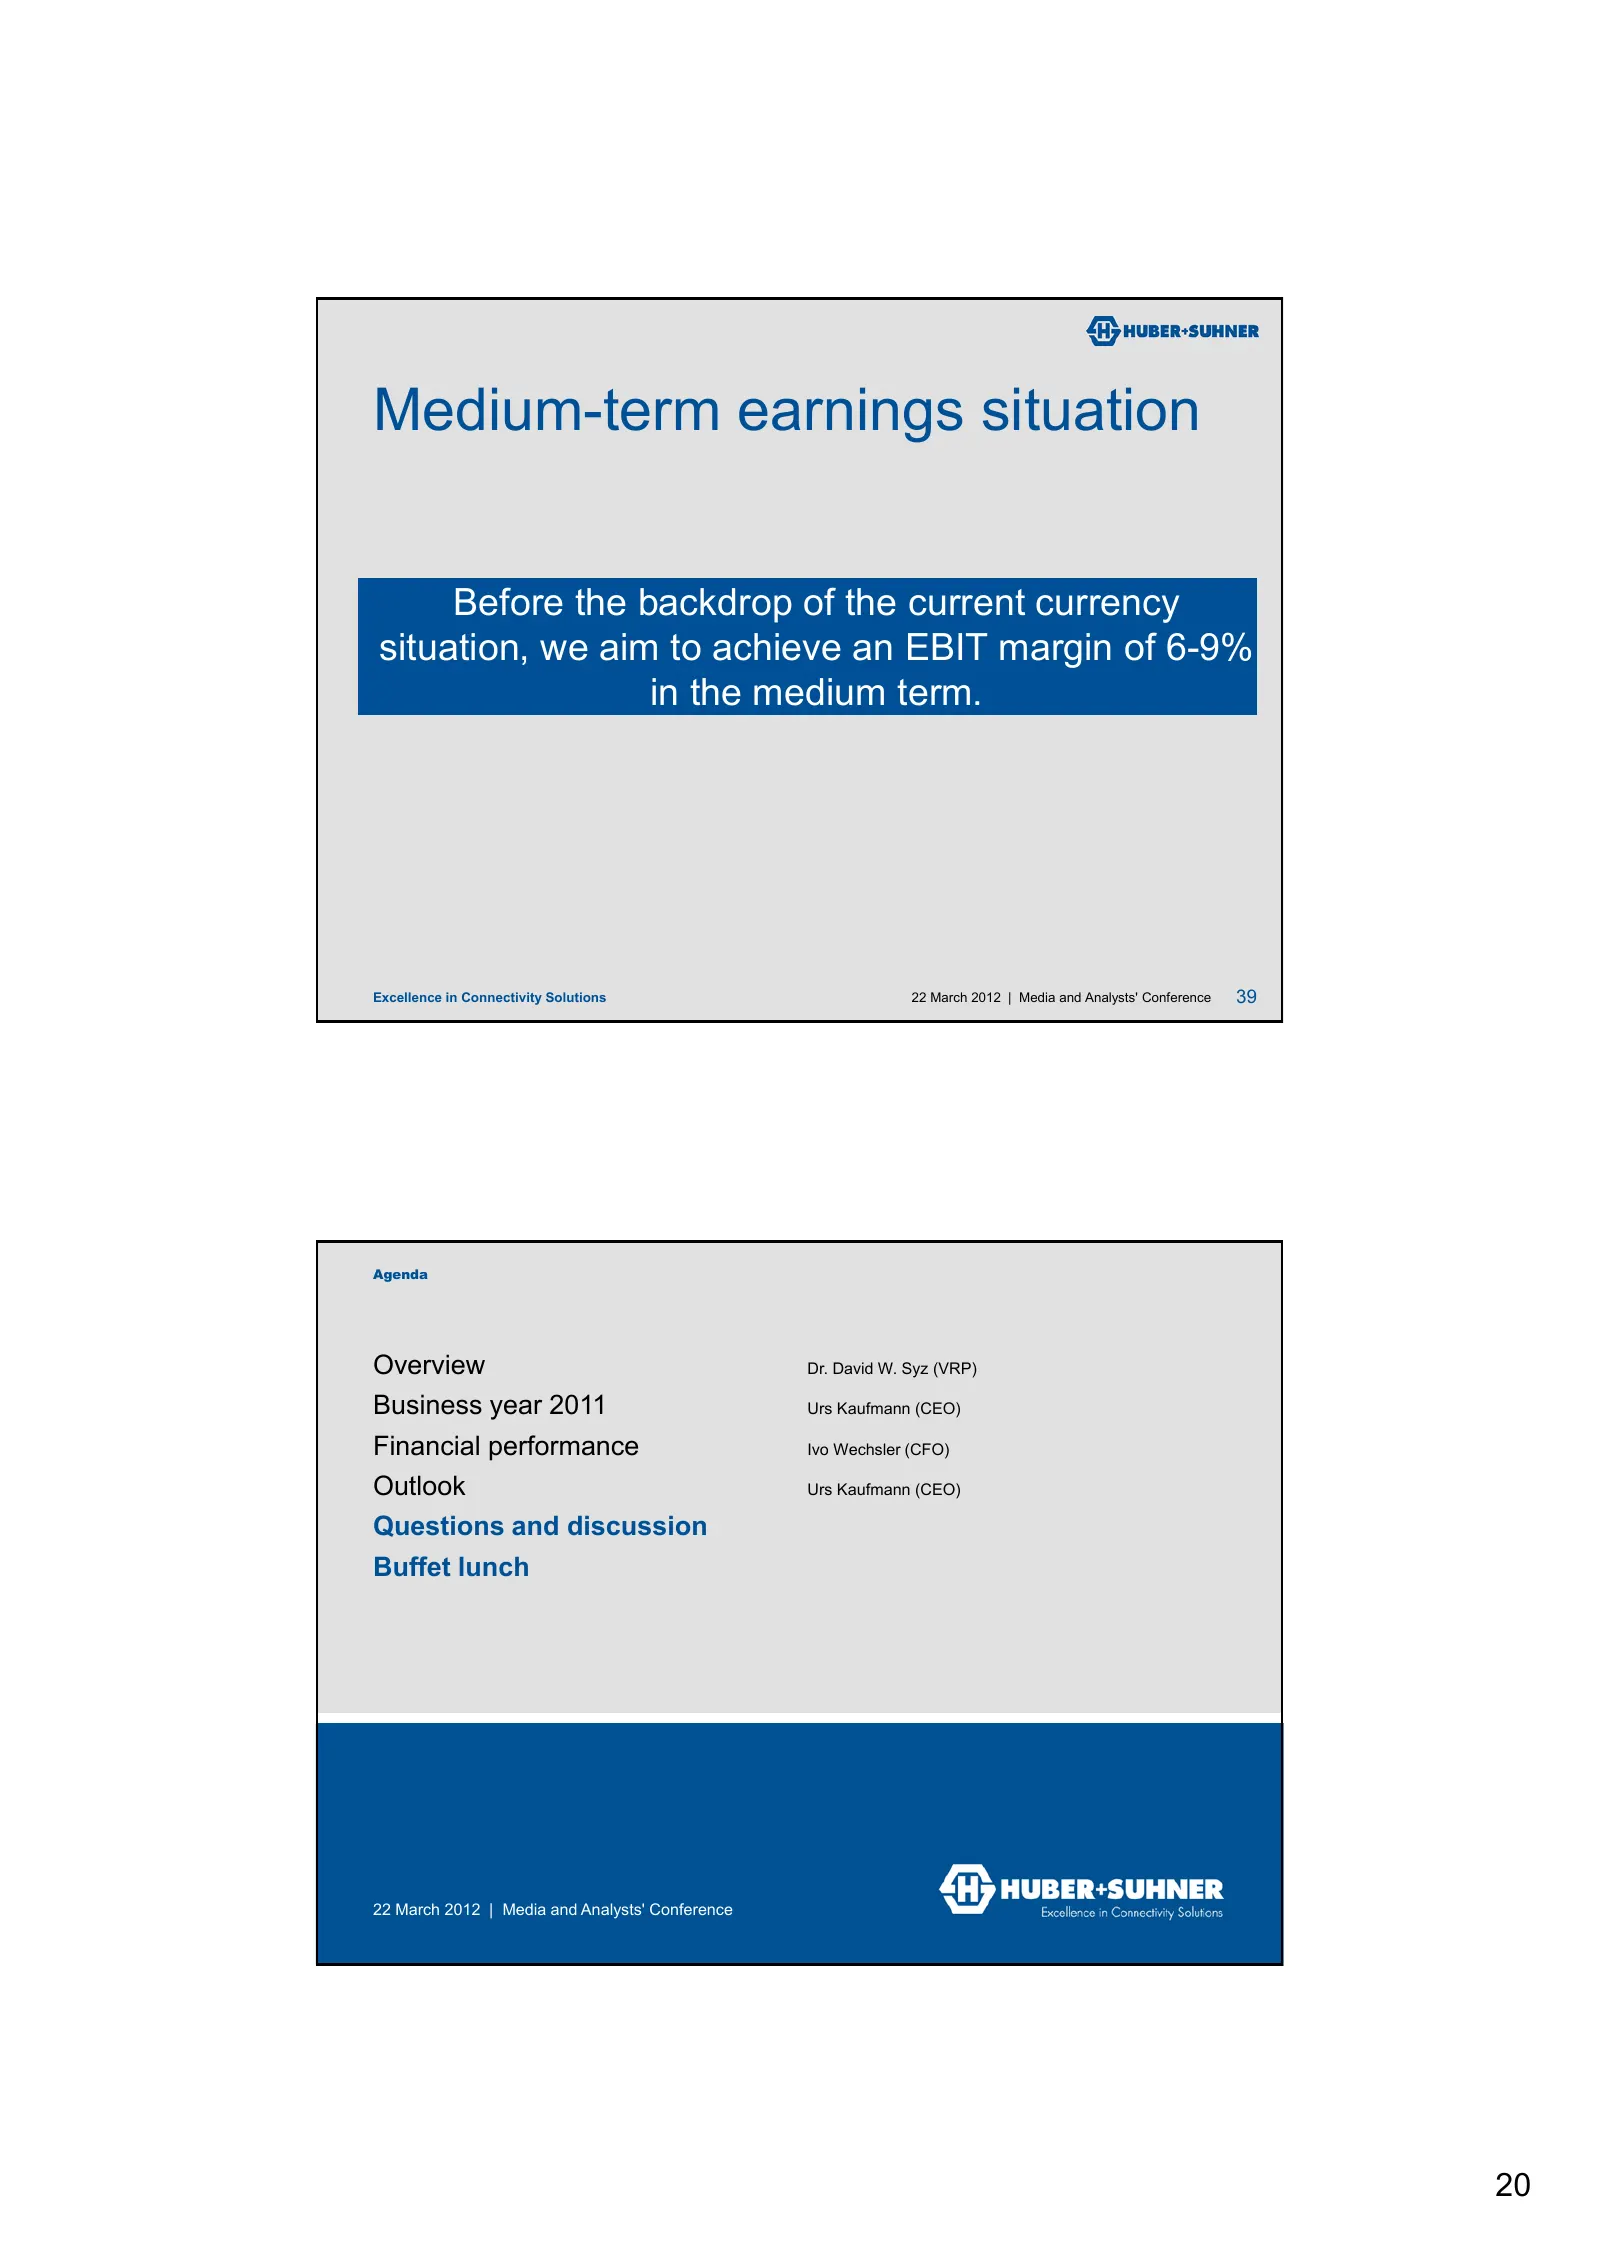
Medium-term earnings situation Before the backdrop of the current currency situation, we aim to achieve an EBIT margin of 6-9% in the medium term. Excellence in Connectivity Solutions 22 March 2012 | Media and Analysts' Conference 39 Agenda Overview Dr. David W. Syz (VRP) Business year 2011 Urs Kauf
Source: Internet Archive copy of hubersuhner.com
More decks from Huber + Suhner AG
 FY2025 Earnings Presentation26 slides · Oct 21, 2026
 Investor Day (September 2026)38 slides · Sep 18, 2026
 H1 2026 Earnings Presentation33 slides · Aug 18, 2026
 FY2025 Earnings Presentation35 slides · Mar 10, 2026
 Investor Presentation (March 2026)26 slides · March 2026
 H1 2025 Earnings Presentation32 slides · Aug 19, 2025