Fisher Scientific International Inc
Fisher Scientific International — Merger or Acquisition (August 2004)
26 slides from Fisher Scientific International's merger presentation, Aug 9, 2004
Slide 1: The World Leader in Serving Science
August 9, 2004 The World Leader in Serving Science
Slide 2: Safe Harbor and Regulation G Statement
This presentation contains statements that constitute forward-looking statements within the meaning of the Private Securities Litigation Reform Act of 1995. These statements are based on Fisher's and Apogent's current expectations and beliefs and are subject to a number of risks, uncertainties and a
Slide 3: Investment Highlights
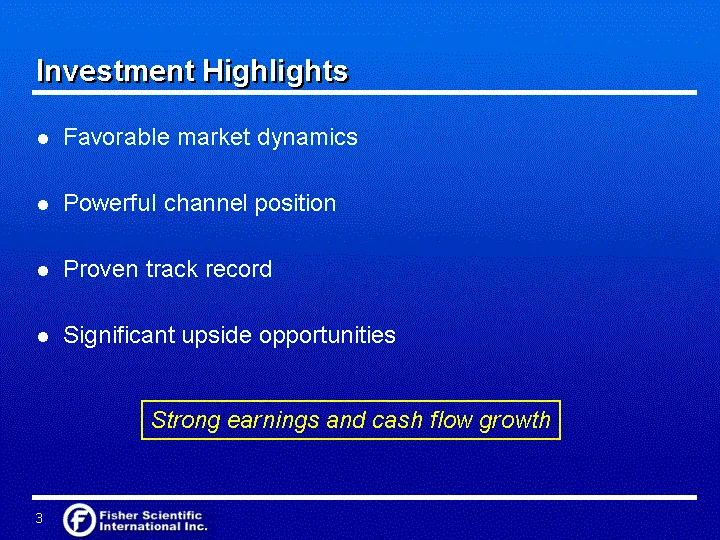
Investment Highlights Favorable market dynamics Powerful channel position Proven track record Significant upside opportunities Strong earnings and cash flow growth
Slide 4: A market leader
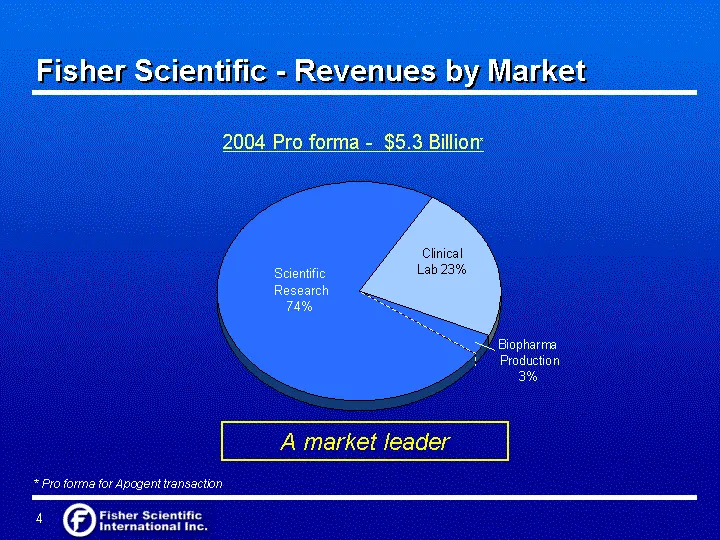
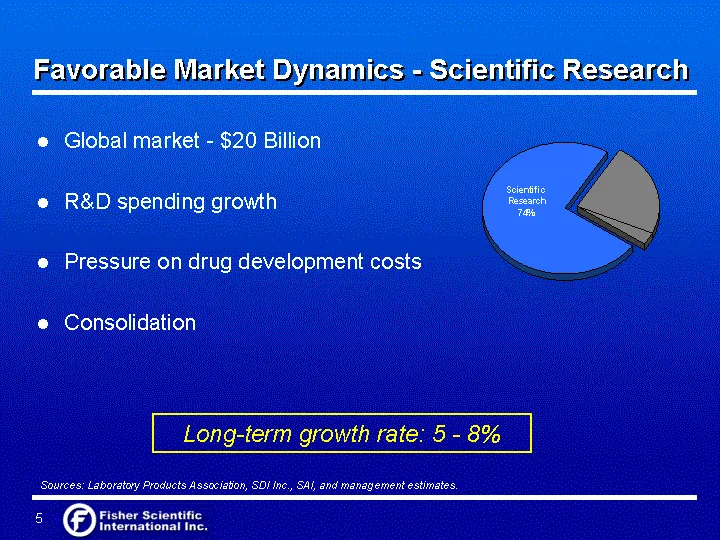
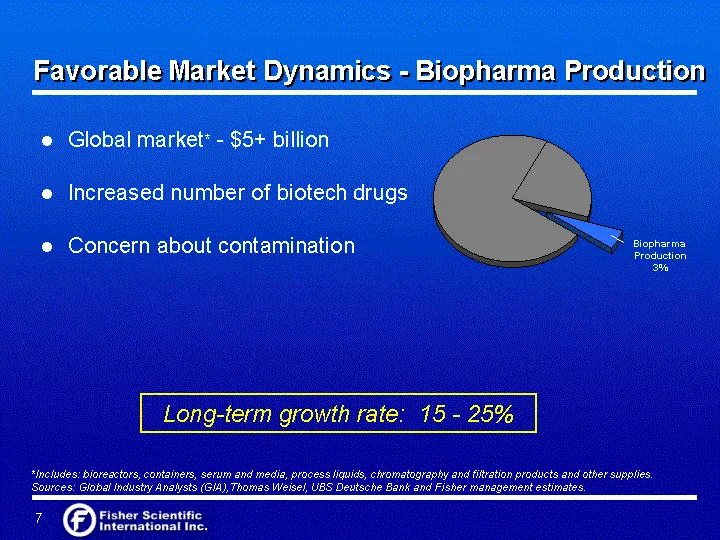
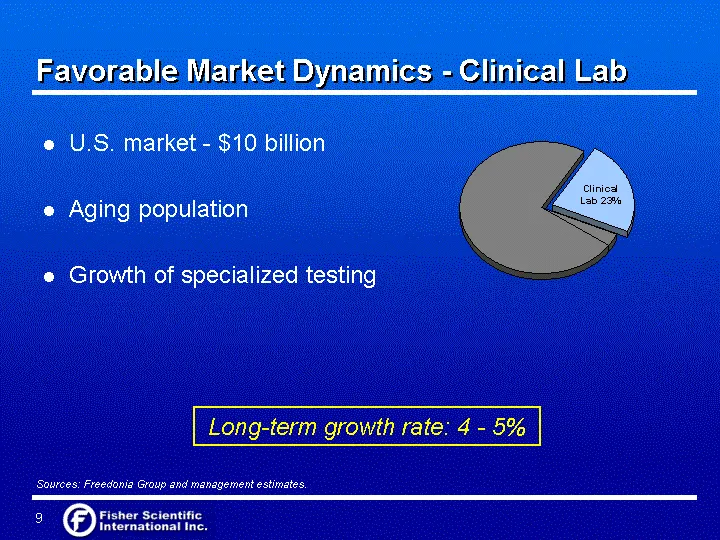
2004 Pro forma - $5.3 Billion* Scientific Research 0.74 Clinical Lab 0.23 BioPharma Production 0.03 Fisher Scientific - Revenues by Market * Pro forma for Apogent transaction A market leader
Slide 5: Favorable Market Dynamics - Scientific Research
Favorable Market Dynamics - Scientific Research Global market - $20 Billion R&D spending growth Pressure on drug development costs Consolidation Long-term growth rate: 5 - 8% Sources: Laboratory Products Association, SDI Inc., SAI, and management estimates. Scientific Research 0.74 Clinical Lab 0.23
Slide 6: Scientific Research Market
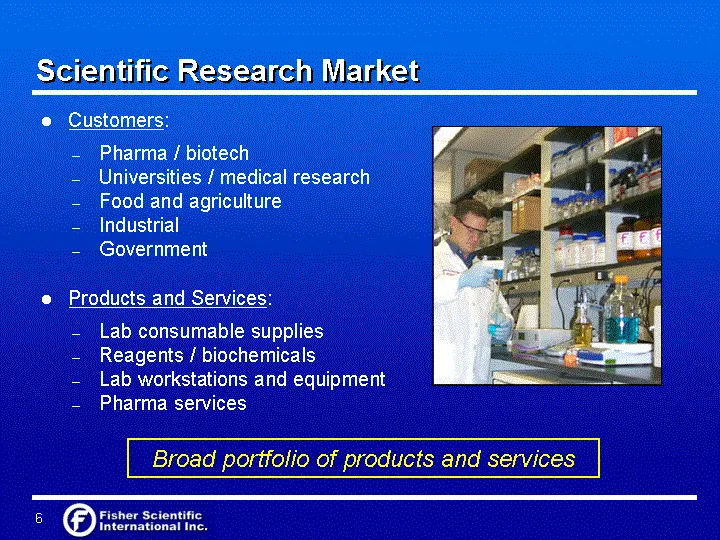
Customers: Pharma / biotech Universities / medical research Food and agriculture Industrial Government Products and Services: Lab consumable supplies Reagents / biochemicals Lab workstations and equipment Pharma services Broad portfolio of products and services Scientific Research Market
Slide 7: Favorable Market Dynamics - Biopharma Production
Global market* - $5+ billion Increased number of biotech drugs Concern about contamination Long-term growth rate: 15 - 25% *Includes: bioreactors, containers, serum and media, process liquids, chromatography and filtration products and other supplies. Sources: Global Industry Analysts (GIA),Thomas W
Slide 8: Favorable Market Dynamics - Clinical Lab
Favorable Market Dynamics - Clinical Lab U.S. market - $10 billion Aging population Growth of specialized testing Long-term growth rate: 4 - 5% Sources: Freedonia Group and management estimates. Scientific Research 0.74 Clinical Lab 0.23 BioPharma Production 0.03 Clinical Lab 23%
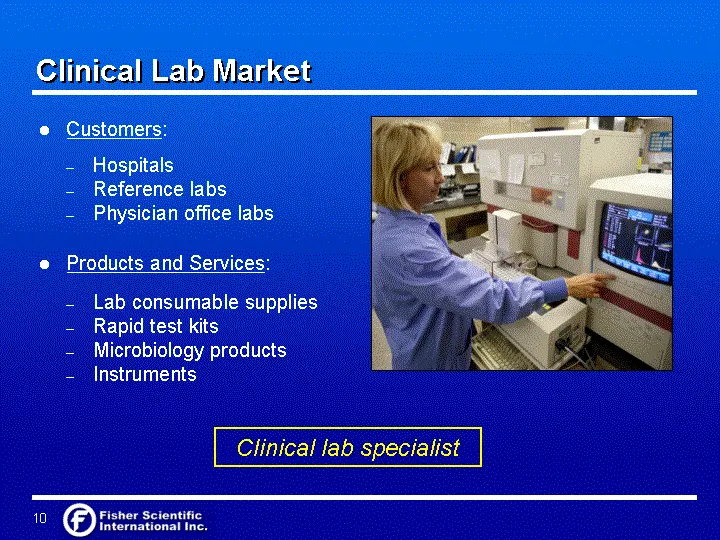
Slide 9: Clinical Lab Market
Customers: Hospitals Reference labs Physician office labs Products and Services: Lab consumable supplies Rapid test kits Microbiology products Instruments Clinical lab specialist Clinical Lab Market
Slide 10: Fisher's Competitive Advantage
Broad product and service offering Globally integrated supply chain Extensive sales and marketing footprint Proven acquisition capabilities Fisher's Competitive Advantage Critical elements of success
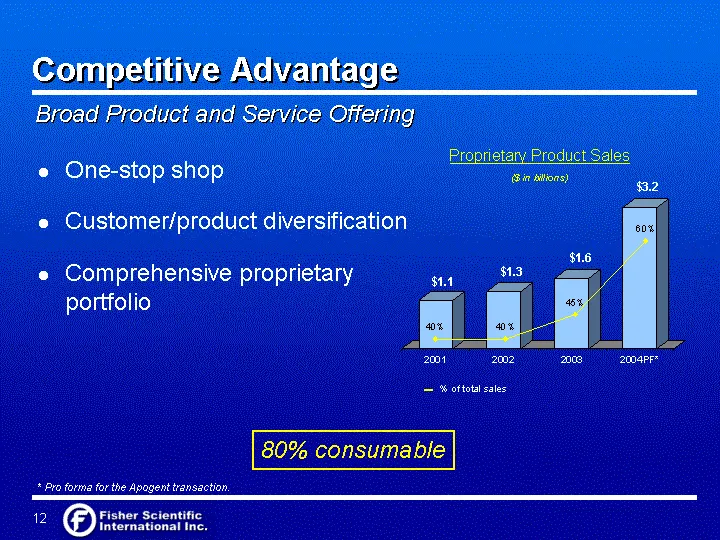
Slide 11: Broad Product and Service Offering
Broad Product and Service Offering Competitive Advantage * Pro forma for the Apogent transaction. 80% consumable One-stop shop Customer/product diversification Comprehensive proprietary portfolio 2001 2002 2003 2004PF* East 1.1 1.3 1.6 3.2 Proprietary Product Sales ($ in billions) 2001 2002 2003 200
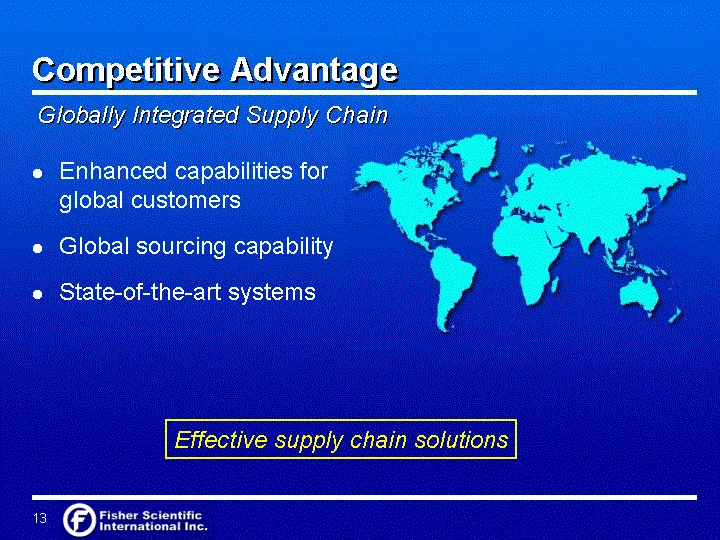
Slide 12: Globally Integrated Supply Chain
Competitive Advantage Effective supply chain solutions Enhanced capabilities for global customers Global sourcing capability State-of-the-art systems Globally Integrated Supply Chain
Slide 13: Extensive Global Sales and Marketing Footprint
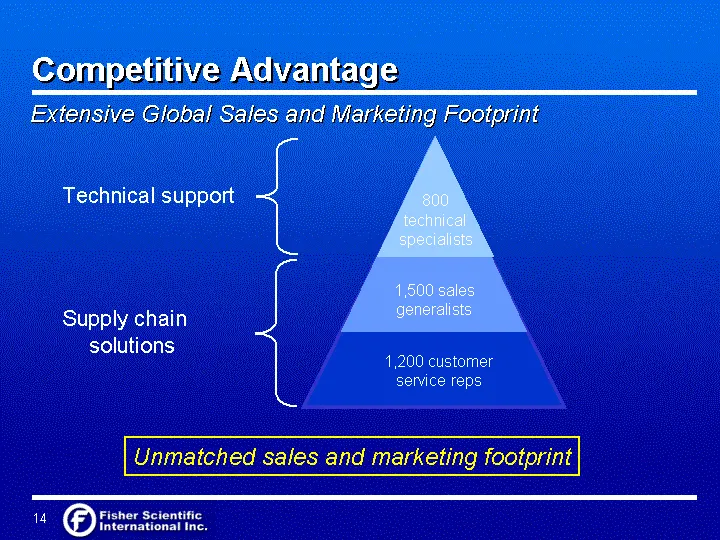
Extensive Global Sales and Marketing Footprint Technical support Supply chain solutions 1,200 customer service reps 1,500 sales generalists 800 technical specialists Competitive Advantage Unmatched sales and marketing footprint
Slide 14: Strong Acquisition Track Record
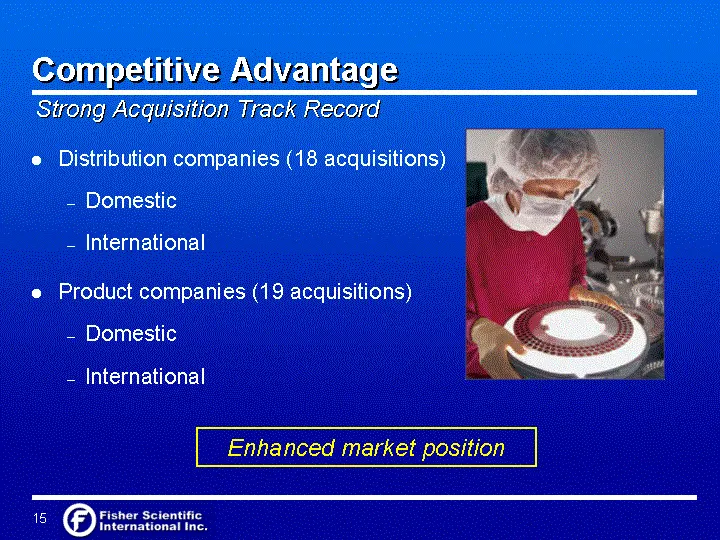
Strong Acquisition Track Record Enhanced market position Competitive Advantage Product companies (19 acquisitions) Domestic International Distribution companies (18 acquisitions) Domestic International
Slide 15: Powerful Channel Position
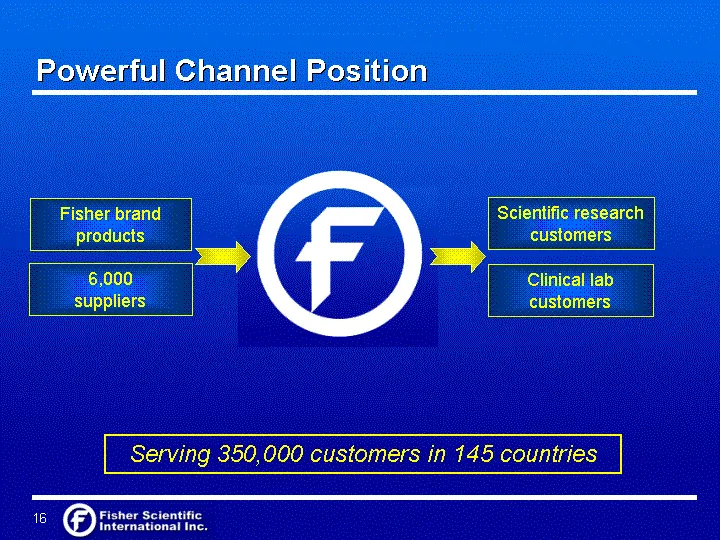
Powerful Channel Position Serving 350,000 customers in 145 countries 6,000 suppliers Scientific research customers Clinical lab customers Fisher brand products
Slide 16: Strong Platform for Future Growth
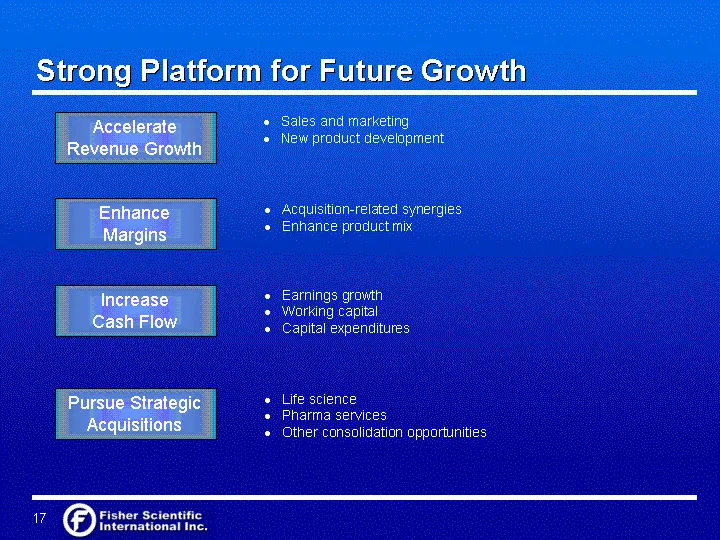
Sales and marketing New product development Strong Platform for Future Growth Pursue Strategic Acquisitions Acquisition-related synergies Enhance product mix Earnings growth Working capital Capital expenditures Life science Pharma services Other consolidation opportunities Increase Cash Flow Enhance
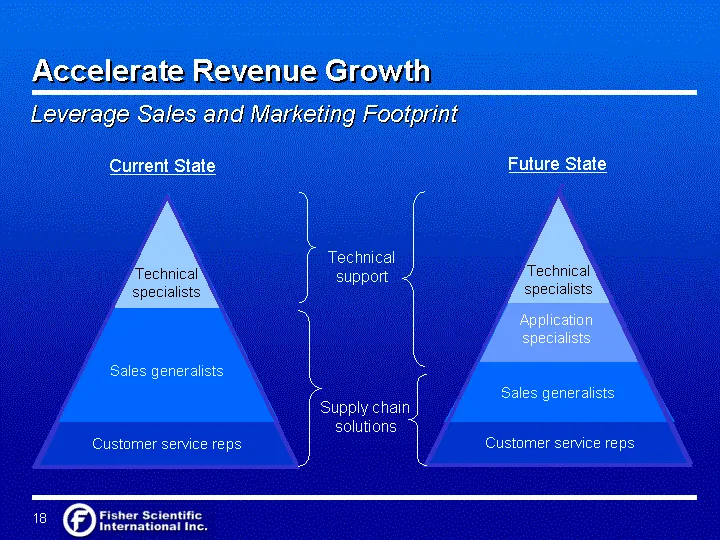
Slide 17: Leverage Sales and Marketing Footprint
Leverage Sales and Marketing Footprint Sales generalists Accelerate Revenue Growth Current State Future State Technical specialists Customer service reps Application specialists Technical support Supply chain solutions Sales generalists Customer service reps Technical specialists
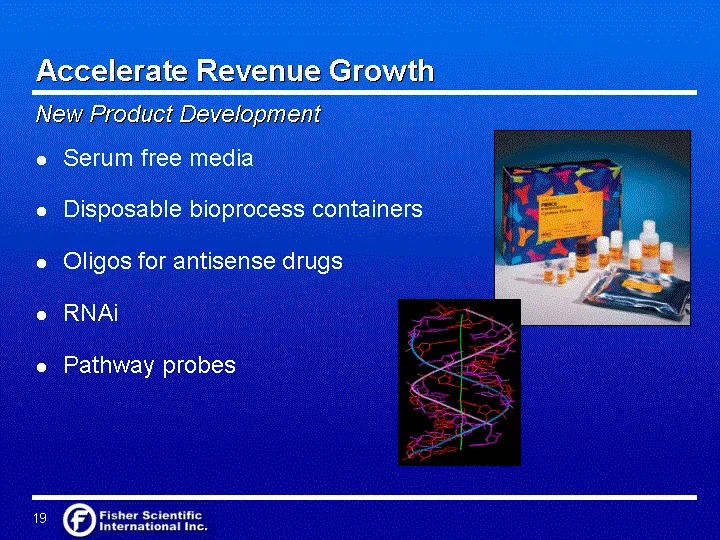
Slide 18: Accelerate Revenue Growth: New Product Development
Accelerate Revenue Growth New Product Development Serum free media Disposable bioprocess containers Oligos for antisense drugs RNAi Pathway probes
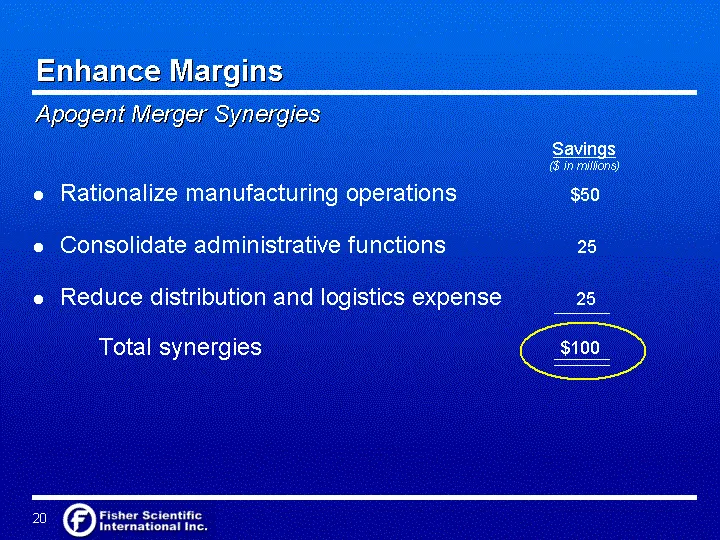
Slide 19: Enhance Margins: Apogent Merger Synergies
Enhance Margins Apogent Merger Synergies Rationalize manufacturing operations $50 Consolidate administrative functions 25 Reduce distribution and logistics expense 25 Savings ($ in millions) $100 Total synergies
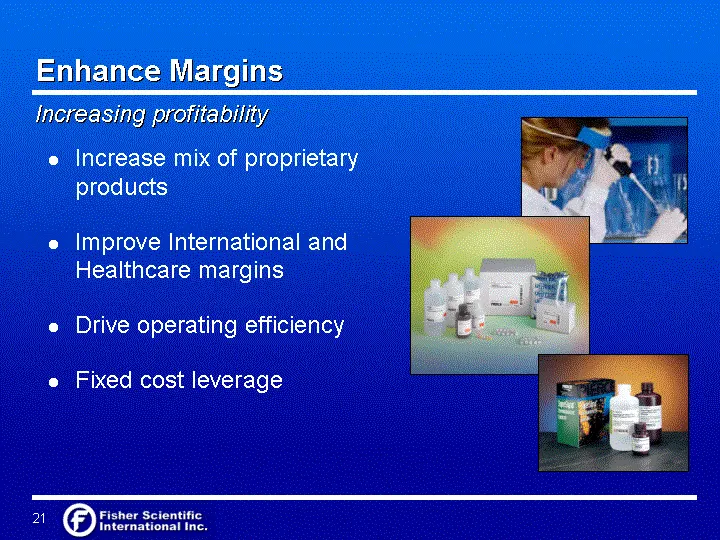
Slide 20: Enhance Margins
Enhance Margins Increase mix of proprietary products Improve International and Healthcare margins Drive operating efficiency Fixed cost leverage Increasing profitability
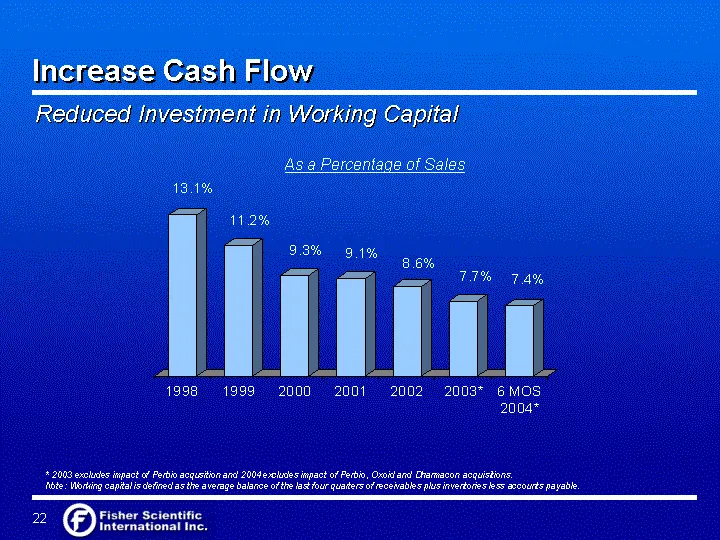
Slide 21: Increase Cash Flow: Reduced Investment in Working Capital
1998 1999 2000 2001 2002 2003* 6 MOS 2004* East 0.131 0.112 0.093 0.091 0.086 0.077 0.074 As a Percentage of Sales Increase Cash Flow Reduced Investment in Working Capital * 2003 excludes impact of Perbio acqusition and 2004 excludes impact of Perbio, Oxoid and Dharmacon acquisitions. Note: Working
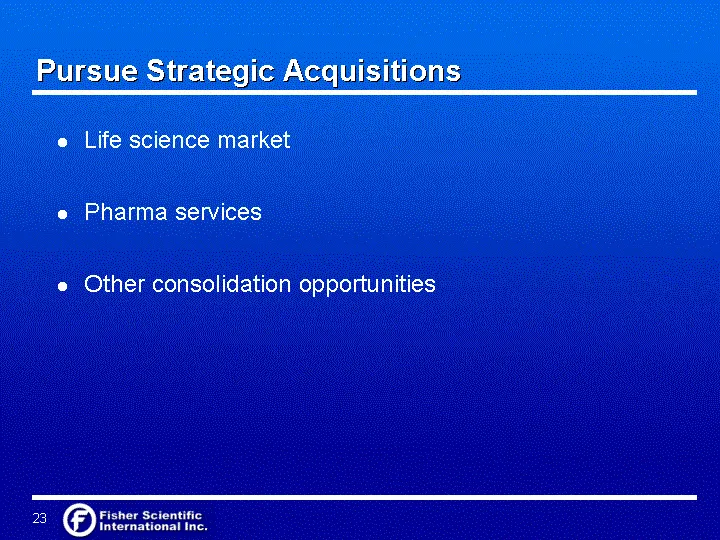
Slide 22: Pursue Strategic Acquisitions
Pursue Strategic Acquisitions Life science market Pharma services Other consolidation opportunities
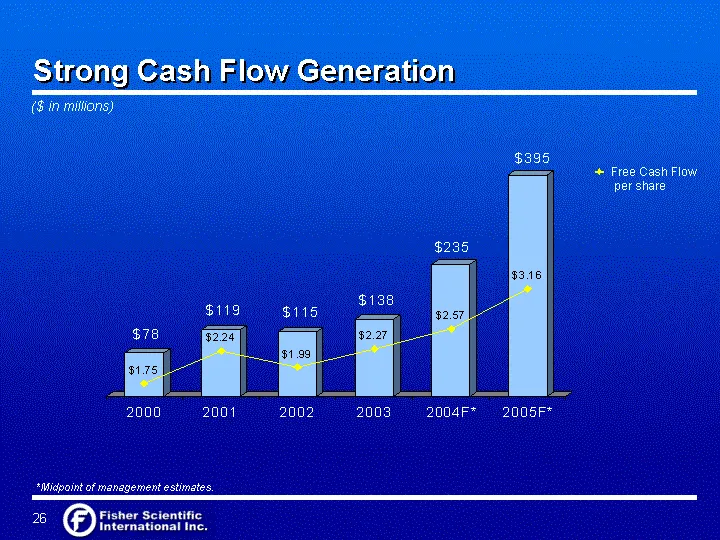
Slide 23: Strong Cash Flow Generation
Strong Cash Flow Generation 2000 2001 2002 2003 2004F* 2005F* ($ in millions) 2000 2001 2002 2003 2004F 2005F East 1.75 2.24 1.99 2.27 2.57 3.16 Free Cash Flow per share *Midpoint of management estimates.
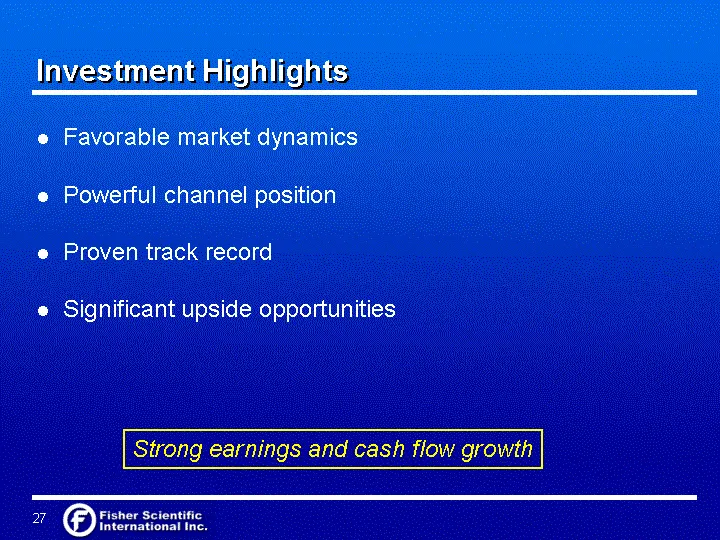
Slide 24: Investment Highlights
Investment Highlights Favorable market dynamics Powerful channel position Proven track record Significant upside opportunities Strong earnings and cash flow growth
Slide 25: Questions and Answers
Questions and Answers
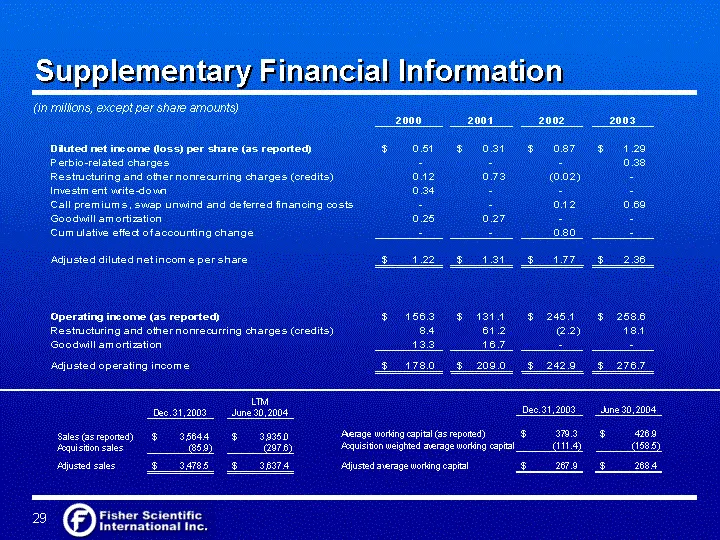
Slide 26: Supplementary Financial Information
(in millions, except per share amounts) Supplementary Financial Information
Source: SEC EDGAR · 8-K filed Aug 9, 2004
More decks from Fisher Scientific International Inc
 Merger or Acquisition (May 2006)23 slides · May 8, 2006
 Lehman Brothers Ninth Annual Global Healthcare Conference 200619 slides · Mar 8, 2006
 Merrill Lynch Global Pharmaceutical, Biotechnology & Medical Device Conference 200612 slides · Feb 9, 2006
 Goldman Sachs Twenty Sixth Annual Global Healthcare Conference 200511 slides · Jun 15, 2005
 Banc of America Securities Health Care Conference 200511 slides · May 17, 2005
 Baird Growth Stock Conference 200526 slides · May 12, 2005