Sulzer AG · SIX:SUN
Sulzer — FY2008 Earnings Presentation
51 slides from Sulzer's earnings presentation, Feb 26, 2009
Slide 1: 2008 Annual Results Presentation
2008 Annual Results Presentation Strong performance in 2008 – Well prepared for the future February 26, 2009 Annual Results 2008 | February 26, 2009 | slide 1
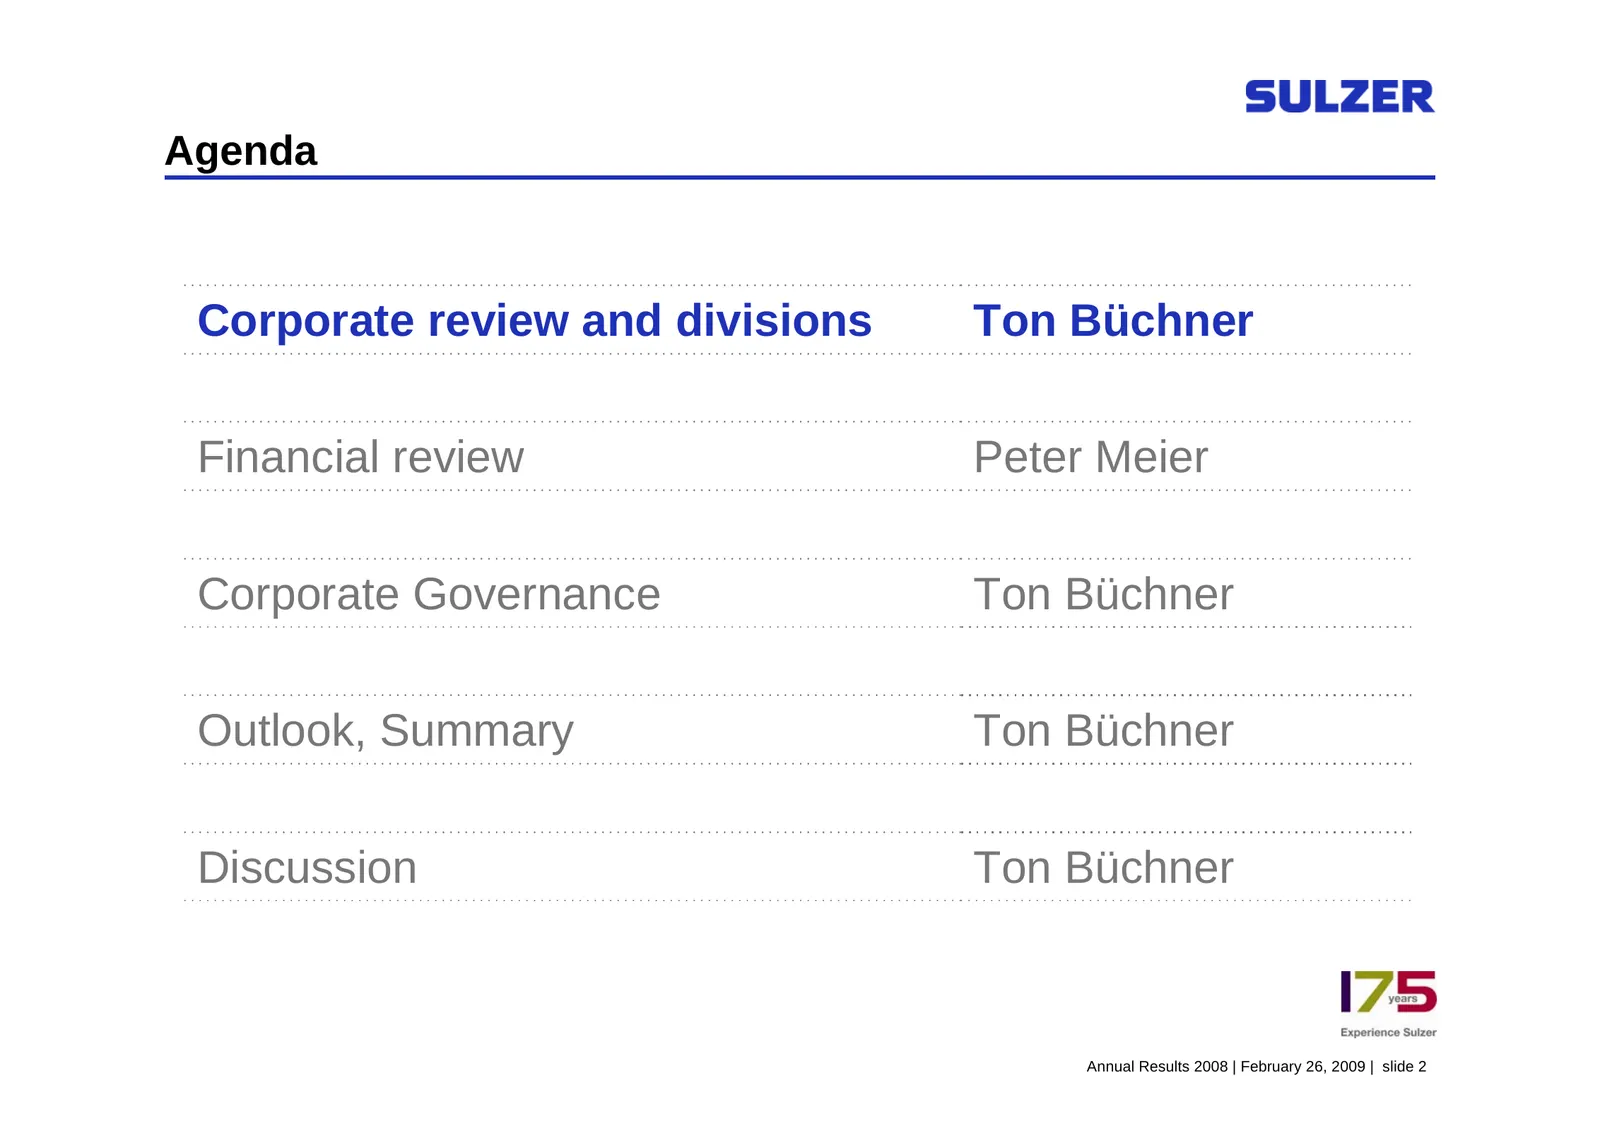
Slide 2: Agenda
Agenda Corporate review and divisions Ton Büchner Financial review Peter Meier Corporate Governance Ton Büchner Outlook, Summary Ton Büchner Discussion Ton Büchner Annual Results 2008 | February 26, 2009 | slide 2
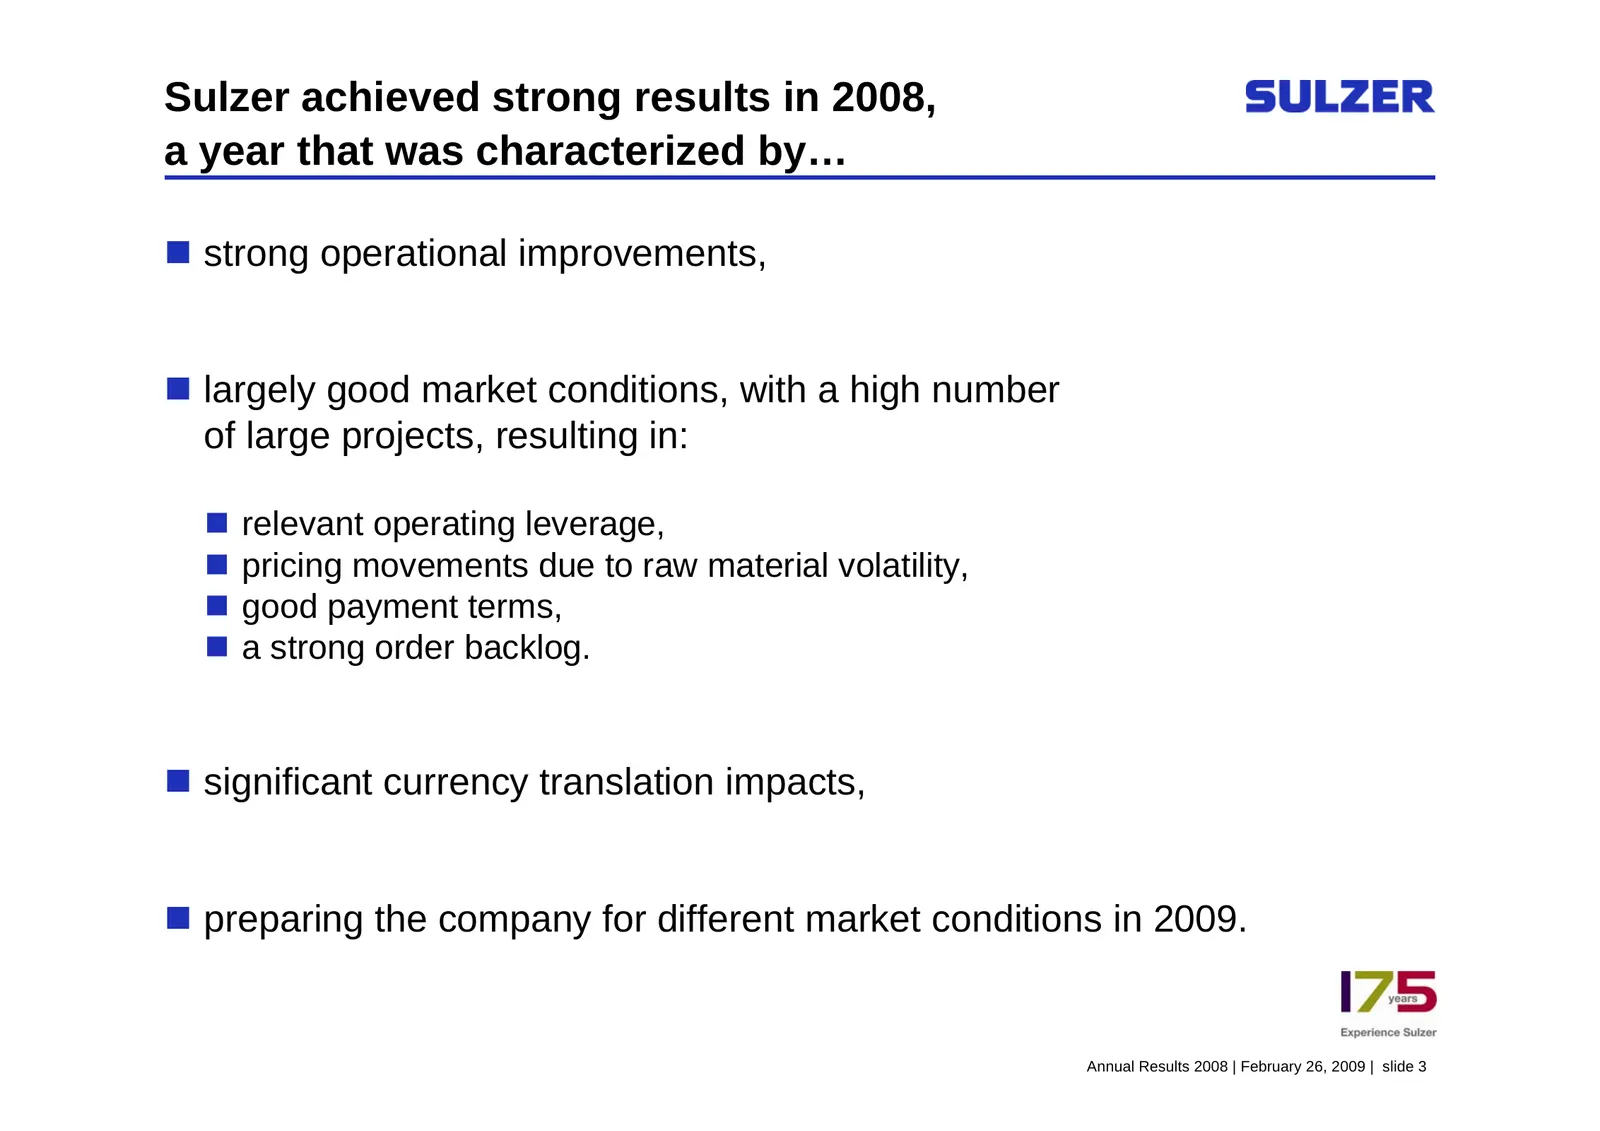
Slide 3: Sulzer achieved strong results in 2008
Sulzer achieved strong results in 2008, a year that was characterized by… strong operational improvements, largely good market conditions, with a high number of large projects, resulting in: relevant operating leverage, pricing movements due to raw material volatility, good payment terms,
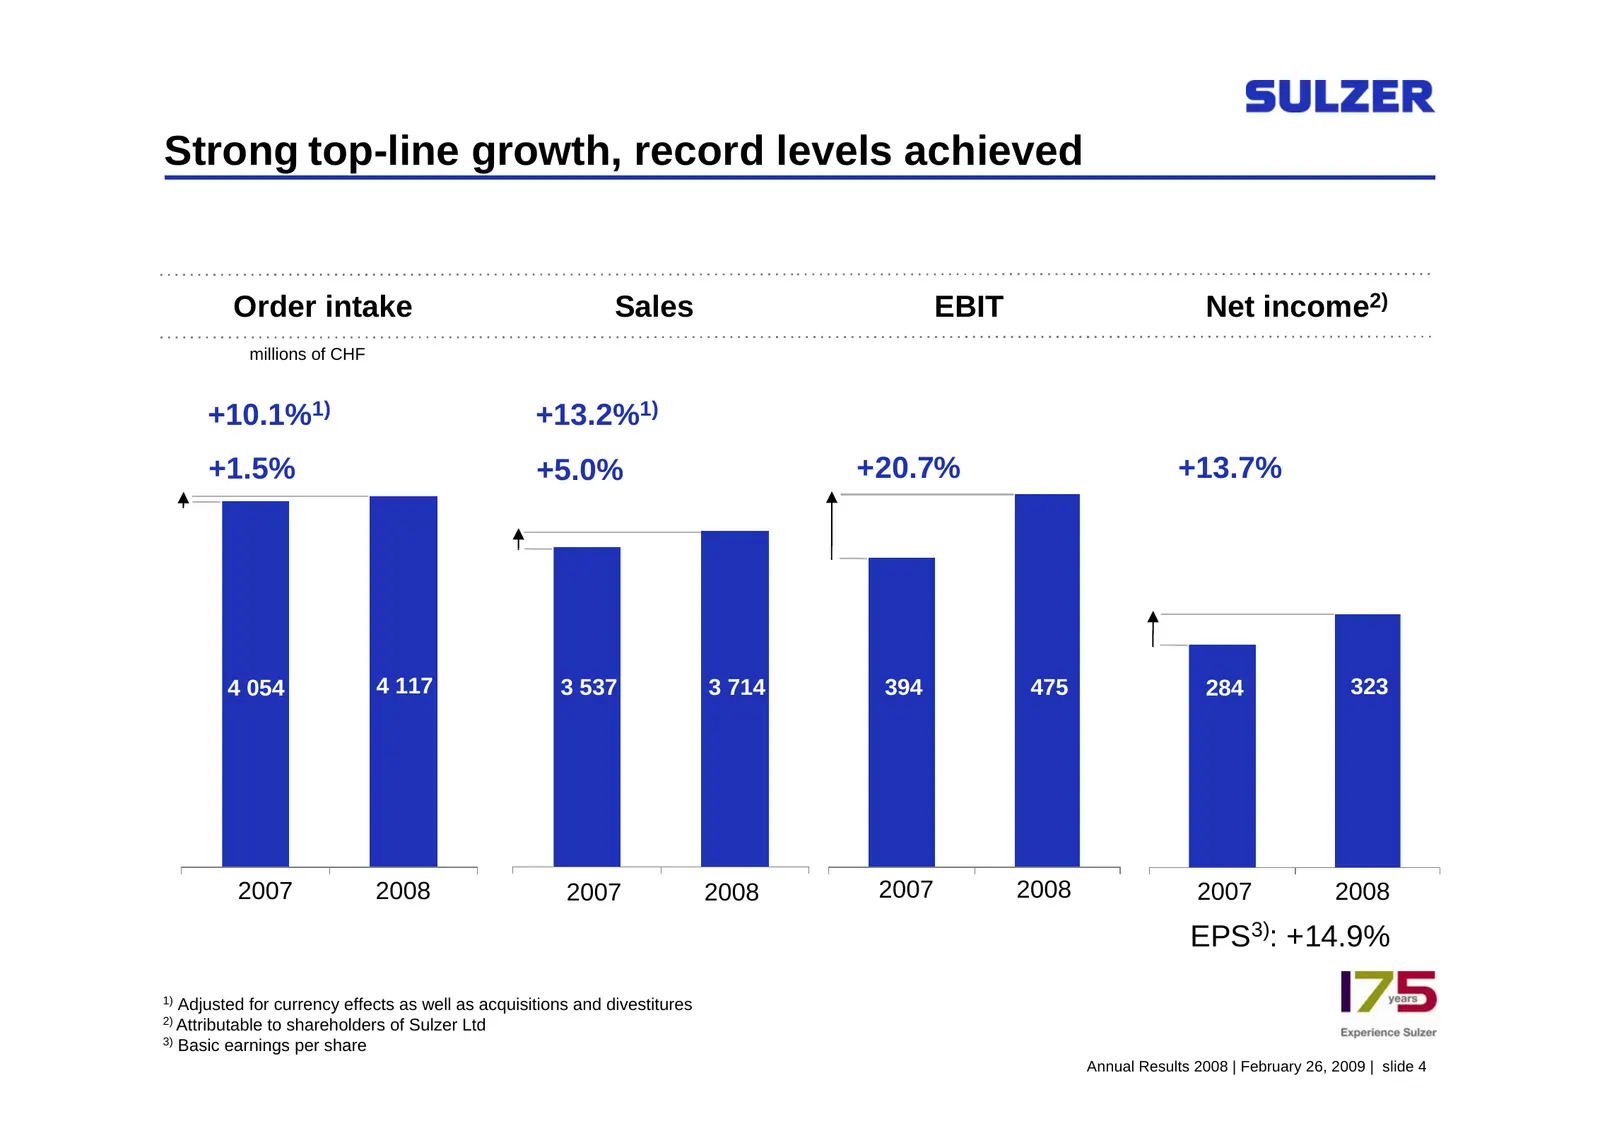
Slide 4: Strong top-line growth, record levels achieved
Strong top-line growth, record levels achieved Order intake Sales EBIT Net income2) millions of CHF +10.1%1) +13.2%1) +1.5% +5.0% +20.7% +13.7% 323 4 054 4 117 3 537 3 714 394 475 284 323 2007 2008 2007 2008 2007 2008 2007 2008 EPS3): +14.9% 1) Adjusted for currency effects as well as acquisitions a
Slide 5: Record results in 2008
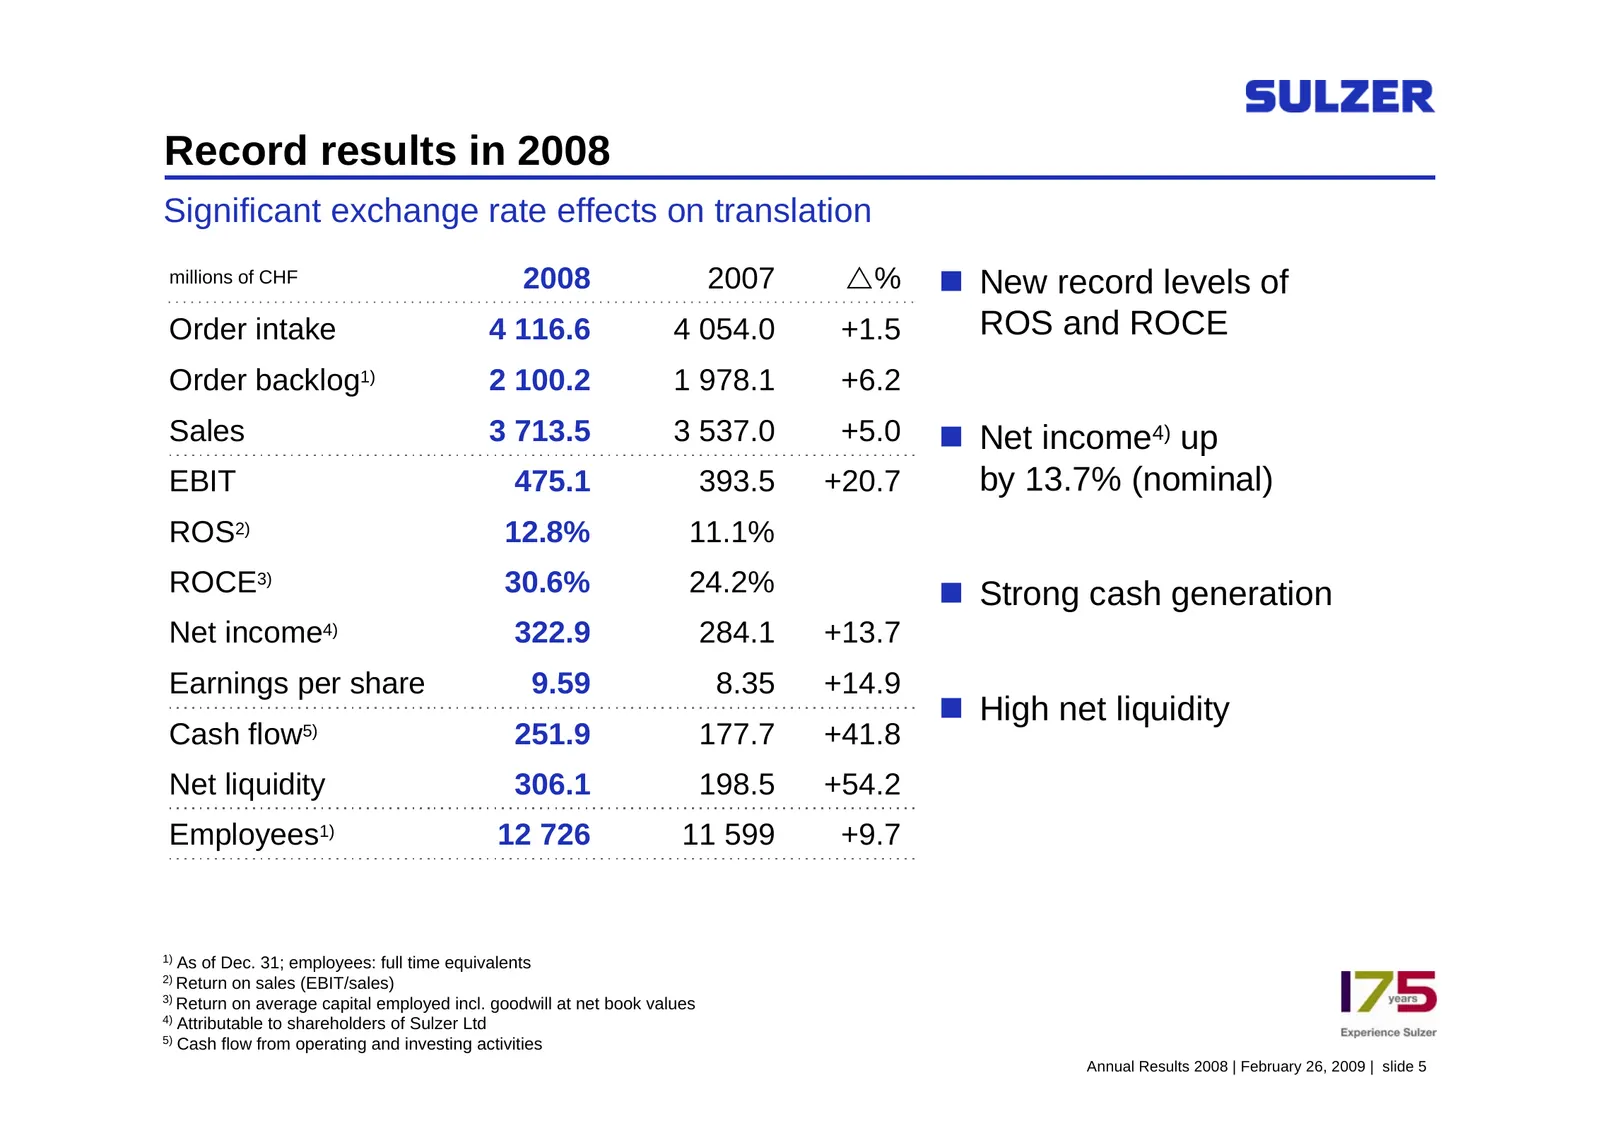
Record results in 2008 Significant exchange rate effects on translation millions of CHF 2008 2007 U% New record levels of Order intake 4 116.6 4 054.0 +1.5 ROS and ROCE Order backlog1) 2 100.2 1 978.1 +6.2 Sales 3 713.5 3 537.0 +5.0 Net income4) up EBIT 475.1 393.5 +20.7 by 13.7% (nominal) ROS2)
Slide 6: Strong increase of profitability and value creation
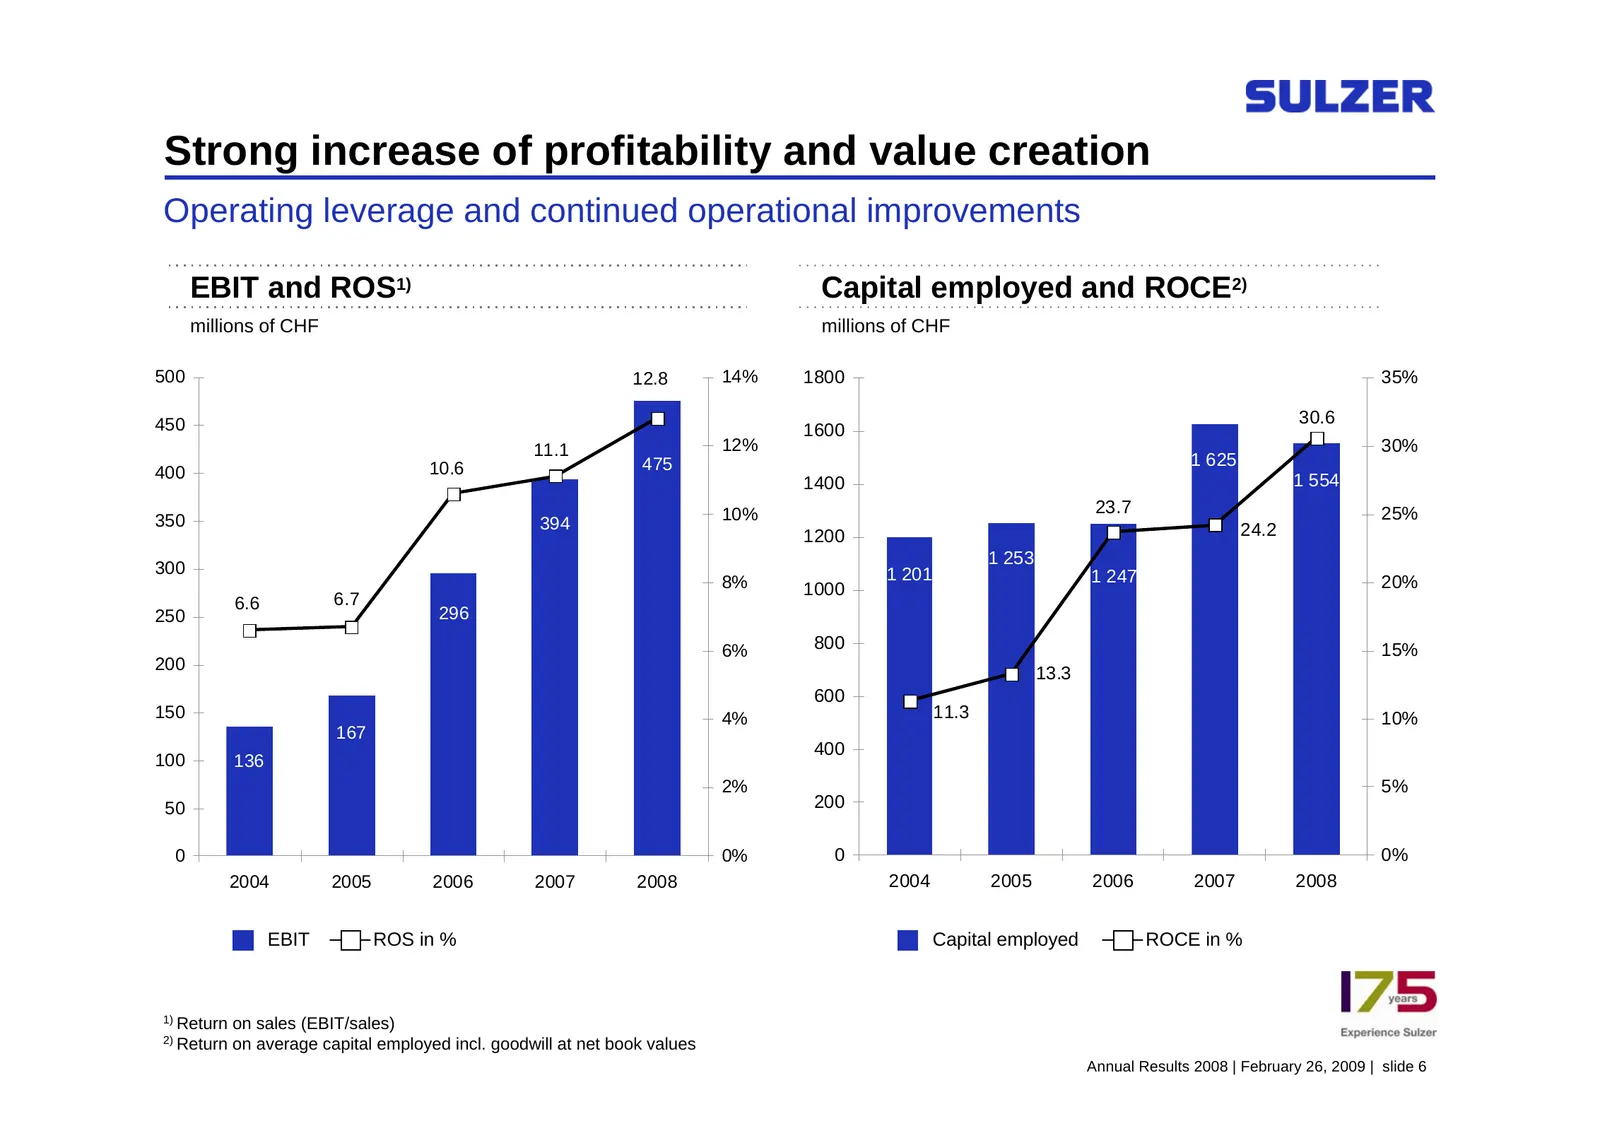
Strong increase of profitability and value creation Operating leverage and continued operational improvements EBIT and ROS1) Capital employed and ROCE2) millions of CHF millions of CHF 500 12.8 14% 1800 35% 450 30.6 1600 11.1 12% 30% 10.6 475 1 625 400 1 554 1400 10% 23.7 25% 350 394 1200 24.2 1 253
Slide 7: 2009 began with a high order backlog
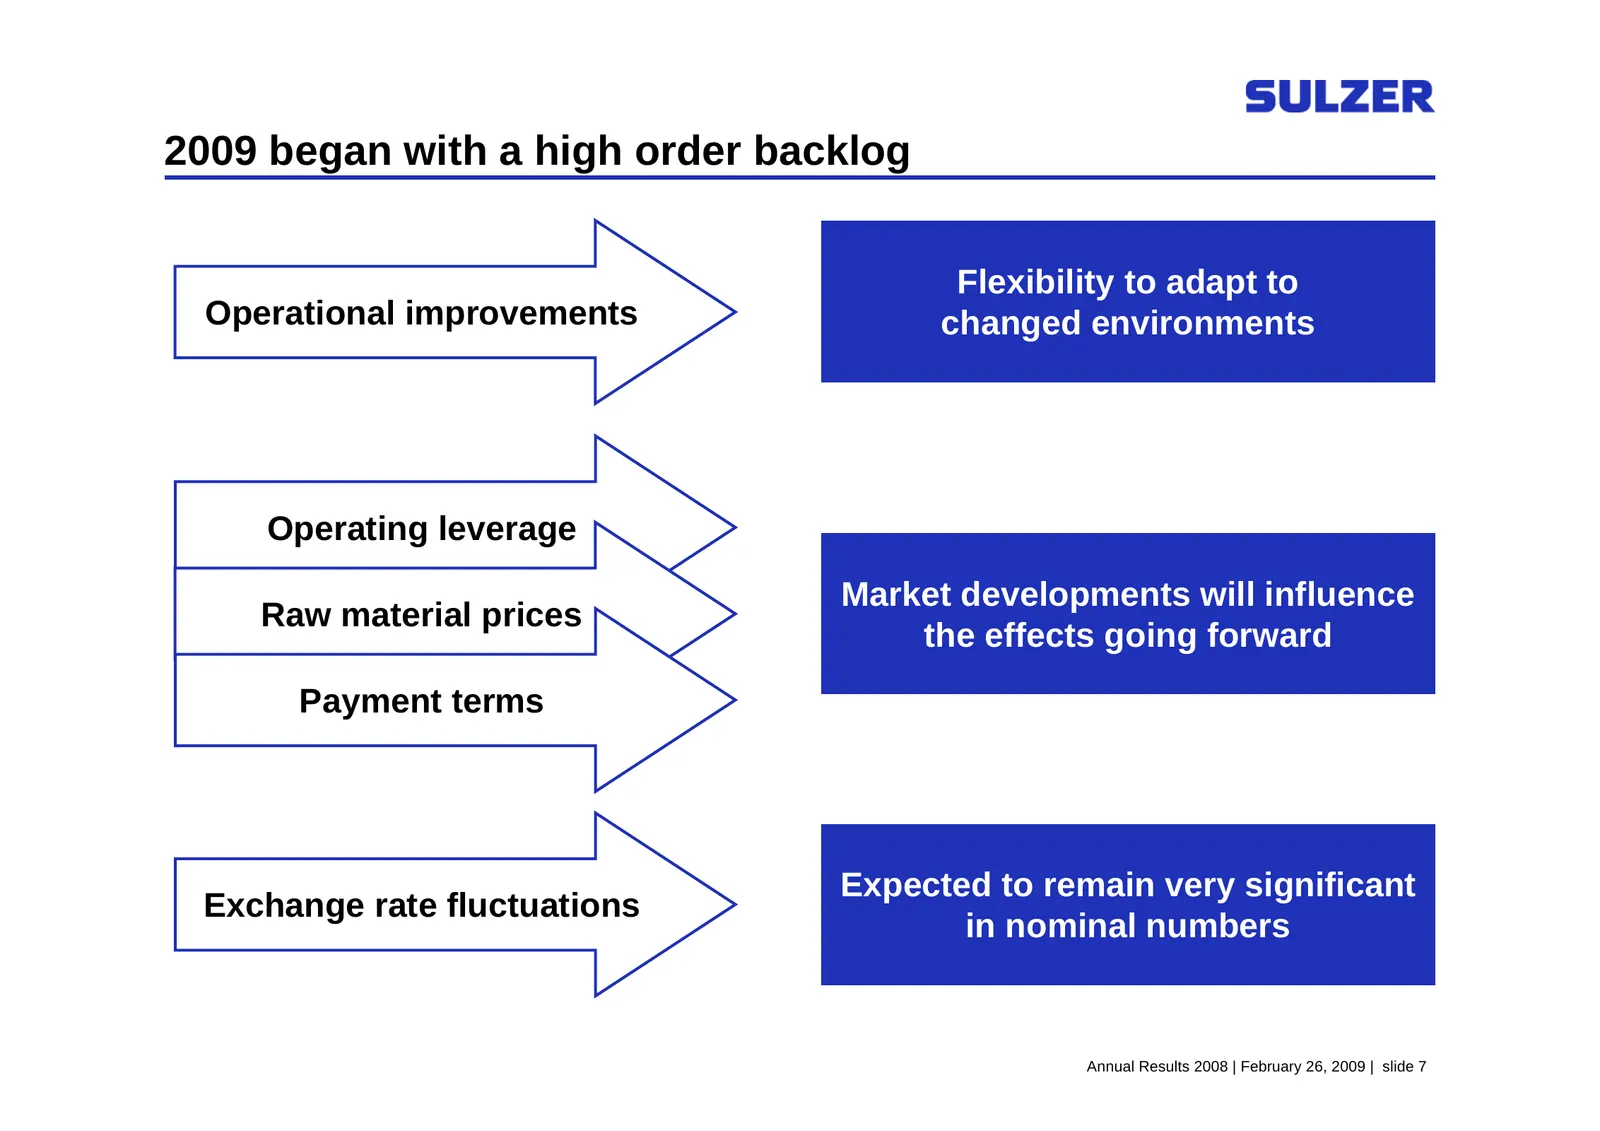
2009 began with a high order backlog Flexibility to adapt to Operational improvements changed environments Operating leverage Market developments will influence Raw material prices the effects going forward Payment terms Expected to remain very significant Exchange rate fluctuations in nominal numbe
Slide 8: Sulzer's vision, mission and values: We do what we say
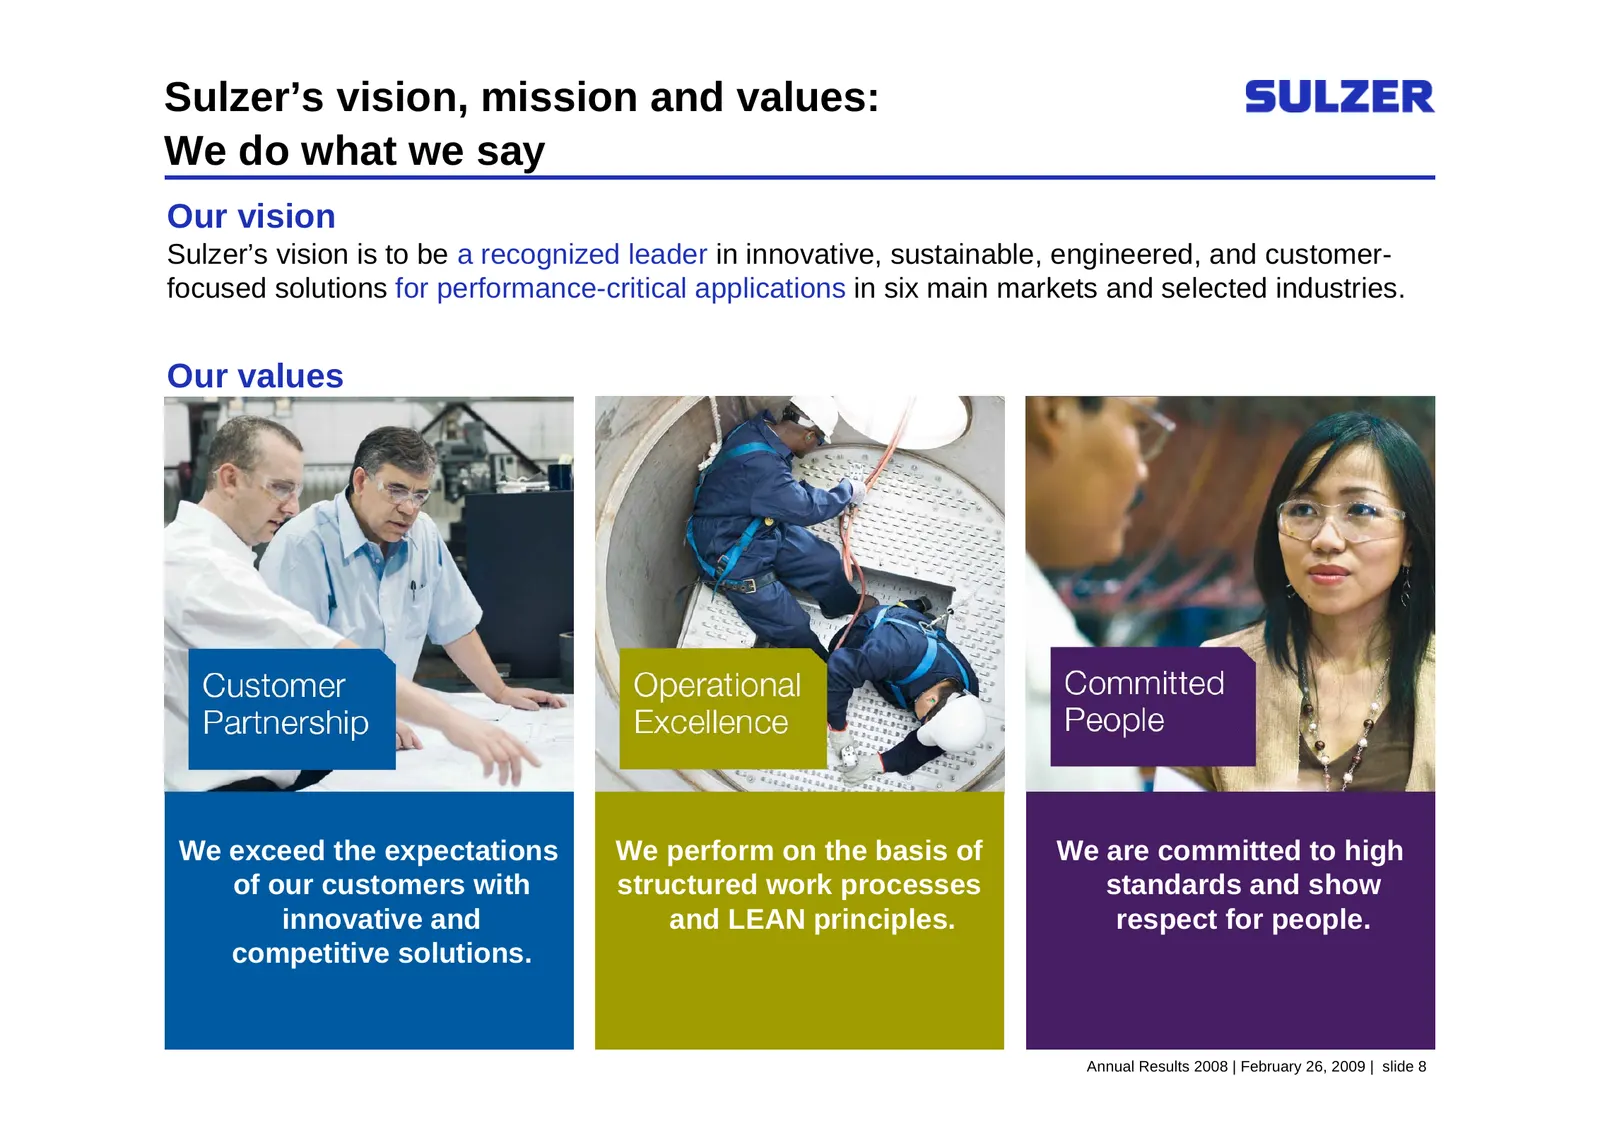
Sulzer’s vision, mission and values: We do what we say Our vision Sulzer’s vision is to be a recognized leader in innovative, sustainable, engineered, and customer- focused solutions for performance-critical applications in six main markets and selected industries. Our values We exceed the expectati
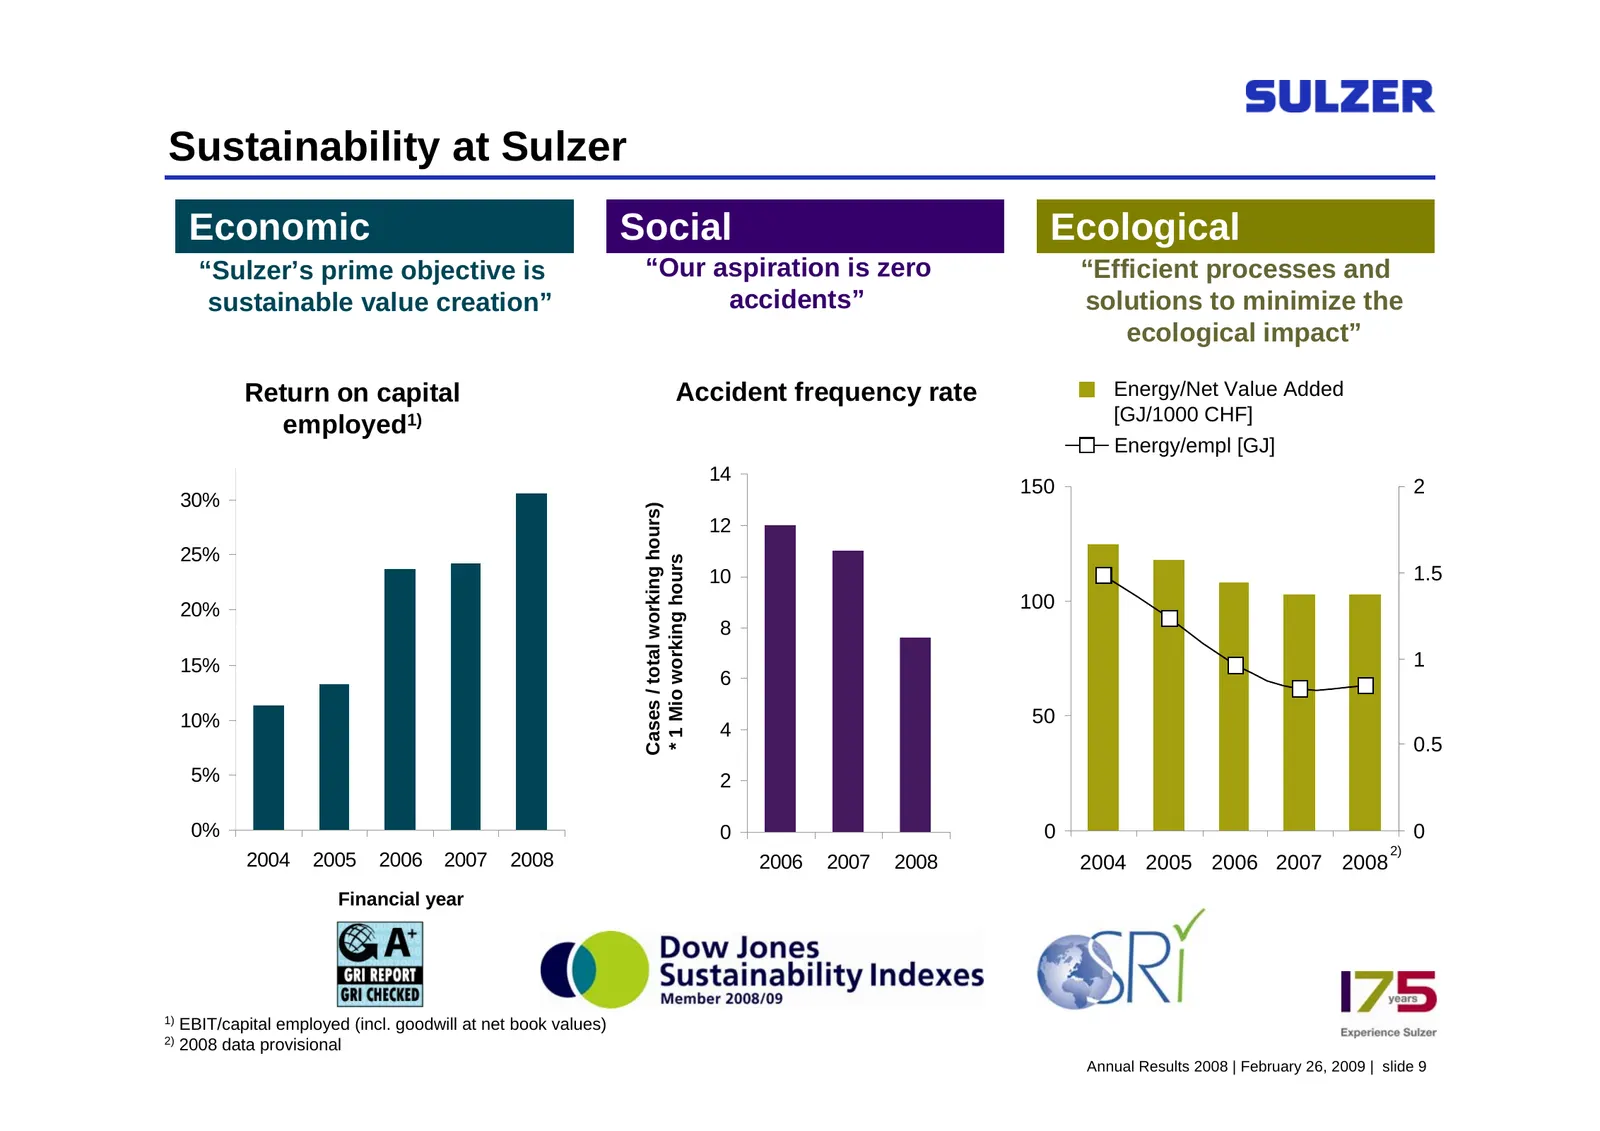
Slide 9: Sustainability at Sulzer
Sustainability at Sulzer Economic Social Ecological “Sulzer’s prime objective is “Our aspiration is zero “Efficient processes and sustainable value creation” accidents” solutions to minimize the ecological impact” Return on capital Accident frequency rate Energy/Net Value Added [GJ/1000 CHF] employe
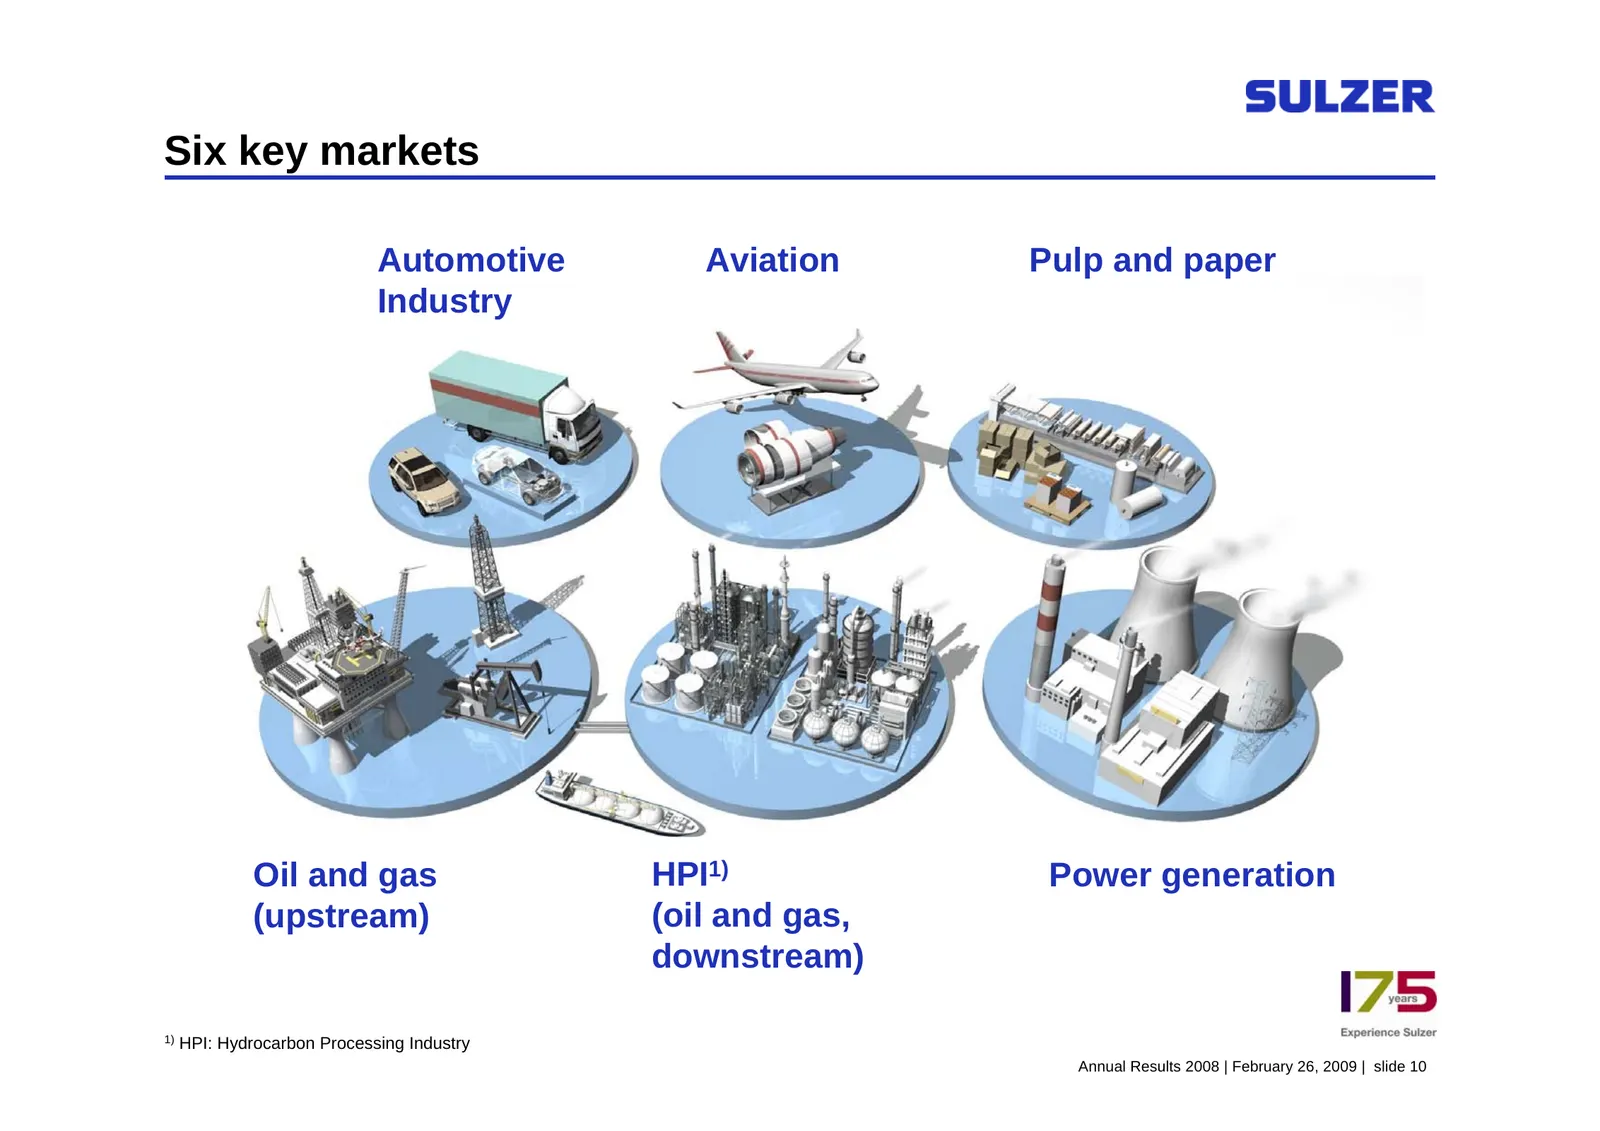
Slide 10: Six key markets
Six key markets Automotive Aviation Pulp and paper Industry Oil and gas HPI1) Power generation (upstream) (oil and gas, downstream) 1) HPI: Hydrocarbon Processing Industry Annual Results 2008 | February 26, 2009 | slide 10
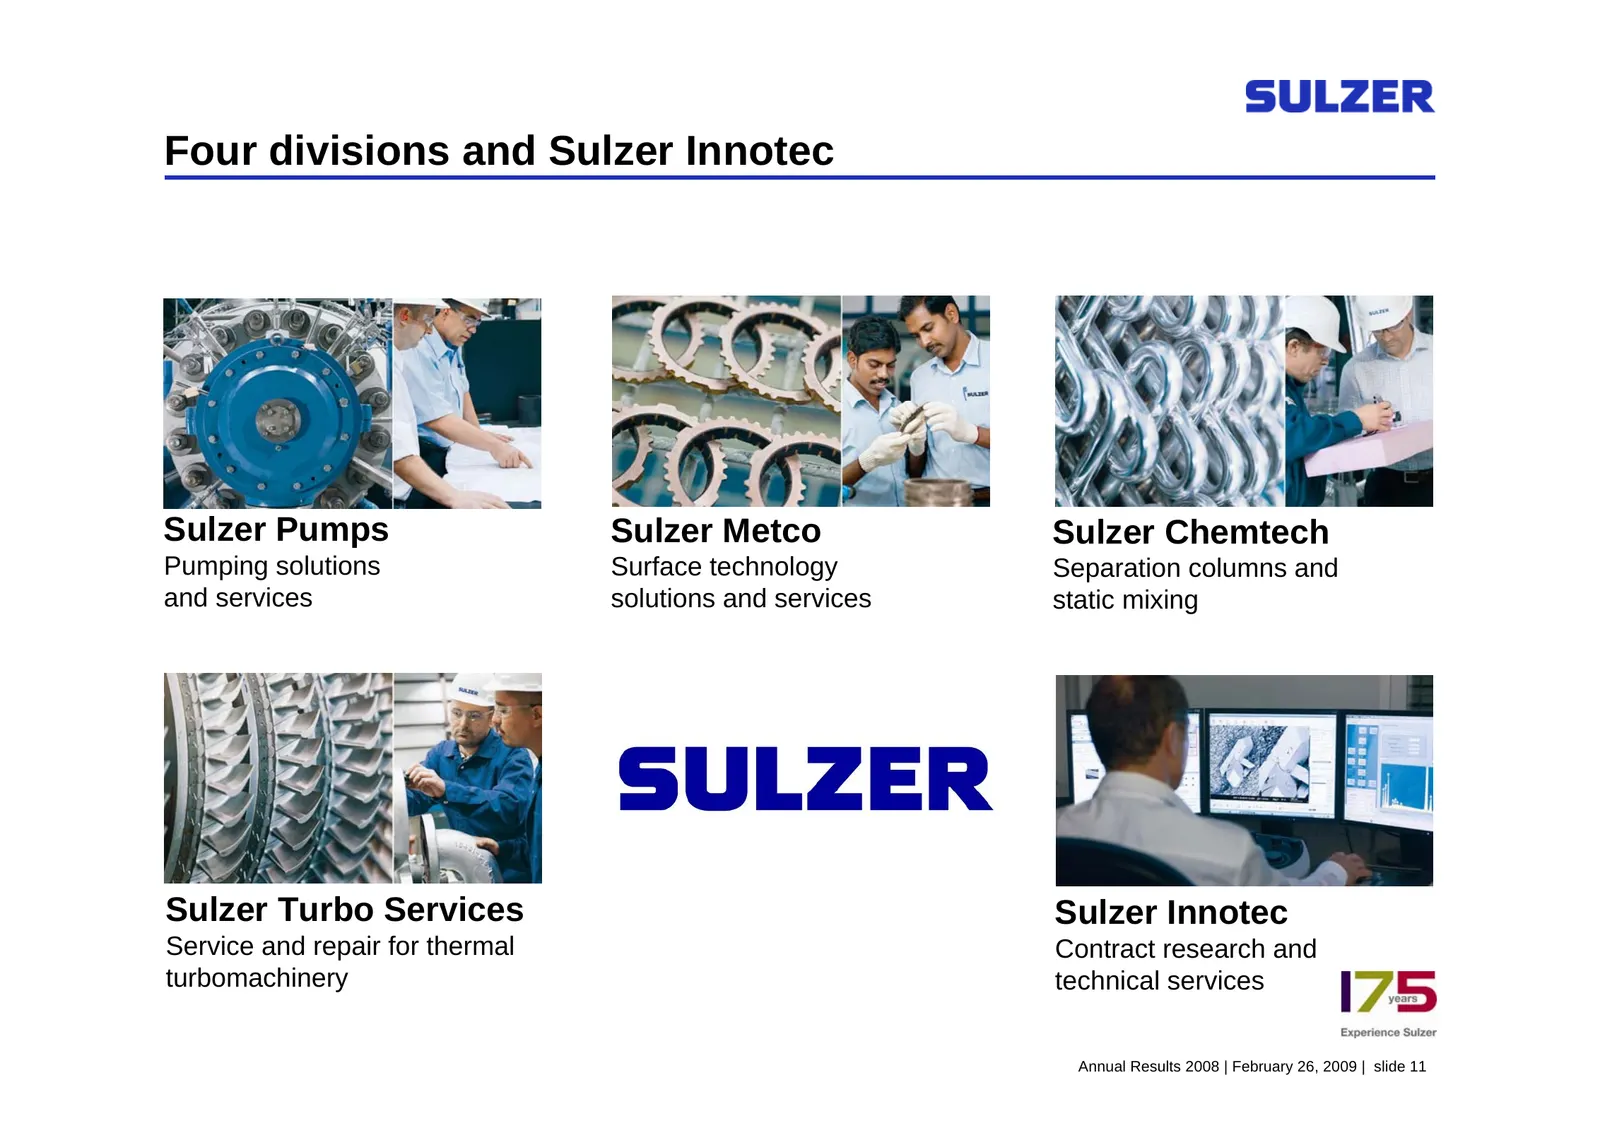
Slide 11: Four divisions and Sulzer Innotec
Four divisions and Sulzer Innotec Sulzer Pumps Sulzer Metco Sulzer Chemtech Pumping solutions Surface technology Separation columns and and services solutions and services static mixing Sulzer Turbo Services Sulzer Innotec Service and repair for thermal Contract research and turbomachinery technical
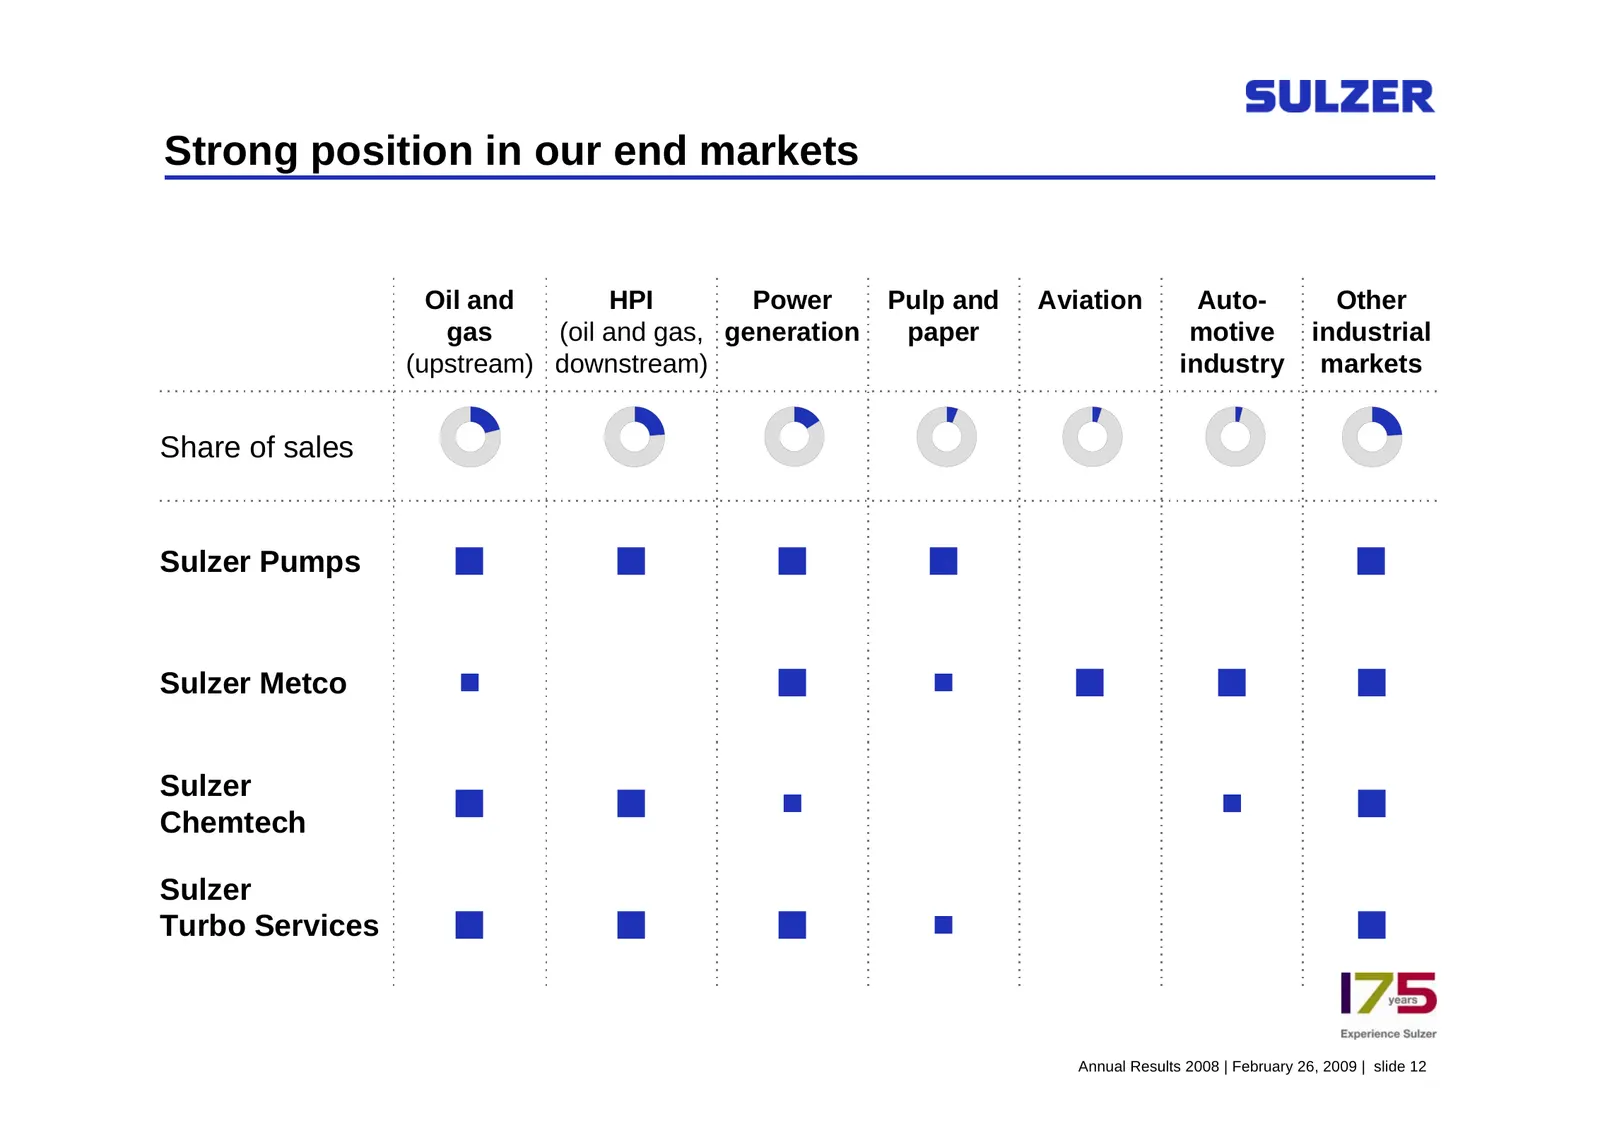
Slide 12: Strong position in our end markets
Strong position in our end markets Oil and HPI Power Pulp and Aviation Auto- Other gas (oil and gas, generation paper motive industrial (upstream) downstream) industry markets Share of sales Sulzer Pumps Sulzer Metco Sulzer Chemtech Sulzer Turbo Services Ann
Slide 13: Key areas of focus for Sulzer
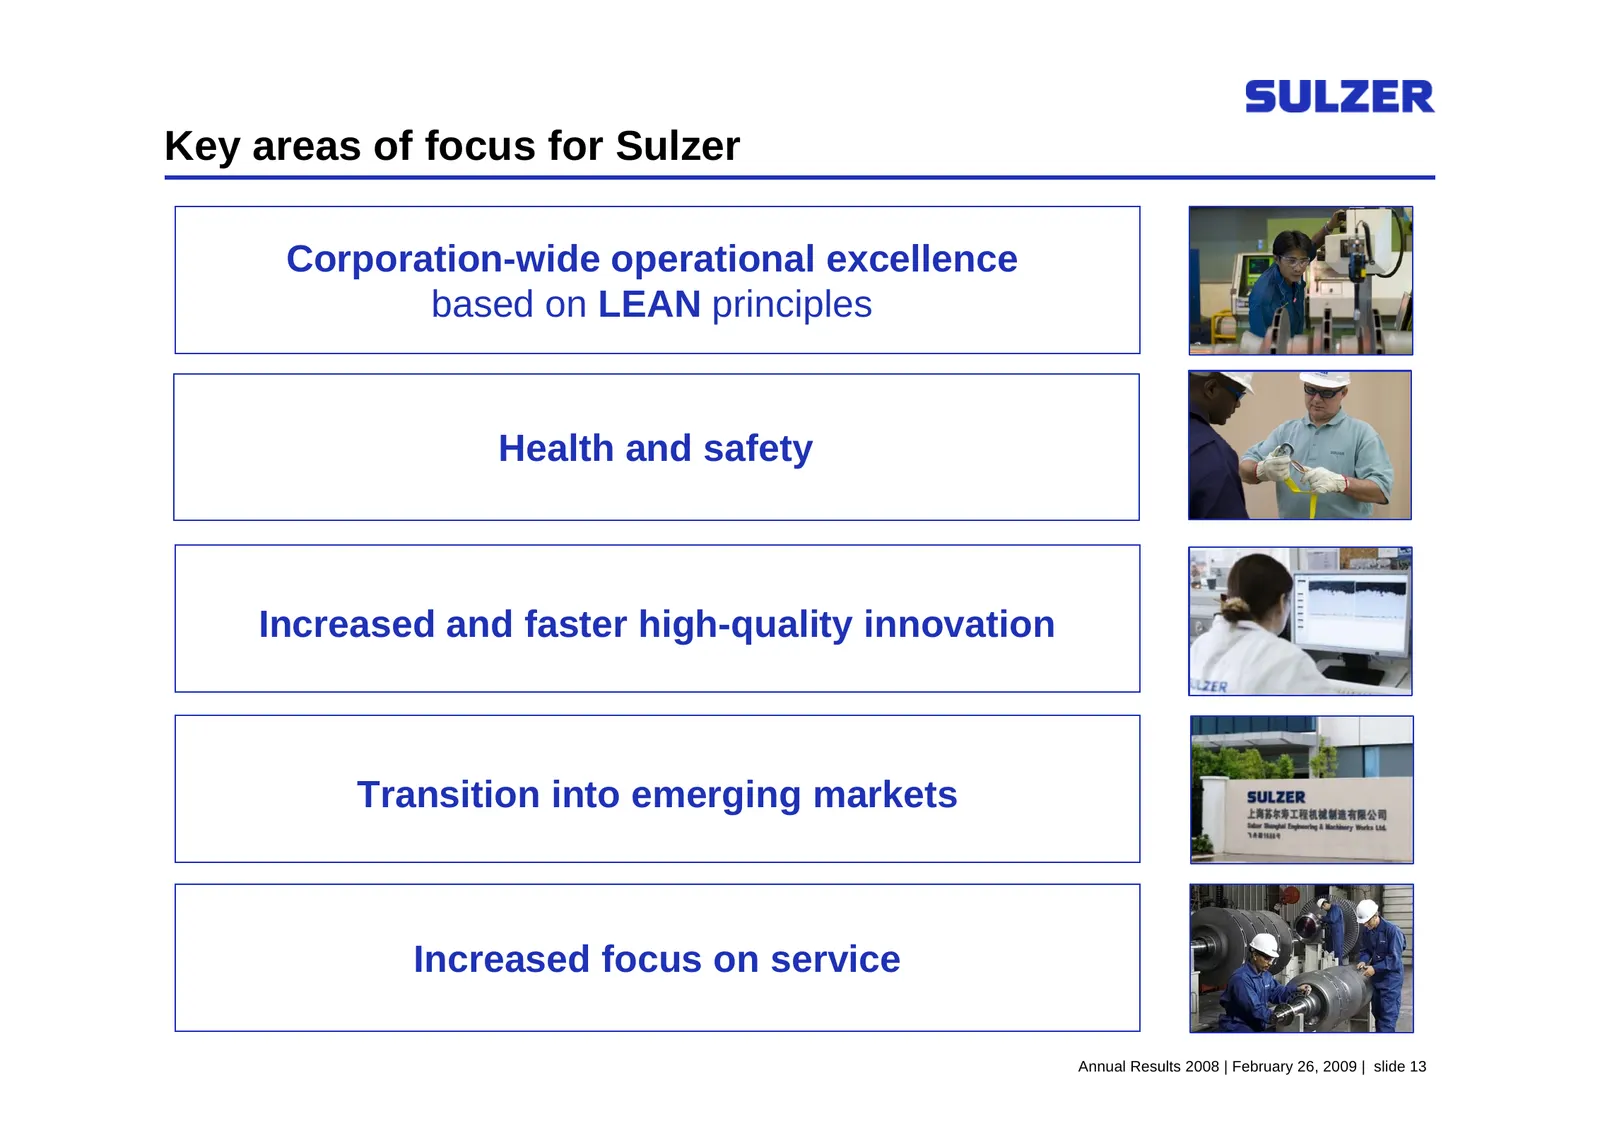
Key areas of focus for Sulzer Corporation-wide operational excellence based on LEAN principles Health and safety Increased and faster high-quality innovation Transition into emerging markets Increased focus on service Annual Results 2008 | February 26, 2009 | slide 13
Slide 14: Two small service acquisitions
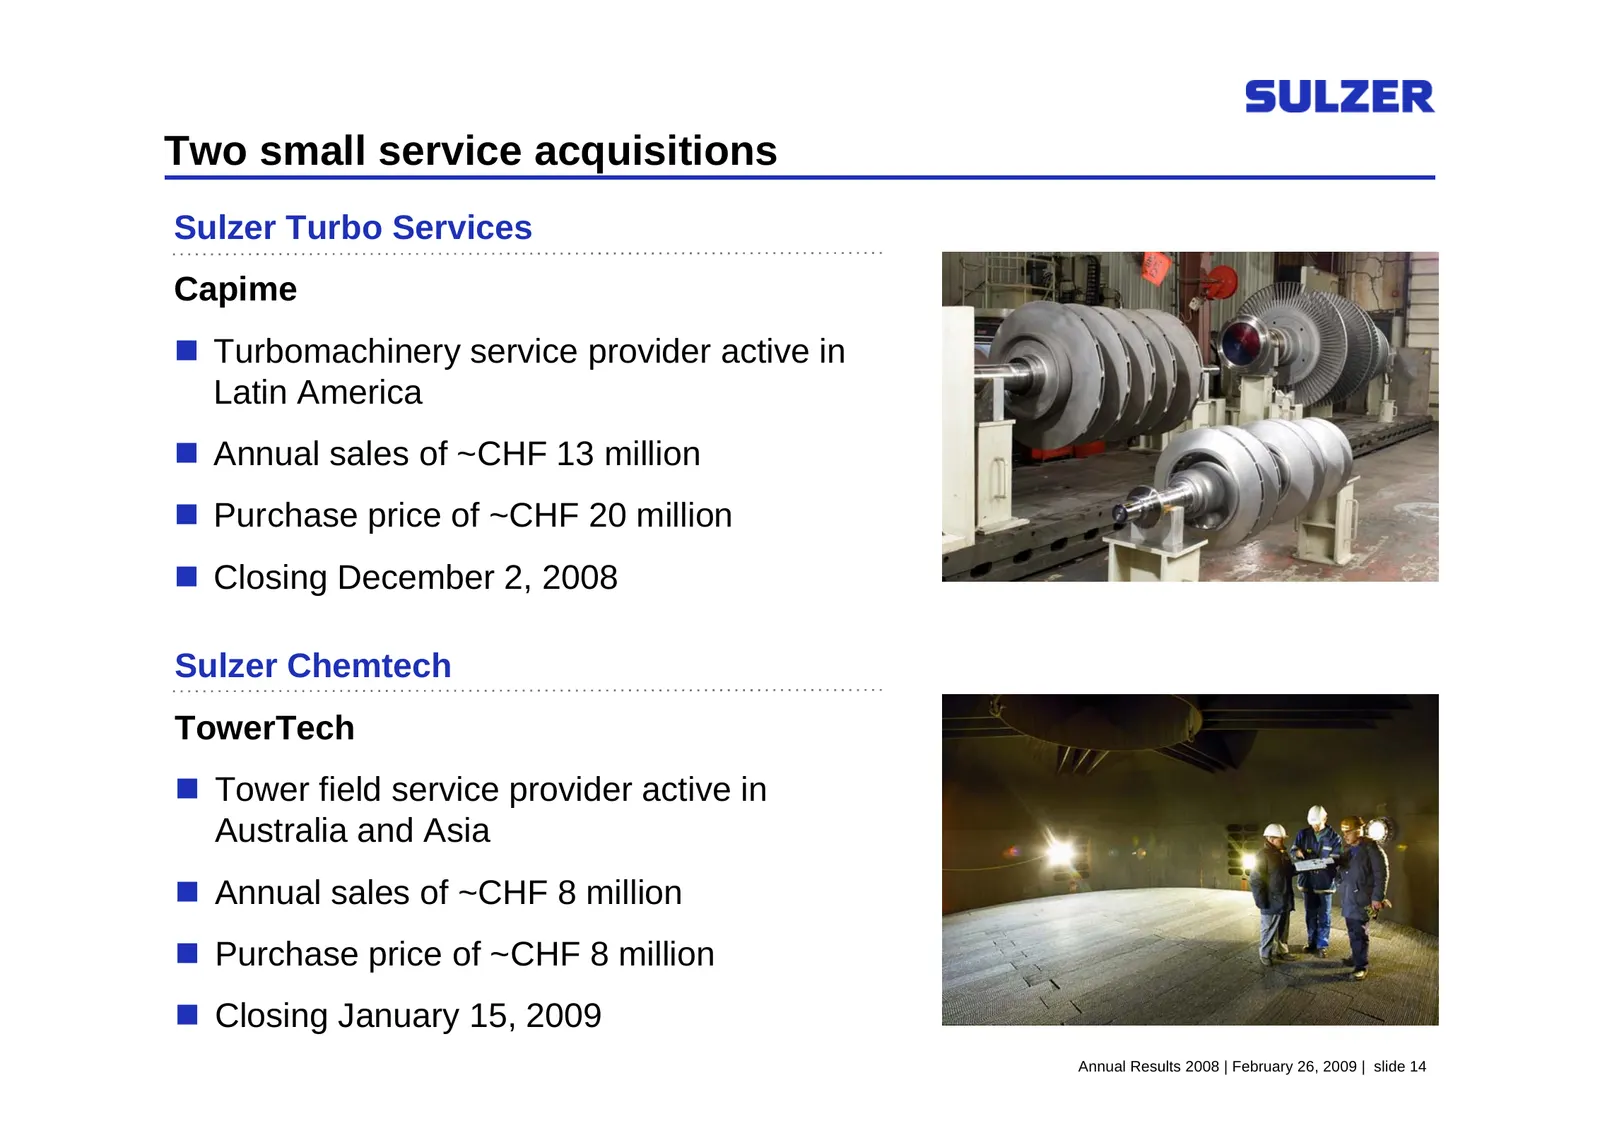
Two small service acquisitions Sulzer Turbo Services Capime Turbomachinery service provider active in Latin America Annual sales of ~CHF 13 million Purchase price of ~CHF 20 million Closing December 2, 2008 Sulzer Chemtech TowerTech Tower field service provider active in Australia and Asia
Slide 15: Order intake: Multi-year, strong double-digit growth rates
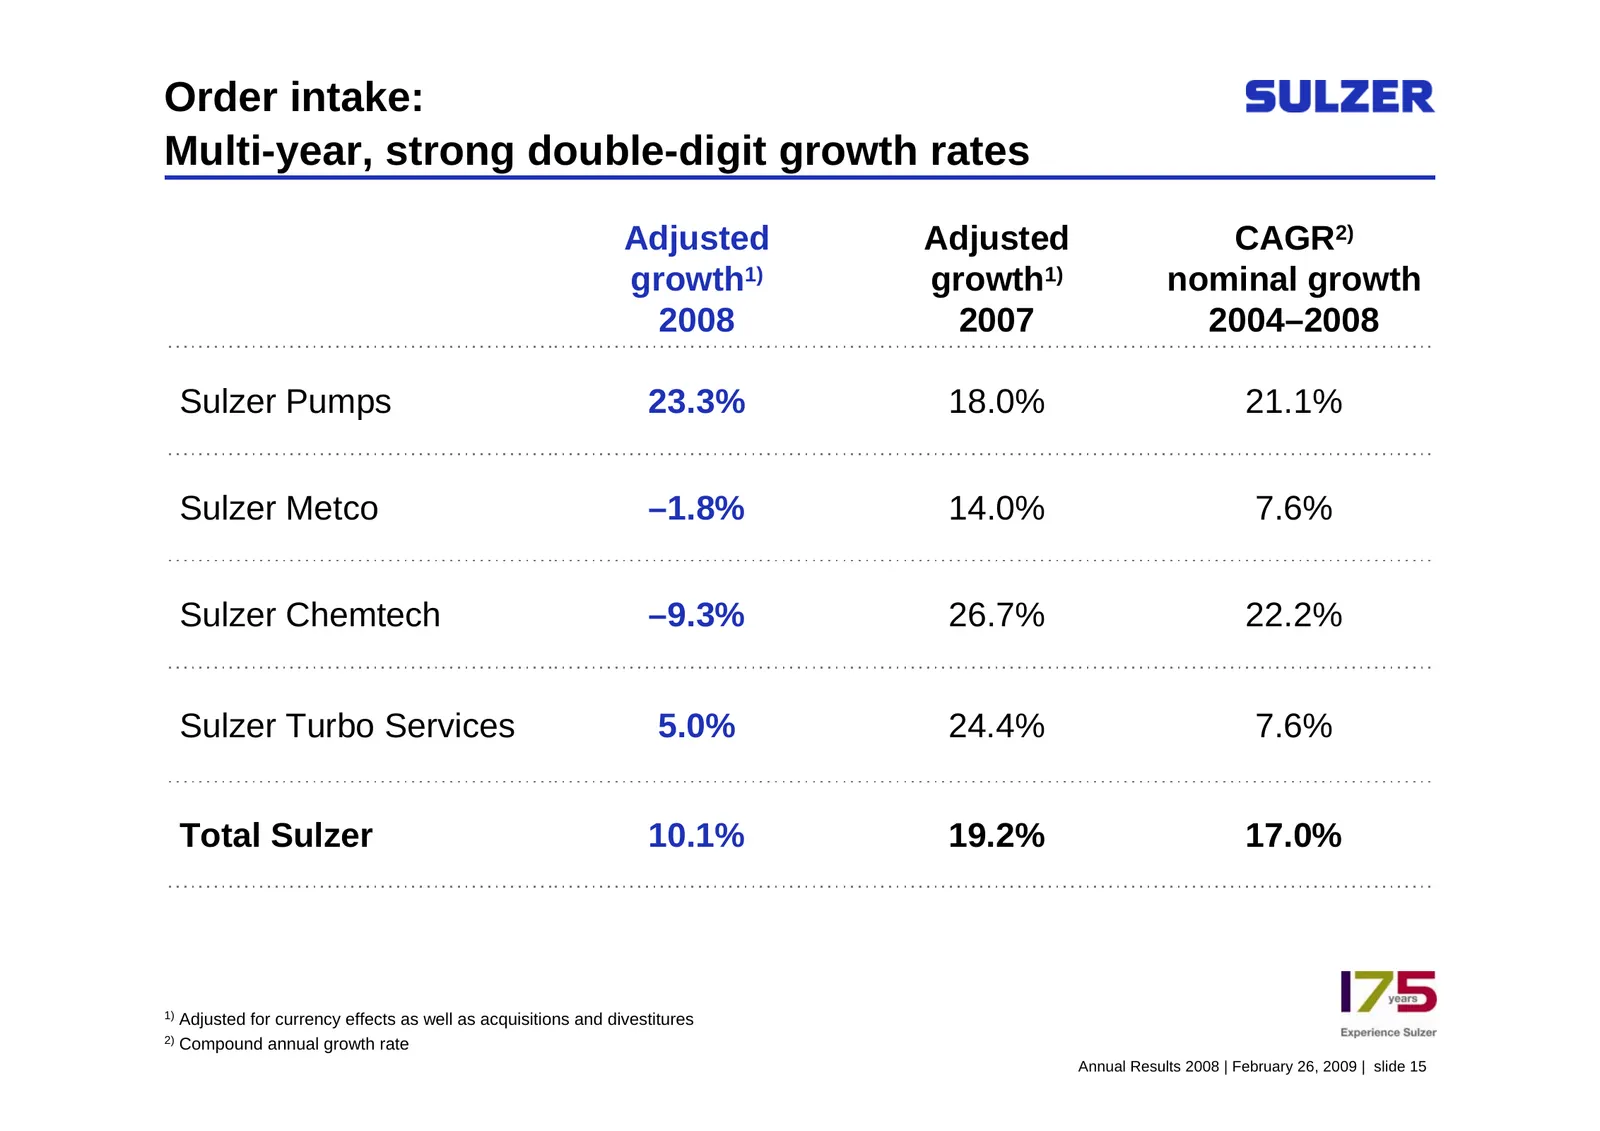
Order intake: Multi-year, strong double-digit growth rates Adjusted Adjusted CAGR2) growth1) growth1) nominal growth 2008 2007 2004–2008 Sulzer Pumps 23.3% 18.0% 21.1% Sulzer Metco –1.8% 14.0% 7.6% Sulzer Chemtech –9.3% 26.7% 22.2% Sulzer Turbo Services 5.0% 24.4% 7.6% Total Sulzer 10.1% 19.2% 17.0%
Slide 16: Sulzer Pumps
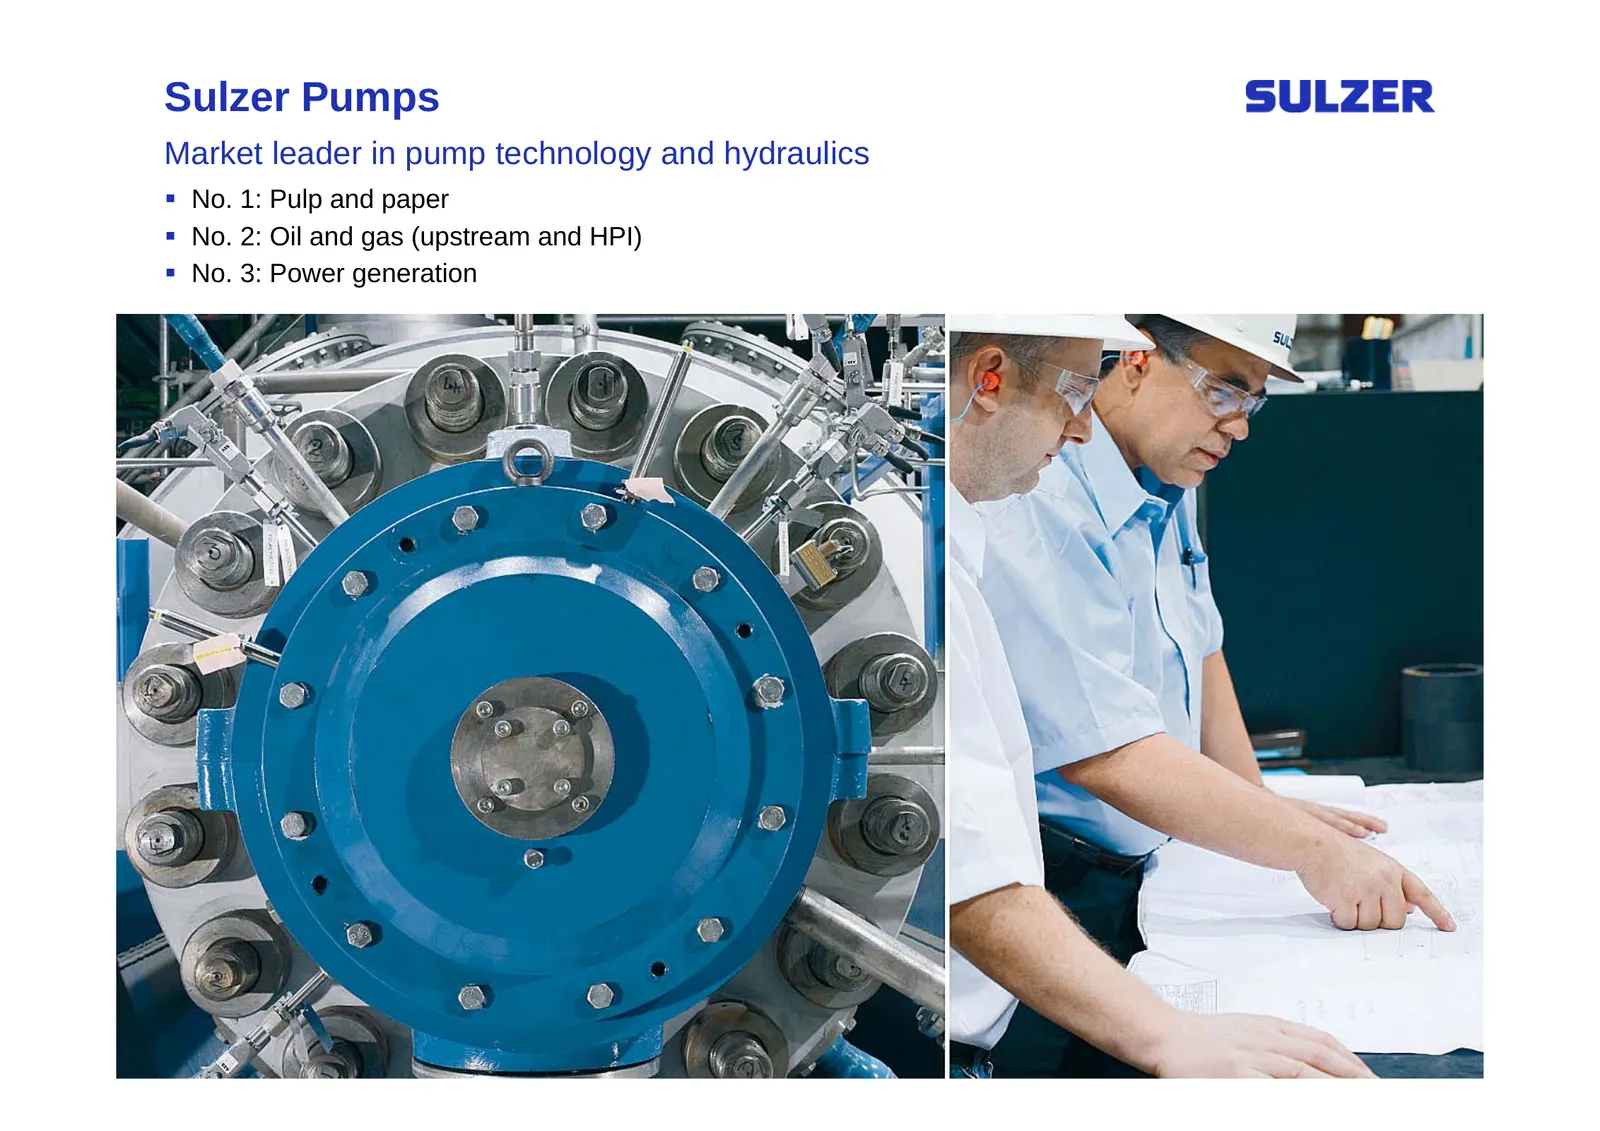
Sulzer Pumps Market leader in pump technology and hydraulics No. 1: Pulp and paper No. 2: Oil and gas (upstream and HPI) No. 3: Power generation Annual Results 2008 | February 26, 2009 | slide 17
Slide 17: Sulzer Pumps: Record level of order intake, sales and EBIT
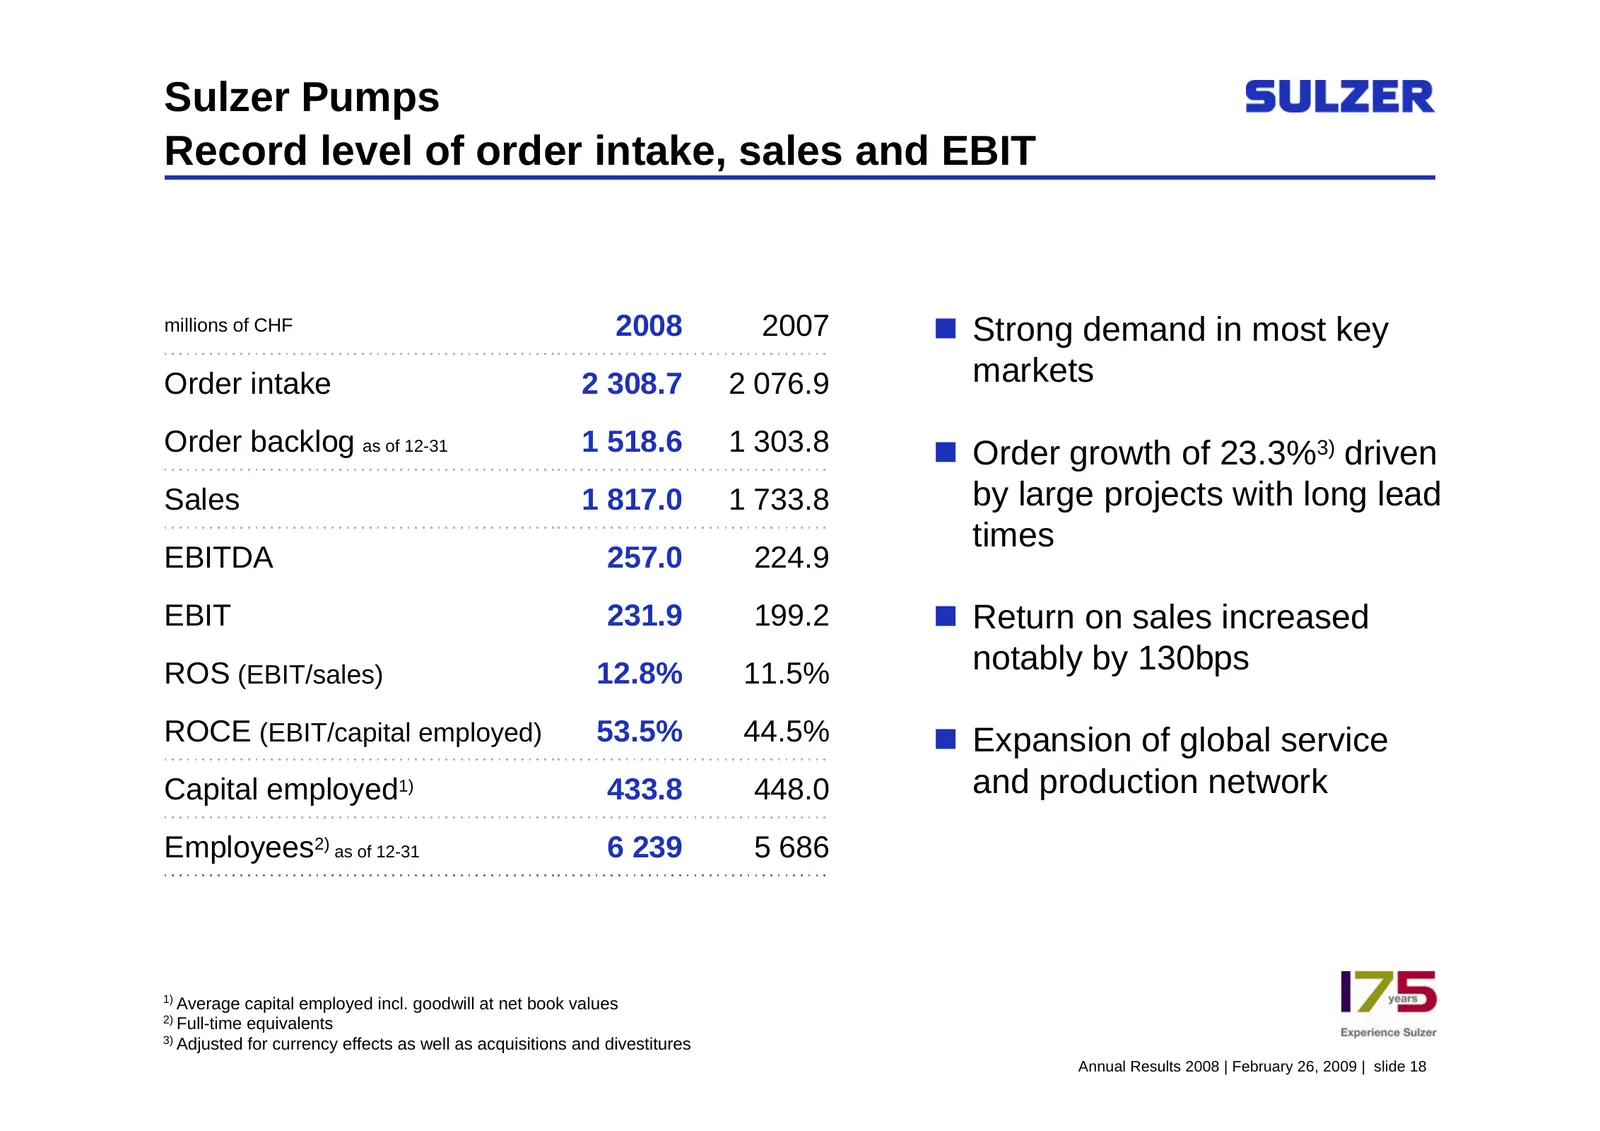
Sulzer Pumps Record level of order intake, sales and EBIT millions of CHF 2008 2007 Strong demand in most key Order intake 2 308.7 2 076.9 markets Order backlog as of 12-31 1 518.6 1 303.8 Order growth of 23.3%3) driven Sales 1 817.0 1 733.8 by large projects with long lead times EBITDA 257.0 22
Slide 18: Sulzer Pumps: Strong global position in key markets
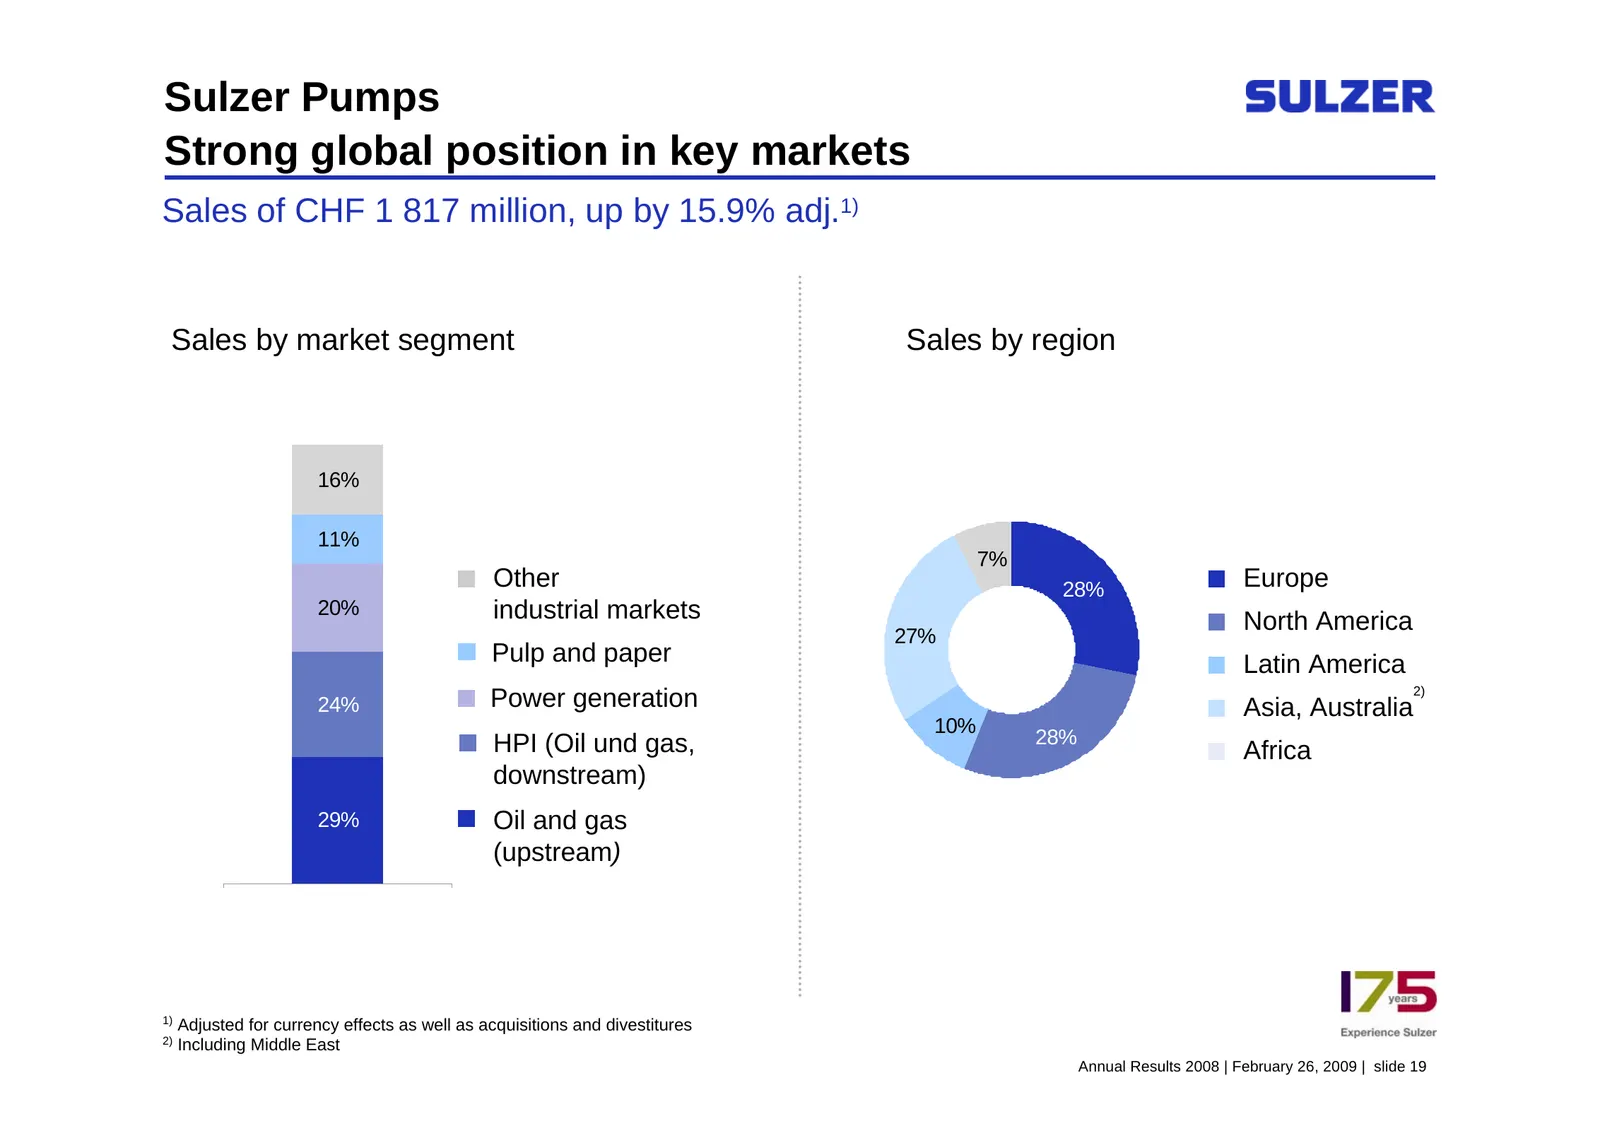
Sulzer Pumps Strong global position in key markets Sales of CHF 1 817 million, up by 15.9% adj.1) Sales by market segment Sales by region 16% 11% 7% Other 28% Europe 20% industrial markets North America 27% Pulp and paper Latin America 2) 24% Power generation Asia, Australia 10% HPI (Oil und gas, 28
Slide 19: Sulzer Metco
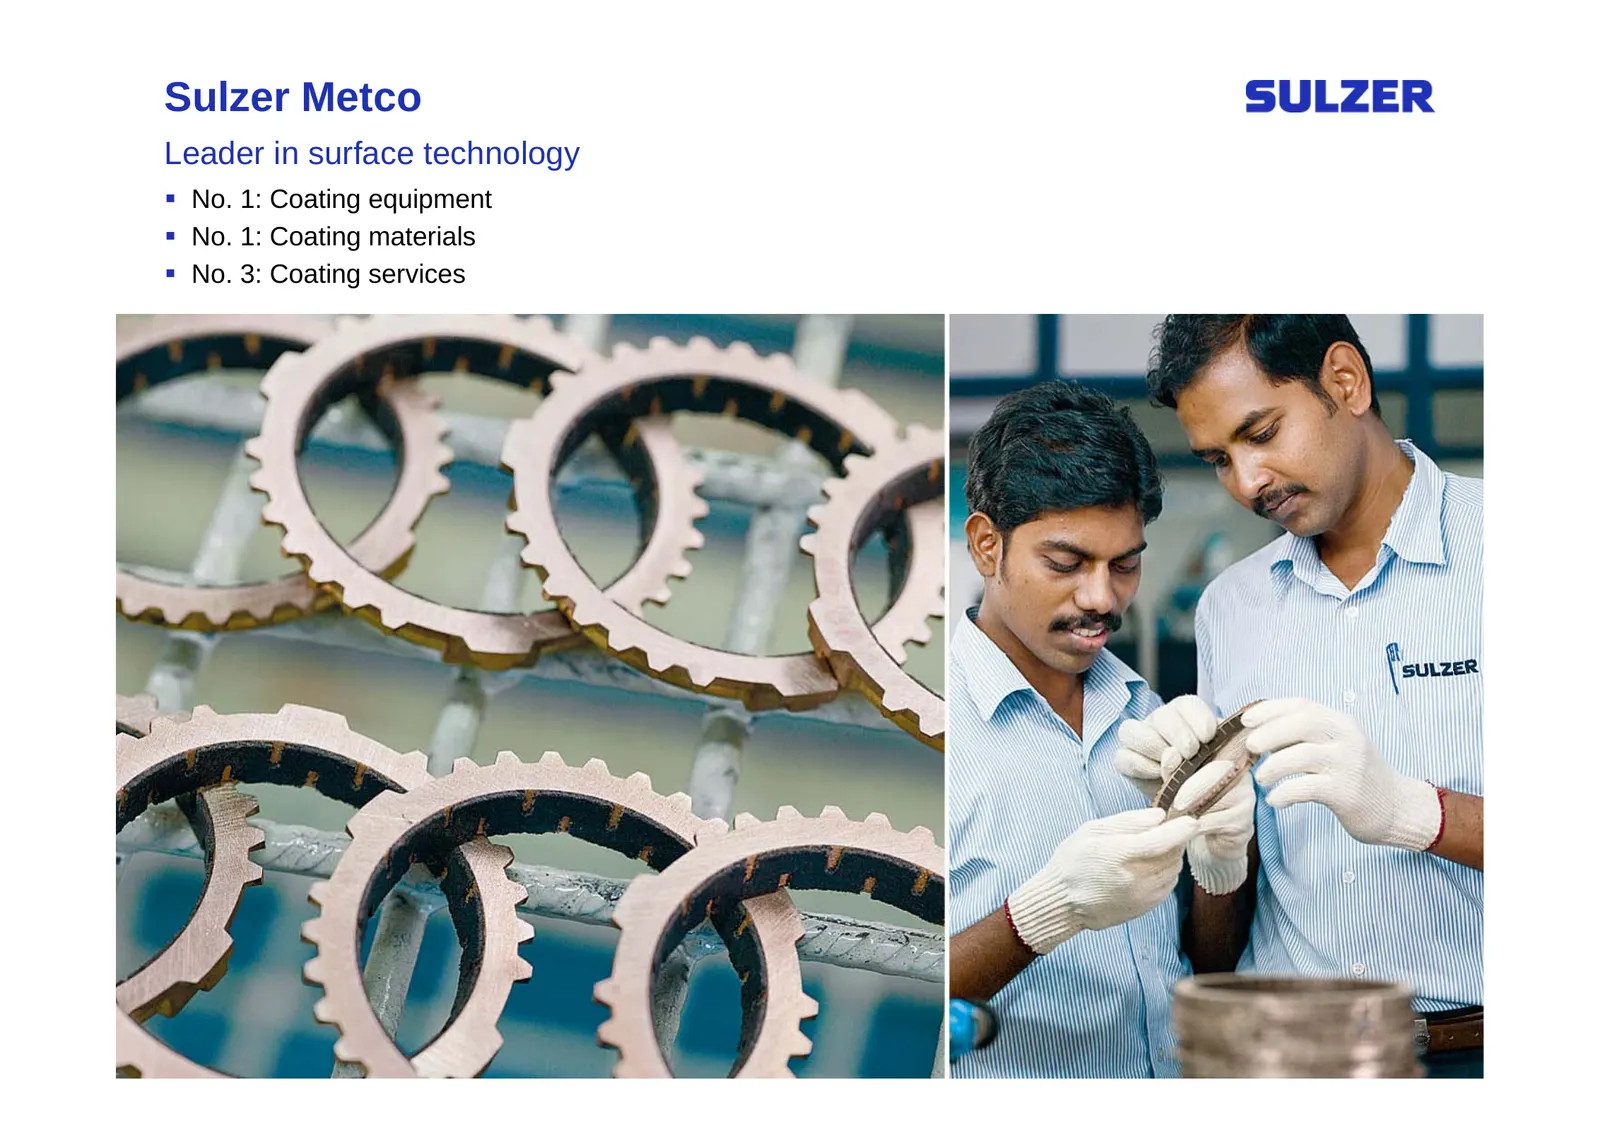
Sulzer Metco Leader in surface technology No. 1: Coating equipment No. 1: Coating materials No. 3: Coating services Annual Results 2008 | February 26, 2009 | slide 21
Slide 20: Sulzer Metco: Stable sales in a tougher environment
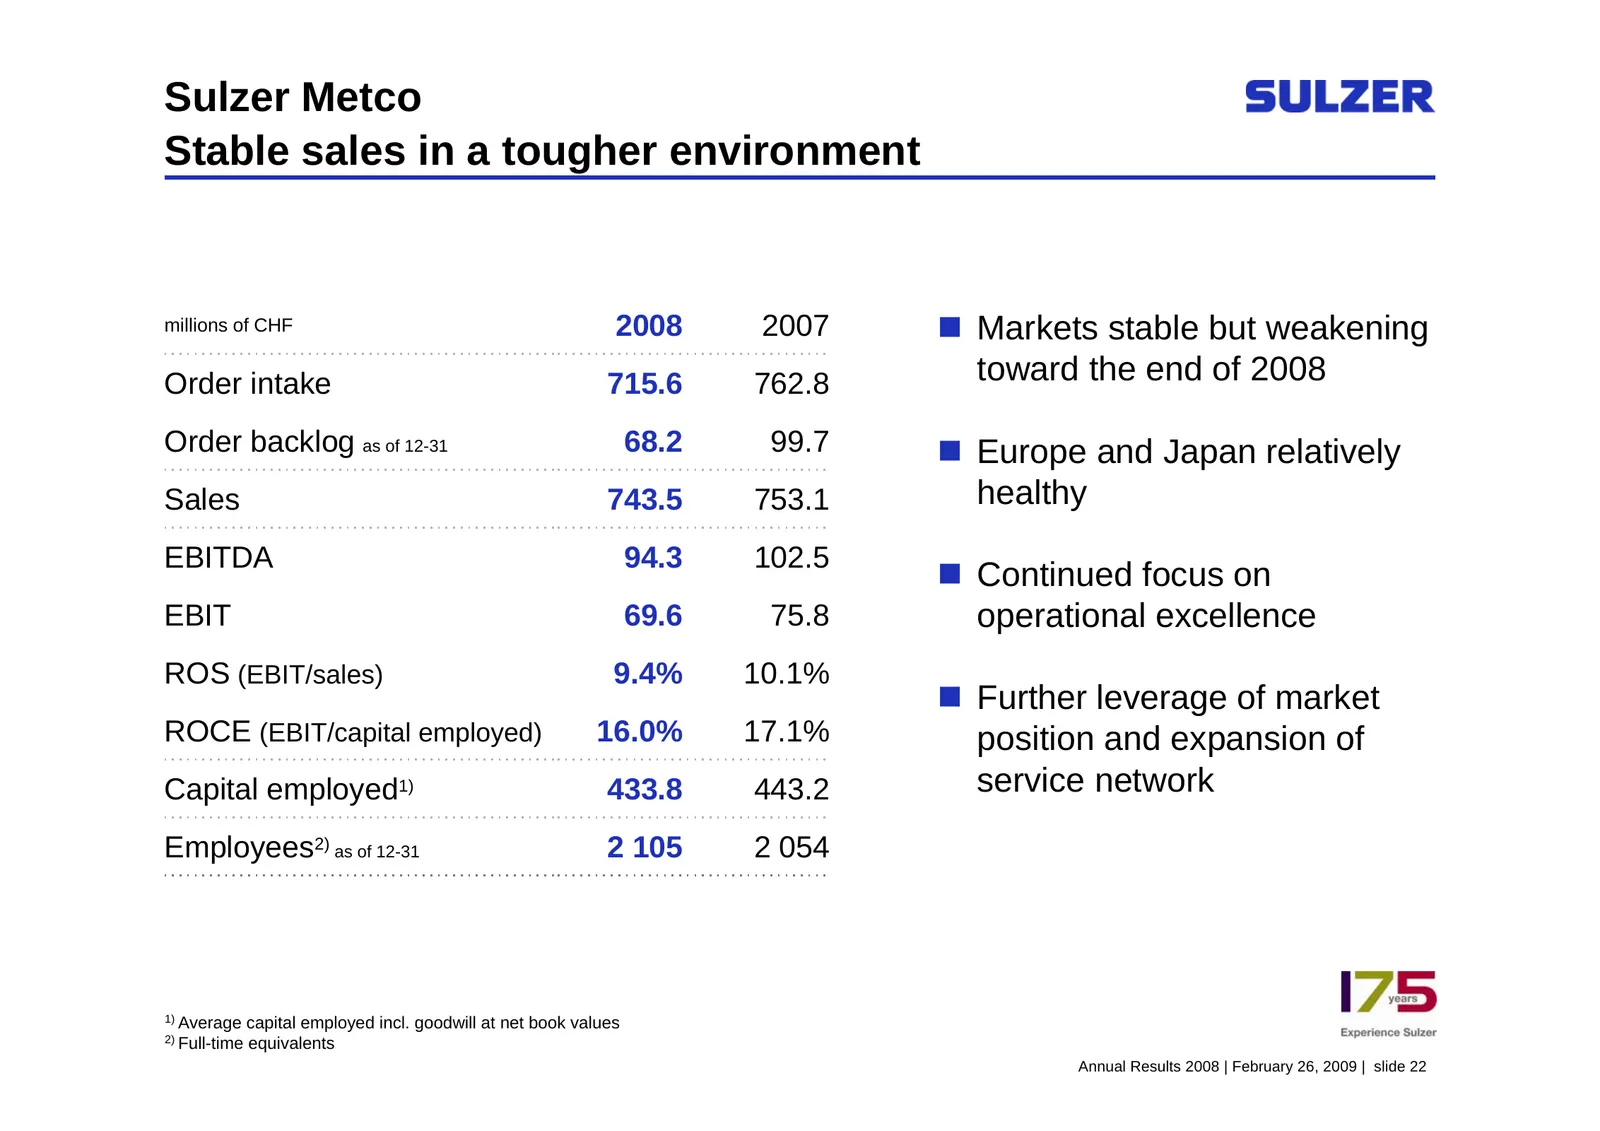
Sulzer Metco Stable sales in a tougher environment millions of CHF 2008 2007 Markets stable but weakening Order intake 715.6 762.8 toward the end of 2008 Order backlog as of 12-31 68.2 99.7 Europe and Japan relatively Sales 743.5 753.1 healthy EBITDA 94.3 102.5 Continued focus on EBIT 69.6 75.
Slide 21: Sulzer Metco: Surface treatment of critical components
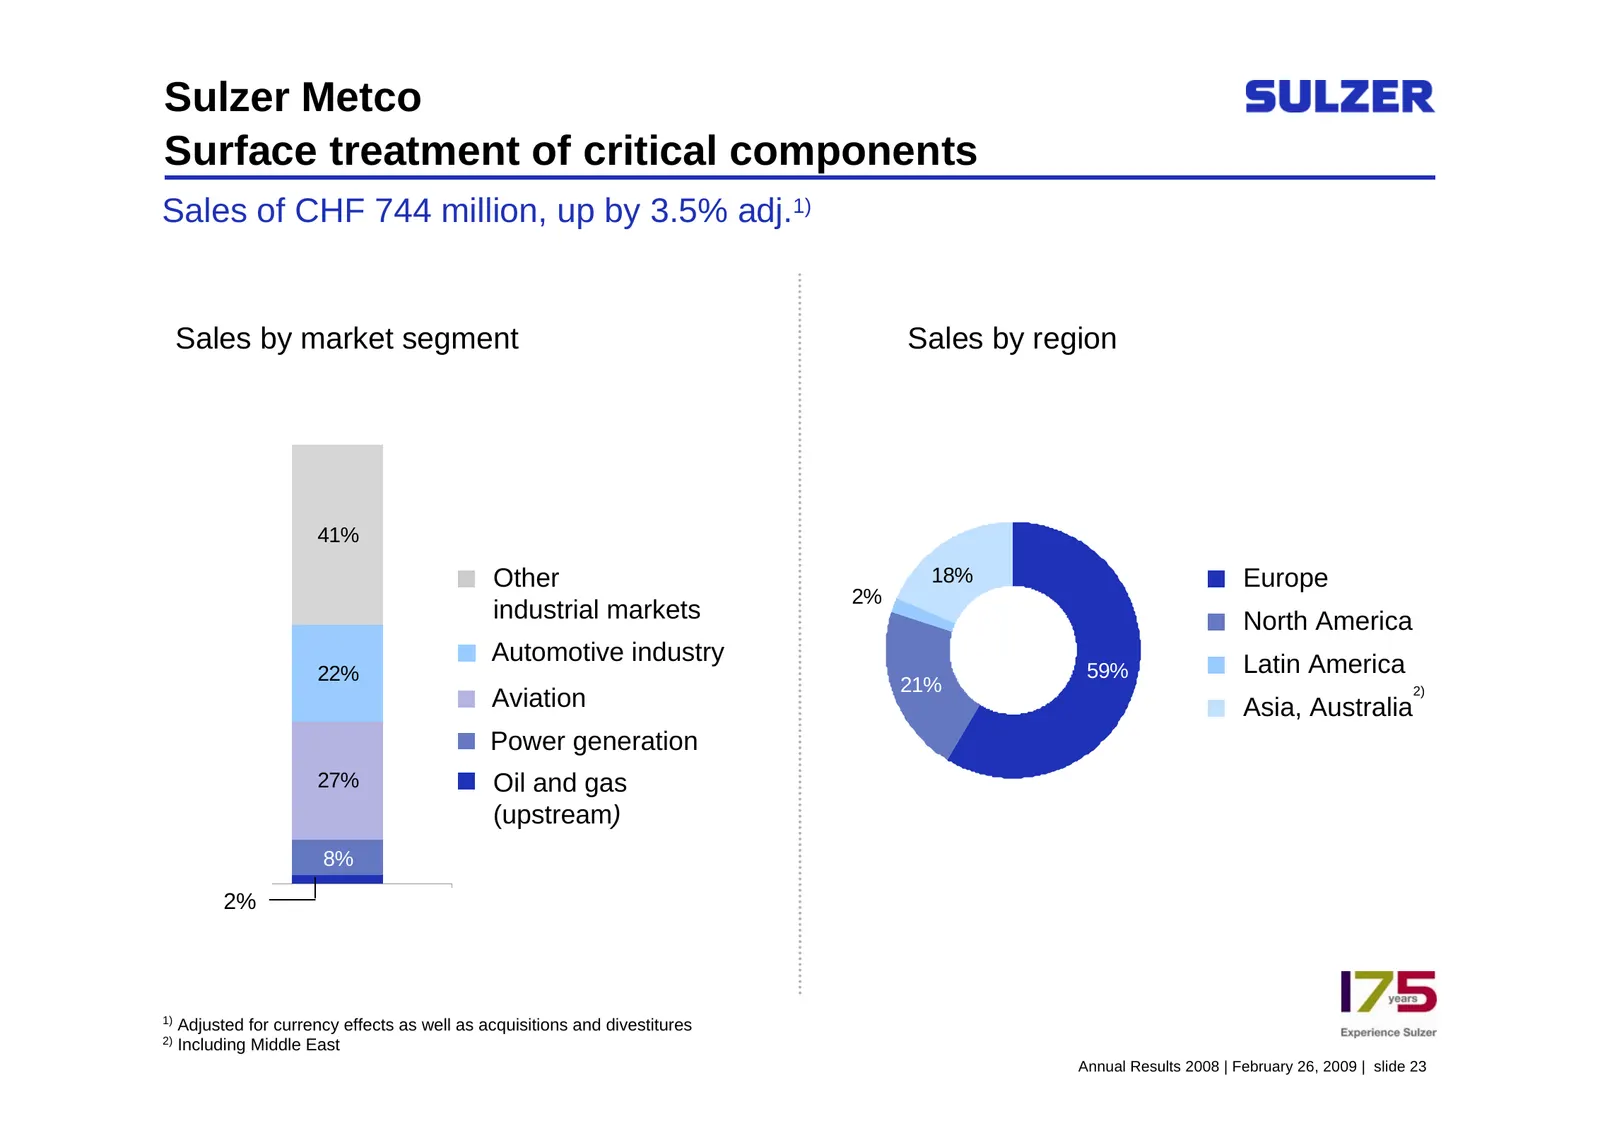
Sulzer Metco Surface treatment of critical components Sales of CHF 744 million, up by 3.5% adj.1) Sales by market segment Sales by region 41% Other 18% Europe 2% industrial markets North America Automotive industry Latin America 22% 59% 21% 2) Aviation Asia, Australia Power generation 27% Oil and ga
Slide 22: Sulzer Chemtech
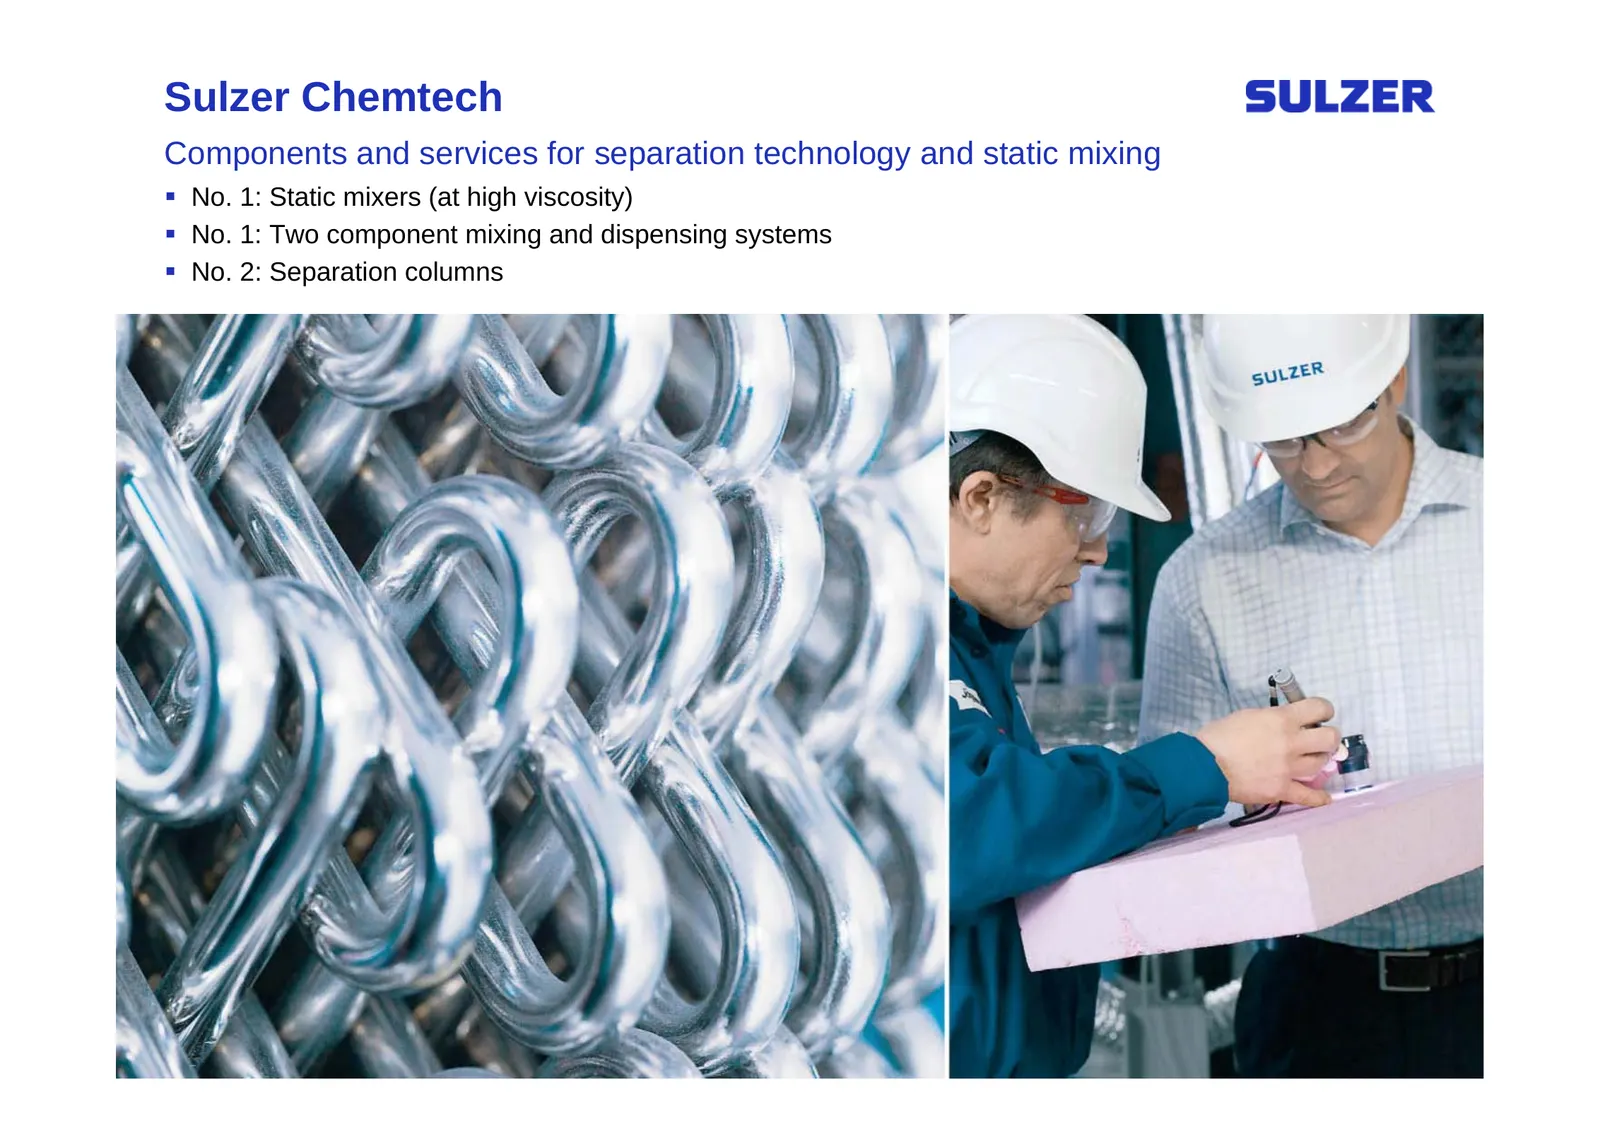
Sulzer Chemtech Components and services for separation technology and static mixing No. 1: Static mixers (at high viscosity) No. 1: Two component mixing and dispensing systems No. 2: Separation columns Annual Results 2008 | February 26, 2009 | slide 25
Slide 23: Sulzer Chemtech: Increased sales and profitability of 17%
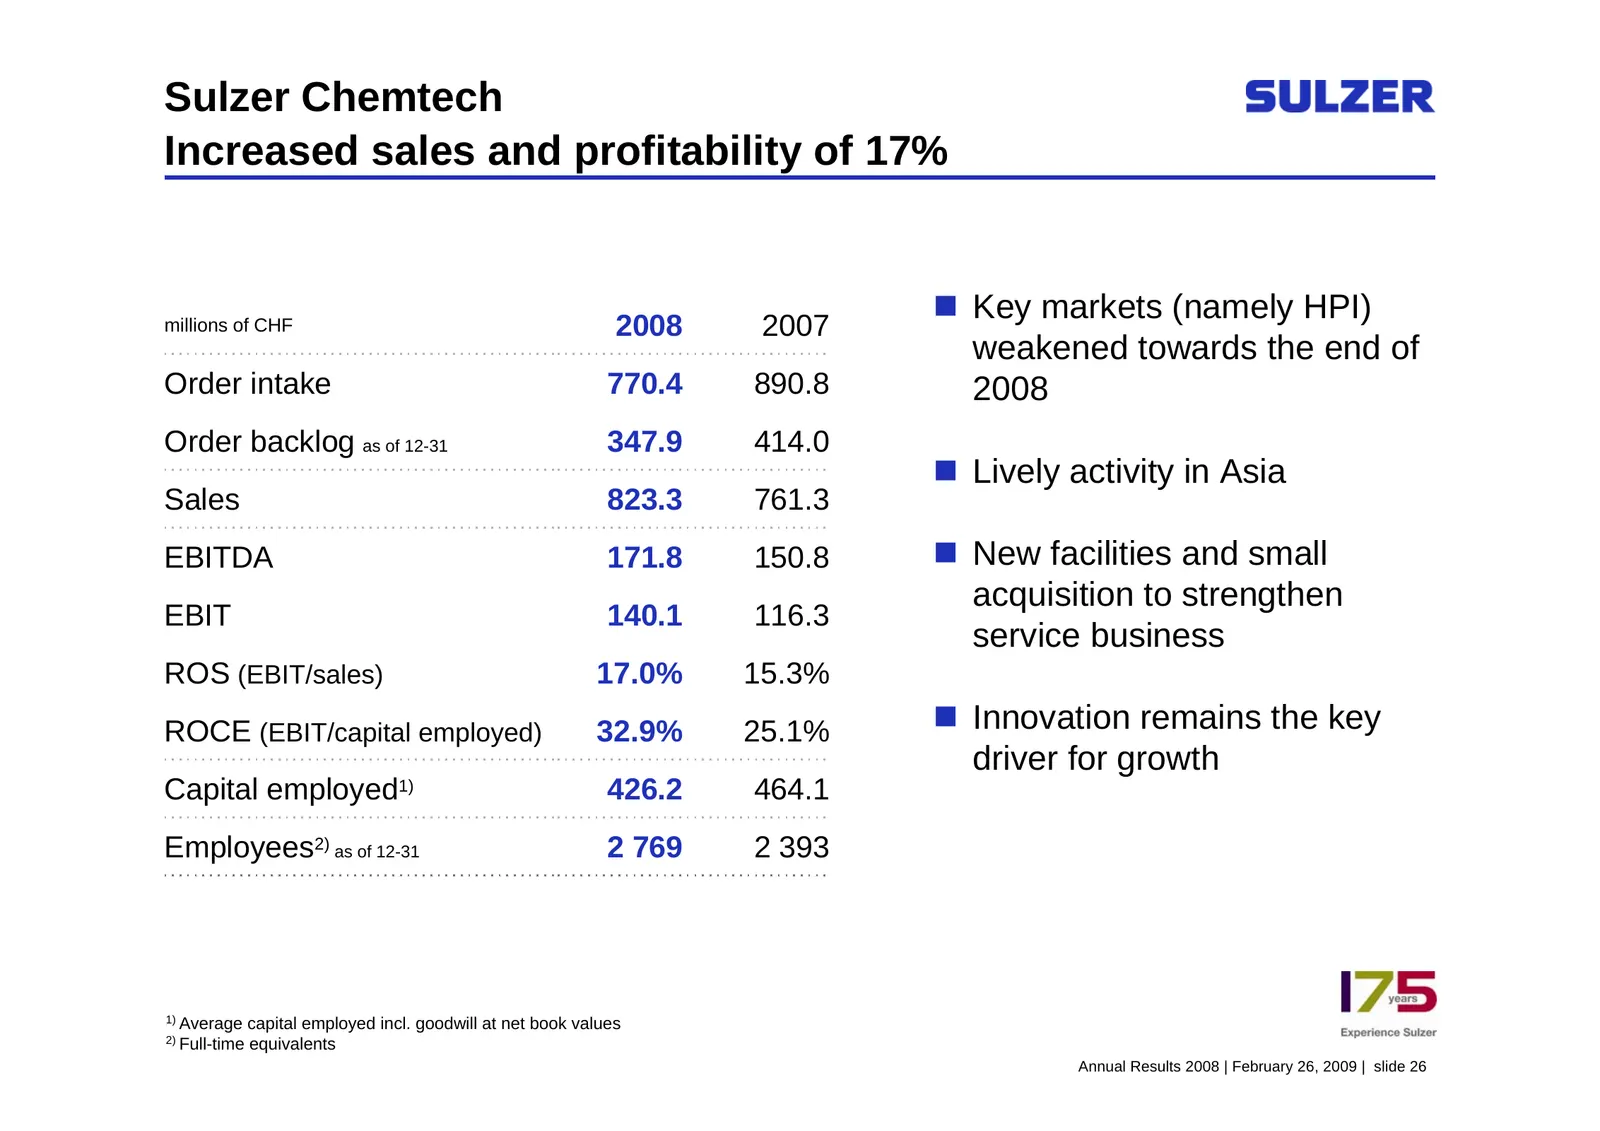
Sulzer Chemtech Increased sales and profitability of 17% Key markets (namely HPI) millions of CHF 2008 2007 weakened towards the end of Order intake 770.4 890.8 2008 Order backlog as of 12-31 347.9 414.0 Lively activity in Asia Sales 823.3 761.3 EBITDA 171.8 150.8 New facilities and small acqu
Slide 24: Sulzer Chemtech: Separation solutions and services for HPI
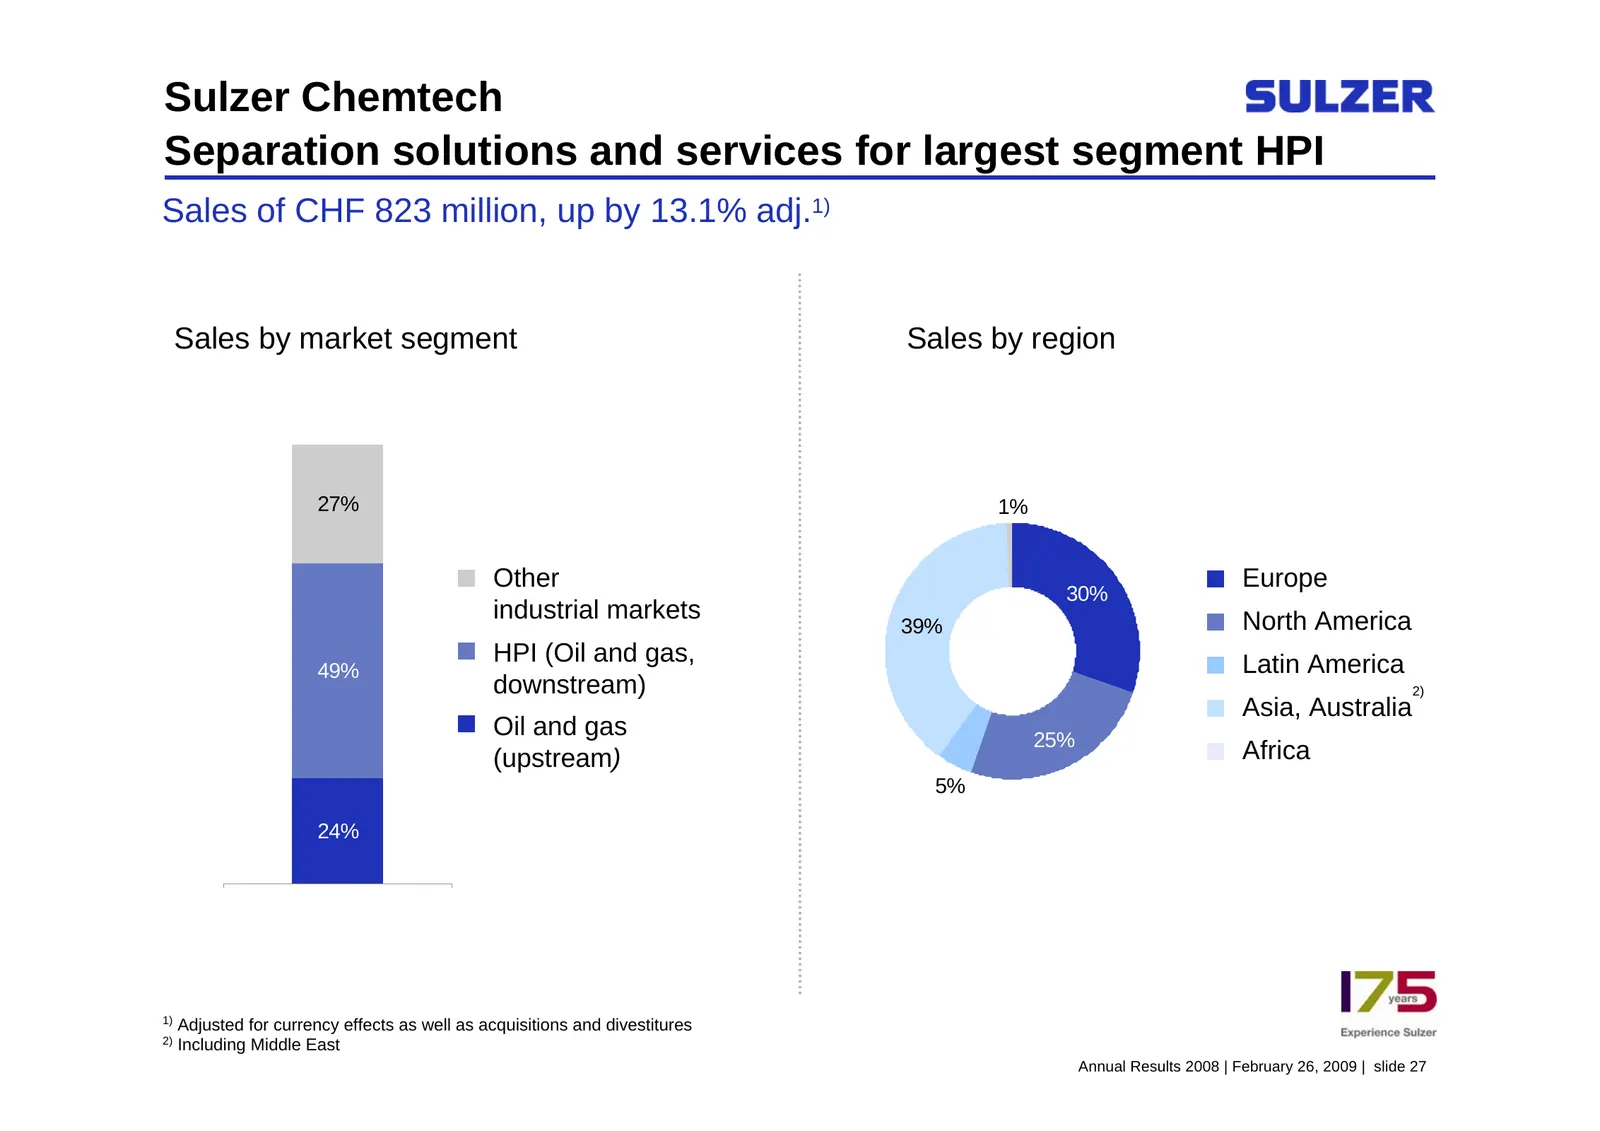
Sulzer Chemtech Separation solutions and services for largest segment HPI Sales of CHF 823 million, up by 13.1% adj.1) Sales by market segment Sales by region 27% 1% Other Europe 30% industrial markets North America 39% HPI (Oil and gas, Latin America 49% downstream) 2) Asia, Australia Oil and gas 2
Slide 25: Sulzer Turbo Services
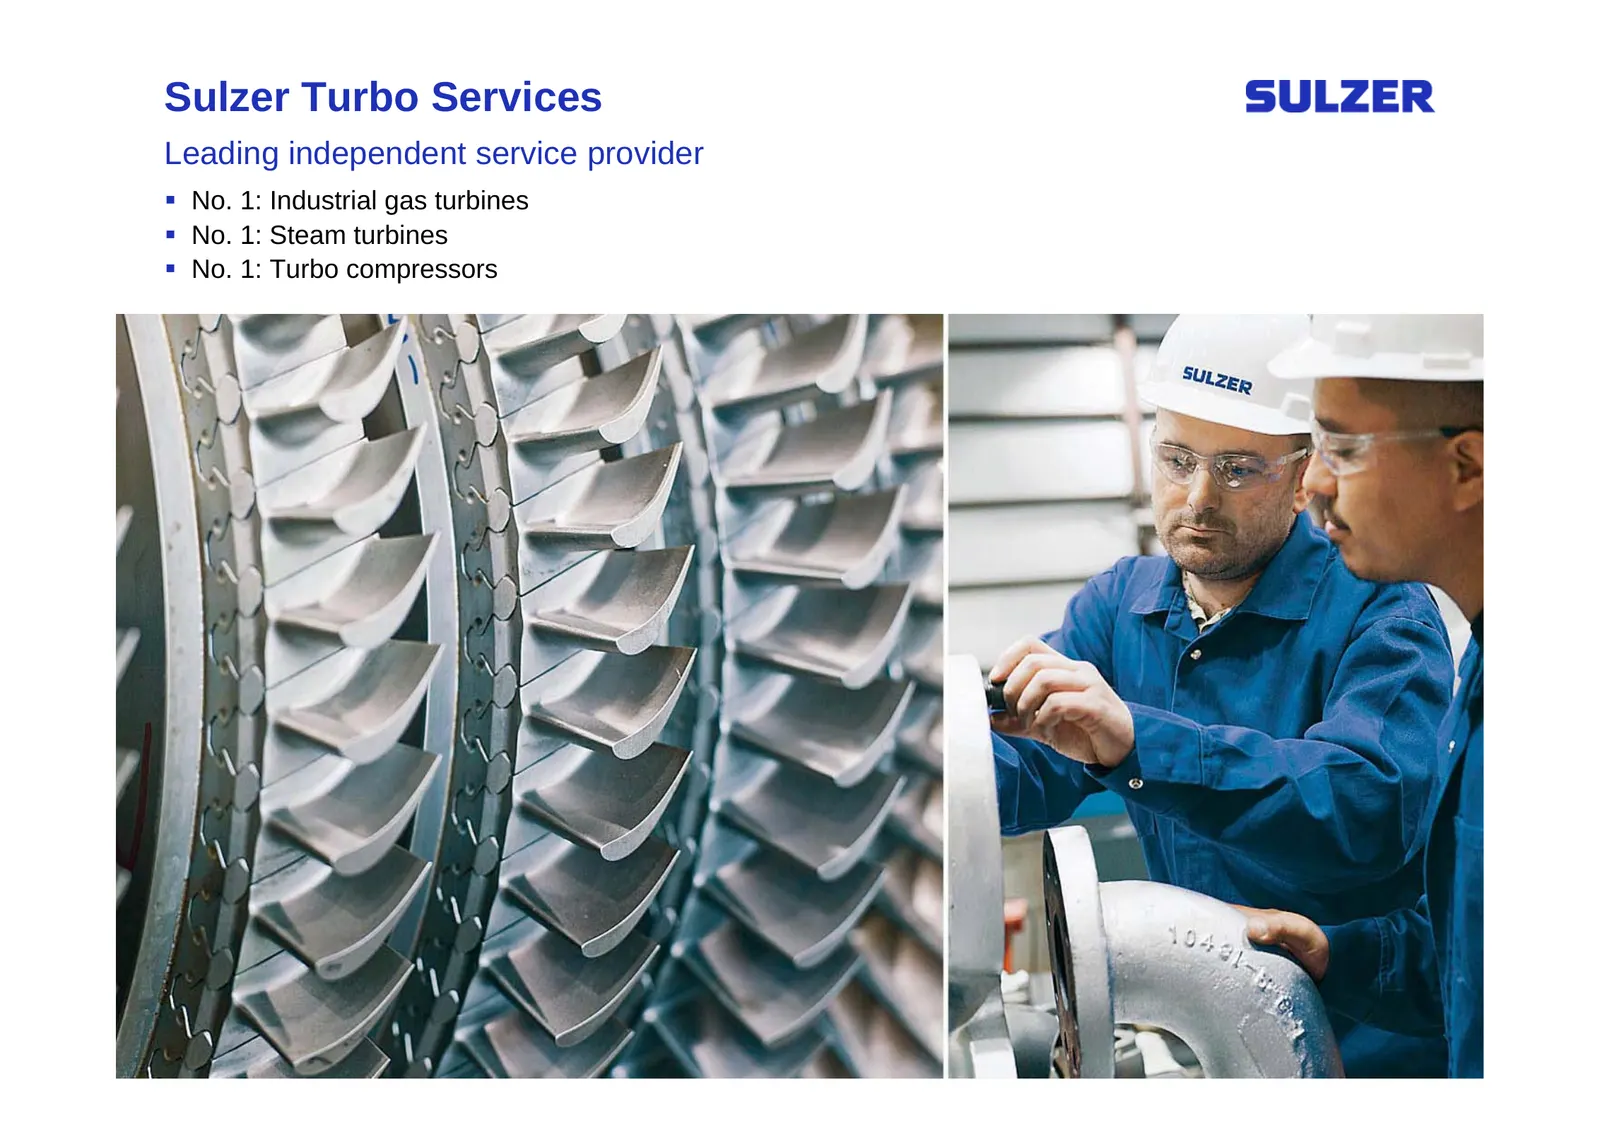
Sulzer Turbo Services Leading independent service provider No. 1: Industrial gas turbines No. 1: Steam turbines No. 1: Turbo compressors Annual Results 2008 | February 26, 2009 | slide 29
Slide 26: Sulzer Turbo Services: Higher sales and operating income
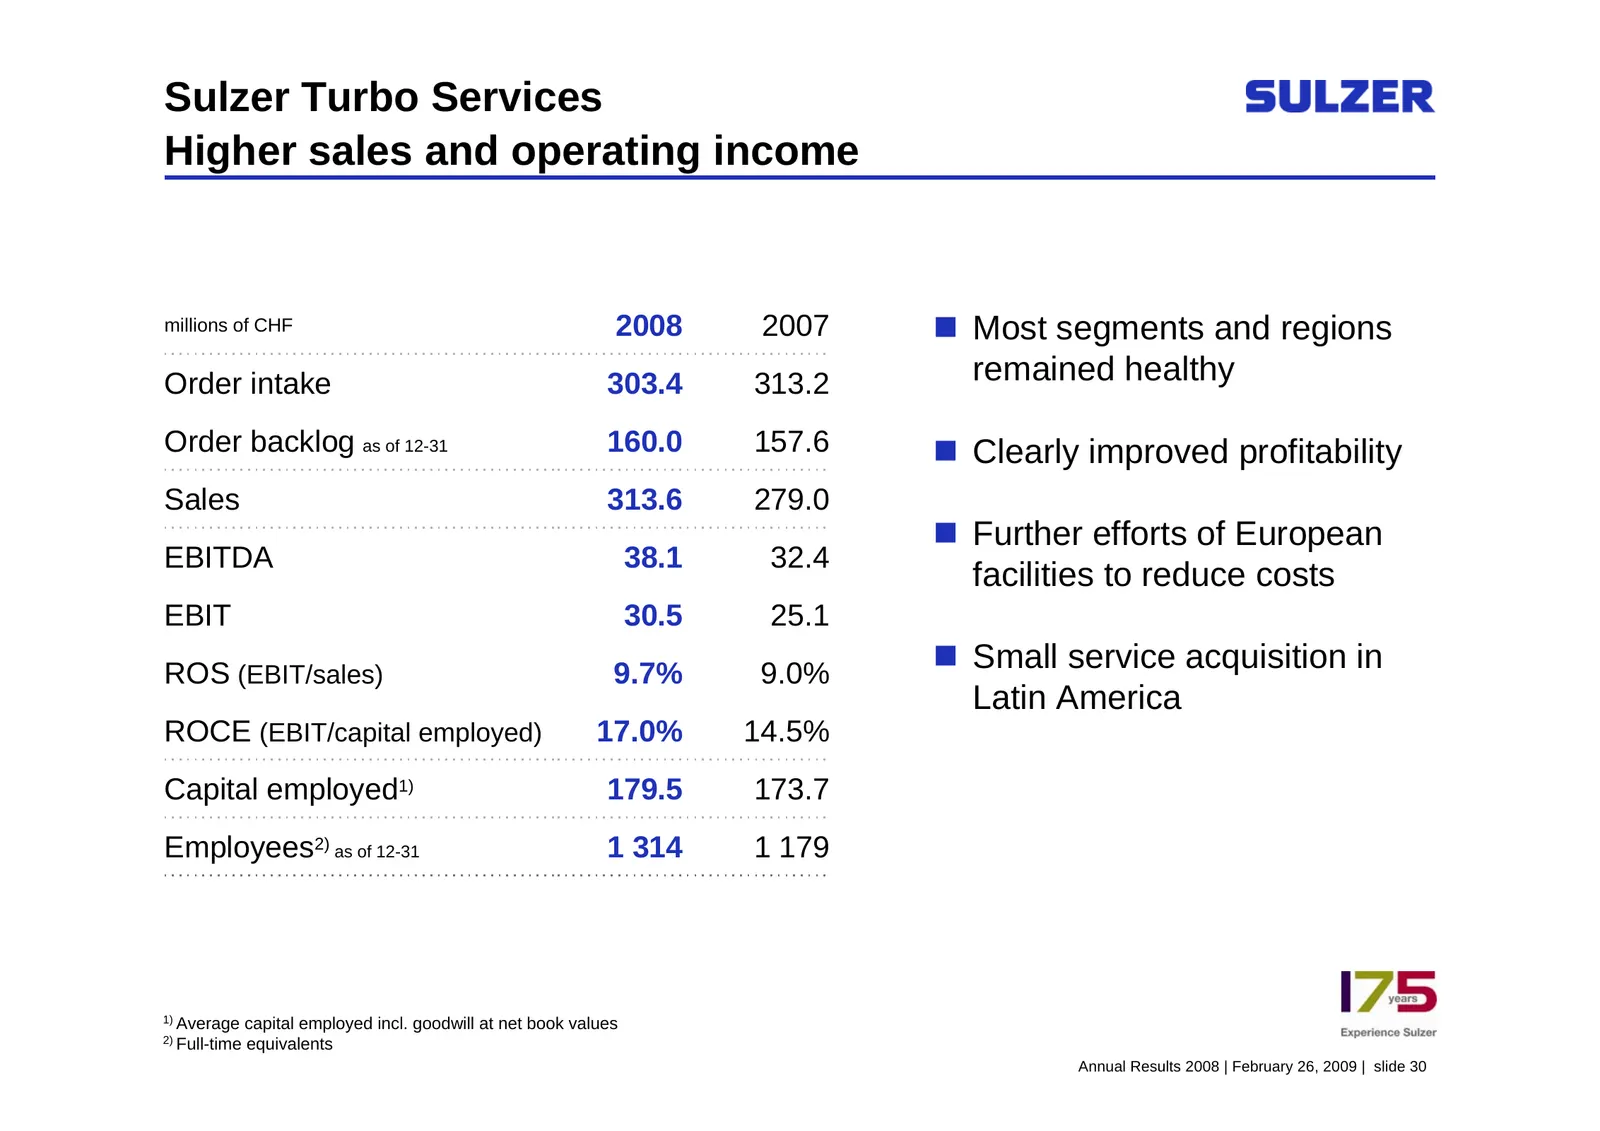
Sulzer Turbo Services Higher sales and operating income millions of CHF 2008 2007 Most segments and regions Order intake 303.4 313.2 remained healthy Order backlog as of 12-31 160.0 157.6 Clearly improved profitability Sales 313.6 279.0 Further efforts of European EBITDA 38.1 32.4 facilities t
Slide 27: Sulzer Turbo Services: Focus on gas and steam turbines
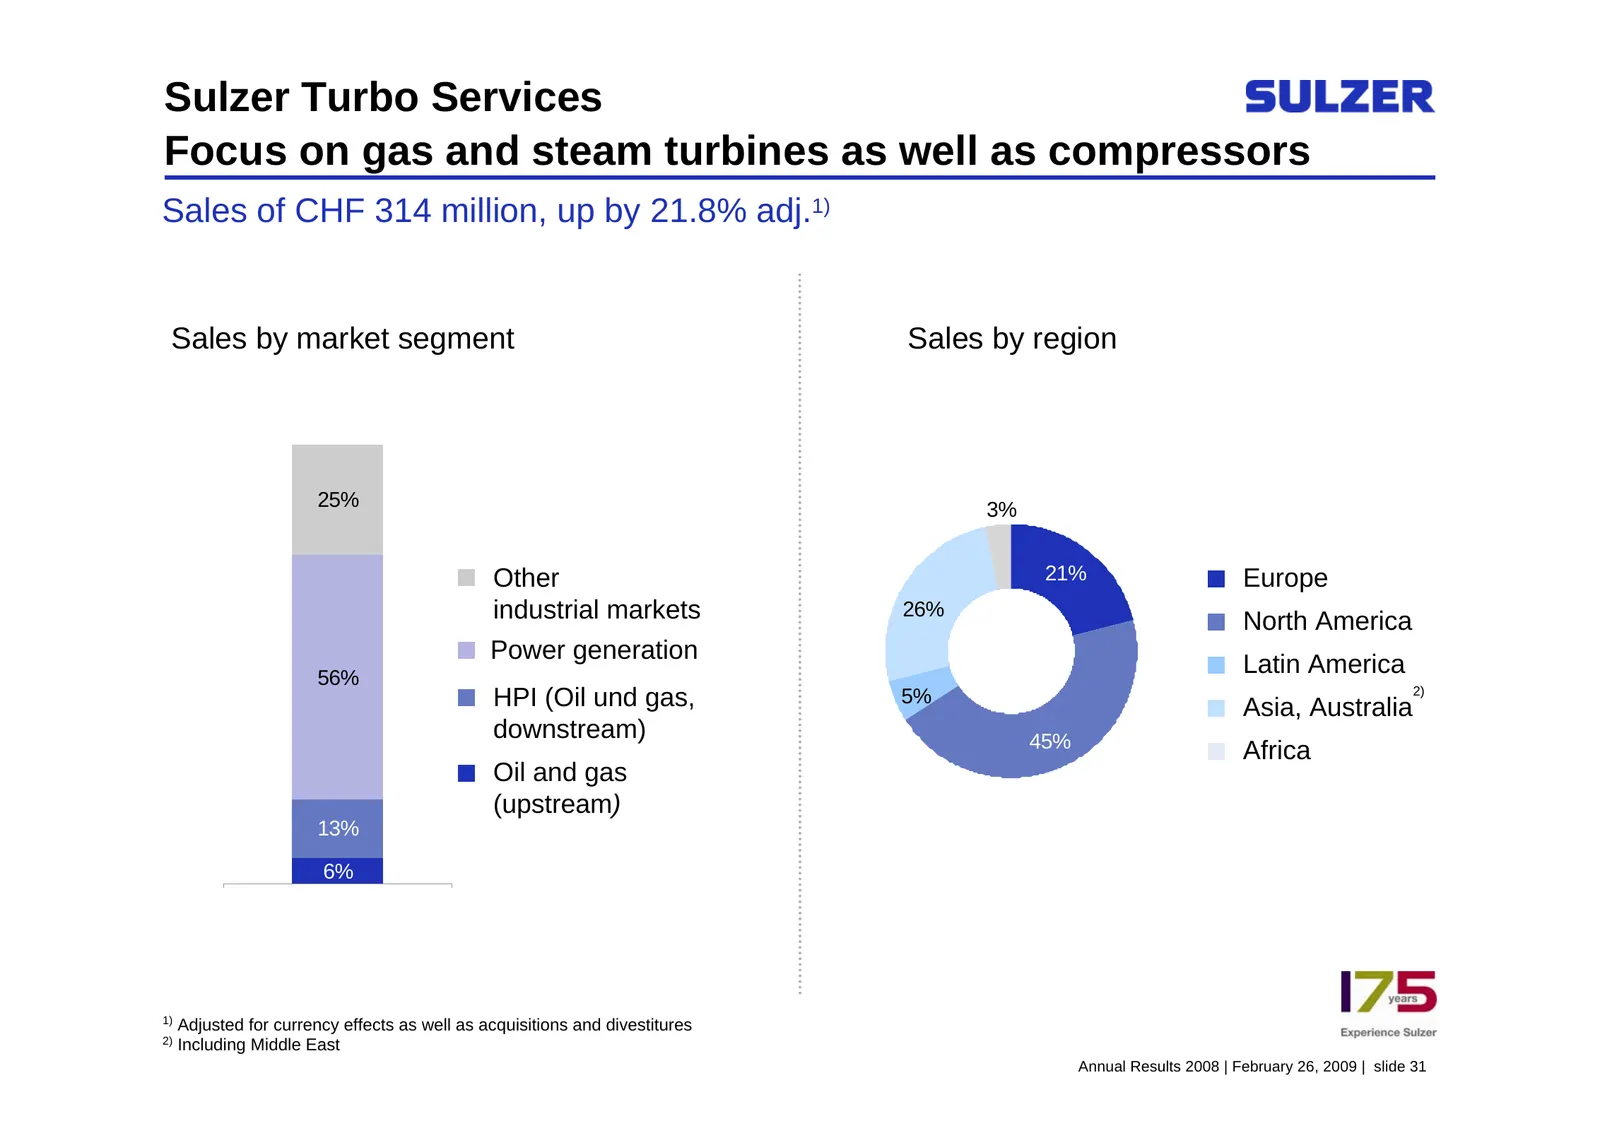
Sulzer Turbo Services Focus on gas and steam turbines as well as compressors Sales of CHF 314 million, up by 21.8% adj.1) Sales by market segment Sales by region 25% 3% Other 21% Europe industrial markets 26% North America Power generation 56% Latin America 2) HPI (Oil und gas, 5% Asia, Australia do
Slide 28: Agenda
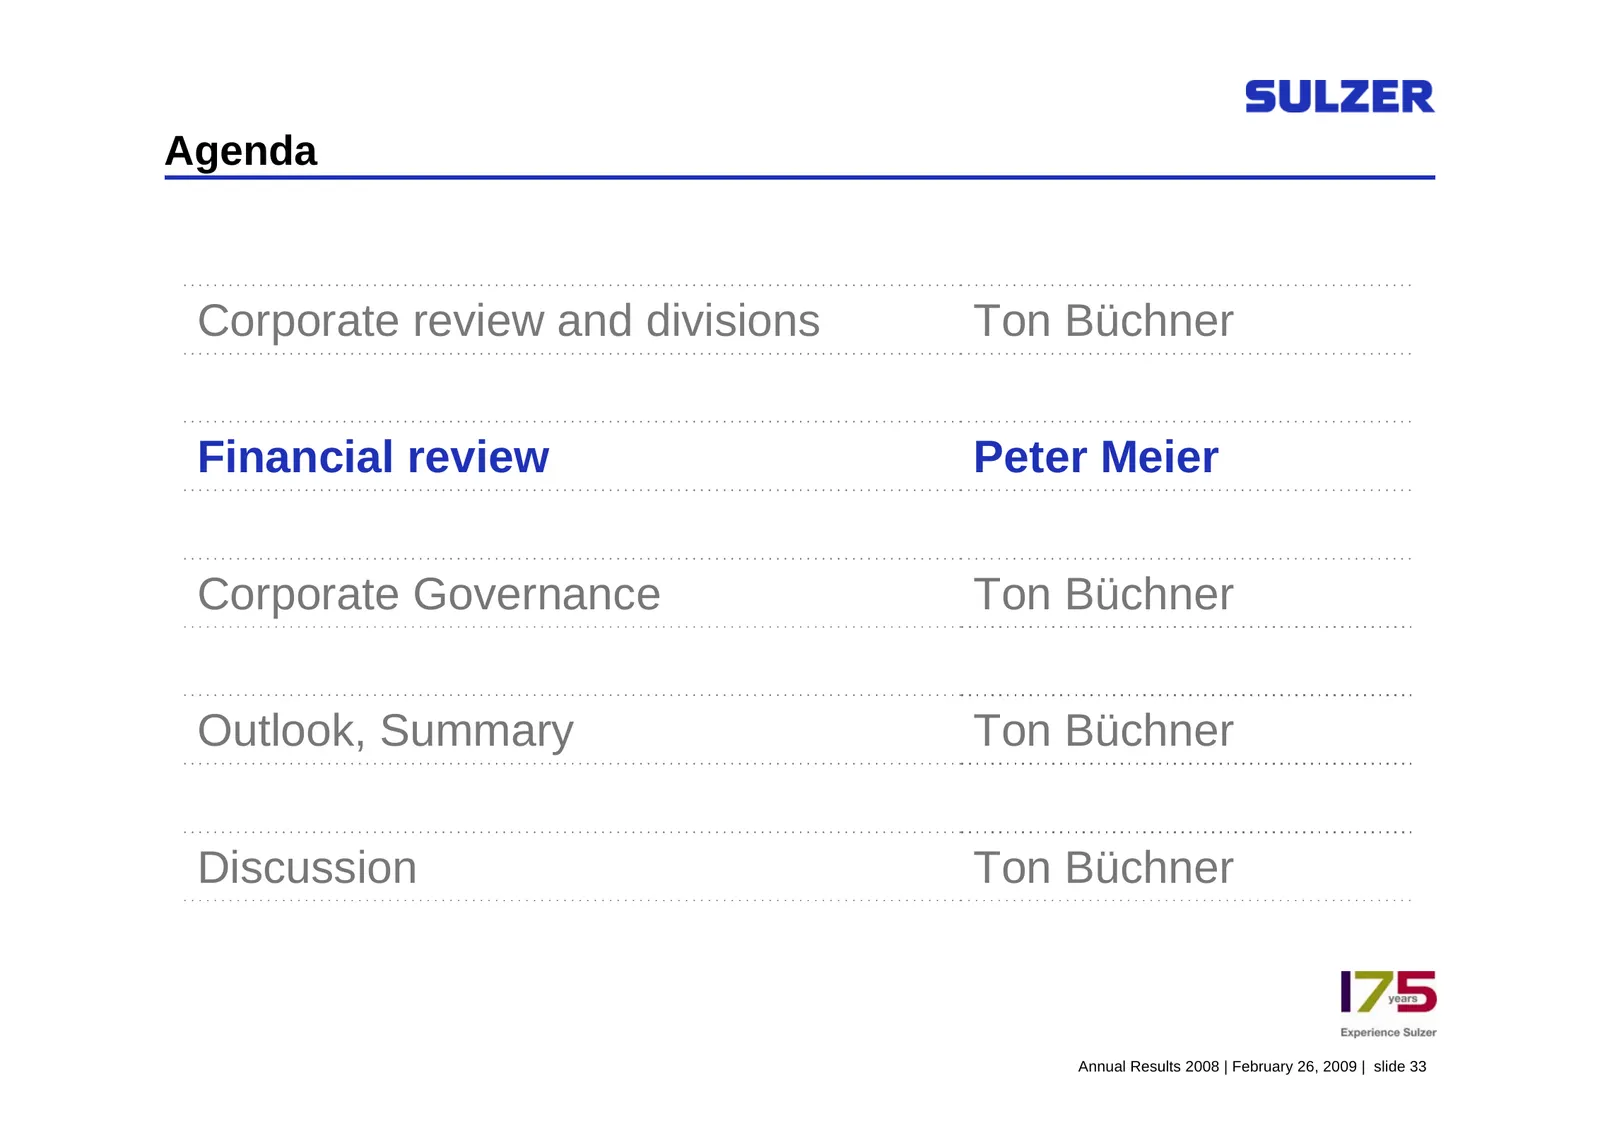
Agenda Corporate review and divisions Ton Büchner Financial review Peter Meier Corporate Governance Ton Büchner Outlook, Summary Ton Büchner Discussion Ton Büchner Annual Results 2008 | February 26, 2009 | slide 33
Slide 29: Financial review 2008
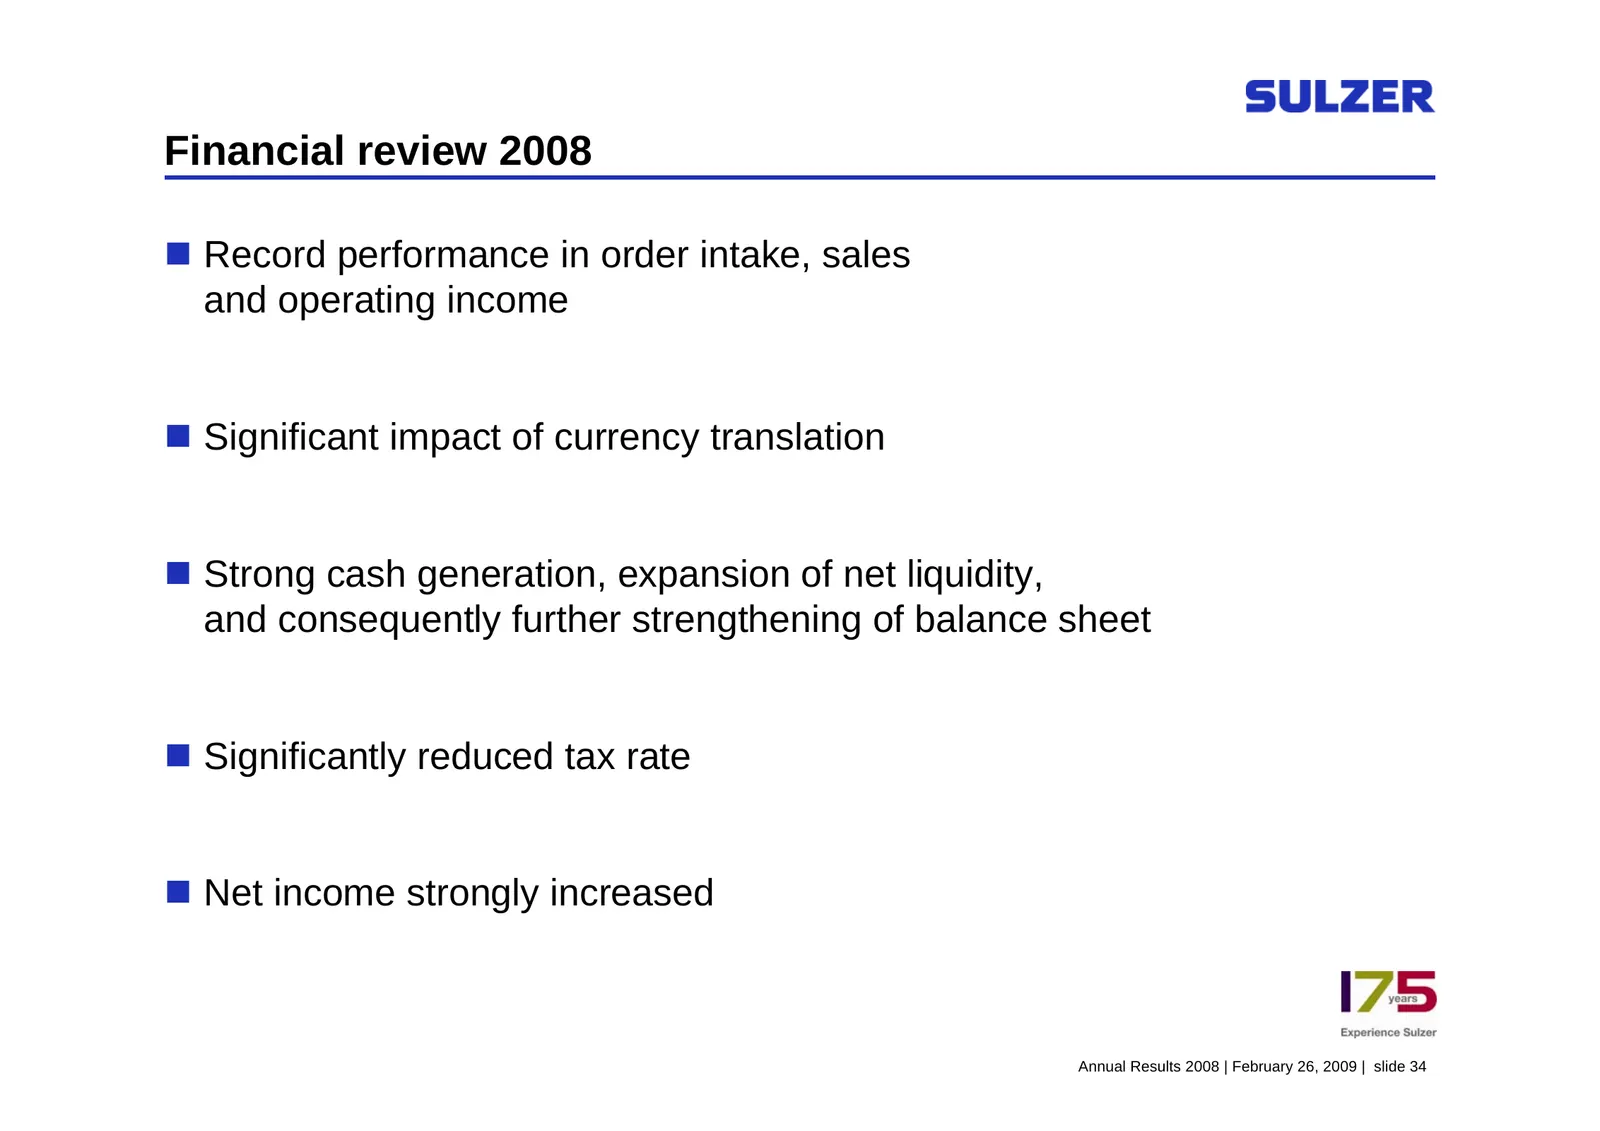
Financial review 2008 Record performance in order intake, sales and operating income Significant impact of currency translation Strong cash generation, expansion of net liquidity, and consequently further strengthening of balance sheet Significantly reduced tax rate Net income strongly inc
Slide 30: Continuous order intake and sales development
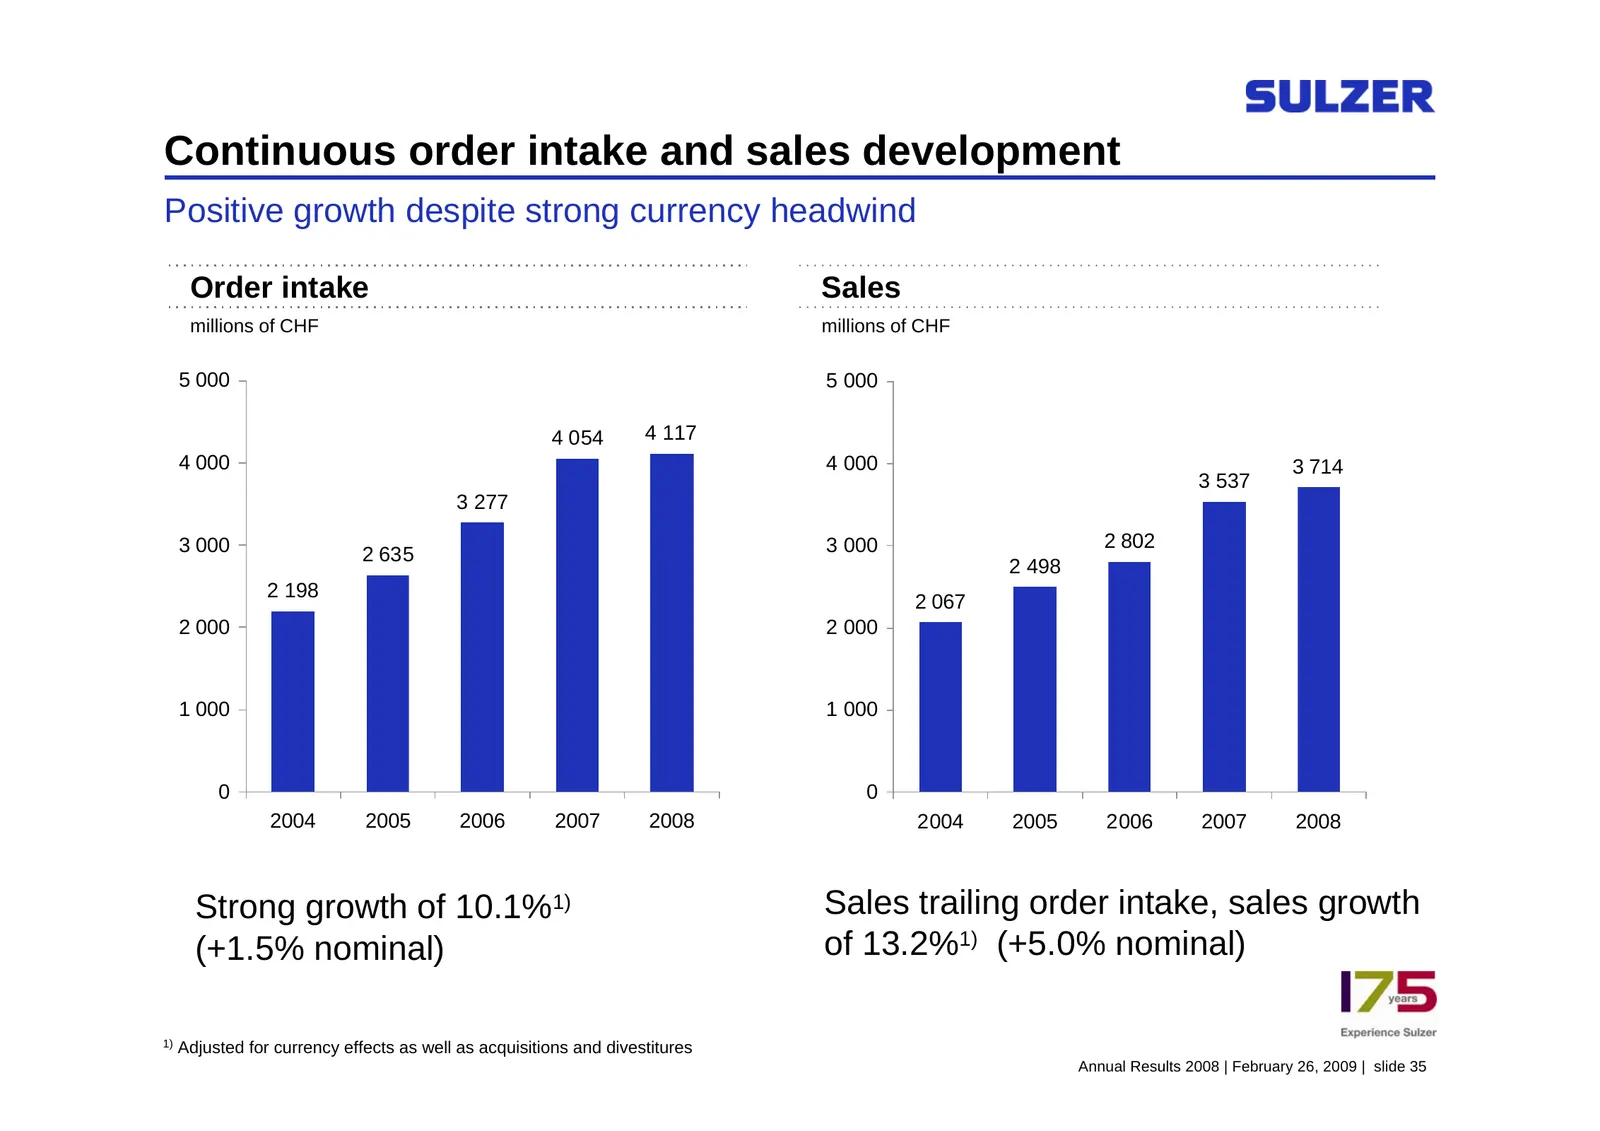
Continuous order intake and sales development Positive growth despite strong currency headwind Order intake Sales millions of CHF millions of CHF 5 000 5 000 4 054 4 117 4 000 4 000 3 714 3 537 3 277 3 000 3 000 2 802 2 635 2 498 2 198 2 067 2 000 2 000 1 000 1 000 0 0 2004 2005 2006 2007 2008 2004
Slide 31: Global presence paid off
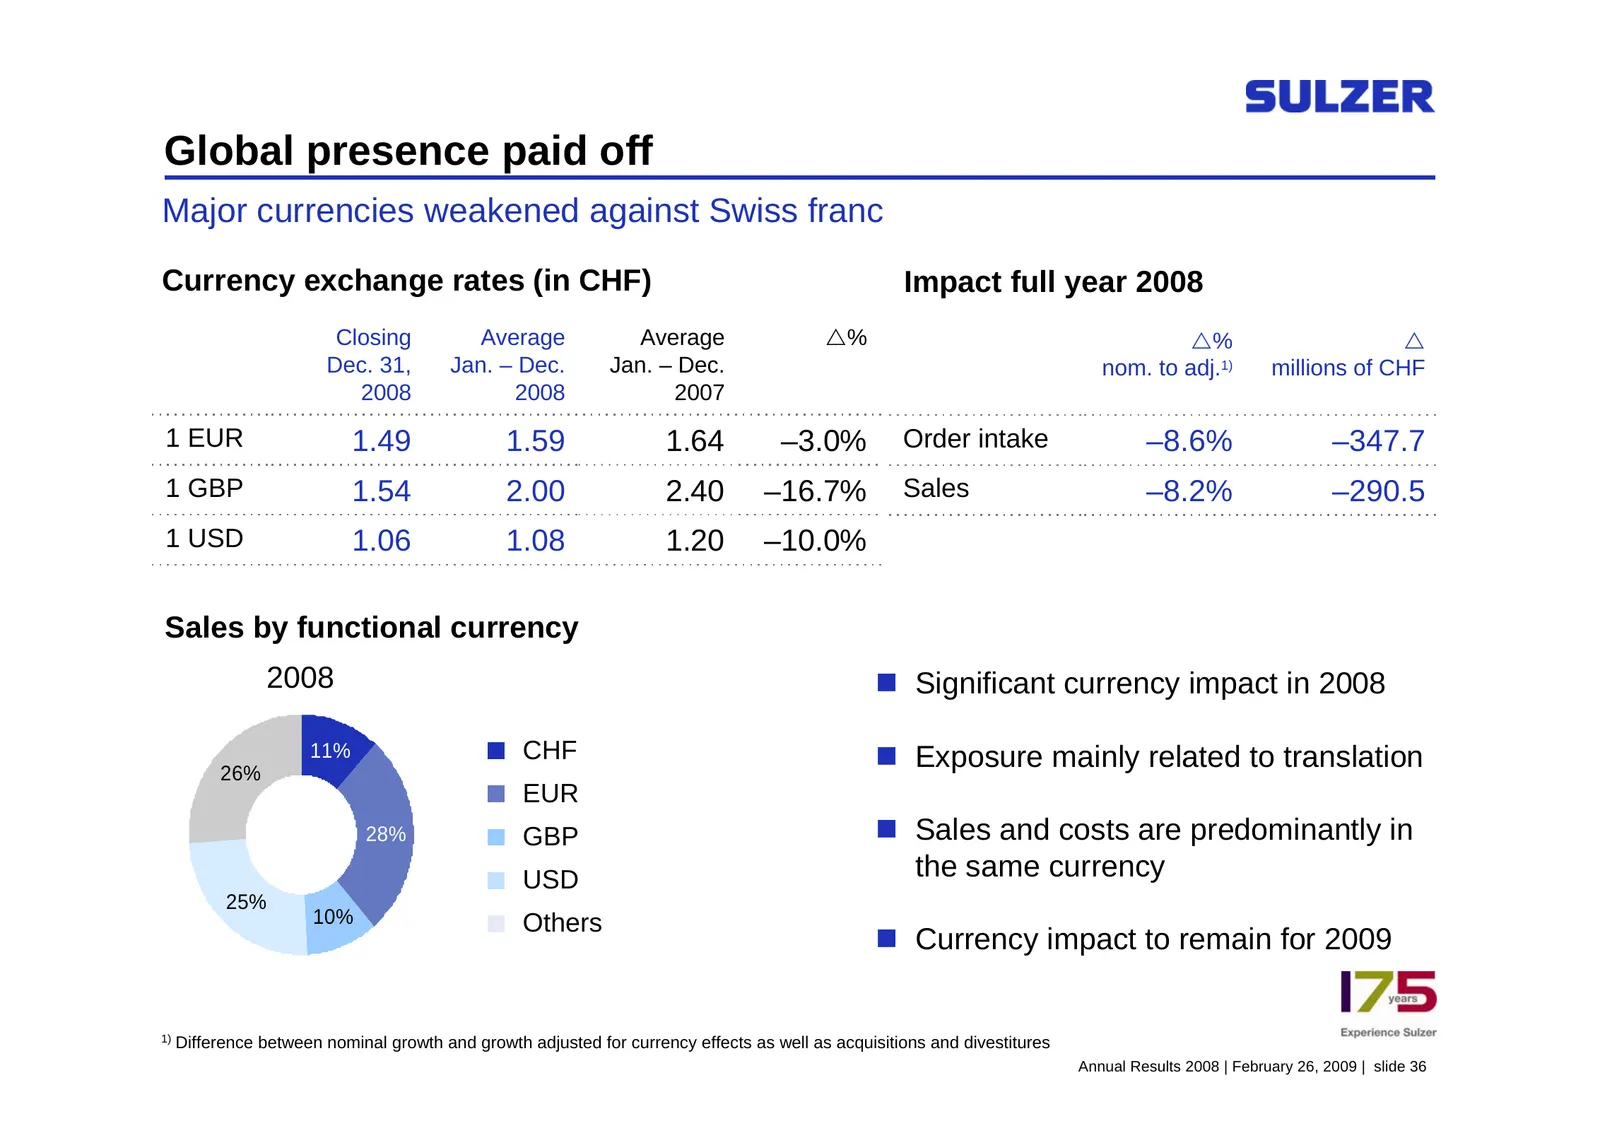
Global presence paid off Major currencies weakened against Swiss franc Currency exchange rates (in CHF) Impact full year 2008 Closing Average Average U% U% U Dec. 31, Jan. – Dec. Jan. – Dec. nom. to adj.1) millions of CHF 2008 2008 2007 1 EUR 1.49 1.59 1.64 –3.0% Order intake –8.6% –347.7 1 GBP 1.54
Slide 32: Strong increase in return on sales
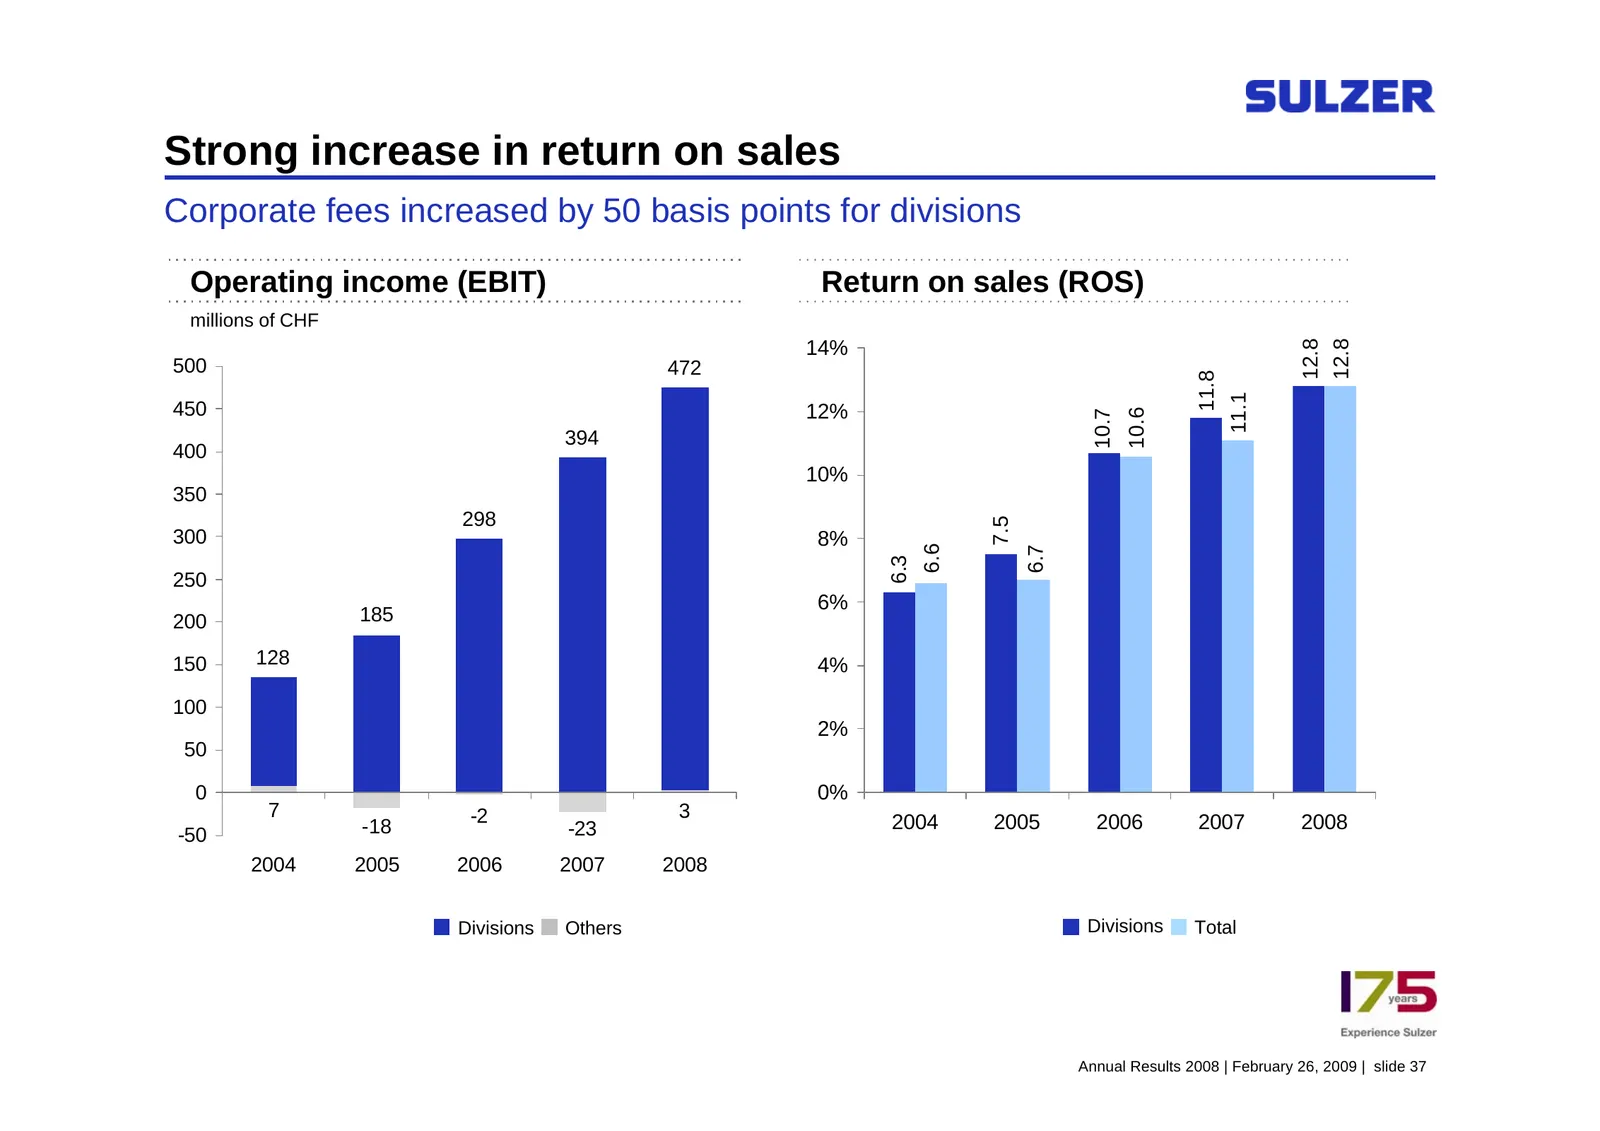
Strong increase in return on sales Corporate fees increased by 50 basis points for divisions Operating income (EBIT) Return on sales (ROS) millions of CHF 12.8 12.8 14% 500 472 11.8 11.1 450 12% 10.6 10.7 394 400 10% 350 298 7.5 300 8% 6.6 6.7 6.3 250 6% 200 185 150 128 4% 100 2% 50 0 0% 7 -2 3 -18
Slide 33: Operating improvements driven by the divisions
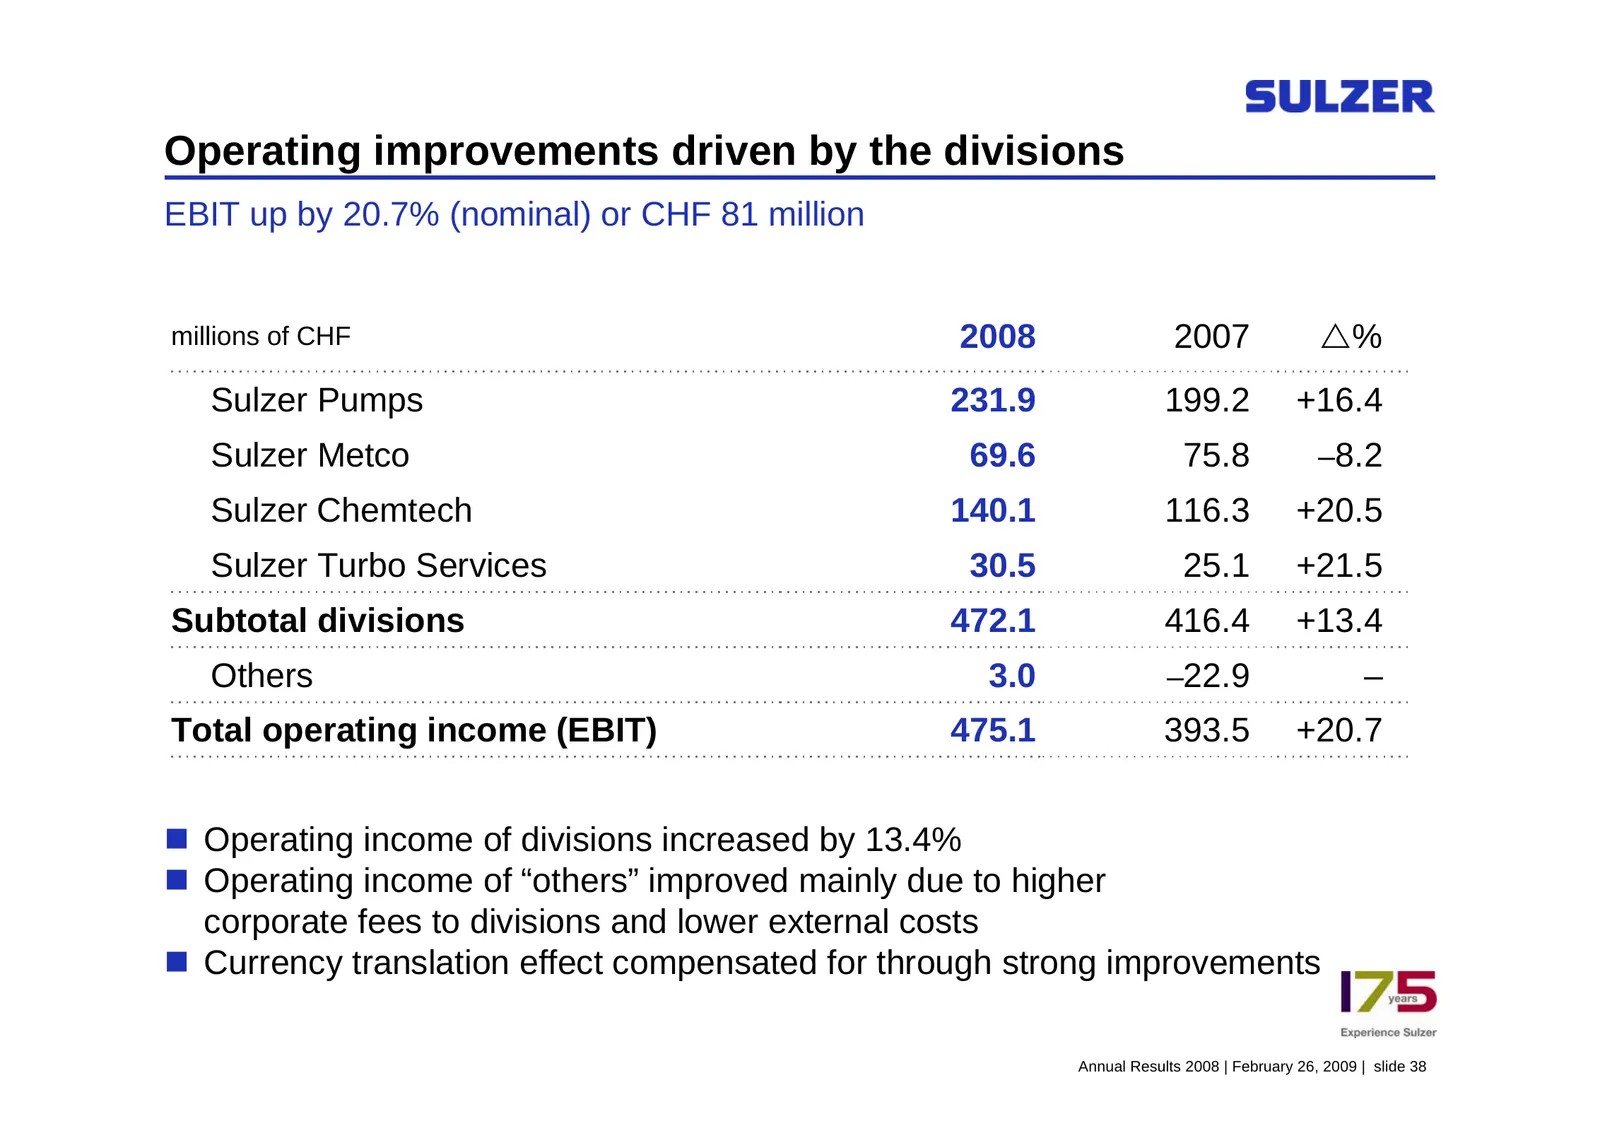
Operating improvements driven by the divisions EBIT up by 20.7% (nominal) or CHF 81 million millions of CHF 2008 2007 U% Sulzer Pumps 231.9 199.2 +16.4 Sulzer Metco 69.6 75.8 –8.2 Sulzer Chemtech 140.1 116.3 +20.5 Sulzer Turbo Services 30.5 25.1 +21.5 Subtotal divisions 472.1 416.4 +13.4 Others 3.0
Slide 34: Others
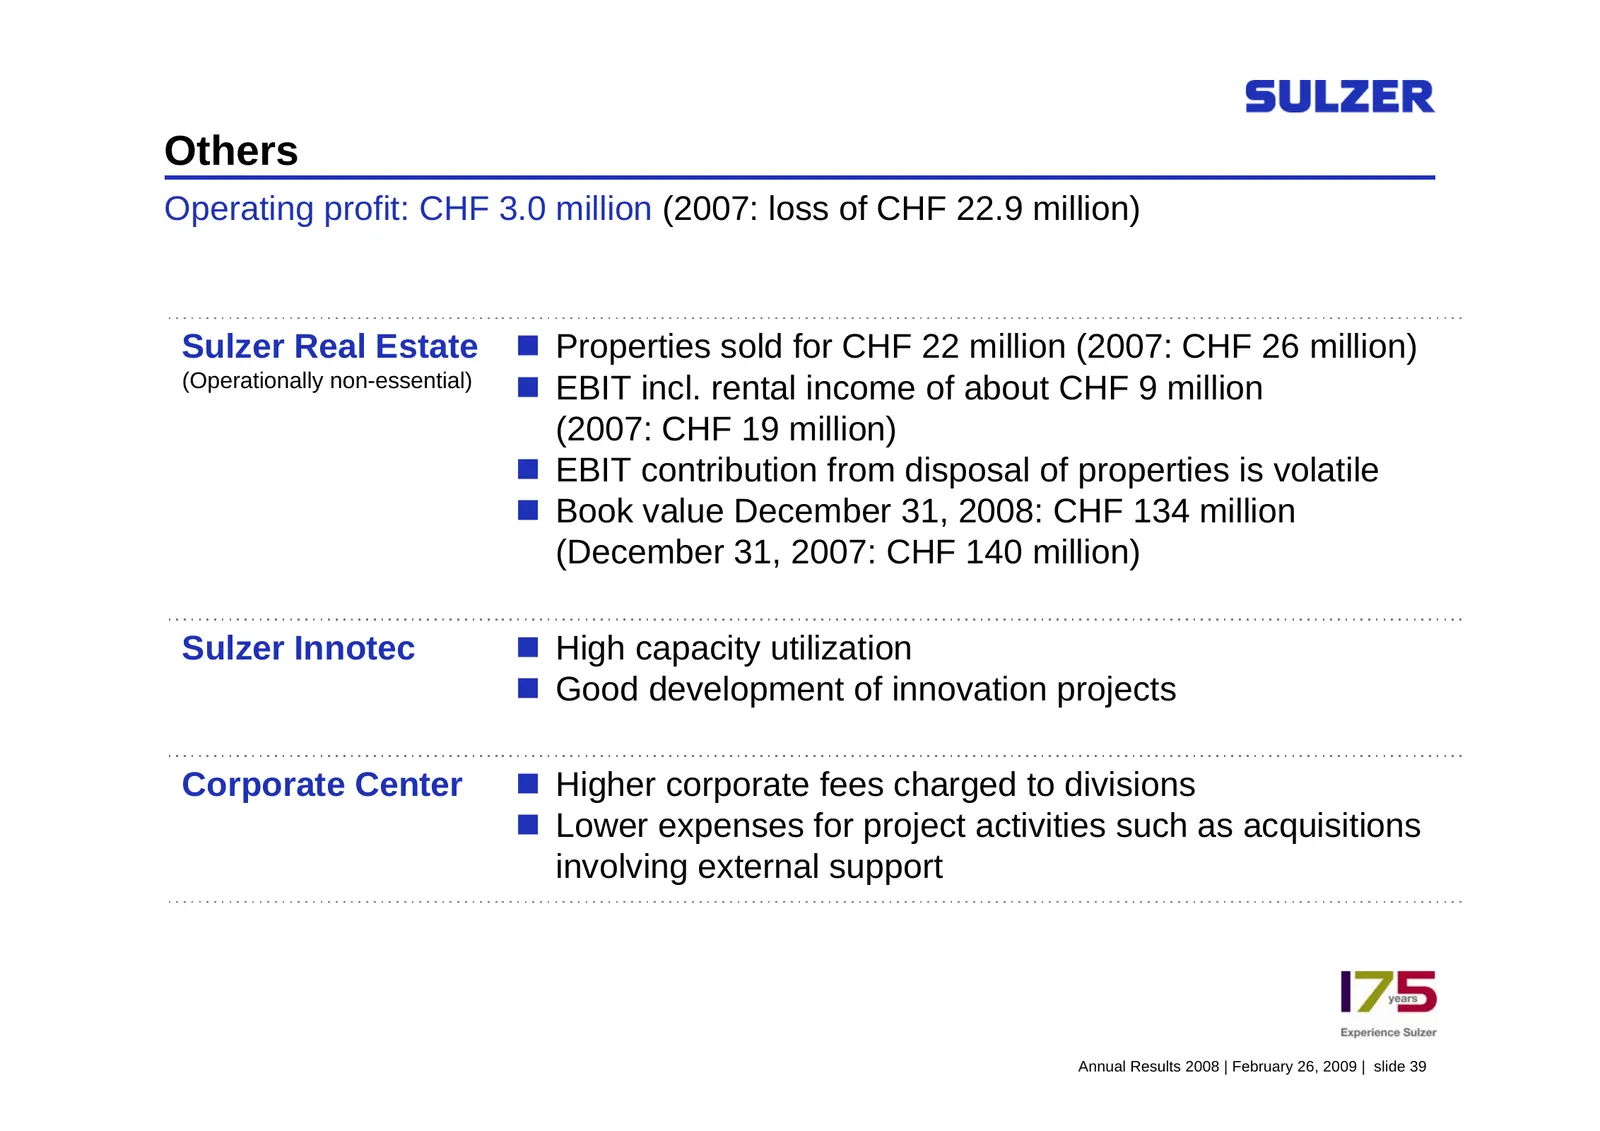
Others Operating profit: CHF 3.0 million (2007: loss of CHF 22.9 million) Sulzer Real Estate Properties sold for CHF 22 million (2007: CHF 26 million) (Operationally non-essential) EBIT incl. rental income of about CHF 9 million (2007: CHF 19 million) EBIT contribution from disposal of propert
Slide 35: Below the EBIT line
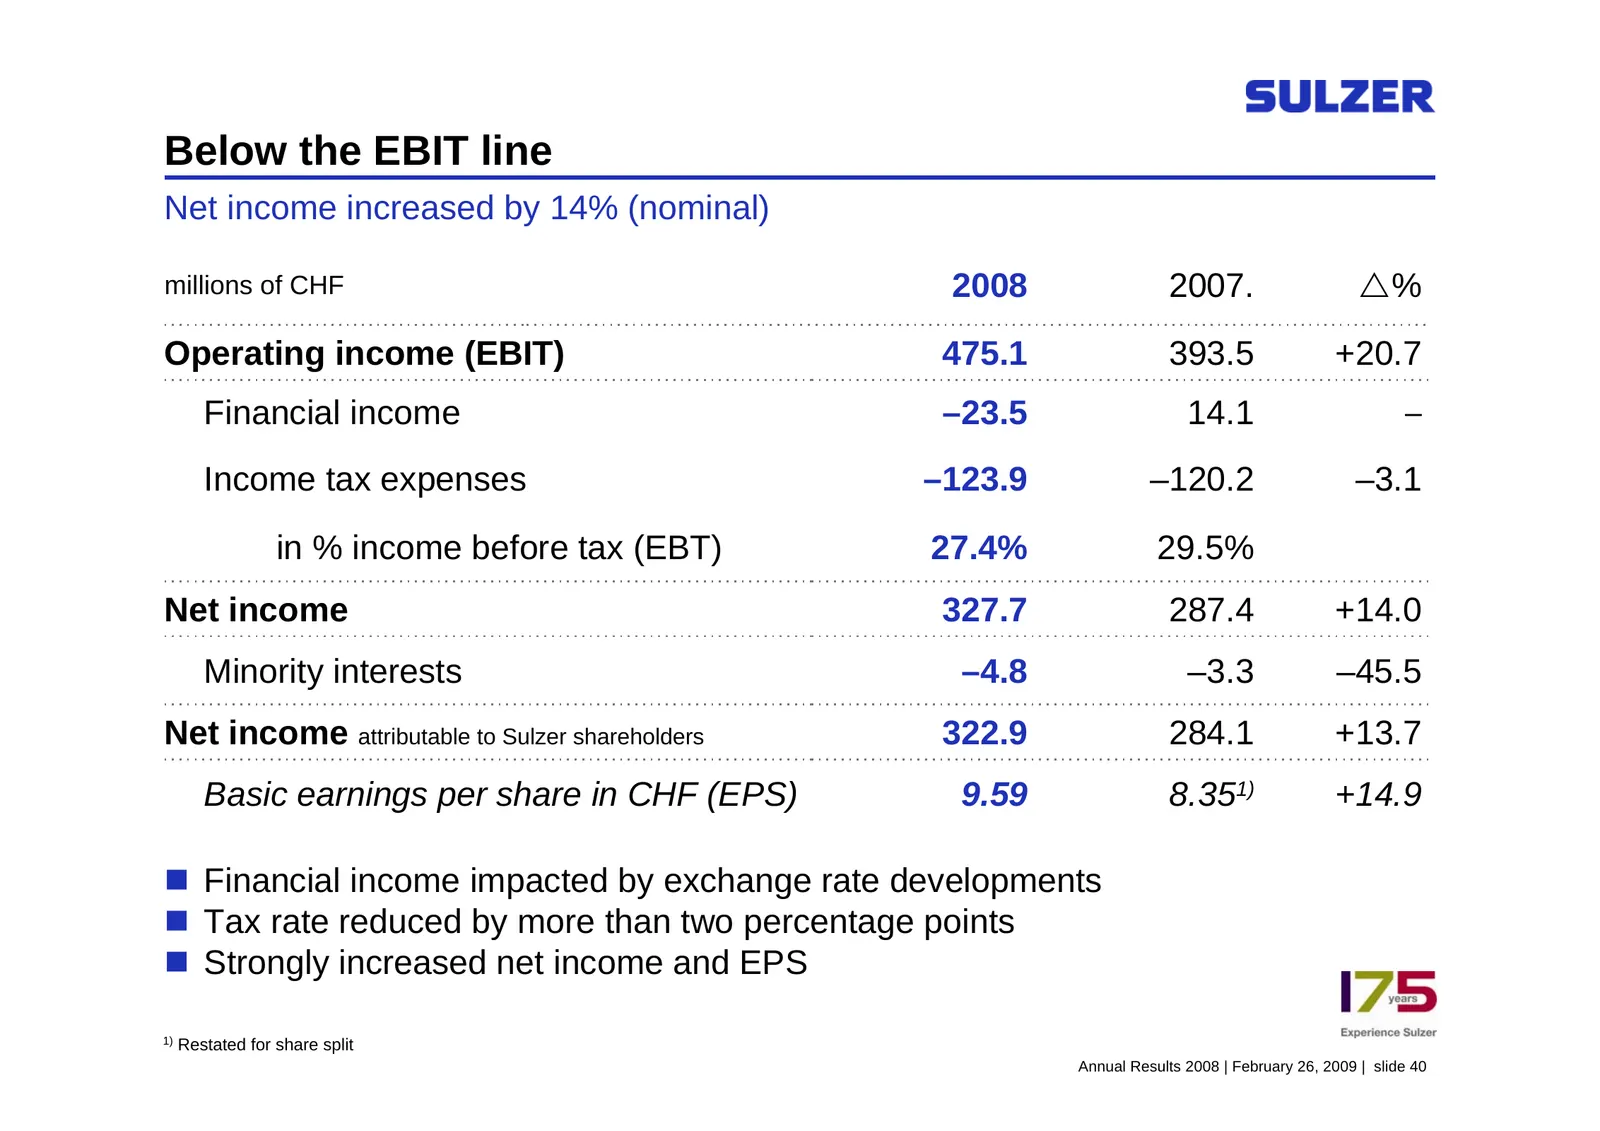
Below the EBIT line Net income increased by 14% (nominal) millions of CHF 2008 2007. U% Operating income (EBIT) 475.1 393.5 +20.7 Financial income –23.5 14.1 – Income tax expenses –123.9 –120.2 –3.1 in % income before tax (EBT) 27.4% 29.5% Net income 327.7 287.4 +14.0 Minority interests –4.8 –3.3 –4
Slide 36: Strong cash flow generation
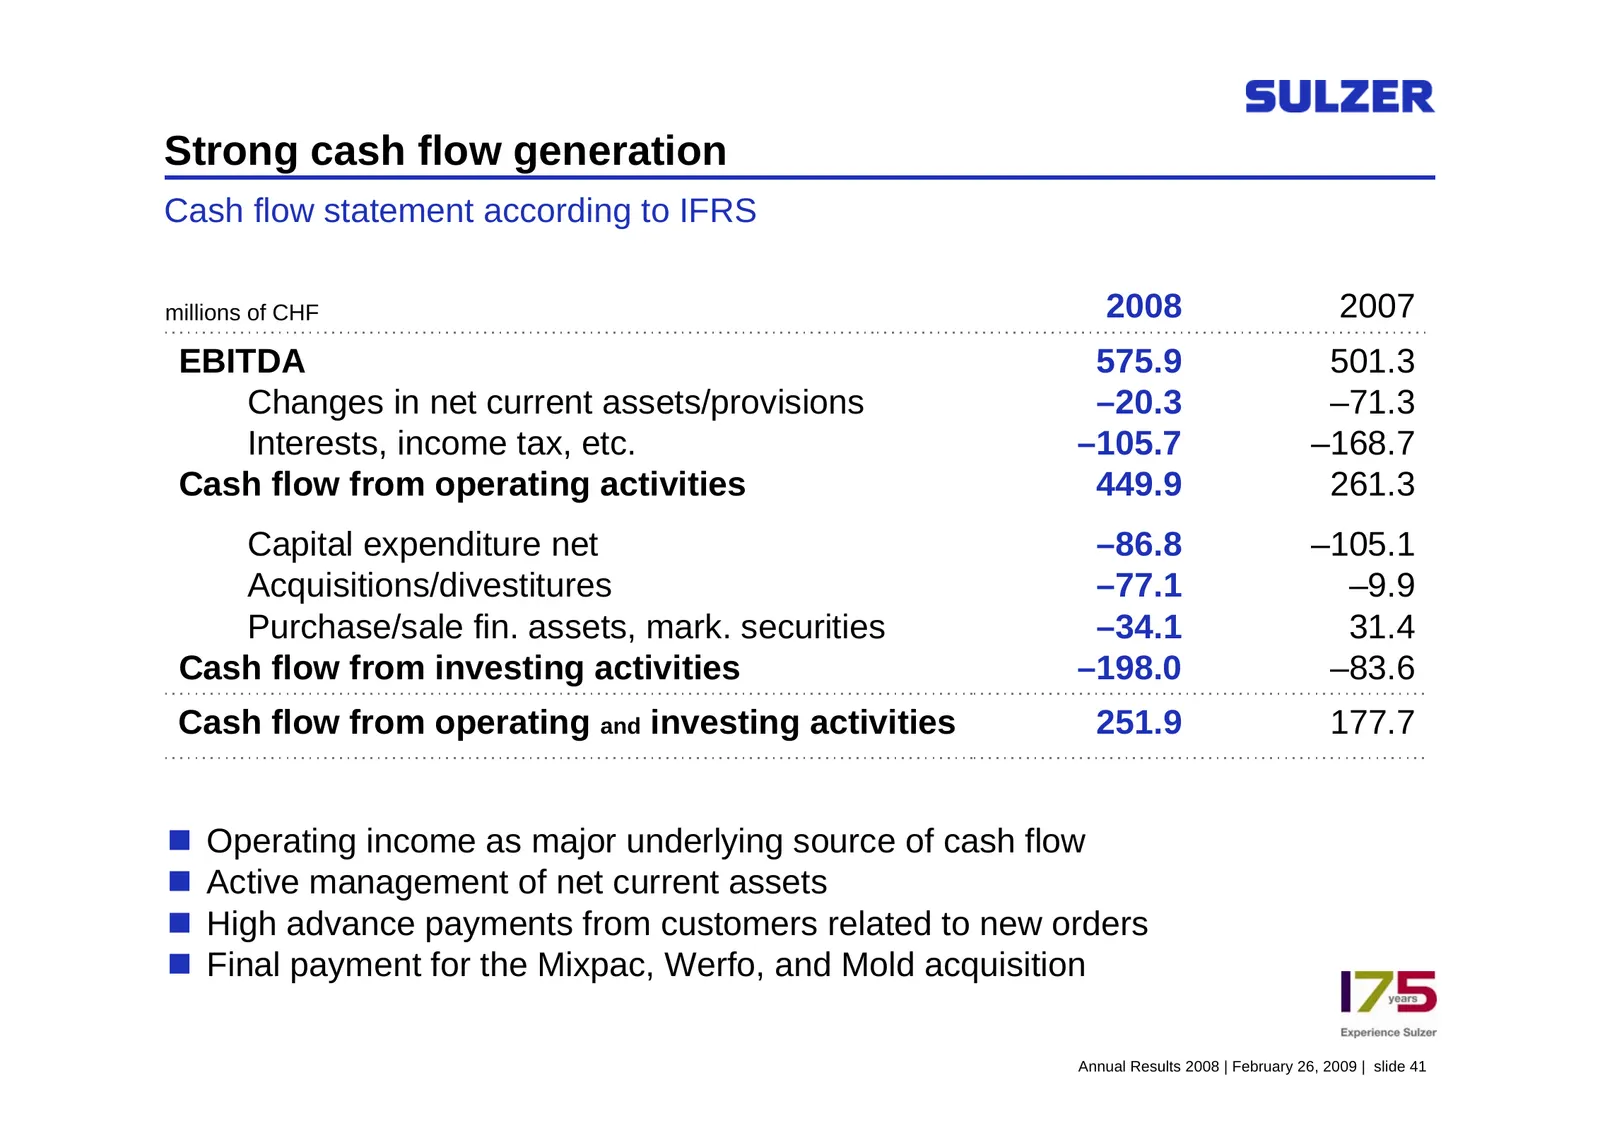
Strong cash flow generation Cash flow statement according to IFRS millions of CHF 2008 2007 EBITDA 575.9 501.3 Changes in net current assets/provisions –20.3 –71.3 Interests, income tax, etc. –105.7 –168.7 Cash flow from operating activities 449.9 261.3 Capital expenditure net –86.8 –105.1 Acquisiti
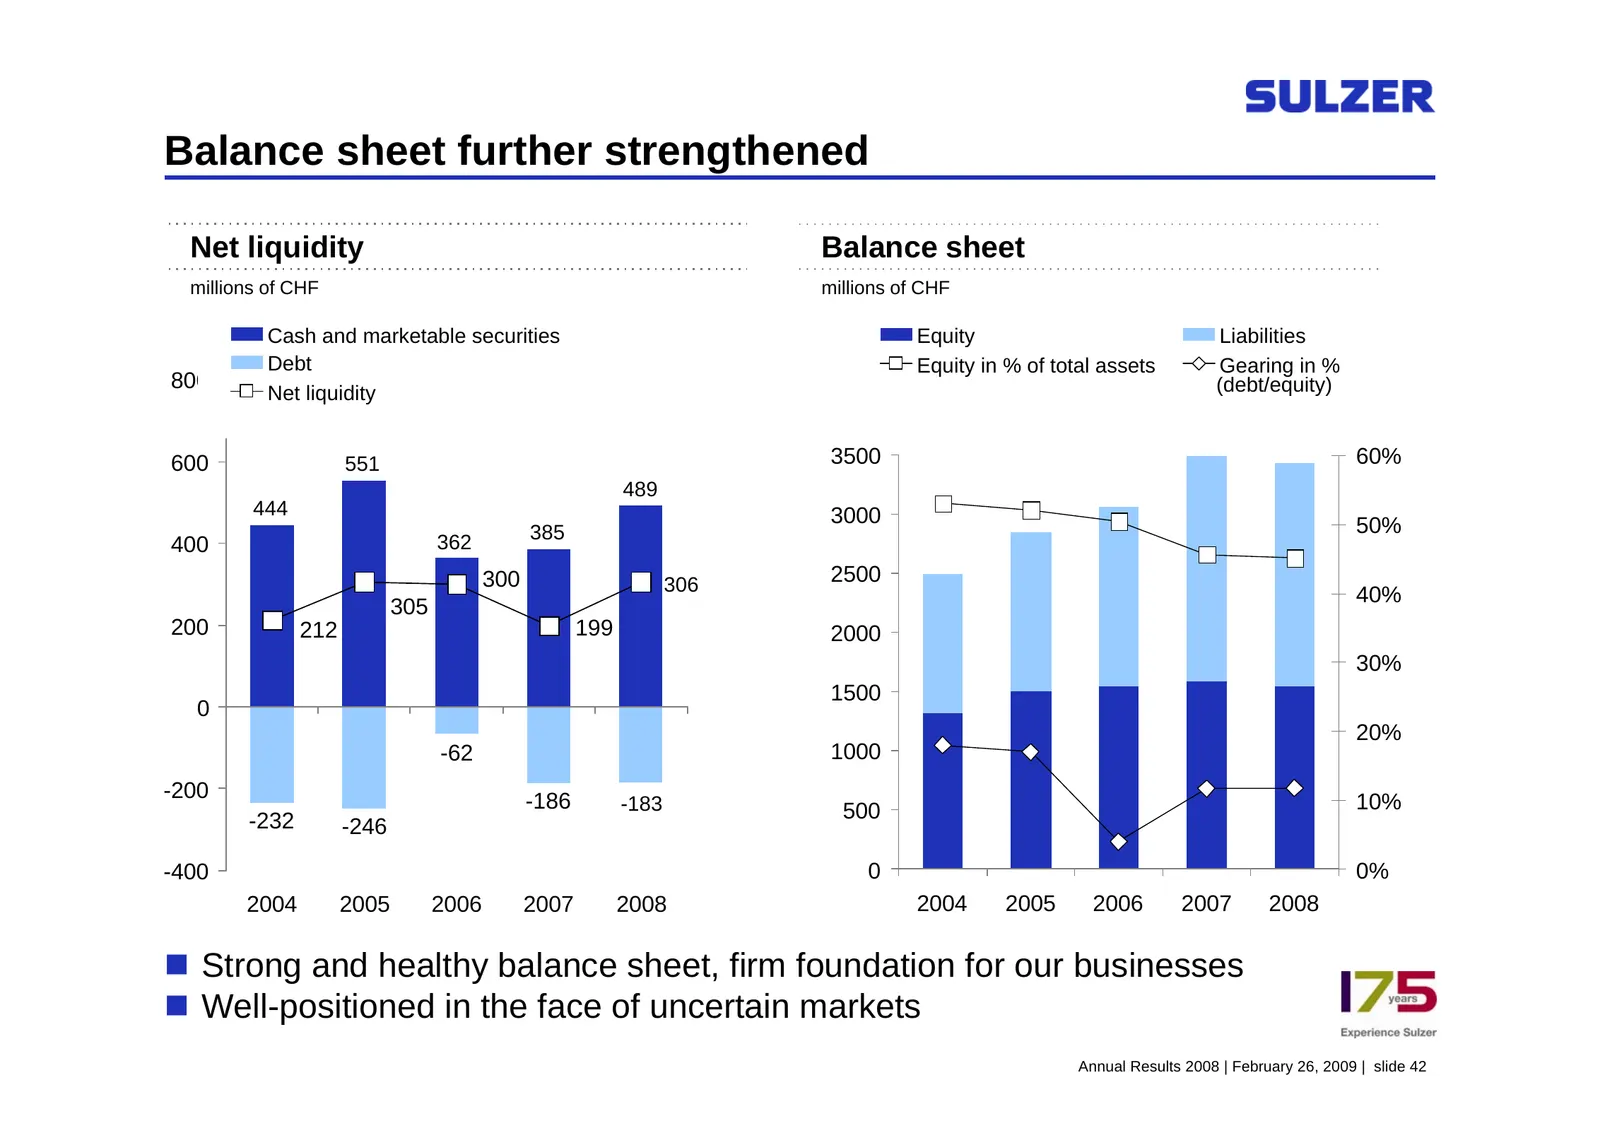
Slide 37: Balance sheet further strengthened
Balance sheet further strengthened Net liquidity Balance sheet millions of CHF millions of CHF Cash and marketable securities Equity Liabilities Debt Equity in % of total assets Gearing in % 800 Net liquidity (debt/equity) 600 551 3500 60% 489 444 3000 385 50% 400 362 300 306 2500 40% 305 200 212 19
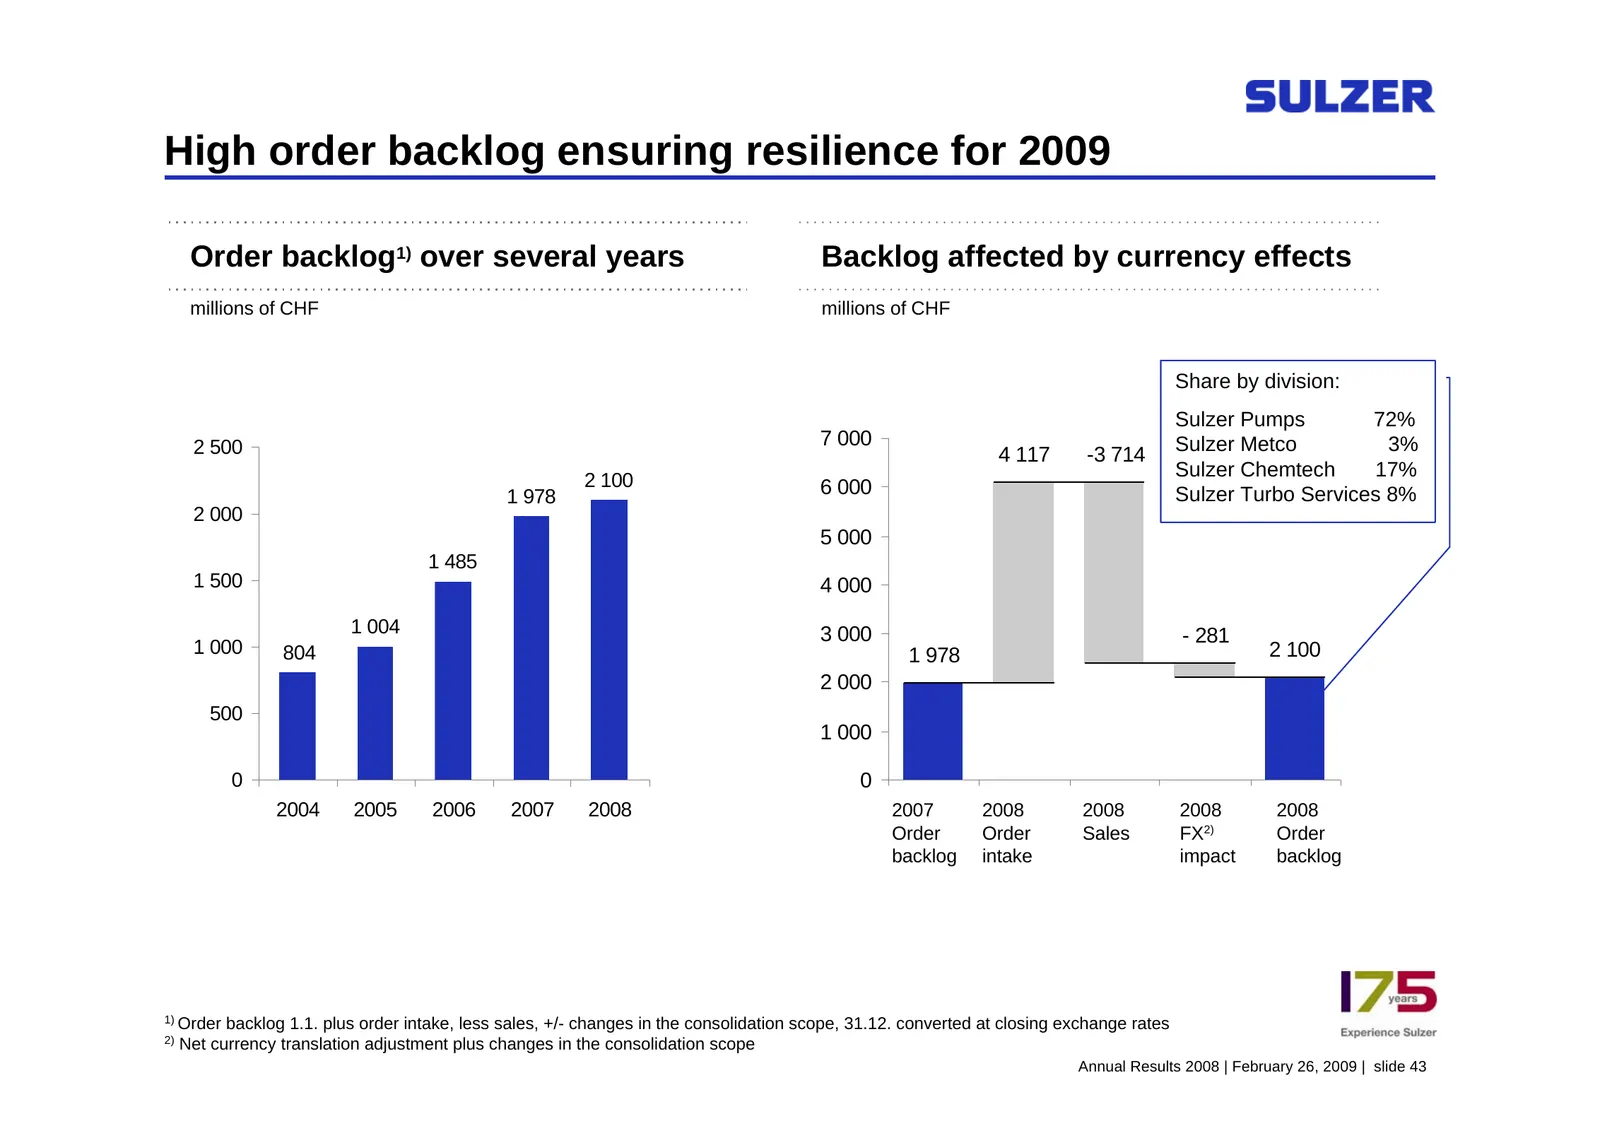
Slide 38: High order backlog ensuring resilience for 2009
High order backlog ensuring resilience for 2009 Order backlog1) over several years Backlog affected by currency effects millions of CHF millions of CHF Share by division: Sulzer Pumps 72% 2 500 7 000 Sulzer Metco 3% 4 117 -3 714 2 100 Sulzer Chemtech 17% 1 978 6 000 Sulzer Turbo Services 8% 2 000 5
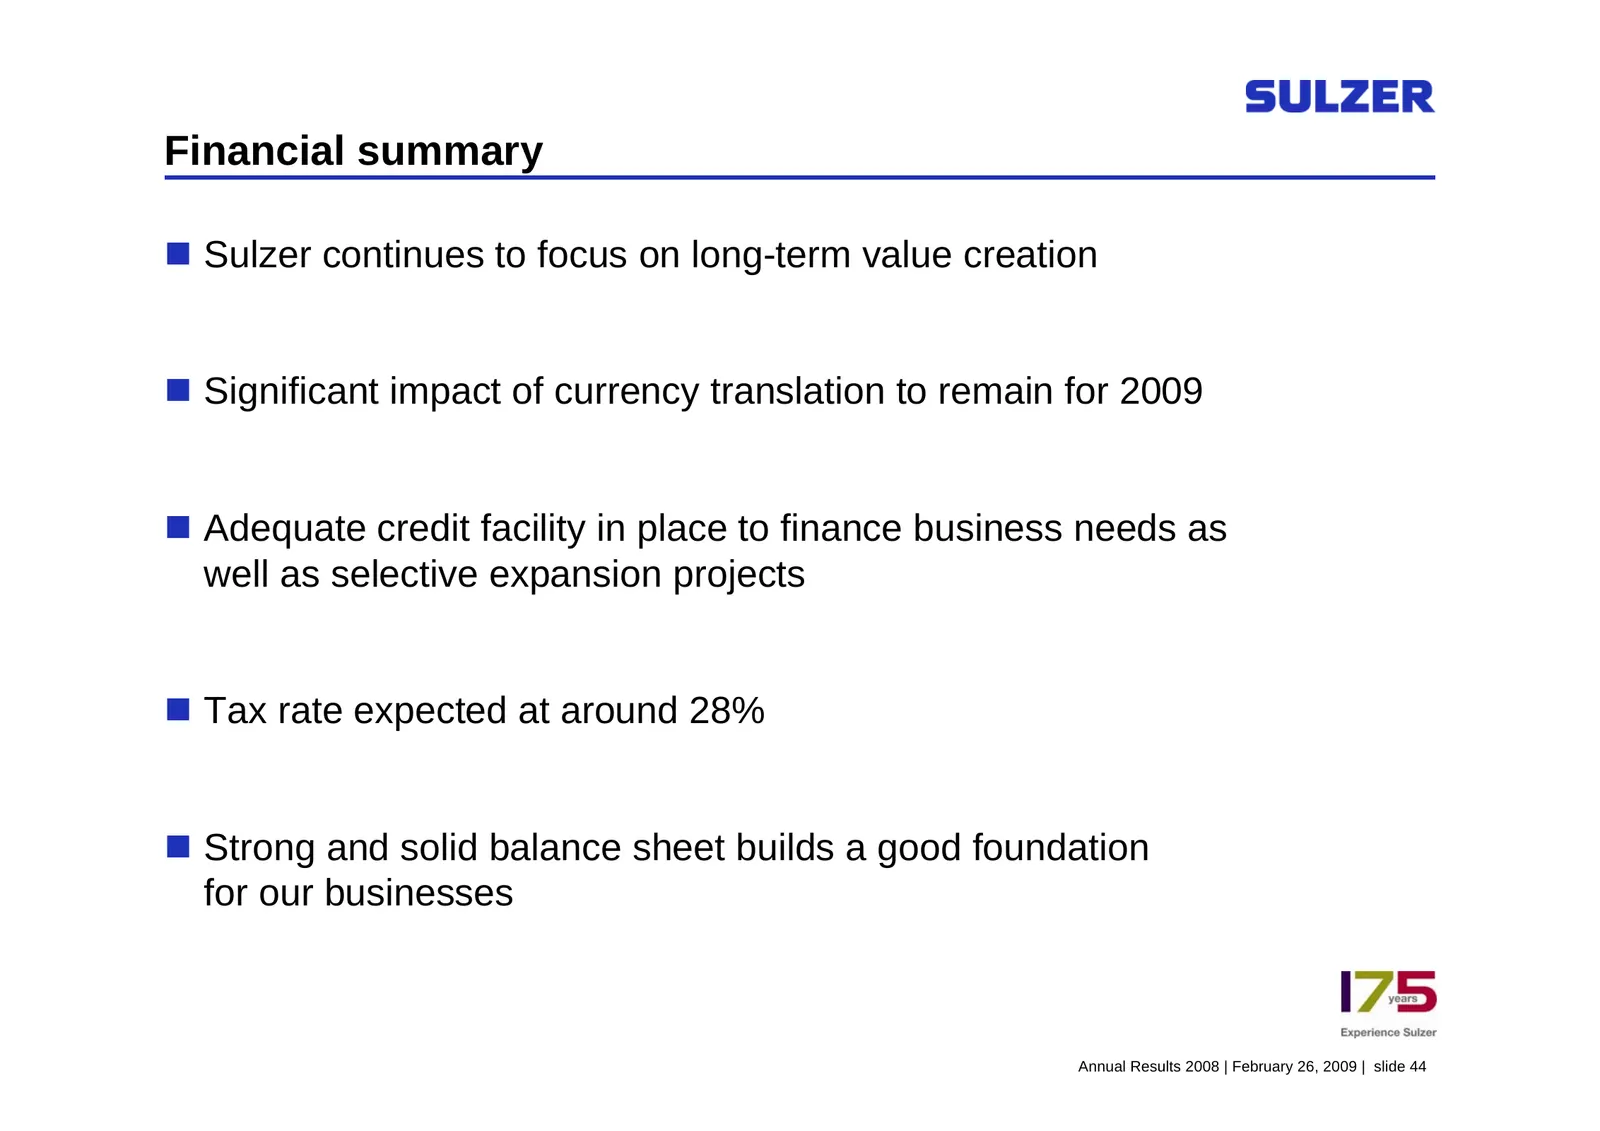
Slide 39: Financial summary
Financial summary Sulzer continues to focus on long-term value creation Significant impact of currency translation to remain for 2009 Adequate credit facility in place to finance business needs as well as selective expansion projects Tax rate expected at around 28% Strong and solid balance
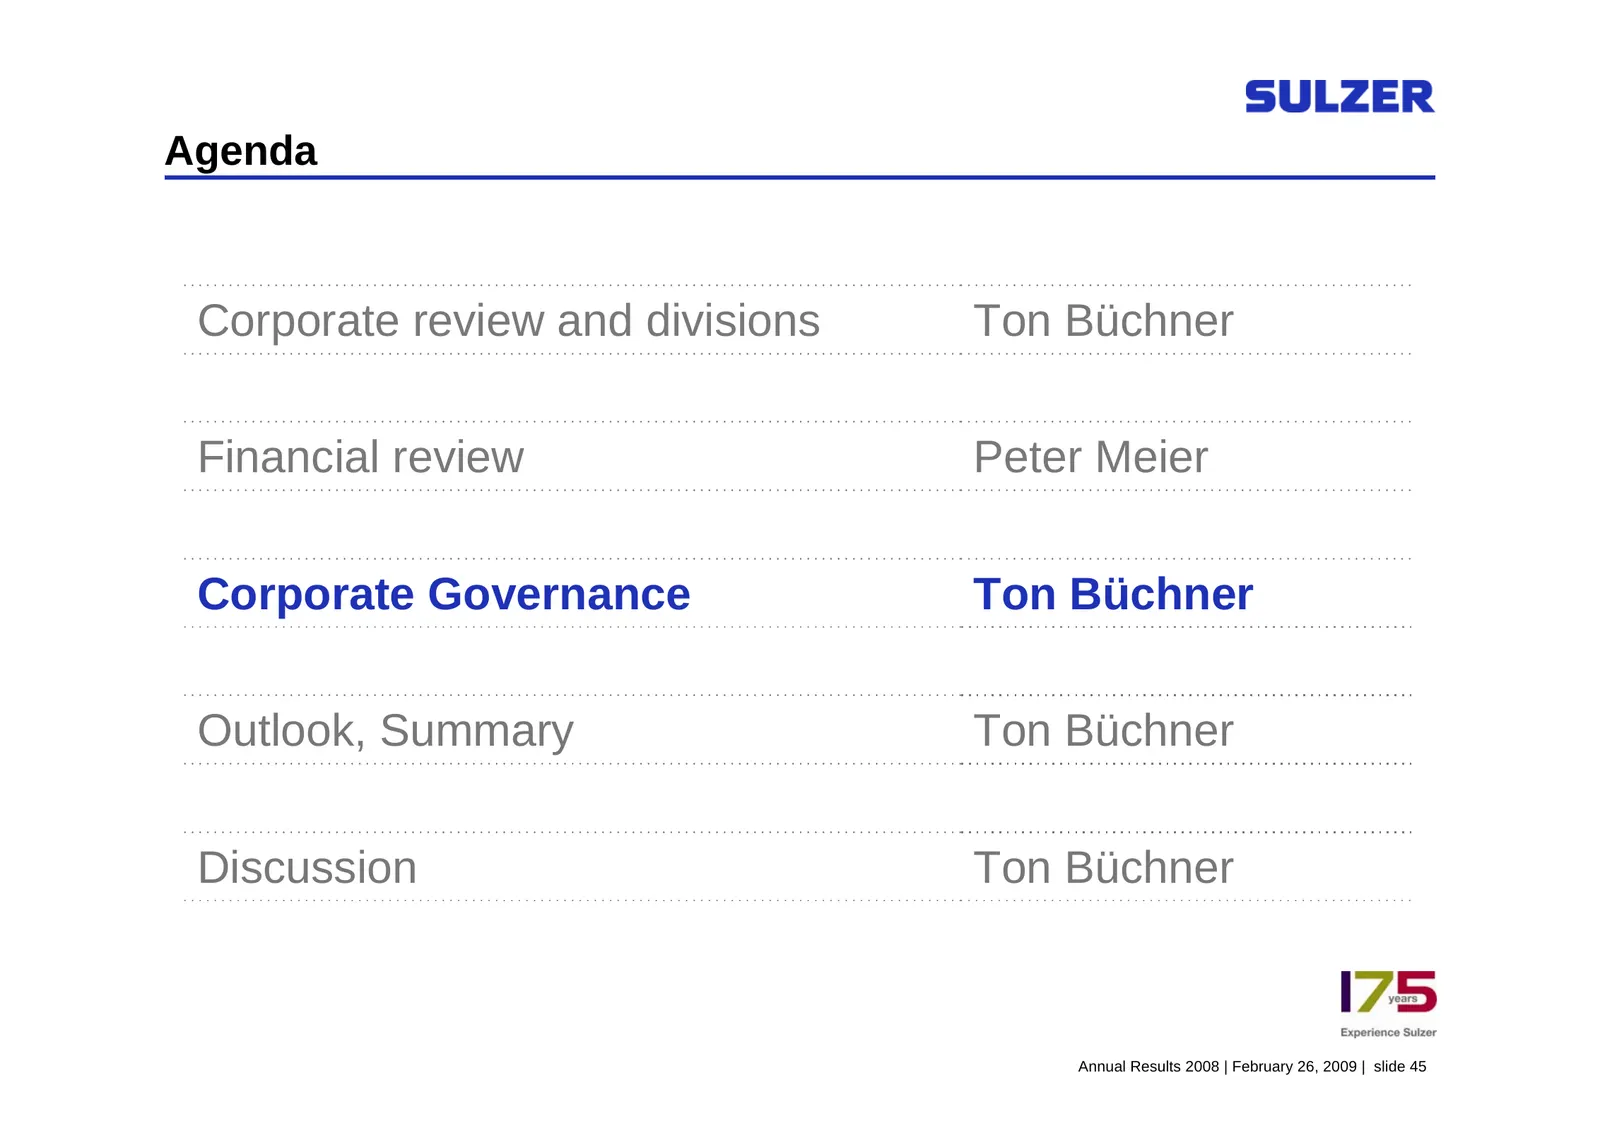
Slide 40: Agenda
Agenda Corporate review and divisions Ton Büchner Financial review Peter Meier Corporate Governance Ton Büchner Outlook, Summary Ton Büchner Discussion Ton Büchner Annual Results 2008 | February 26, 2009 | slide 45
Slide 41: Shareholding structure as of December 31, 2008
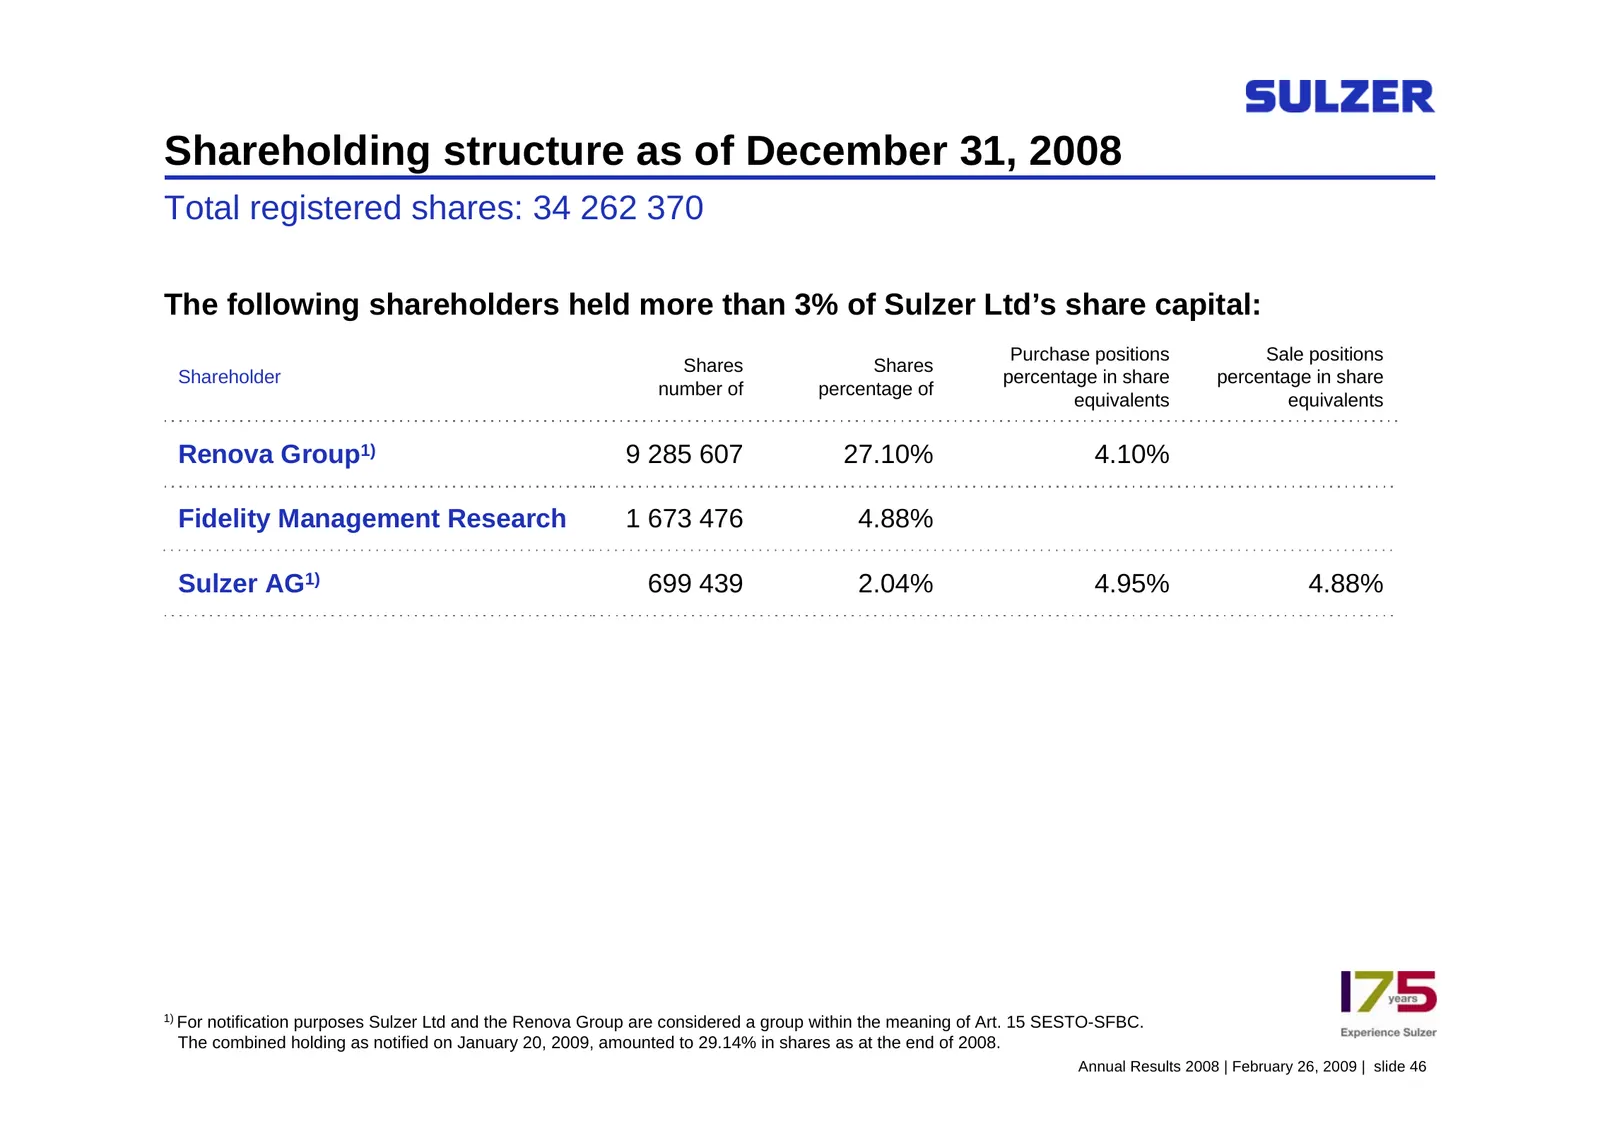
Shareholding structure as of December 31, 2008 Total registered shares: 34 262 370 The following shareholders held more than 3% of Sulzer Ltd’s share capital: Purchase positions Sale positions Shares Shares Shareholder percentage in share percentage in share number of percentage of equivalents equiv
Slide 42: EBK/FINMA proceedings concerning Sulzer
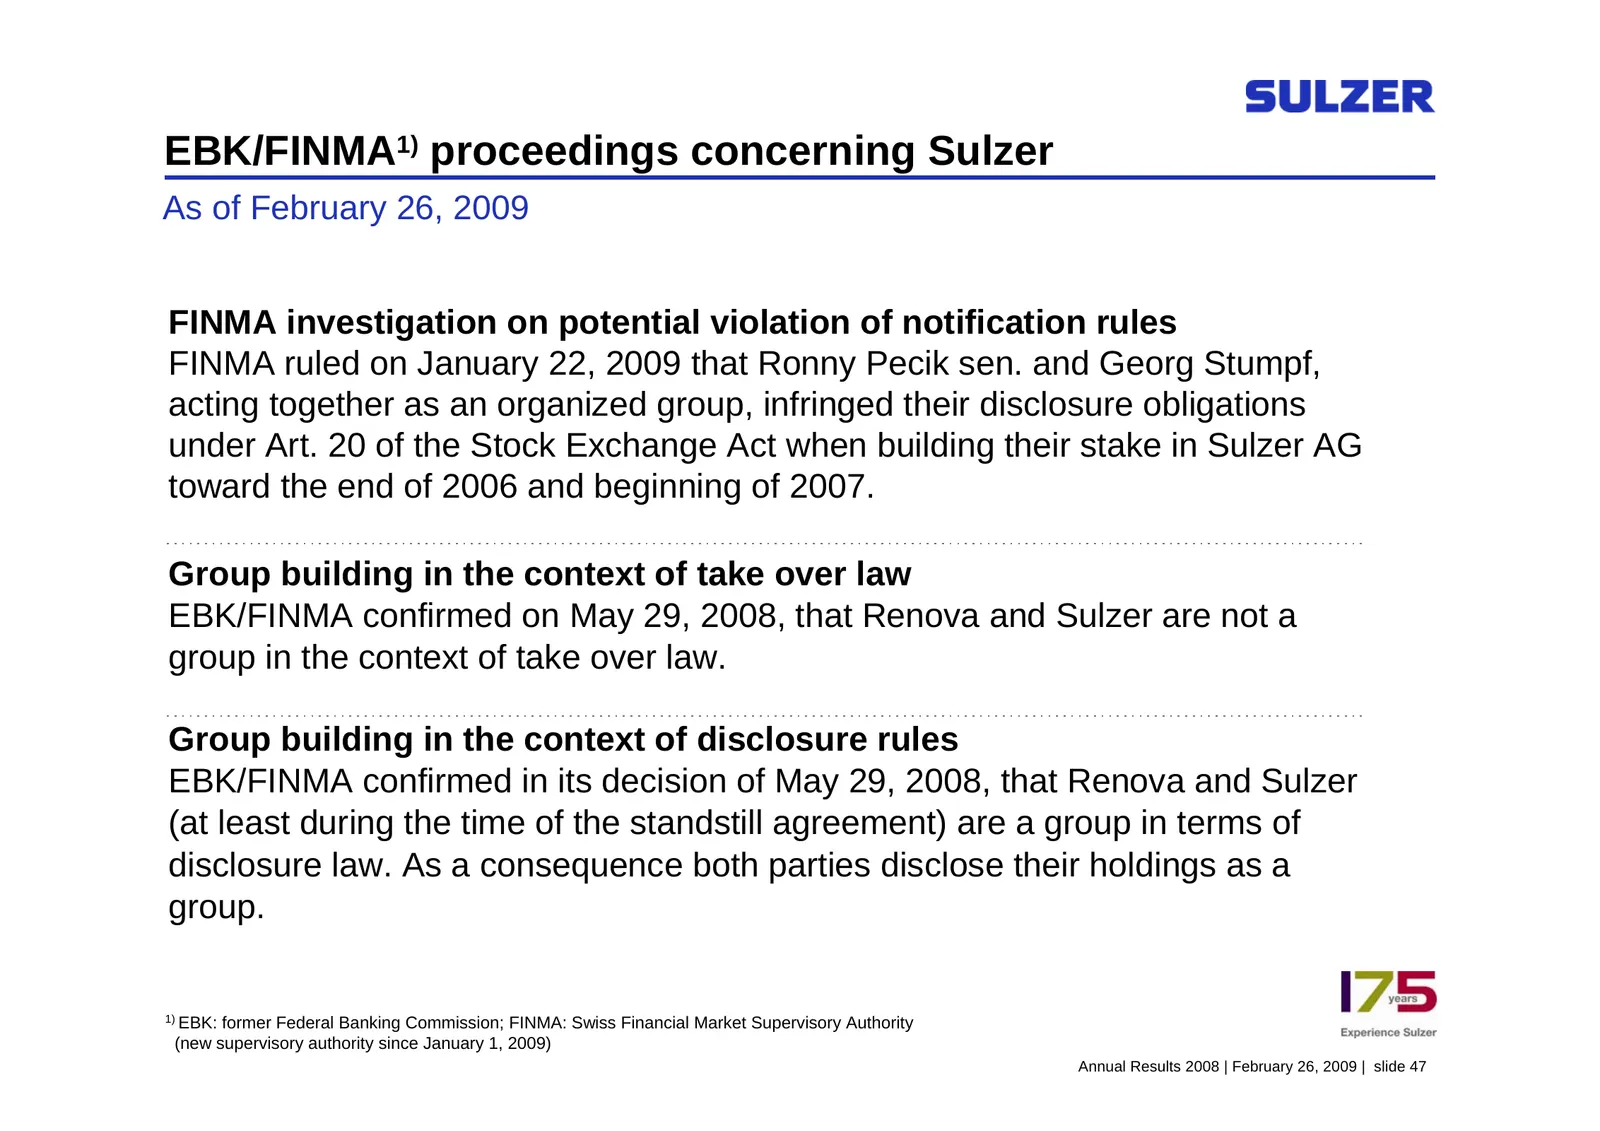
EBK/FINMA1) proceedings concerning Sulzer As of February 26, 2009 FINMA investigation on potential violation of notification rules FINMA ruled on January 22, 2009 that Ronny Pecik sen. and Georg Stumpf, acting together as an organized group, infringed their disclosure obligations under Art. 20 of th
Slide 43: Annual general meeting 2009: Dividend proposal
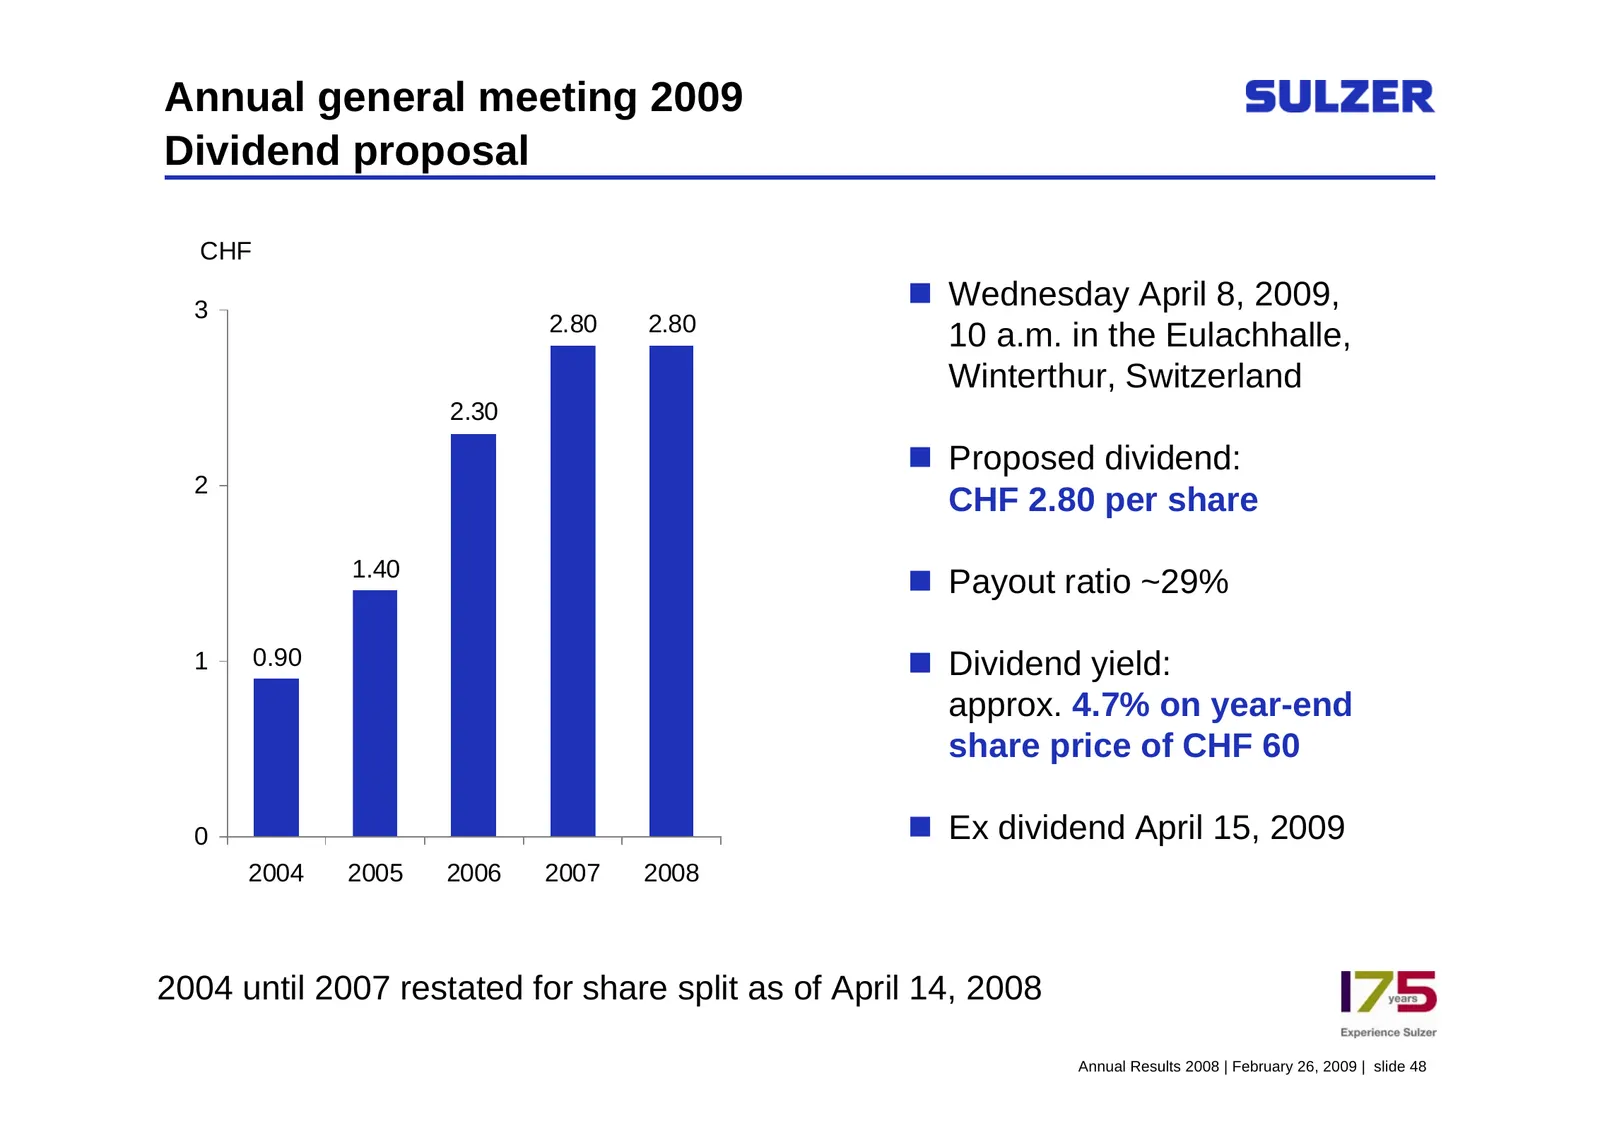
Annual general meeting 2009 Dividend proposal CHF 3 Wednesday April 8, 2009, 2.80 2.80 10 a.m. in the Eulachhalle, Winterthur, Switzerland 2.30 Proposed dividend: 2 CHF 2.80 per share 1.40 Payout ratio ~29% 1 0.90 Dividend yield: approx. 4.7% on year-end share price of CHF 60 0 Ex dividend
Slide 44: Annual general meeting 2009: Board of Directors
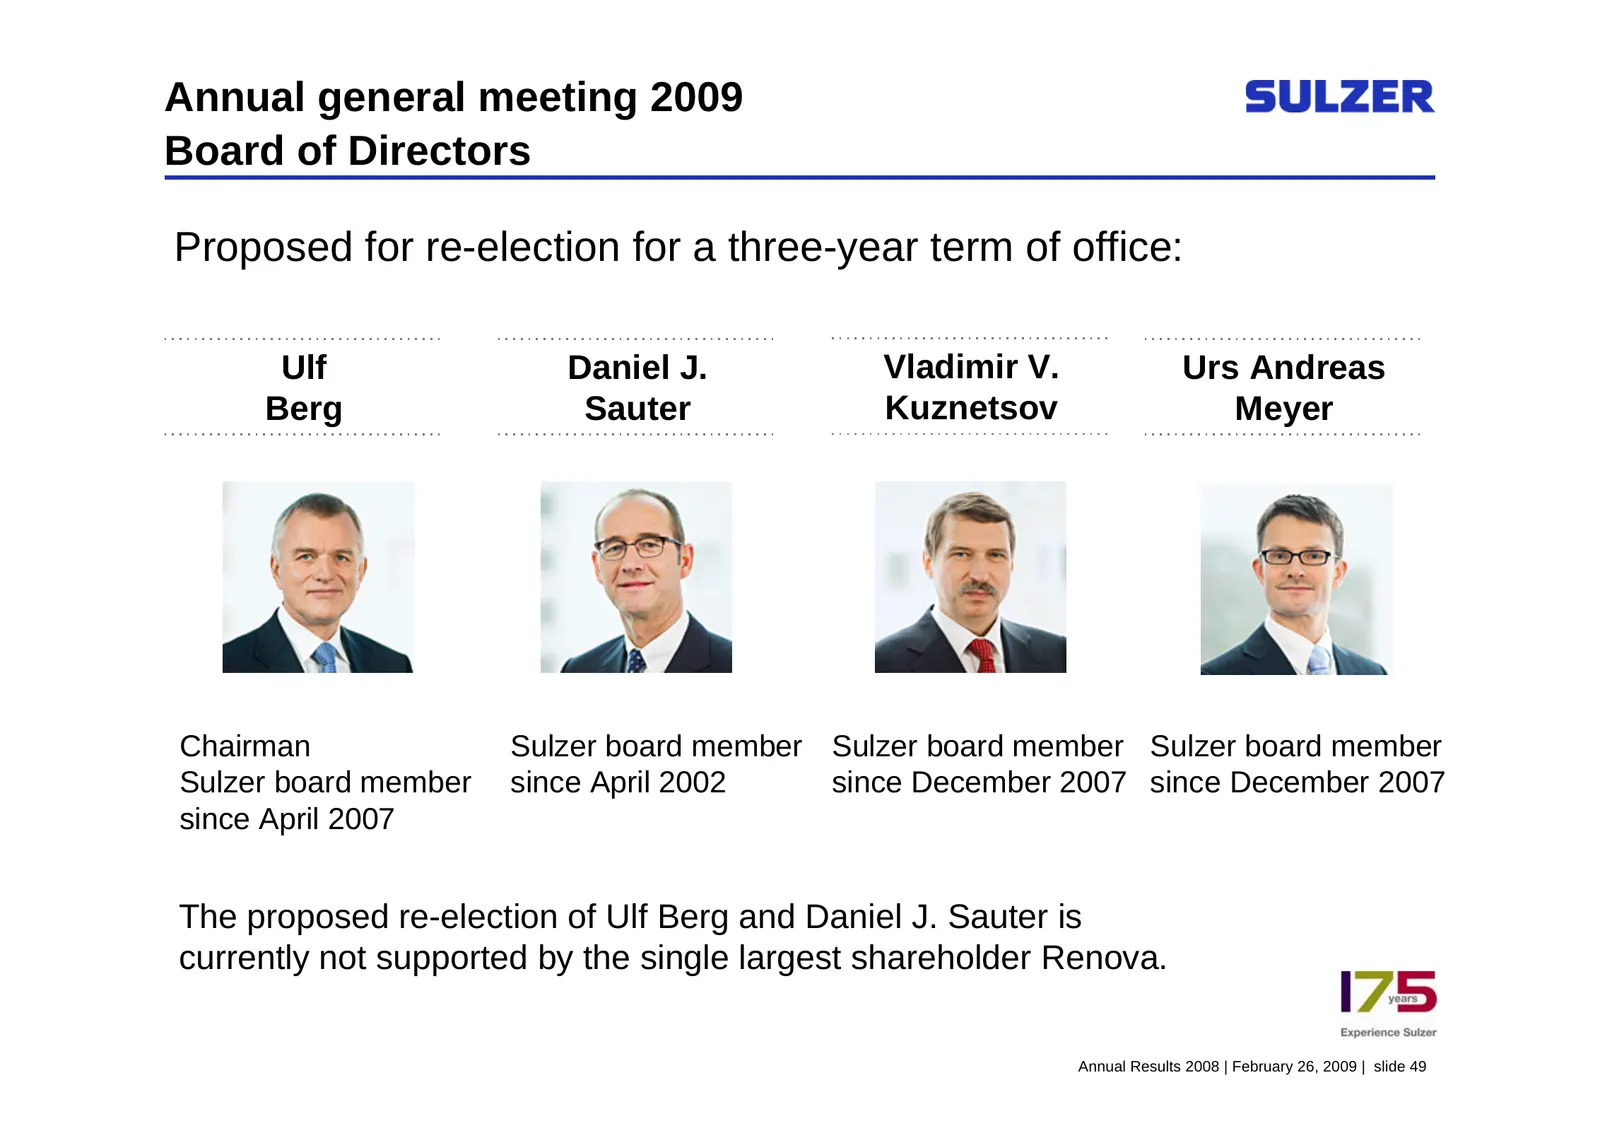
Annual general meeting 2009 Board of Directors Proposed for re-election for a three-year term of office: Ulf Daniel J. Vladimir V. Urs Andreas Berg Sauter Kuznetsov Meyer Chairman Sulzer board member Sulzer board member Sulzer board member Sulzer board member since April 2002 since December 2007 sin
Slide 45: Agenda
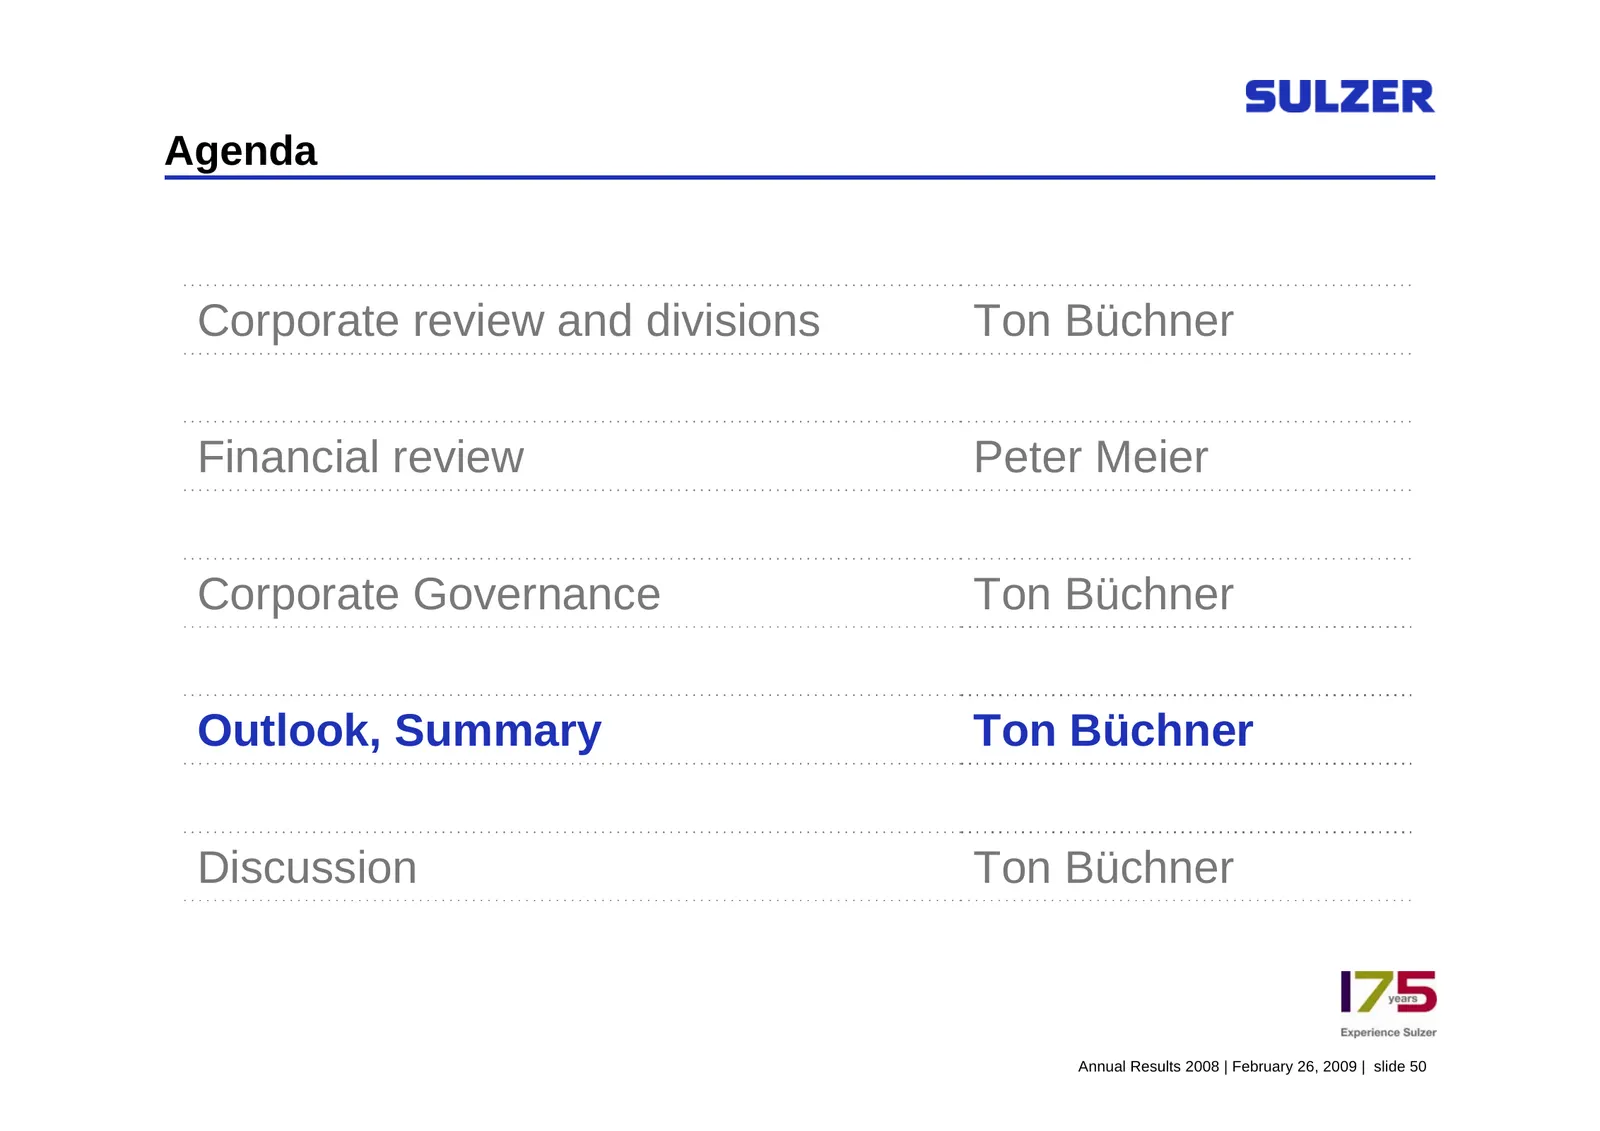
Agenda Corporate review and divisions Ton Büchner Financial review Peter Meier Corporate Governance Ton Büchner Outlook, Summary Ton Büchner Discussion Ton Büchner Annual Results 2008 | February 26, 2009 | slide 50
Slide 46: Market assessment
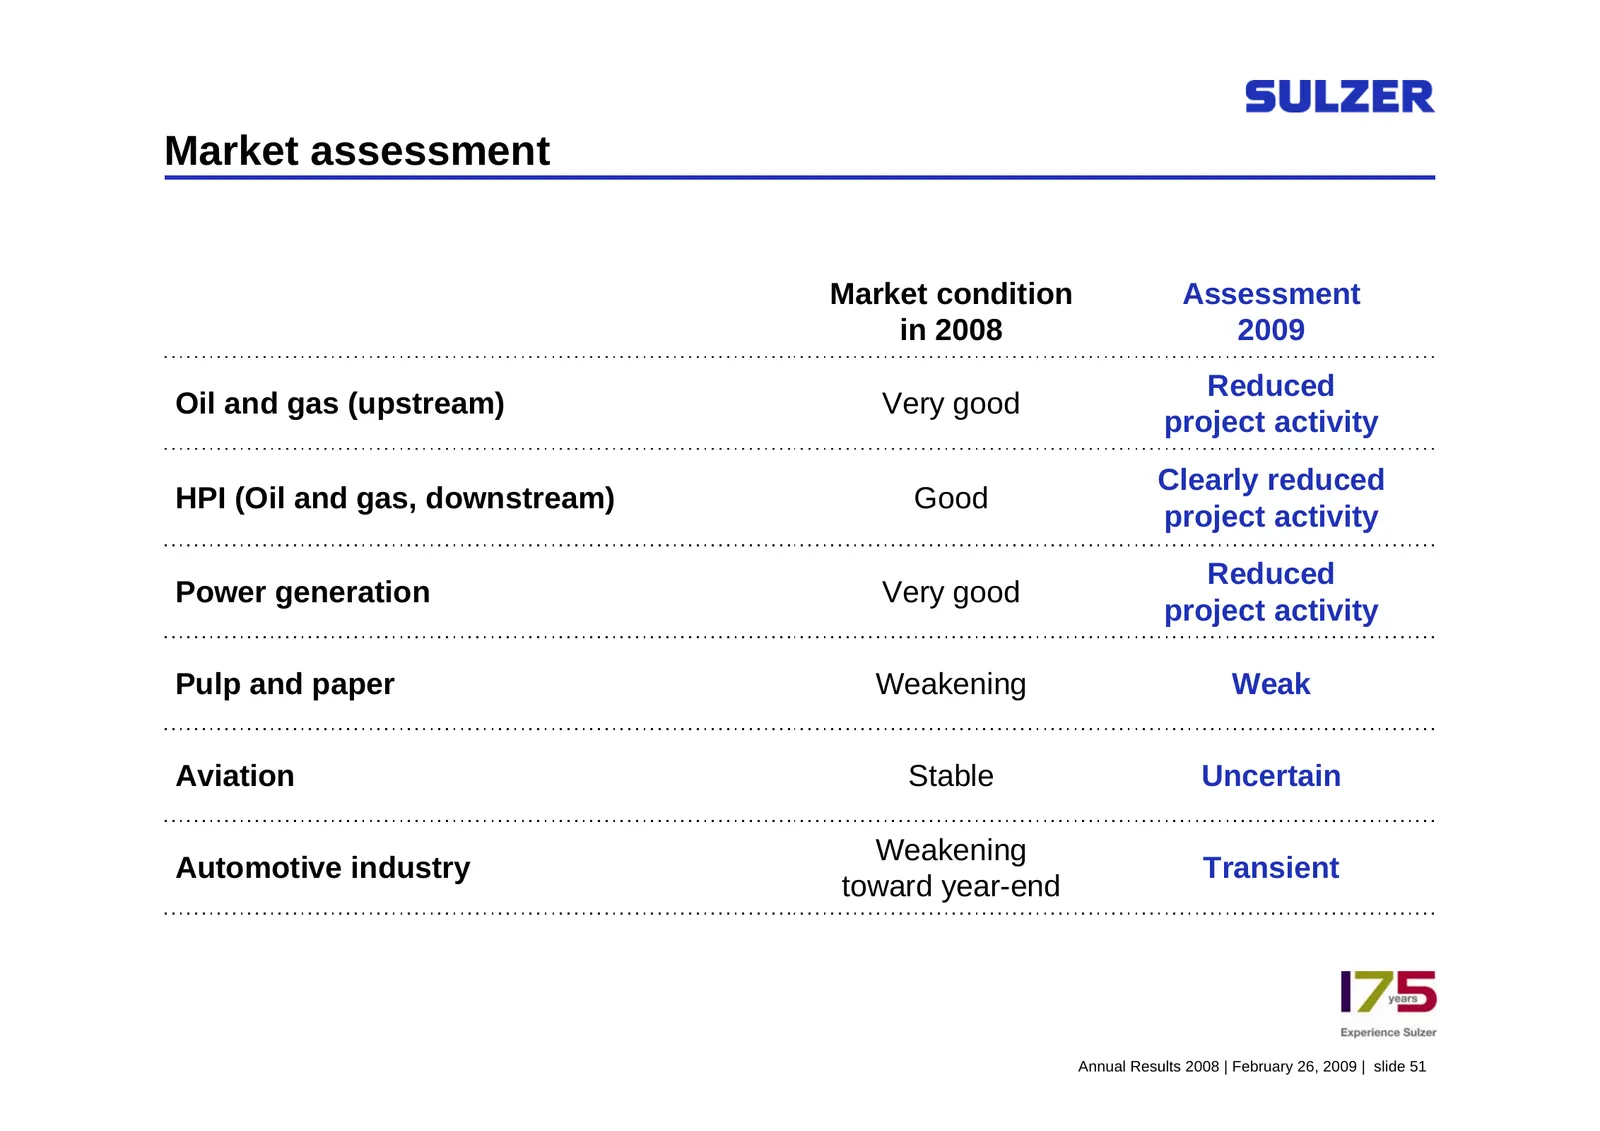
Market assessment Market condition Assessment in 2008 2009 Reduced Oil and gas (upstream) Very good project activity Clearly reduced HPI (Oil and gas, downstream) Good project activity Reduced Power generation Very good project activity Pulp and paper Weakening Weak Aviation Stable Uncertain Weakeni
Slide 47: Financial midrange outlook for the Corporation
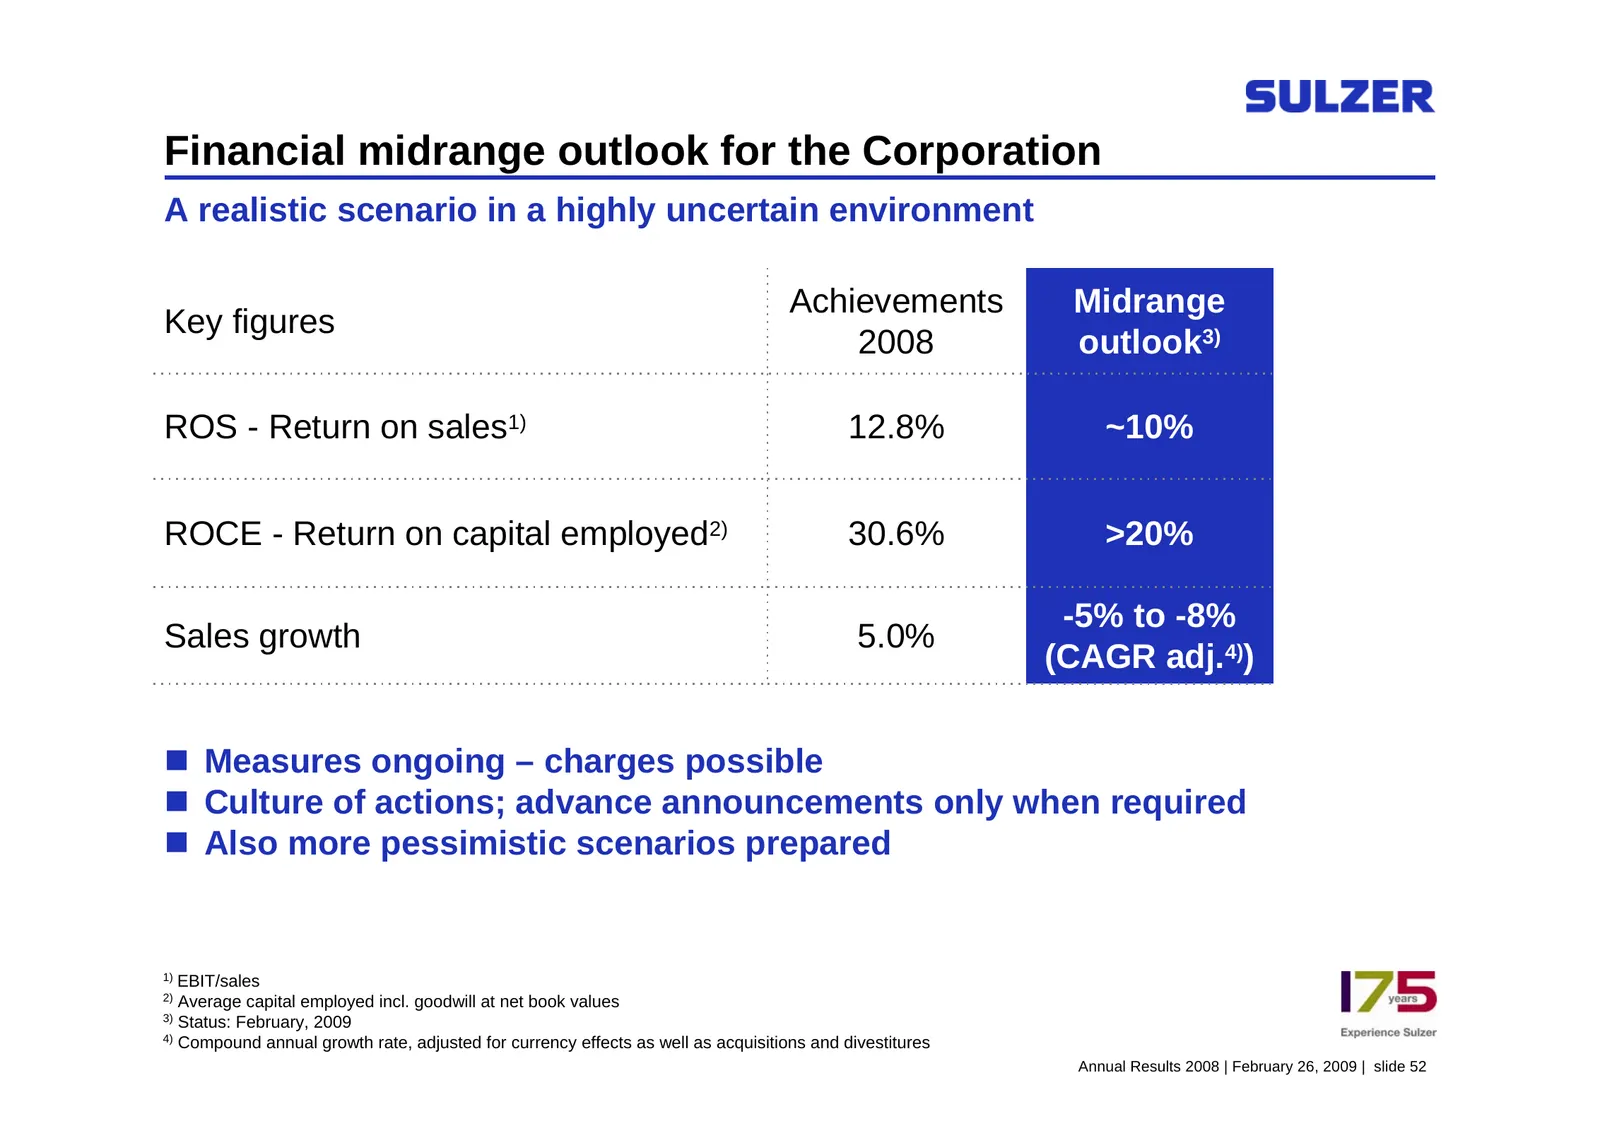
Financial midrange outlook for the Corporation A realistic scenario in a highly uncertain environment Achievements Midrange Key figures 2008 outlook3) ROS - Return on sales1) 12.8% ~10% ROCE - Return on capital employed2) 30.6% >20% -5% to -8% Sales growth 5.0% (CAGR adj.4)) Measures ongoing – cha
Slide 48: Key areas of focus for Sulzer
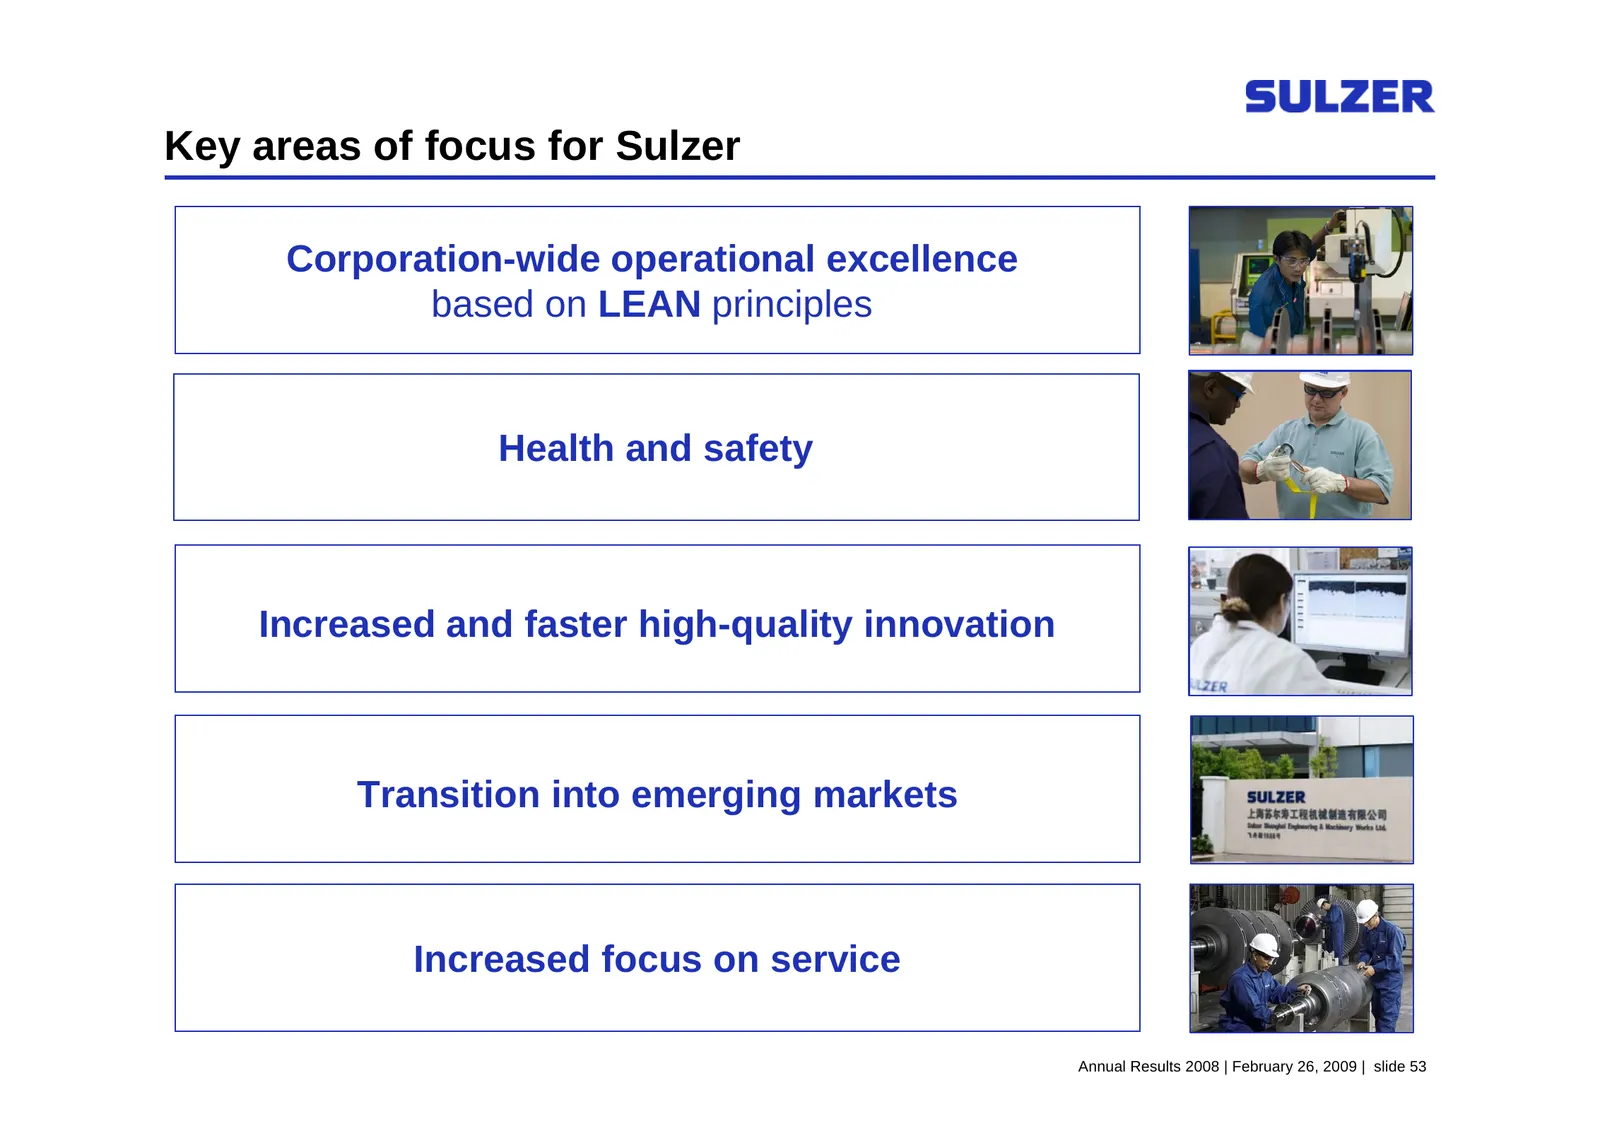
Key areas of focus for Sulzer Corporation-wide operational excellence based on LEAN principles Health and safety Increased and faster high-quality innovation Transition into emerging markets Increased focus on service Annual Results 2008 | February 26, 2009 | slide 53
Slide 49: Summary
Summary 2008 was a great year Significant challenges in 2009 and beyond Sulzer focuses on long-term value creation Sulzer’s strengths make us confident to take on the challenges Accommodate growth in a flexible way Strong order backlog Management team with experience in a downturn econ
Slide 50: Experience Sulzer
Experience Sulzer Annual Results 2008 | February 26, 2009 | slide 55
Slide 51: The Safe Harbor Statement under the US Private Securities Litigation Reform Act 1995
THE SAFE HARBOR STATEMENT UNDER THE US PRIVATE SECURITIES LITIGATION REFORM ACT 1995 This presentation contains forward-looking statements, including but not limited to, projections of future performance of materials and products, containing risks and uncertainties. These statements are subject to c
Source: Internet Archive copy of sulzer.com
More decks from Sulzer AG
 Q2 2026 Earnings Presentation24 slides · Jul 28, 2026
 FY2025 Earnings Presentation38 slides · Feb 26, 2026
 H1 2025 Earnings Presentation22 slides · Jul 24, 2025
 FY2024 Earnings Presentation35 slides · Feb 27, 2025
 H1 2024 Earnings Presentation19 slides · Jul 26, 2024
 Investor Day (June 2024)78 slides · Jun 10, 2024