Pepco — Investor Day (March 2012)
131 slides from Pepco's investor day presentation, Mar 26, 2012

Slide 1: Investing For Our Future
Investing For Our Future ANALYST CONFERENCE • WASHINGTON, D.C. • MARCH 27, 2012
Slide 2: Strategic Overview
Strategic Overview Joe Rigby Chairman, President & Chief Executive Officer
Slide 3: Safe Harbor Statement/Regulation G Information
Safe Harbor Statement/Regulation G Information Some of the statements contained in today’s presentation with respect to Pepco Holdings, Pepco, Delmarva Power and Atlantic City Electric, and each of their respective subsidiaries, are forward-looking statements within the meaning of the U.S. federal s
Slide 4: PHI's Strategic Focus
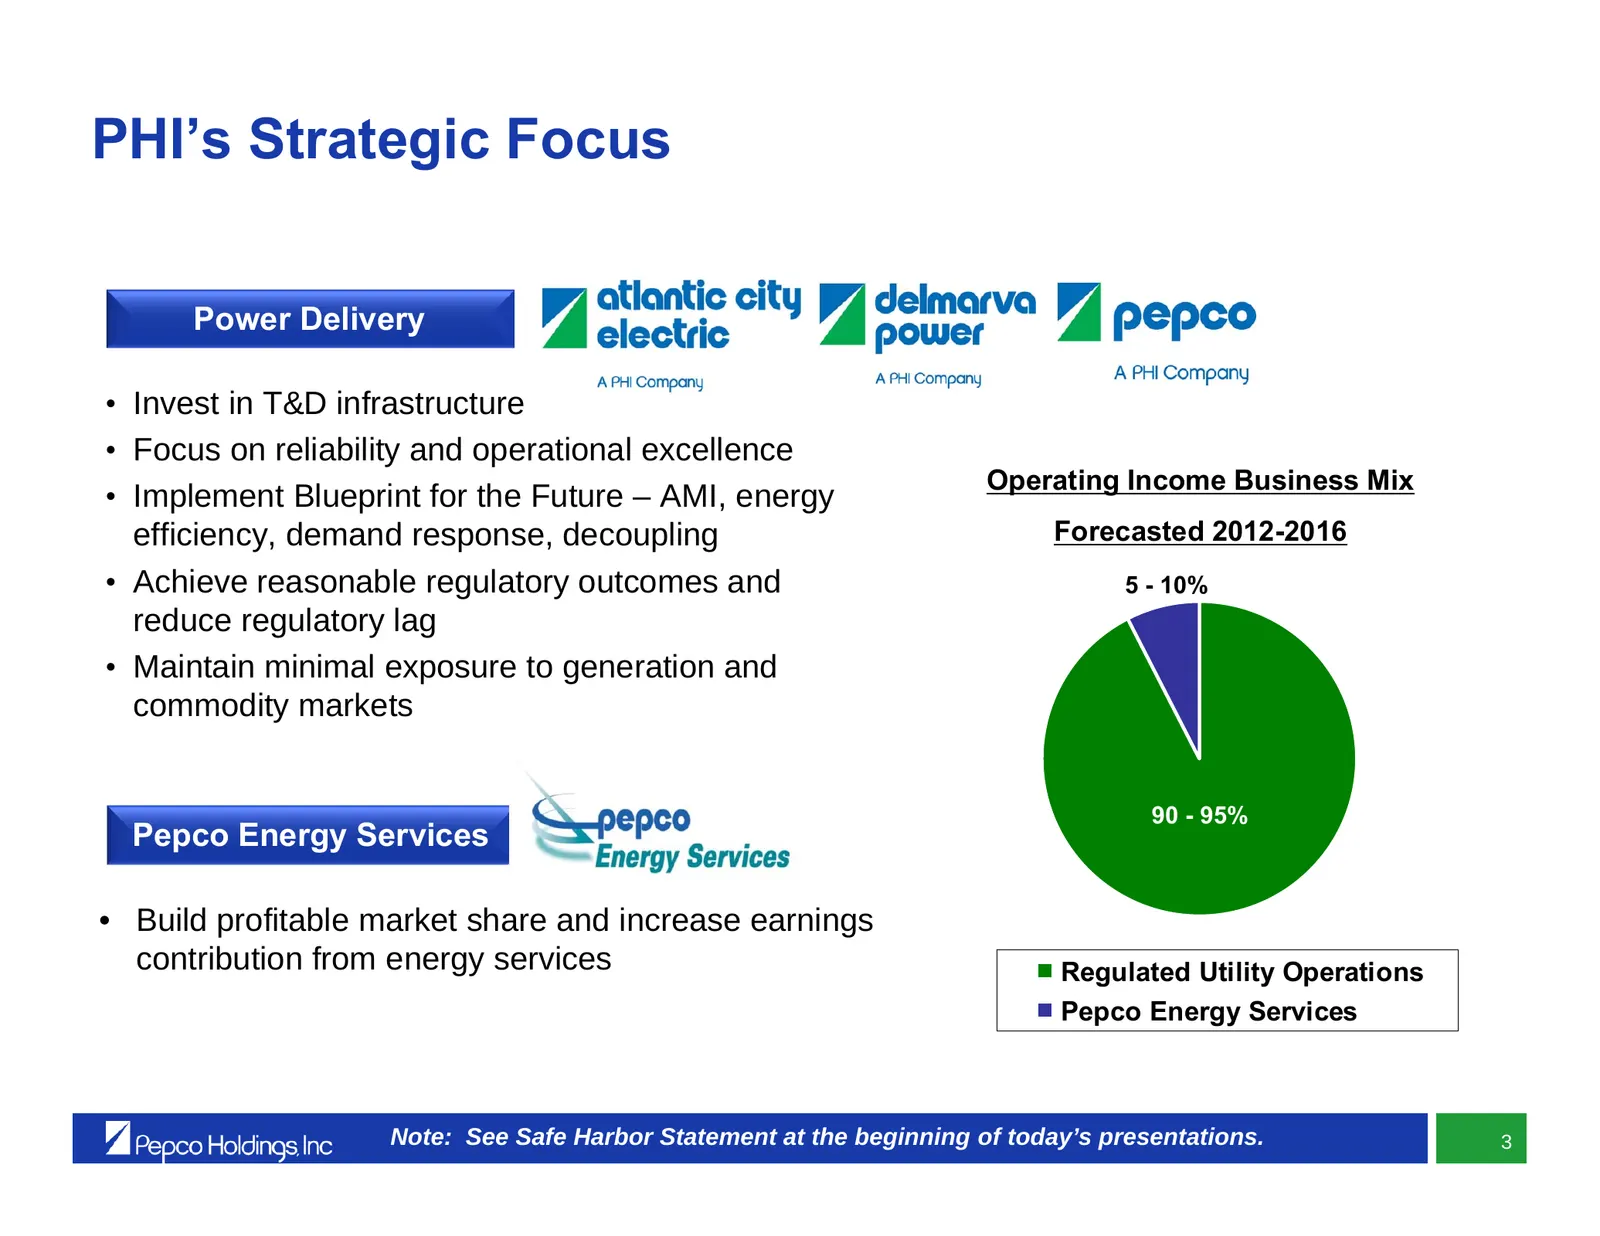
PHI’s Strategic Focus Power Delivery • Invest in T&D infrastructure • Focus on reliability and operational excellence Operating Income Business Mix • Implement Blueprint for the Future – AMI, energy efficiency, demand response, decoupling Forecasted 2012-2016 • Achieve reasonable regulatory outcomes
Slide 5: Current State
Current State • $5.6 billion regulated capital expenditure five-year plan and a higher level of ongoing annual O&M spend to significantly improve system reliability, customer service, energy efficiency and renewal of aging systems • Reliability enhancement plan is yielding positive, measurable resul
Slide 6: Accomplishments Since Our Last Analyst Conference
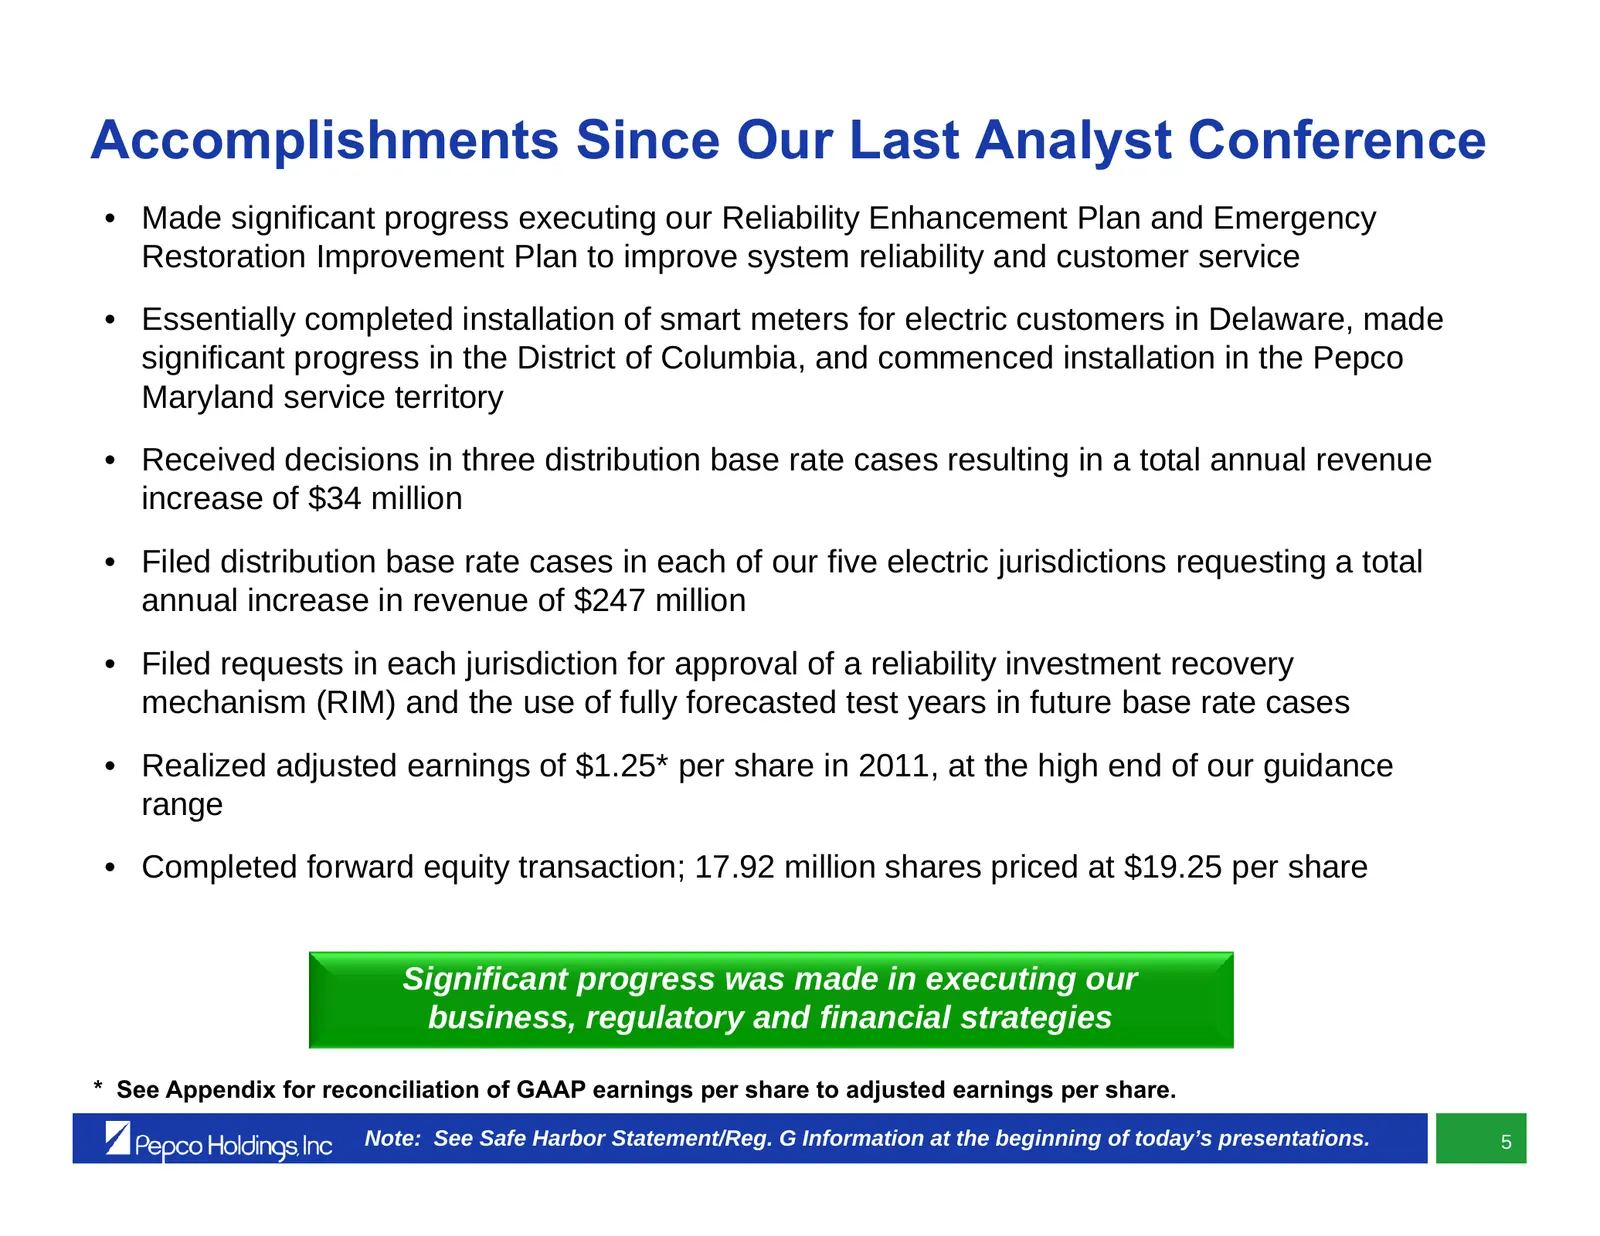
Accomplishments Since Our Last Analyst Conference • Made significant progress executing our Reliability Enhancement Plan and Emergency Restoration Improvement Plan to improve system reliability and customer service • Essentially completed installation of smart meters for electric customers in Delawa
Slide 7: Strategic Direction Aligned with Industry Opportunities & Challenges
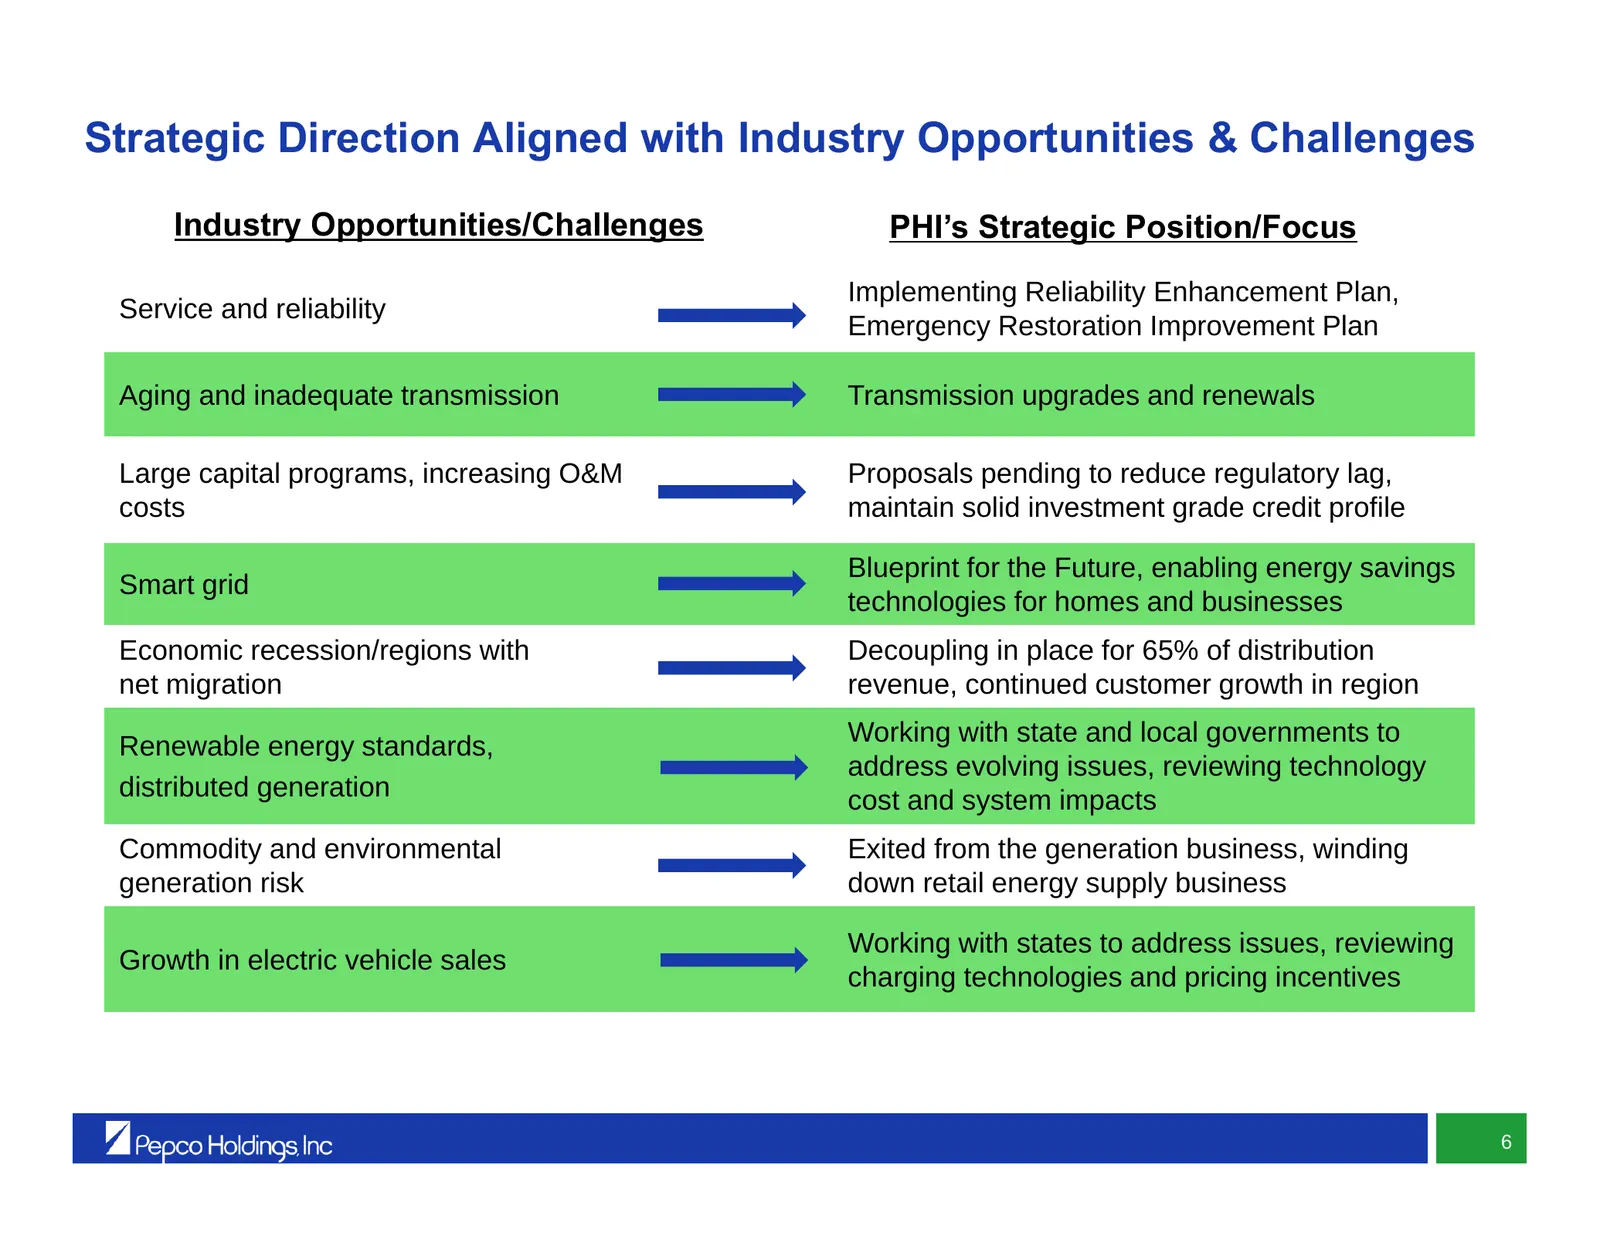
Strategic Direction Aligned with Industry Opportunities & Challenges Industry Opportunities/Challenges PHI’s Strategic Position/Focus Implementing Reliability Enhancement Plan, Service and reliability Emergency Restoration Improvement Plan Aging and inadequate transmission Transmission upgrades and
Slide 8: PHI – A Leader in Environmental Performance and Carbon Disclosure
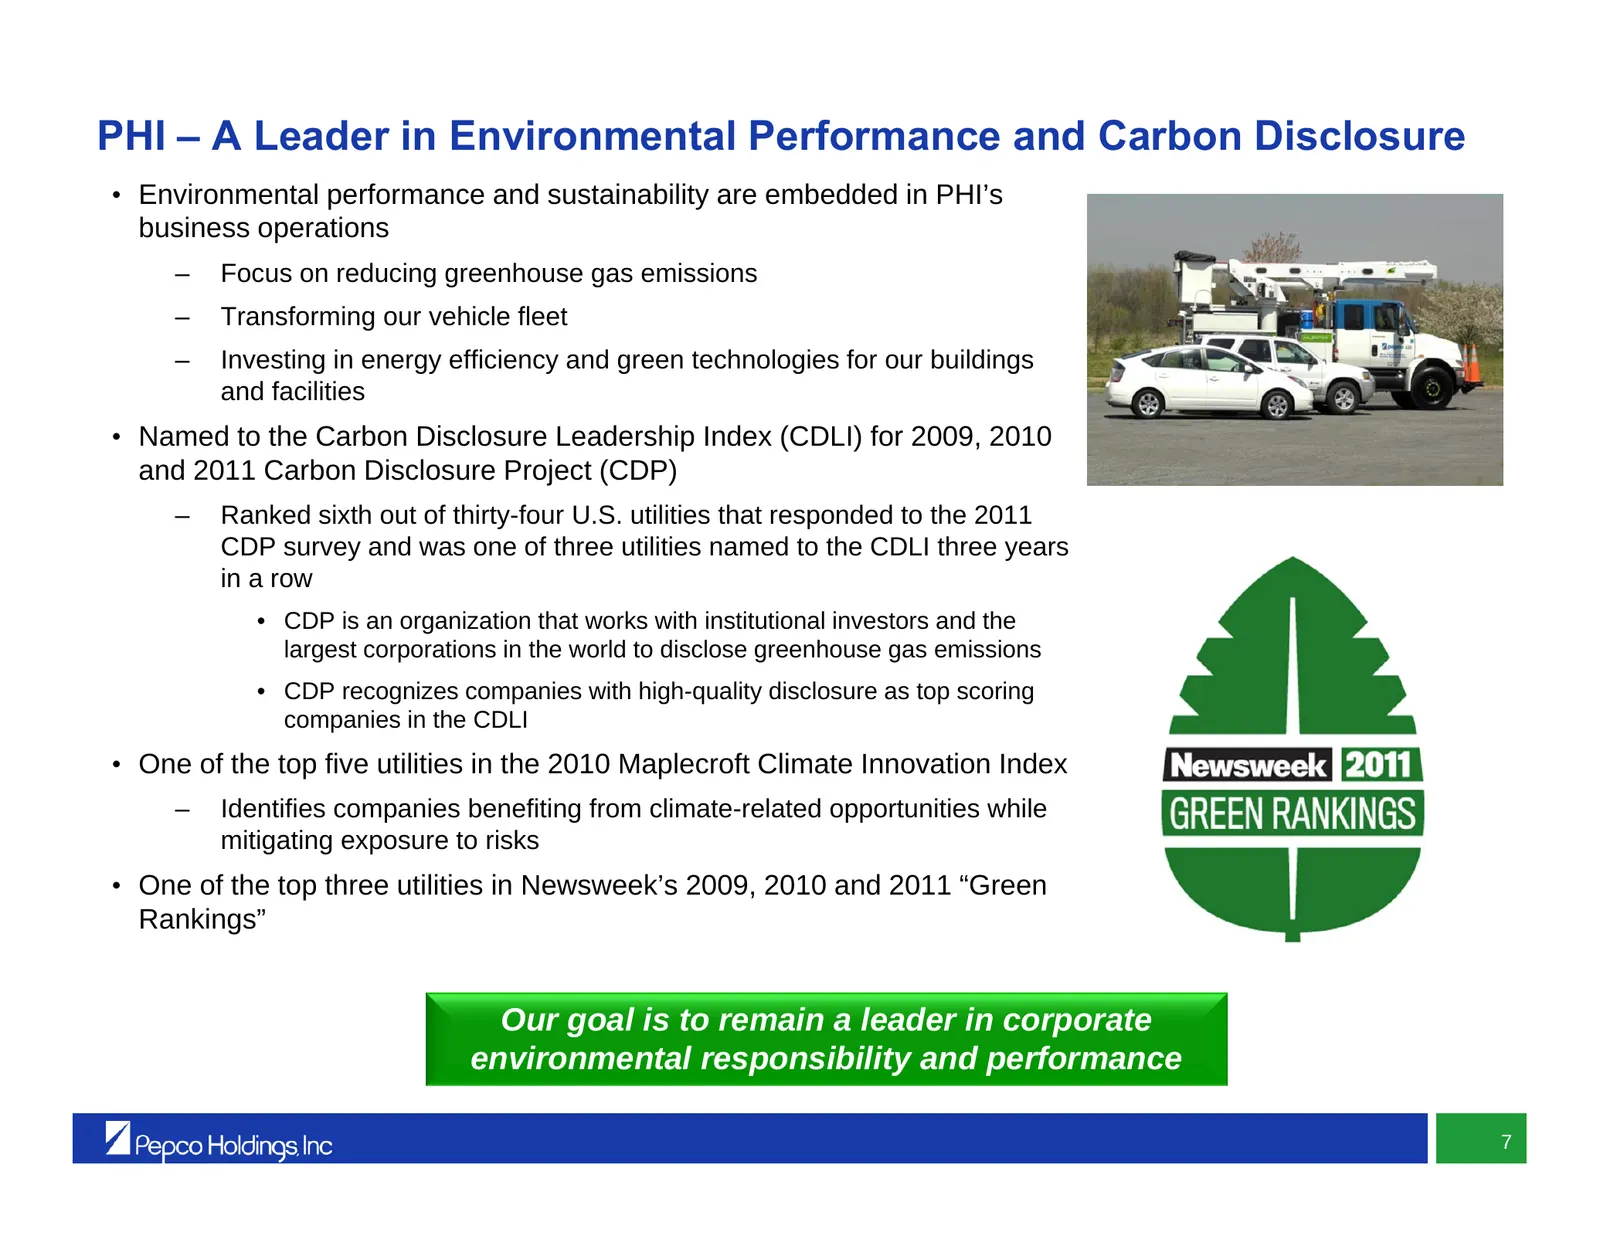
PHI – A Leader in Environmental Performance and Carbon Disclosure • Environmental performance and sustainability are embedded in PHI’s business operations – Focus on reducing greenhouse gas emissions – Transforming our vehicle fleet – Investing in energy efficiency and green technologies for our bui
Slide 9: The Roadmap to Delivering Value to Our Customers and Investors
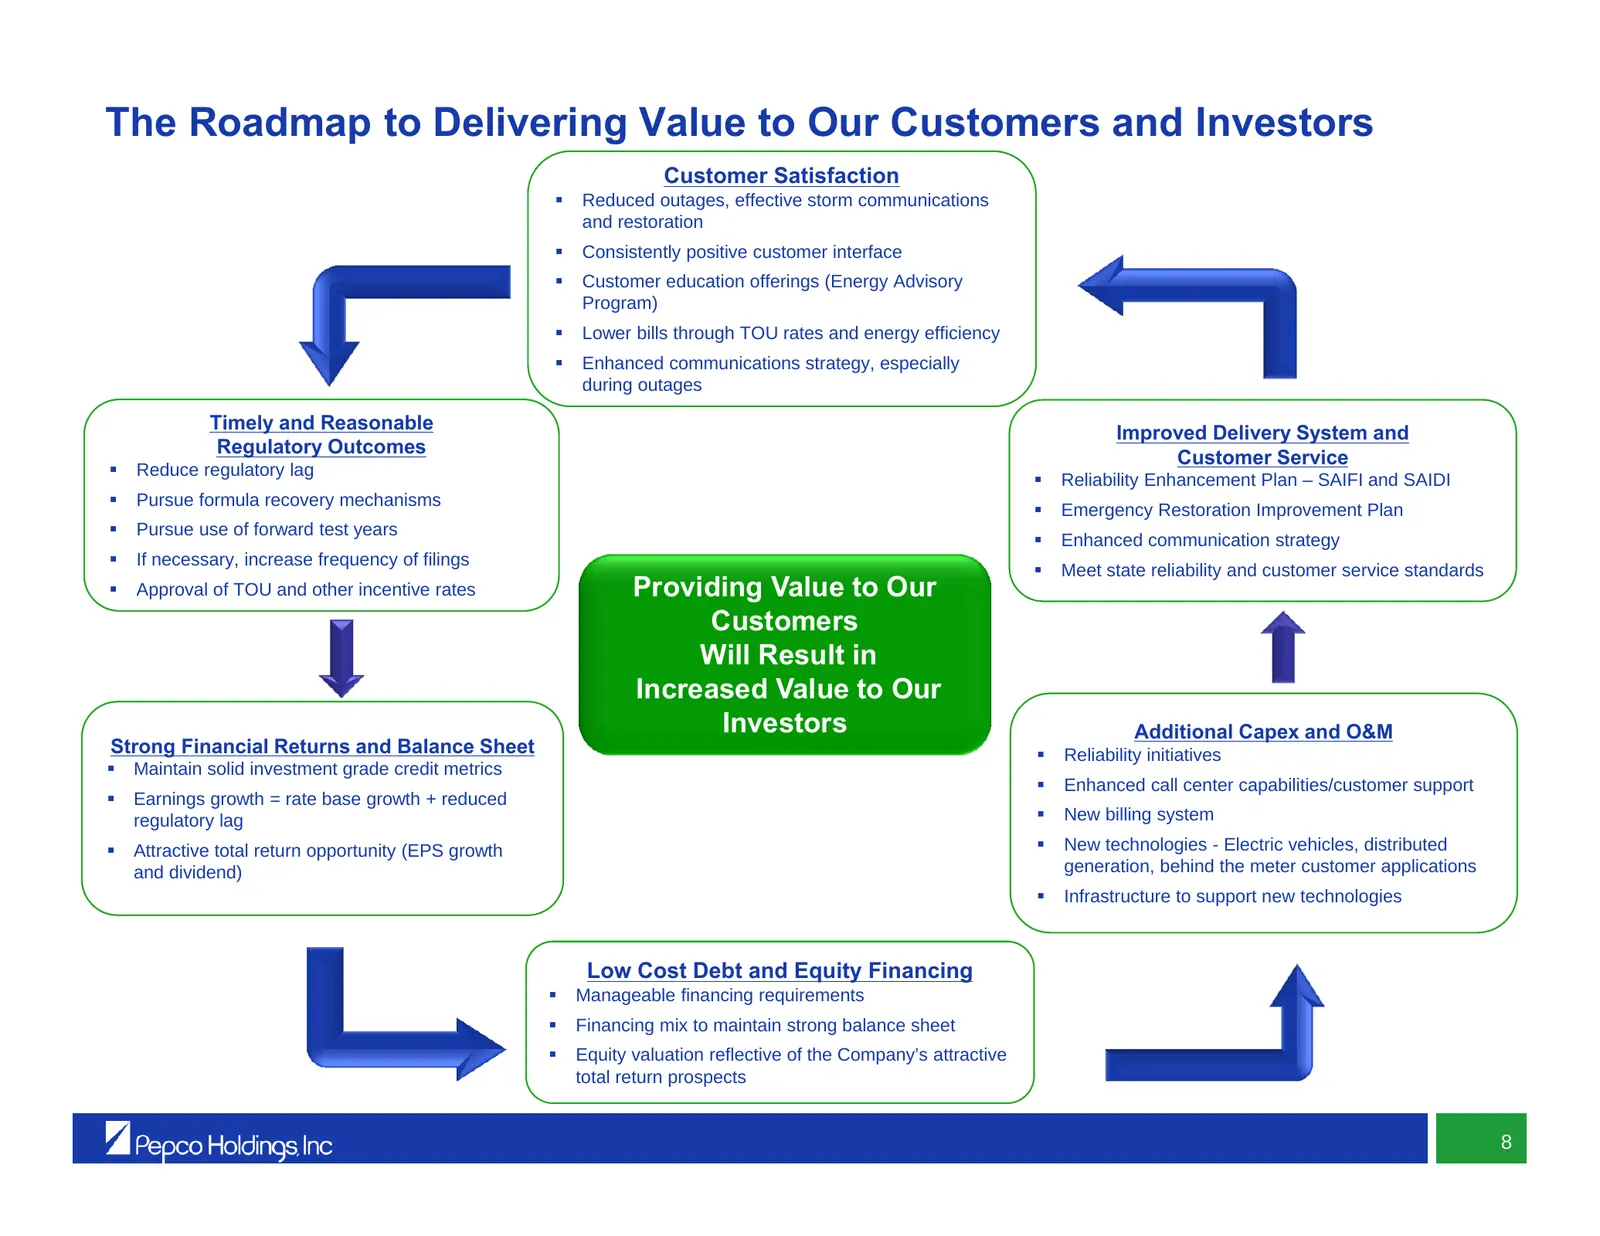
The Roadmap to Delivering Value to Our Customers and Investors Customer Satisfaction Reduced outages, effective storm communications and restoration Consistently positive customer interface Customer education offerings (Energy Advisory Program) Lower bills through TOU rates and energy effici
Slide 10: Strong T&D Infrastructure Investment Growth
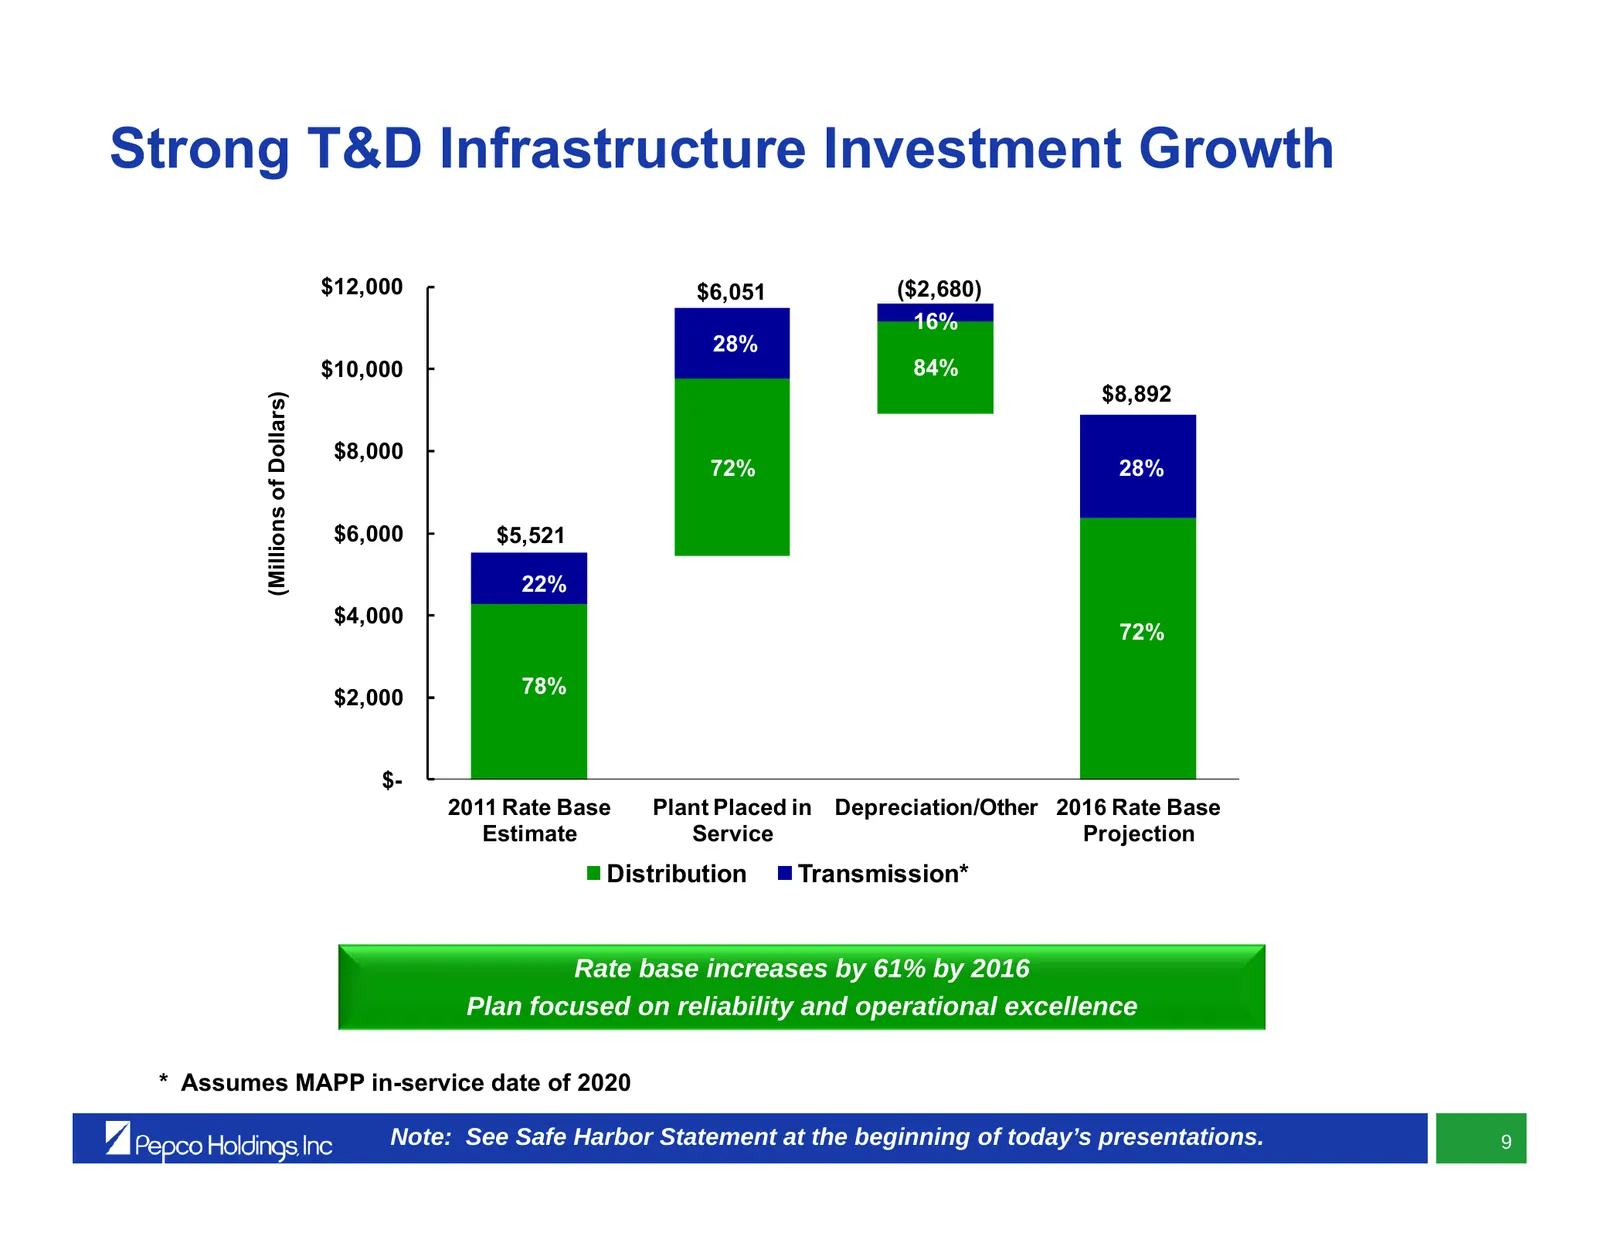
Strong T&D Infrastructure Investment Growth $12,000 $6,051 ($2,680) 16% 28% $10,000 84% $8,892 (Millions of Dollars) $8,000 72% 28% $6,000 $5,521 22% $4,000 72% 78% $2,000 $- 2011 Rate Base Plant Placed in Depreciation/Other 2016 Rate Base Estimate Service Projection Distribution Transmission* Rate
Slide 11: Regulatory Lag
Regulatory Lag • Our commitment to increase O&M and Capex spending is essential to improving system reliability and customer service over the long-term • Increased spending is an ongoing but necessary headwind in our efforts to reduce regulatory lag • We will continue working to reduce regulatory la
Slide 12: PHI Value Proposition – Poised for Above Average Total Return
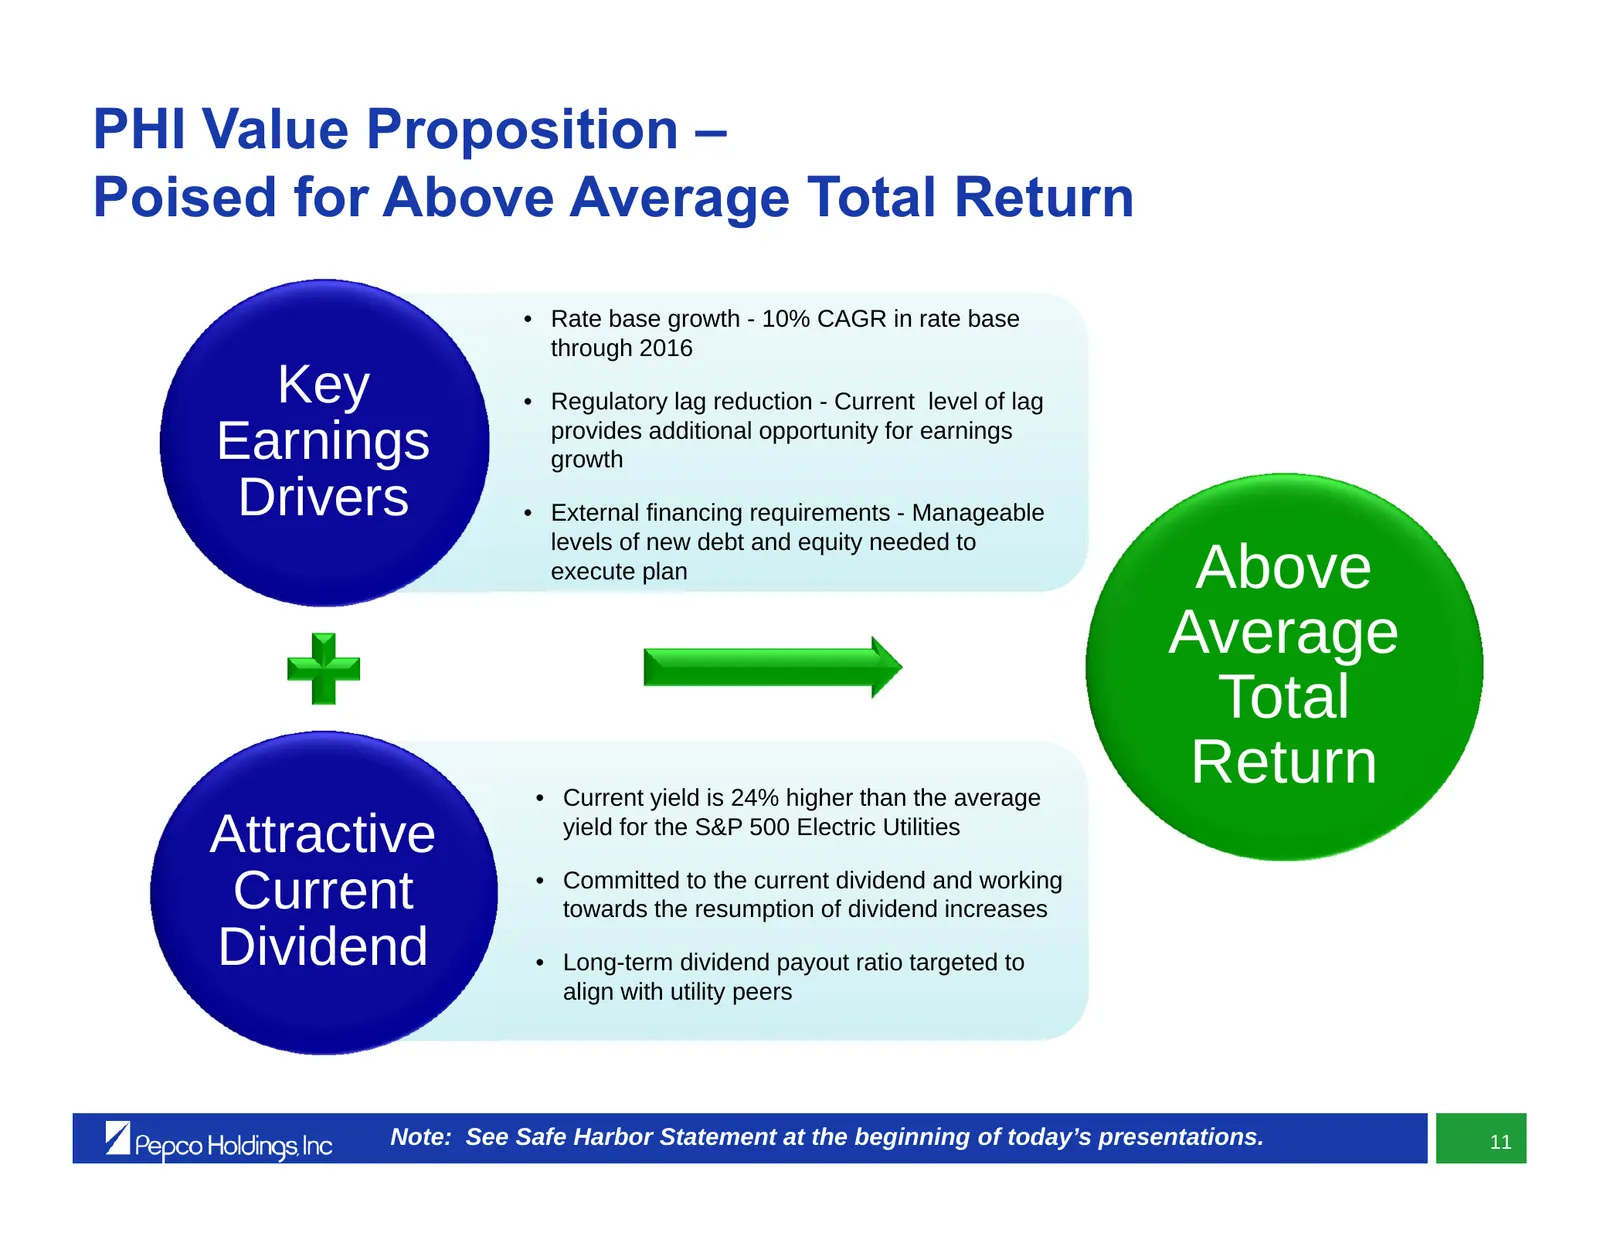
PHI Value Proposition – Poised for Above Average Total Return • Rate base growth - 10% CAGR in rate base through 2016 Key • Regulatory lag reduction - Current level of lag Earnings provides additional opportunity for earnings growth Drivers • External financing requirements - Manageable levels of ne
Slide 13: 2012 Focus
2012 Focus • Focus on reliability, infrastructure expansion and operational excellence • Complete pending distribution base rate cases and achieve reasonable outcomes, including mechanisms that reduce regulatory lag • File next round of distribution base rate cases if outcomes of pending cases do no
Slide 14: PHI – Well Positioned
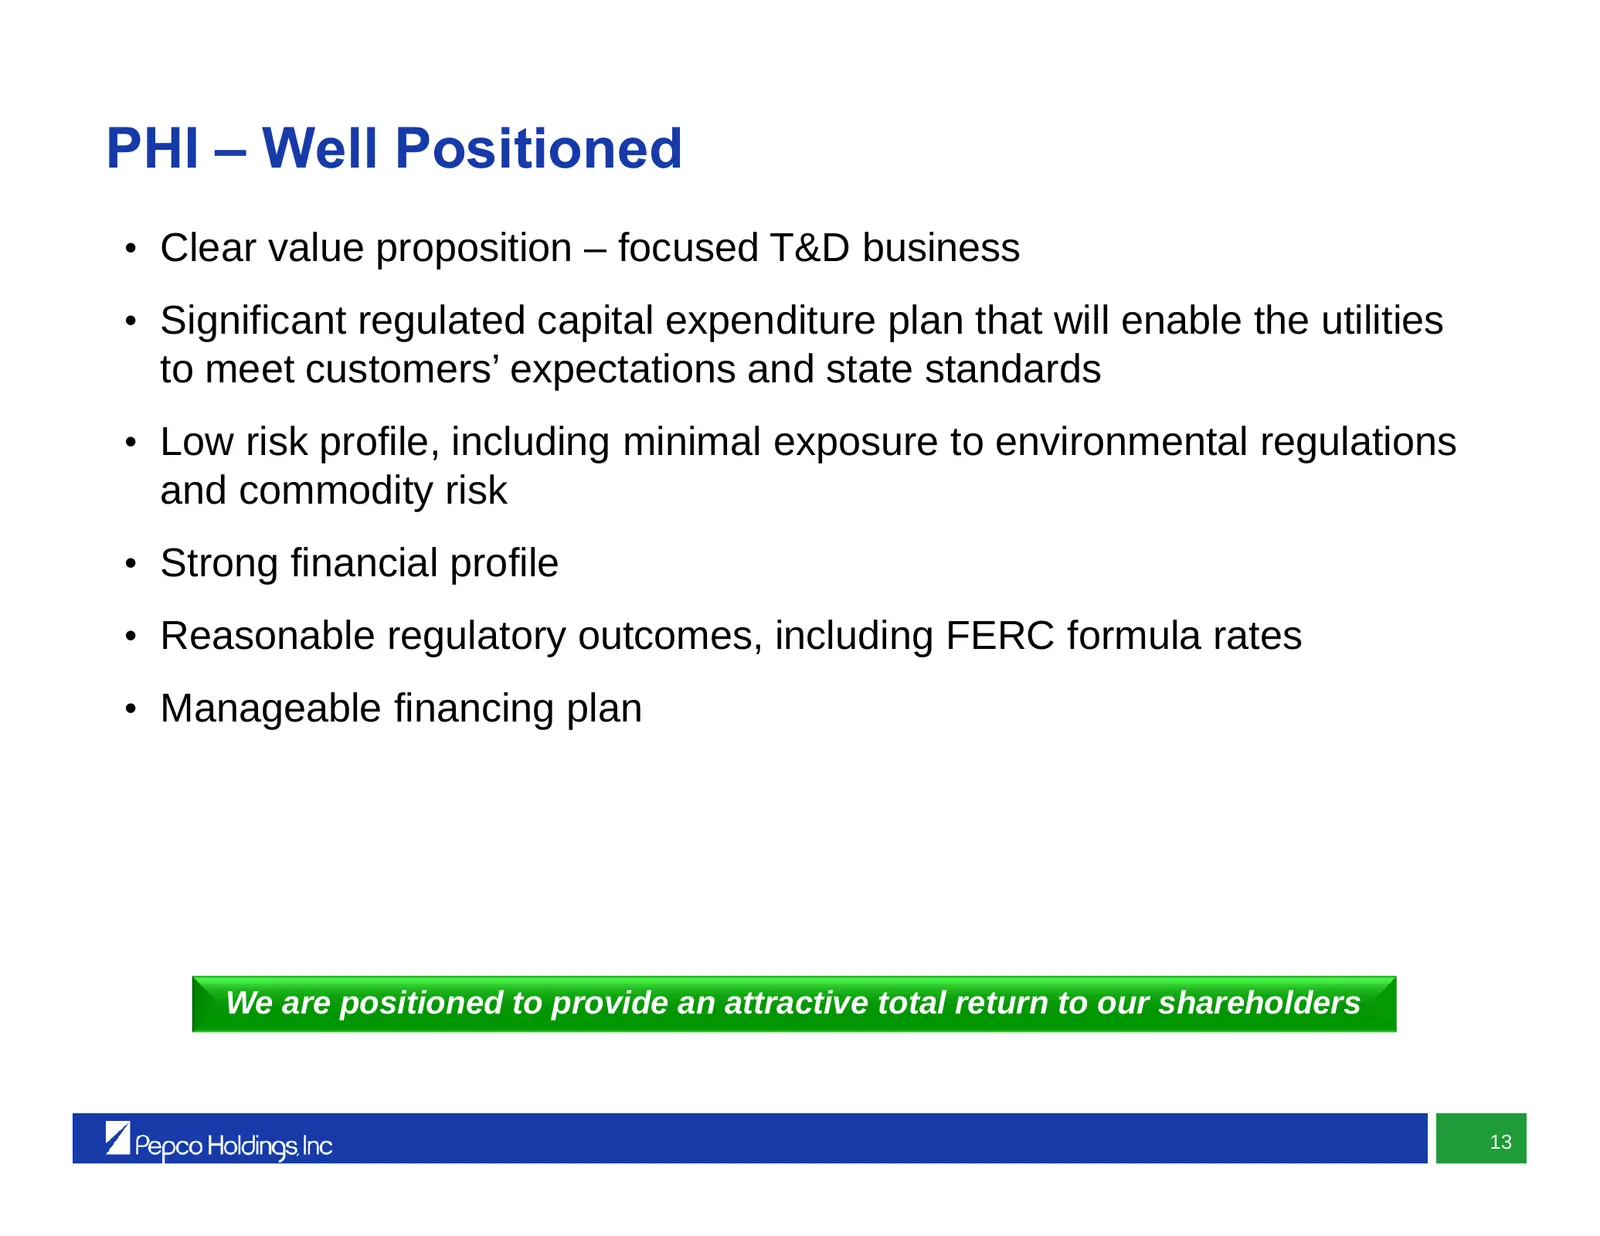
PHI – Well Positioned • Clear value proposition – focused T&D business • Significant regulated capital expenditure plan that will enable the utilities to meet customers’ expectations and state standards • Low risk profile, including minimal exposure to environmental regulations and commodity risk •
Slide 15: Strategic Overview
Strategic Overview Joe Rigby Chairman, President & Chief Executive Officer
Slide 16: Appendix
Appendix y | Pepco Holdings Inc L |
Slide 17: Reconciliation of GAAP EPS to Adjusted EPS
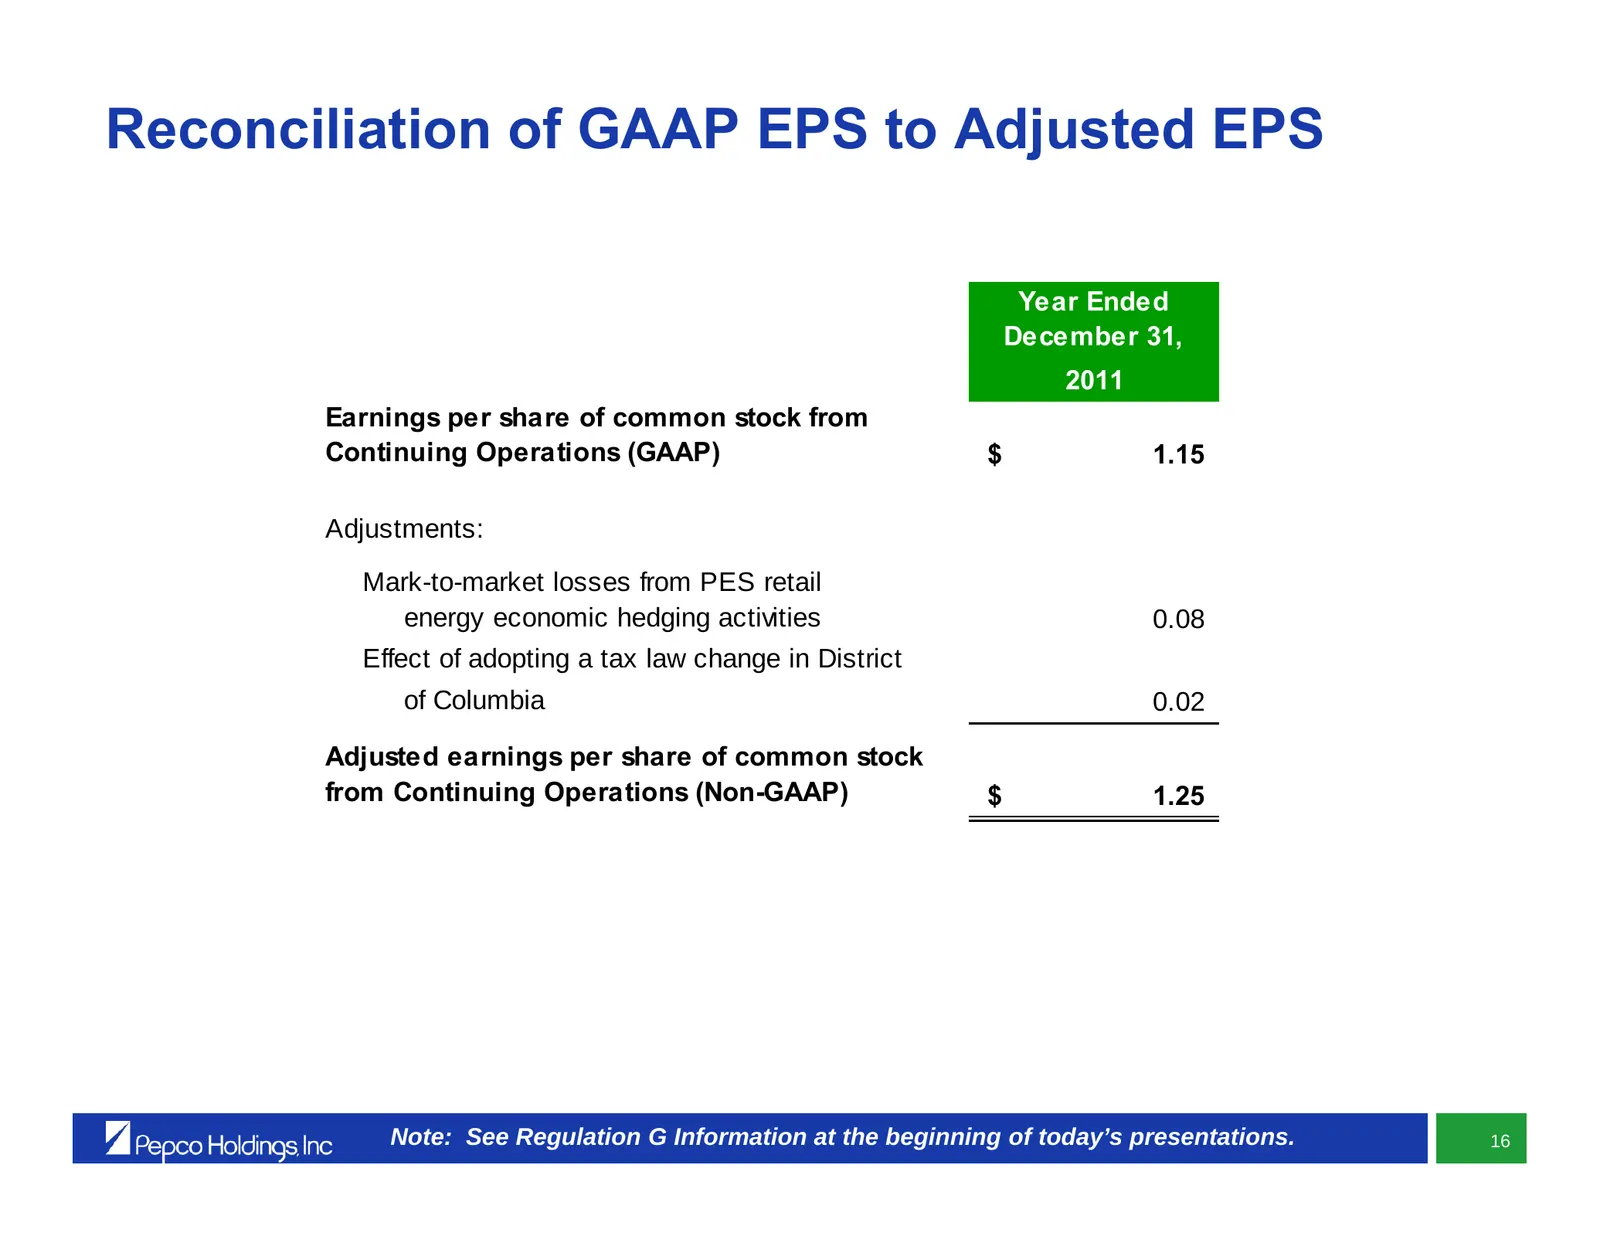
Reconciliation of GAAP EPS to Adjusted EPS Year Ended December 31, 2011 Earnings per share of common stock from Continuing Operations (GAAP) $ 1.15 Adjustments: Mark-to-market losses from PES retail energy economic hedging activities 0.08 Effect of adopting a tax law change in District of Columbia 0
Slide 18: Power Delivery
Power Delivery Dave Velazquez Executive Vice President, Power Delivery
Slide 19: Business Overview – Power Delivery
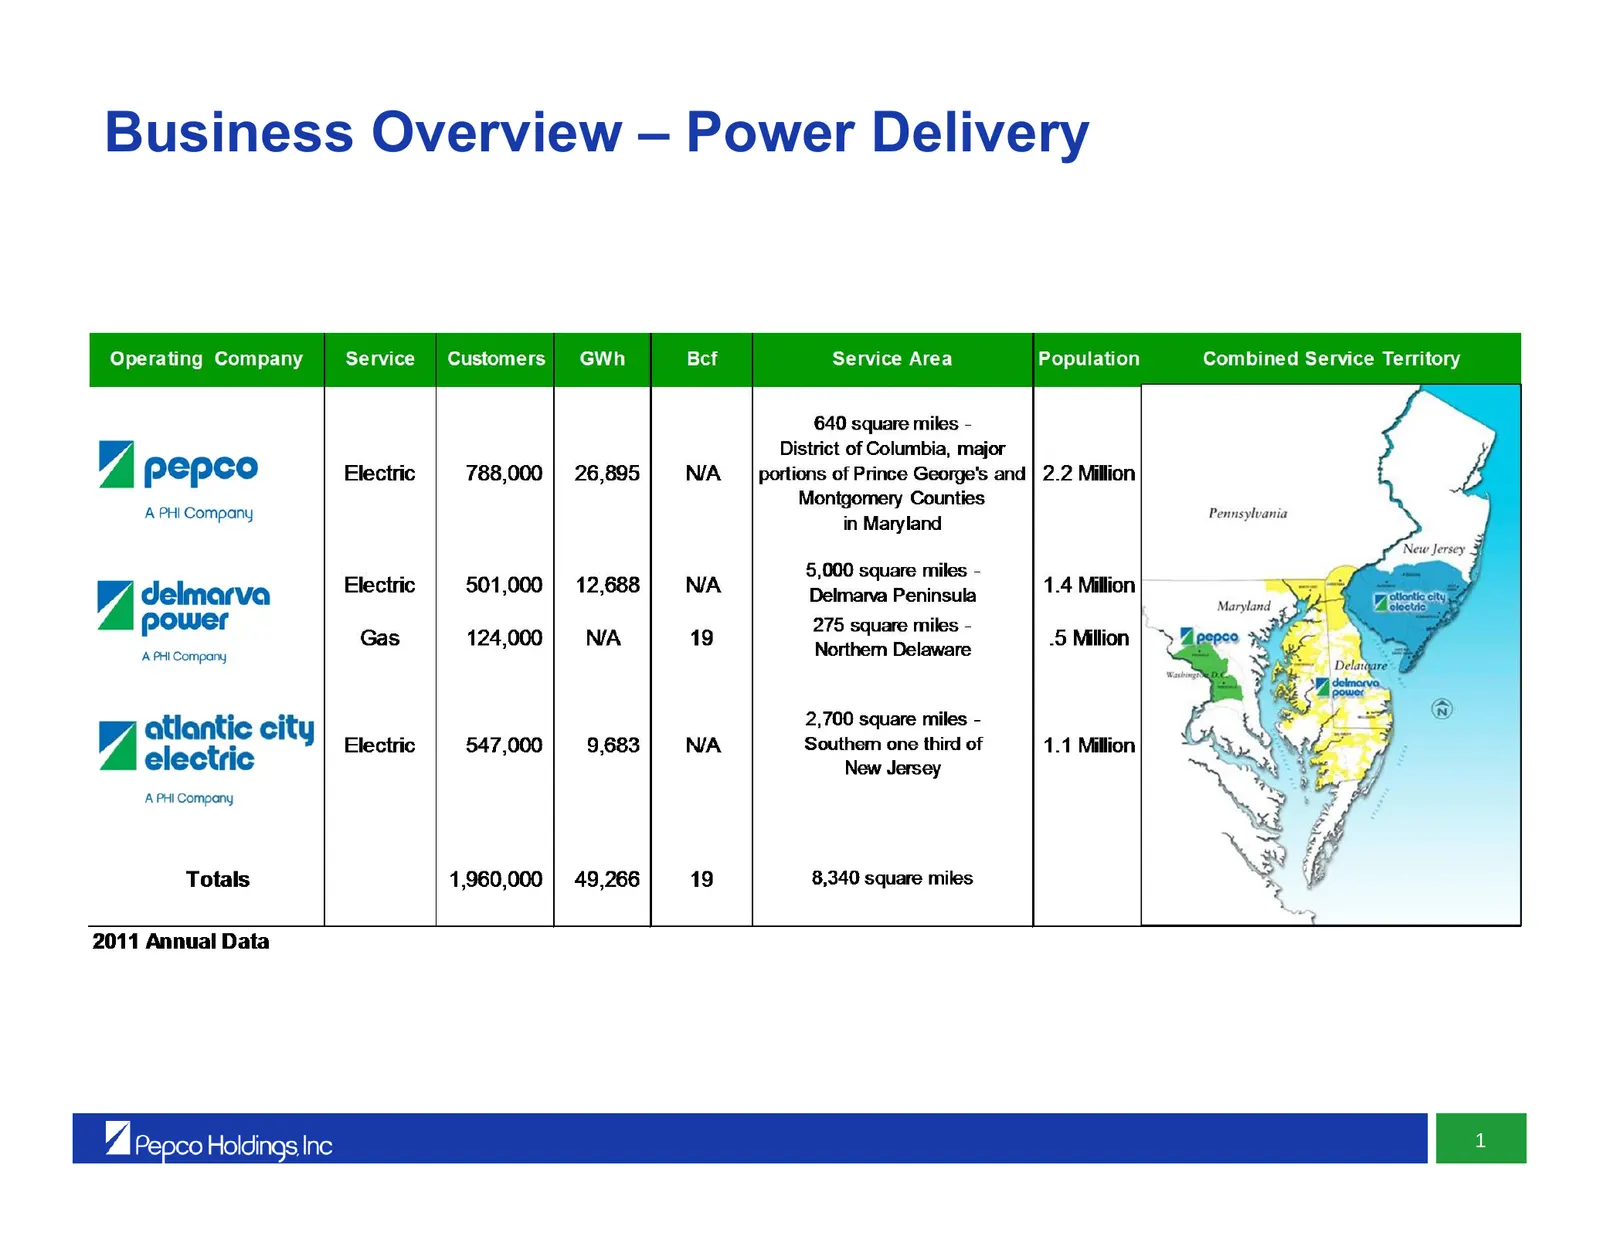
Business Overview – Power Delivery 1
Slide 20: 2011 Highlights
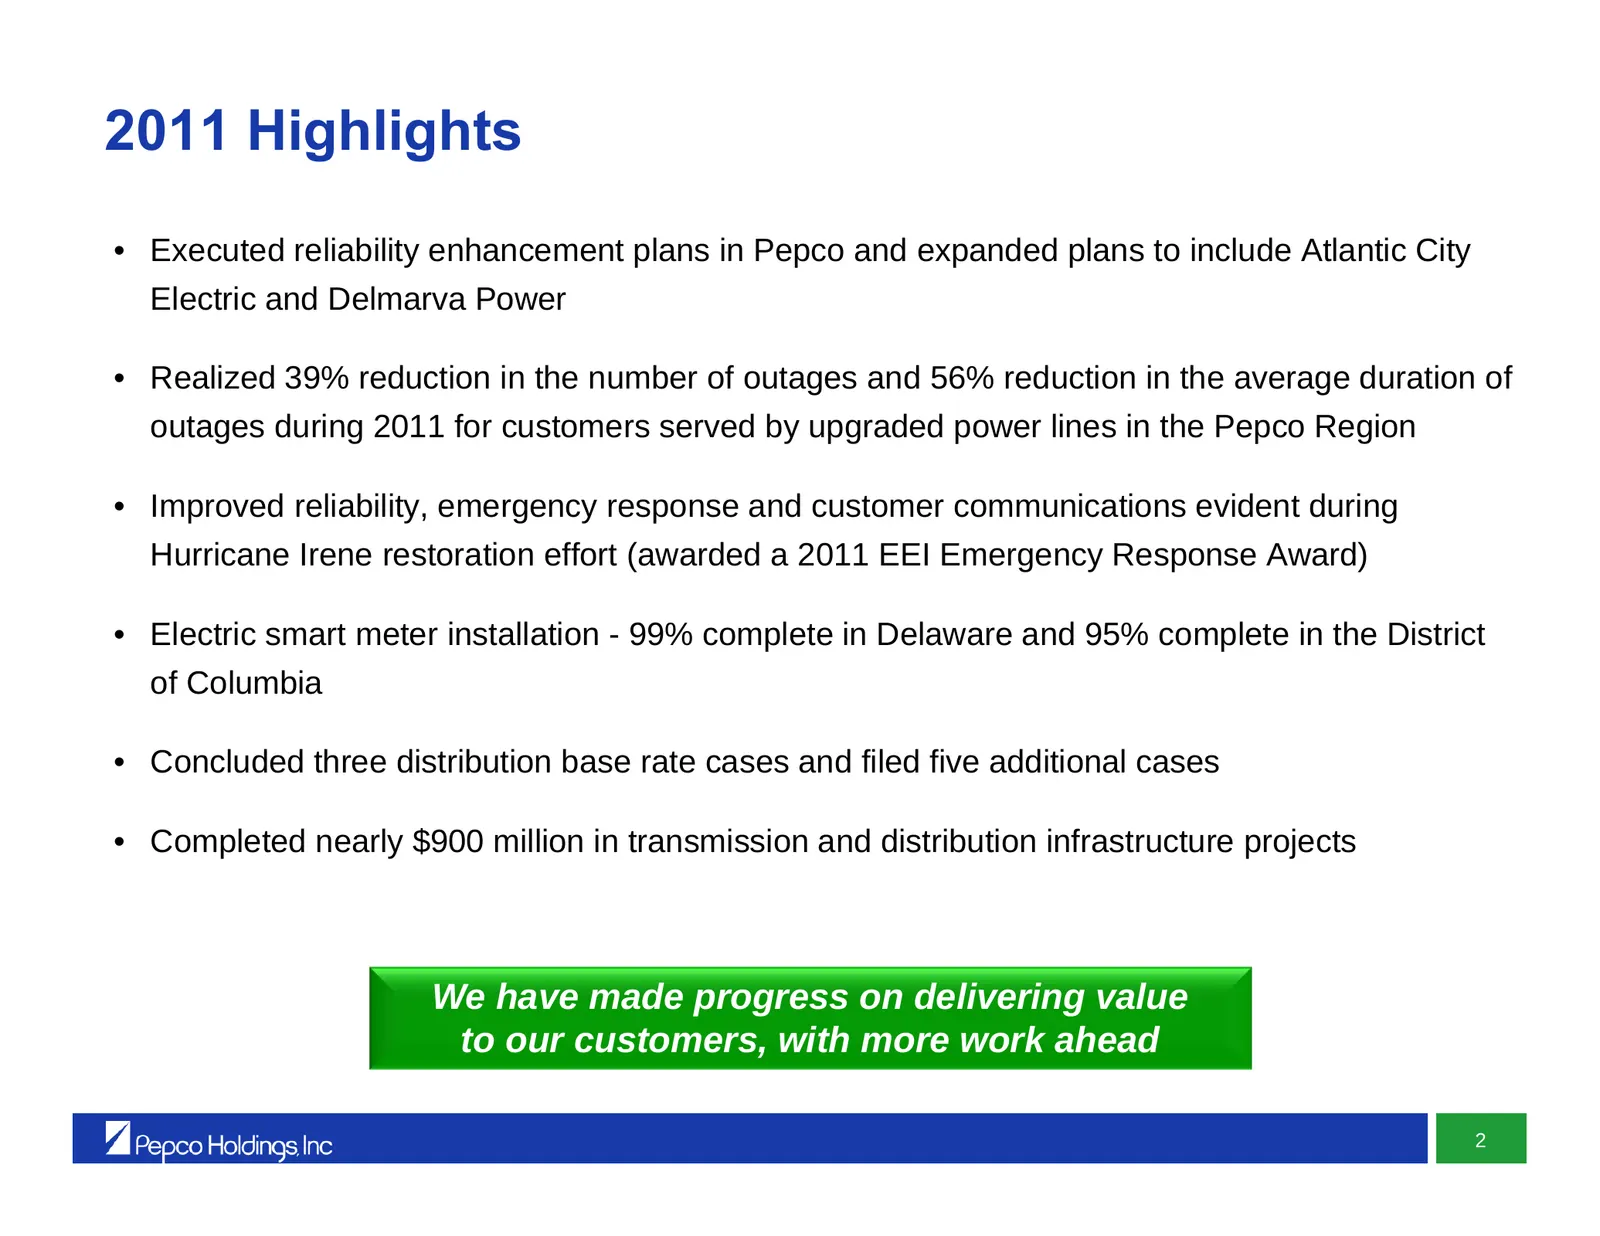
2011 Highlights • Executed reliability enhancement plans in Pepco and expanded plans to include Atlantic City Electric and Delmarva Power • Realized 39% reduction in the number of outages and 56% reduction in the average duration of outages during 2011 for customers served by upgraded power lines in
Slide 21: 2012 Focus – Continuing to Build on 2011 Progress
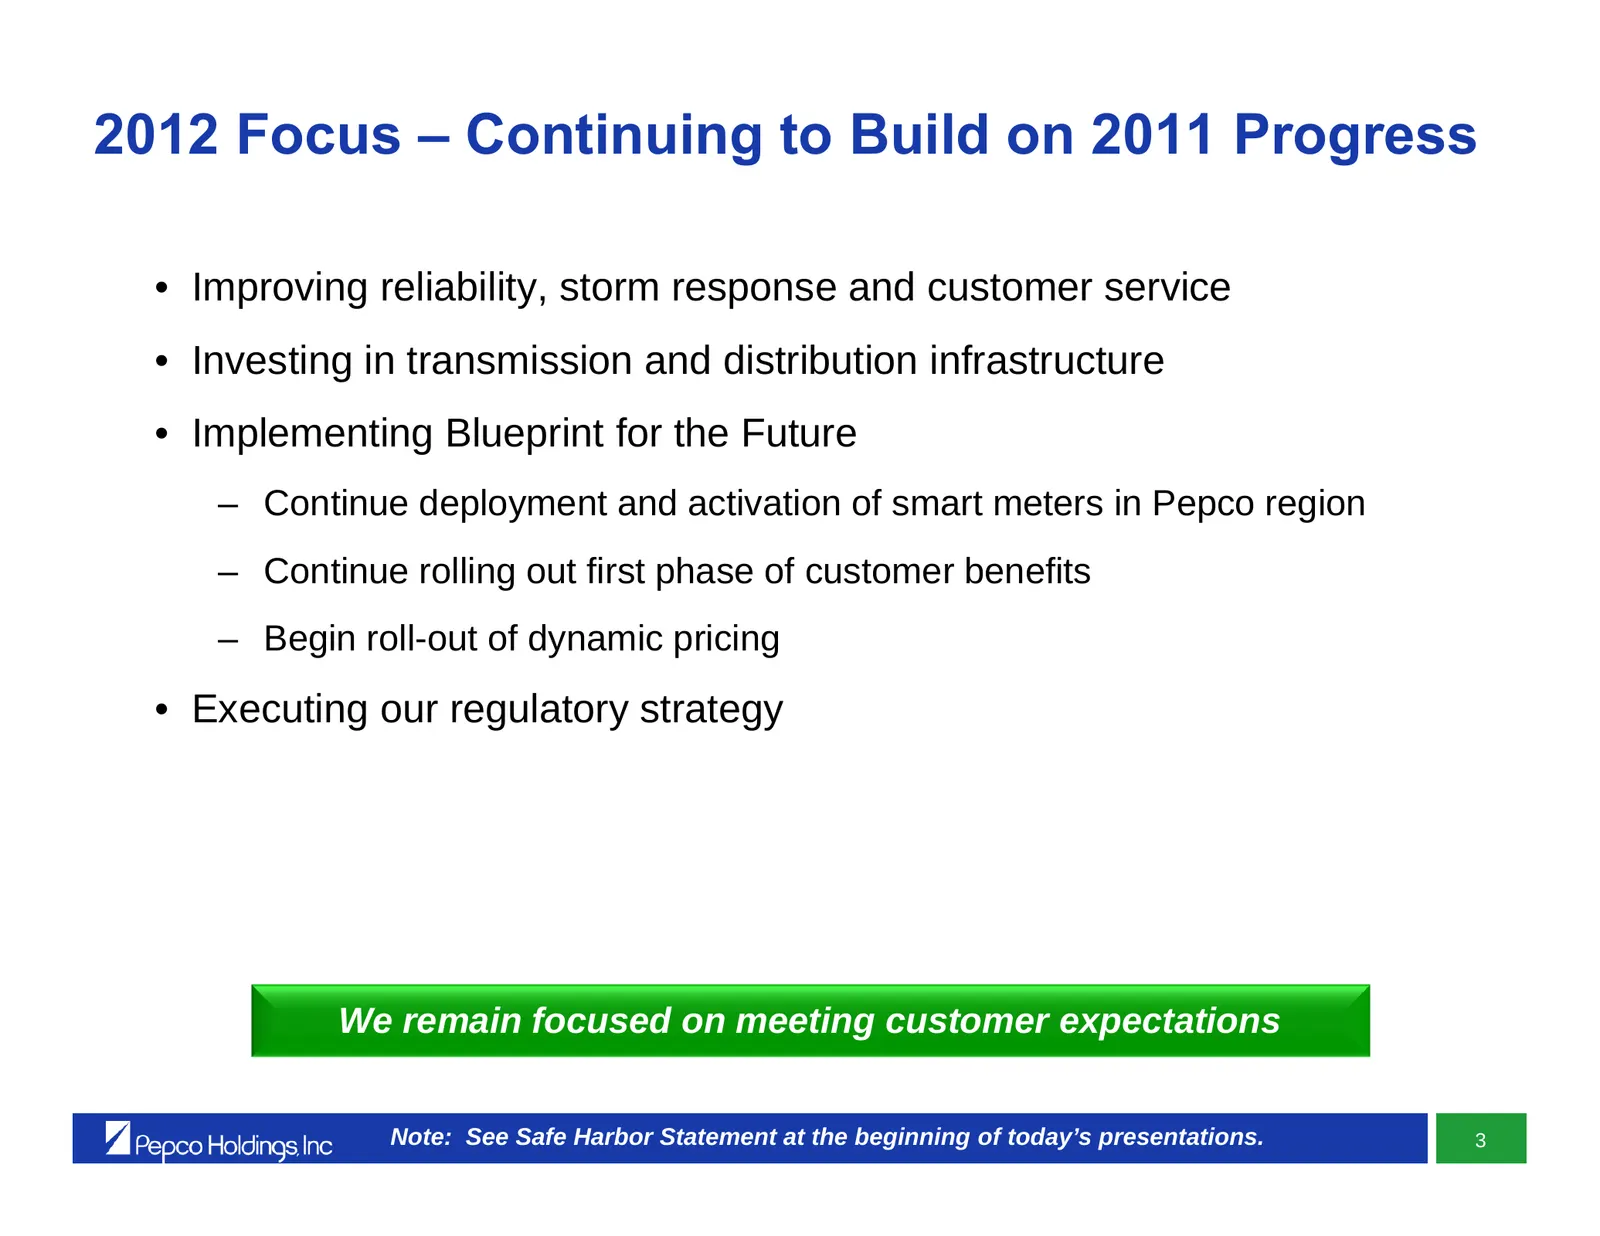
2012 Focus – Continuing to Build on 2011 Progress • Improving reliability, storm response and customer service • Investing in transmission and distribution infrastructure • Implementing Blueprint for the Future – Continue deployment and activation of smart meters in Pepco region – Continue rolling o
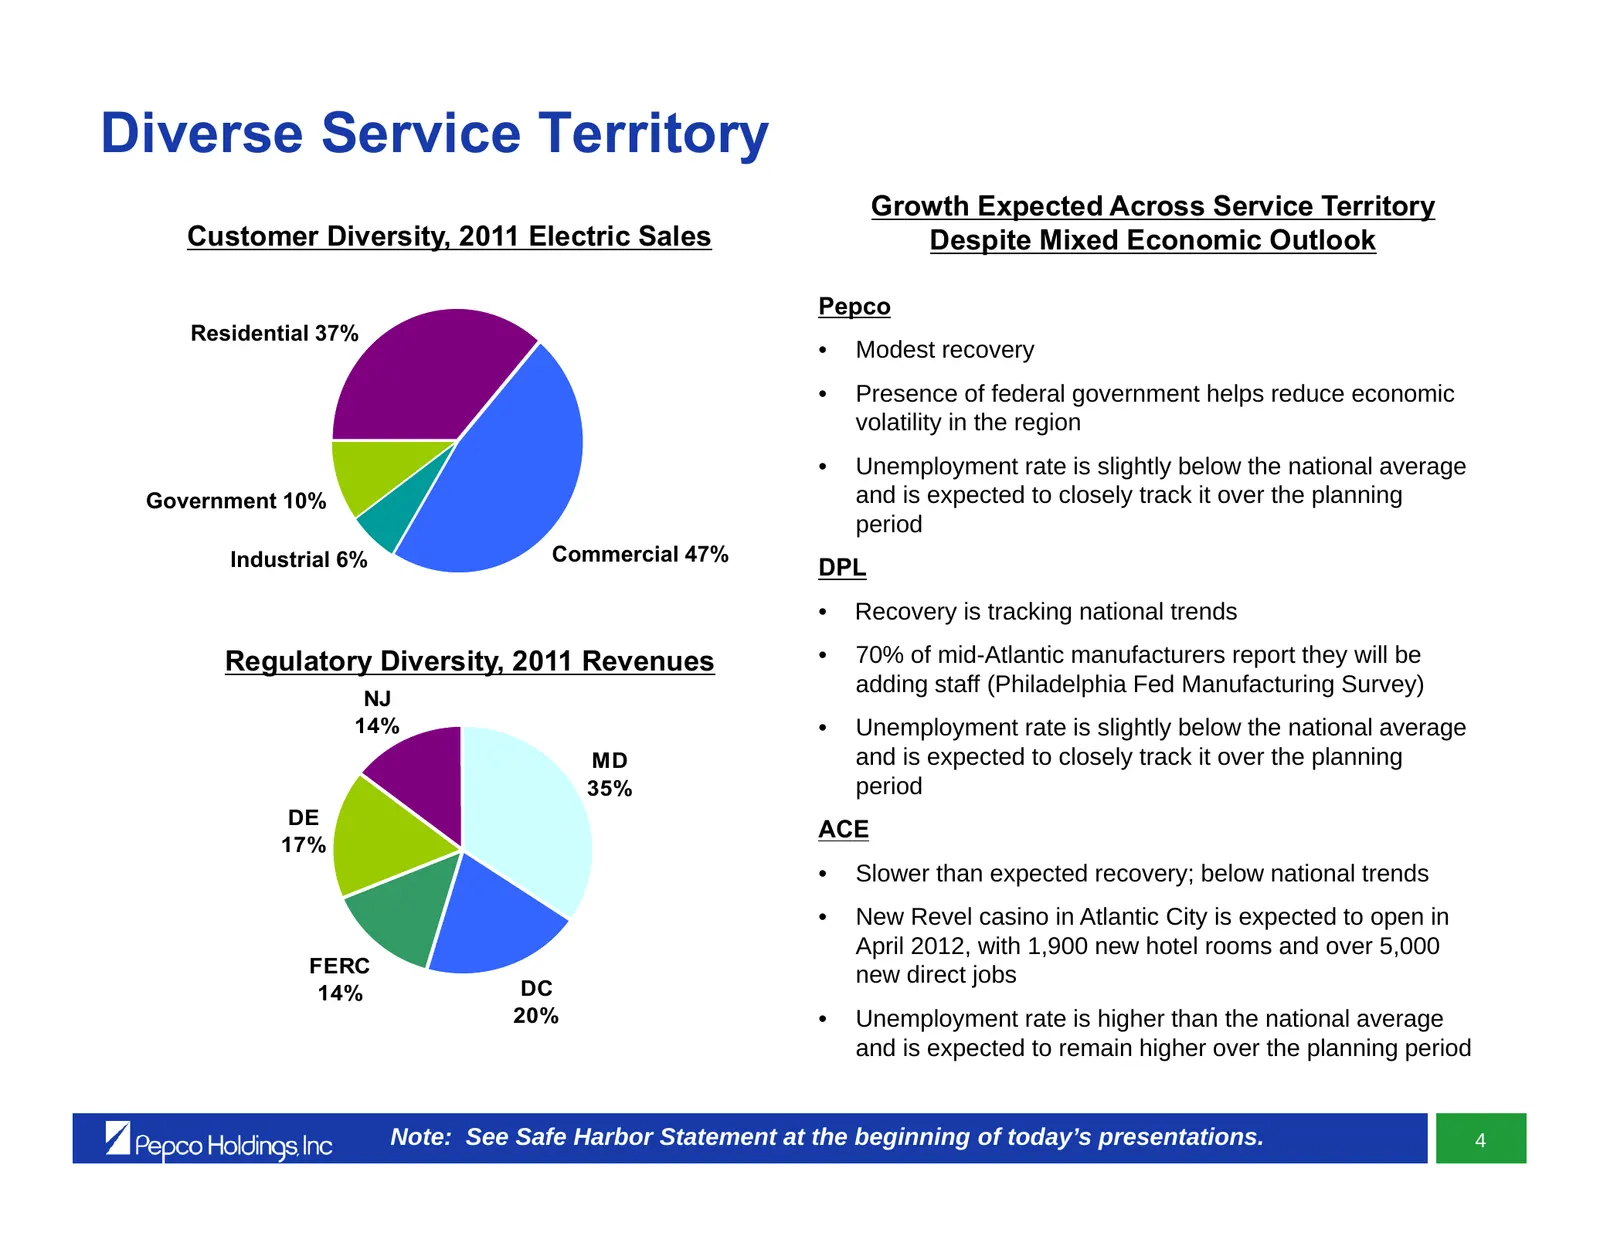
Slide 22: Diverse Service Territory
Diverse Service Territory Growth Expected Across Service Territory Customer Diversity, 2011 Electric Sales Despite Mixed Economic Outlook Pepco Residential 37% • Modest recovery • Presence of federal government helps reduce economic volatility in the region • Unemployment rate is slightly below the
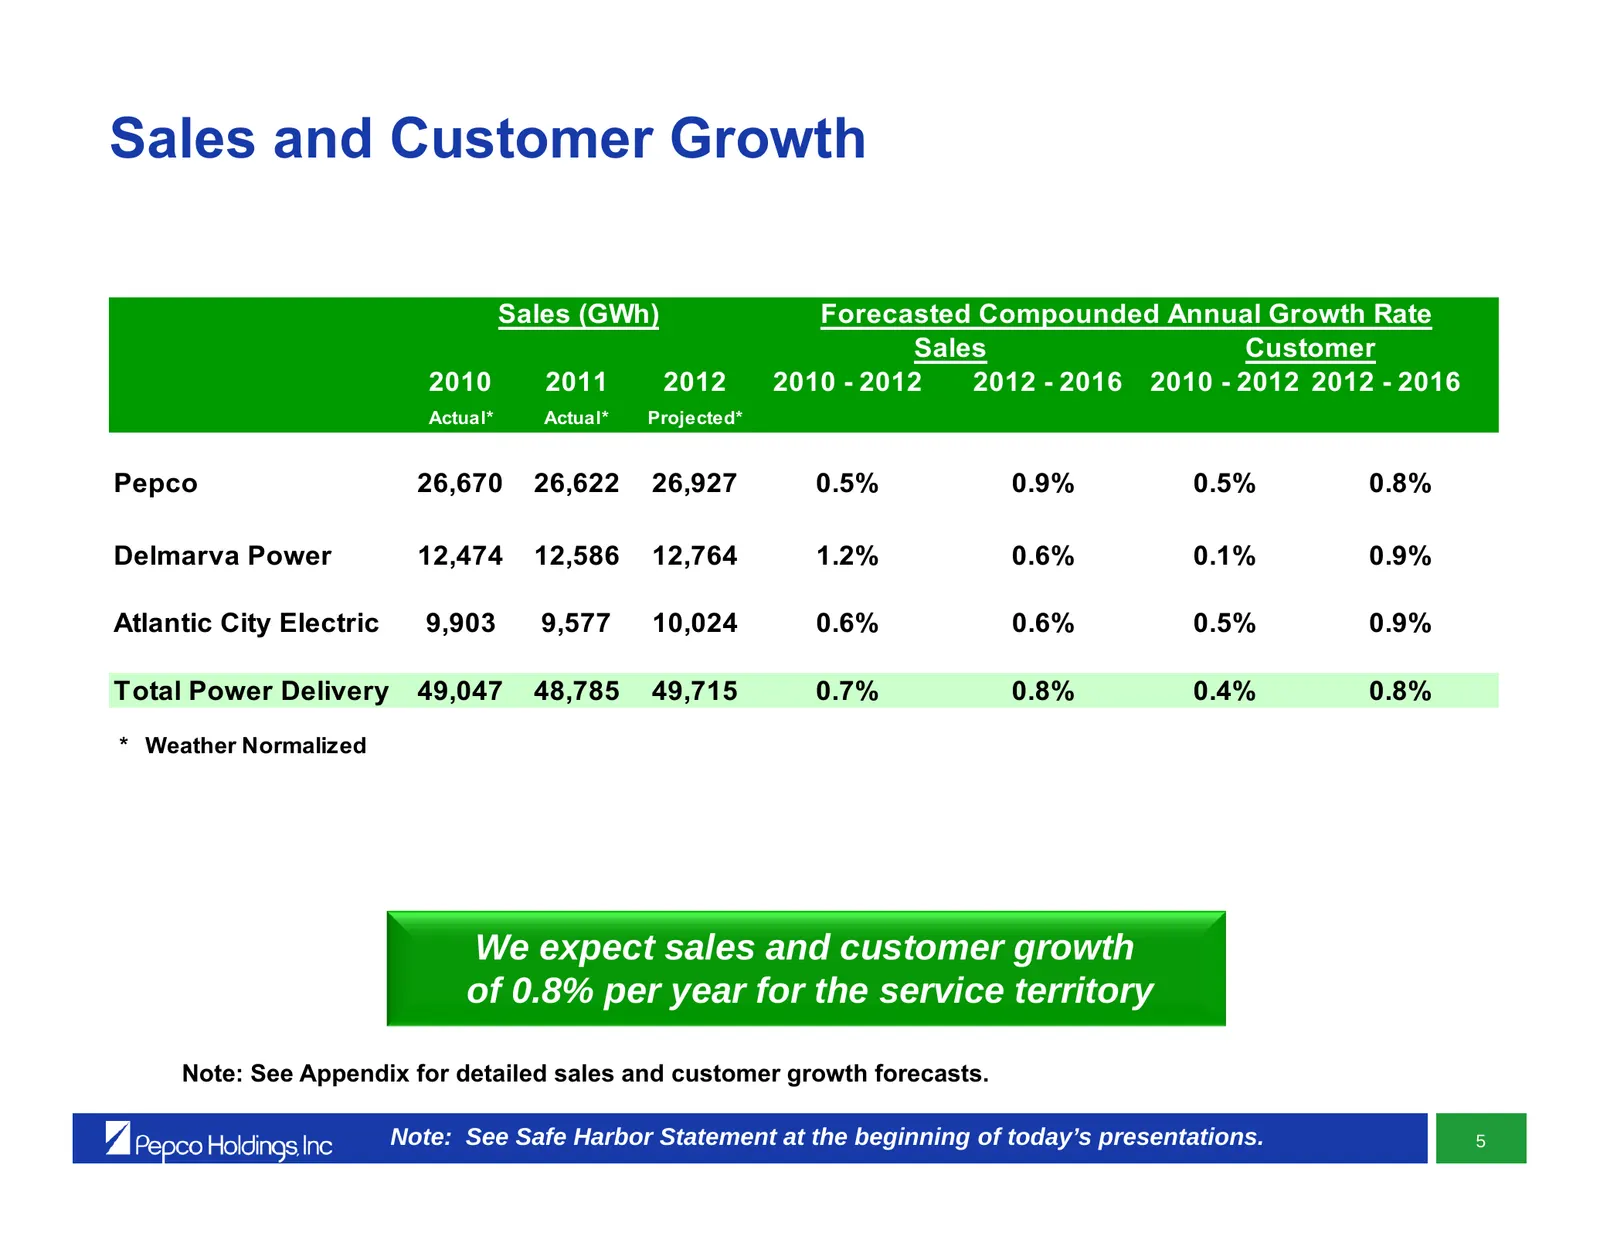
Slide 23: Sales and Customer Growth
Sales and Customer Growth Sales (GWh) Forecasted Compounded Annual Growth Rate Sales Customer 2010 2011 2012 2010 - 2012 2012 - 2016 2010 - 2012 2012 - 2016 Actual* Actual* Projected* Pepco 26,670 26,622 26,927 0.5% 0.9% 0.5% 0.8% Delmarva Power 12,474 12,586 12,764 1.2% 0.6% 0.1% 0.9% Atlantic City
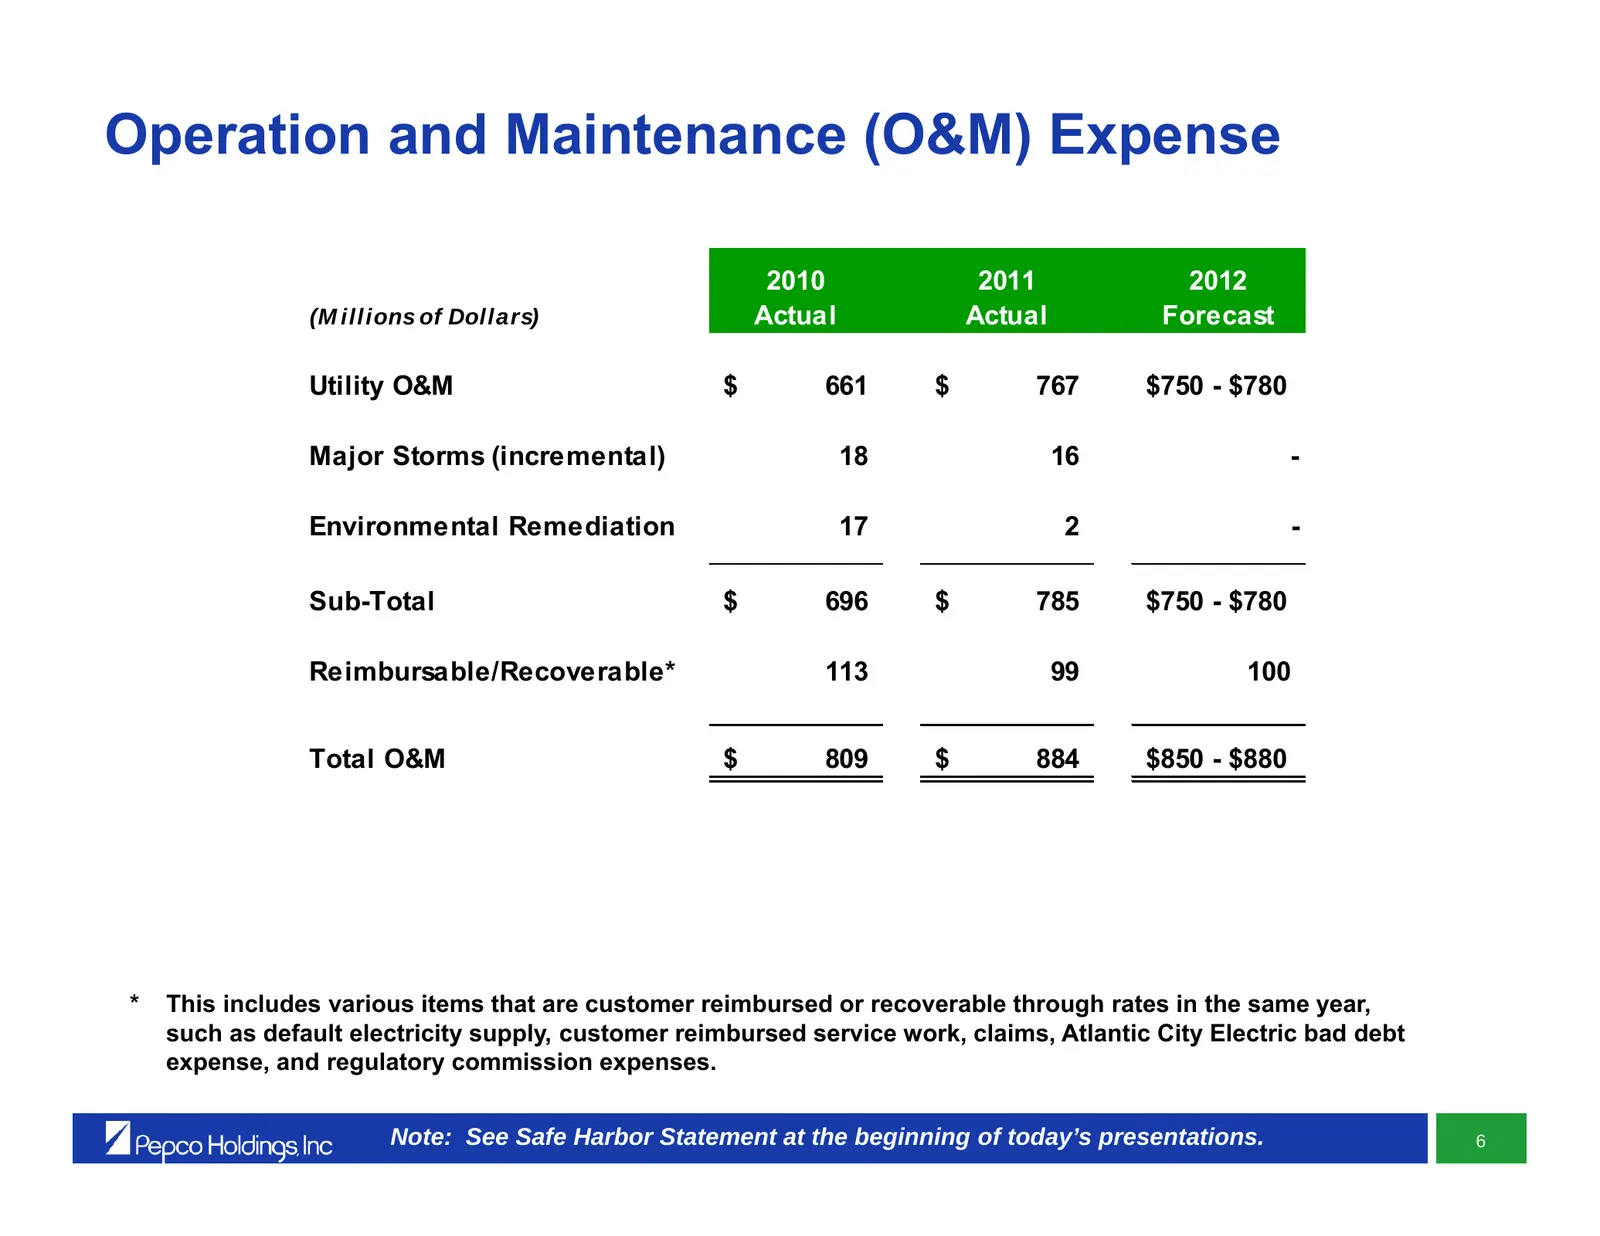
Slide 24: Operation and Maintenance (O&M) Expense
Operation and Maintenance (O&M) Expense 2010 2011 2012 (M illions of Dollars) Actual Actual Forecast Utility O&M $ 661 $ 767 $750 - $780 Major Storms (incremental) 18 16 - Environmental Remediation 17 2 - Sub-Total $ 696 $ 785 $750 - $780 Reimbursable/Recoverable* 113 99 100 Total O&M $ 809 $ 884 $8
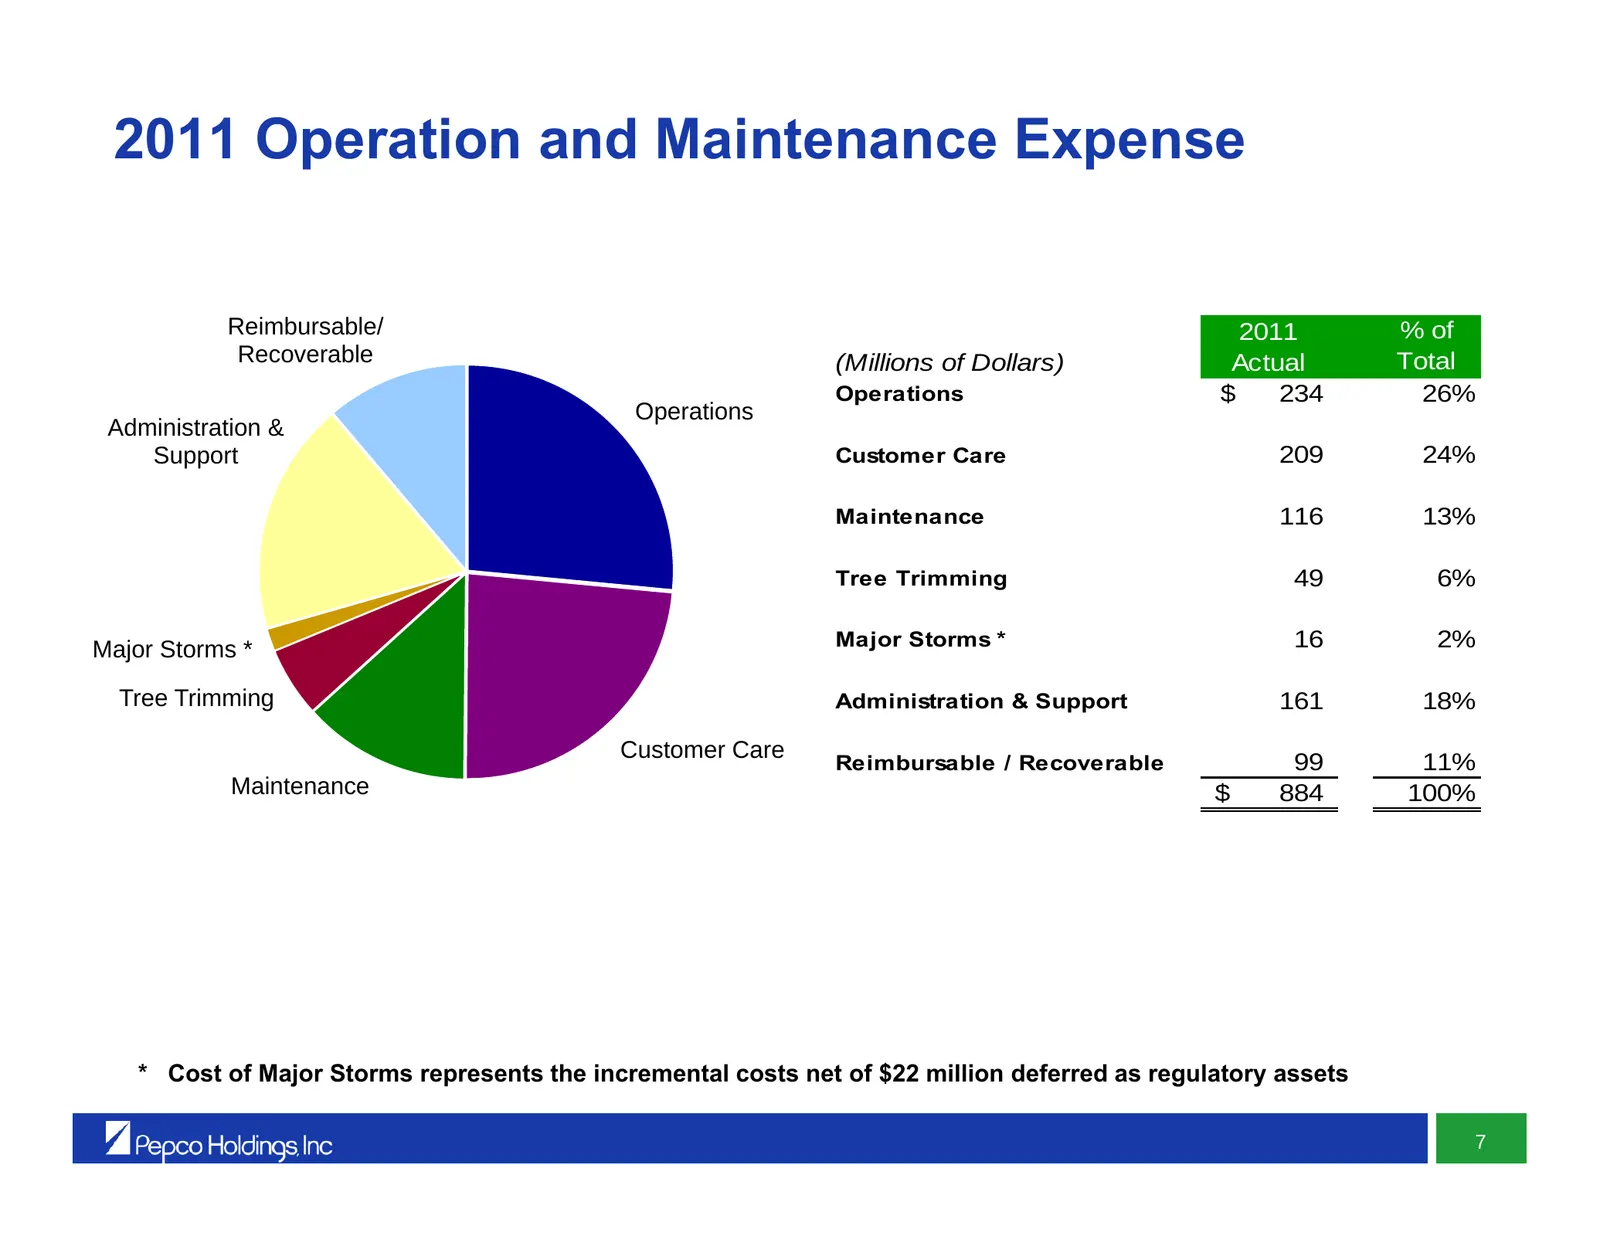
Slide 25: 2011 Operation and Maintenance Expense
2011 Operation and Maintenance Expense Reimbursable/ 2011 % of Recoverable (Millions of Dollars) Actual Total Operations $ 234 26% Operations Administration & Support Customer Care 209 24% Maintenance 116 13% Tree Trimming 49 6% Major Storms * Major Storms * 16 2% Tree Trimming Administration & Supp
Slide 26: Forecast Construction Expenditures – 2012 - 2016
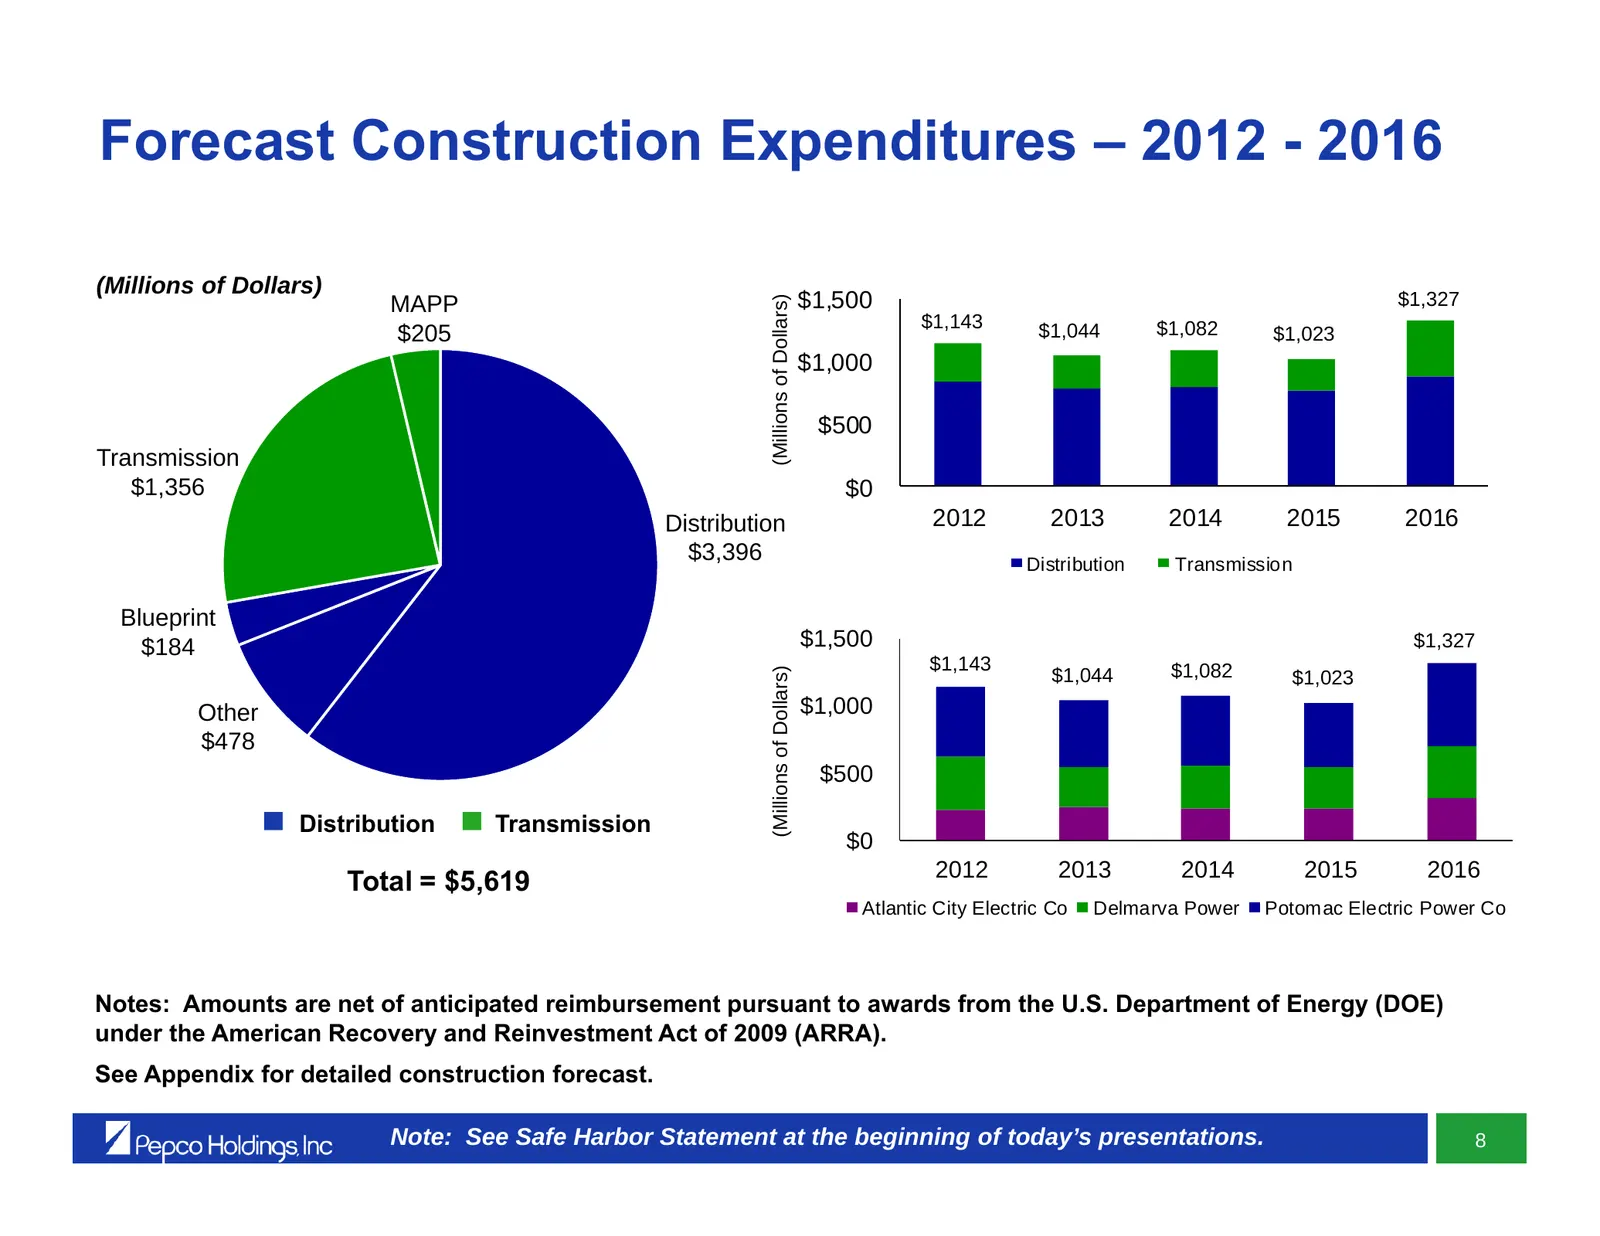
Forecast Construction Expenditures – 2012 - 2016 (Millions of Dollars) $1,500 $1,327 (Millions of Dollars) MAPP $1,143 $1,044 $1,082 $205 $1,023 $1,000 $500 Transmission $1,356 $0 Distribution 2012 2013 2014 2015 2016 $3,396 Distribution Transmission Blueprint $184 $1,500 $1,327 $1,143 $1,082 (Milli
Slide 27: Distribution Construction Expenditures – 2012 - 2016
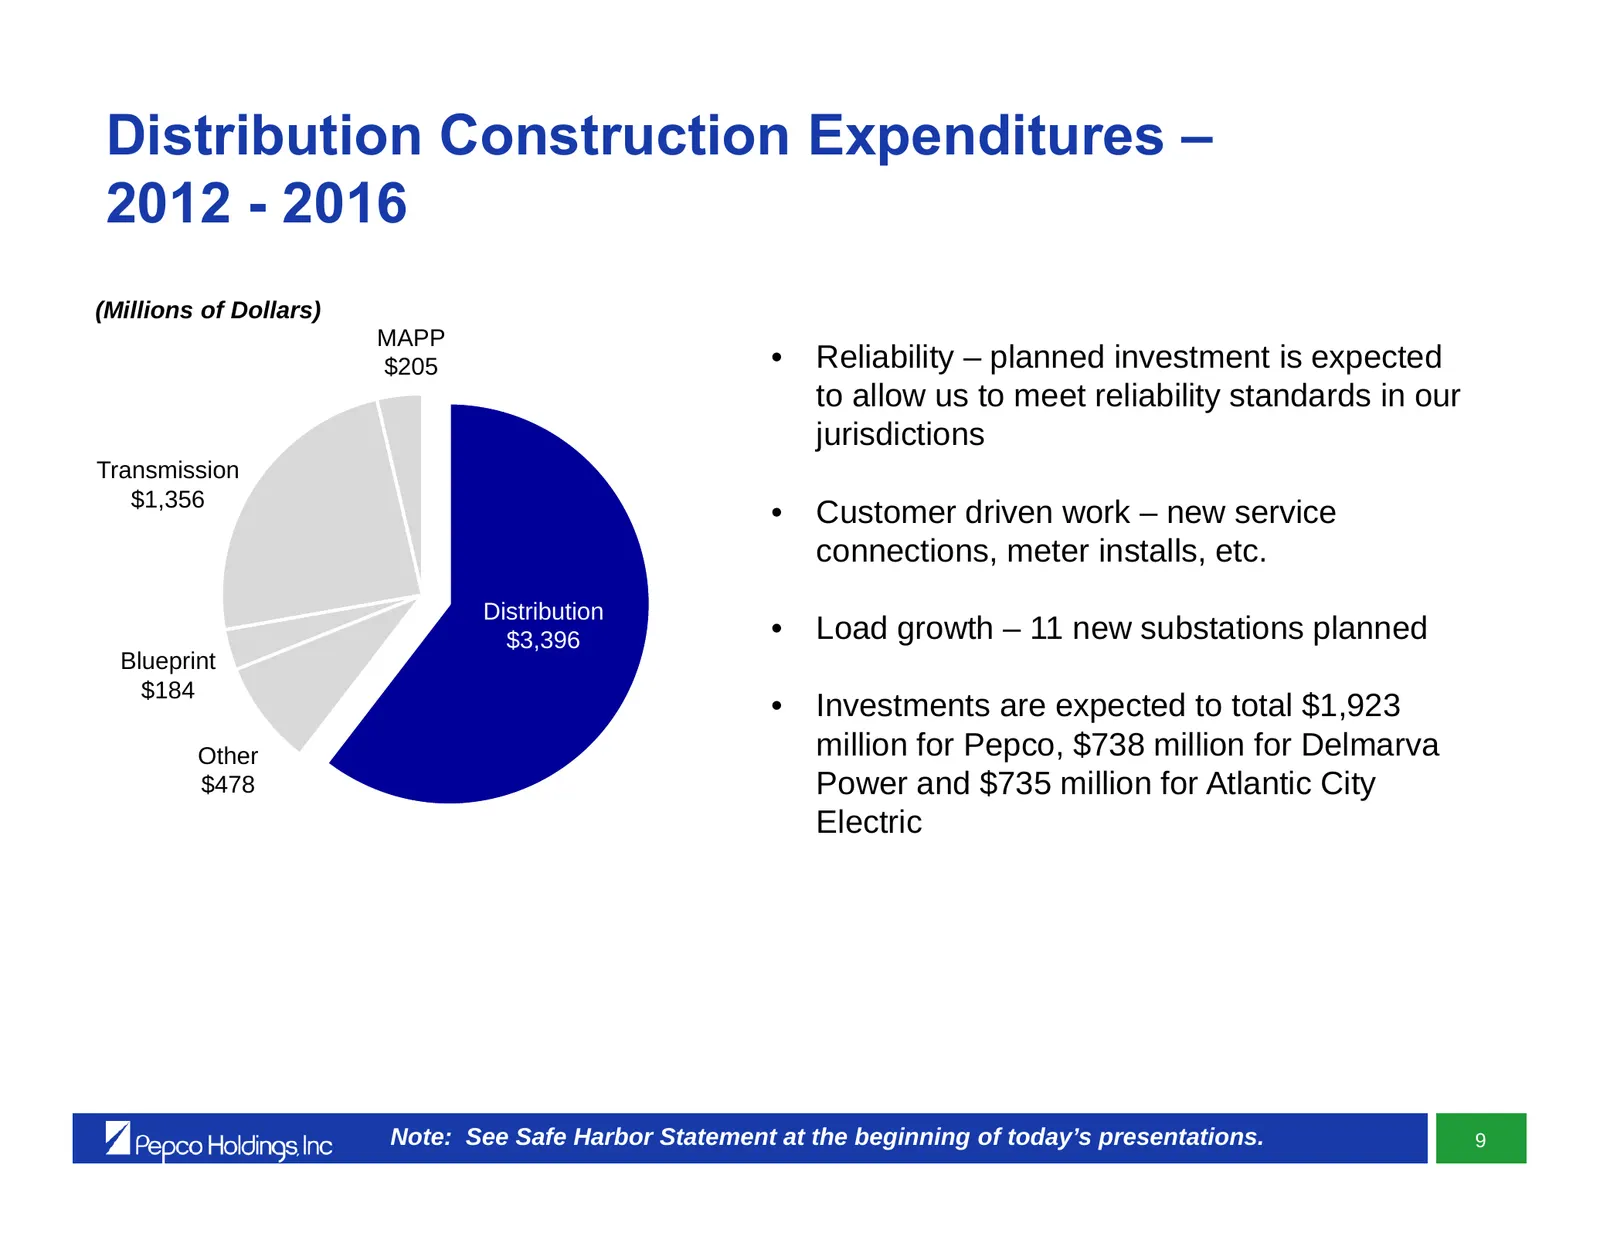
Distribution Construction Expenditures – 2012 - 2016 (Millions of Dollars) MAPP $205 • Reliability – planned investment is expected to allow us to meet reliability standards in our jurisdictions Transmission $1,356 • Customer driven work – new service connections, meter installs, etc. Distribution $
Slide 28: Distribution Expenditure Detail
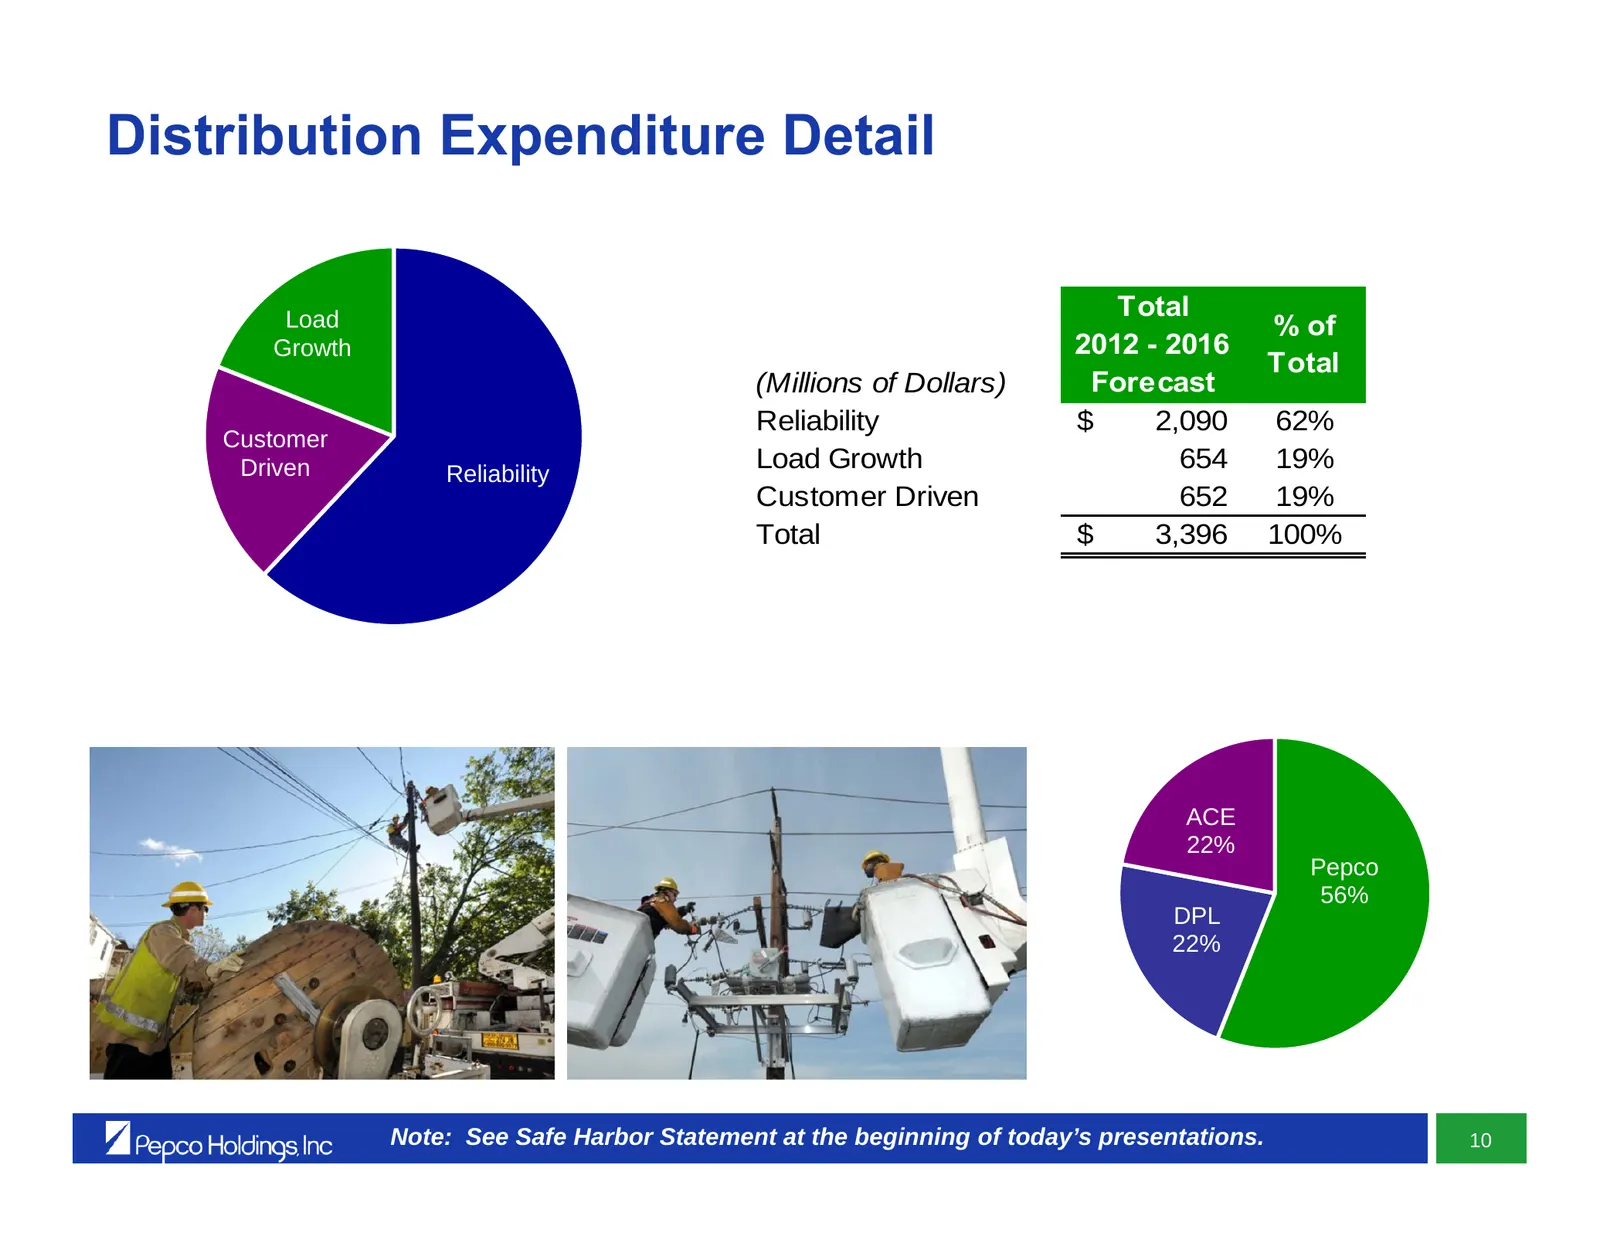
Distribution Expenditure Detail Total Load % of Growth 2012 - 2016 Total (Millions of Dollars) Forecast Reliability $ 2,090 62% Customer Driven Reliability Load Growth 654 19% Customer Driven 652 19% Total $ 3,396 100% ACE 22% Pepco 56% DPL 22% Note: See Safe Harbor Statement at the beginning of tod
Slide 29: Reliability Standards – Maryland
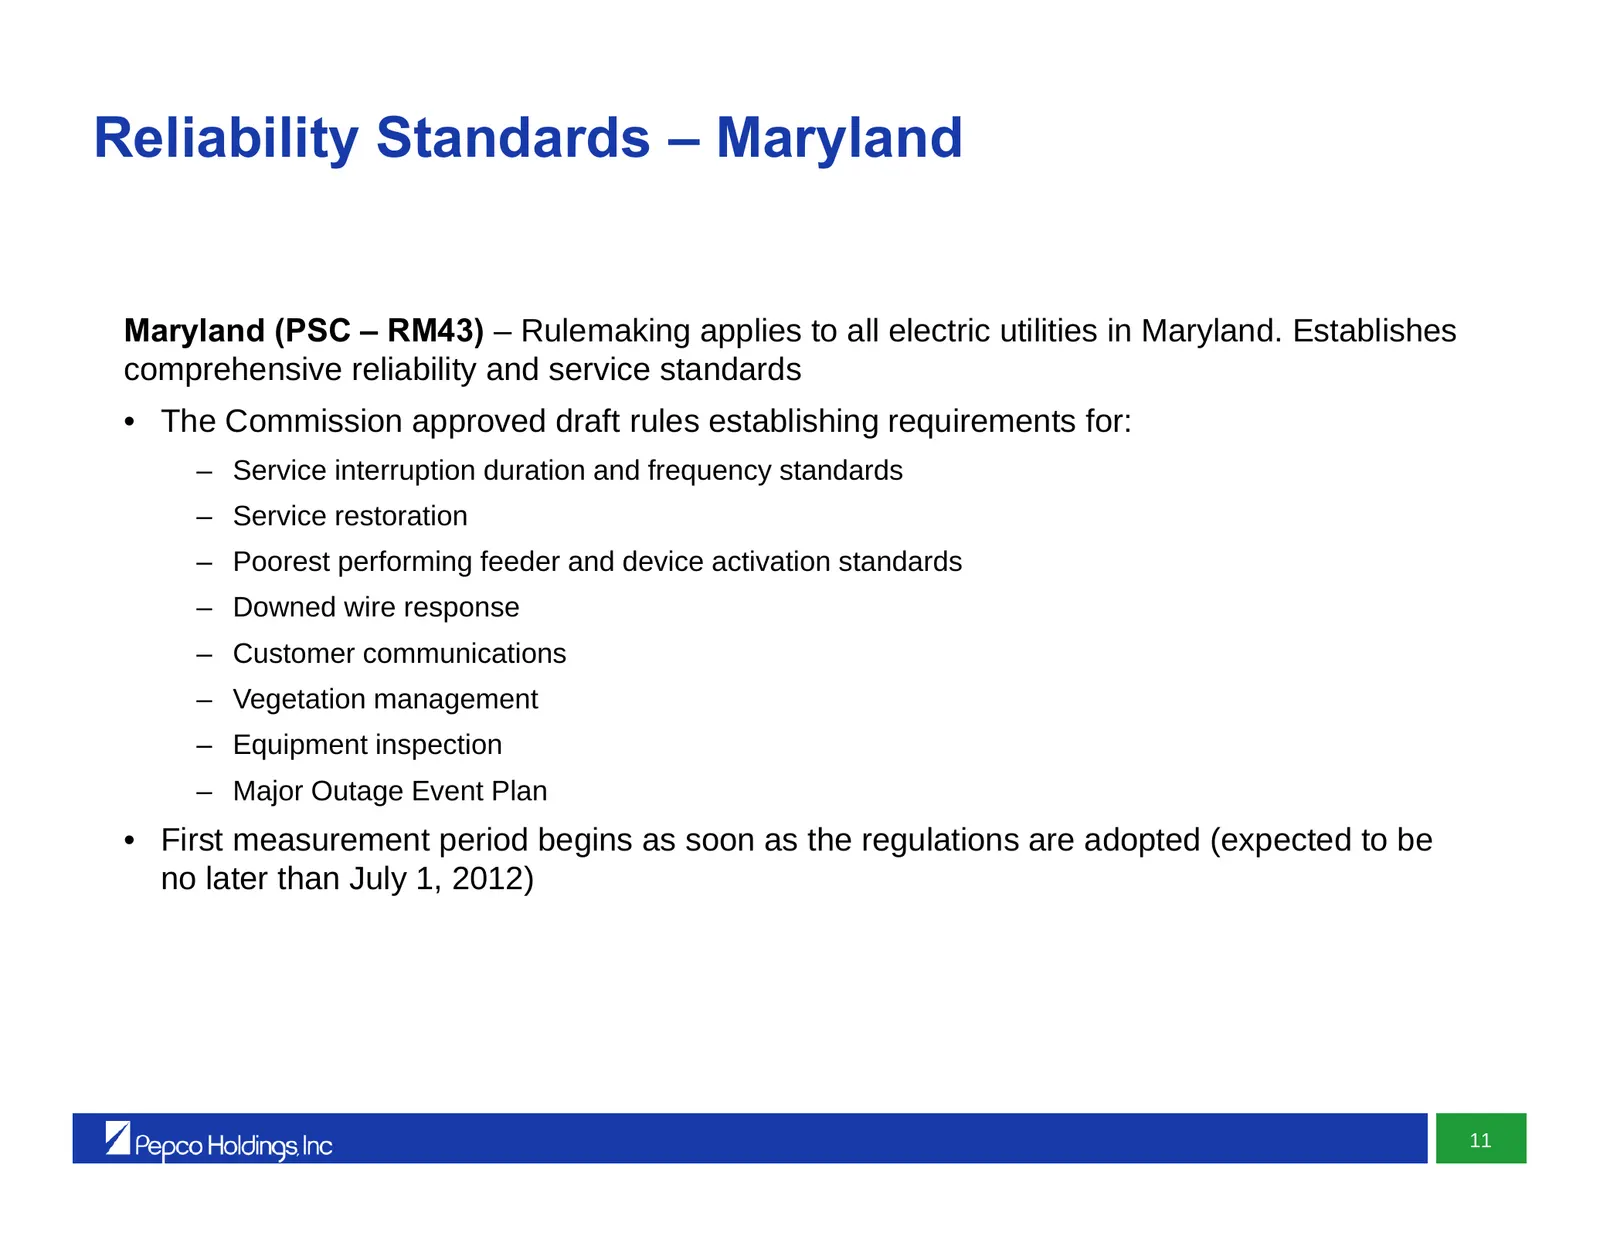
Reliability Standards – Maryland Maryland (PSC – RM43) – Rulemaking applies to all electric utilities in Maryland. Establishes comprehensive reliability and service standards • The Commission approved draft rules establishing requirements for: – Service interruption duration and frequency standards
Slide 30: Reliability Standards – District of Columbia
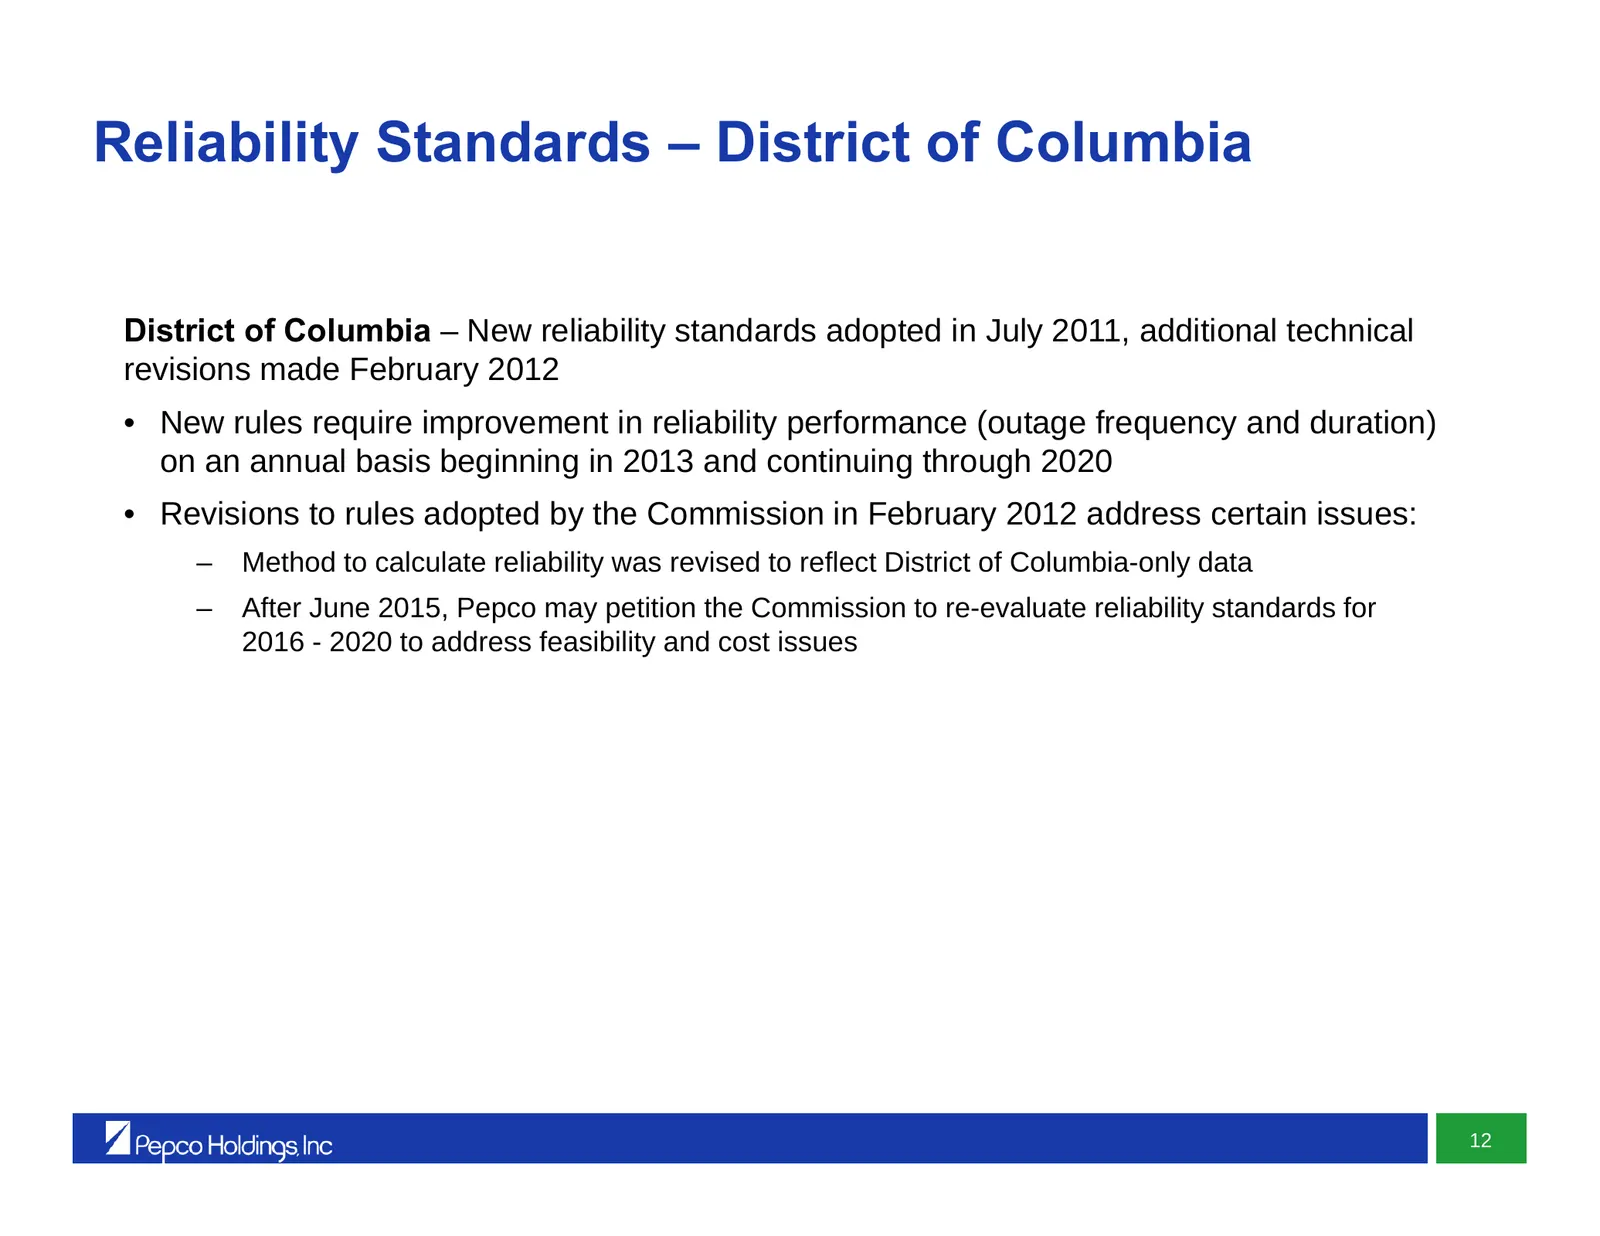
Reliability Standards – District of Columbia District of Columbia – New reliability standards adopted in July 2011, additional technical revisions made February 2012 • New rules require improvement in reliability performance (outage frequency and duration) on an annual basis beginning in 2013 and co
Slide 31: Reliability Enhancement Plan – Improving System Reliability is a Top Priority
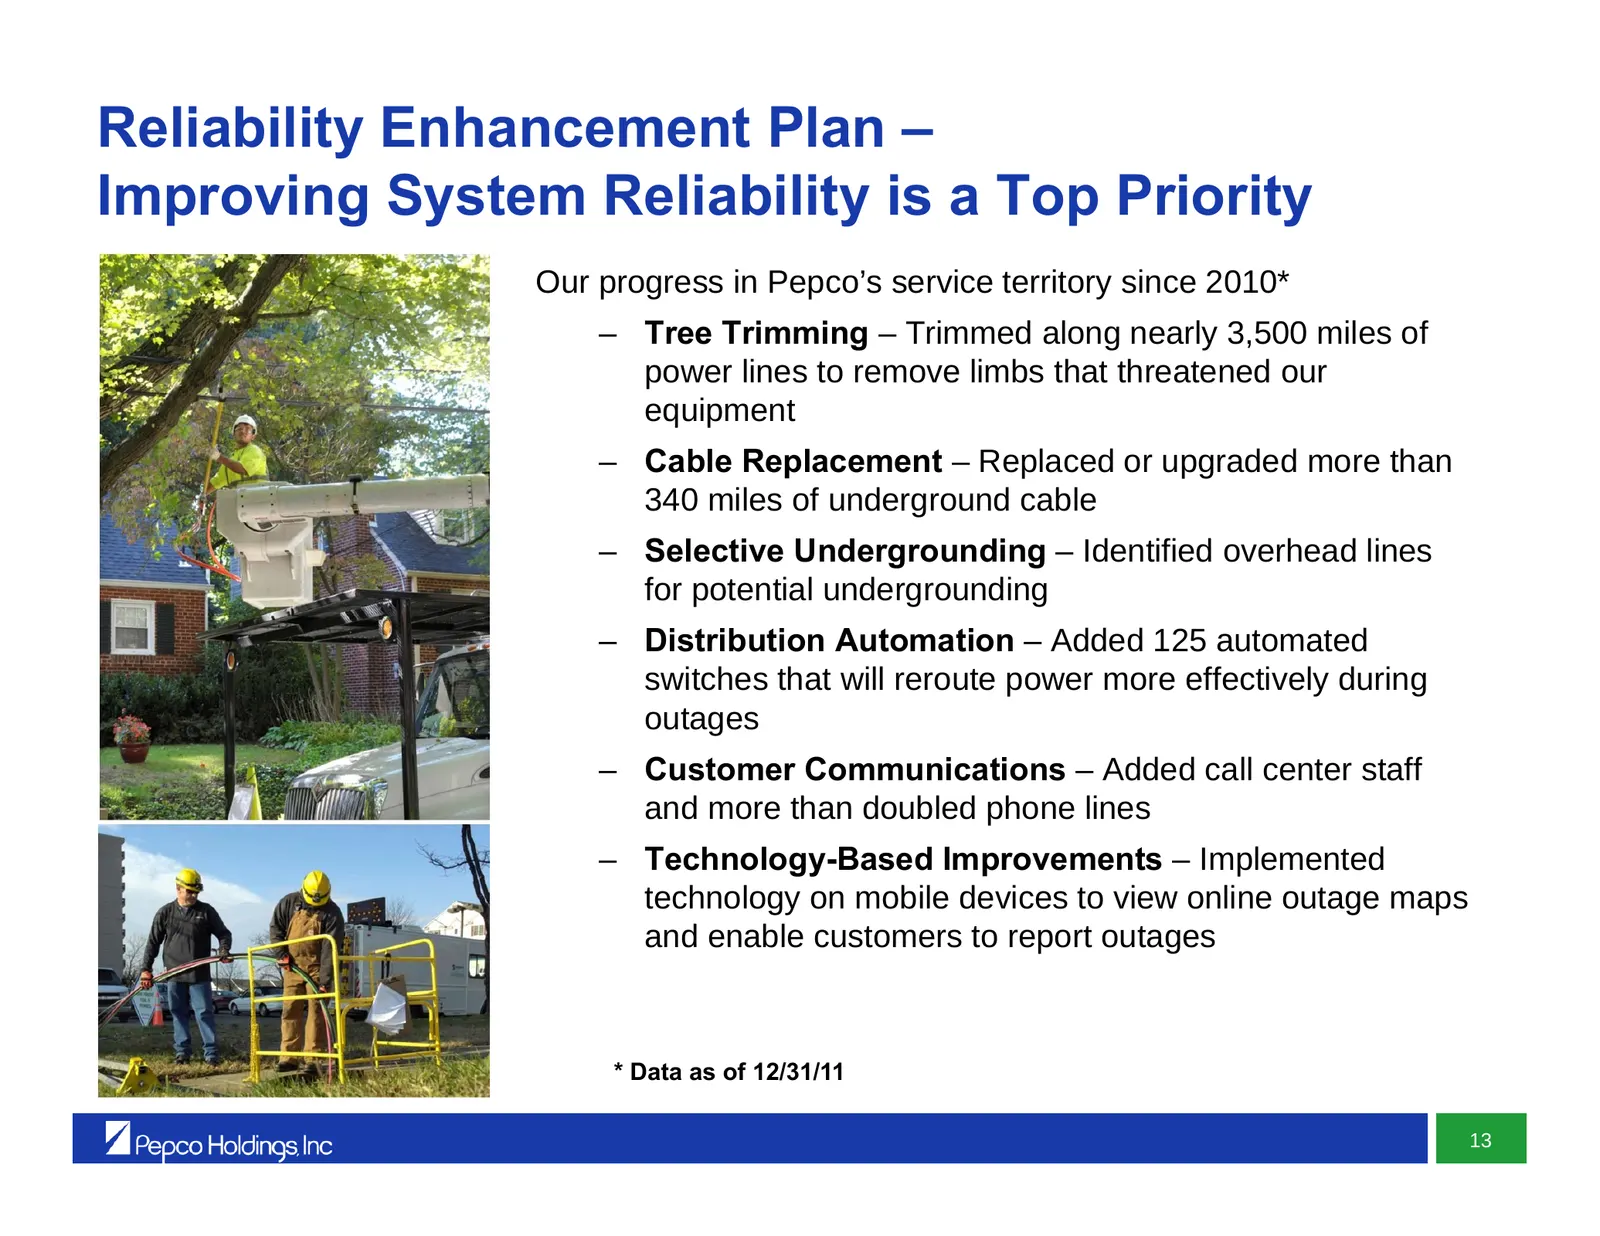
Reliability Enhancement Plan – Improving System Reliability is a Top Priority Our progress in Pepco’s service territory since 2010* – Tree Trimming – Trimmed along nearly 3,500 miles of power lines to remove limbs that threatened our equipment – Cable Replacement – Replaced or upgraded more than 340
Slide 32: Distribution Automation Benefits
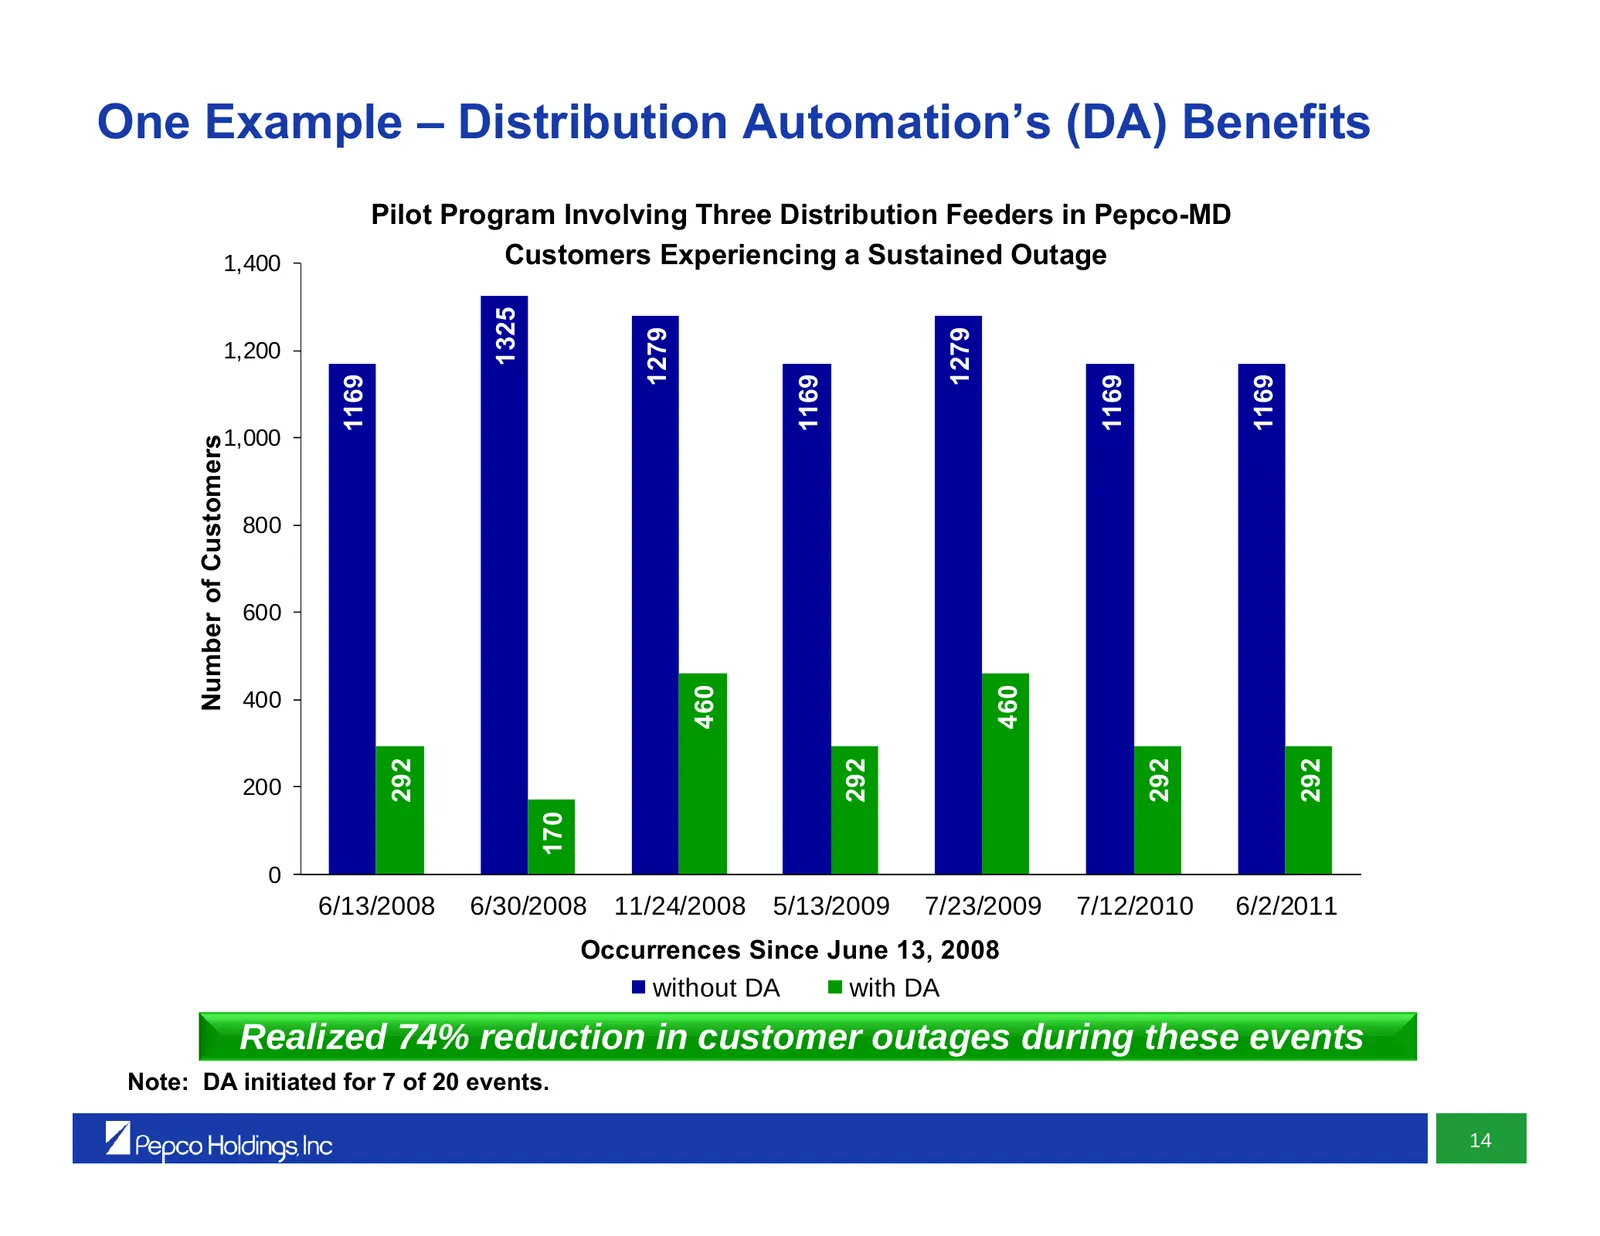
One Example – Distribution Automation’s (DA) Benefits Pilot Program Involving Three Distribution Feeders in Pepco-MD 1,400 Customers Experiencing a Sustained Outage 1325 1279 1279 1,200 1169 1169 1169 1169 1,000 Number of Customers 800 600 460 460 400 292 292 292 292 200 170 0 6/13/2008 6/30/2008 11
Slide 33: Transmission Construction Expenditures – 2012 - 2016
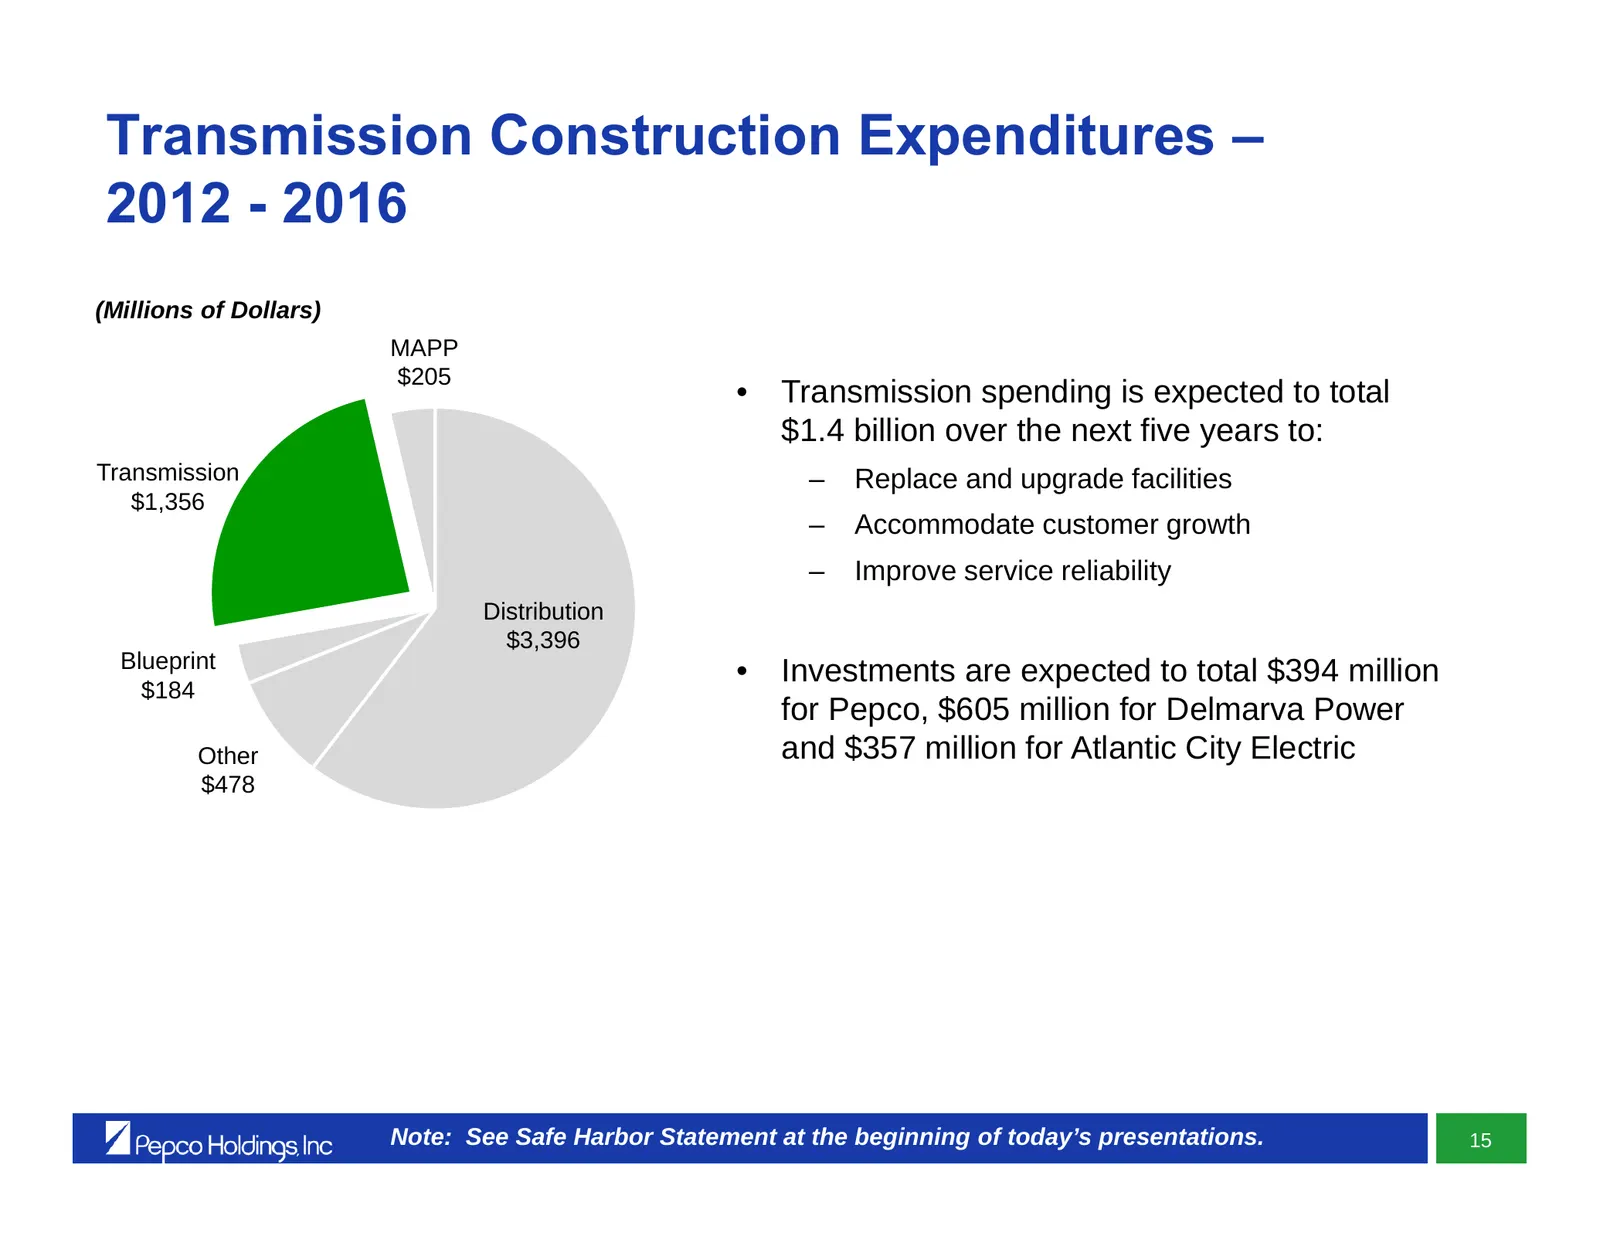
Transmission Construction Expenditures – 2012 - 2016 (Millions of Dollars) MAPP $205 • Transmission spending is expected to total $1.4 billion over the next five years to: Transmission – Replace and upgrade facilities $1,356 – Accommodate customer growth – Improve service reliability Distribution $3
Slide 34: Transmission Expenditure Detail
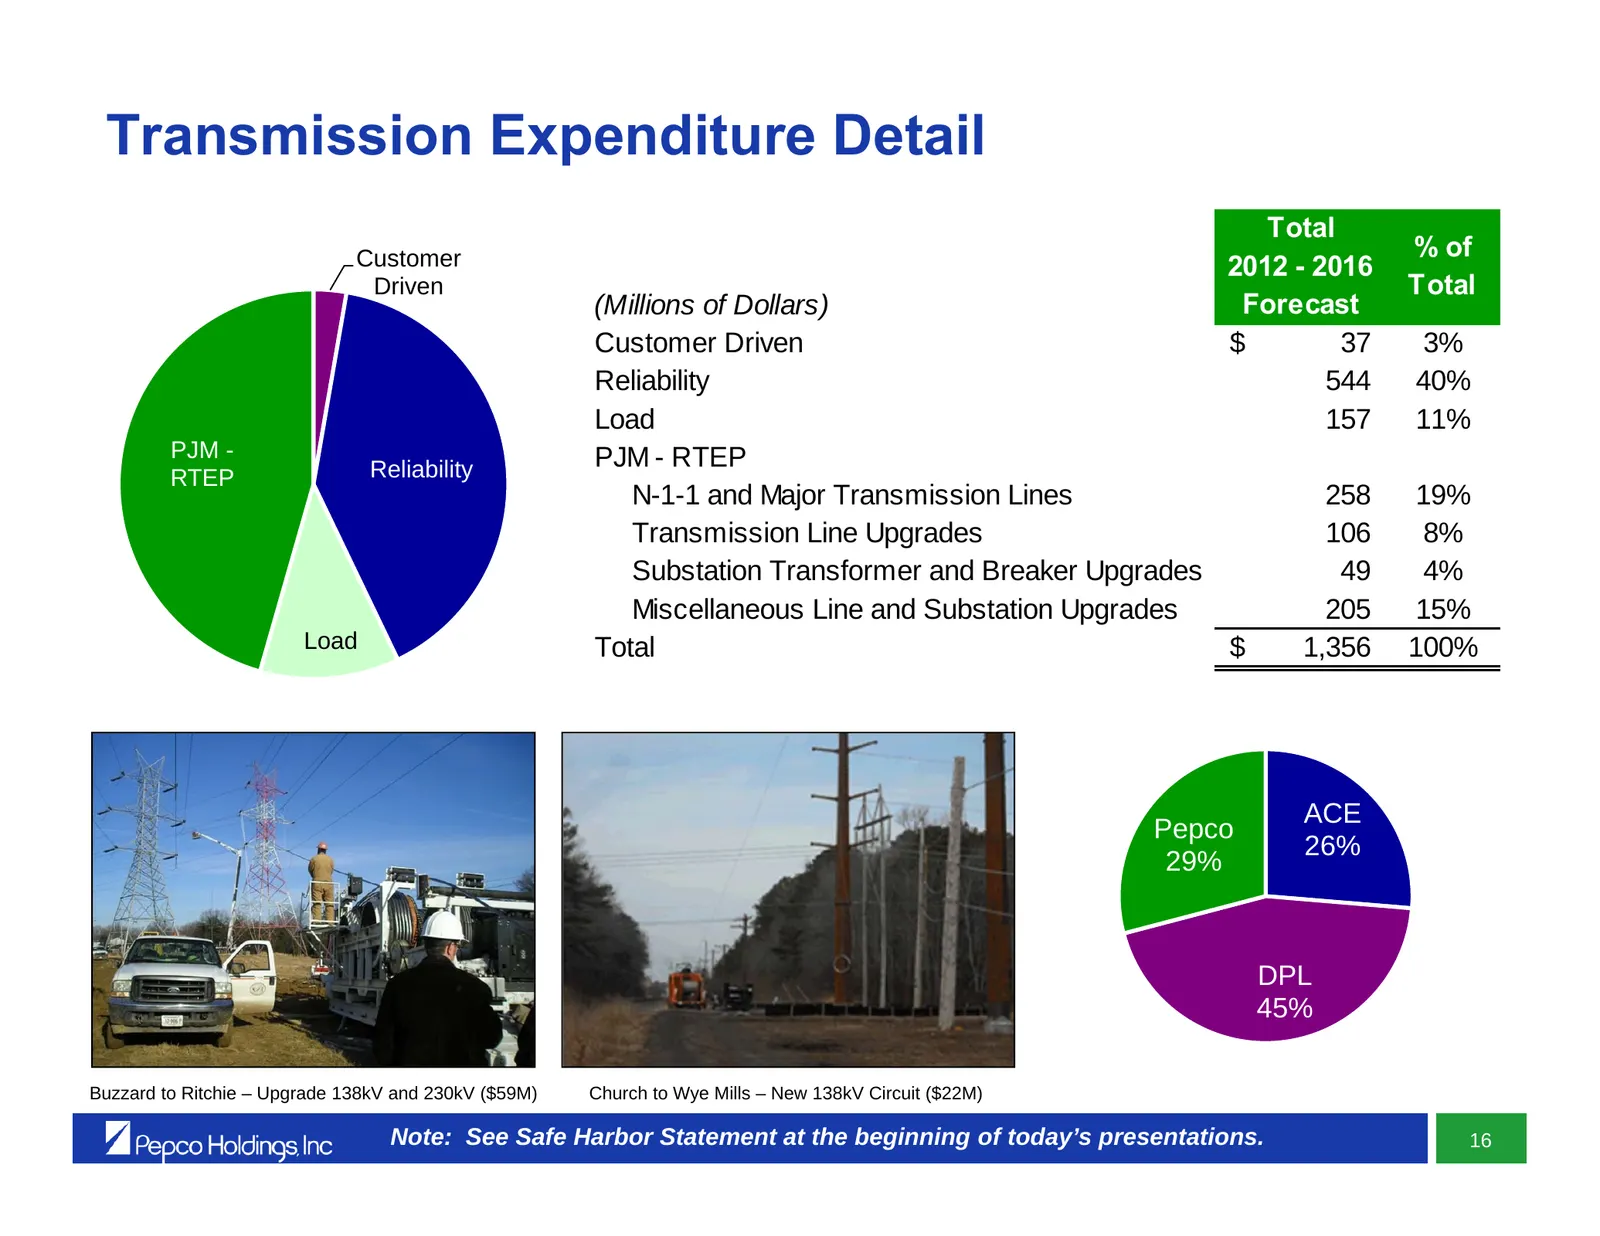
Transmission Expenditure Detail Total Customer % of 2012 - 2016 Driven Total (Millions of Dollars) Forecast Customer Driven $ 37 3% Reliability 544 40% Load 157 11% PJM - PJM - RTEP RTEP Reliability N-1-1 and Major Transmission Lines 258 19% Transmission Line Upgrades 106 8% Substation Transformer a
Slide 35: MAPP Construction Expenditures – 2012 - 2016
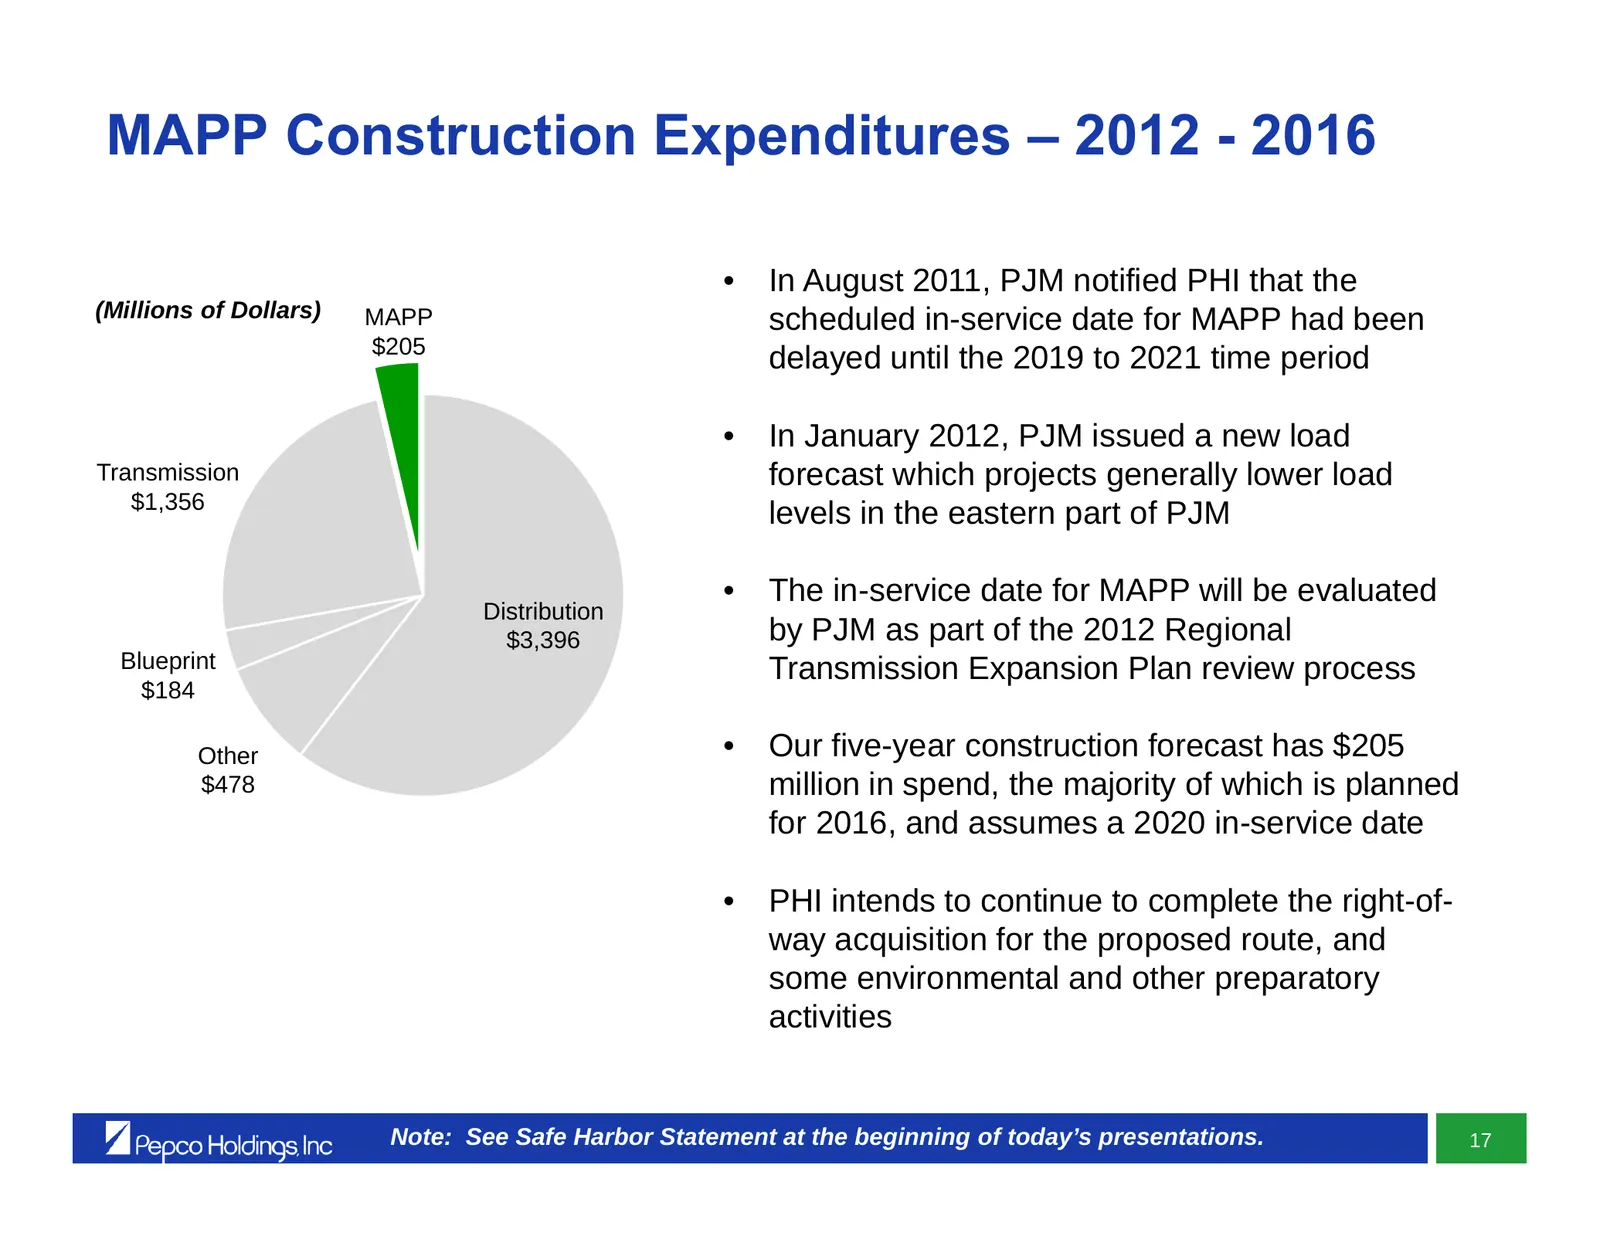
MAPP Construction Expenditures – 2012 - 2016 • In August 2011, PJM notified PHI that the (Millions of Dollars) MAPP scheduled in-service date for MAPP had been $205 delayed until the 2019 to 2021 time period • In January 2012, PJM issued a new load Transmission forecast which projects generally lowe
Slide 36: Blueprint Construction Expenditures – 2012 - 2016
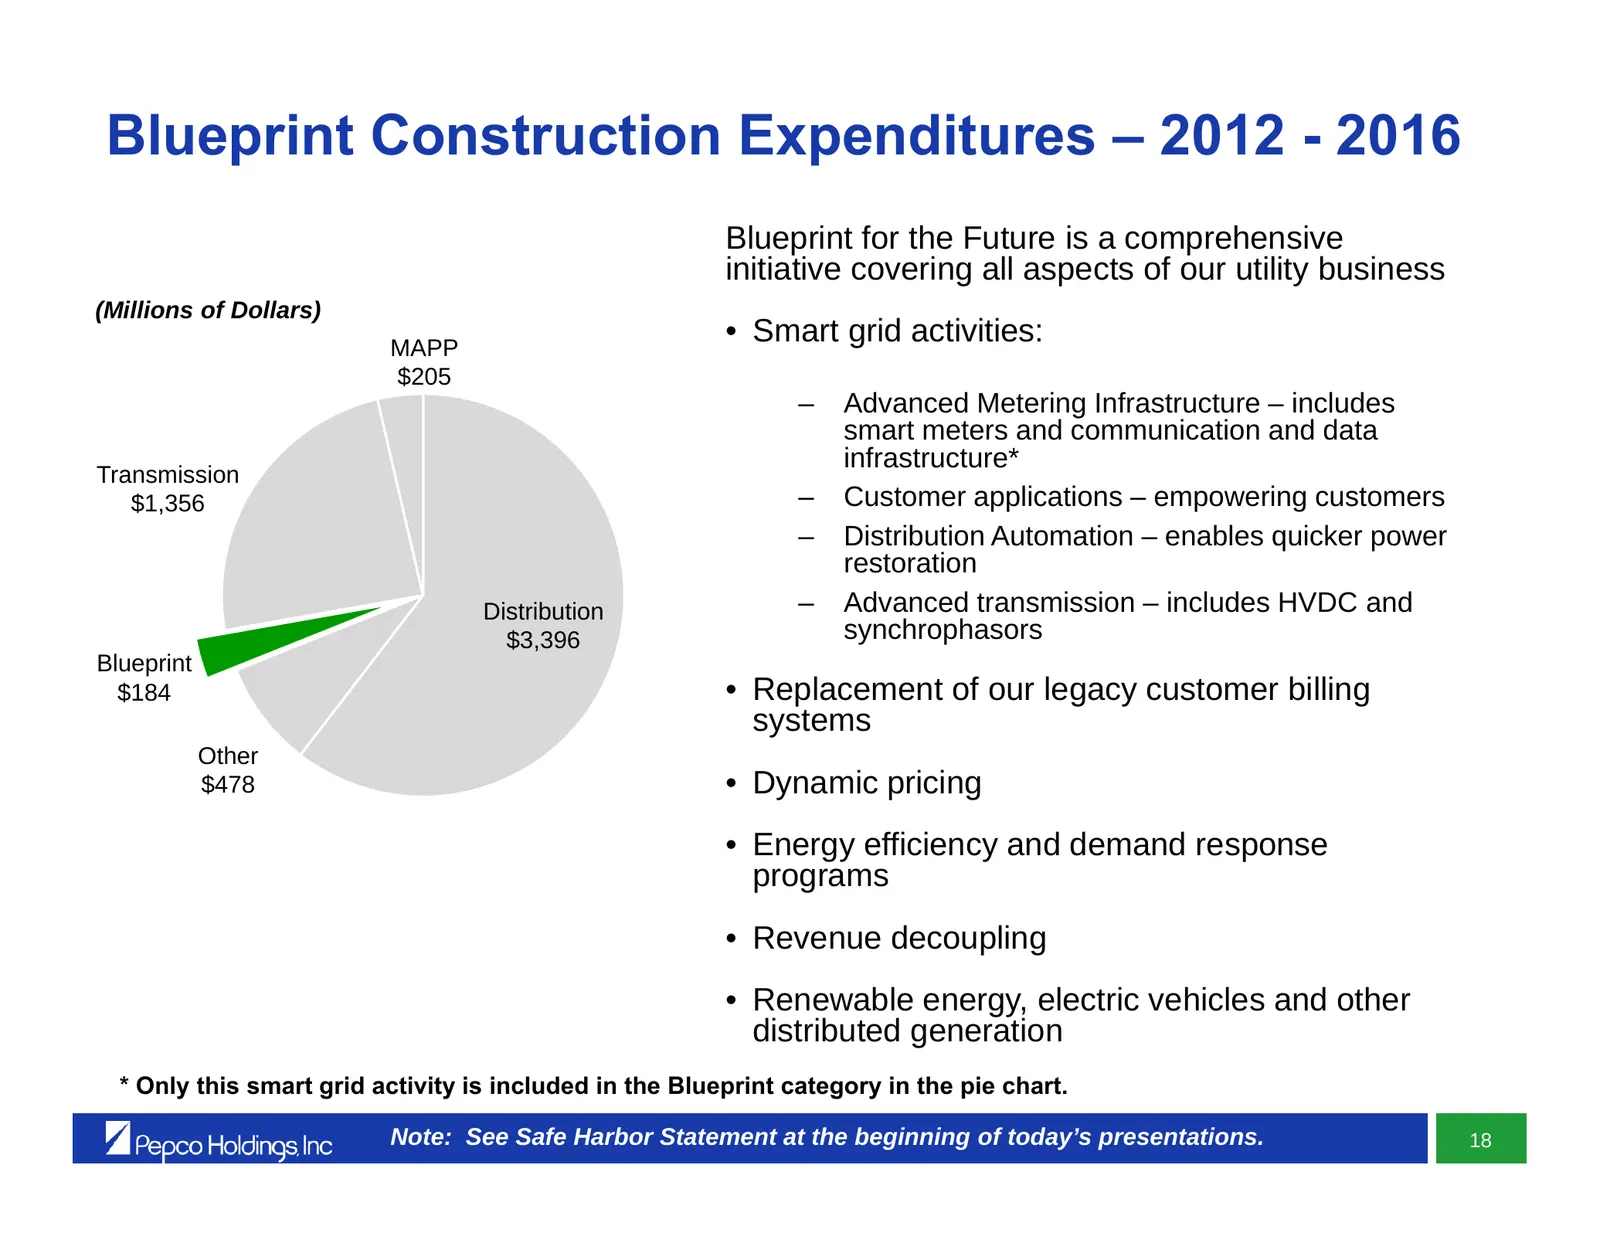
Blueprint Construction Expenditures – 2012 - 2016 Blueprint for the Future is a comprehensive initiative covering all aspects of our utility business (Millions of Dollars) MAPP • Smart grid activities: $205 – Advanced Metering Infrastructure – includes smart meters and communication and data infrast
Slide 37: Advanced Metering Infrastructure (AMI) – Underway in DE, DC and Pepco-MD
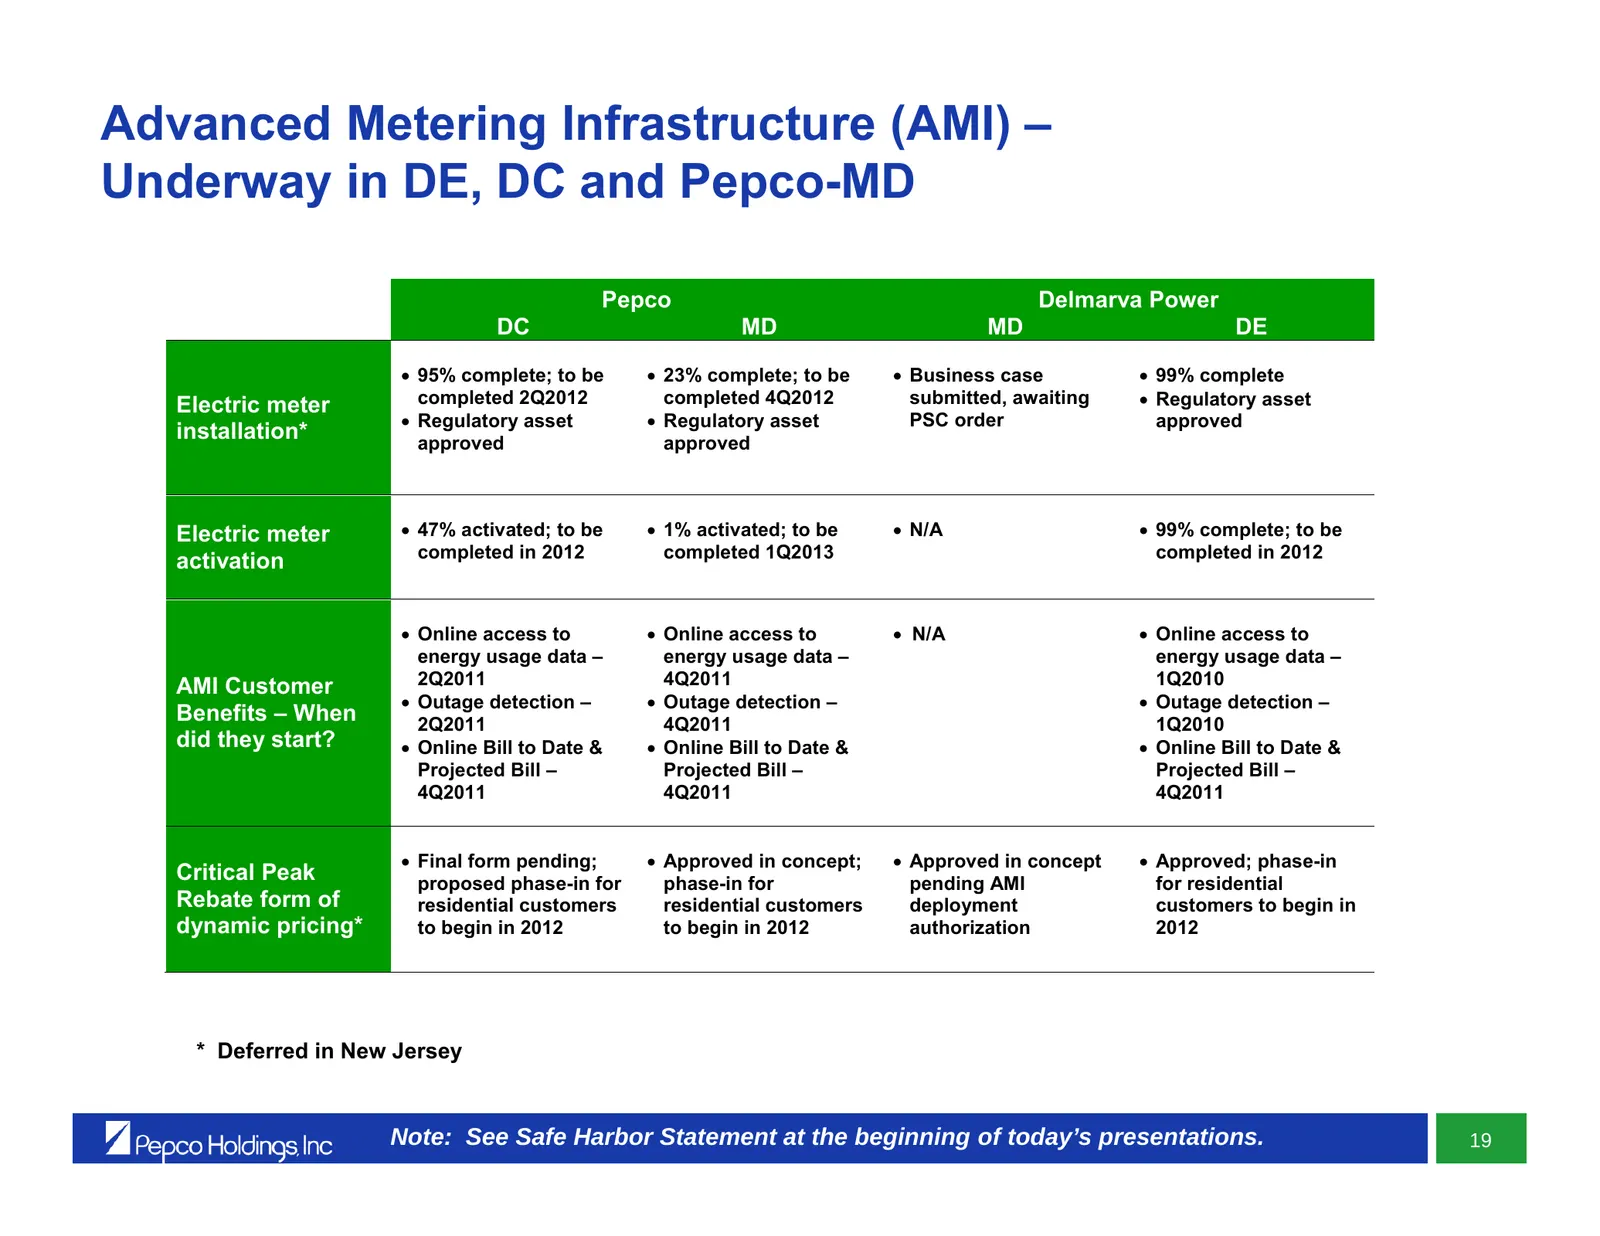
Advanced Metering Infrastructure (AMI) – Underway in DE, DC and Pepco-MD Pepco Delmarva Power DC MD MD DE 95% complete; to be 23% complete; to be Business case 99% complete Electric meter completed 2Q2012 completed 4Q2012 submitted, awaiting Regulatory asset Regulatory asset Regulatory
Slide 38: Illustrative Customer Communications – Delmarva Power-Delaware
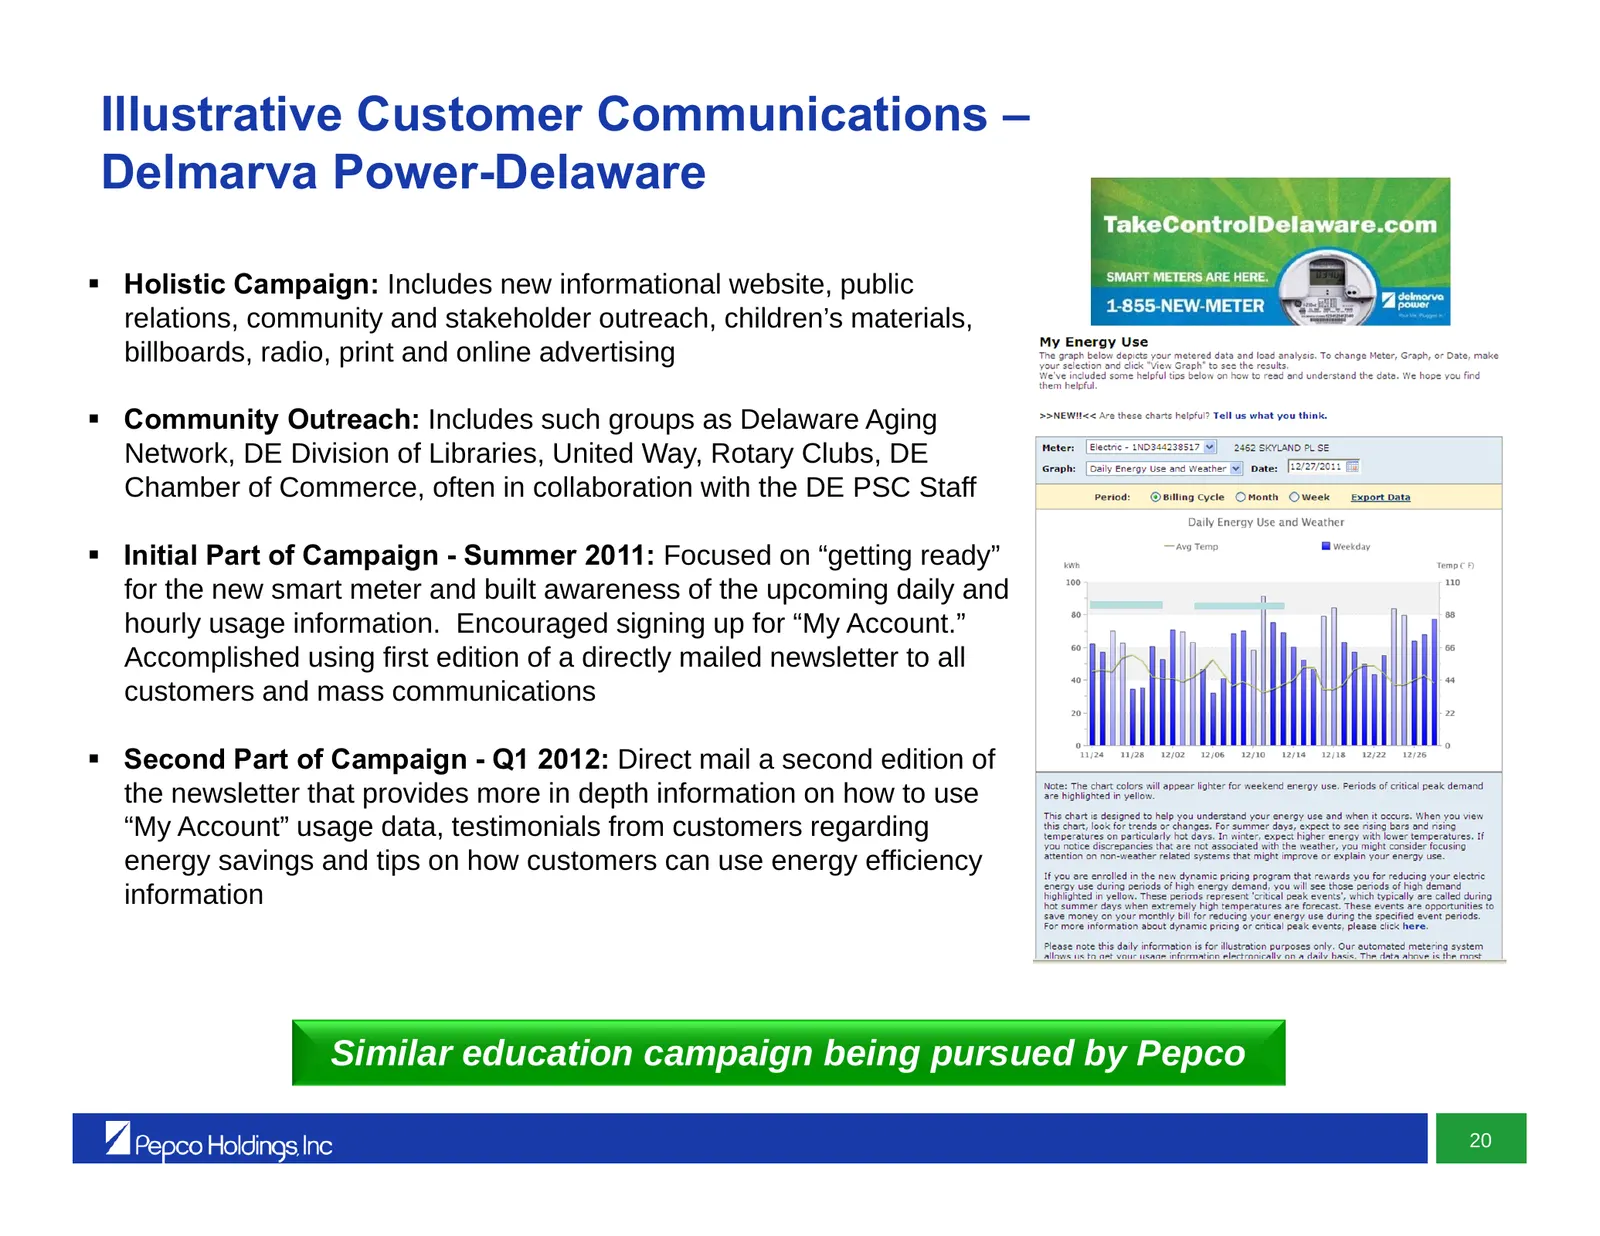
Illustrative Customer Communications – Delmarva Power-Delaware Holistic Campaign: Includes new informational website, public relations, community and stakeholder outreach, children’s materials, billboards, radio, print and online advertising Community Outreach: Includes such groups as Delaware A
Slide 39: Advanced Metering Infrastructure – Successfully Used During Hurricane Irene
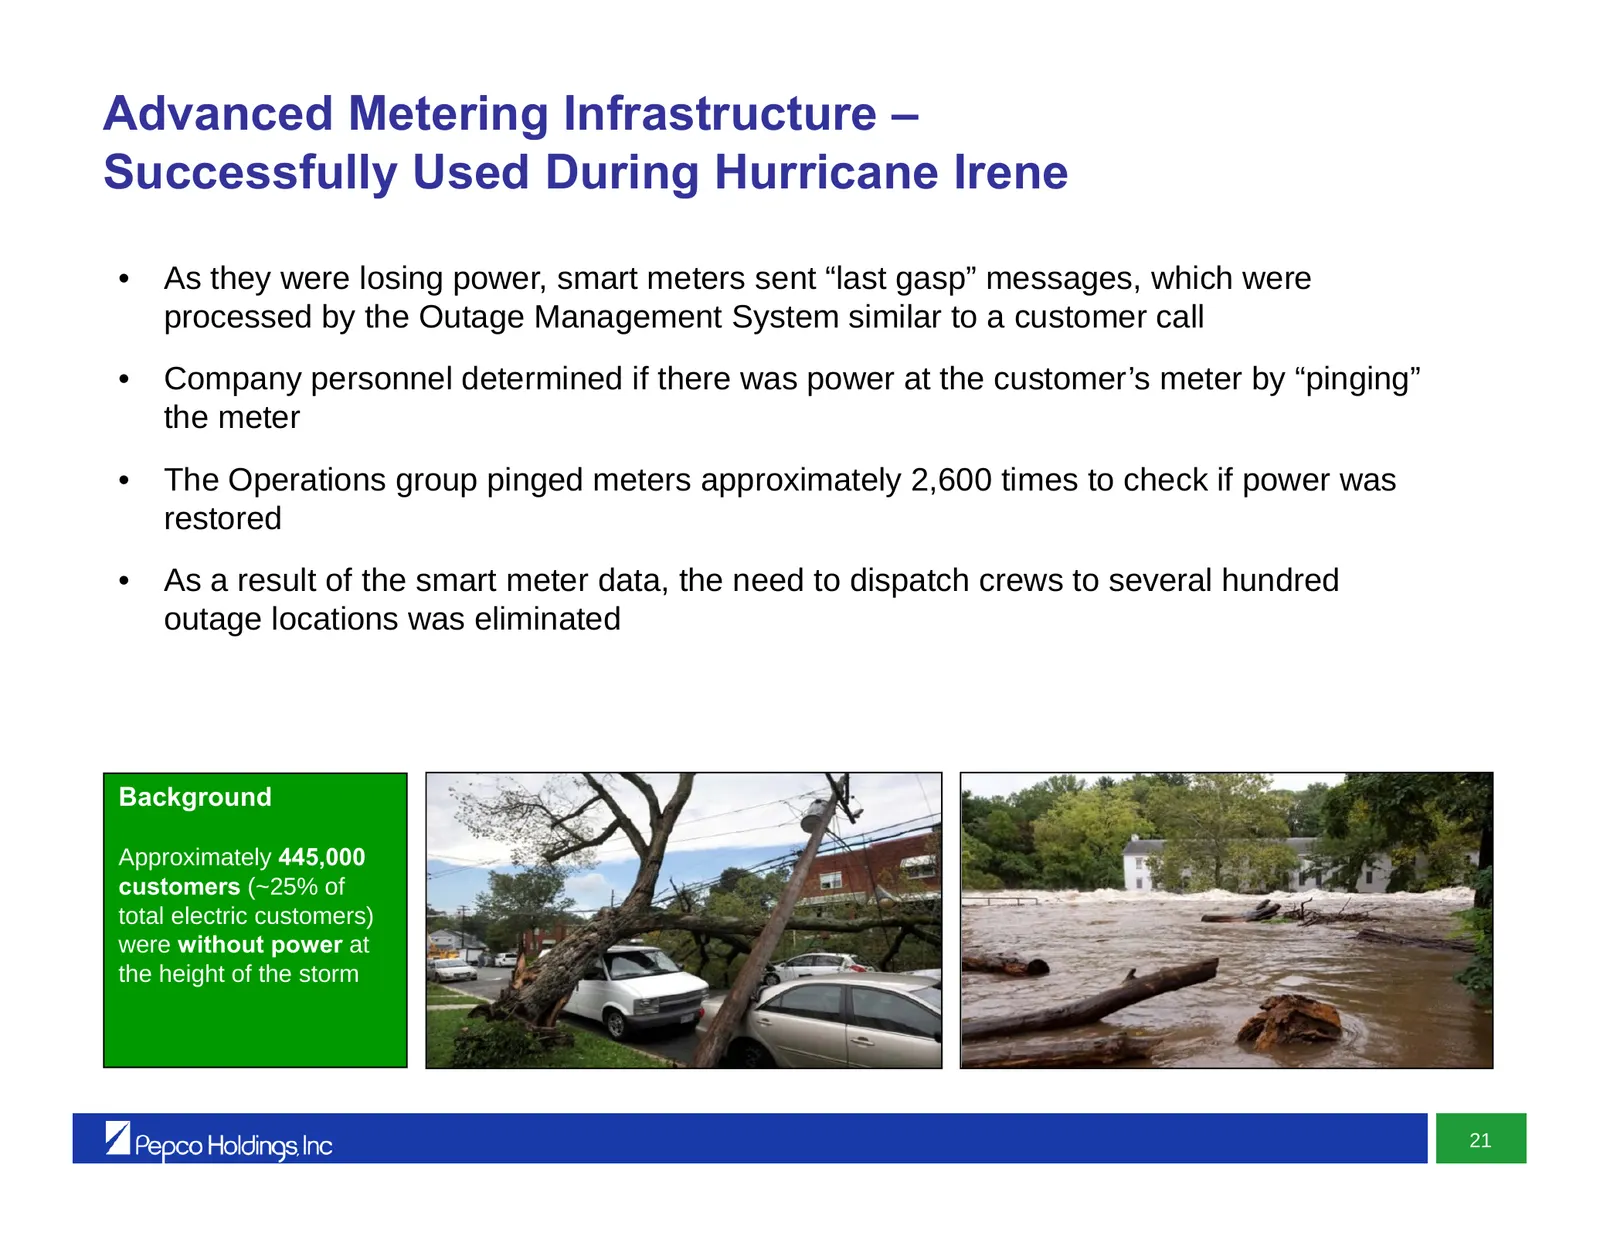
Advanced Metering Infrastructure – Successfully Used During Hurricane Irene • As they were losing power, smart meters sent “last gasp” messages, which were processed by the Outage Management System similar to a customer call • Company personnel determined if there was power at the customer’s meter b
Slide 40: Dynamic Pricing – Status
Dynamic Pricing – Status • Request for implementation filed in Delaware, Maryland, and the District of Columbia: – Proposed to offer dynamic pricing to a group of several thousand residential customers in 2012, with rollout to all residential customers in 2013 (in Delaware and the District of Columb
Slide 41: Dynamic Pricing – Calculation of Benefits
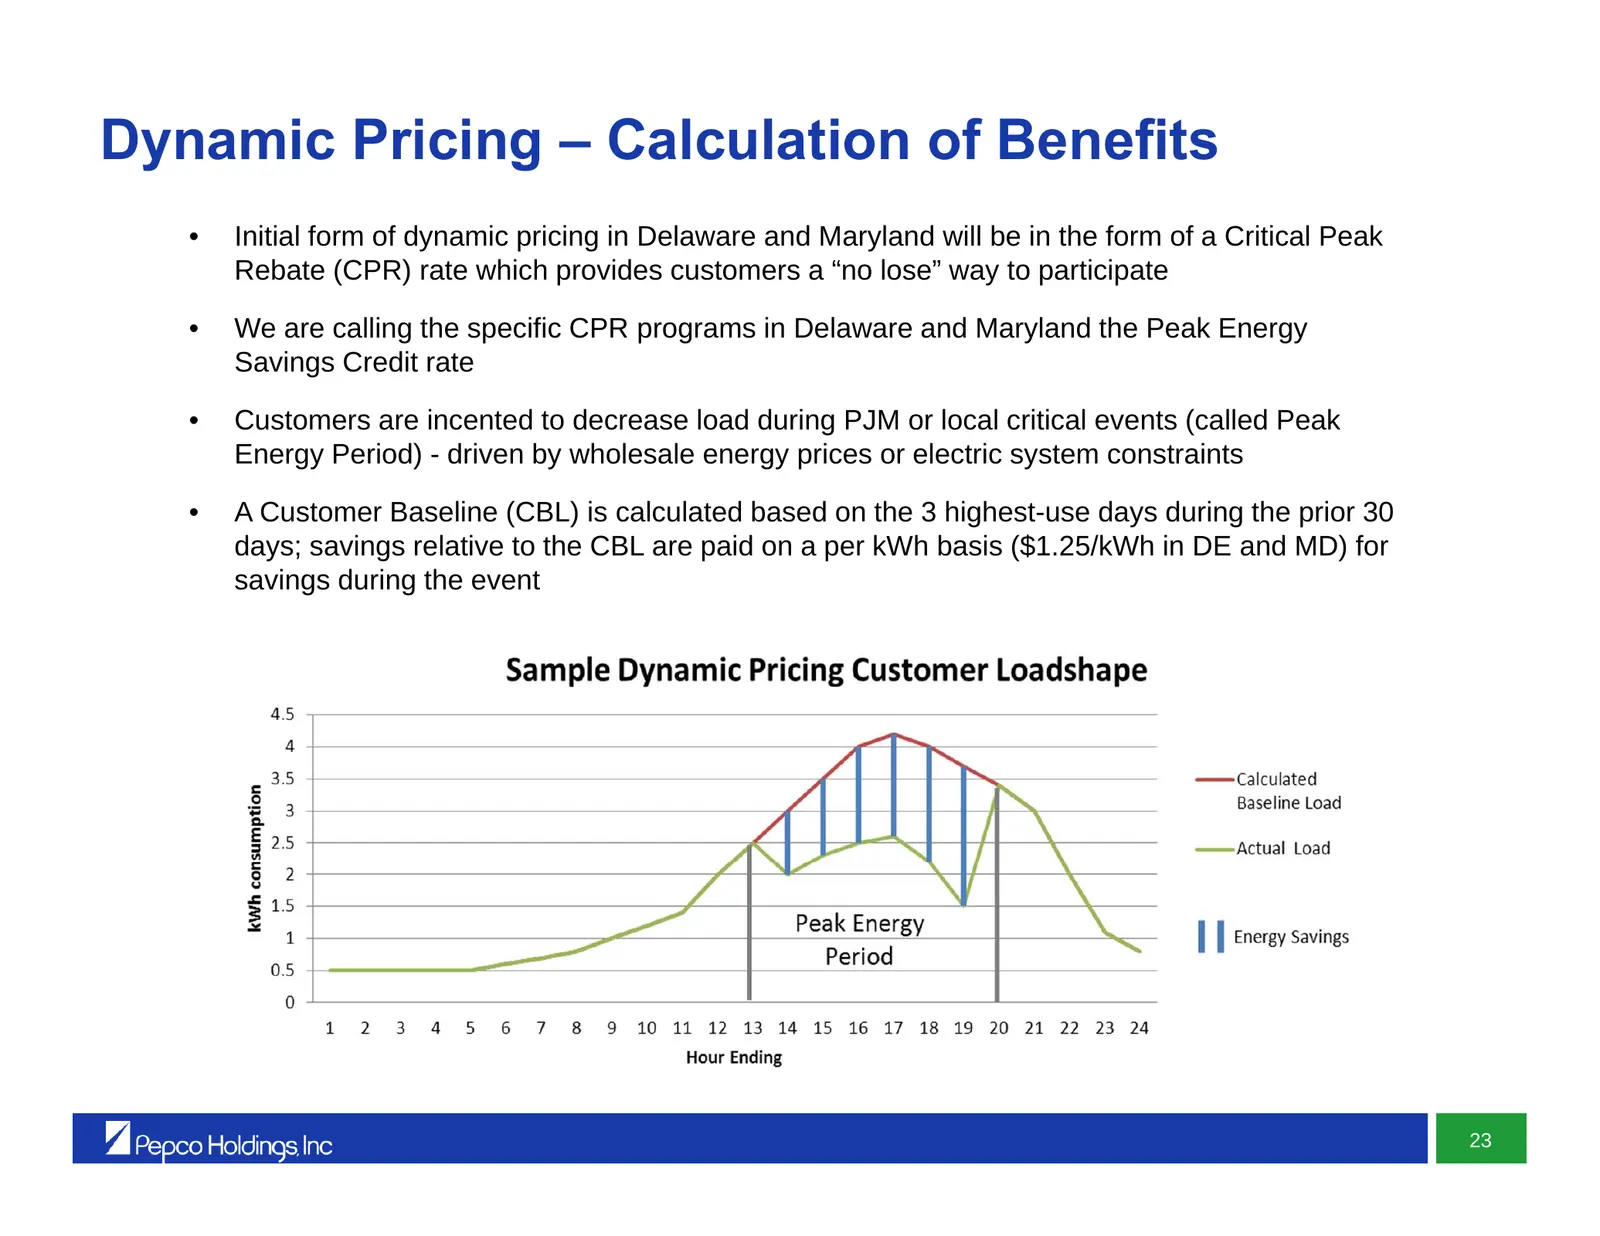
Dynamic Pricing – Calculation of Benefits • Initial form of dynamic pricing in Delaware and Maryland will be in the form of a Critical Peak Rebate (CPR) rate which provides customers a “no lose” way to participate • We are calling the specific CPR programs in Delaware and Maryland the Peak Energy Sa
Slide 42: Dynamic Pricing – How It Works
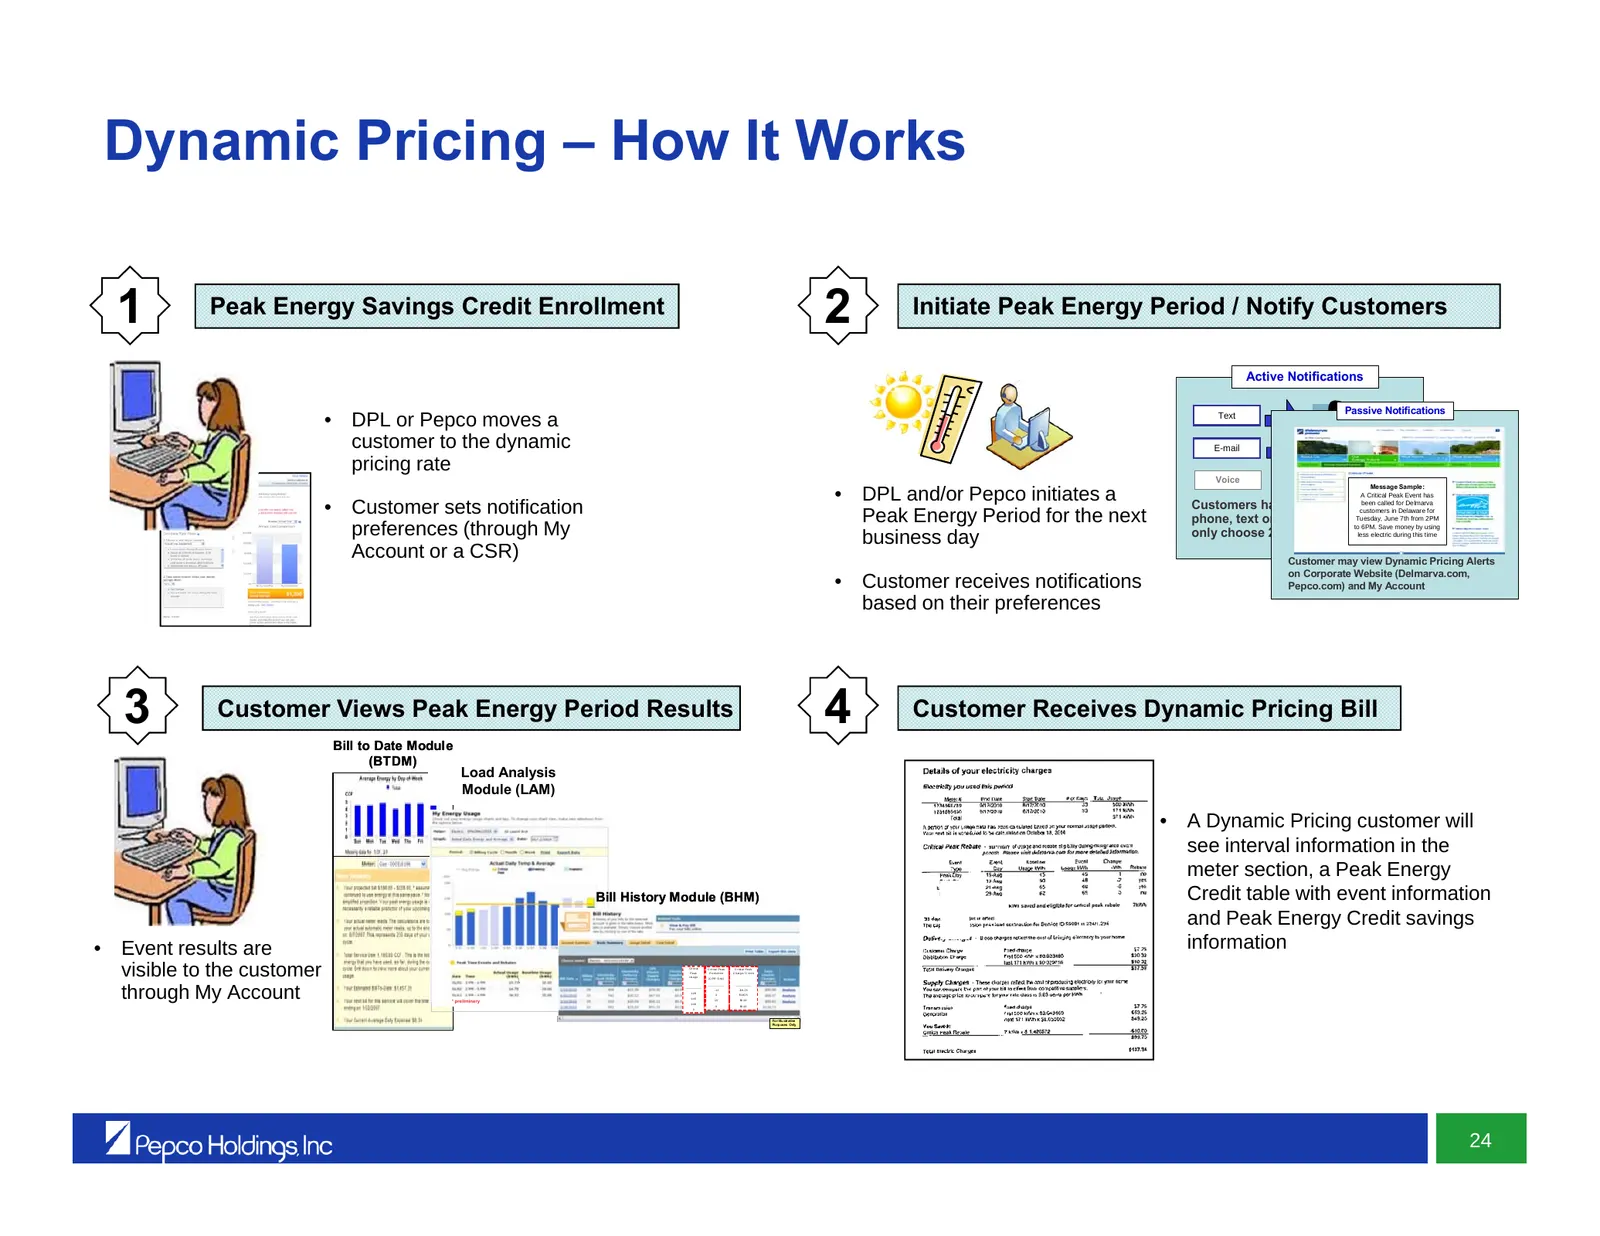
Dynamic Pricing – How It WorksP Energy Periods 1 Peak Energy Savings Credit Enrollment 2 Initiate Peak Energy Period / Notify Customers Active Notifications Text Passive Notifications • DPL or Pepco moves a customer to the dynamic E-mail pricing rate Voice Message Sample: • DPL and/or Pepco initiate
Slide 43: Power Delivery Business Outlook
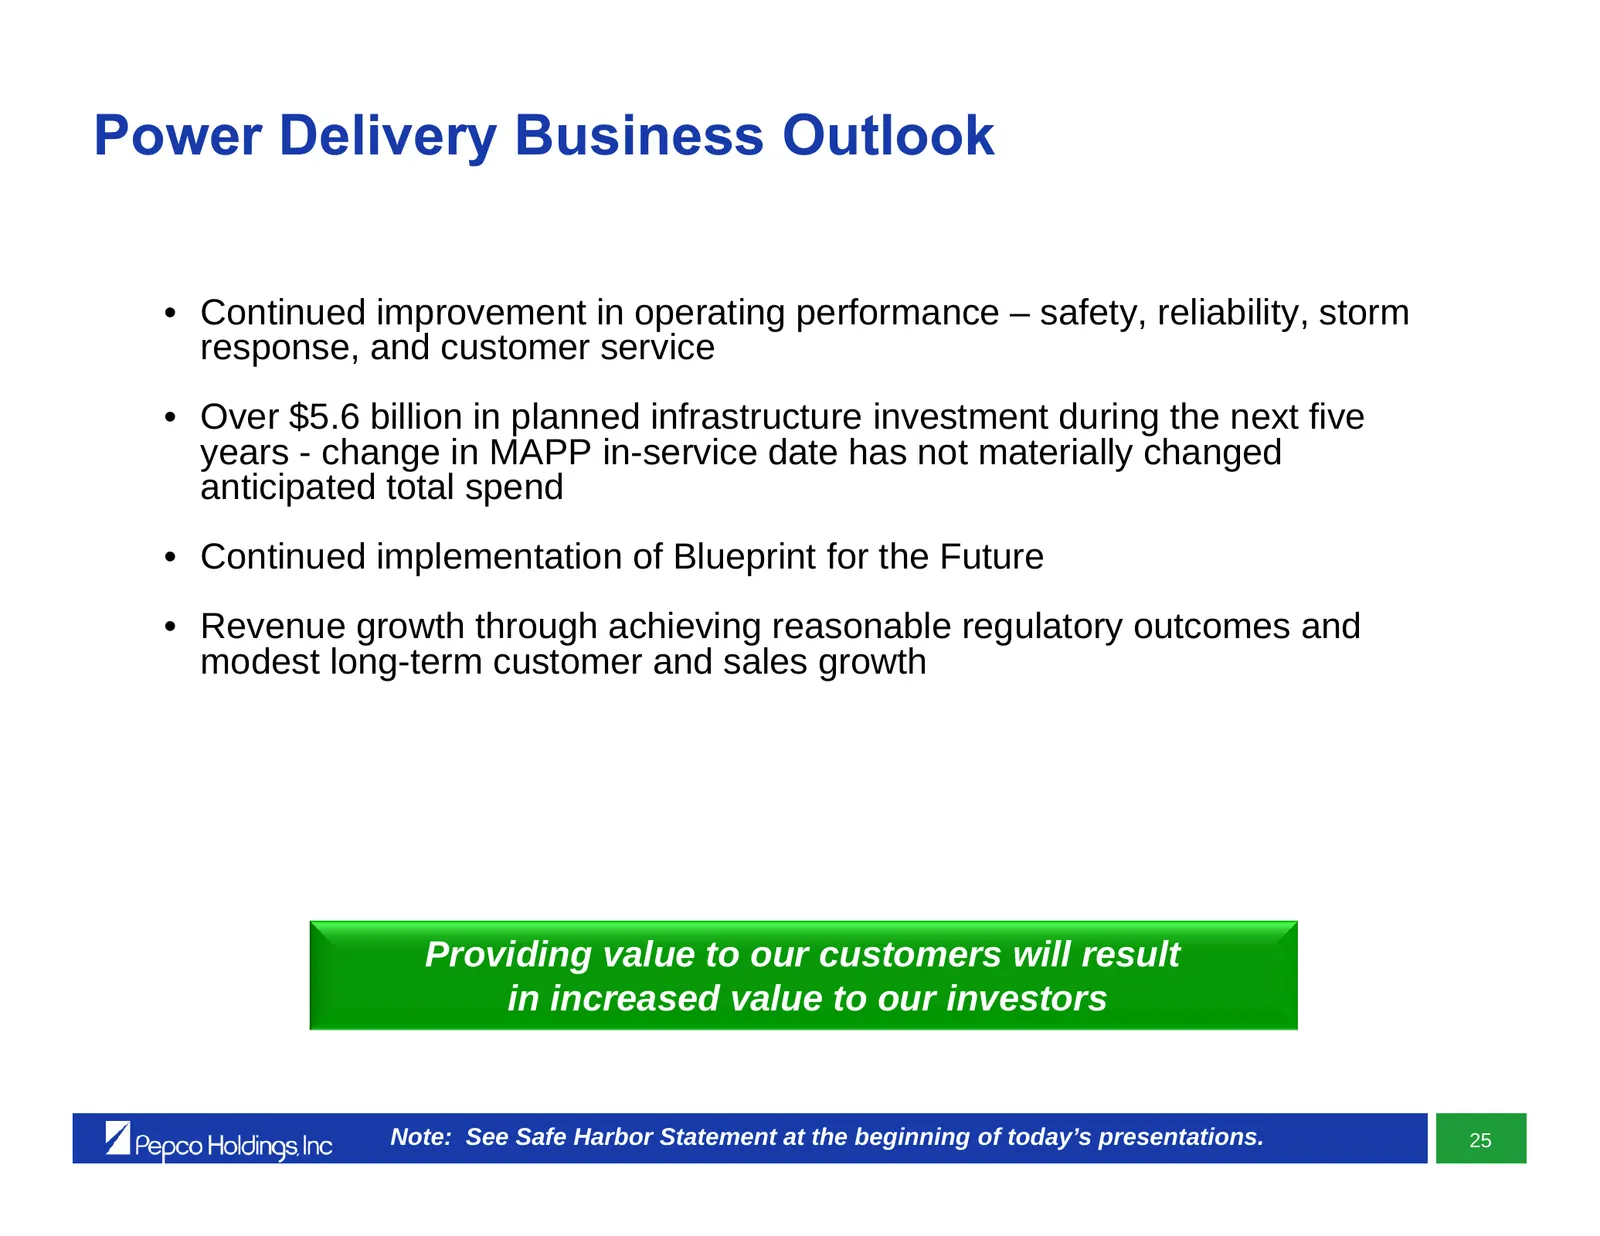
Power Delivery Business Outlook • Continued improvement in operating performance – safety, reliability, storm response, and customer service • Over $5.6 billion in planned infrastructure investment during the next five years - change in MAPP in-service date has not materially changed anticipated tot
Slide 44: Power Delivery
Power Delivery Dave Velazquez Executive Vice President, Power Delivery
Slide 45: Appendix
Appendix y | Pepco Holdings Inc L |
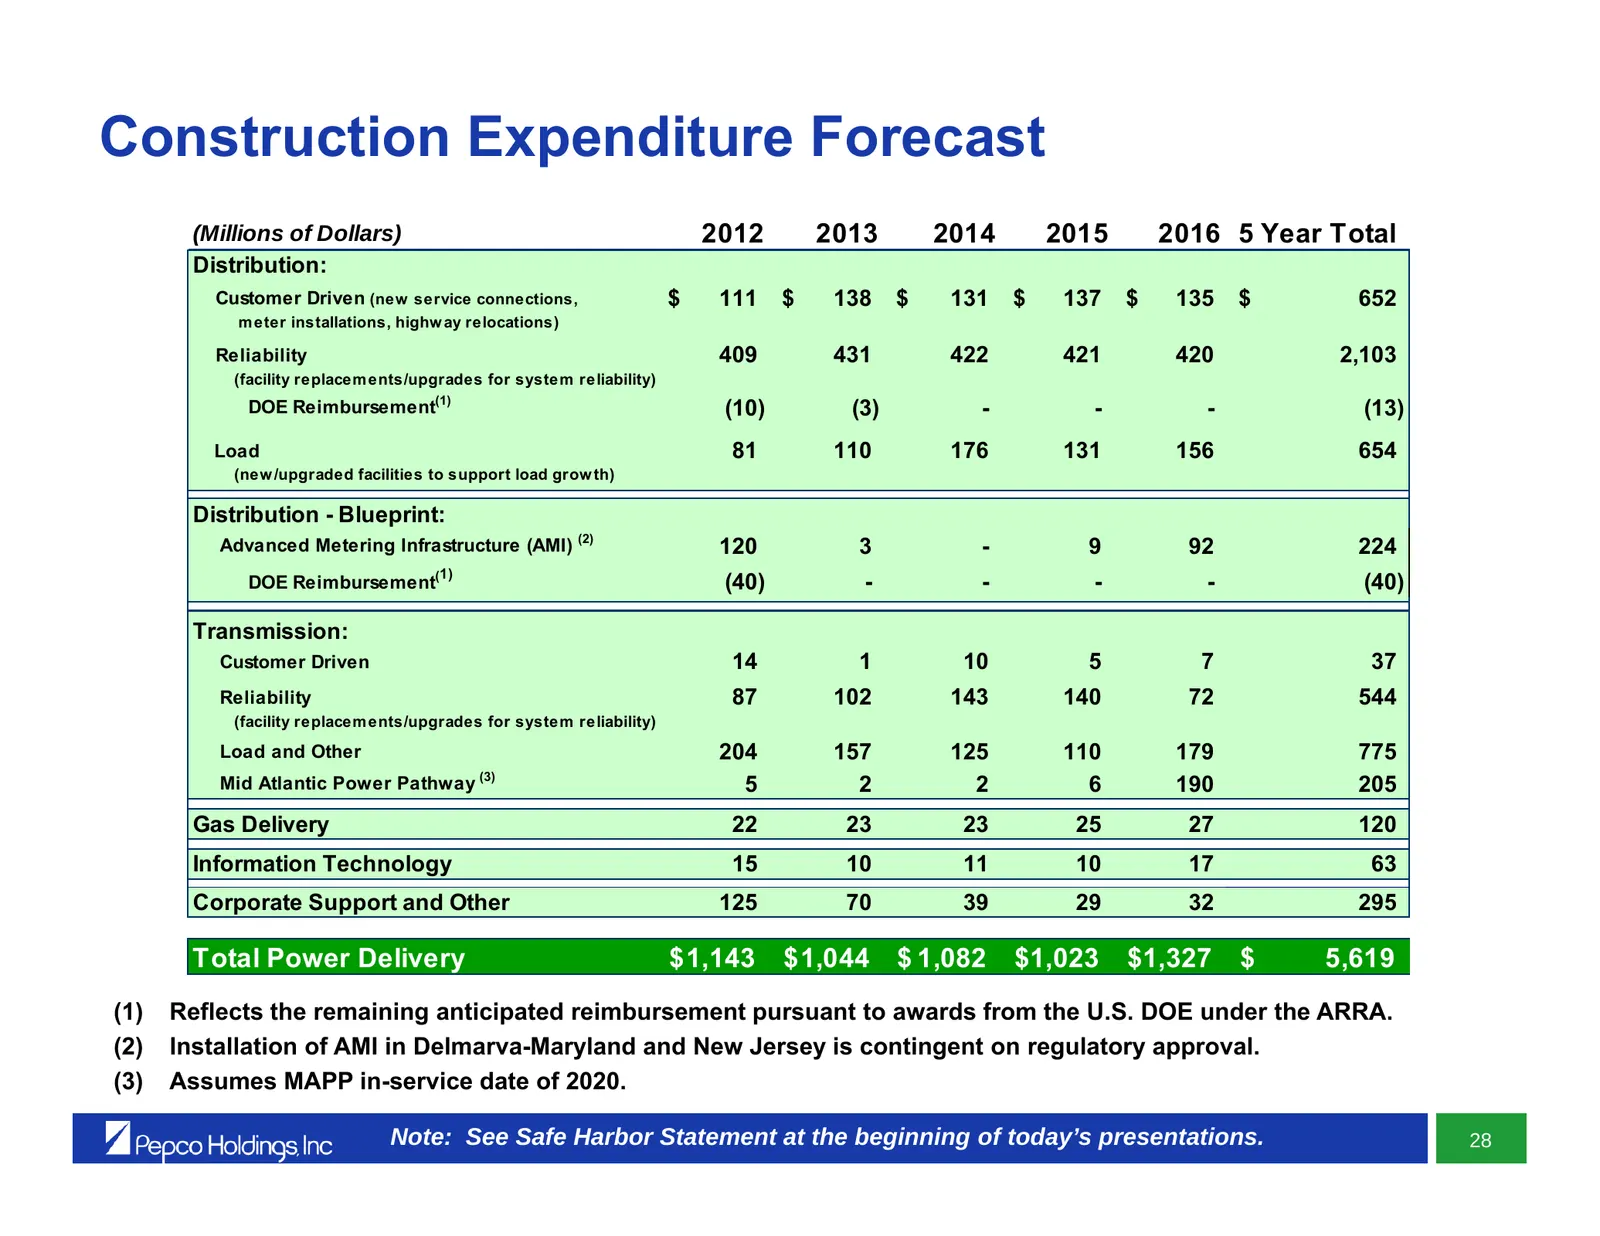
Slide 46: Construction Expenditure Forecast
Construction Expenditure Forecast (Millions of Dollars) 2012 2013 2014 2015 2016 5 Year Total Distribution: Customer Driven (new service connections, $ 111 $ 138 $ 131 $ 137 $ 135 $ 652 m eter installations, highw ay relocations) Reliability 409 431 422 421 420 2,103 (facility replacem ents/upgrades
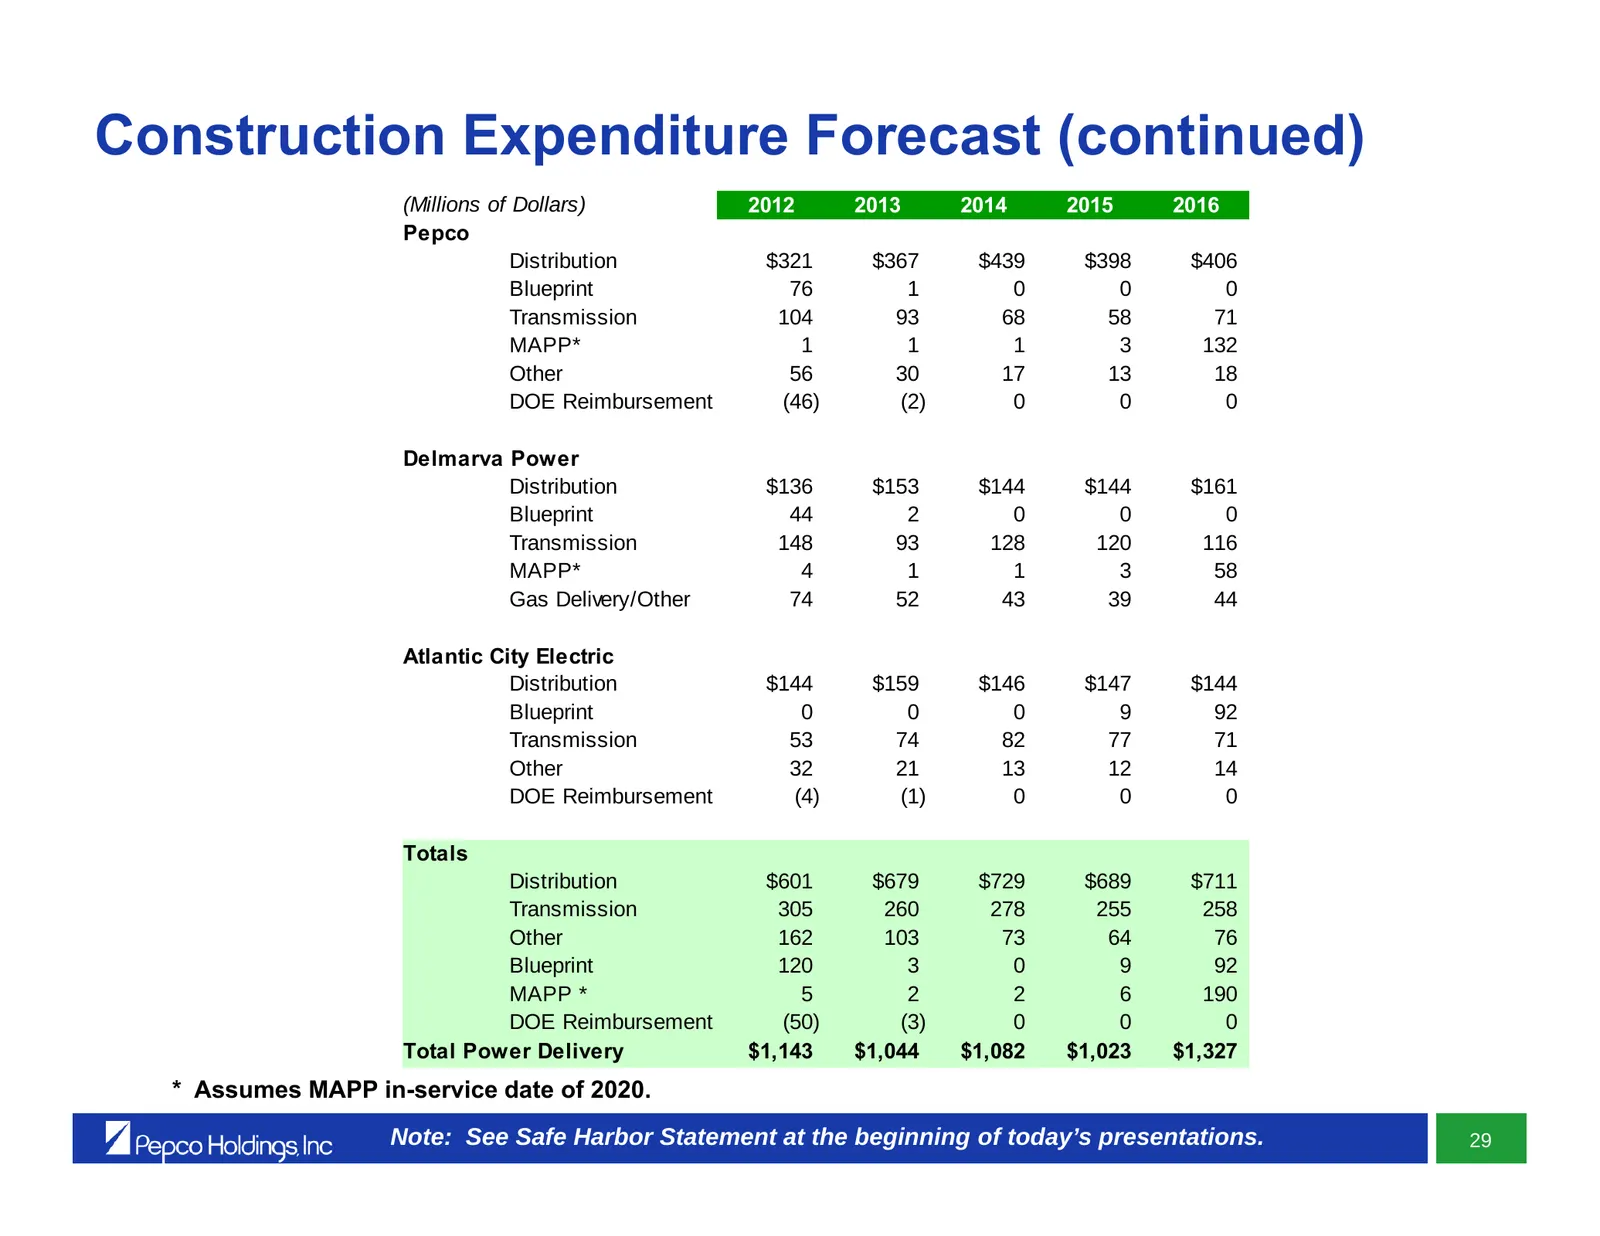
Slide 47: Construction Expenditure Forecast (continued)
Construction Expenditure Forecast (continued) (Millions of Dollars) 2012 2013 2014 2015 2016 Pepco Distribution $321 $367 $439 $398 $406 Blueprint 76 1 0 0 0 Transmission 104 93 68 58 71 MAPP* 1 1 1 3 132 Other 56 30 17 13 18 DOE Reimbursement (46) (2) 0 0 0 Delmarva Power Distribution $136 $153 $14
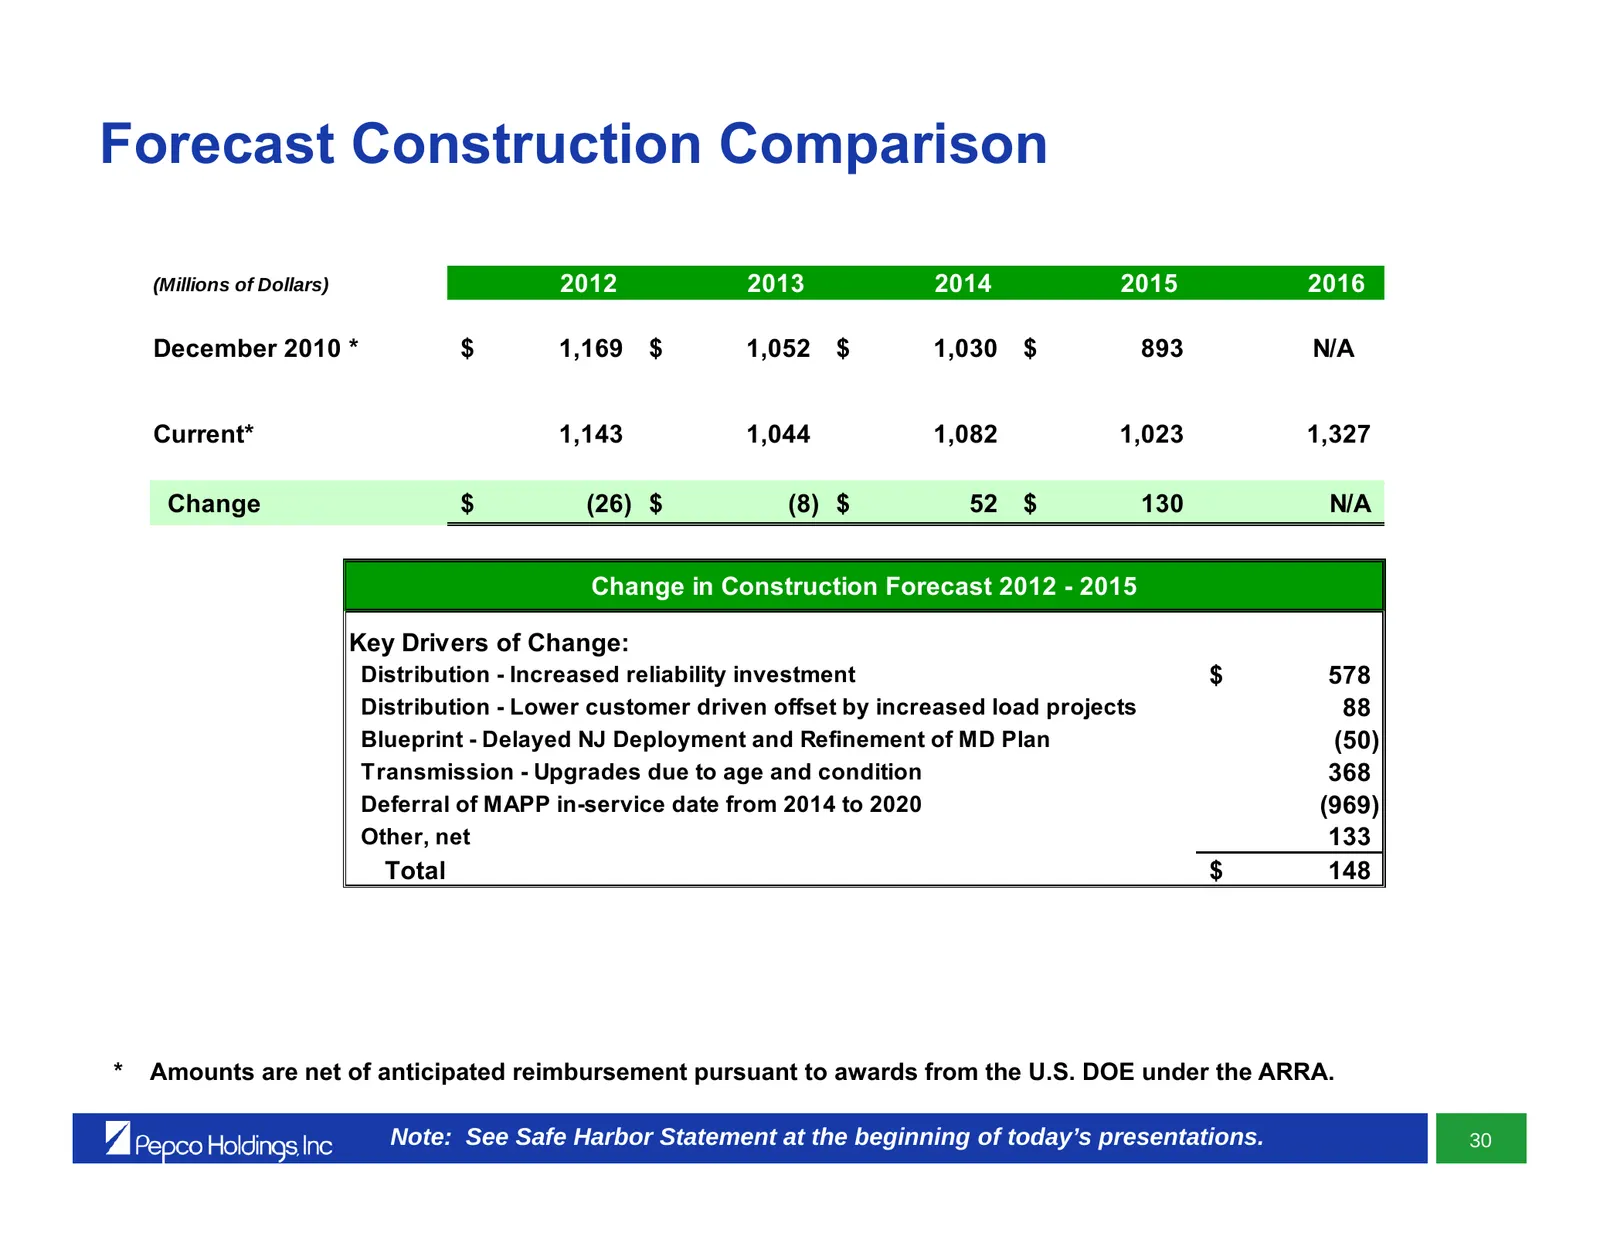
Slide 48: Forecast Construction Comparison
Forecast Construction Comparison (Millions of Dollars) 2012 2013 2014 2015 2016 December 2010 * $ 1,169 $ 1,052 $ 1,030 $ 893 N/A Current* 1,143 1,044 1,082 1,023 1,327 Change $ (26) $ (8) $ 52 $ 130 N/A Change in Construction Forecast 2012 - 2015 Key Drivers of Change: Distribution - Increased reli
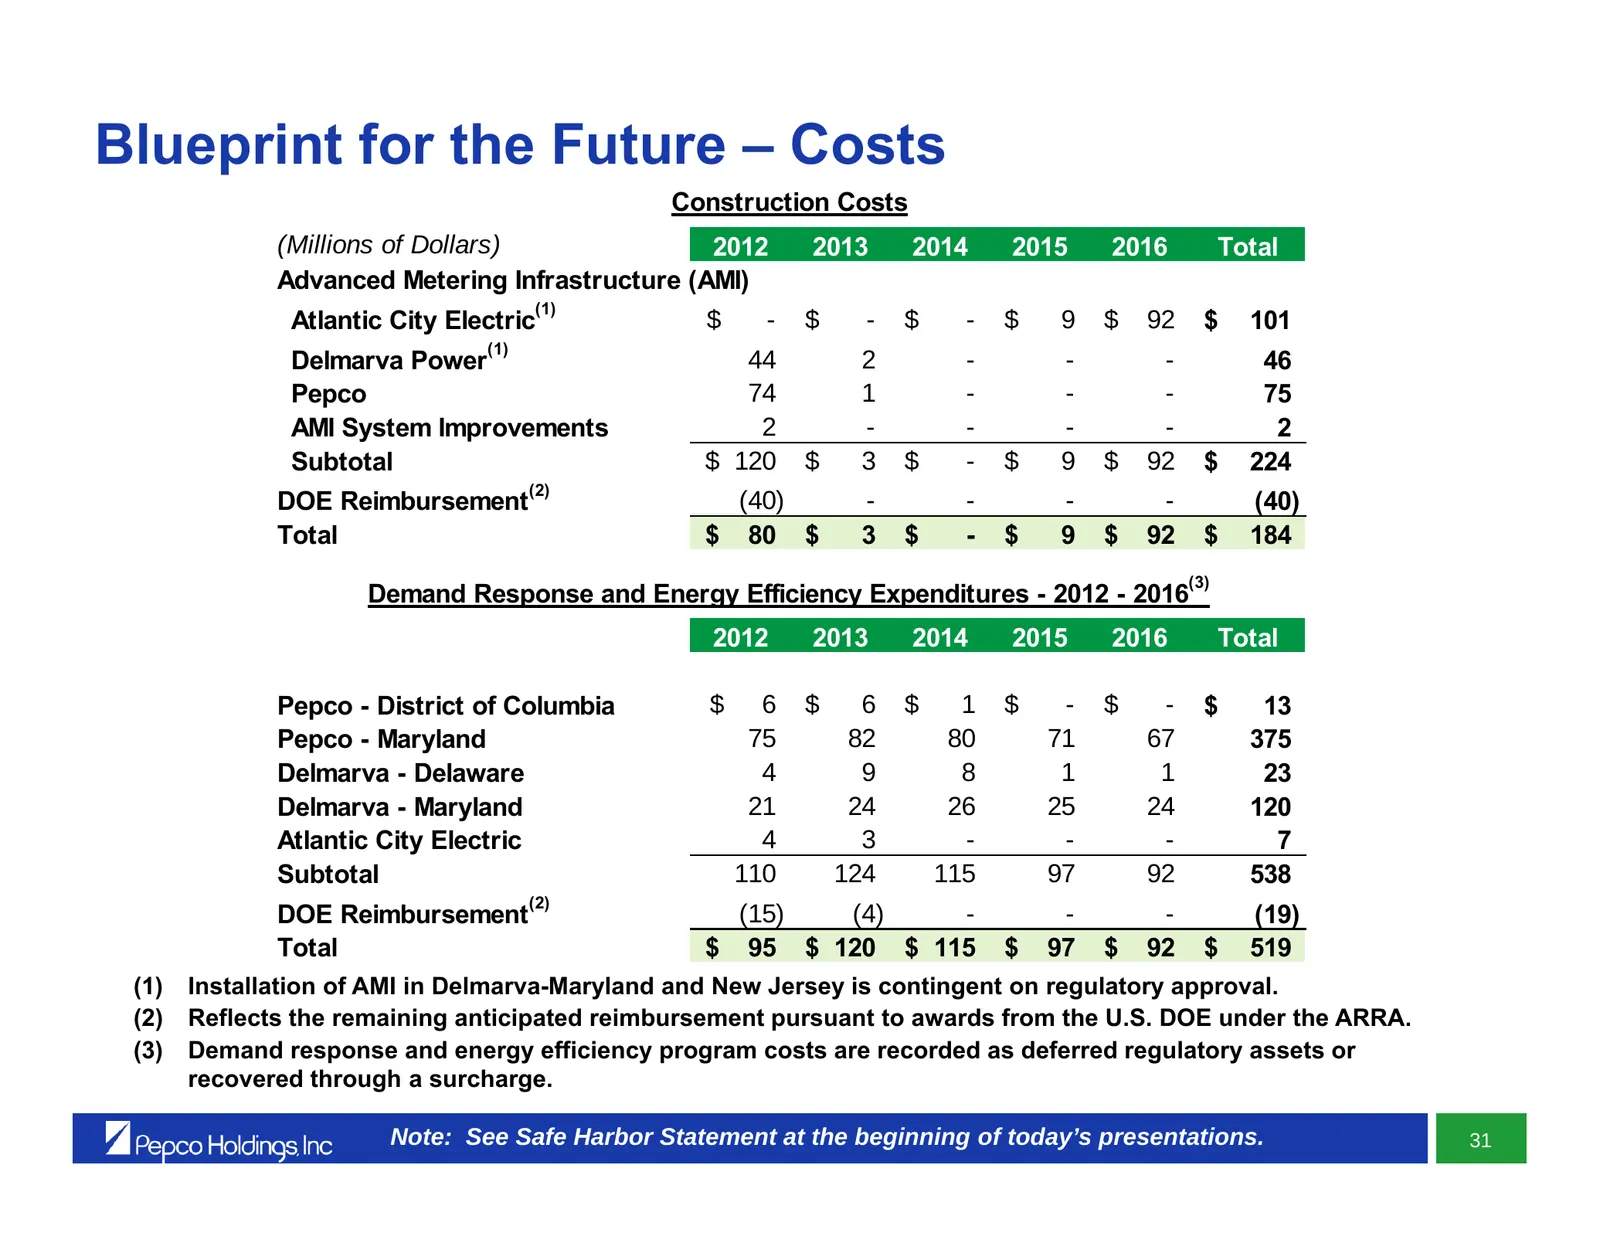
Slide 49: Blueprint for the Future – Costs
Blueprint for the Future – Costs Construction Costs (Millions of Dollars) 2012 2013 2014 2015 2016 Total Advanced Metering Infrastructure (AMI) (1) Atlantic City Electric $ - $ - $ - $ 9 $ 92 $ 101 (1) Delmarva Power 44 2 - - - 46 Pepco 74 1 - - - 75 AMI System Improvements 2 - - - - 2 Subtotal $ 12
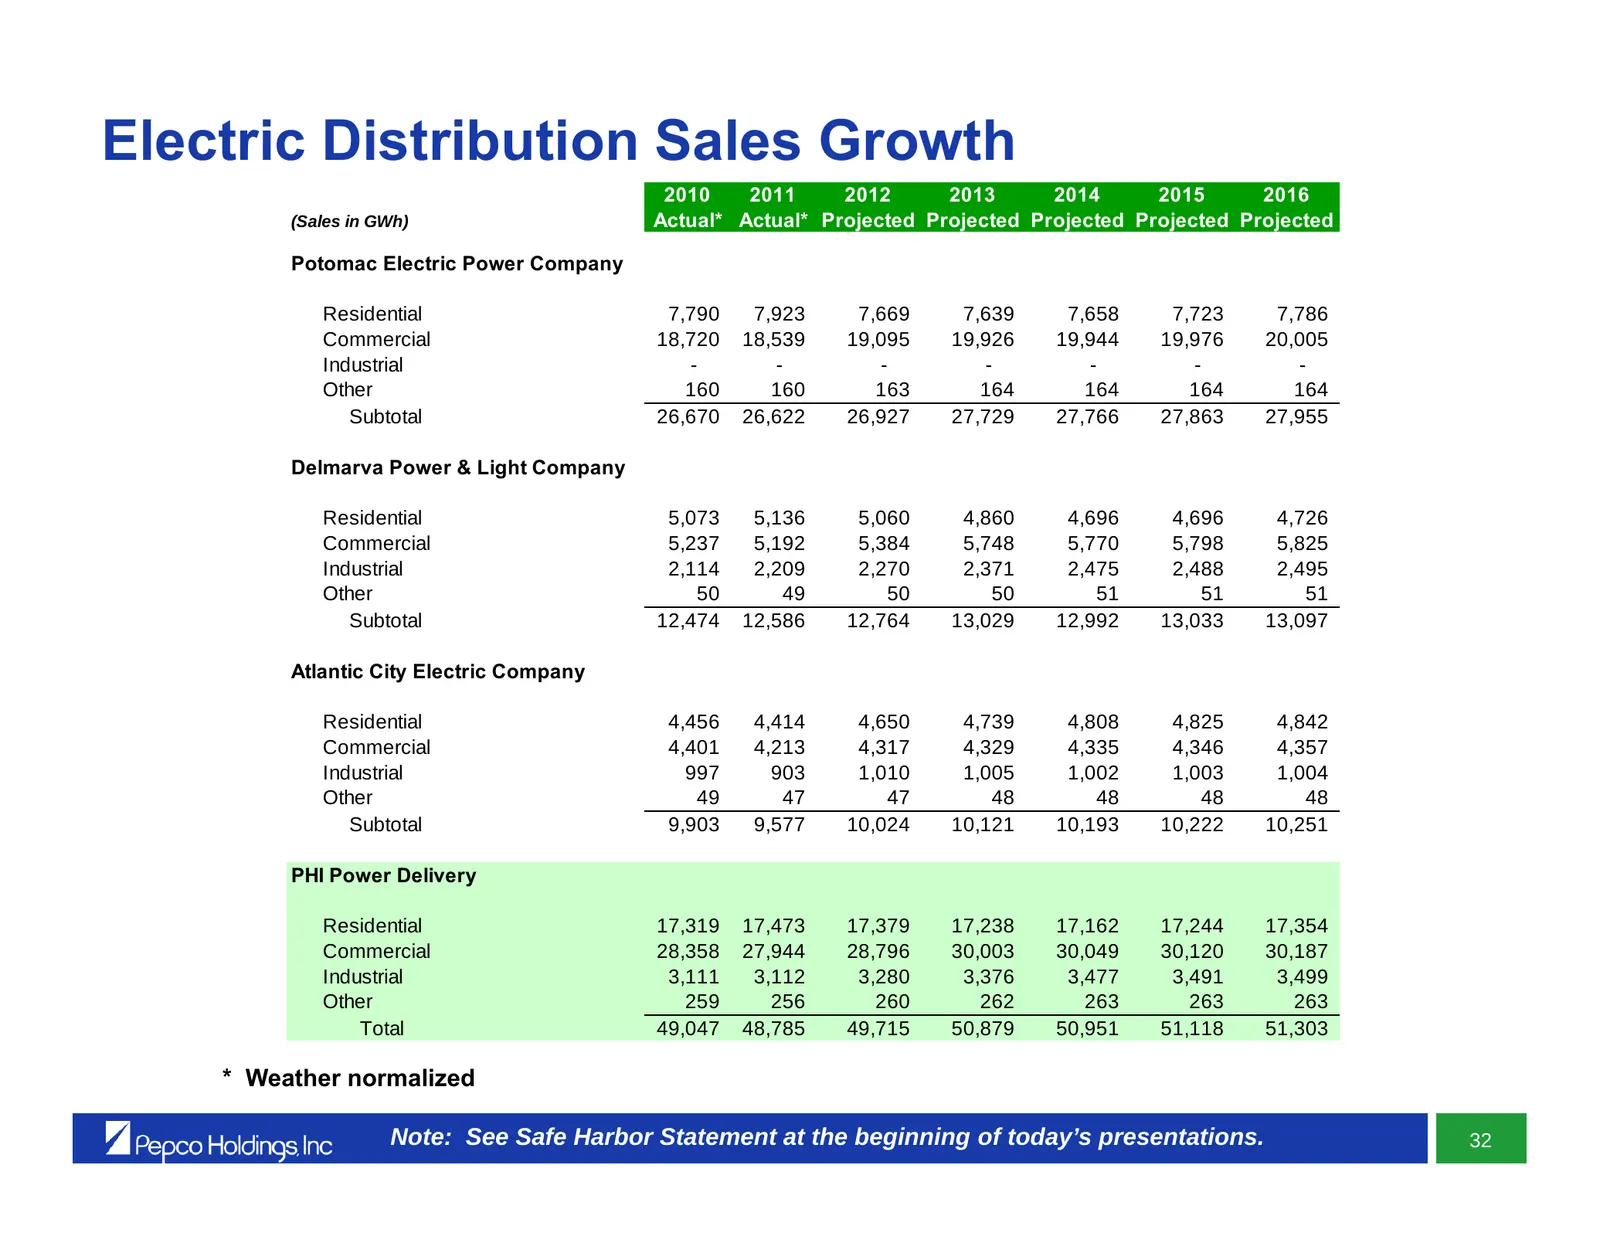
Slide 50: Electric Distribution Sales Growth
Electric Distribution Sales Growth 2010 2011 2012 2013 2014 2015 2016 (Sales in GWh) Actual* Actual* Projected Projected Projected Projected Projected Potomac Electric Power Company Residential 7,790 7,923 7,669 7,639 7,658 7,723 7,786 Commercial 18,720 18,539 19,095 19,926 19,944 19,976 20,005 Indu
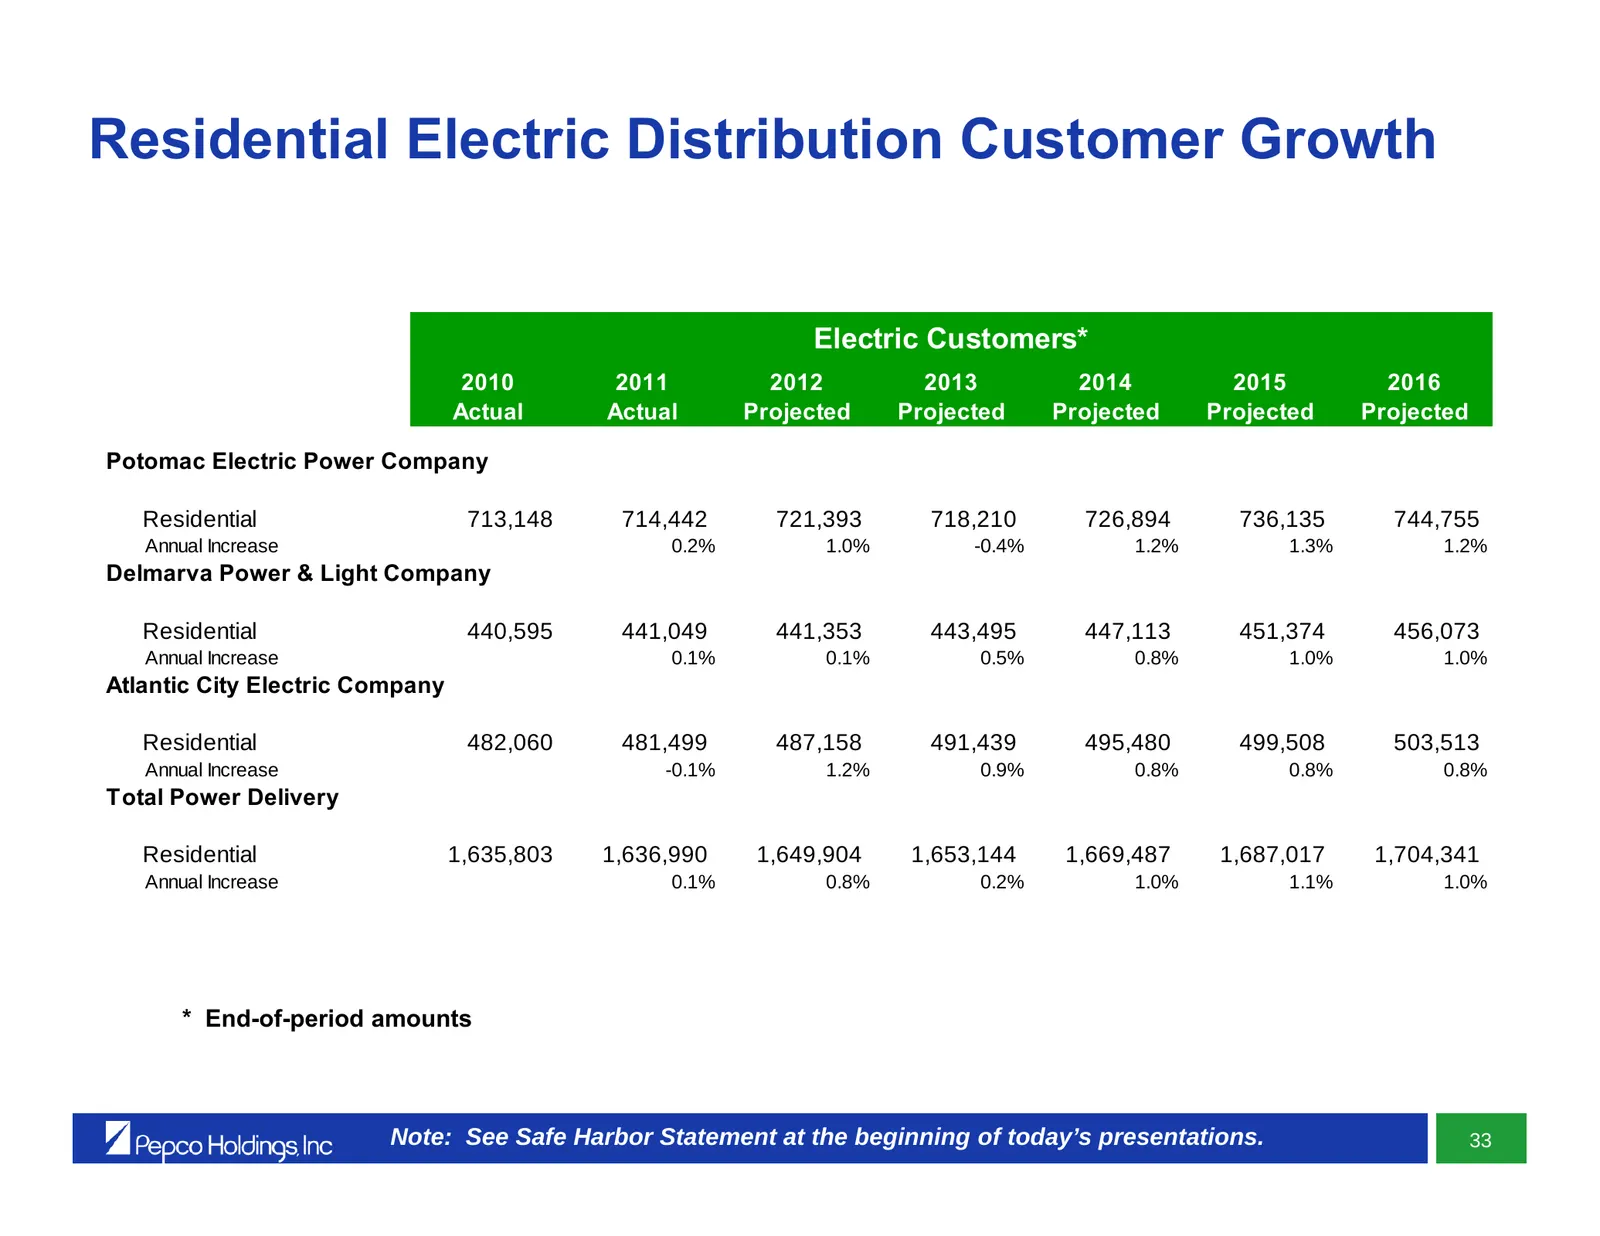
Slide 51: Residential Electric Distribution Customer Growth
Residential Electric Distribution Customer Growth Electric Customers* 2010 2011 2012 2013 2014 2015 2016 Actual Actual Projected Projected Projected Projected Projected Potomac Electric Power Company Residential 713,148 714,442 721,393 718,210 726,894 736,135 744,755 Annual Increase 0.2% 1.0% -0.4%
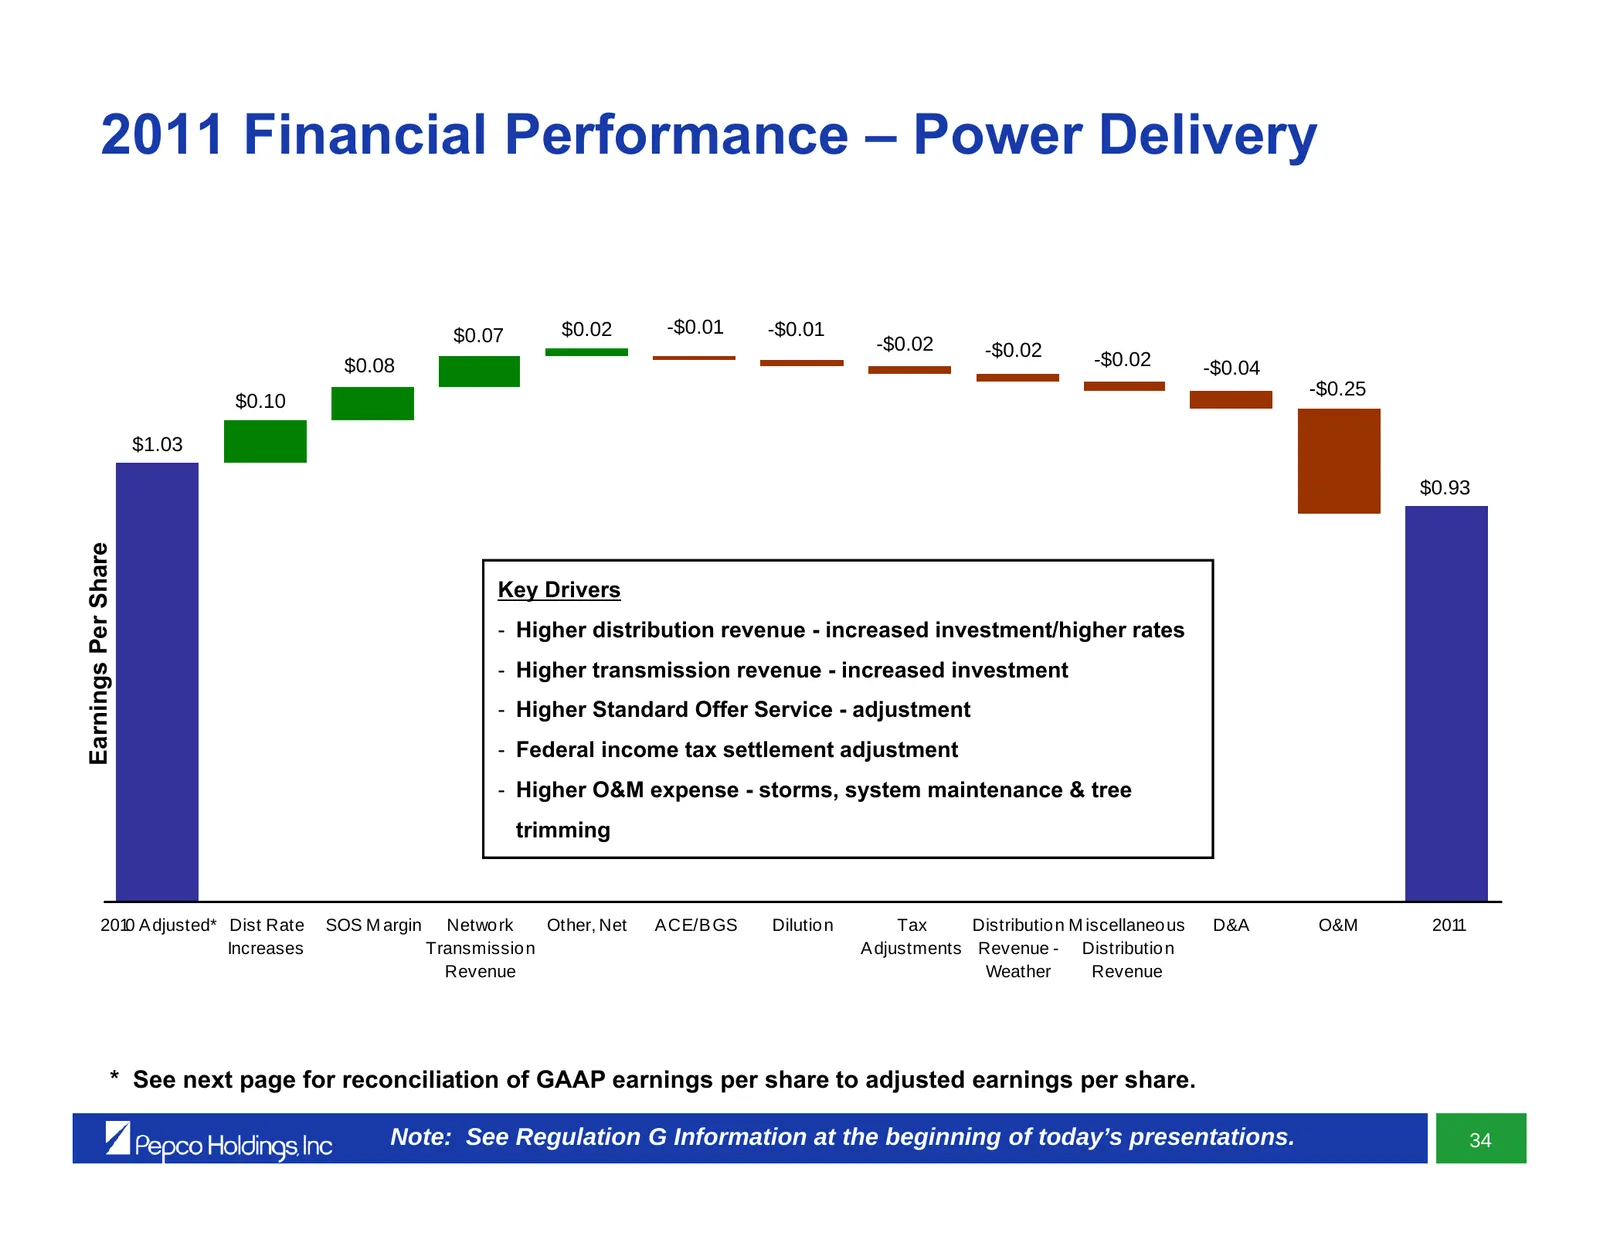
Slide 52: 2011 Financial Performance – Power Delivery
2011 Financial Performance – Power Delivery $0.07 $0.02 -$0.01 -$0.01 -$0.02 -$0.02 $0.08 -$0.02 -$0.04 -$0.25 $0.10 $1.03 $0.93 Earnings Per Share Key Drivers - Higher distribution revenue - increased investment/higher rates - Higher transmission revenue - increased investment - Higher Standard Off
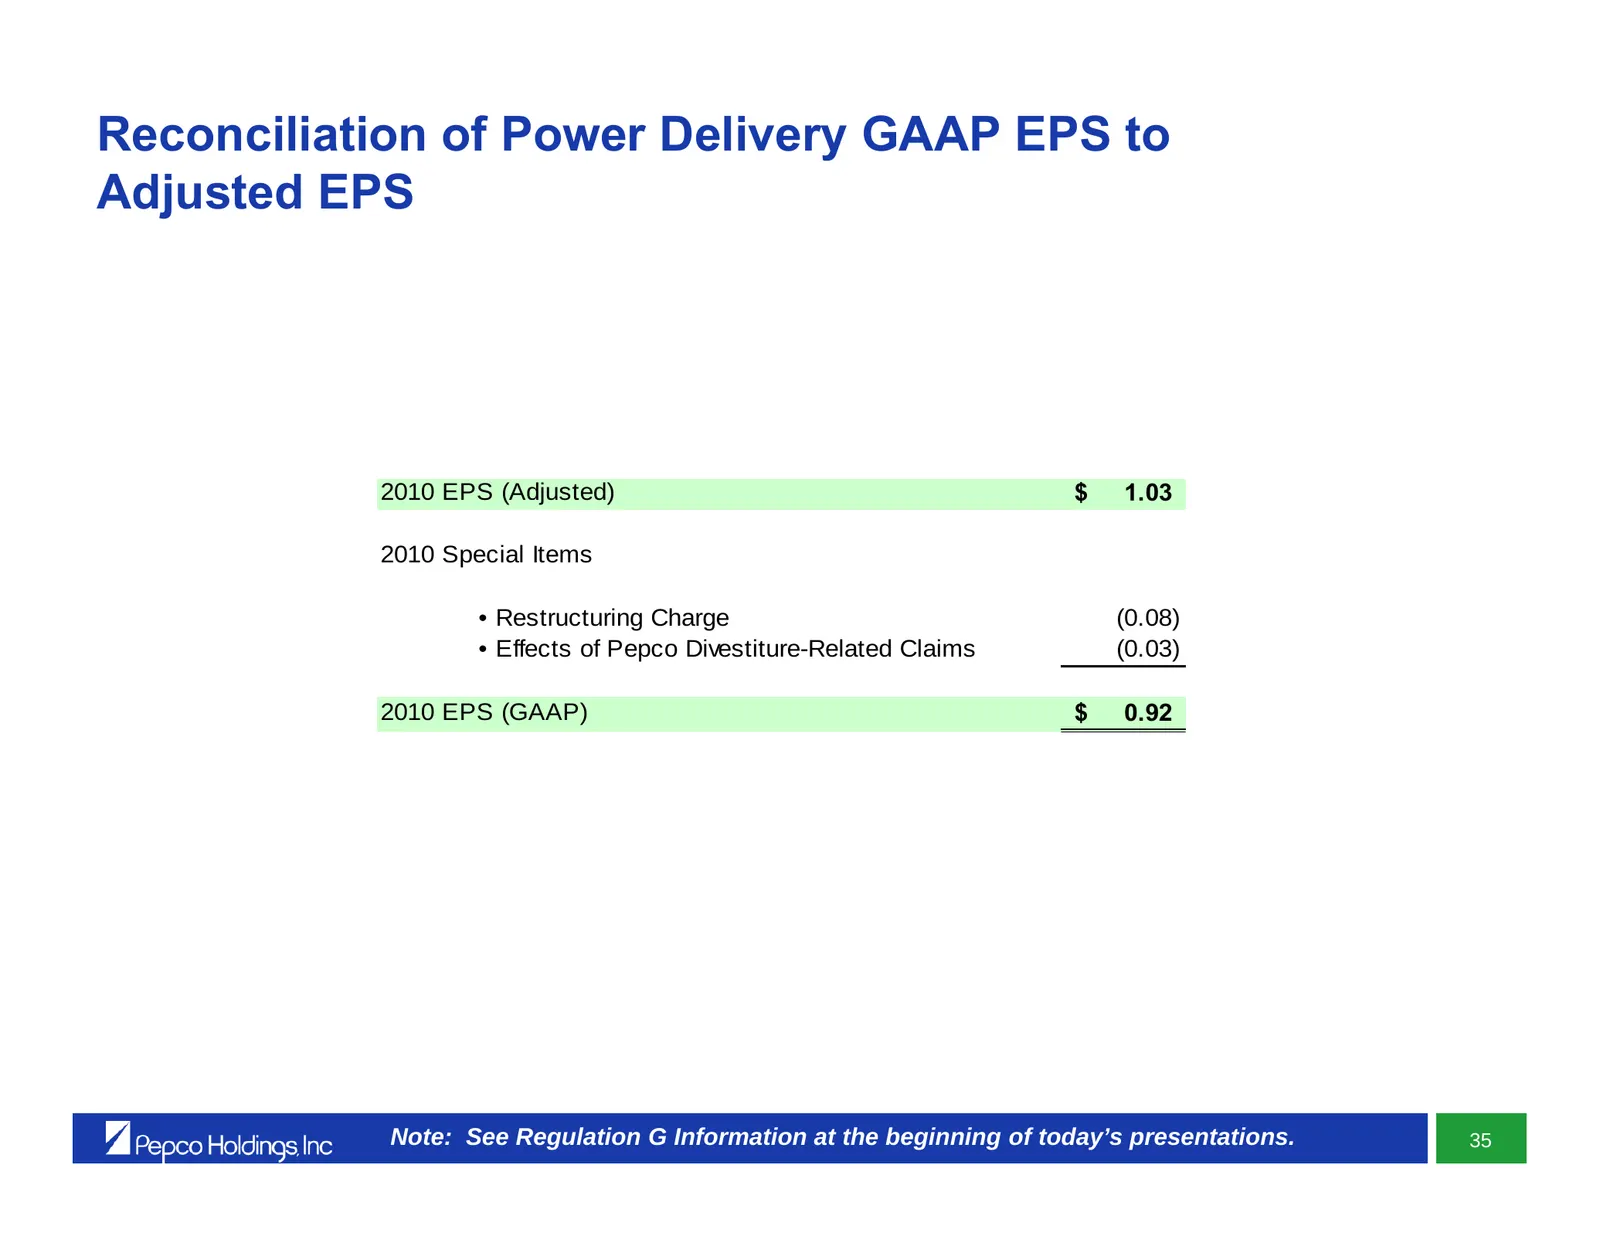
Slide 53: Reconciliation of Power Delivery GAAP EPS to Adjusted EPS
Reconciliation of Power Delivery GAAP EPS to Adjusted EPS 2010 EPS (Adjusted) $ 1.03 2010 Special Items • Restructuring Charge (0.08) • Effects of Pepco Divestiture-Related Claims (0.03) 2010 EPS (GAAP) $ 0.92 Note: See Regulation G Information at the beginning of today’s presentations. 35
Slide 54: Regulatory Overview
Regulatory Overview Tony Kamerick Senior Vice President & Chief Financial Officer
Slide 55: Executing Our Regulatory Strategy – A Core Competency
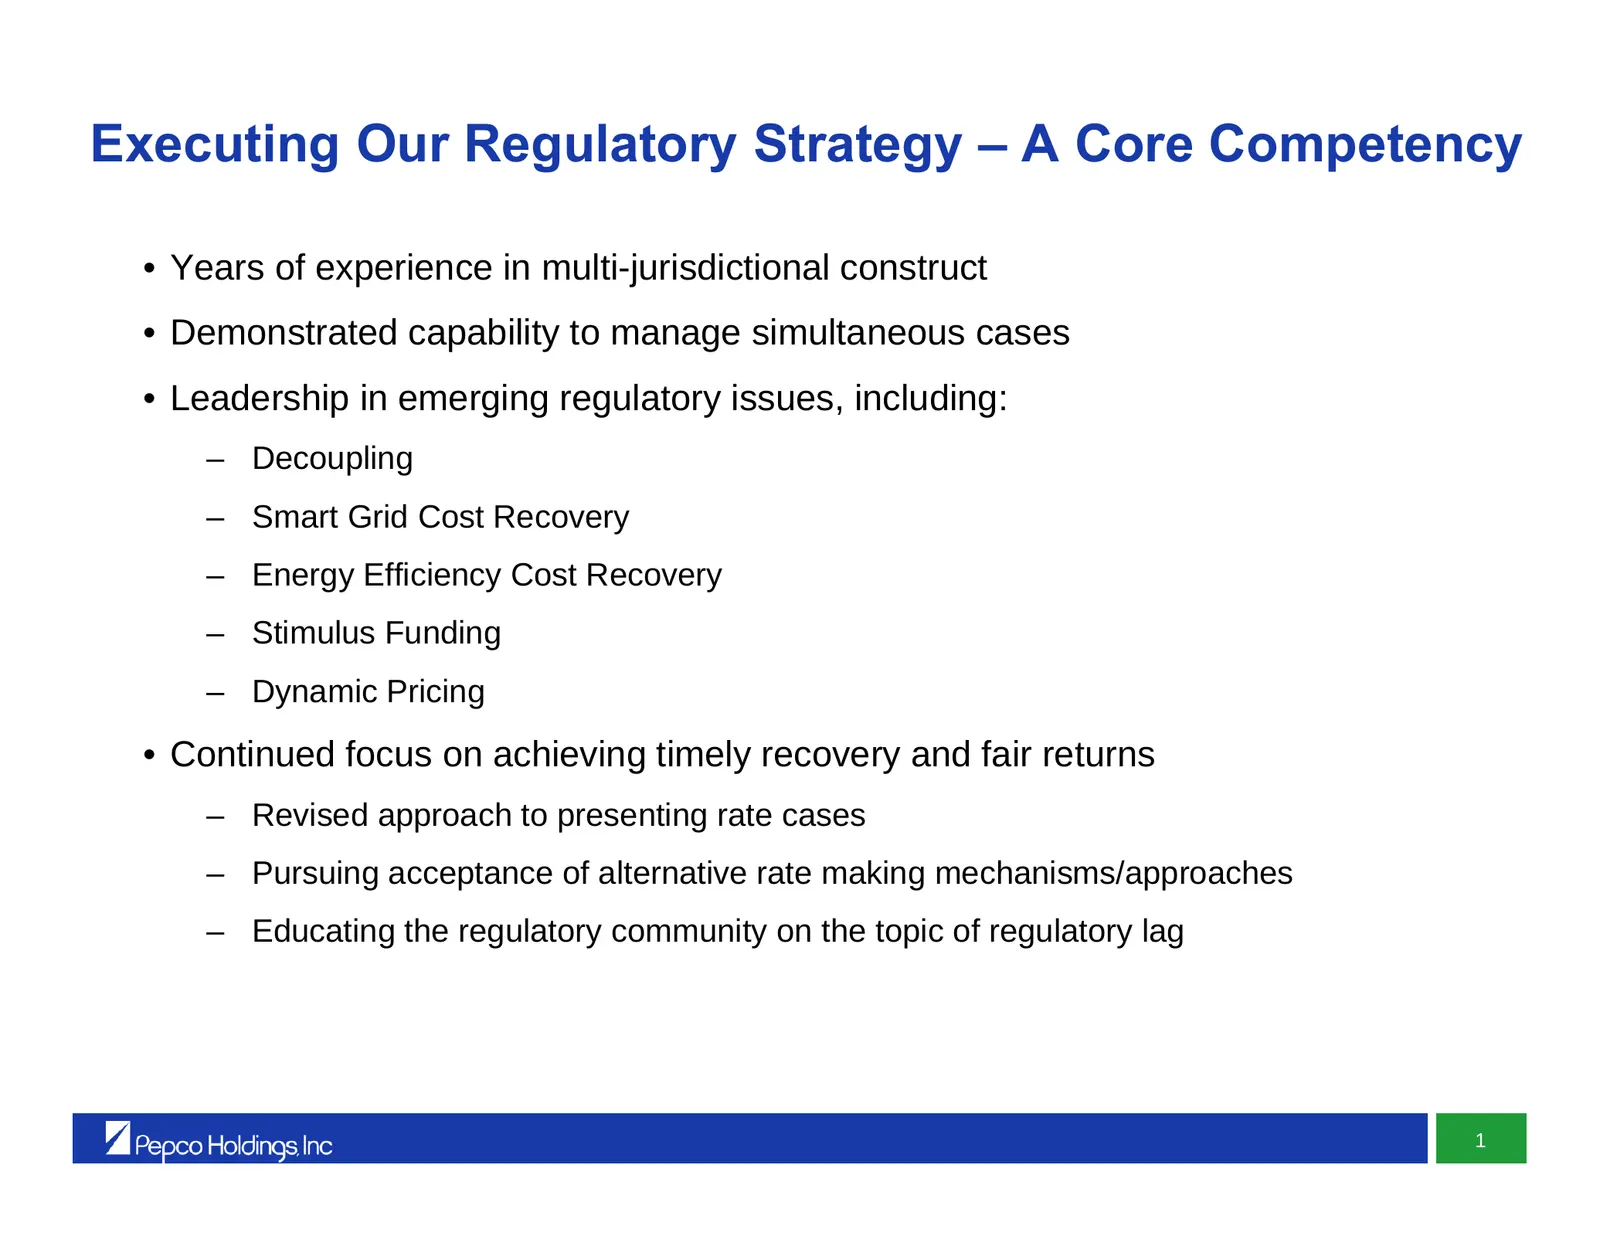
Executing Our Regulatory Strategy – A Core Competency • Years of experience in multi-jurisdictional construct • Demonstrated capability to manage simultaneous cases • Leadership in emerging regulatory issues, including: – Decoupling – Smart Grid Cost Recovery – Energy Efficiency Cost Recovery – Stim
Slide 56: Executing Our Regulatory Strategy – A Deep Bench
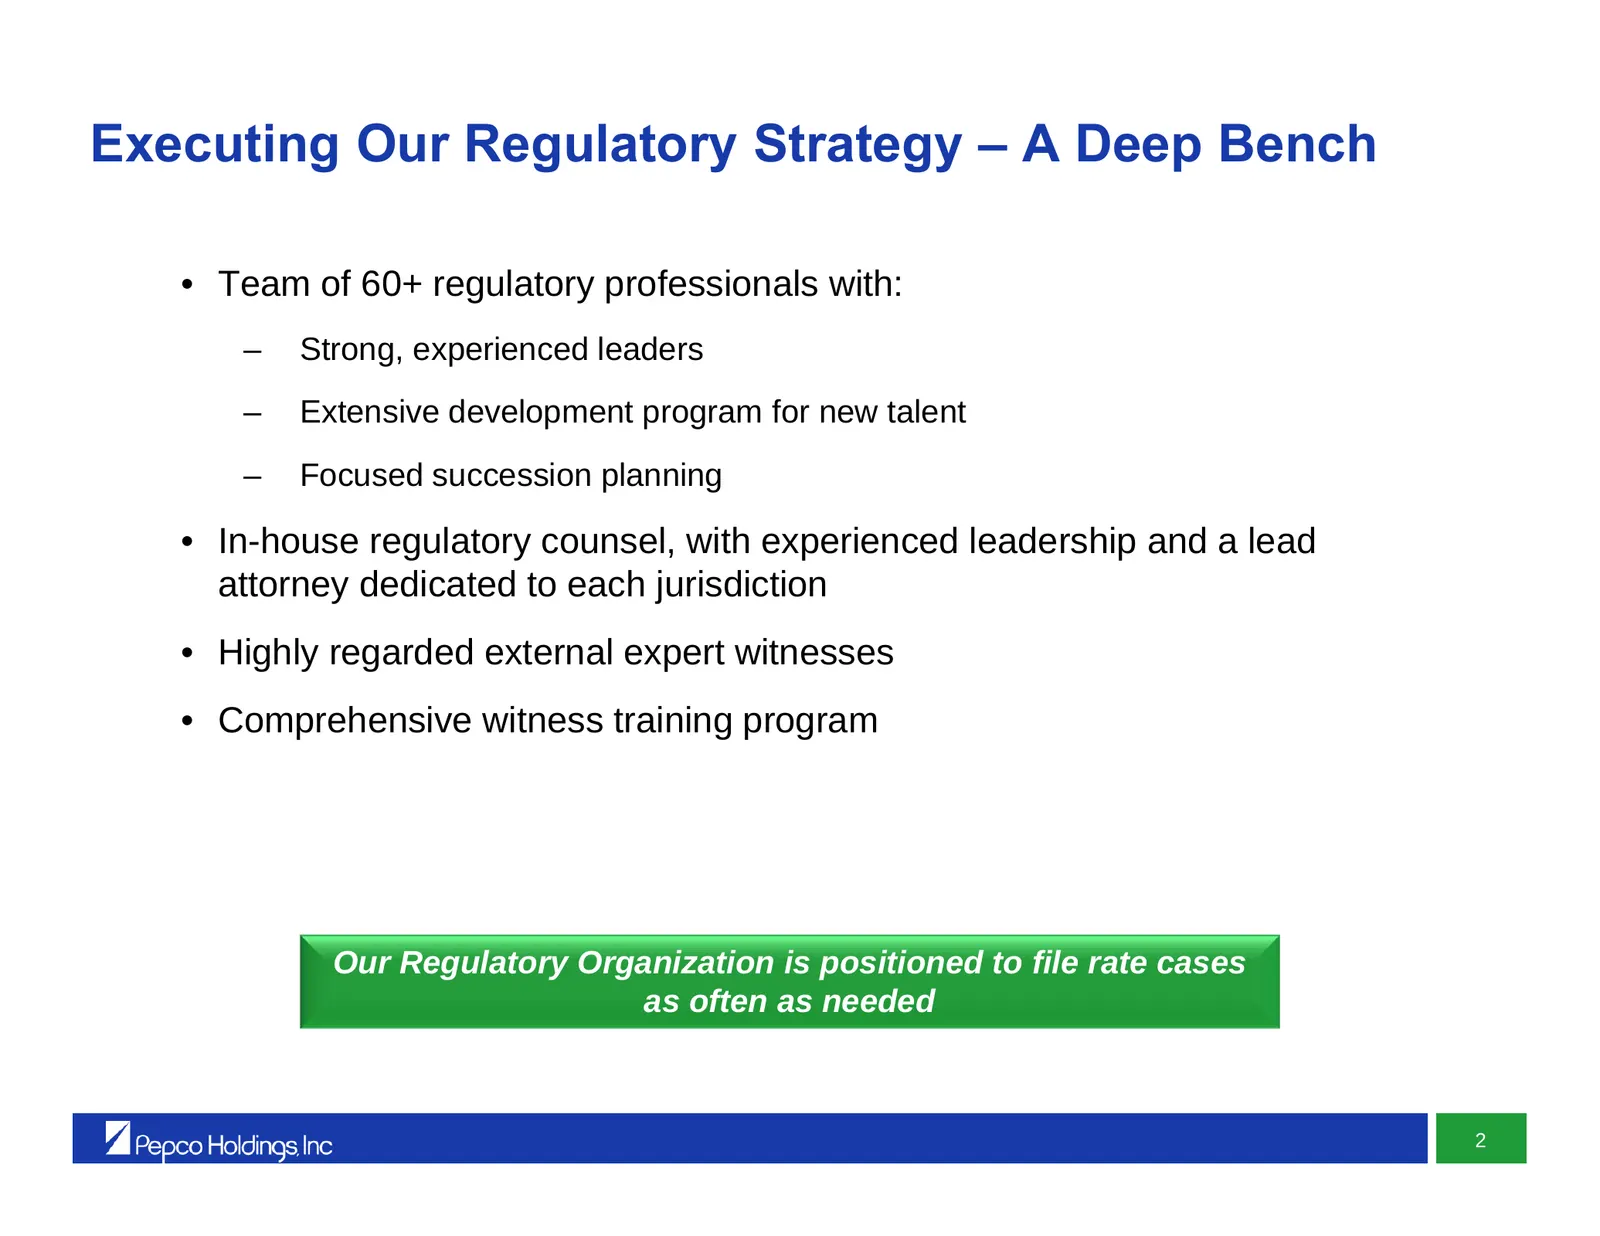
Executing Our Regulatory Strategy – A Deep Bench • Team of 60+ regulatory professionals with: – Strong, experienced leaders – Extensive development program for new talent – Focused succession planning • In-house regulatory counsel, with experienced leadership and a lead attorney dedicated to each ju
Slide 57: 2011 Highlights
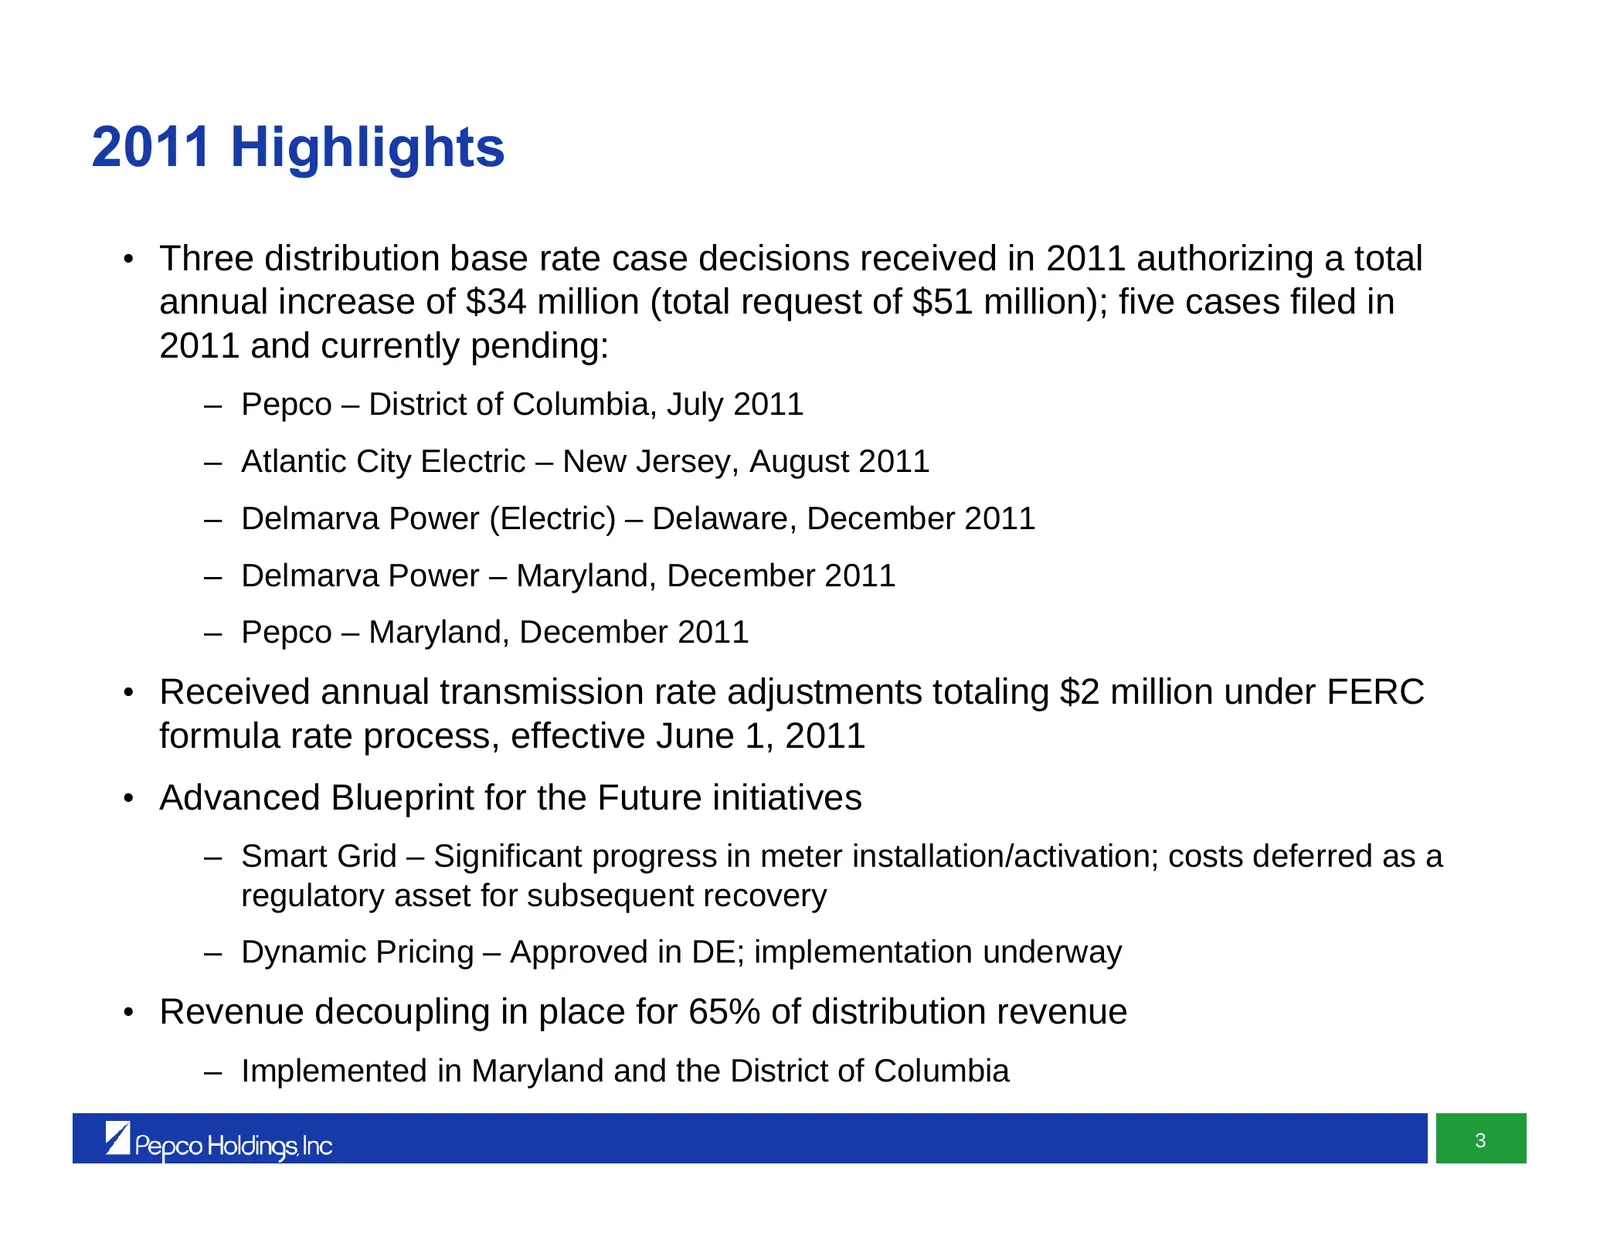
2011 Highlights • Three distribution base rate case decisions received in 2011 authorizing a total annual increase of $34 million (total request of $51 million); five cases filed in 2011 and currently pending: – Pepco – District of Columbia, July 2011 – Atlantic City Electric – New Jersey, August 20
Slide 58: Regulatory Environment
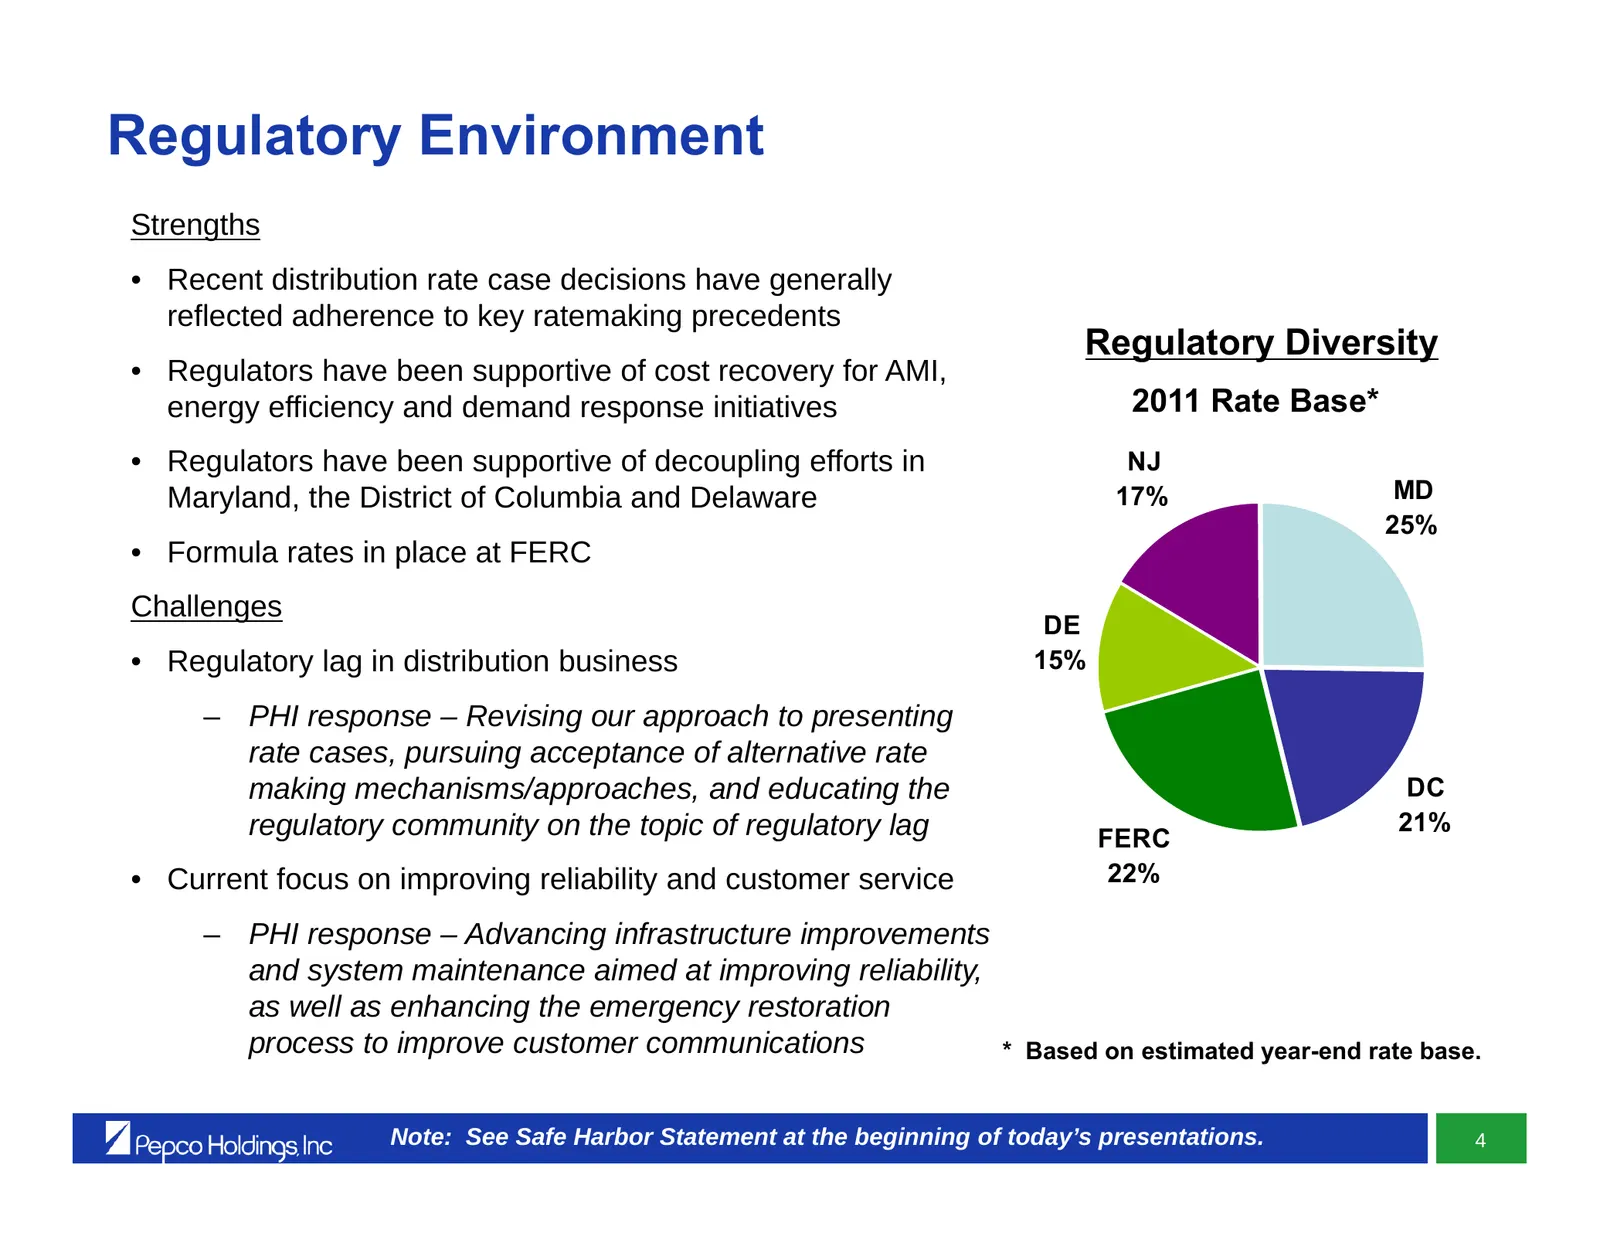
Regulatory Environment Strengths • Recent distribution rate case decisions have generally reflected adherence to key ratemaking precedents Regulatory Diversity • Regulators have been supportive of cost recovery for AMI, energy efficiency and demand response initiatives 2011 Rate Base* • Regulators h
Slide 59: Rate Base Summary
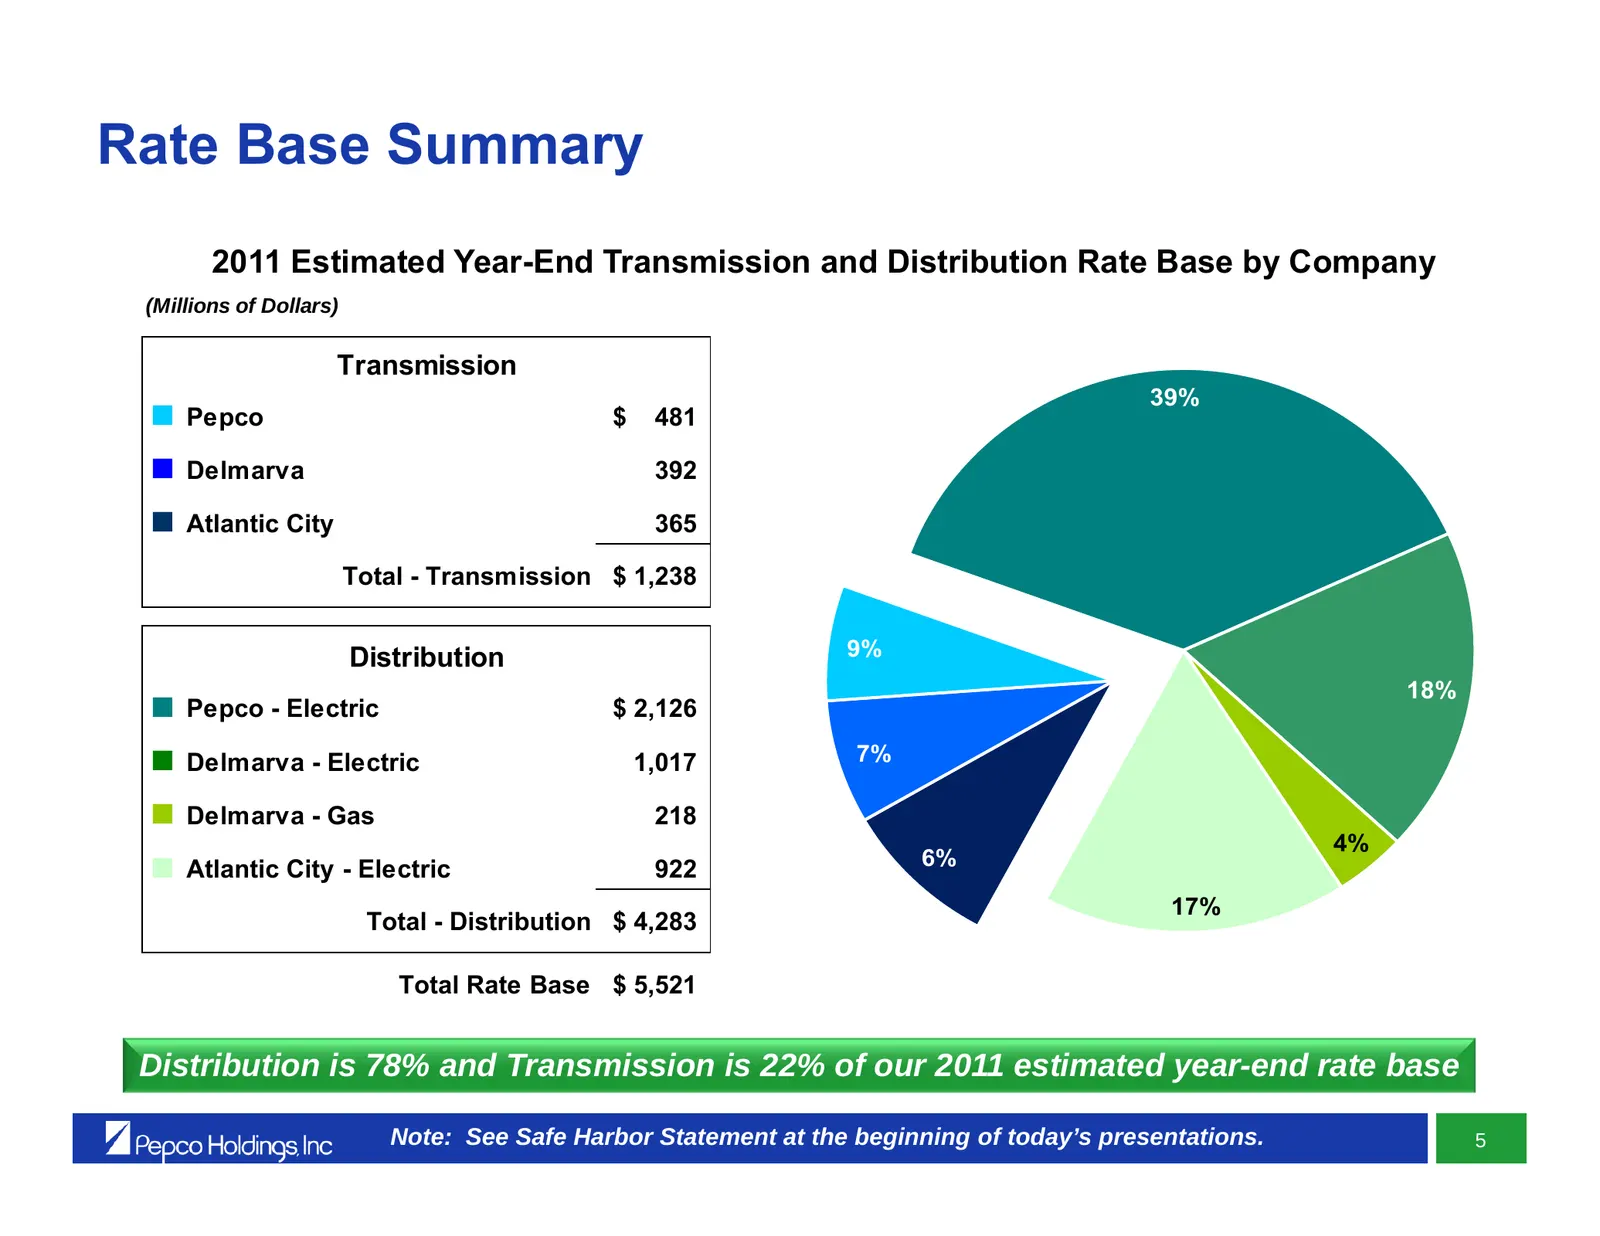
Rate Base Summary 2011 Estimated Year-End Transmission and Distribution Rate Base by Company (Millions of Dollars) Transmission 39% ■ Pepco $ 481 ■ Delmarva 392 ■ Atlantic City 365 Total - Transmission $ 1,238 7% Distribution 9% 18% ■ Pepco - Electric $ 2,126 7% ■ Delmarva - Electric 1,017 7% ■ Delm
Slide 60: Closing the ROE Gap – An Earnings Growth Opportunity
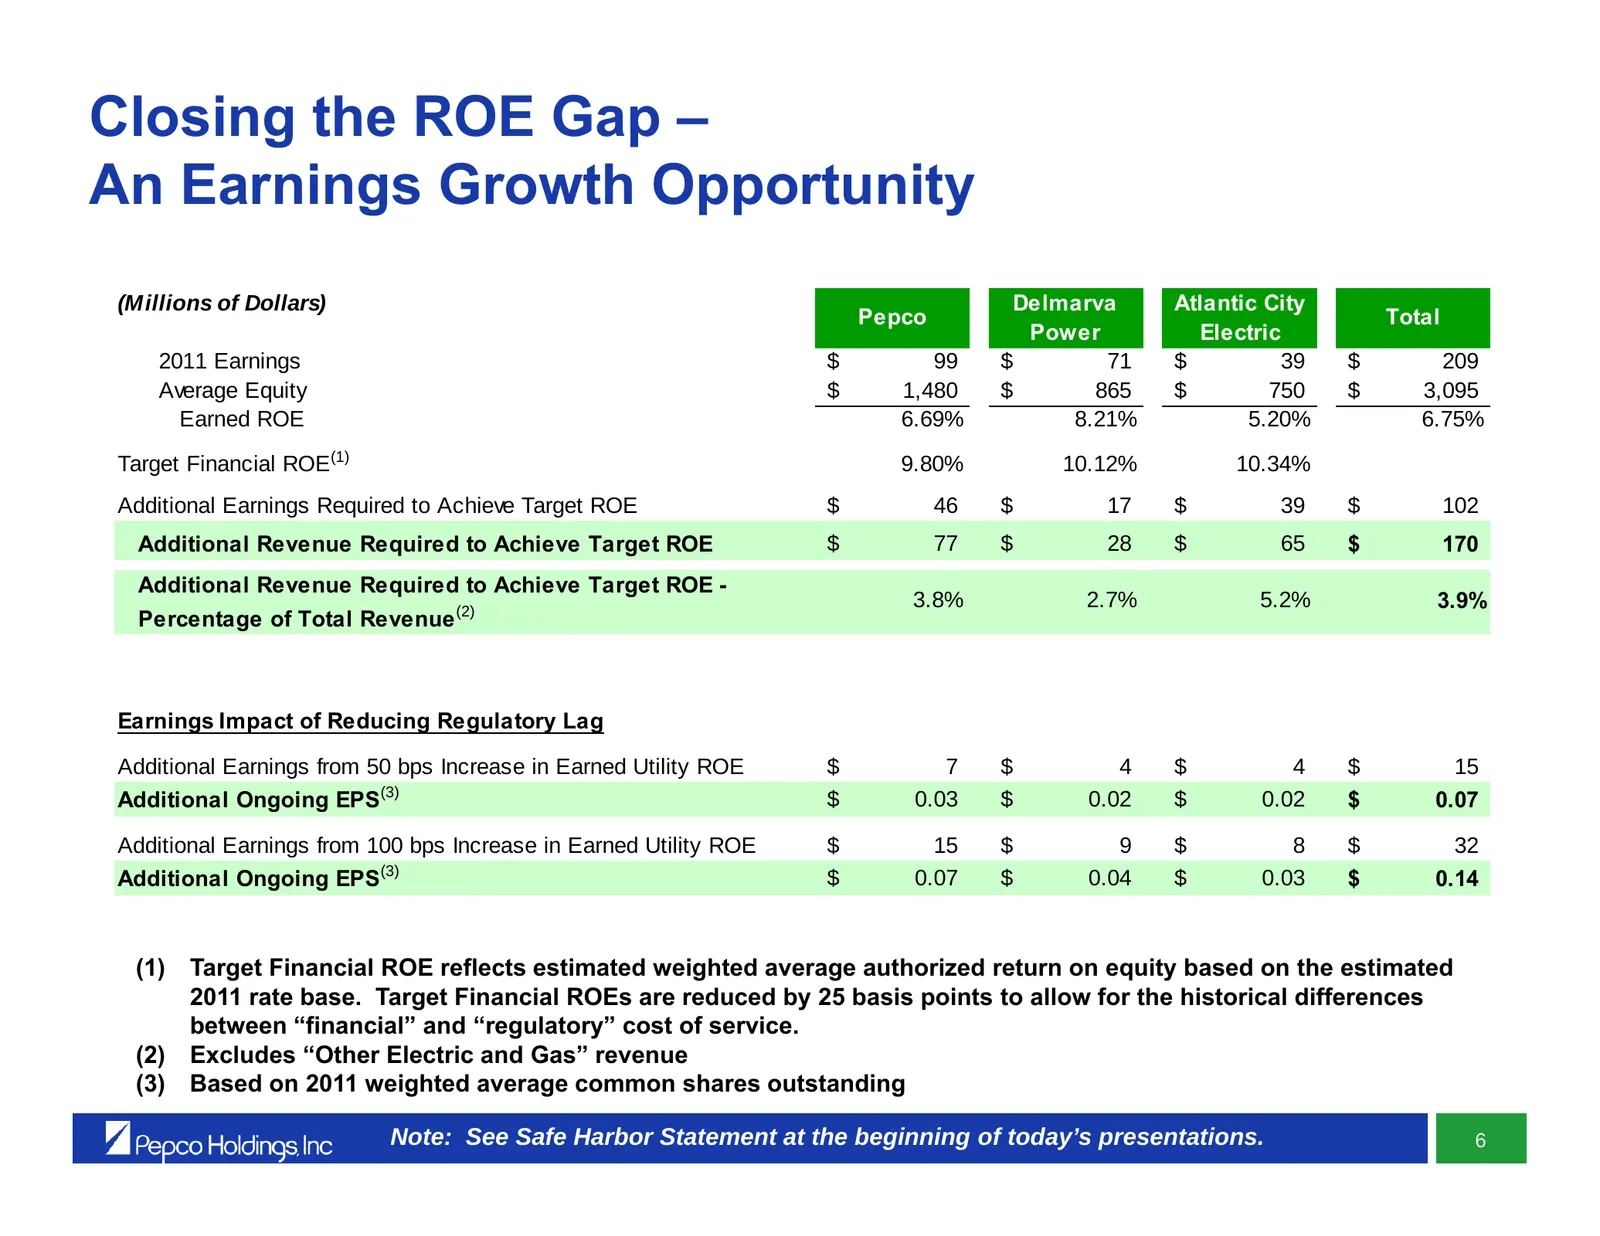
Closing the ROE Gap – An Earnings Growth Opportunity (Millions of Dollars) Delmarva Atlantic City Pepco Total Power Electric 2011 Earnings $ 99 $ 71 $ 39 $ 209 Average Equity $ 1,480 $ 865 $ 750 $ 3,095 Earned ROE 6.69% 8.21% 5.20% 6.75% Target Financial ROE(1) 9.80% 10.12% 10.34% Additional Earning
Slide 61: Distribution Rate Cases – The Current Cycle
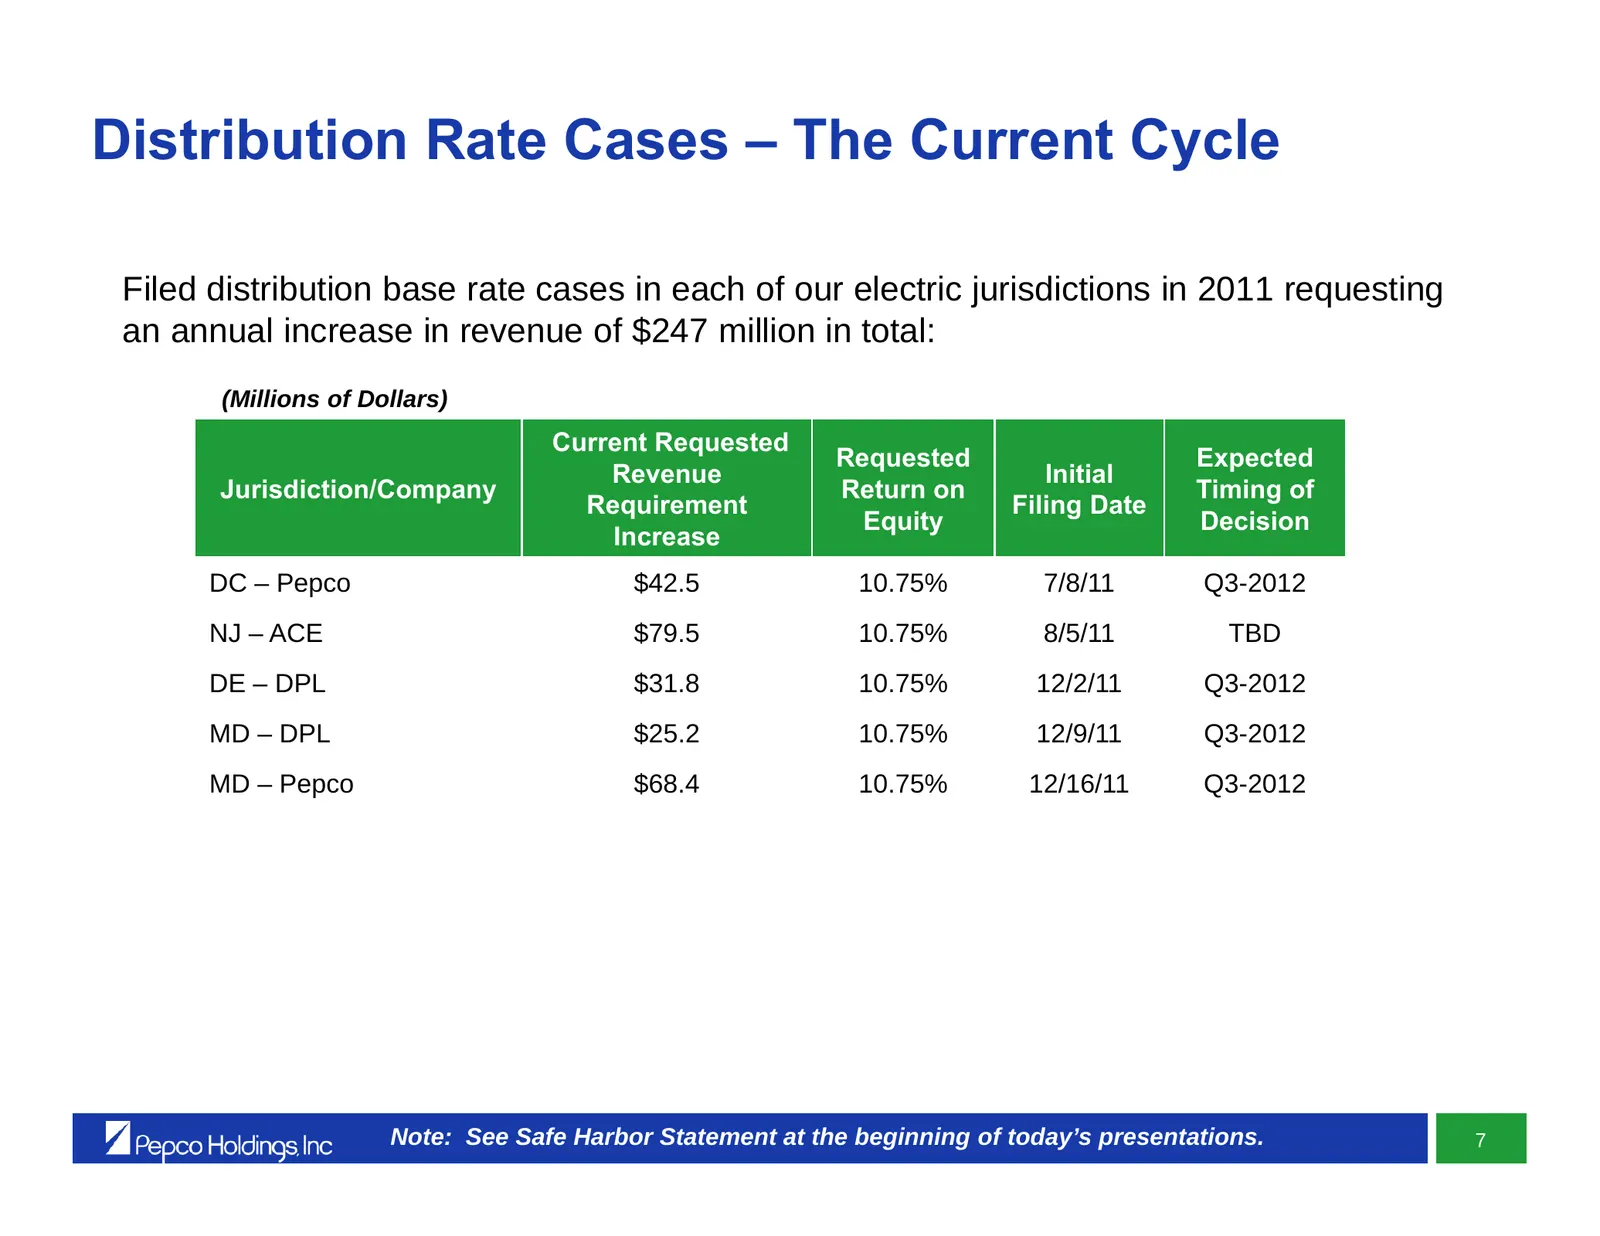
Distribution Rate Cases – The Current Cycle Filed distribution base rate cases in each of our electric jurisdictions in 2011 requesting an annual increase in revenue of $247 million in total: (Millions of Dollars) Current Requested Requested Expected Revenue Initial Jurisdiction/Company Return on Ti
Slide 62: Distribution Rate Cases – Drivers of Requested Revenue Increase
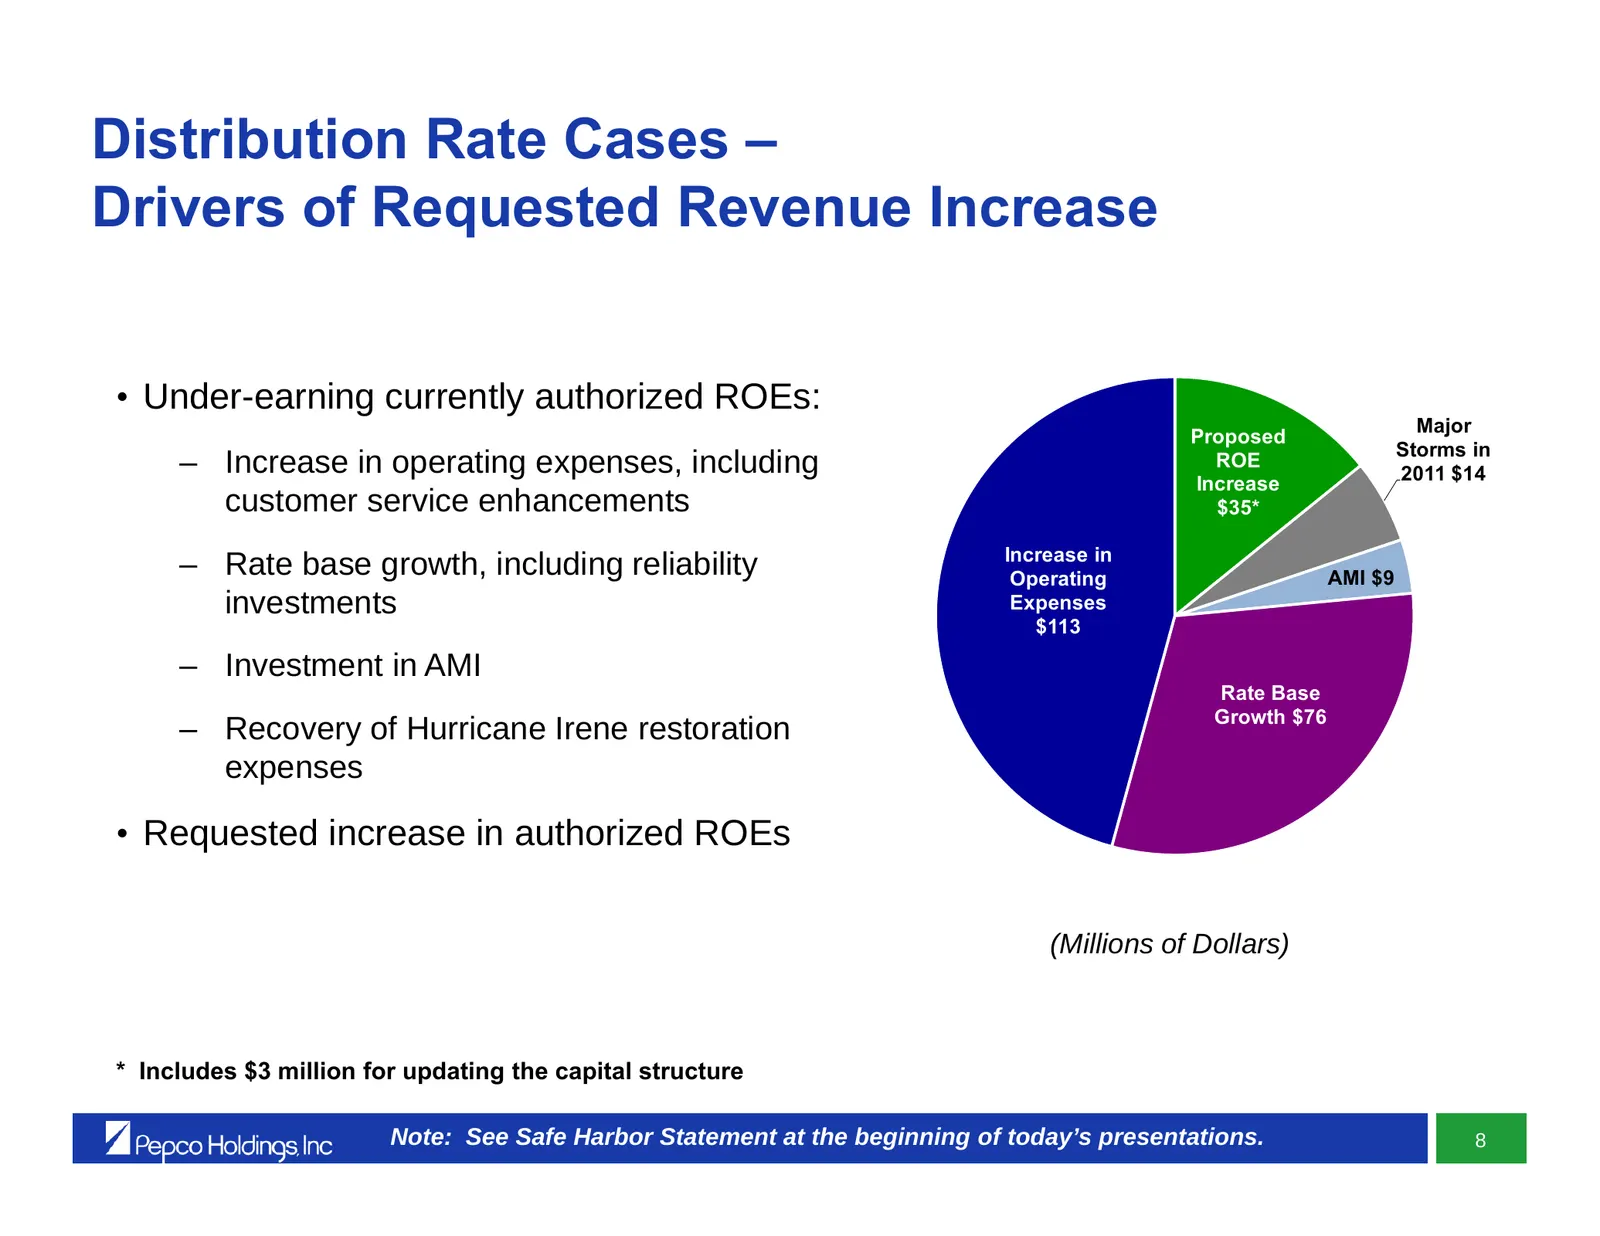
Distribution Rate Cases – Drivers of Requested Revenue Increase • Under-earning currently authorized ROEs: Major Proposed Storms in – Increase in operating expenses, including ROE 2011 $14 Increase customer service enhancements $35* Increase in – Rate base growth, including reliability Operating AMI
Slide 63: Distribution Rate Cases – Focus on Regulatory Lag
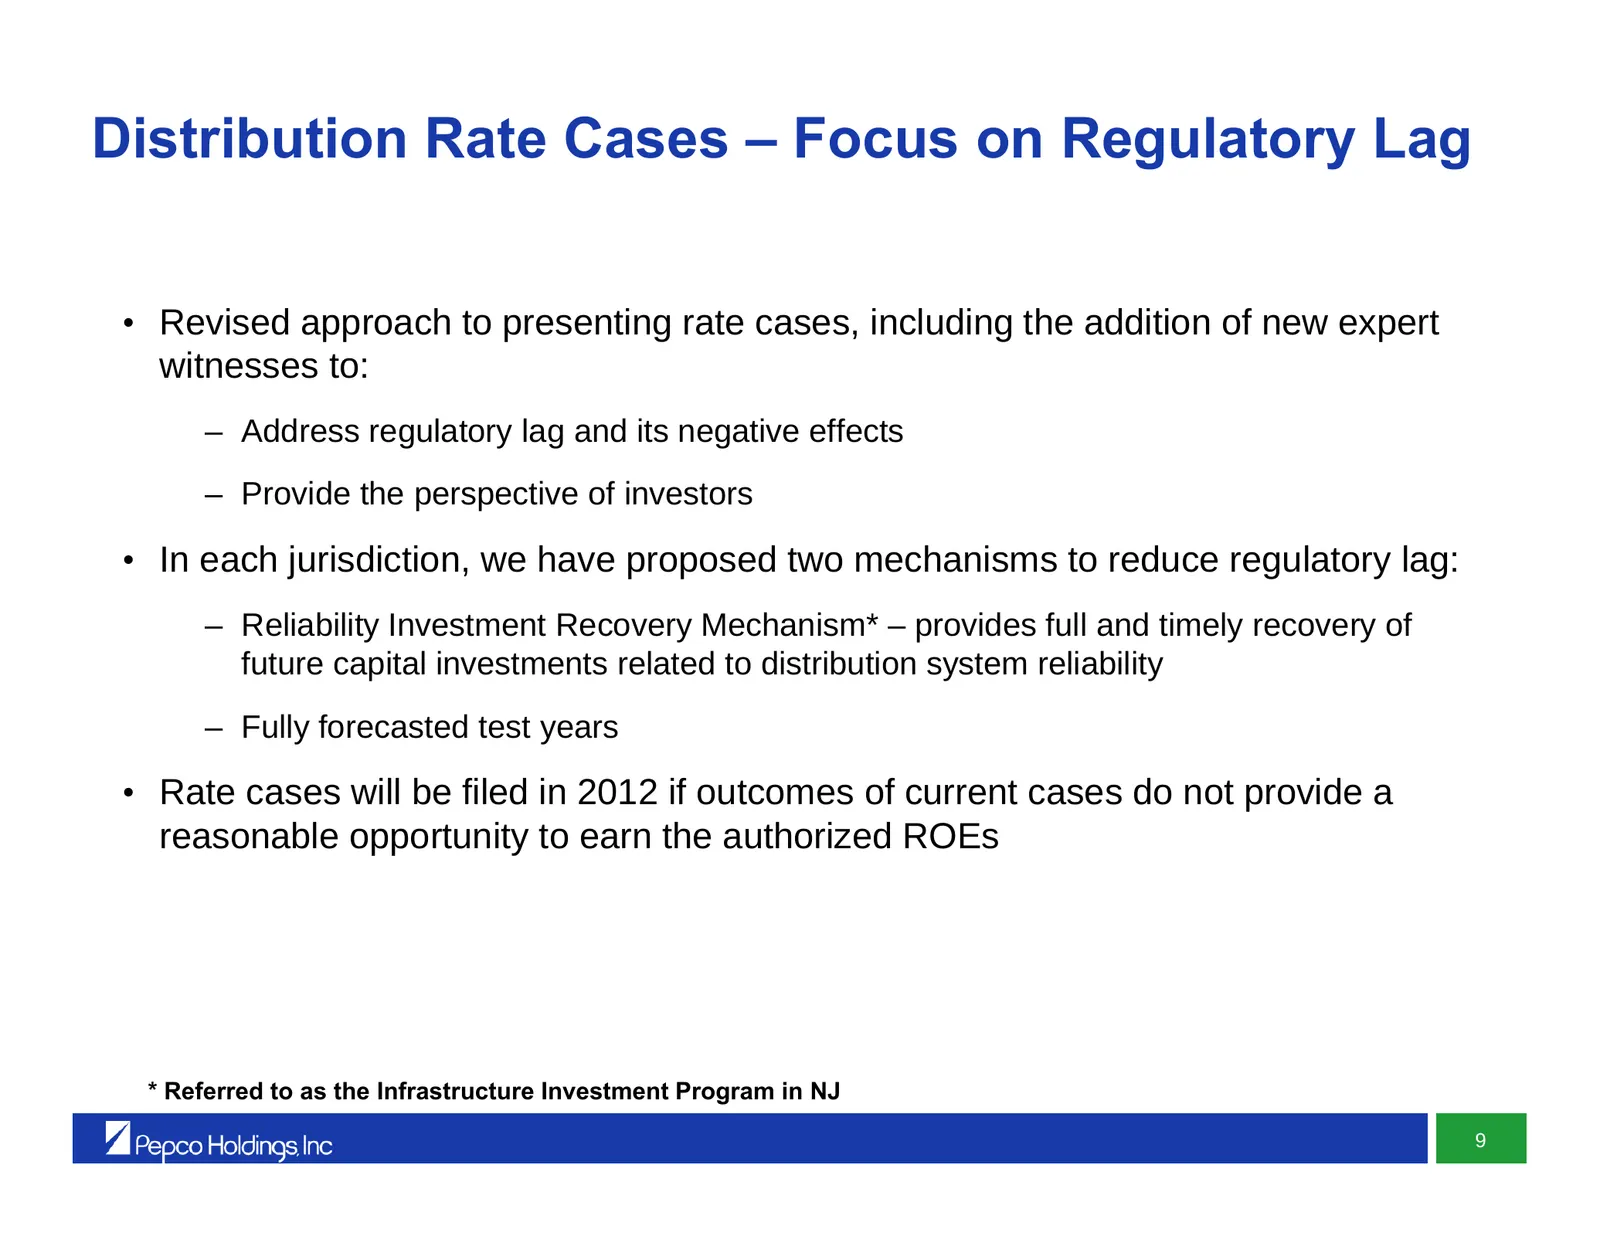
Distribution Rate Cases – Focus on Regulatory Lag • Revised approach to presenting rate cases, including the addition of new expert witnesses to: – Address regulatory lag and its negative effects – Provide the perspective of investors • In each jurisdiction, we have proposed two mechanisms to reduce
Slide 64: Distribution Rate Cases – Pending Pepco – District of Columbia
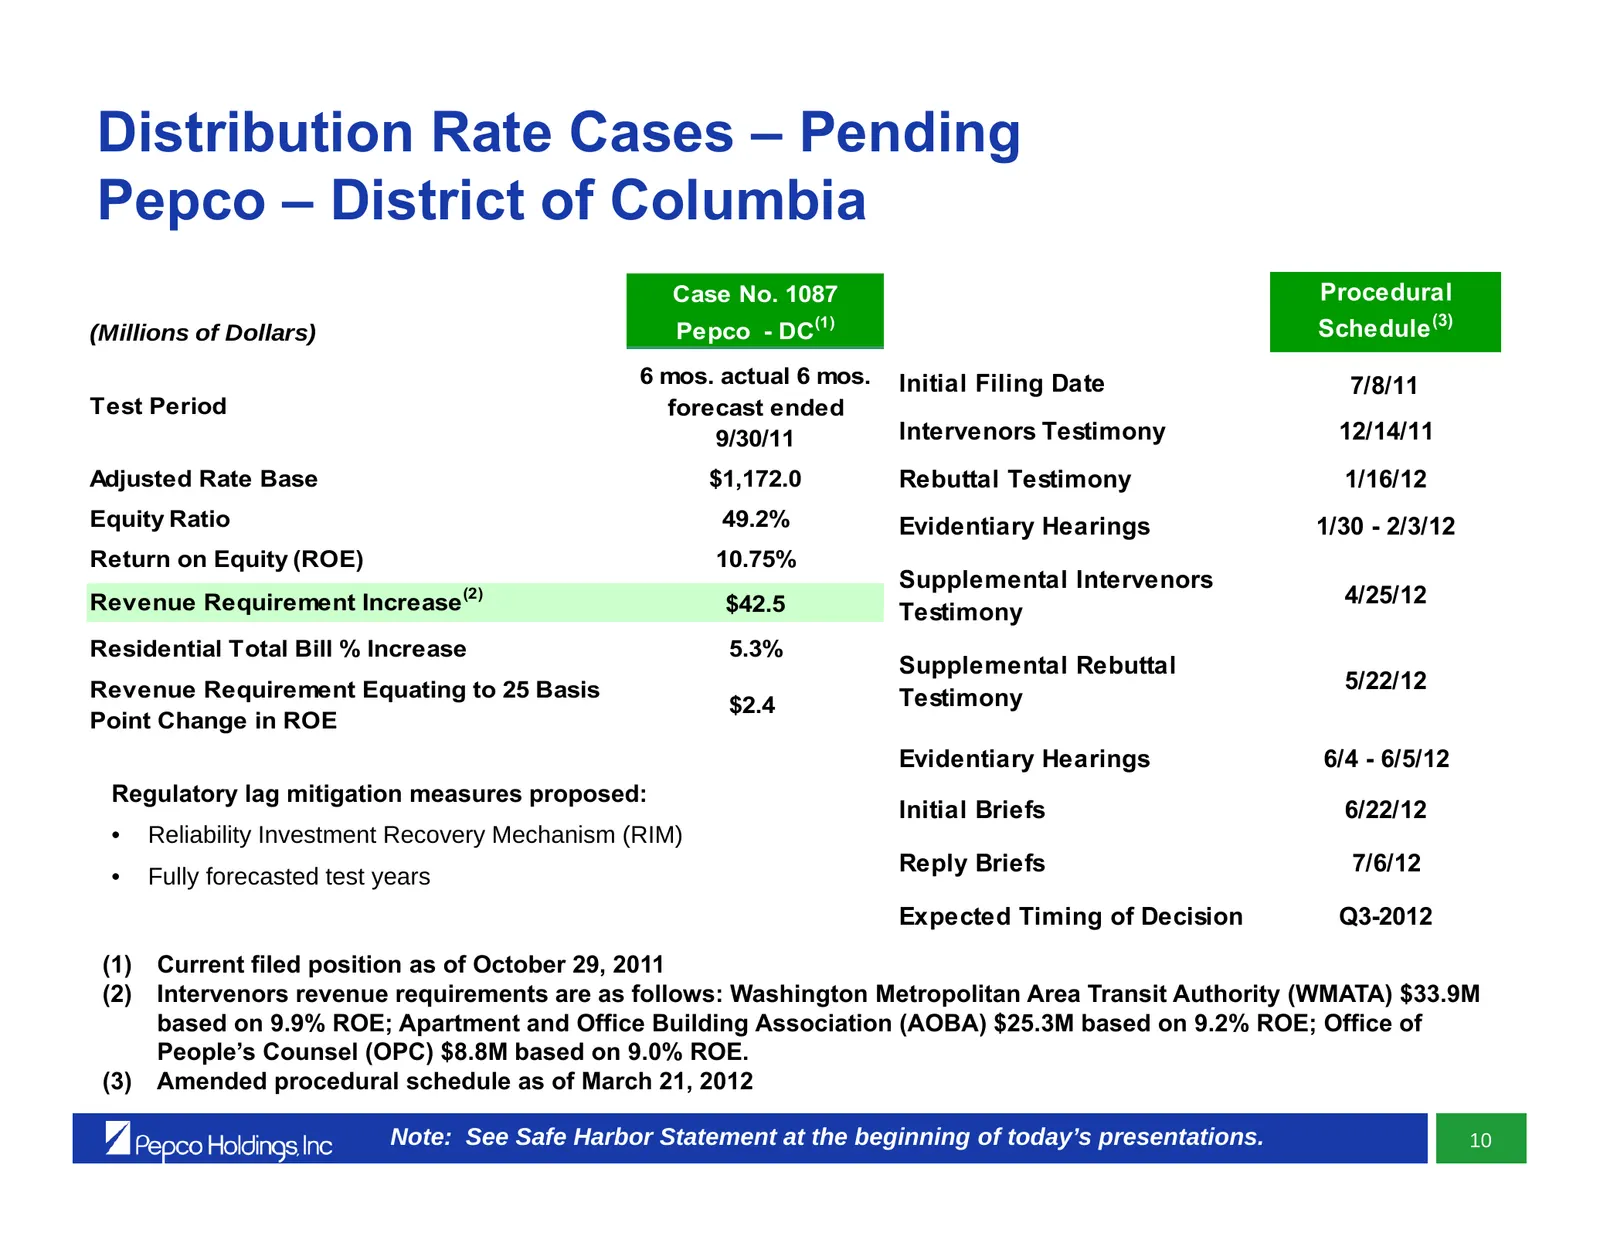
Distribution Rate Cases – Pending Pepco – District of Columbia Case No. 1087 Procedural (Millions of Dollars) Pepco - DC (1) Schedule (3) 6 mos. actual 6 mos. Initial Filing Date 7/8/11 Test Period forecast ended 9/30/11 Intervenors Testimony 12/14/11 Adjusted Rate Base $1,172.0 Rebuttal Testimony 1
Slide 65: Distribution Rate Cases – Pending Atlantic City Electric – New Jersey
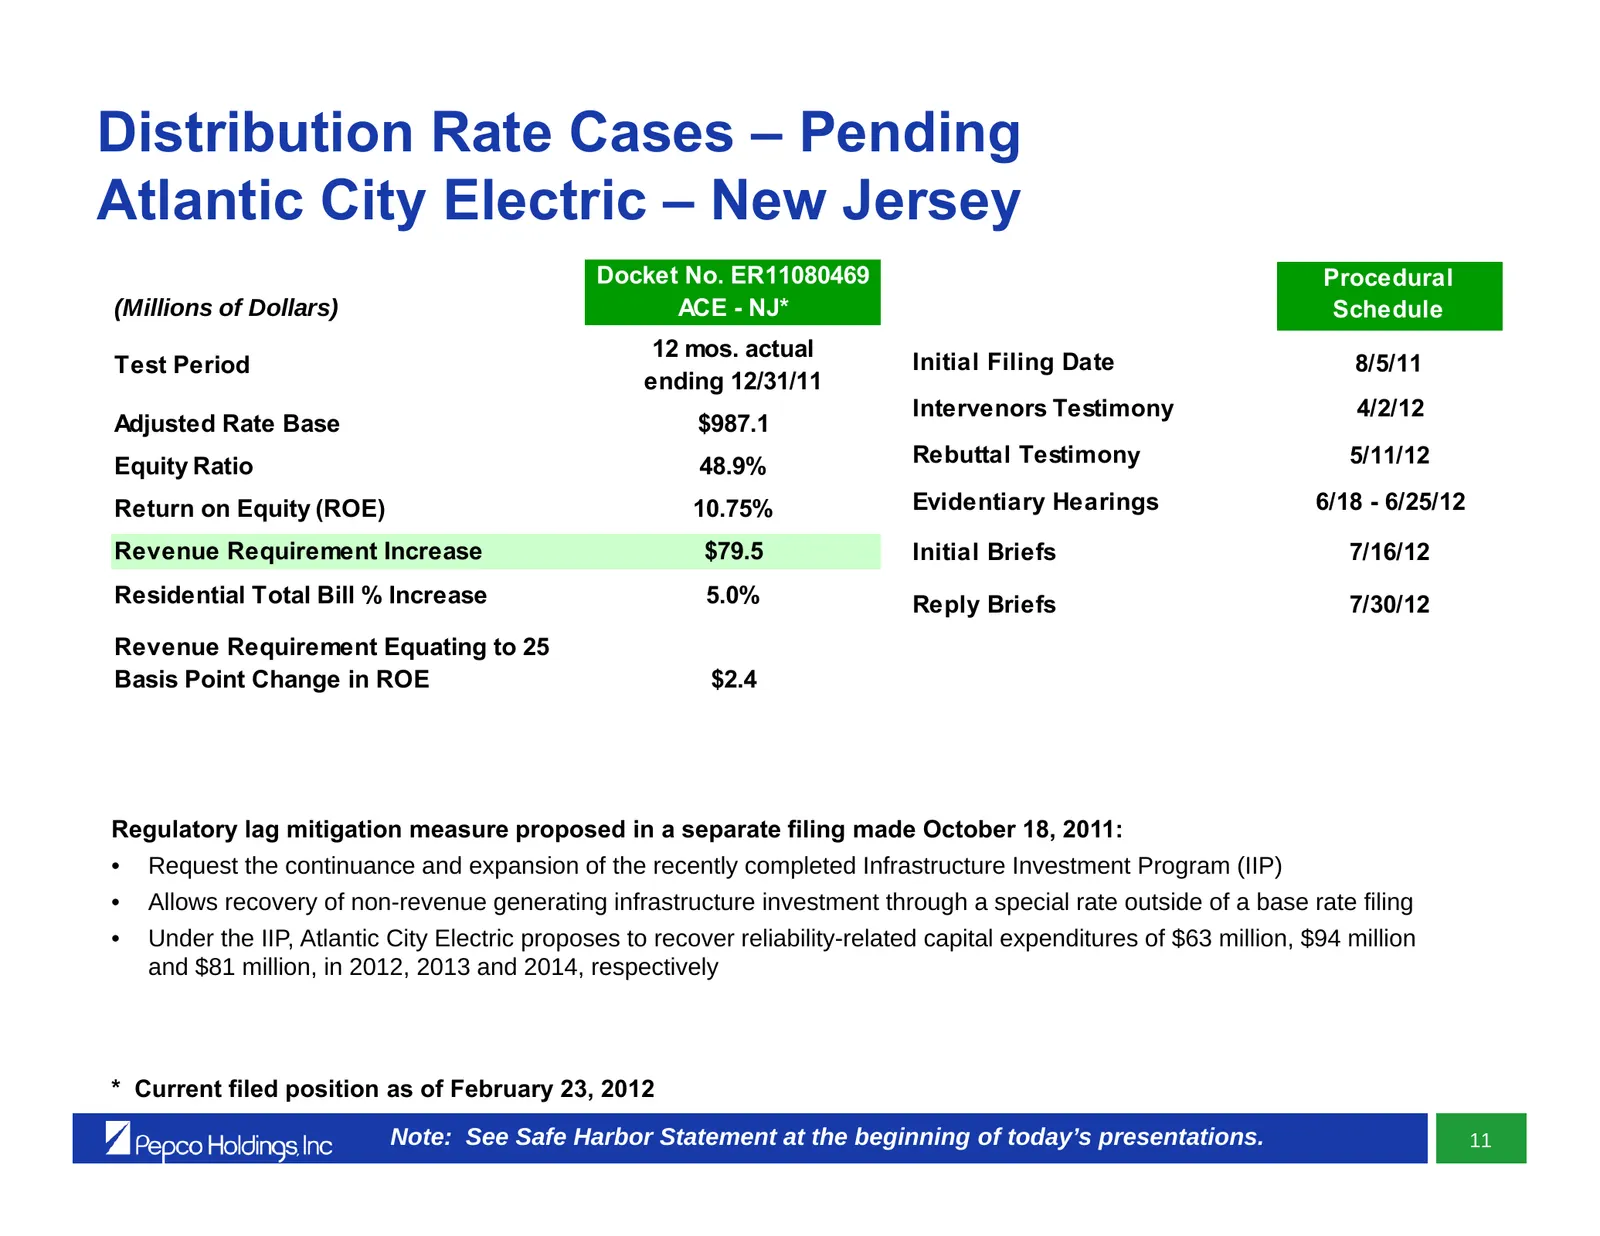
Distribution Rate Cases – Pending Atlantic City Electric – New Jersey Docket No. ER11080469 Procedural (Millions of Dollars) ACE - NJ* Schedule 12 mos. actual Test Period Initial Filing Date 8/5/11 ending 12/31/11 Intervenors Testimony 4/2/12 Adjusted Rate Base $987.1 Equity Ratio 48.9% Rebuttal Tes
Slide 66: Distribution Rate Cases – Pending Delmarva Power – Delaware Electric
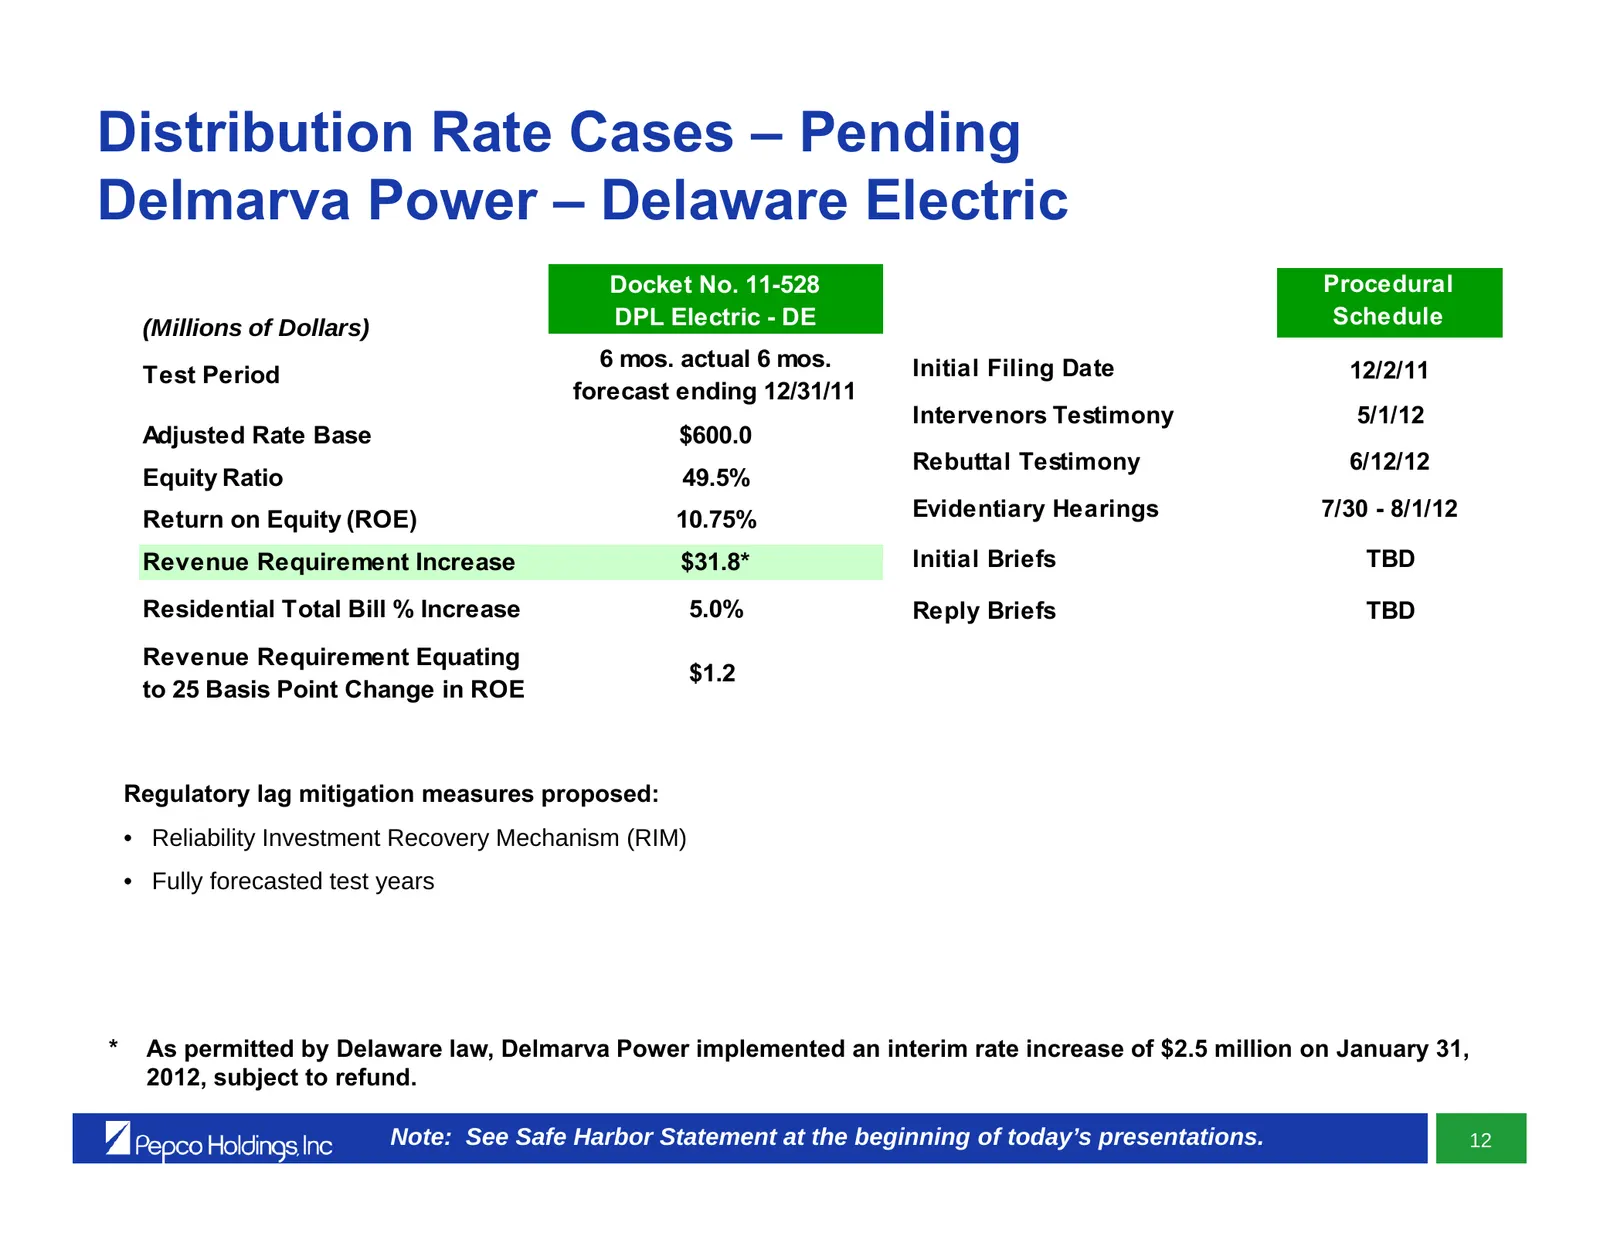
Distribution Rate Cases – Pending Delmarva Power – Delaware Electric Docket No. 11-528 Procedural (Millions of Dollars) DPL Electric - DE Schedule 6 mos. actual 6 mos. Initial Filing Date 12/2/11 Test Period forecast ending 12/31/11 Intervenors Testimony 5/1/12 Adjusted Rate Base $600.0 Rebuttal Tes
Slide 67: Distribution Rate Cases – Pending Delmarva Power – Maryland
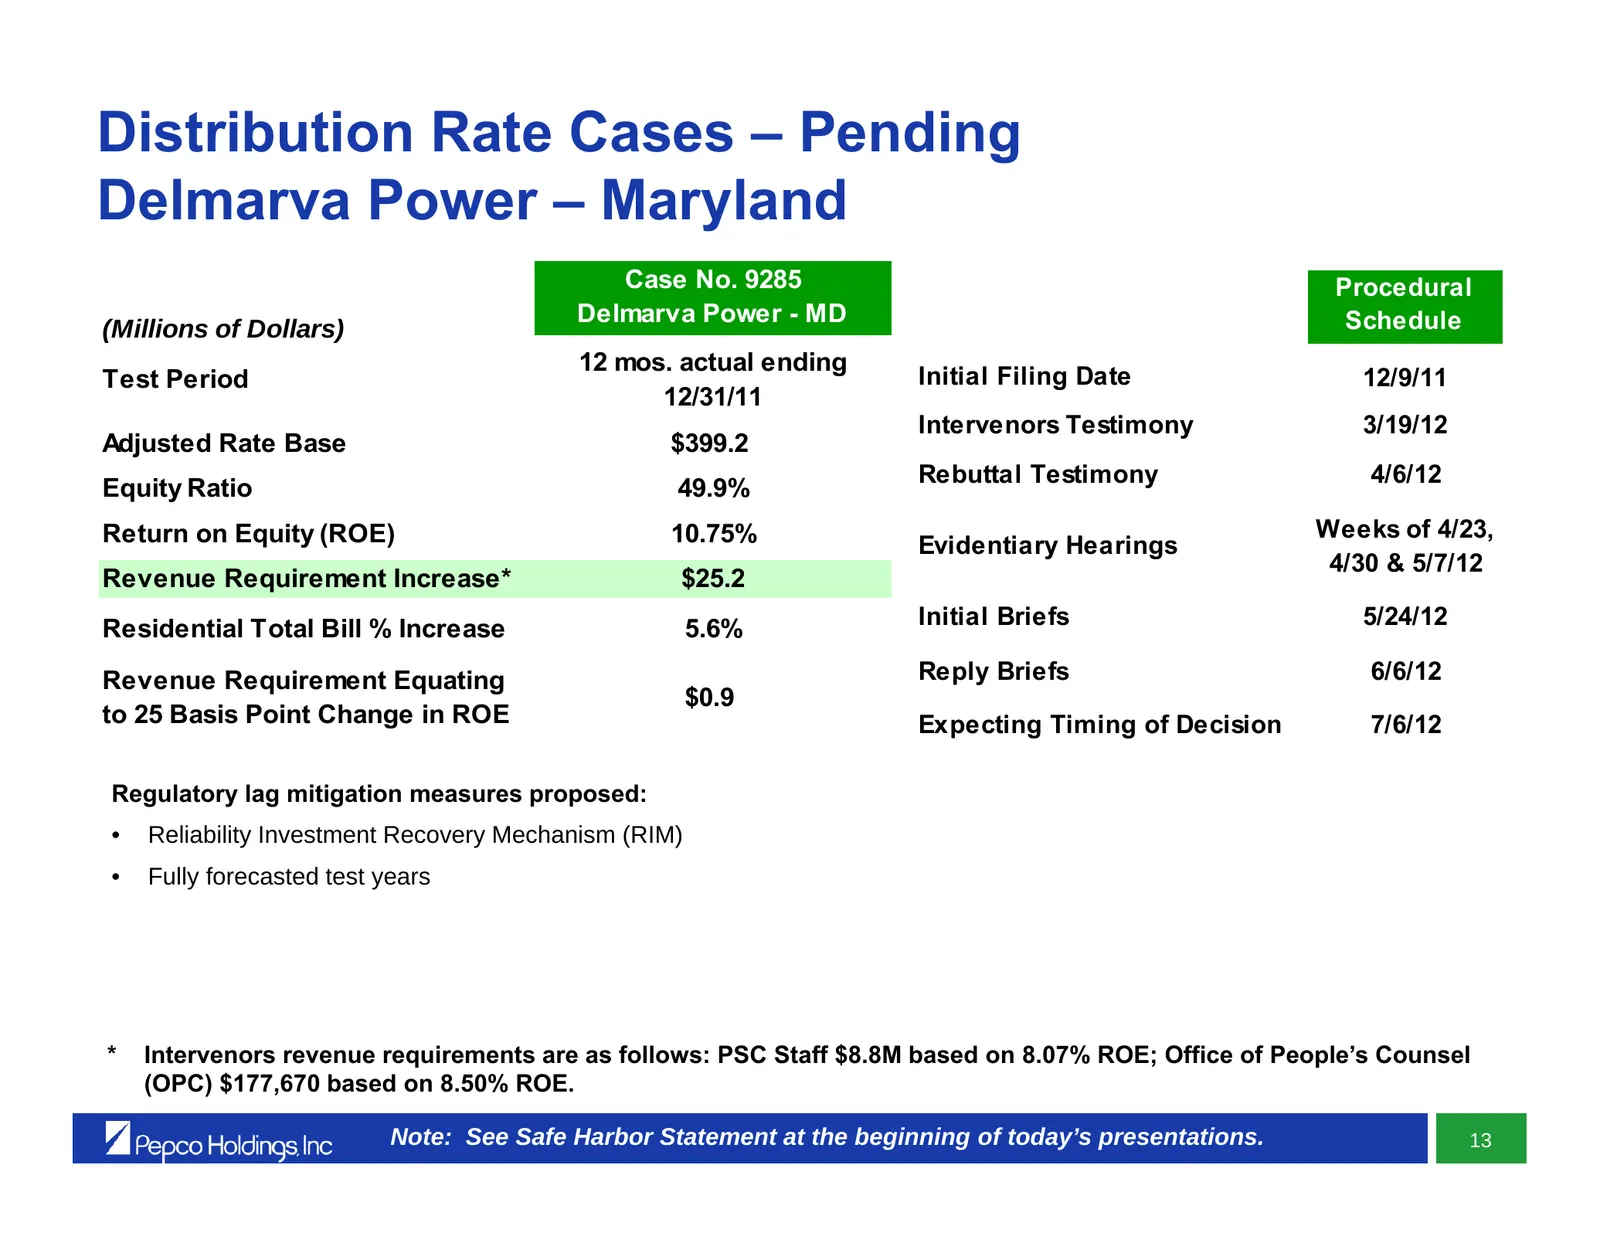
Distribution Rate Cases – Pending Delmarva Power – Maryland Case No. 9285 Procedural Delmarva Power - MD Schedule (Millions of Dollars) 12 mos. actual ending Test Period Initial Filing Date 12/9/11 12/31/11 Intervenors Testimony 3/19/12 Adjusted Rate Base $399.2 Rebuttal Testimony 4/6/12 Equity Rati
Slide 68: Distribution Rate Cases – Pending Pepco – Maryland
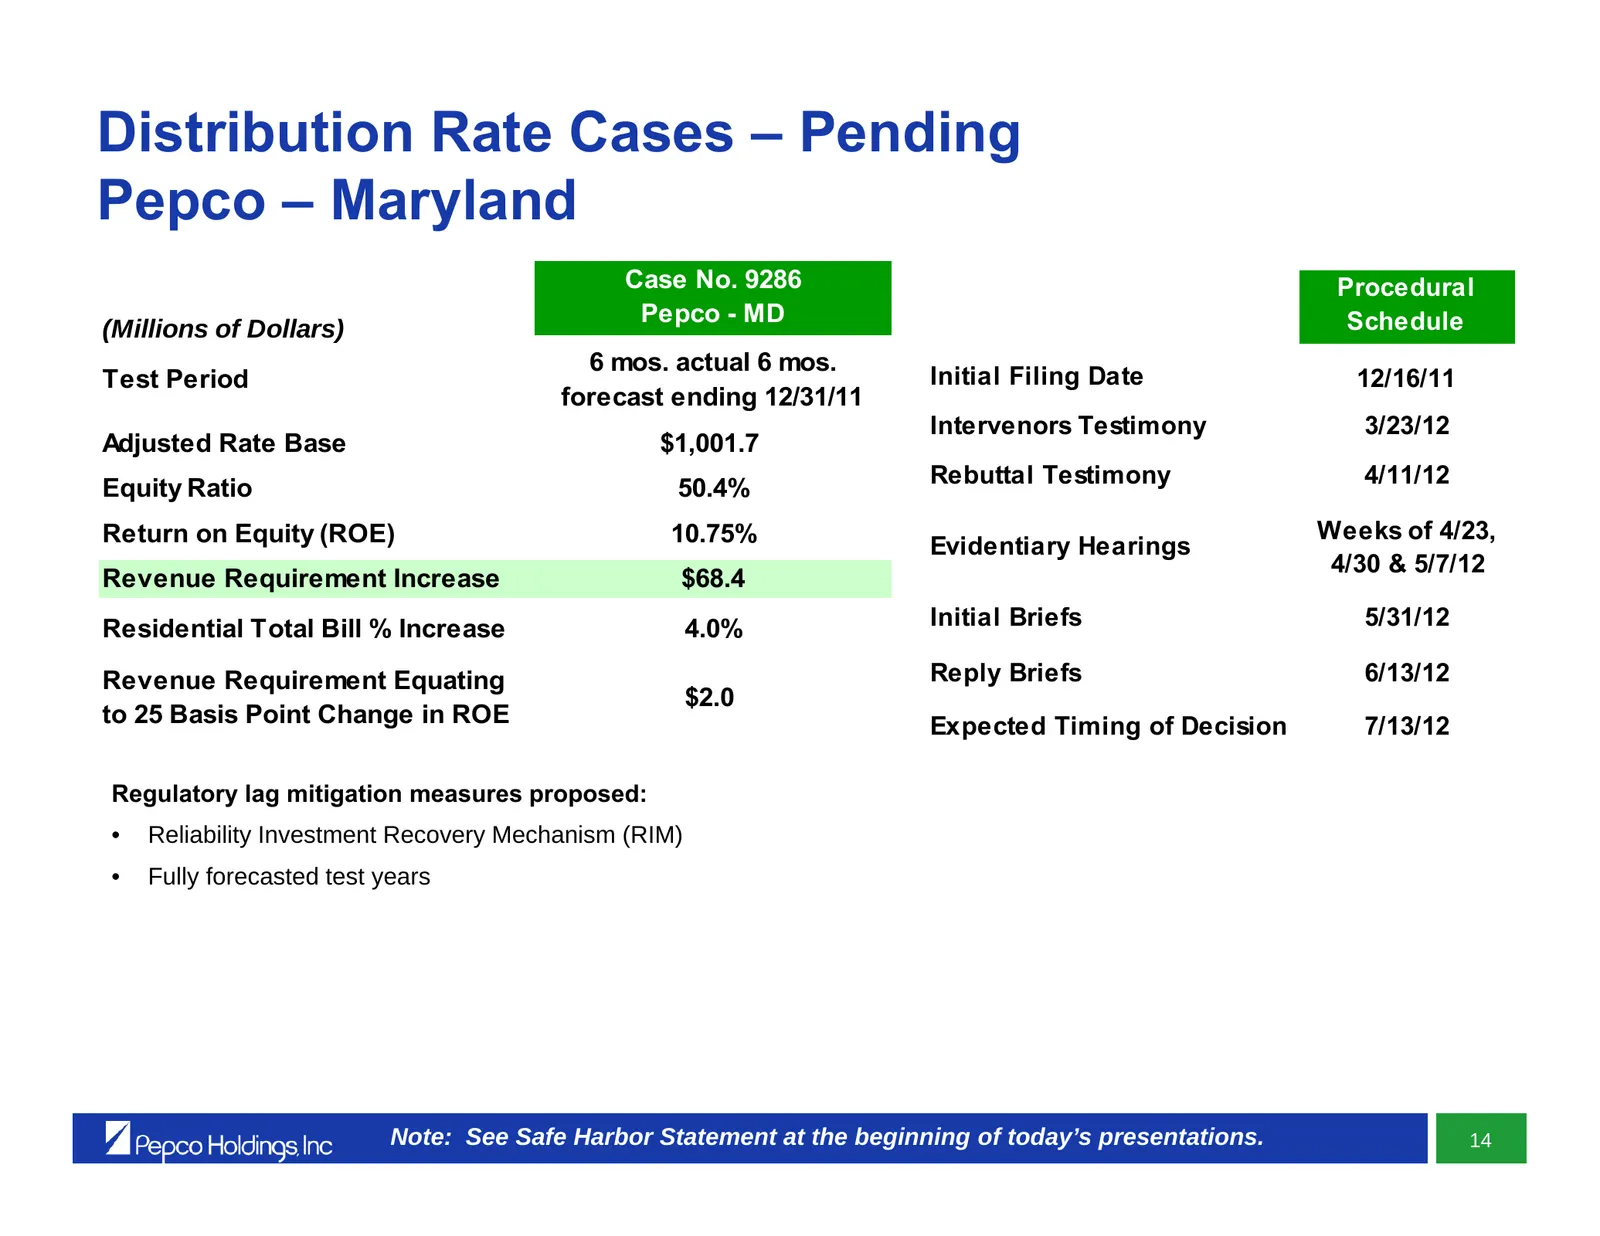
Distribution Rate Cases – Pending Pepco – Maryland Case No. 9286 Procedural Pepco - MD Schedule (Millions of Dollars) 6 mos. actual 6 mos. Test Period Initial Filing Date 12/16/11 forecast ending 12/31/11 Intervenors Testimony 3/23/12 Adjusted Rate Base $1,001.7 Rebuttal Testimony 4/11/12 Equity Rat
Slide 69: Transmission Formula Rate Process
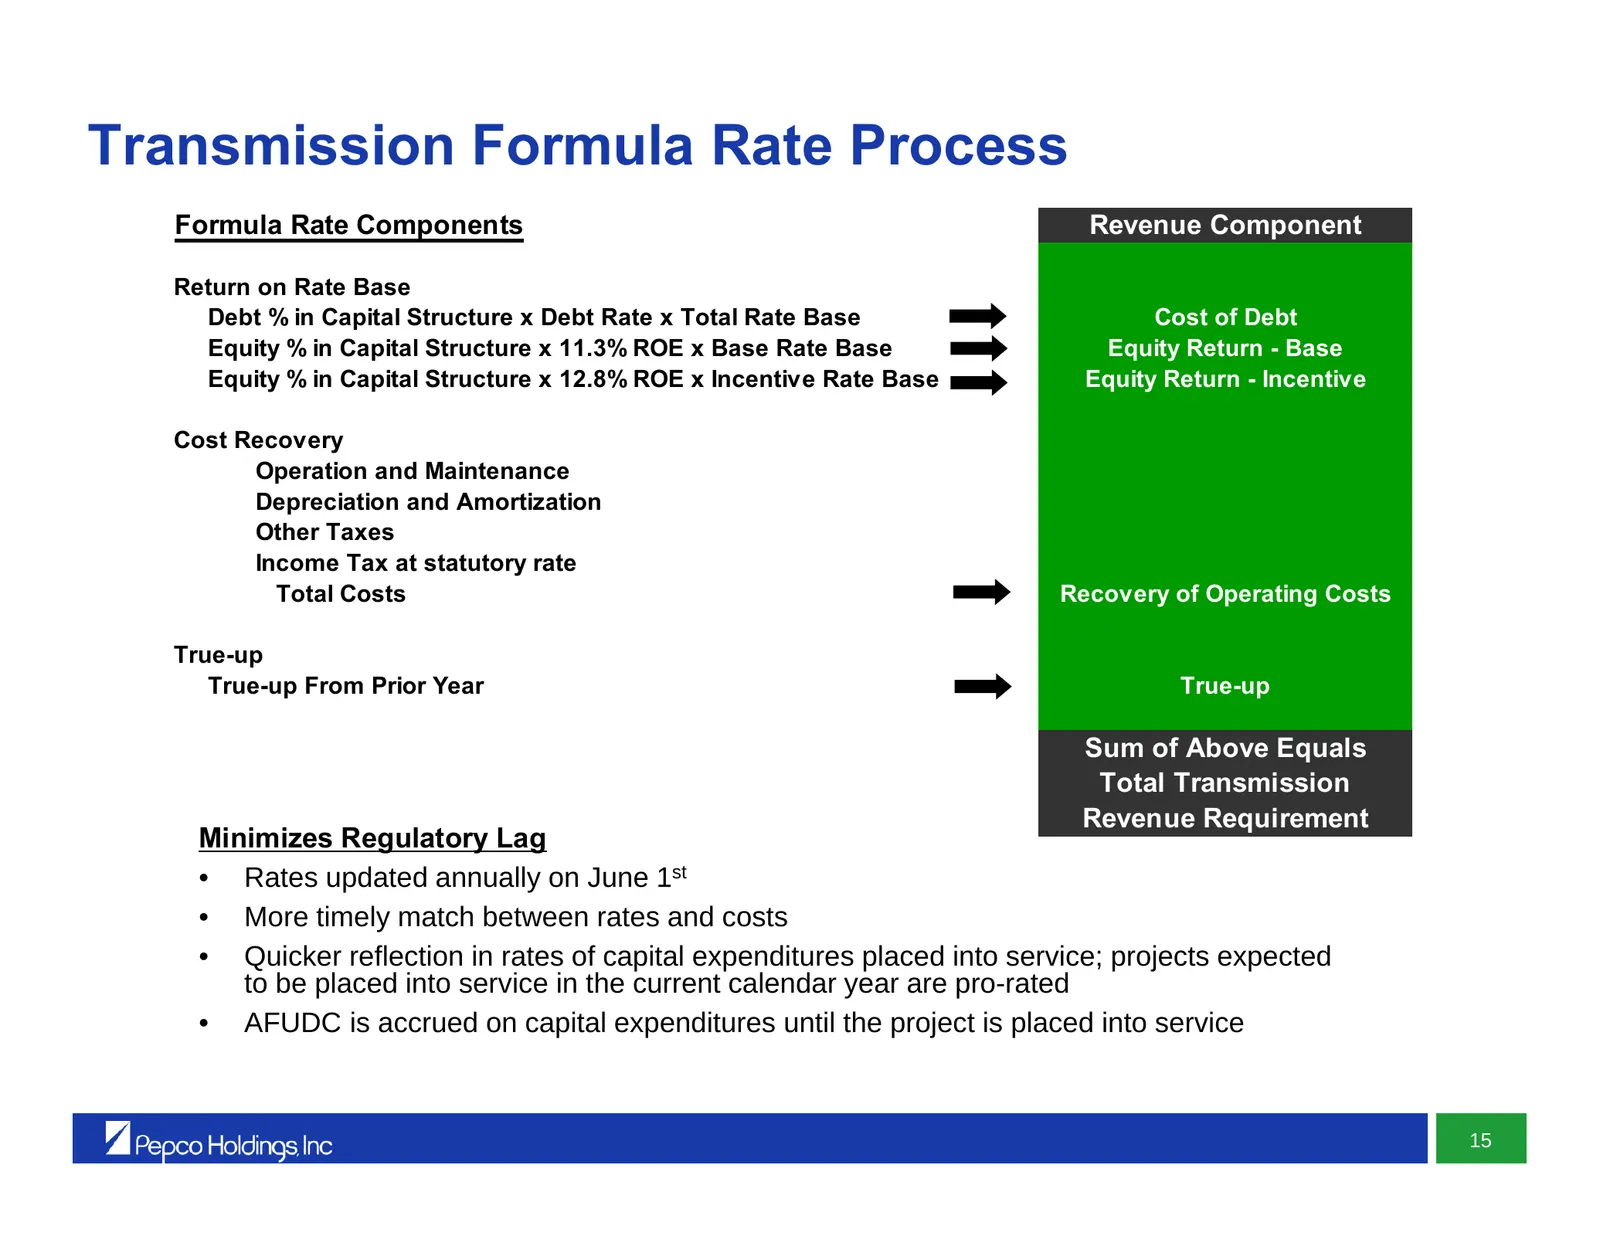
Transmission Formula Rate Process Formula Rate Components Revenue Component Return on Rate Base Debt % in Capital Structure x Debt Rate x Total Rate Base Cost of Debt Equity % in Capital Structure x 11.3% ROE x Base Rate Base Equity Return - Base Equity % in Capital Structure x 12.8% ROE x Incentive
Slide 70: FERC-Regulated Transmission Business
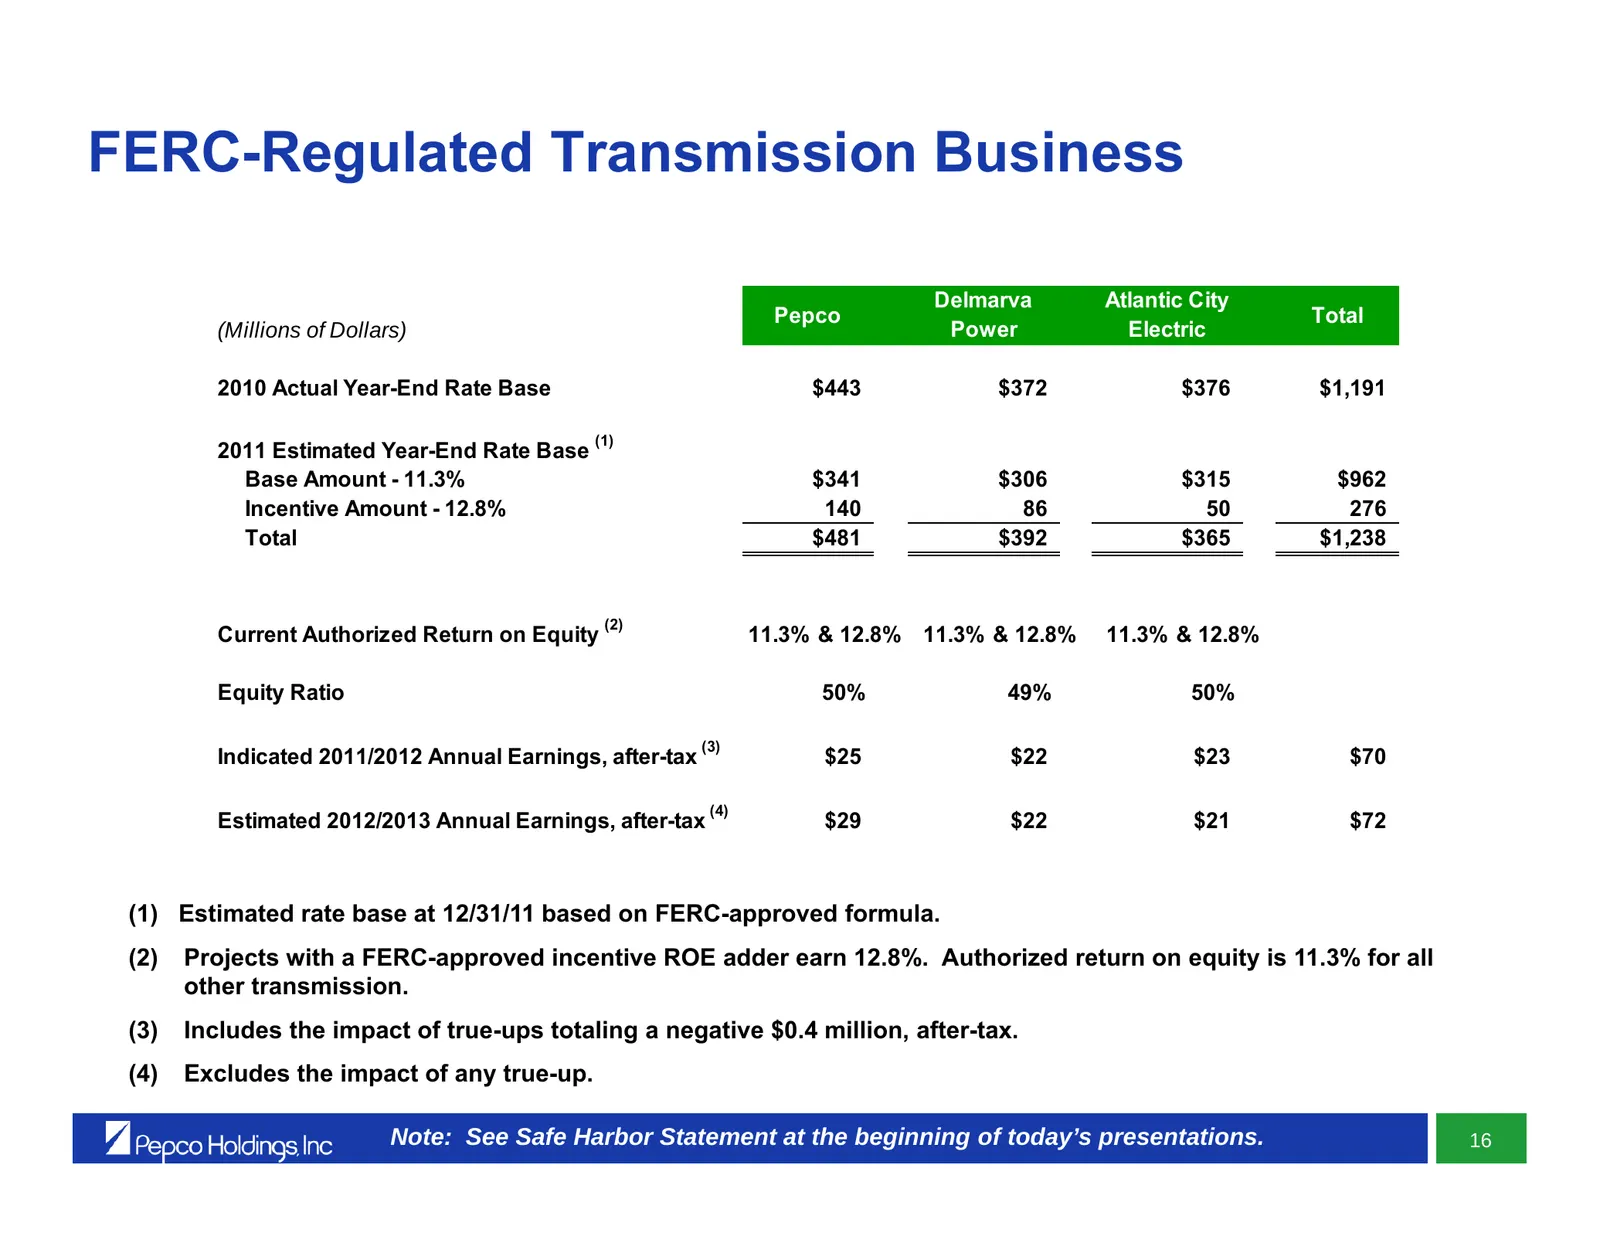
FERC-Regulated Transmission Business Delmarva Atlantic City Pepco Total (Millions of Dollars) Power Electric 2010 Actual Year-End Rate Base $443 $372 $376 $1,191 (1) 2011 Estimated Year-End Rate Base Base Amount - 11.3% $341 $306 $315 $962 Incentive Amount - 12.8% 140 86 50 276 Total $481 $392 $365
Slide 71: Decoupling Status
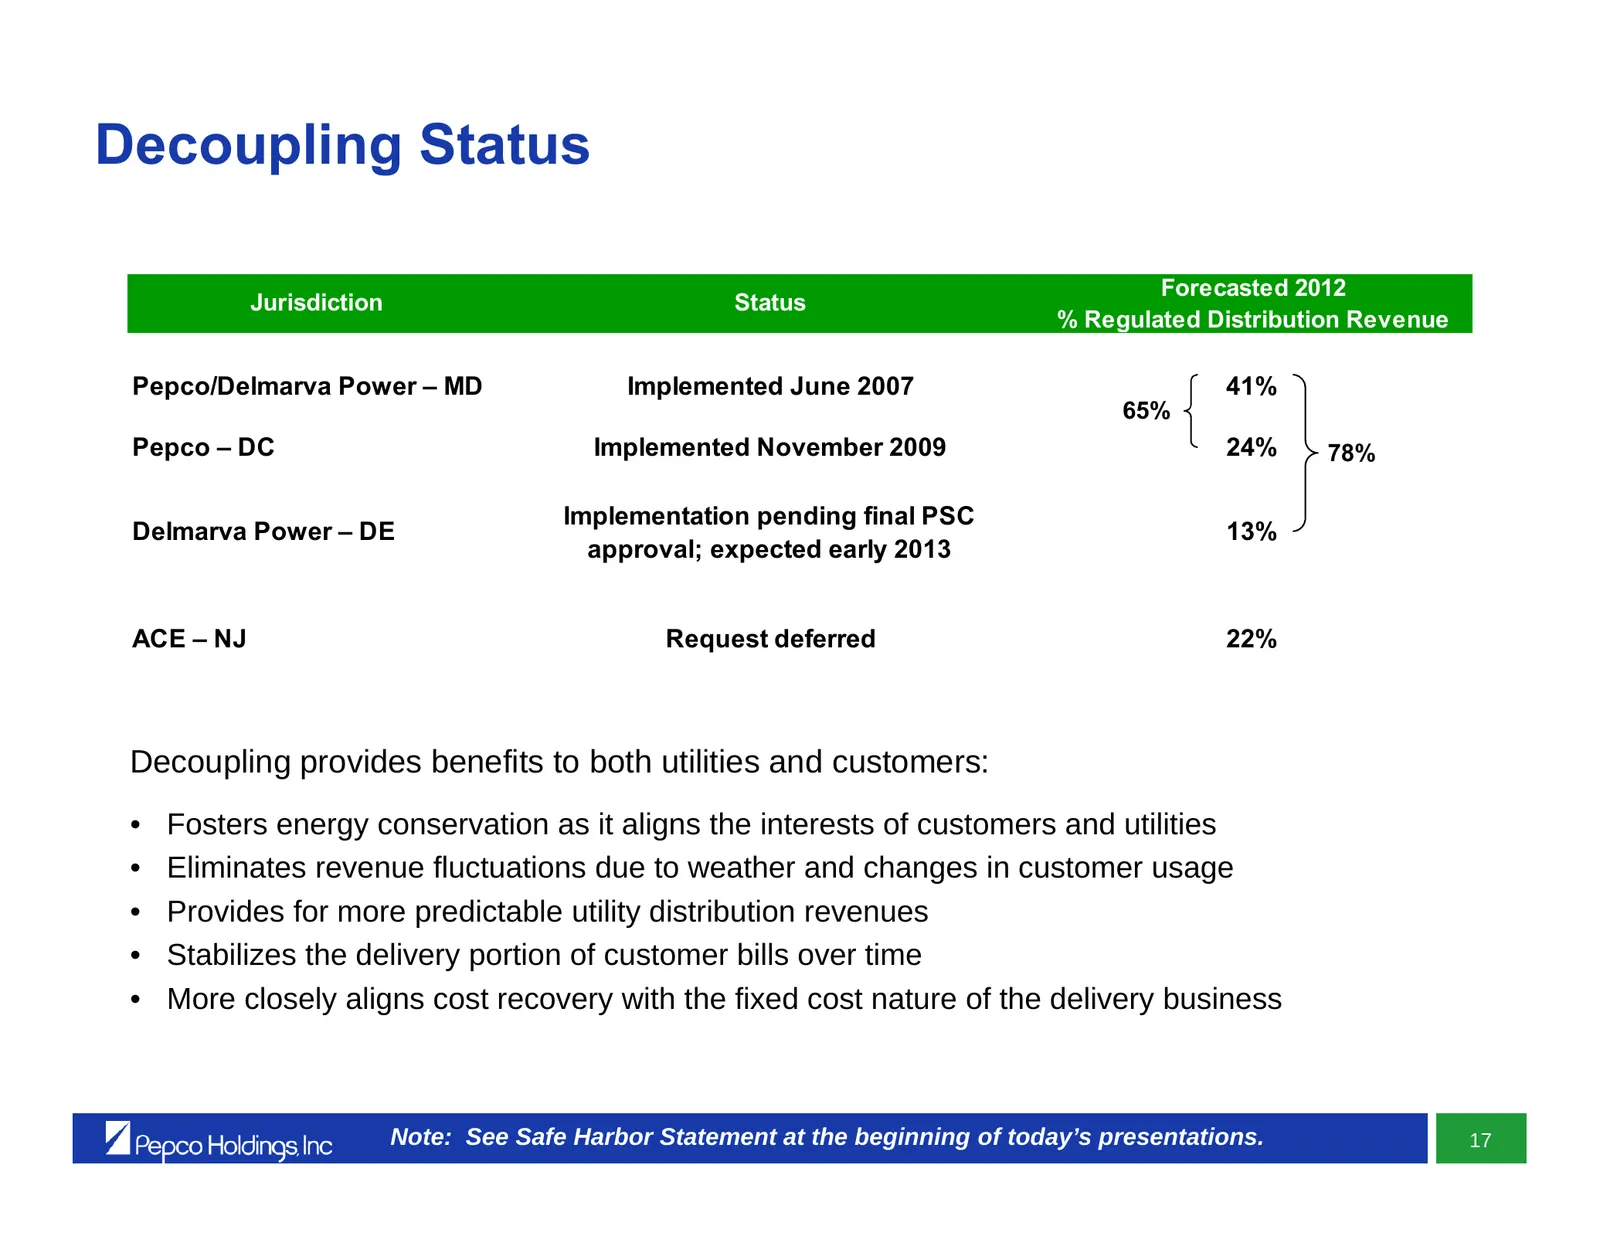
Decoupling Status Forecasted 2012 Jurisdiction Status % Regulated Distribution Revenue Pepco/Delmarva Power – MD Implemented June 2007 41% 65% Pepco – DC Implemented November 2009 24% 78% Implementation pending final PSC Delmarva Power – DE 13% approval; expected early 2013 ACE – NJ Request deferred
Slide 72: Methods of Cost Recovery Outside of Base Rate Case Process
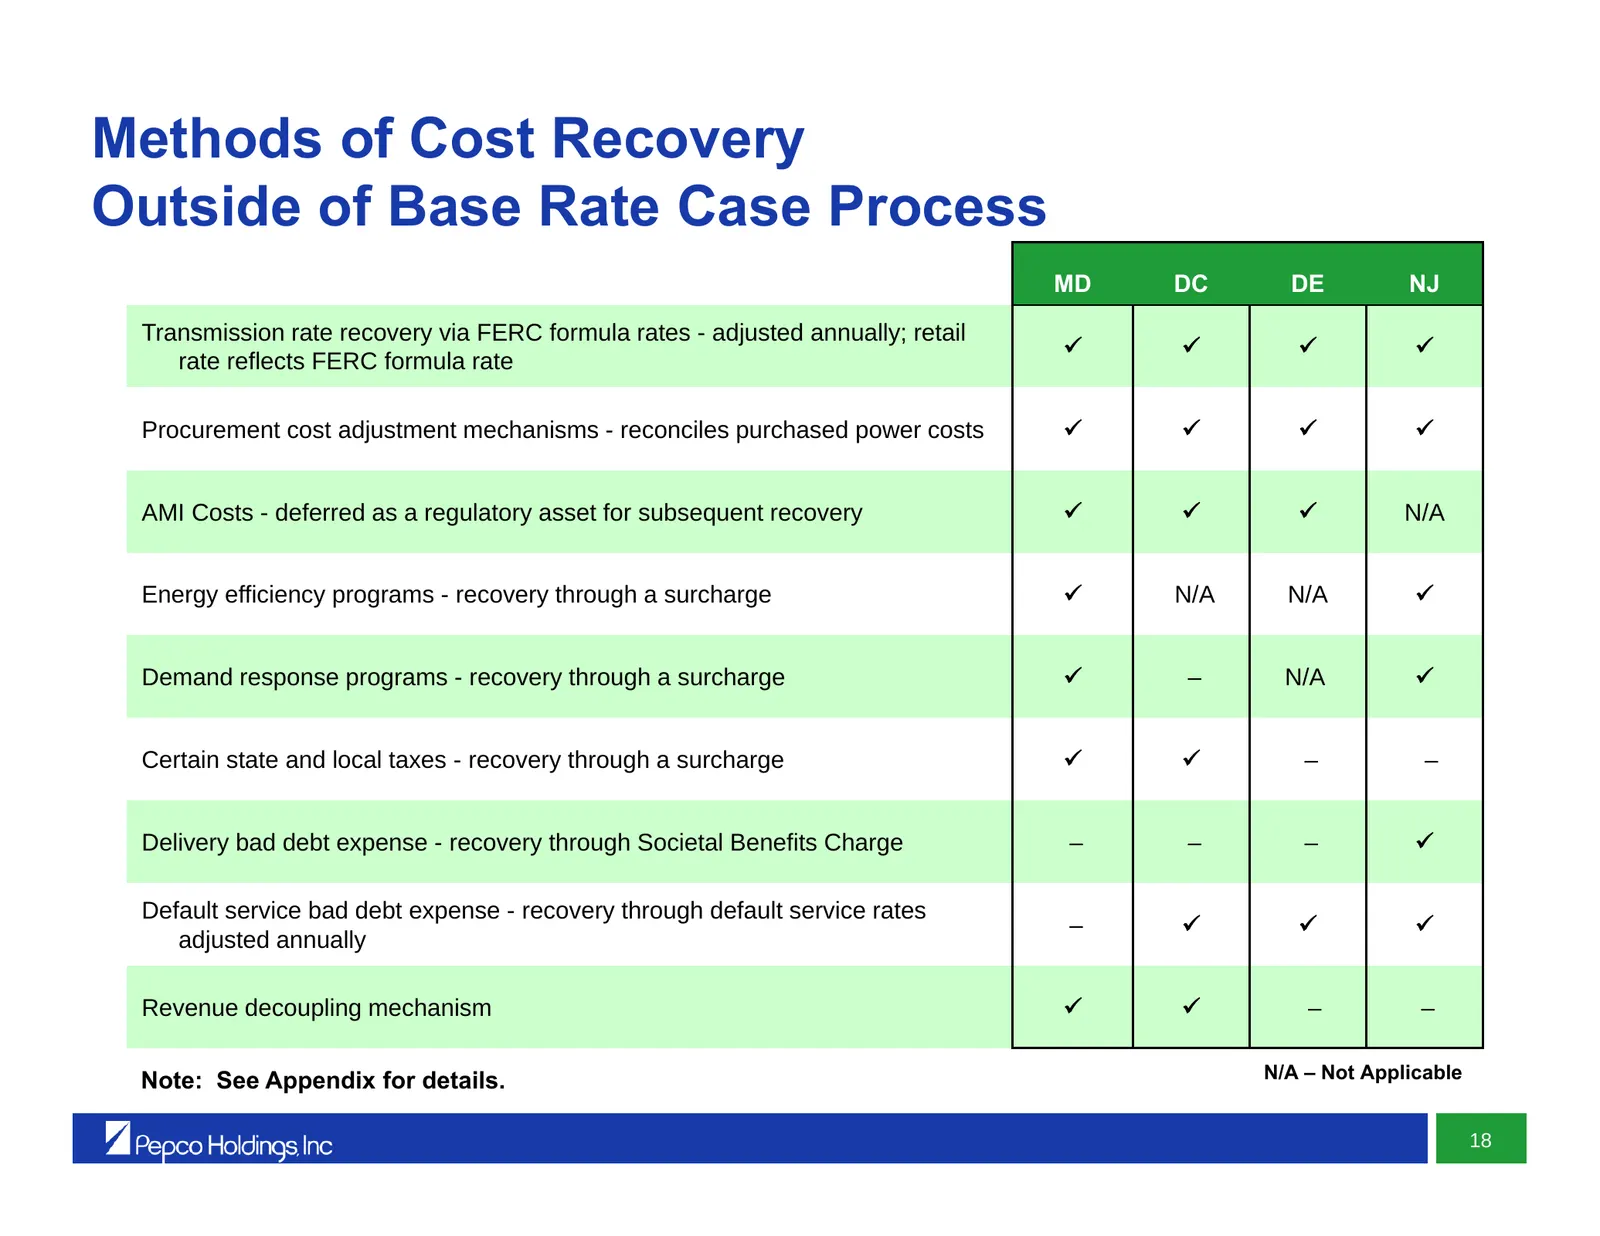
Methods of Cost Recovery Outside of Base Rate Case Process MD DC DE NJ Transmission rate recovery via FERC formula rates - adjusted annually; retail rate reflects FERC formula rate Procurement cost adjustment mechanisms - reconciles purchased power costs AMI Costs - deferred as a reg
Slide 73: Regulatory Summary
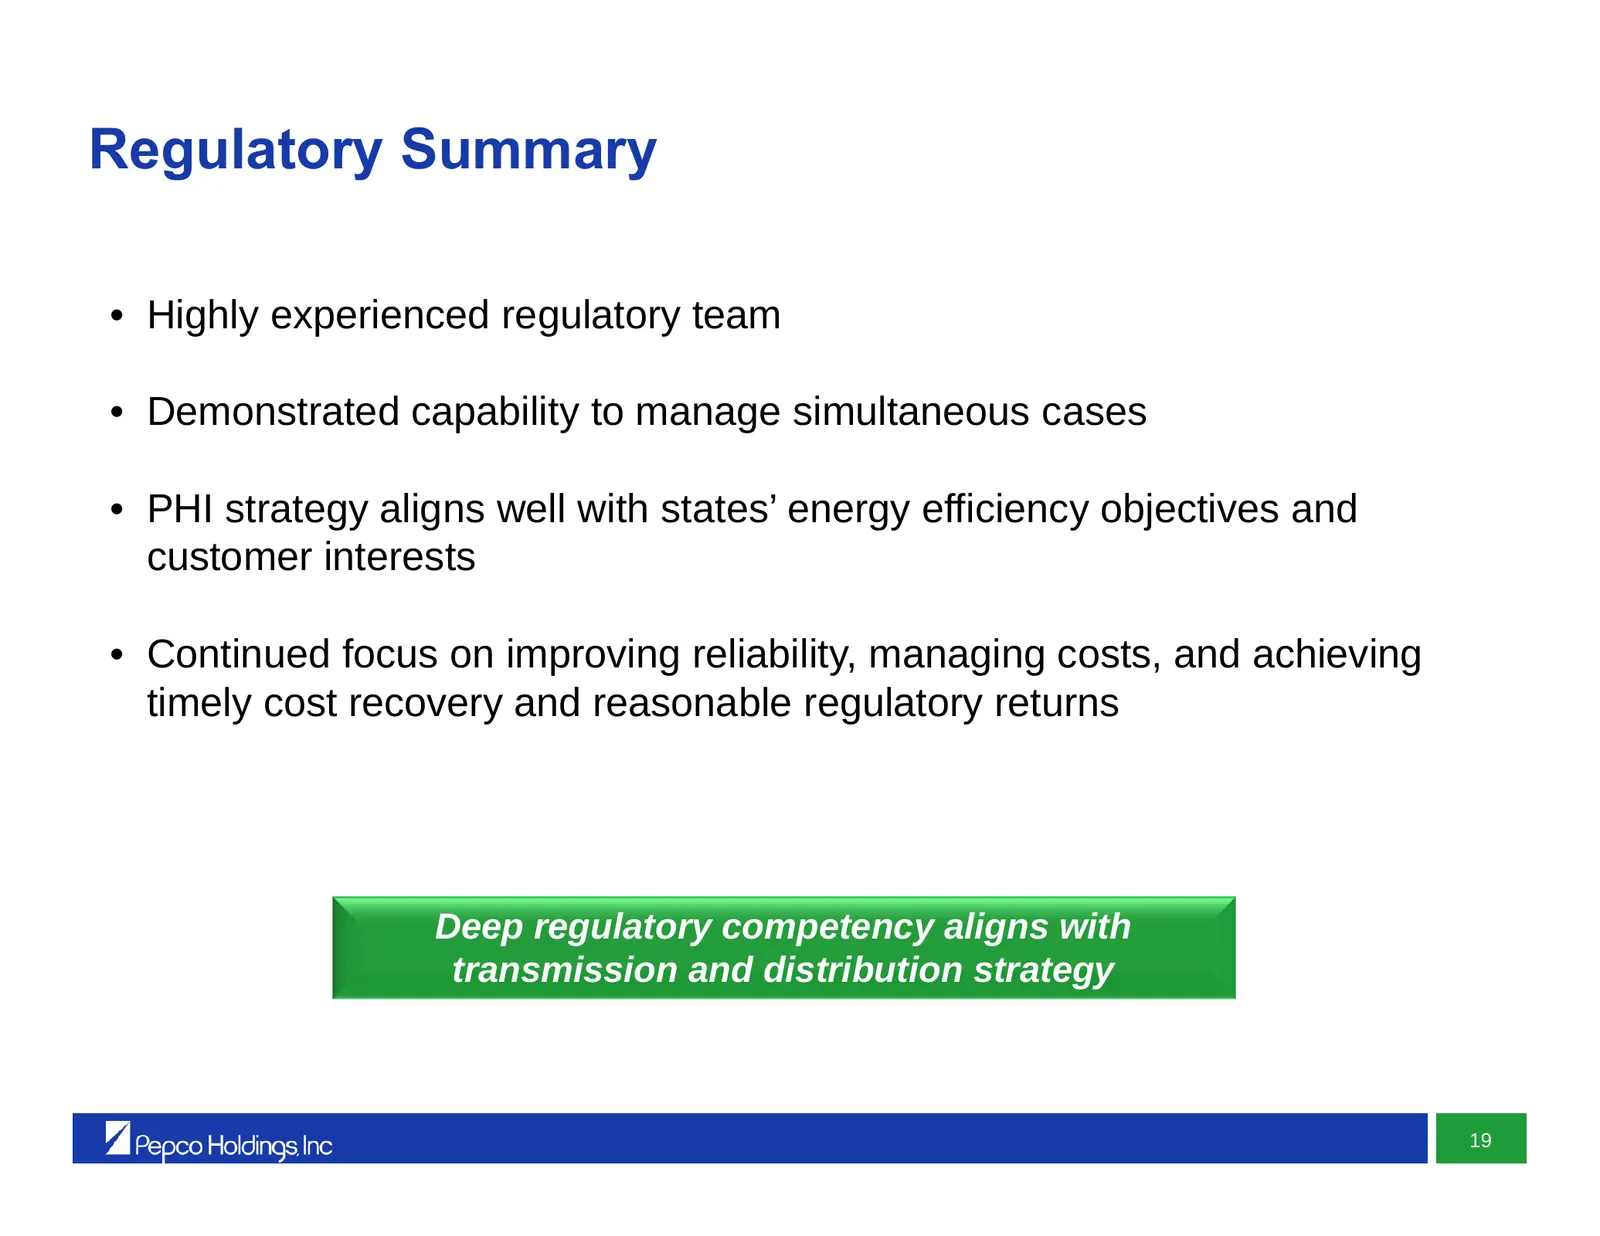
Regulatory Summary • Highly experienced regulatory team • Demonstrated capability to manage simultaneous cases • PHI strategy aligns well with states’ energy efficiency objectives and customer interests • Continued focus on improving reliability, managing costs, and achieving timely cost recovery an
Slide 74: Regulatory Overview
Regulatory Overview Tony Kamerick Senior Vice President & Chief Financial Officer
Slide 75: Appendix
Appendix y | Pepco Holdings Inc L |
Slide 76: Distribution Base Rate Case Outcomes
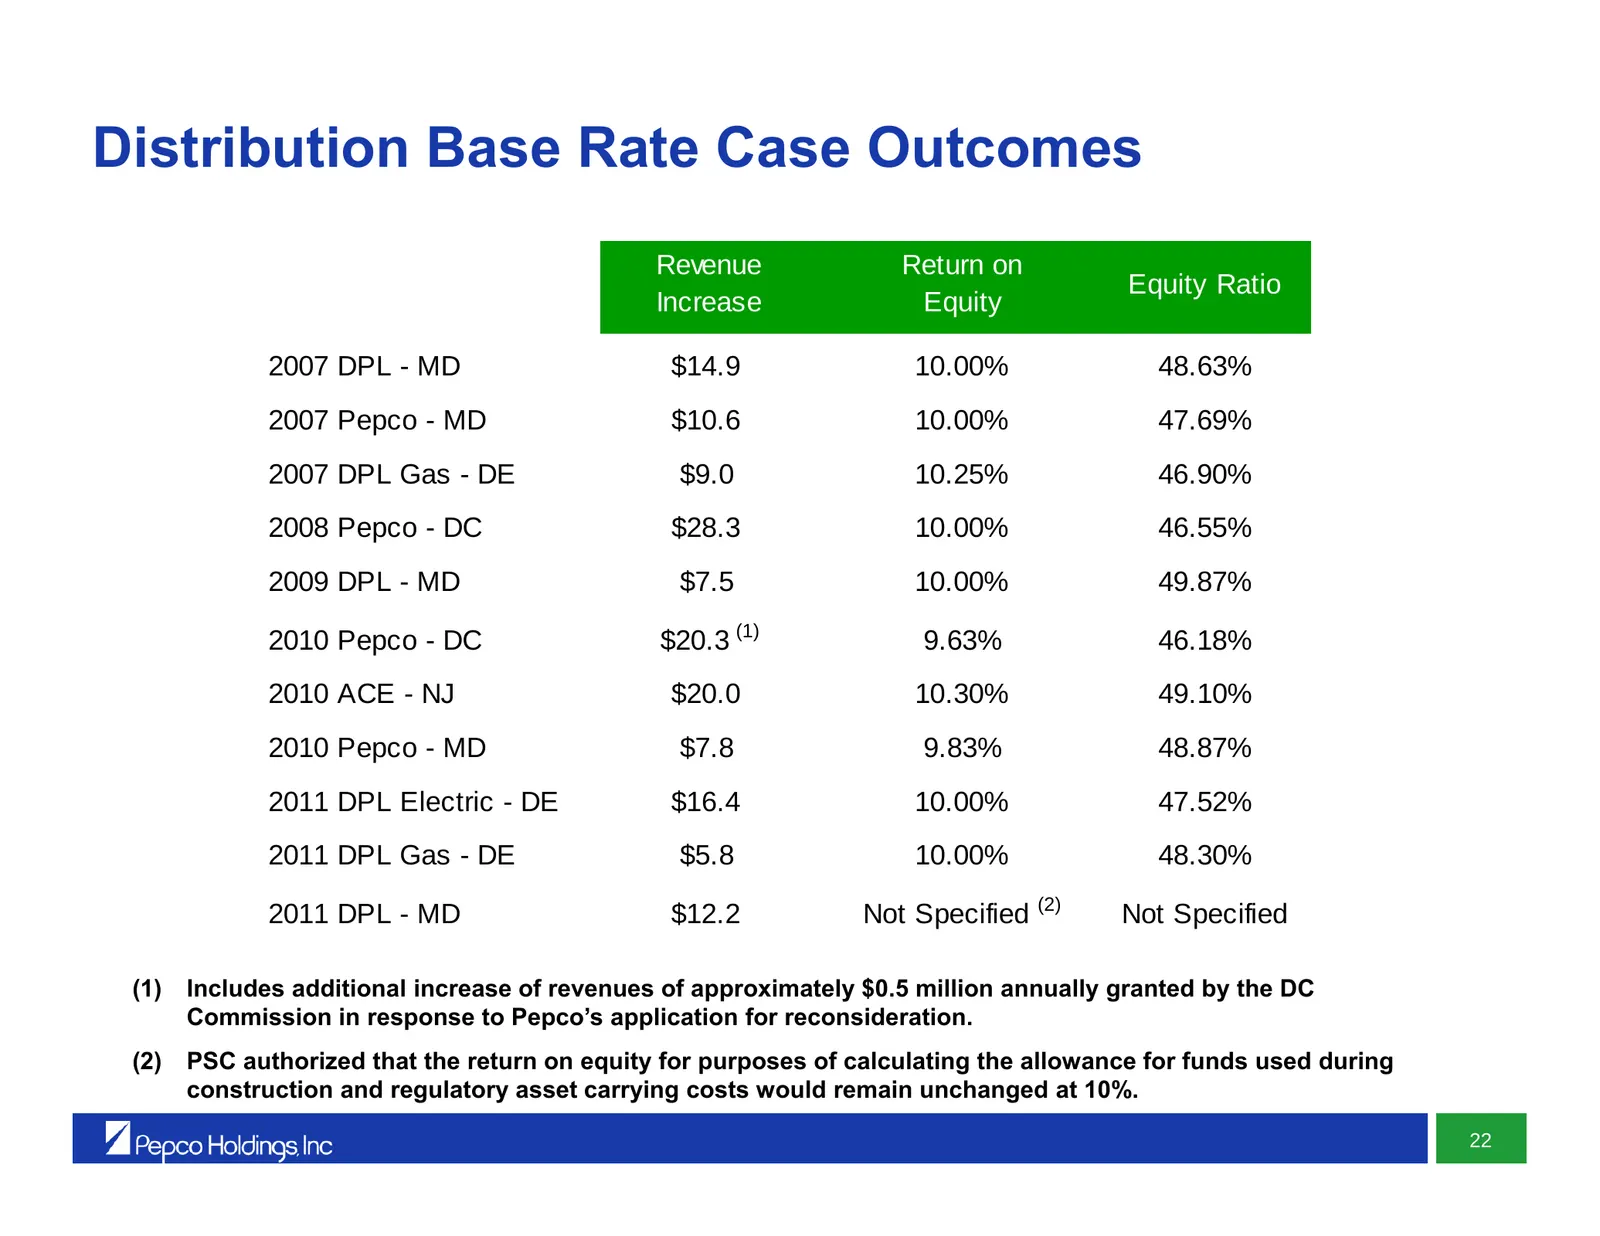
Distribution Base Rate Case Outcomes Revenue Return on Equity Ratio Increase Equity 2007 DPL - MD $14.9 10.00% 48.63% 2007 Pepco - MD $10.6 10.00% 47.69% 2007 DPL Gas - DE $9.0 10.25% 46.90% 2008 Pepco - DC $28.3 10.00% 46.55% 2009 DPL - MD $7.5 10.00% 49.87% 2010 Pepco - DC $20.3 (1) 9.63% 46.18% 2
Slide 77: Default Service Auction/Bidding Process
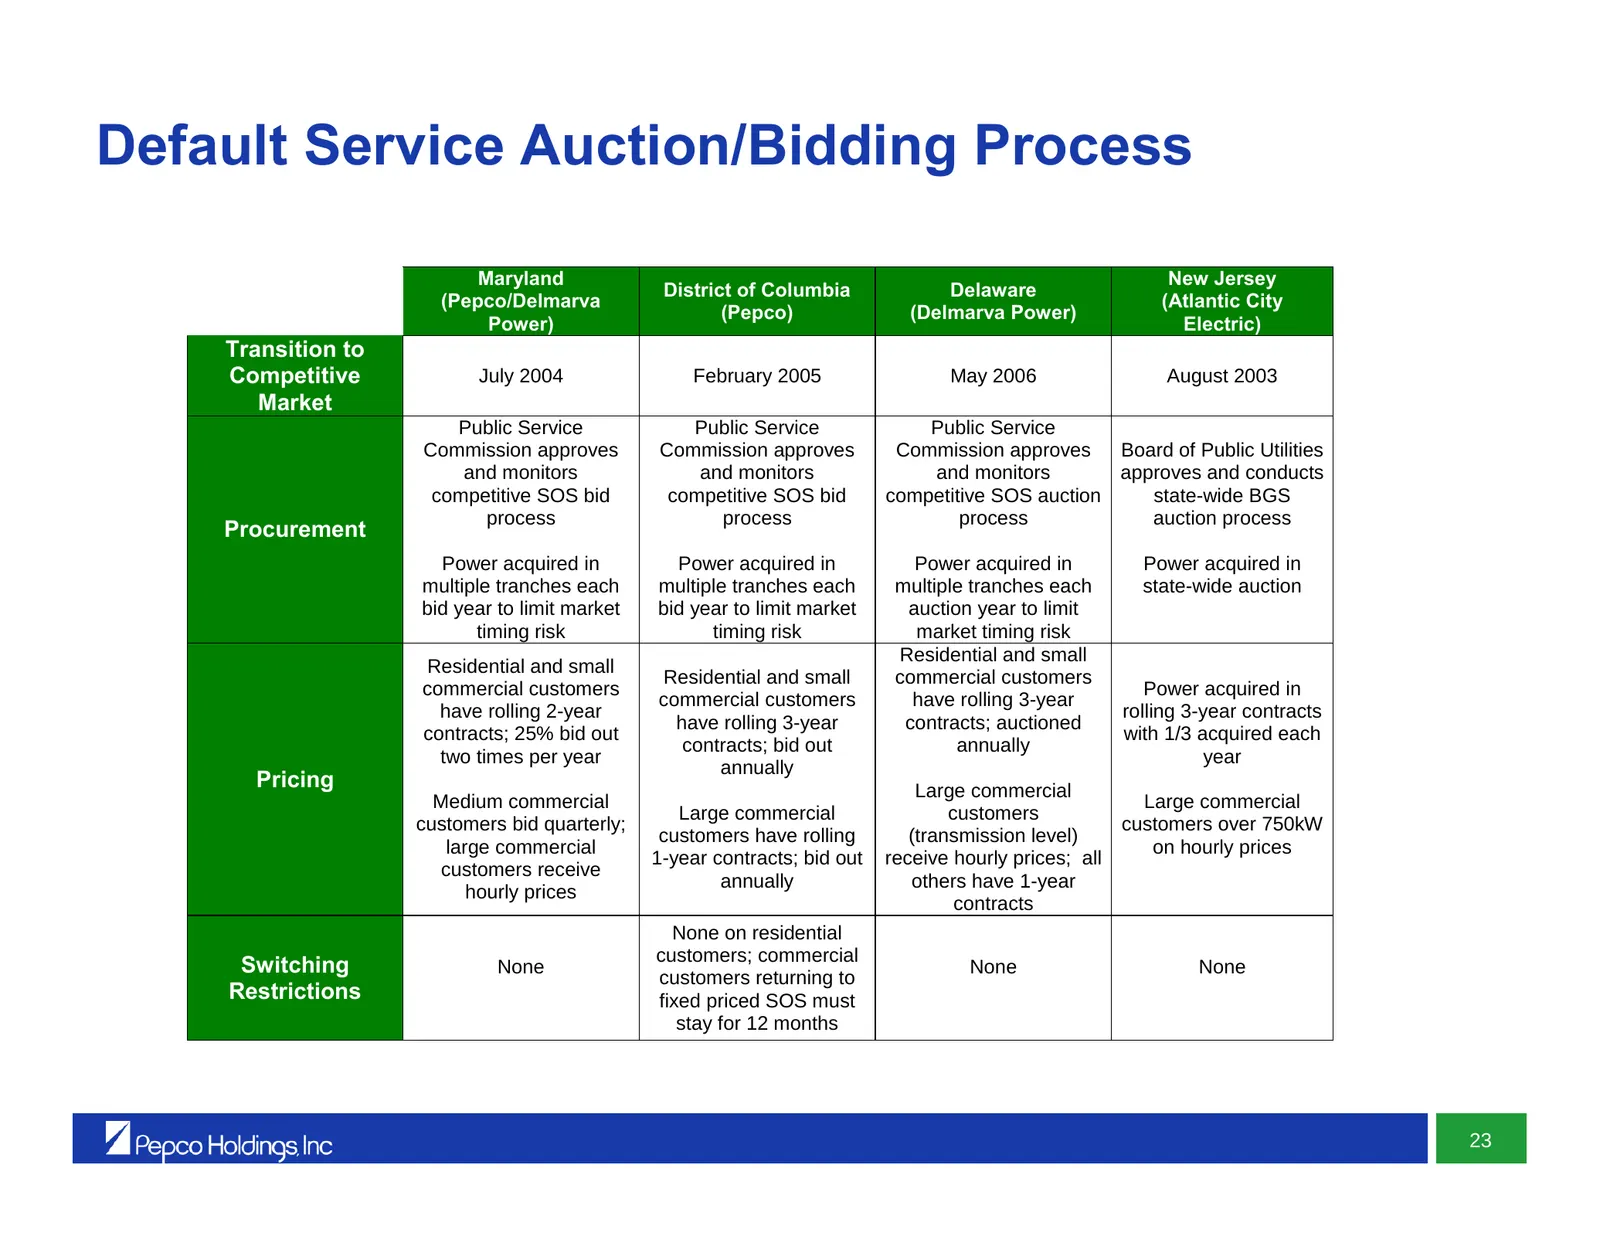
Default Service Auction/Bidding Process Maryland New Jersey District of Columbia Delaware (Pepco/Delmarva (Atlantic City (Pepco) (Delmarva Power) Power) Electric) Transition to Competitive July 2004 February 2005 May 2006 August 2003 Market Public Service Public Service Public Service Commission app
Slide 78: Default Service Procurement – Auction Schedules for Load Bid 2012/13
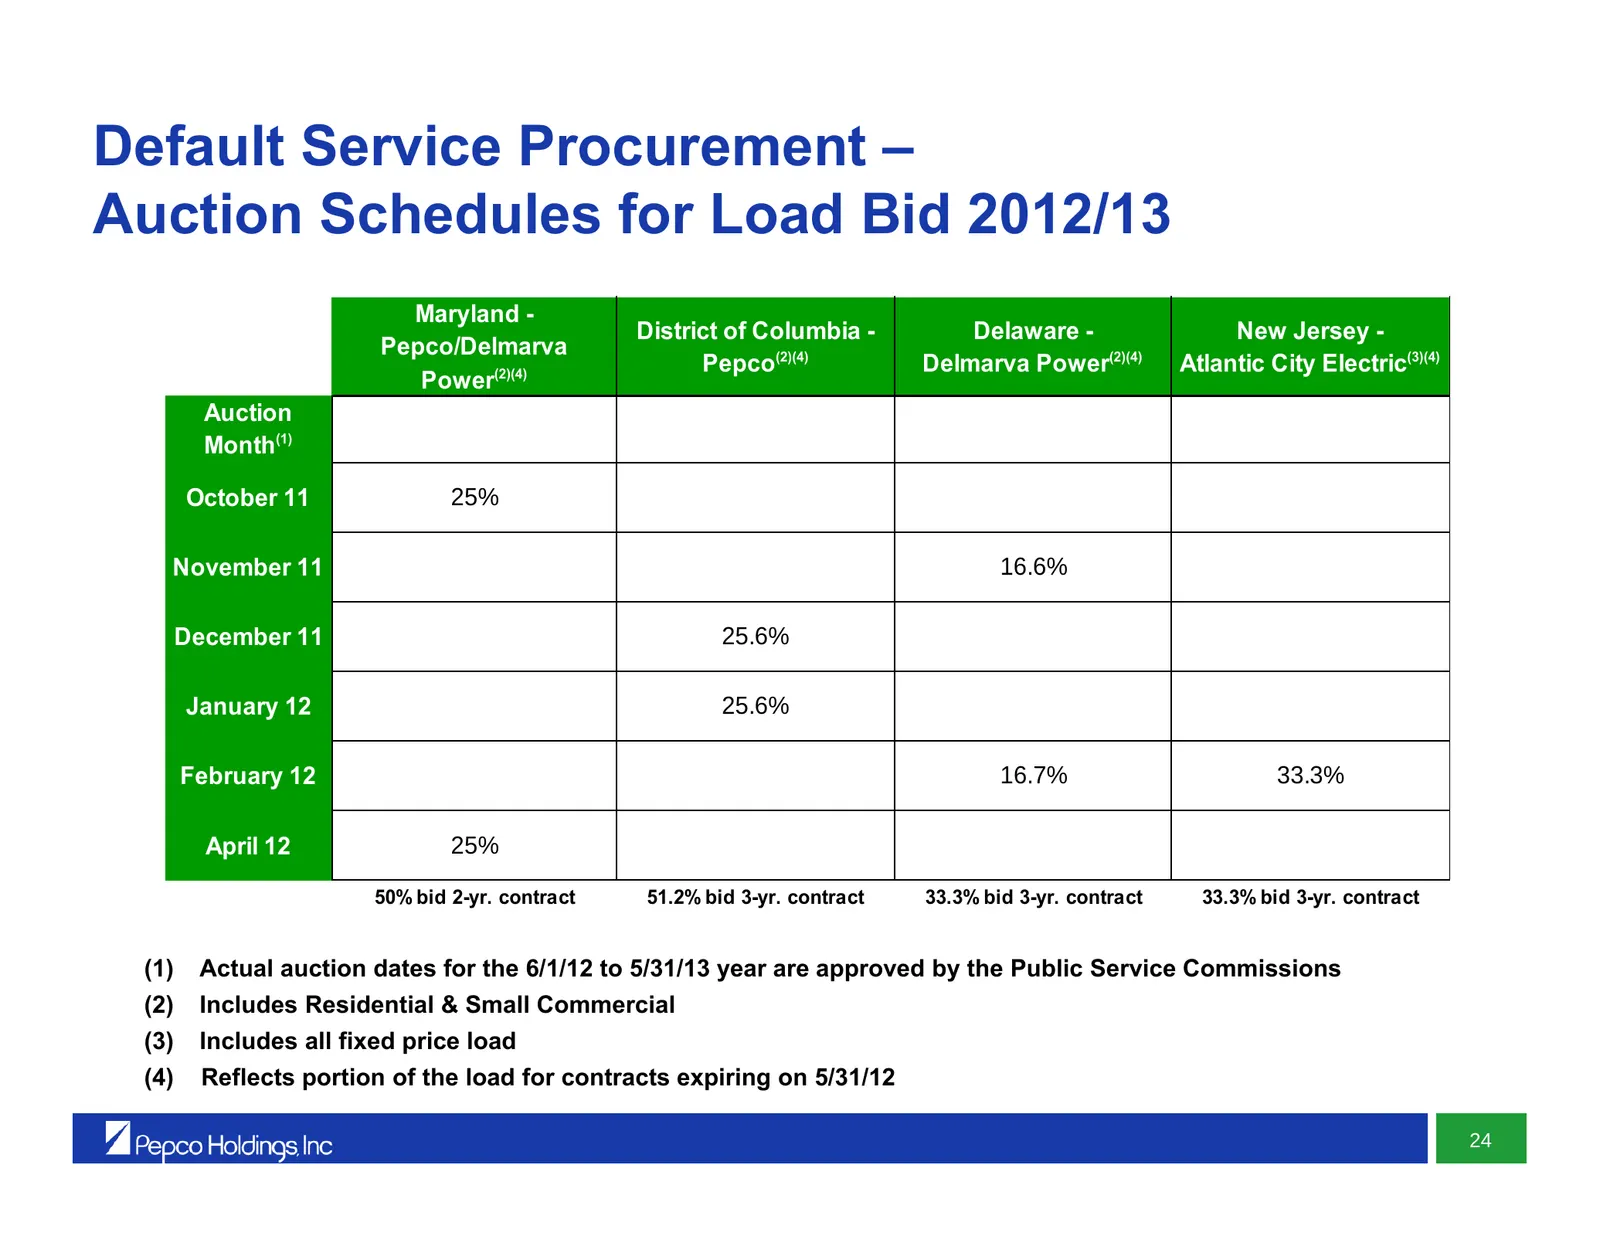
Default Service Procurement – Auction Schedules for Load Bid 2012/13 Maryland - District of Columbia - Delaware - New Jersey - Pepco/Delmarva Pepco(2)(4) Delmarva Power(2)(4) Atlantic City Electric(3)(4) Power(2)(4) Auction Month(1) October 11 25% November 11 16.6% December 11 25.6% January 12 25.6%
Slide 79: Methods of Cost Recovery – Maryland
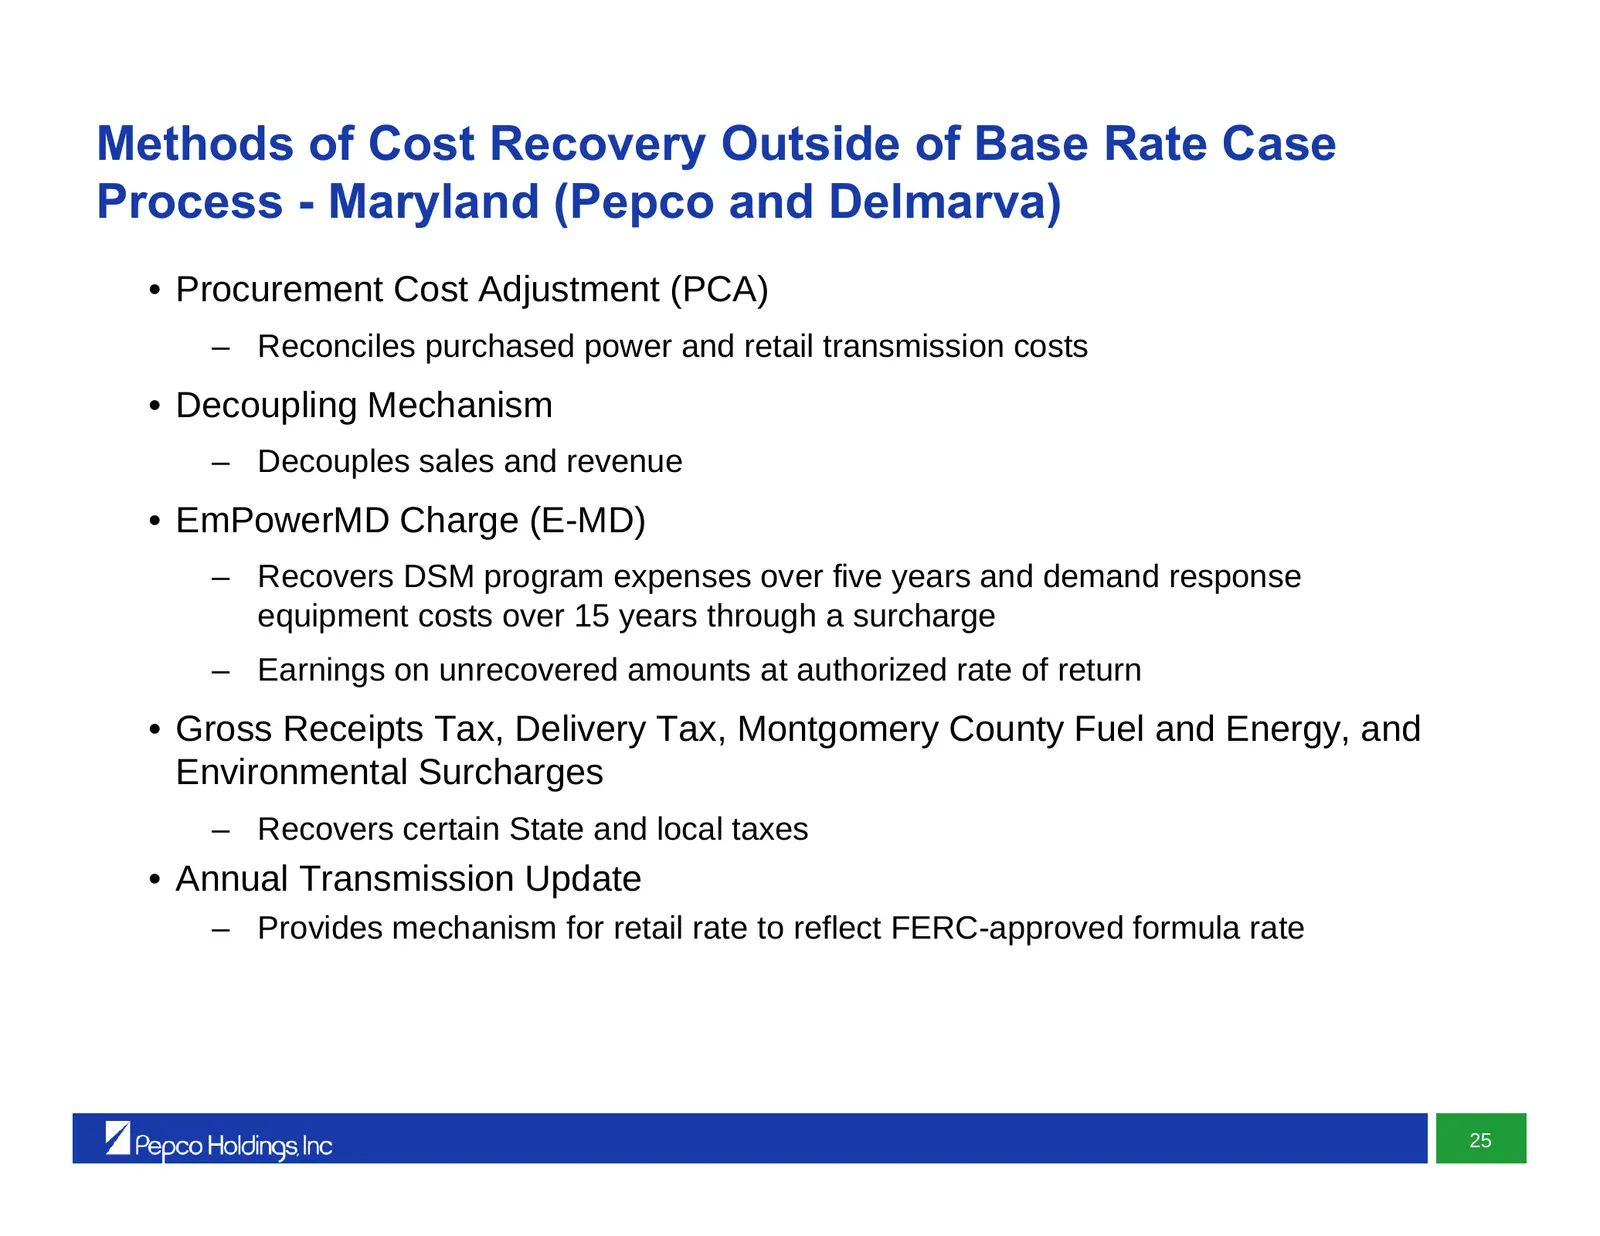
Methods of Cost Recovery Outside of Base Rate Case Process - Maryland (Pepco and Delmarva) • Procurement Cost Adjustment (PCA) – Reconciles purchased power and retail transmission costs • Decoupling Mechanism – Decouples sales and revenue • EmPowerMD Charge (E-MD) – Recovers DSM program expenses ove
Slide 80: Methods of Cost Recovery – District of Columbia
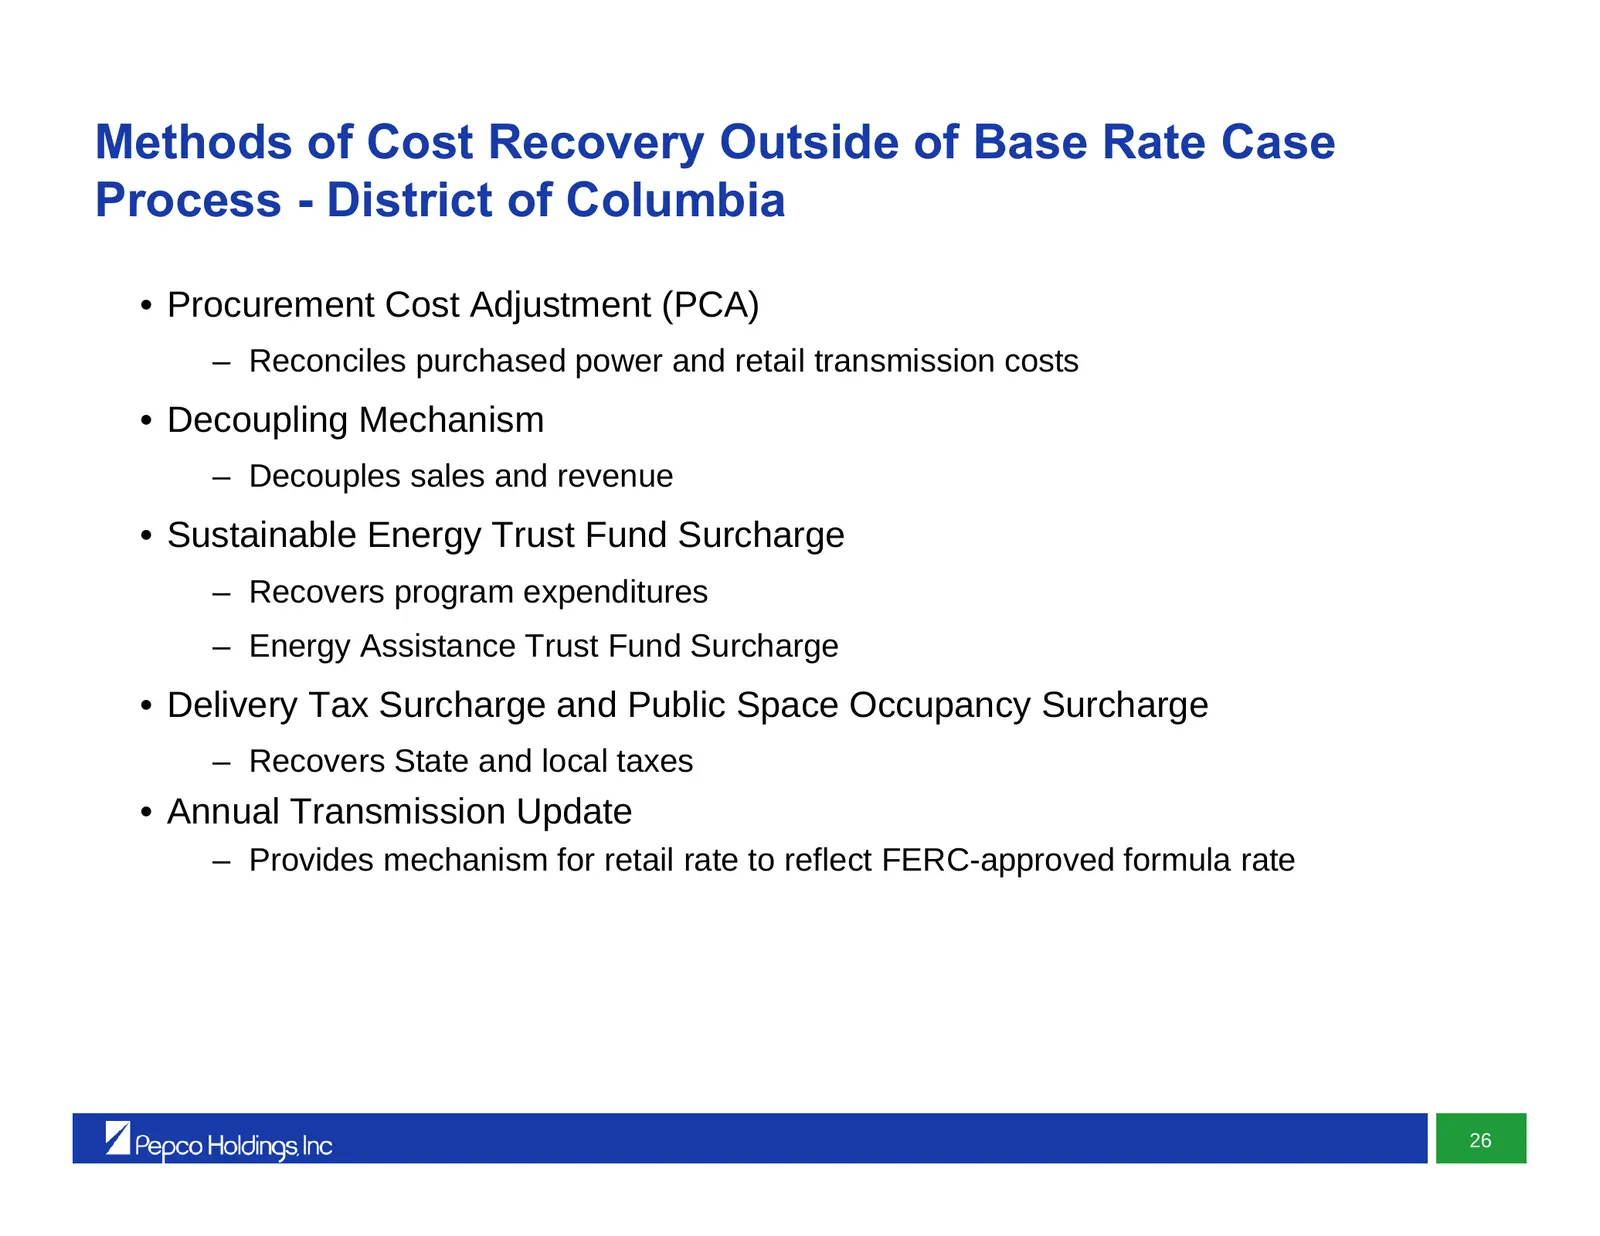
Methods of Cost Recovery Outside of Base Rate Case Process - District of Columbia • Procurement Cost Adjustment (PCA) – Reconciles purchased power and retail transmission costs • Decoupling Mechanism – Decouples sales and revenue • Sustainable Energy Trust Fund Surcharge – Recovers program expenditu
Slide 81: Methods of Cost Recovery – Delaware
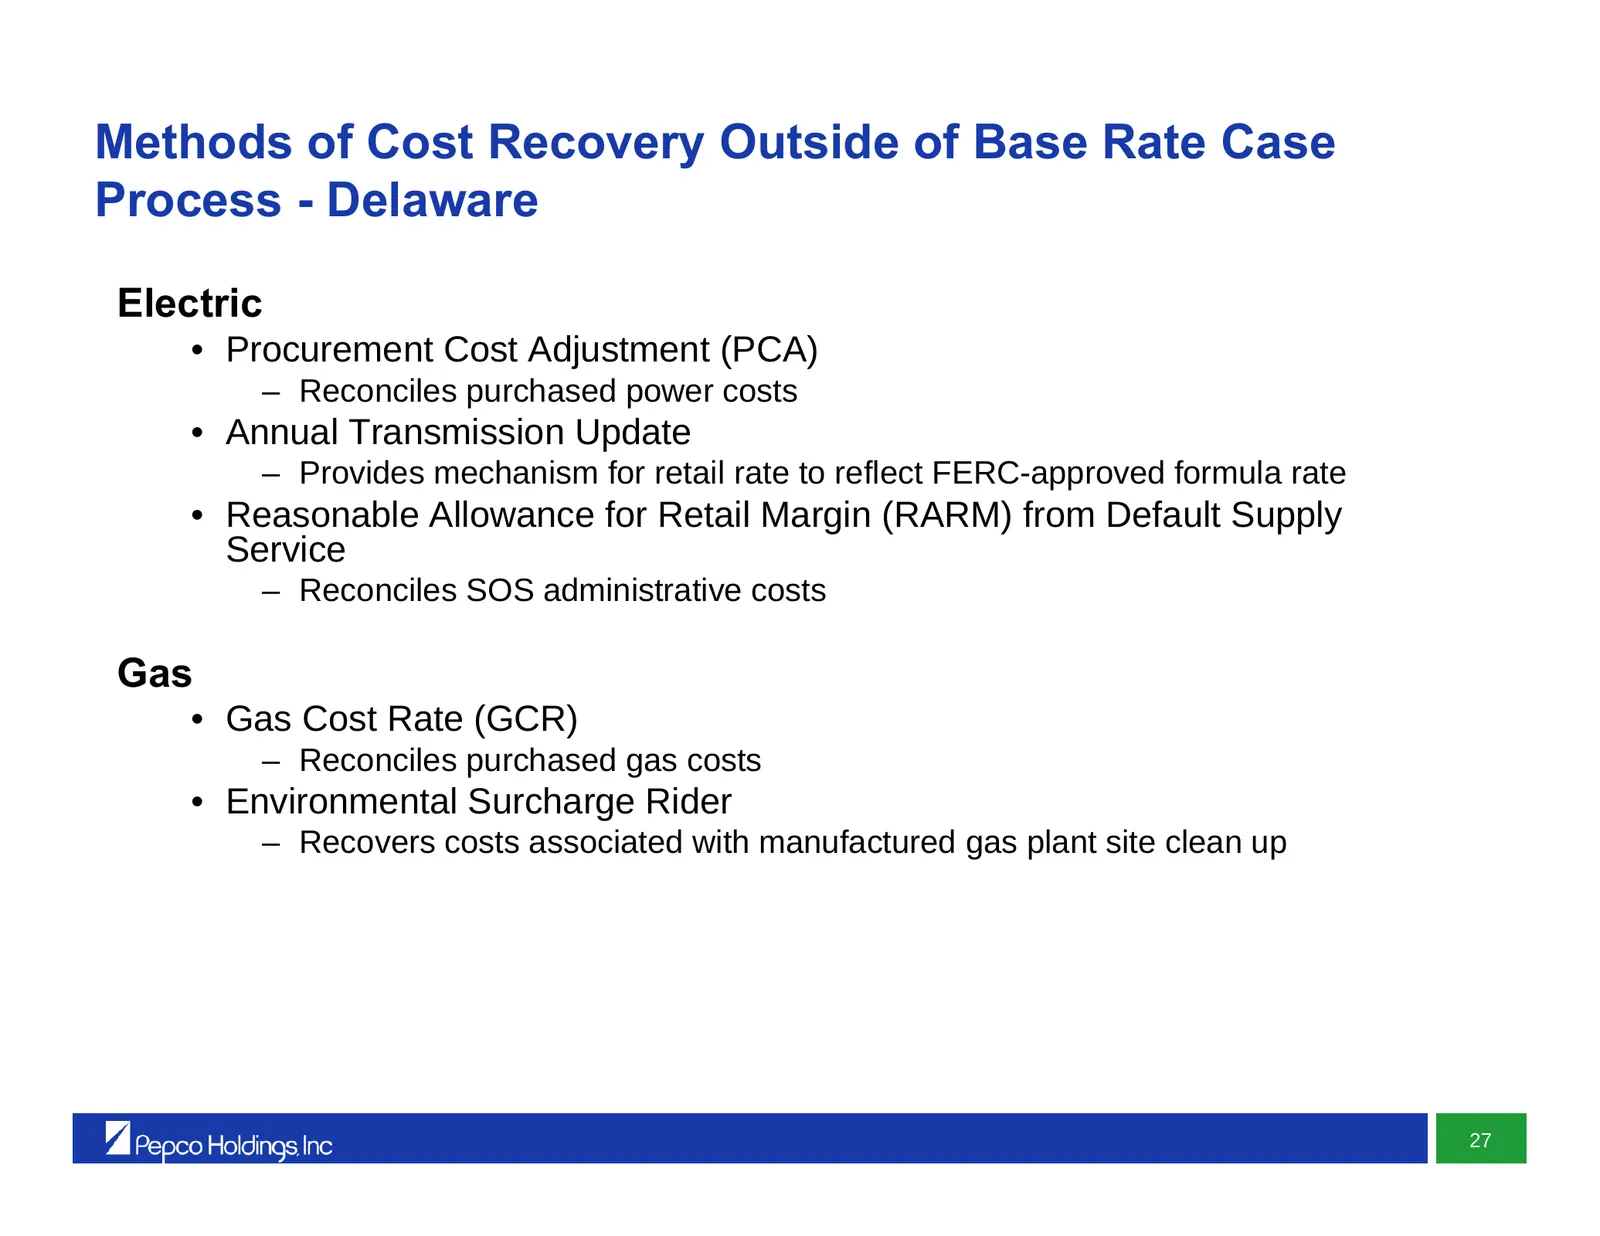
Methods of Cost Recovery Outside of Base Rate Case Process - Delaware Electric • Procurement Cost Adjustment (PCA) – Reconciles purchased power costs • Annual Transmission Update – Provides mechanism for retail rate to reflect FERC-approved formula rate • Reasonable Allowance for Retail Margin (RARM
Slide 82: Methods of Cost Recovery – New Jersey
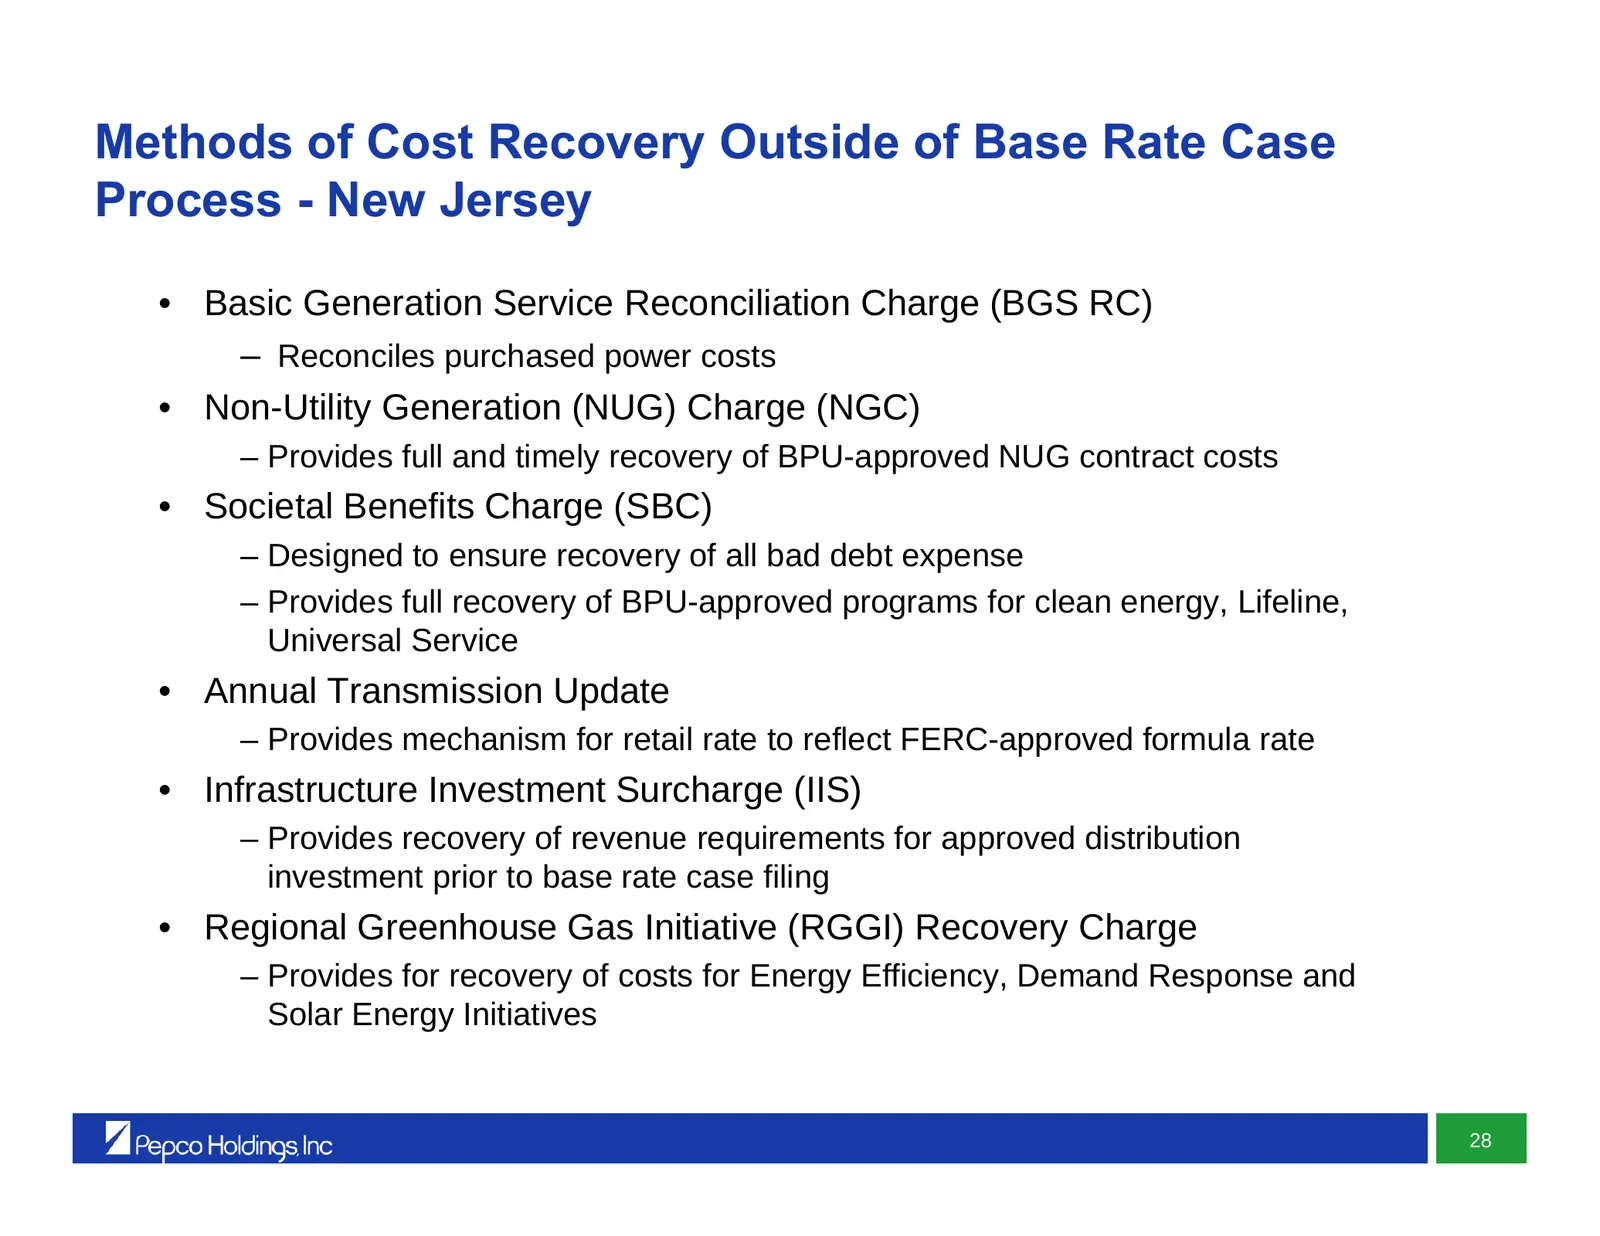
Methods of Cost Recovery Outside of Base Rate Case Process - New Jersey • Basic Generation Service Reconciliation Charge (BGS RC) – Reconciles purchased power costs • Non-Utility Generation (NUG) Charge (NGC) – Provides full and timely recovery of BPU-approved NUG contract costs • Societal Benefits
Slide 83: Regulatory Information by Commission
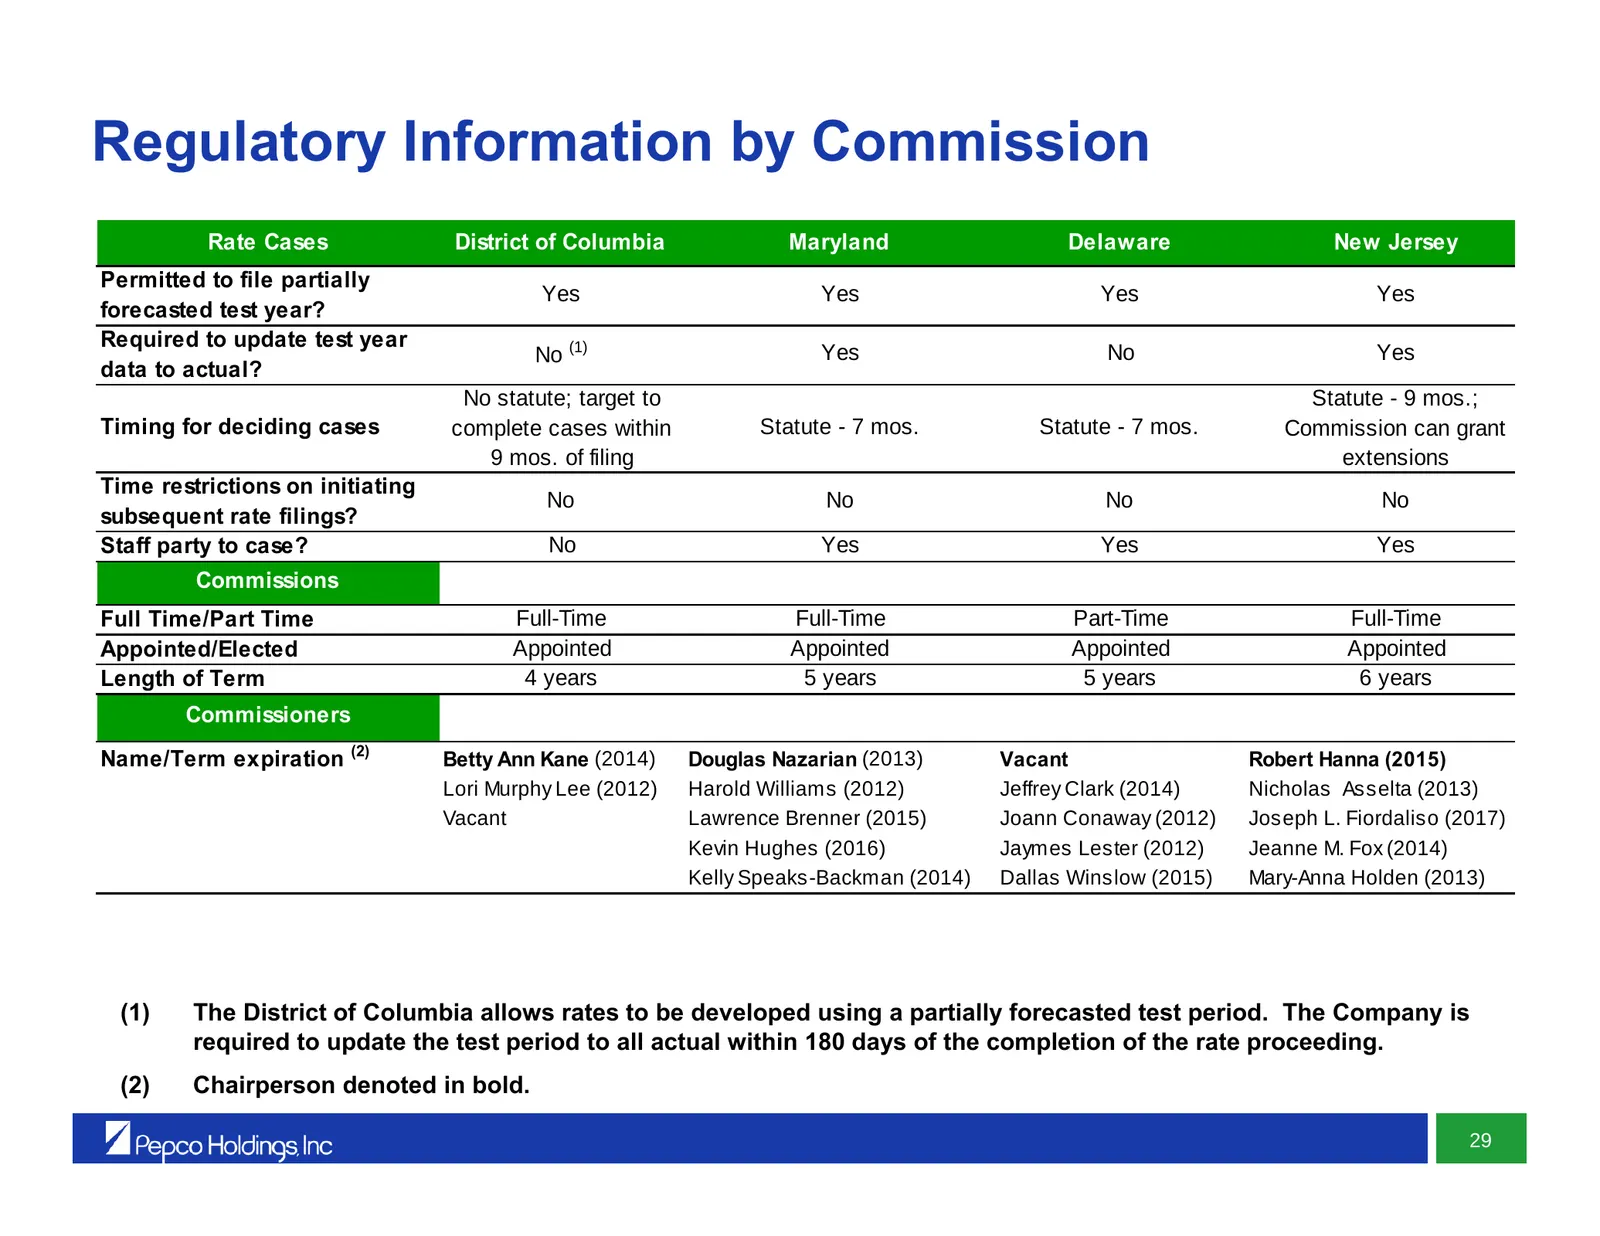
Regulatory Information by Commission Rate Cases District of Columbia Maryland Delaware New Jersey Permitted to file partially Yes Yes Yes Yes forecasted test year? Required to update test year No (1) Yes No Yes data to actual? No statute; target to Statute - 9 mos.; Timing for deciding cases complet
Slide 84: Pepco Energy Services Overview
Pepco Energy Services Overview John Huffman President & Chief Executive Officer, Pepco Energy Services 83
Slide 85: Pepco Energy Services – Overview
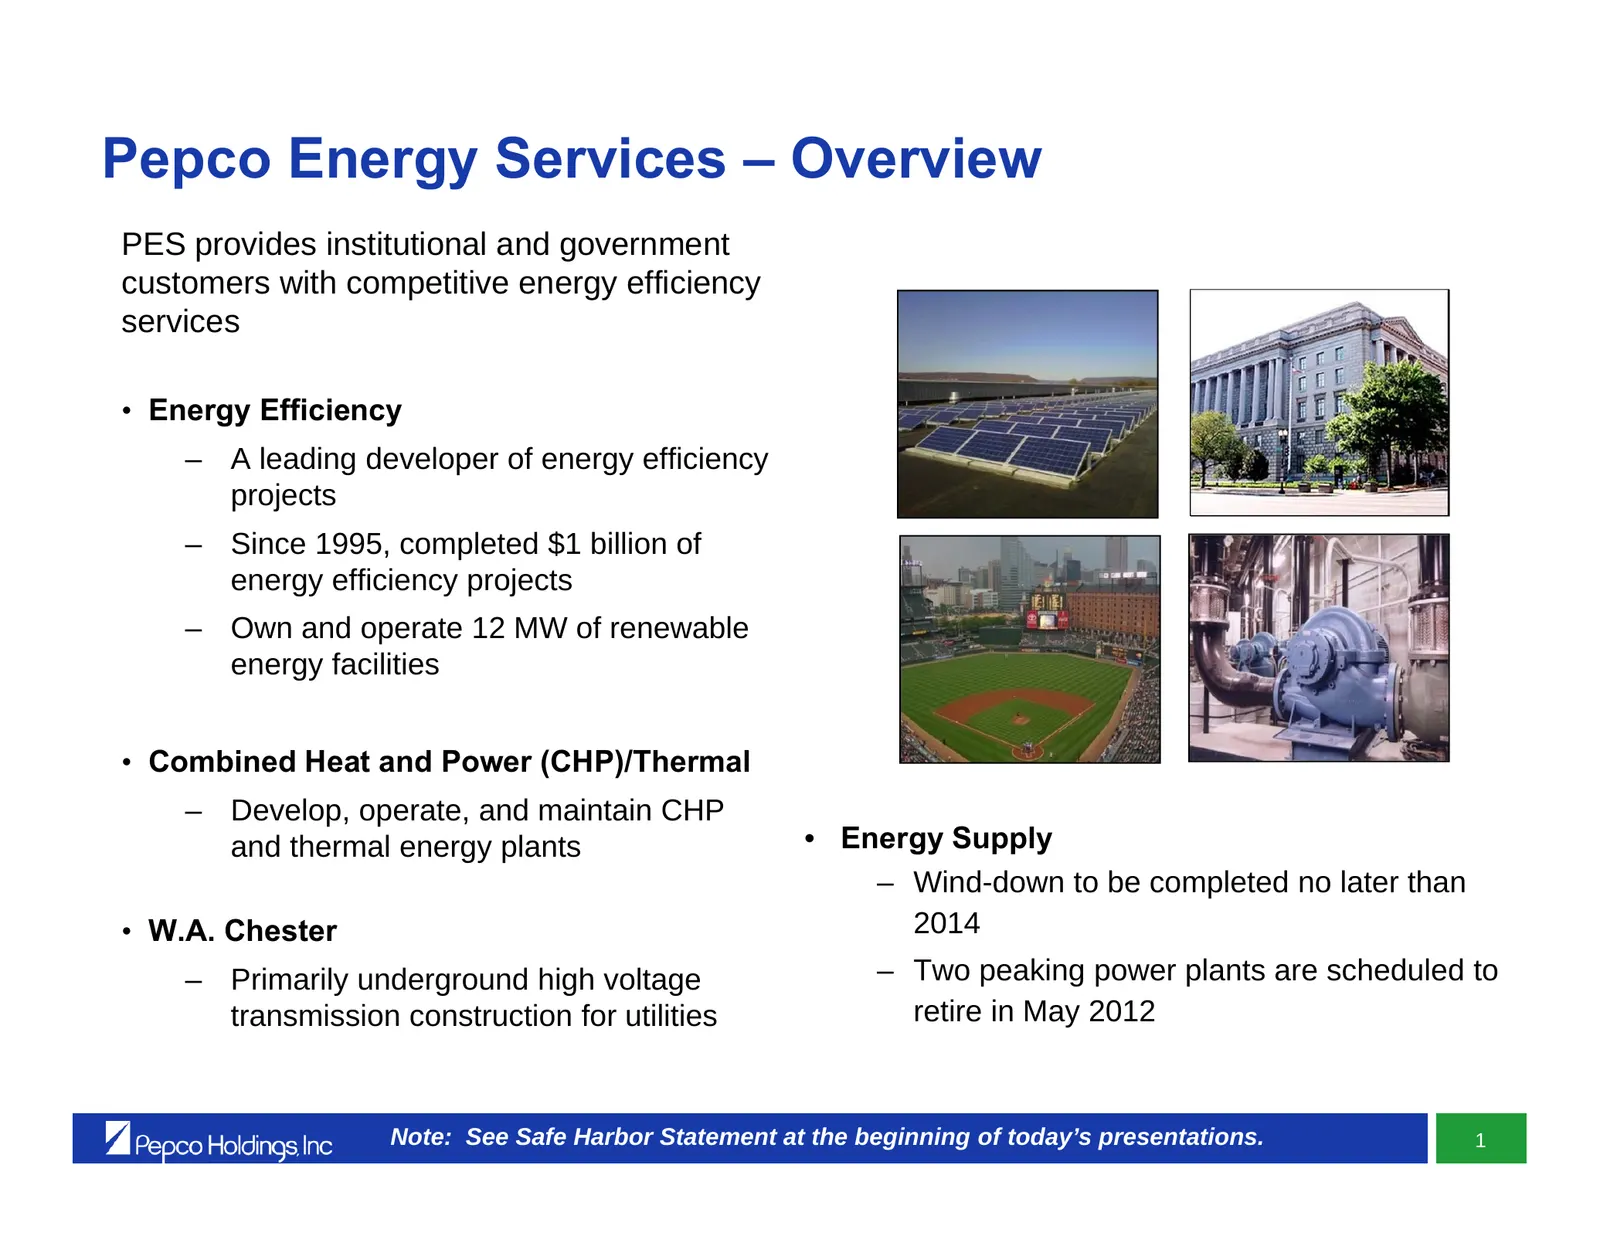
Pepco Energy Services – Overview PES provides institutional and government customers with competitive energy efficiency services • Energy Efficiency – A leading developer of energy efficiency projects – Since 1995, completed $1 billion of energy efficiency projects – Own and operate 12 MW of renewab
Slide 86: Wind Down of Retail Supply and Retirement of Power Plants
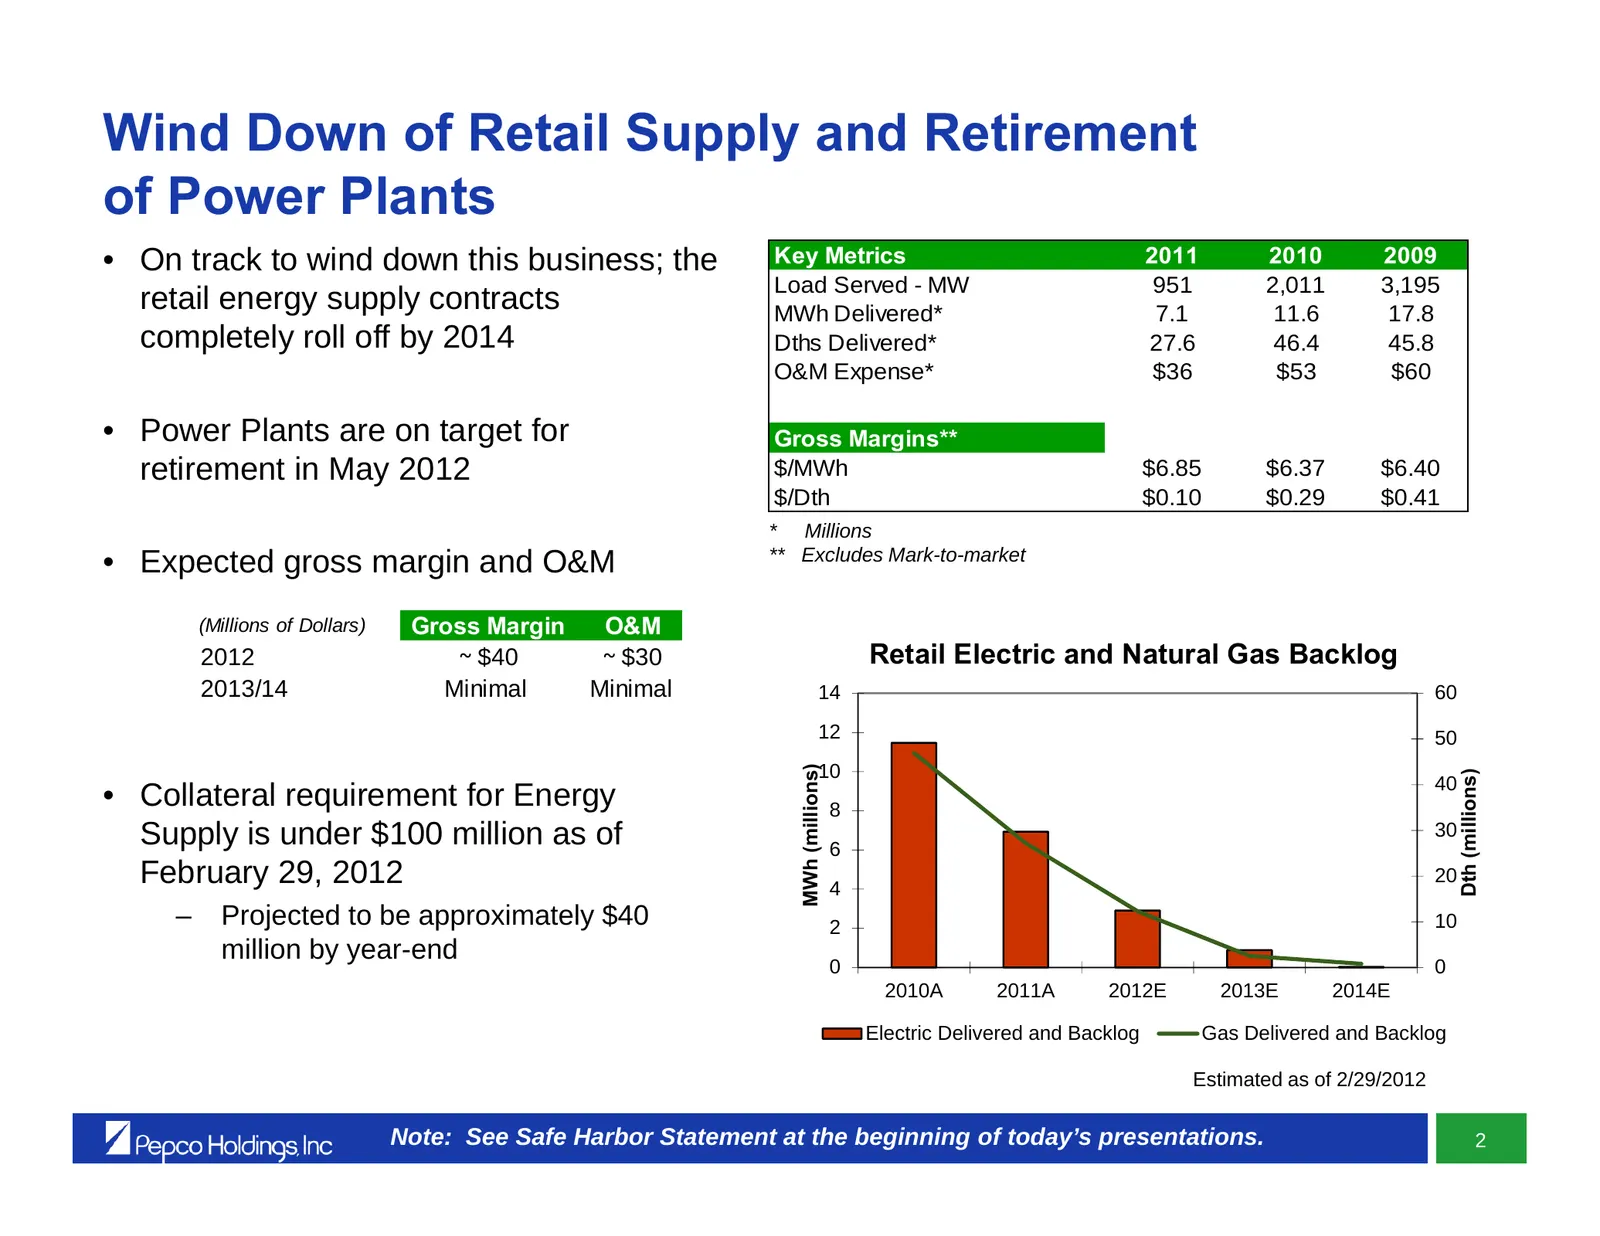
Wind Down of Retail Supply and Retirement of Power Plants • On track to wind down this business; the Key Metrics 2011 2010 2009 Load Served - MW 951 2,011 3,195 retail energy supply contracts MWh Delivered* 7.1 11.6 17.8 completely roll off by 2014 Dths Delivered* 27.6 46.4 45.8 O&M Expense* $36 $53
Slide 87: Growing the Energy Services Business
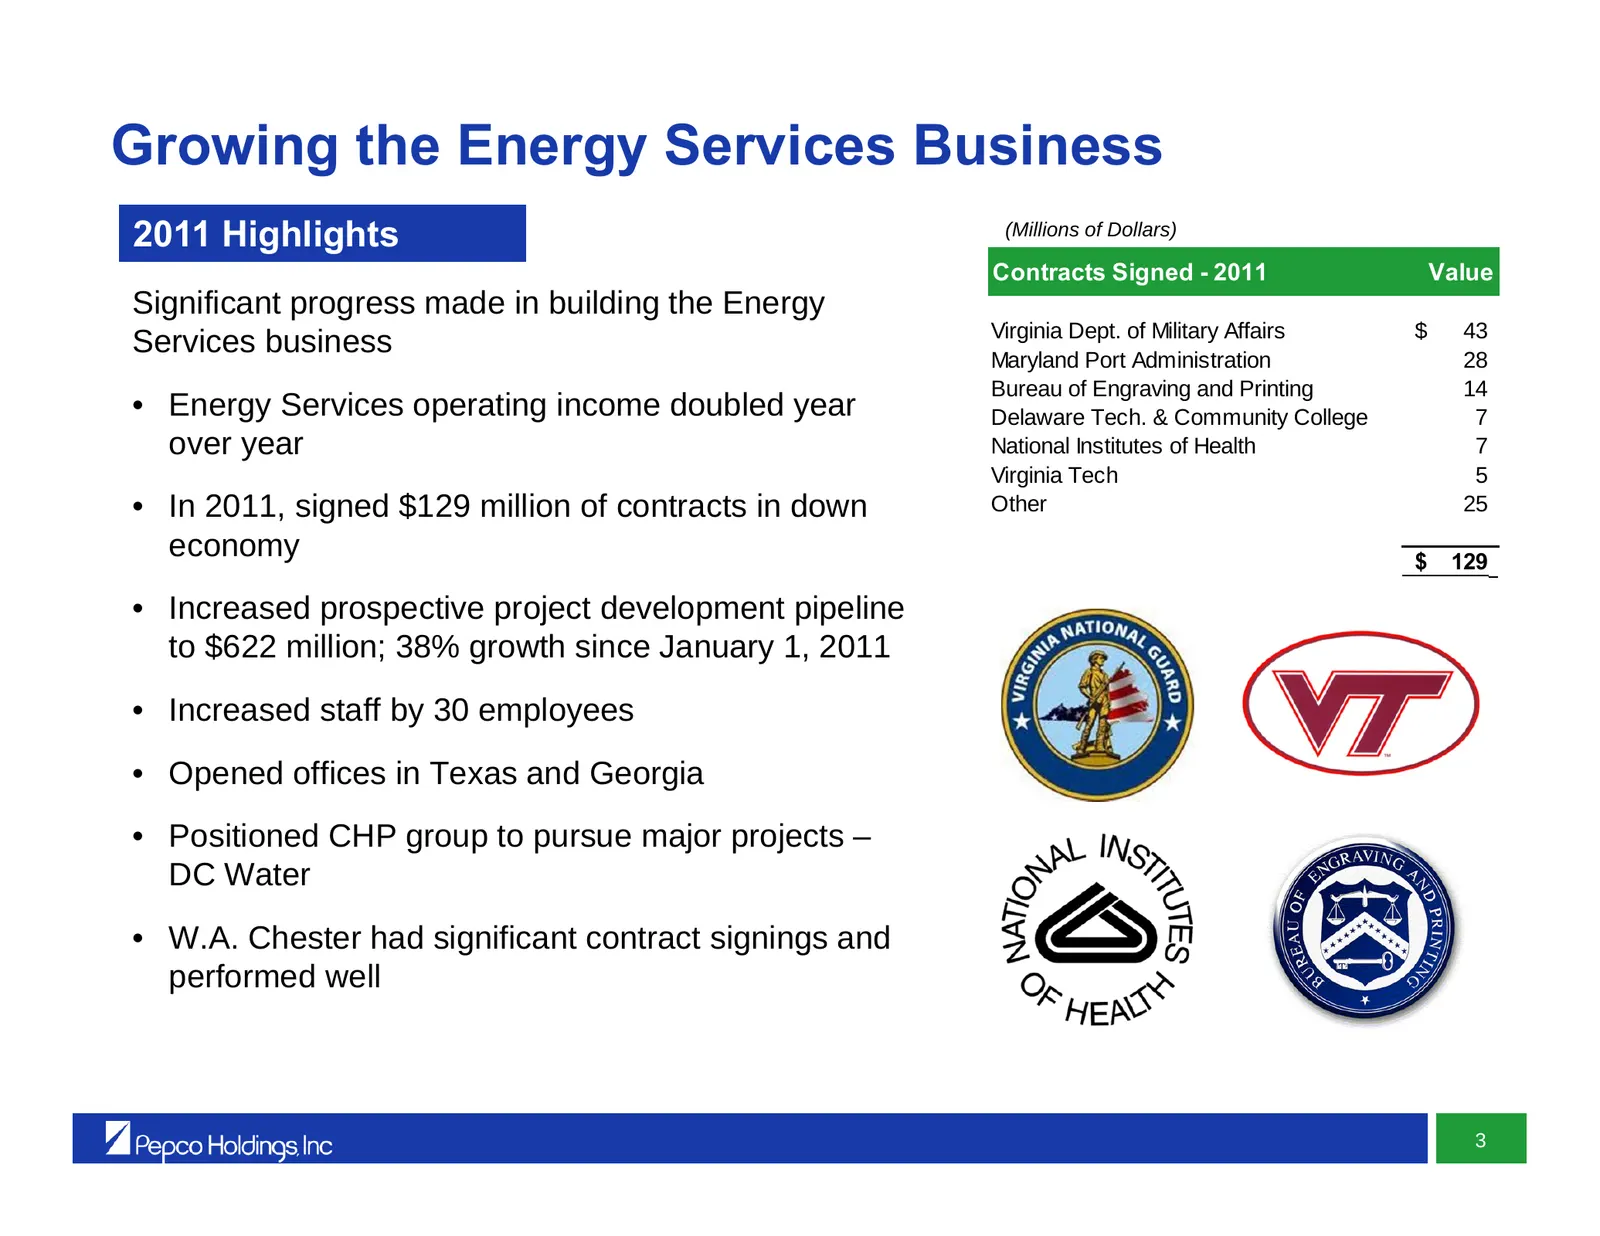
Growing the Energy Services Business 2011 Highlights (Millions of Dollars) Contracts Signed - 2011 Value Significant progress made in building the Energy Virginia Dept. of Military Affairs $ 43 Services business Maryland Port Administration 28 Bureau of Engraving and Printing 14 • Energy Services op
Slide 88: PES Going Forward
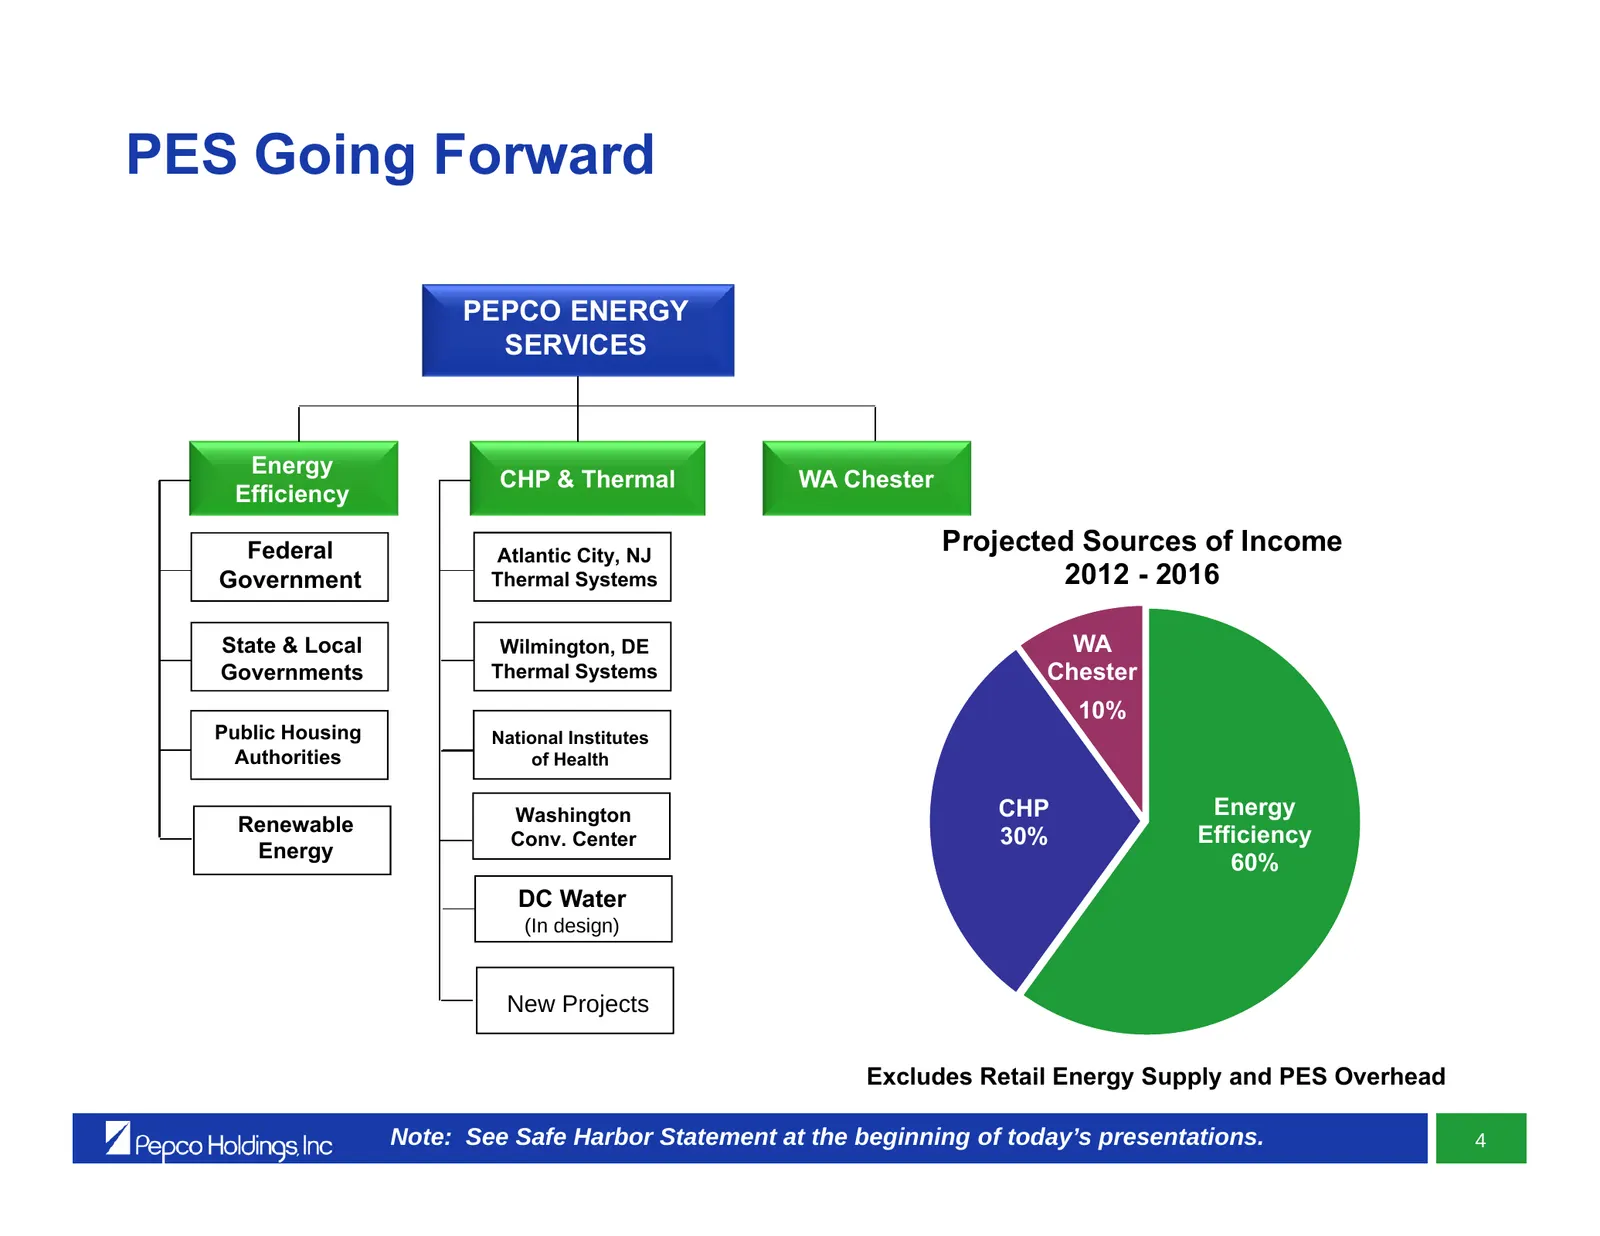
PES Going Forward PEPCO ENERGY SERVICES Energy CHP & Thermal WA Chester Efficiency Federal Atlantic City, NJ Projected Sources of Income Government Thermal Systems 2012 - 2016 State & Local Wilmington, DE WA Governments Thermal Systems Chester 10% Public Housing National Institutes Authorities of He
Slide 89: Key Features of Typical Projects
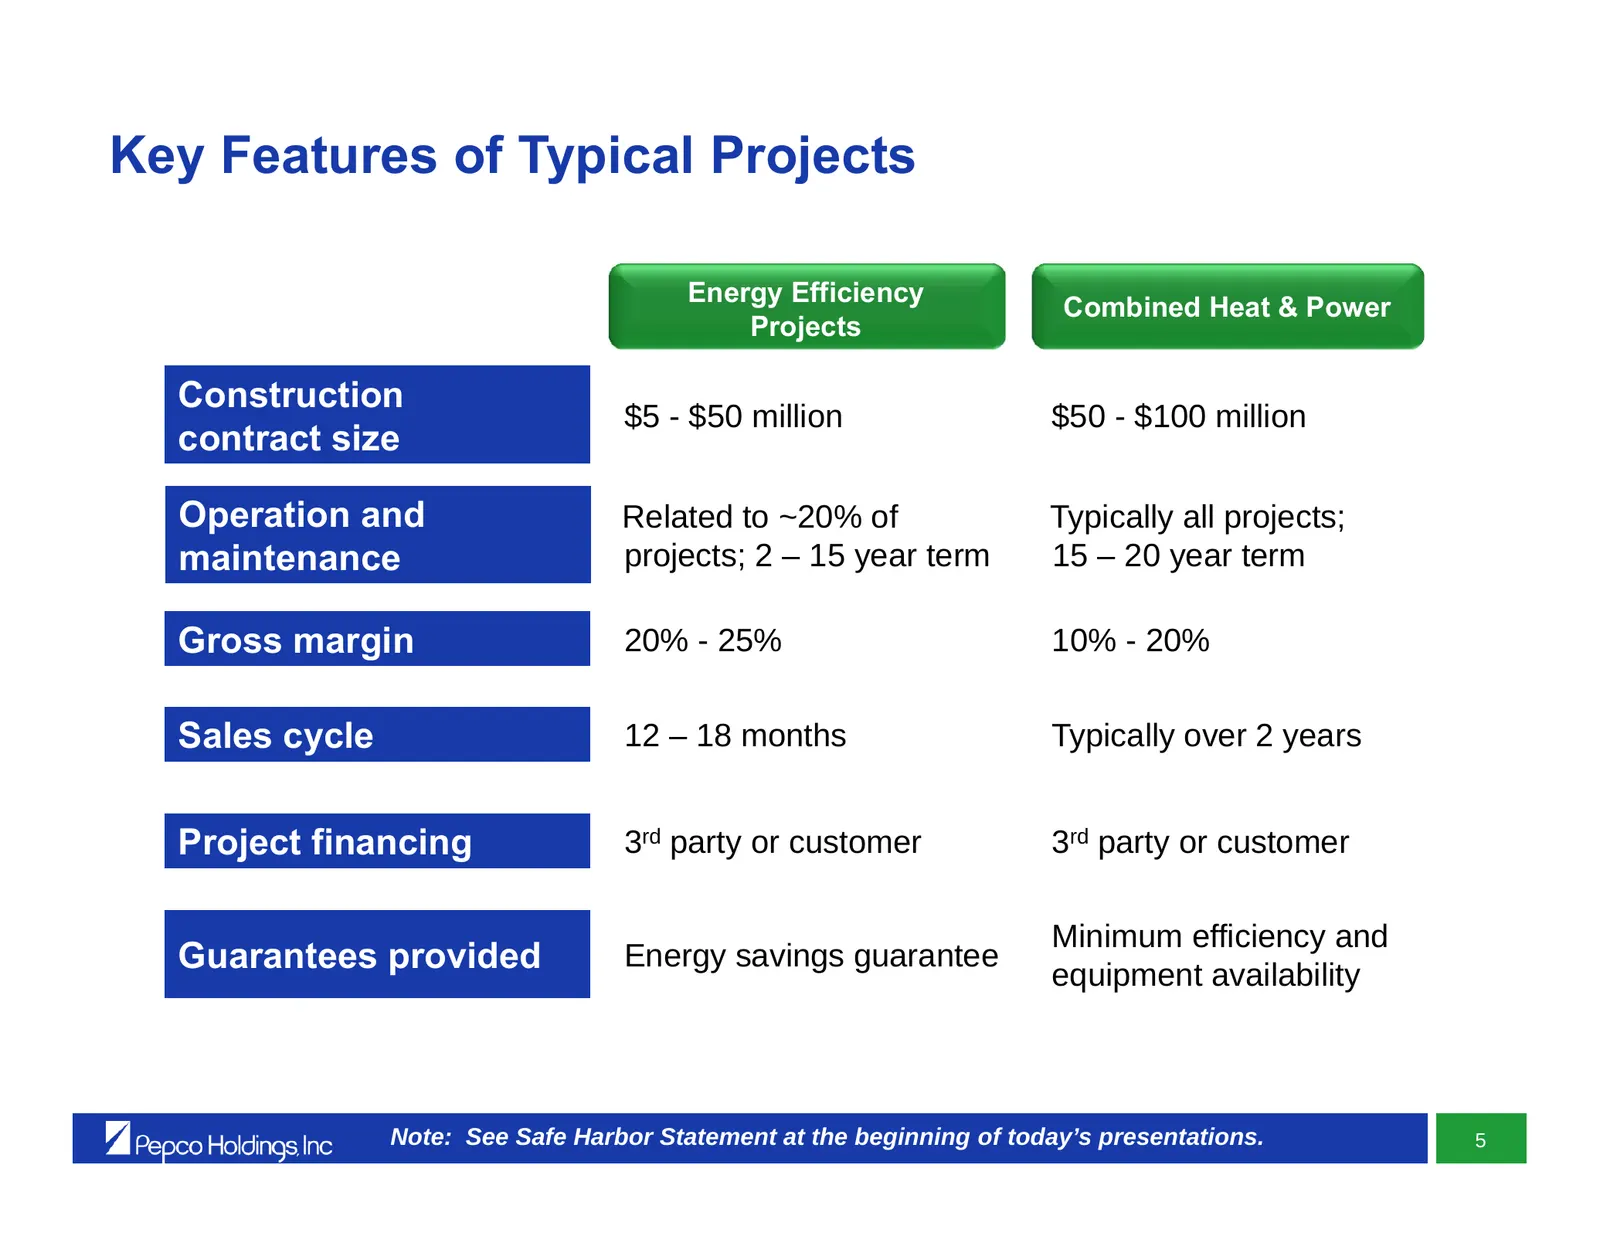
Key Features of Typical Projects Energy Efficiency Combined Heat & Power Projects Construction $5 - $50 million $50 - $100 million contract size Operation and Related to ~20% of Typically all projects; maintenance projects; 2 – 15 year term 15 – 20 year term Gross margin 20% - 25% 10% - 20% Sales cy
Slide 90: DC Water CHP Project
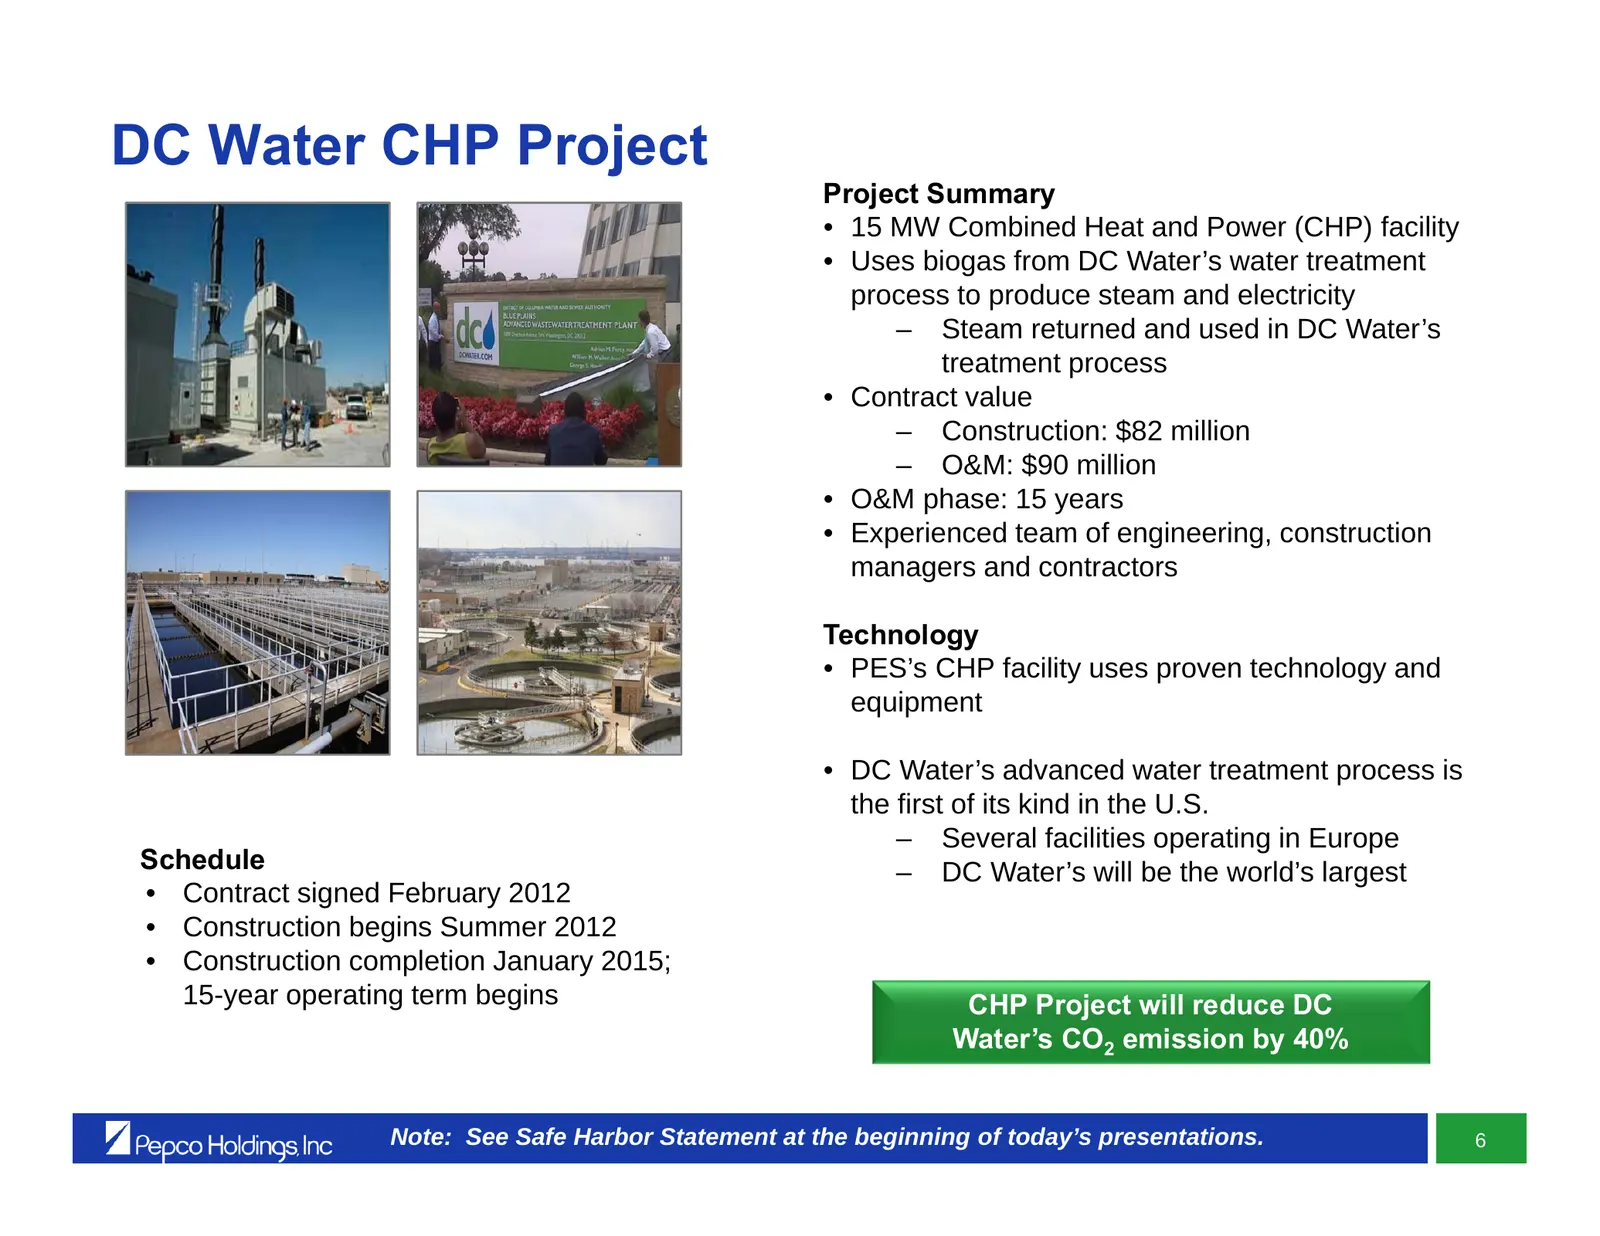
DC Water CHP Project Project Summary • 15 MW Combined Heat and Power (CHP) facility • Uses biogas from DC Water’s water treatment process to produce steam and electricity – Steam returned and used in DC Water’s treatment process • Contract value – Construction: $82 million – O&M: $90 million • O&M p
Slide 91: Market Expansion
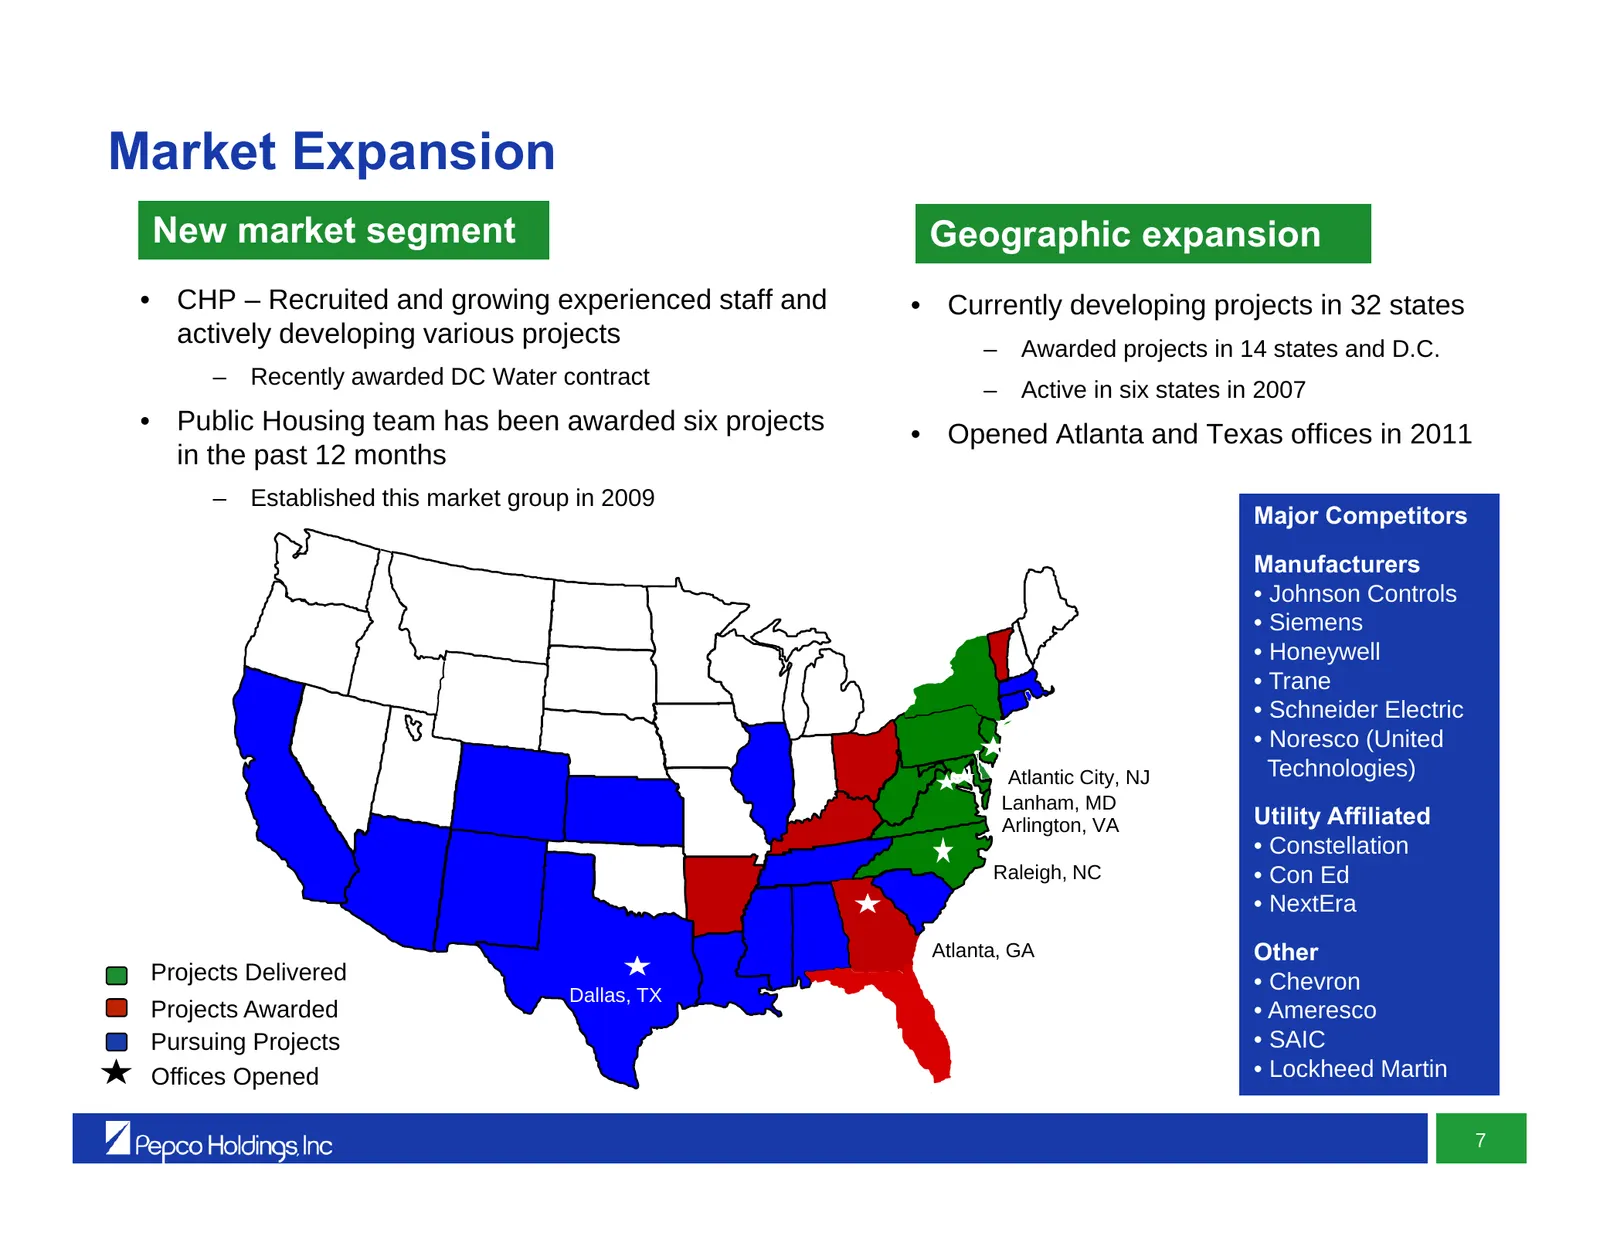
Market Expansion New market segment Geographic expansion • CHP – Recruited and growing experienced staff and • Currently developing projects in 32 states actively developing various projects – Awarded projects in 14 states and D.C. – Recently awarded DC Water contract – Active in six states in 2007
Slide 92: Investing in Talent to Drive Growth
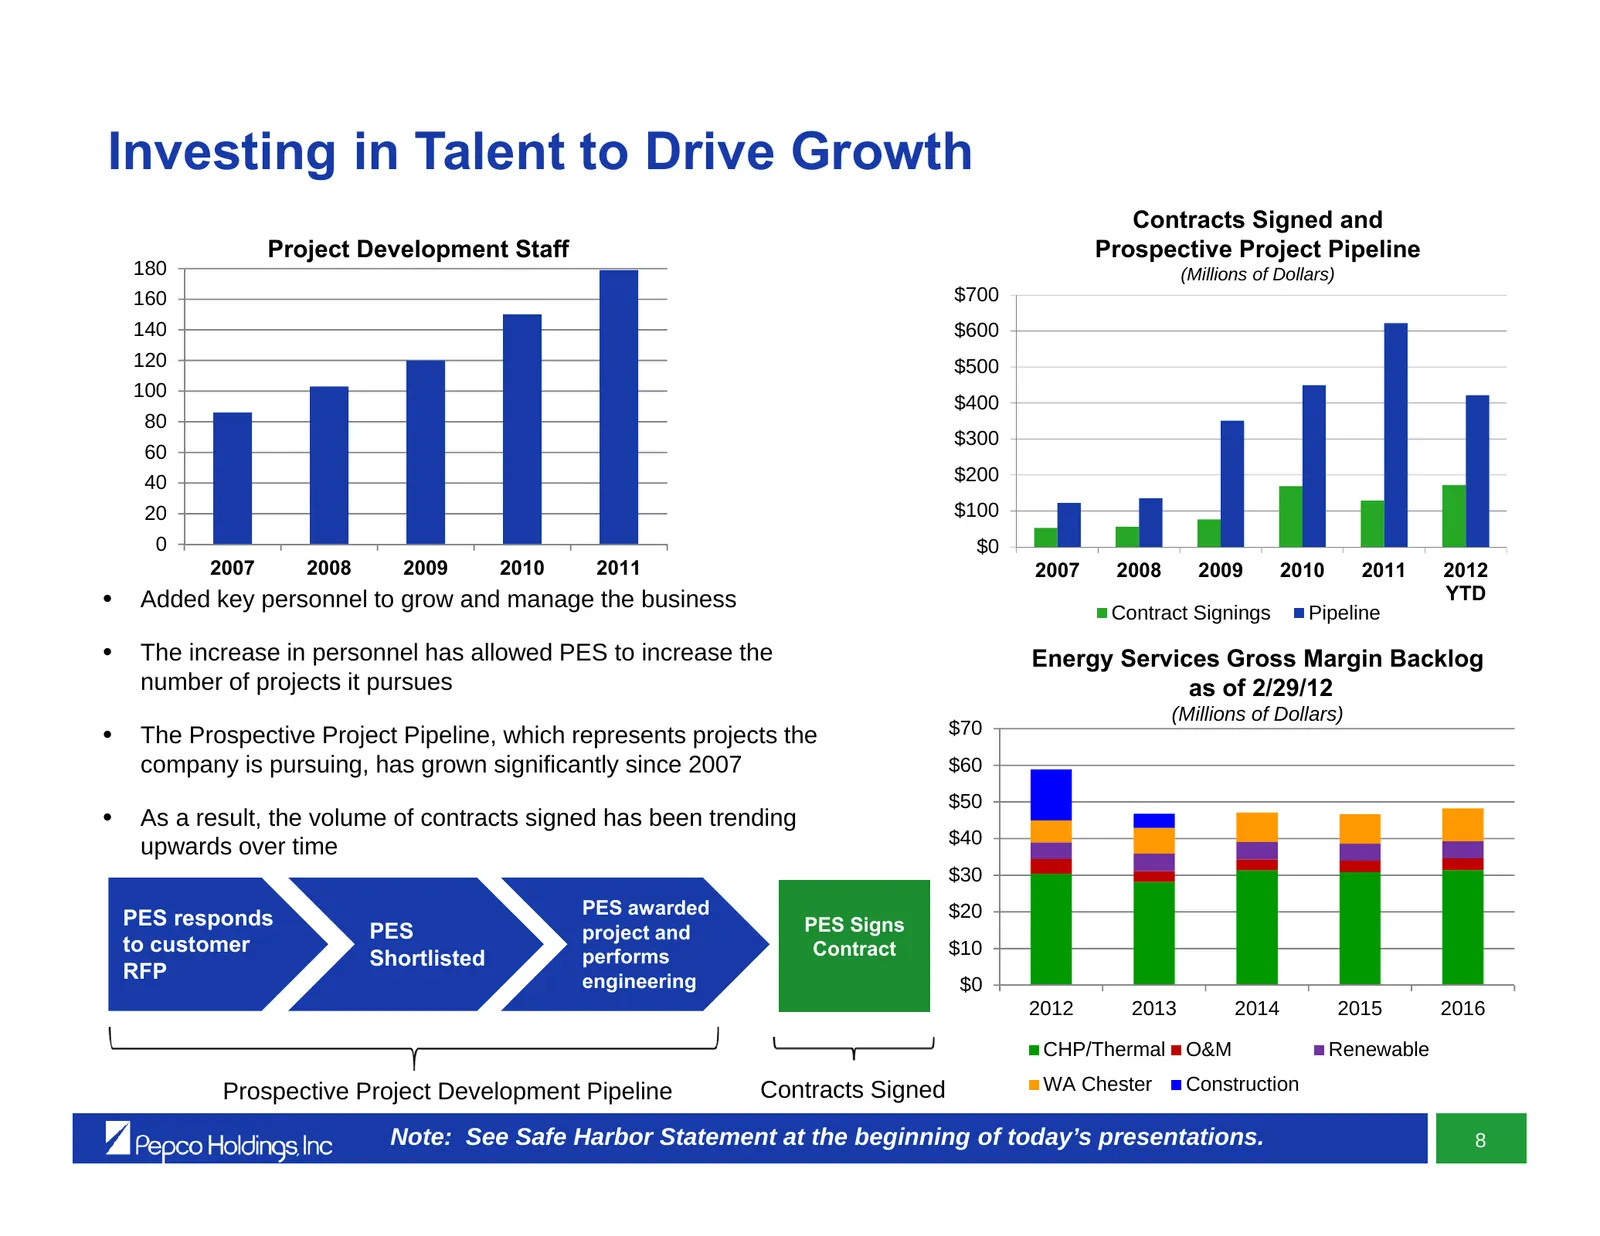
Investing in Talent to Drive Growth Contracts Signed and Project Development Staff Prospective Project Pipeline 180 (Millions of Dollars) 160 $700 140 $600 120 $500 100 $400 80 $300 60 40 $200 20 $100 0 $0 2007 2008 2009 2010 2011 2007 2008 2009 2010 2011 2012 • Added key personnel to grow and manag
Slide 93: Current Market Challenges
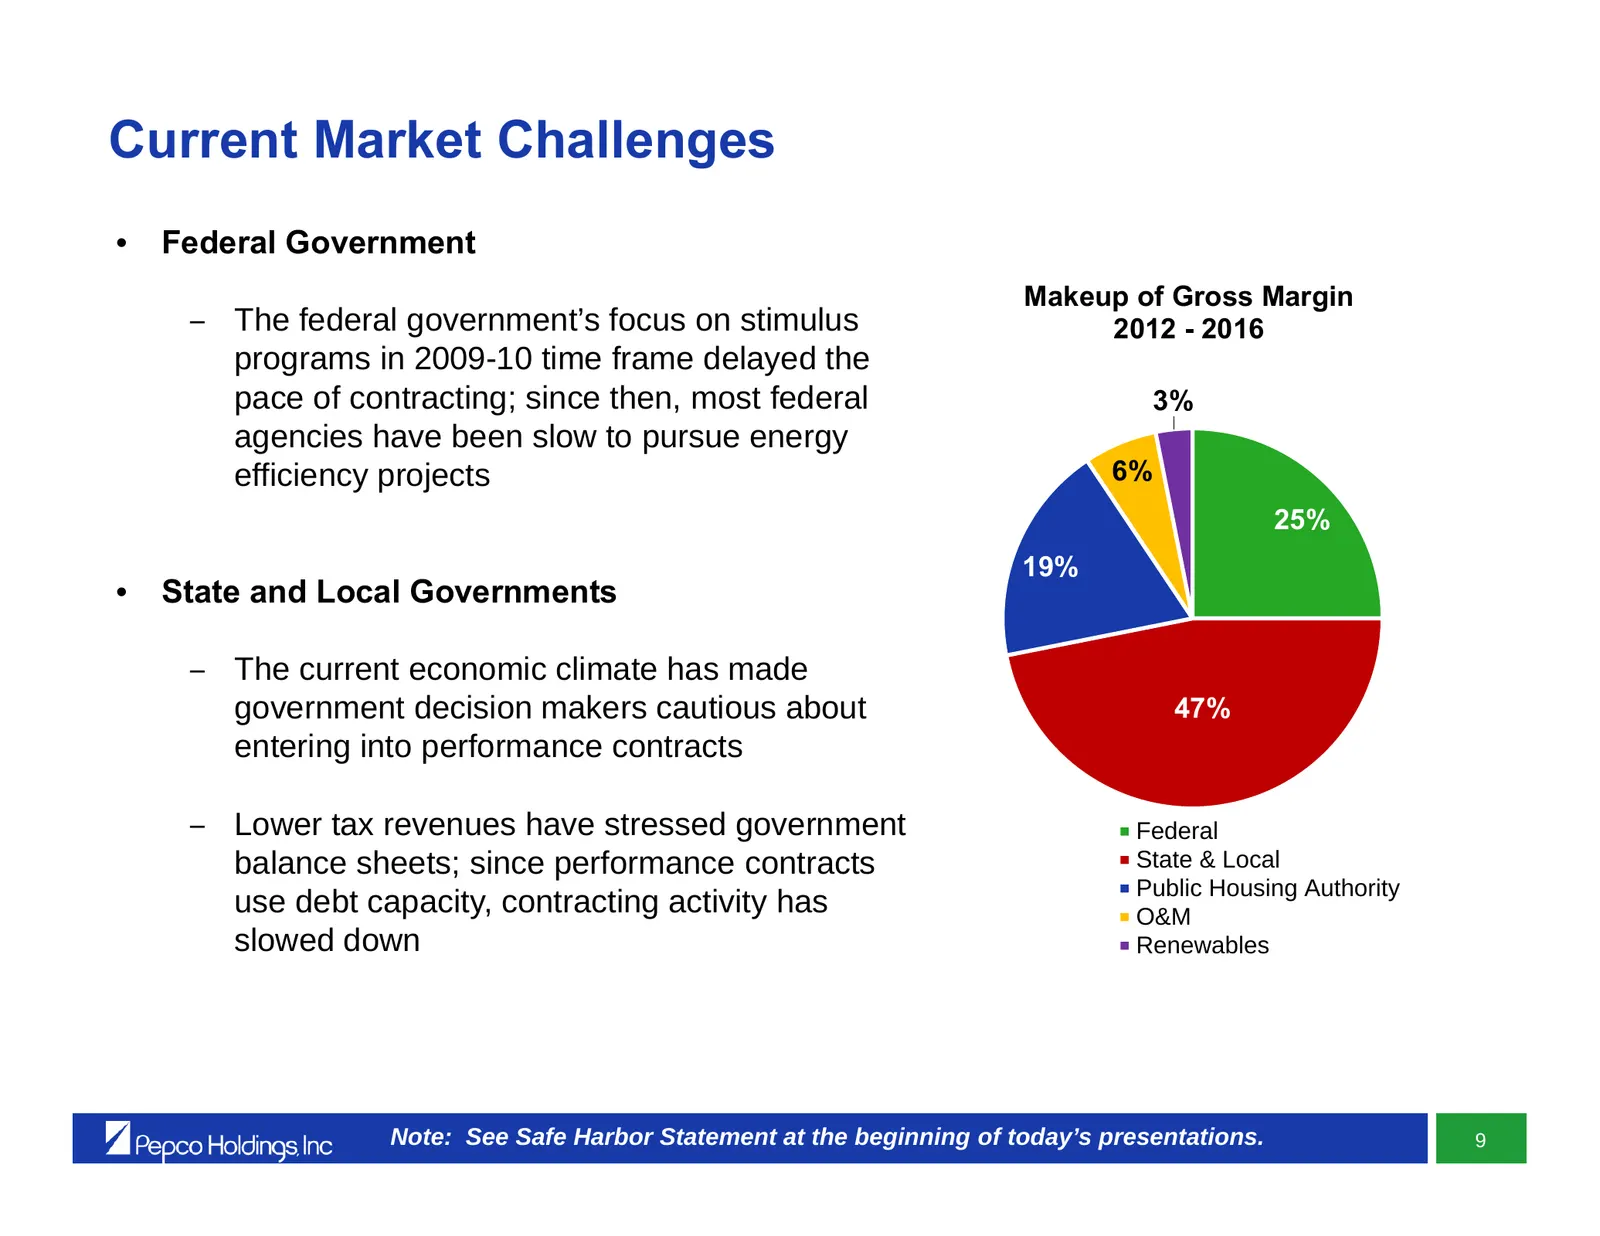
Current Market Challenges • Federal Government Makeup of Gross Margin ‒ The federal government’s focus on stimulus 2012 - 2016 programs in 2009-10 time frame delayed the pace of contracting; since then, most federal 3% agencies have been slow to pursue energy efficiency projects 6% 25% 19% • State a
Slide 94: Positive Market Drivers
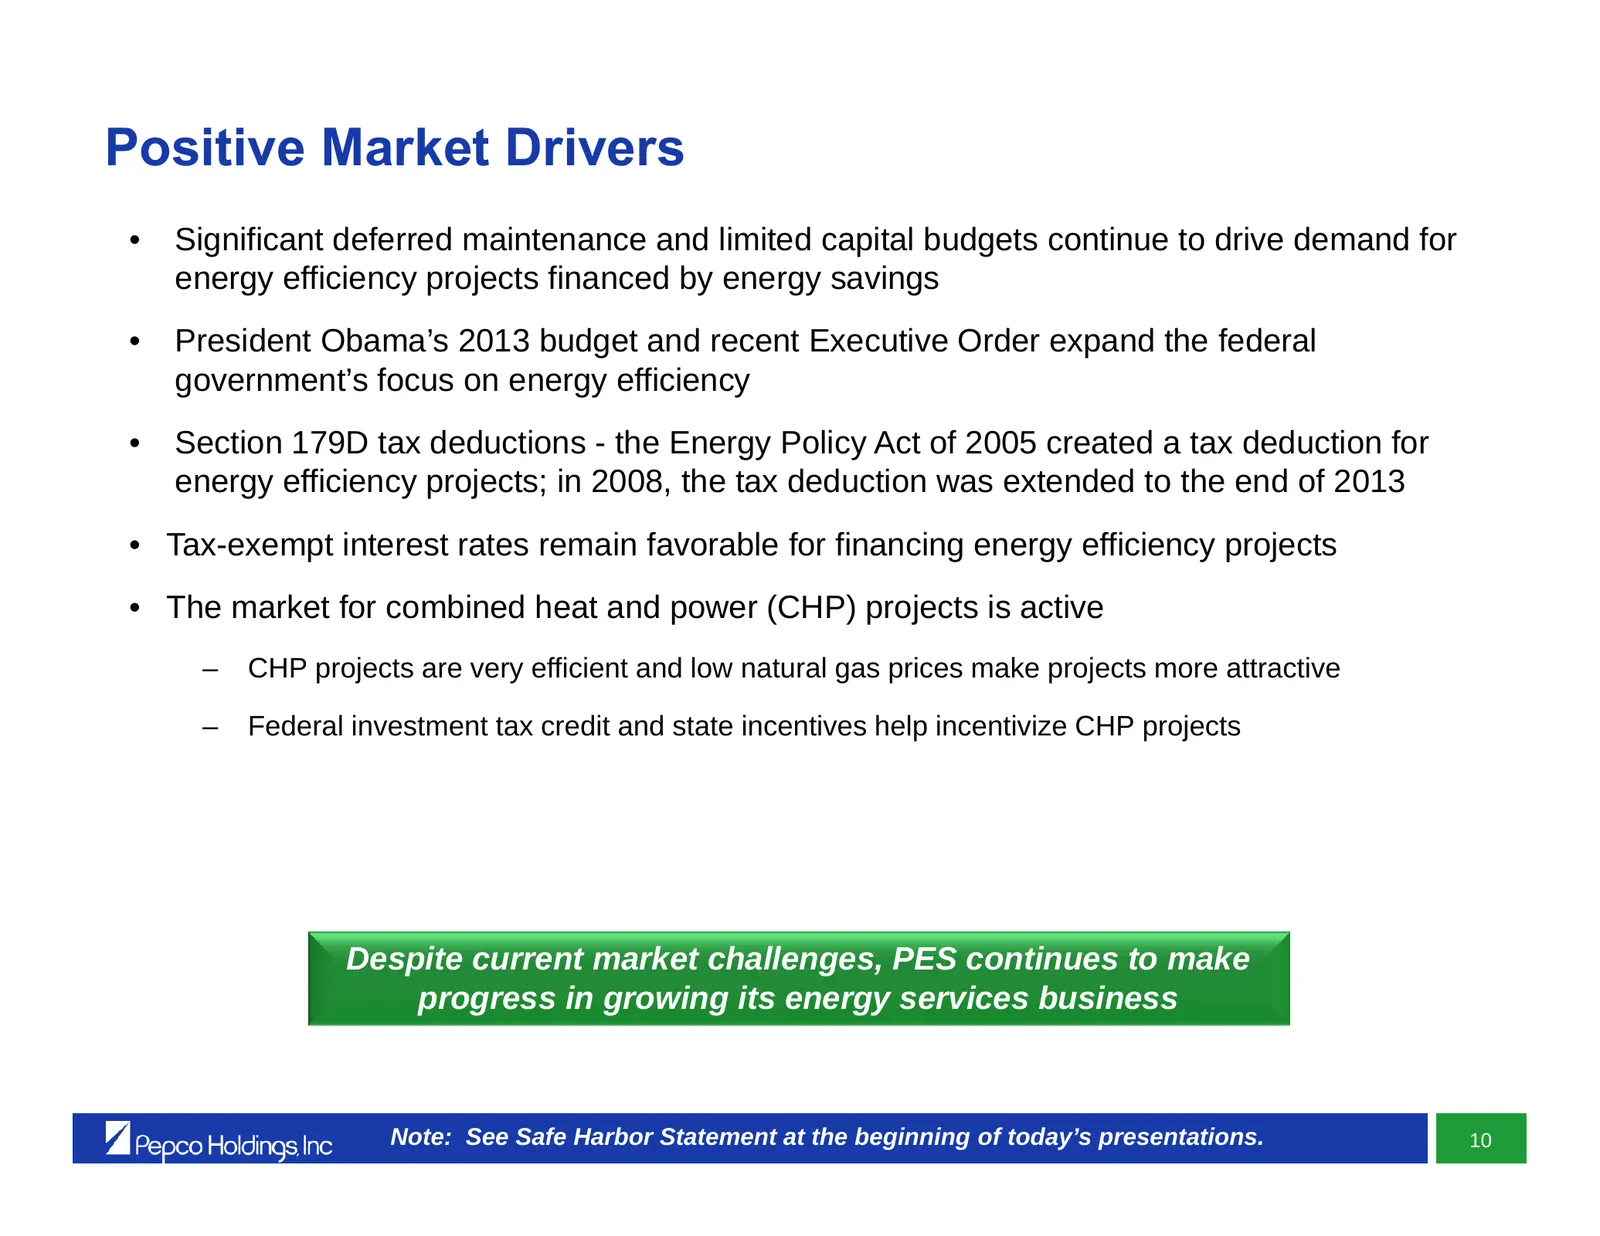
Positive Market Drivers • Significant deferred maintenance and limited capital budgets continue to drive demand for energy efficiency projects financed by energy savings • President Obama’s 2013 budget and recent Executive Order expand the federal government’s focus on energy efficiency • Section 17
Slide 95: Pepco Energy Services Growth Plan
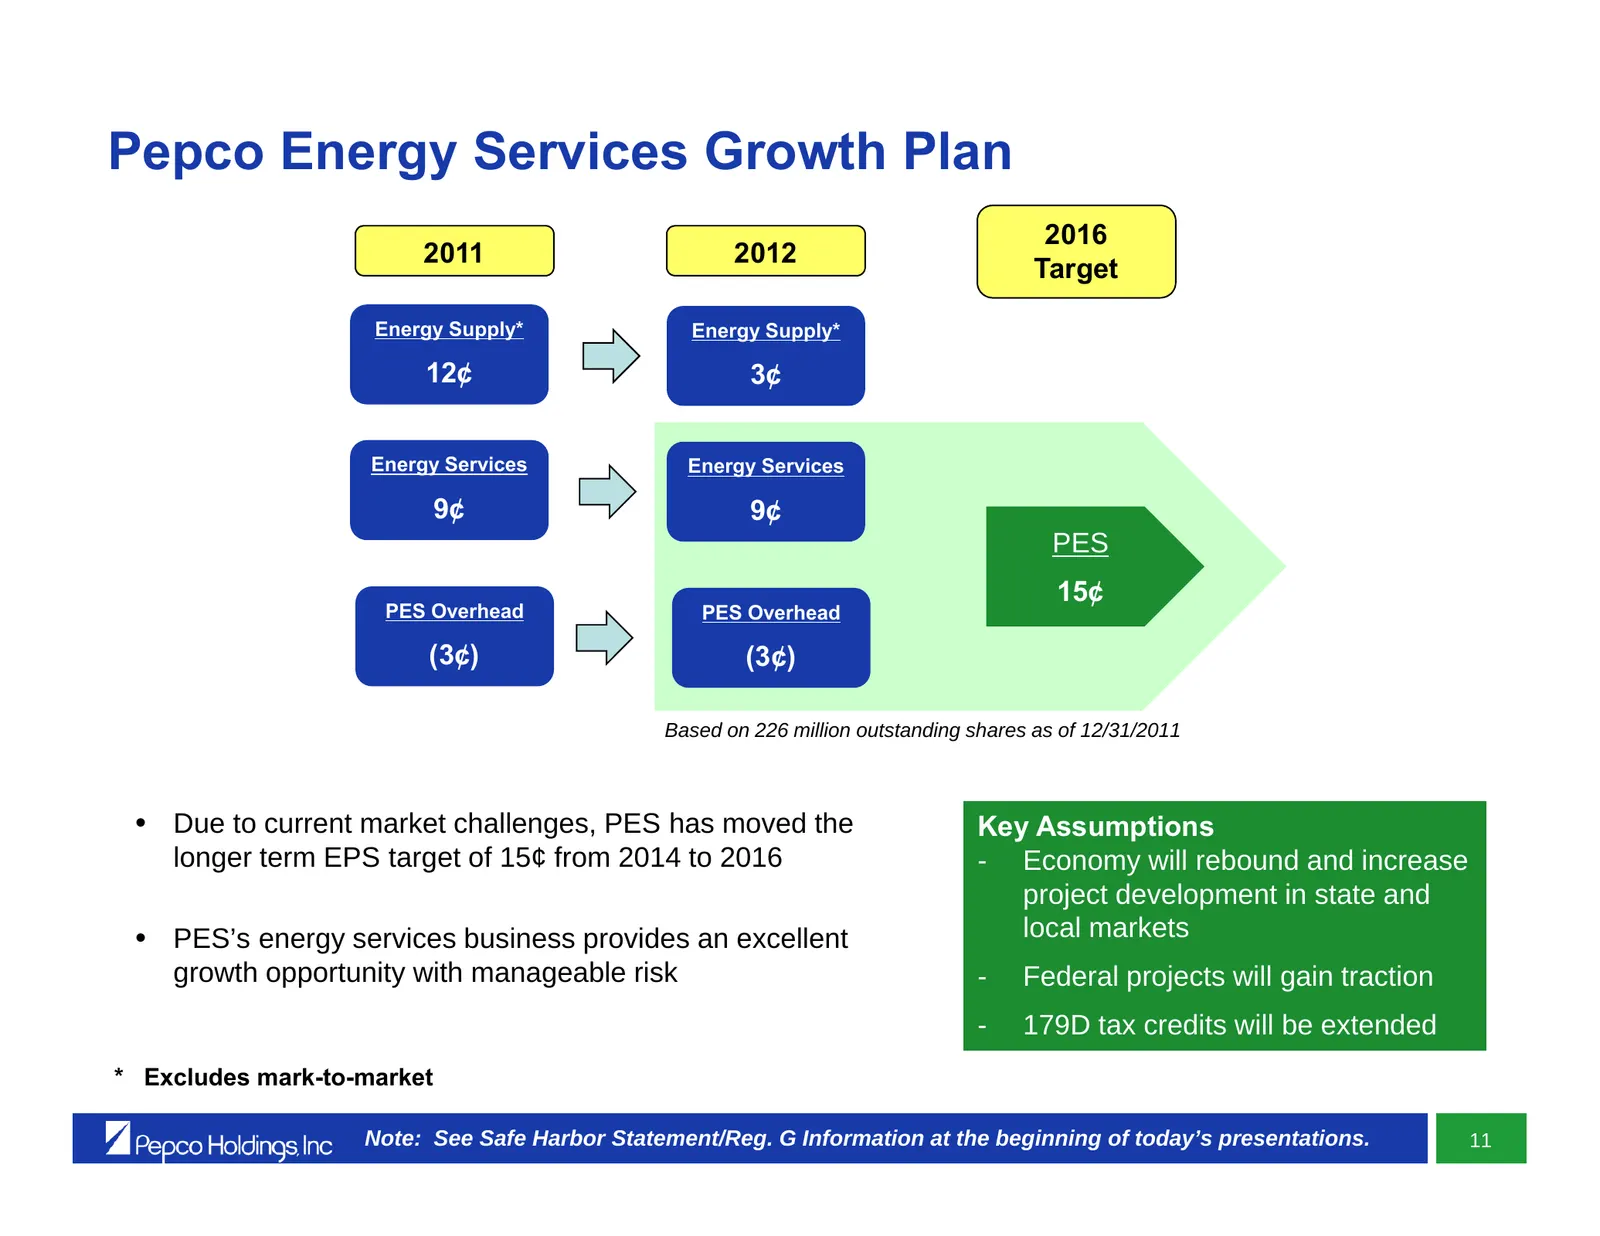
Pepco Energy Services Growth Plan 2016 2011 2012 Target Energy Supply* Energy Supply* 12¢ 3¢ Energy Services Energy Services 9¢ 9¢ PES 15¢ PES Overhead PES Overhead (3¢) (3¢) Based on 226 million outstanding shares as of 12/31/2011 • Due to current market challenges, PES has moved the Key Assumption
Slide 96: Summary
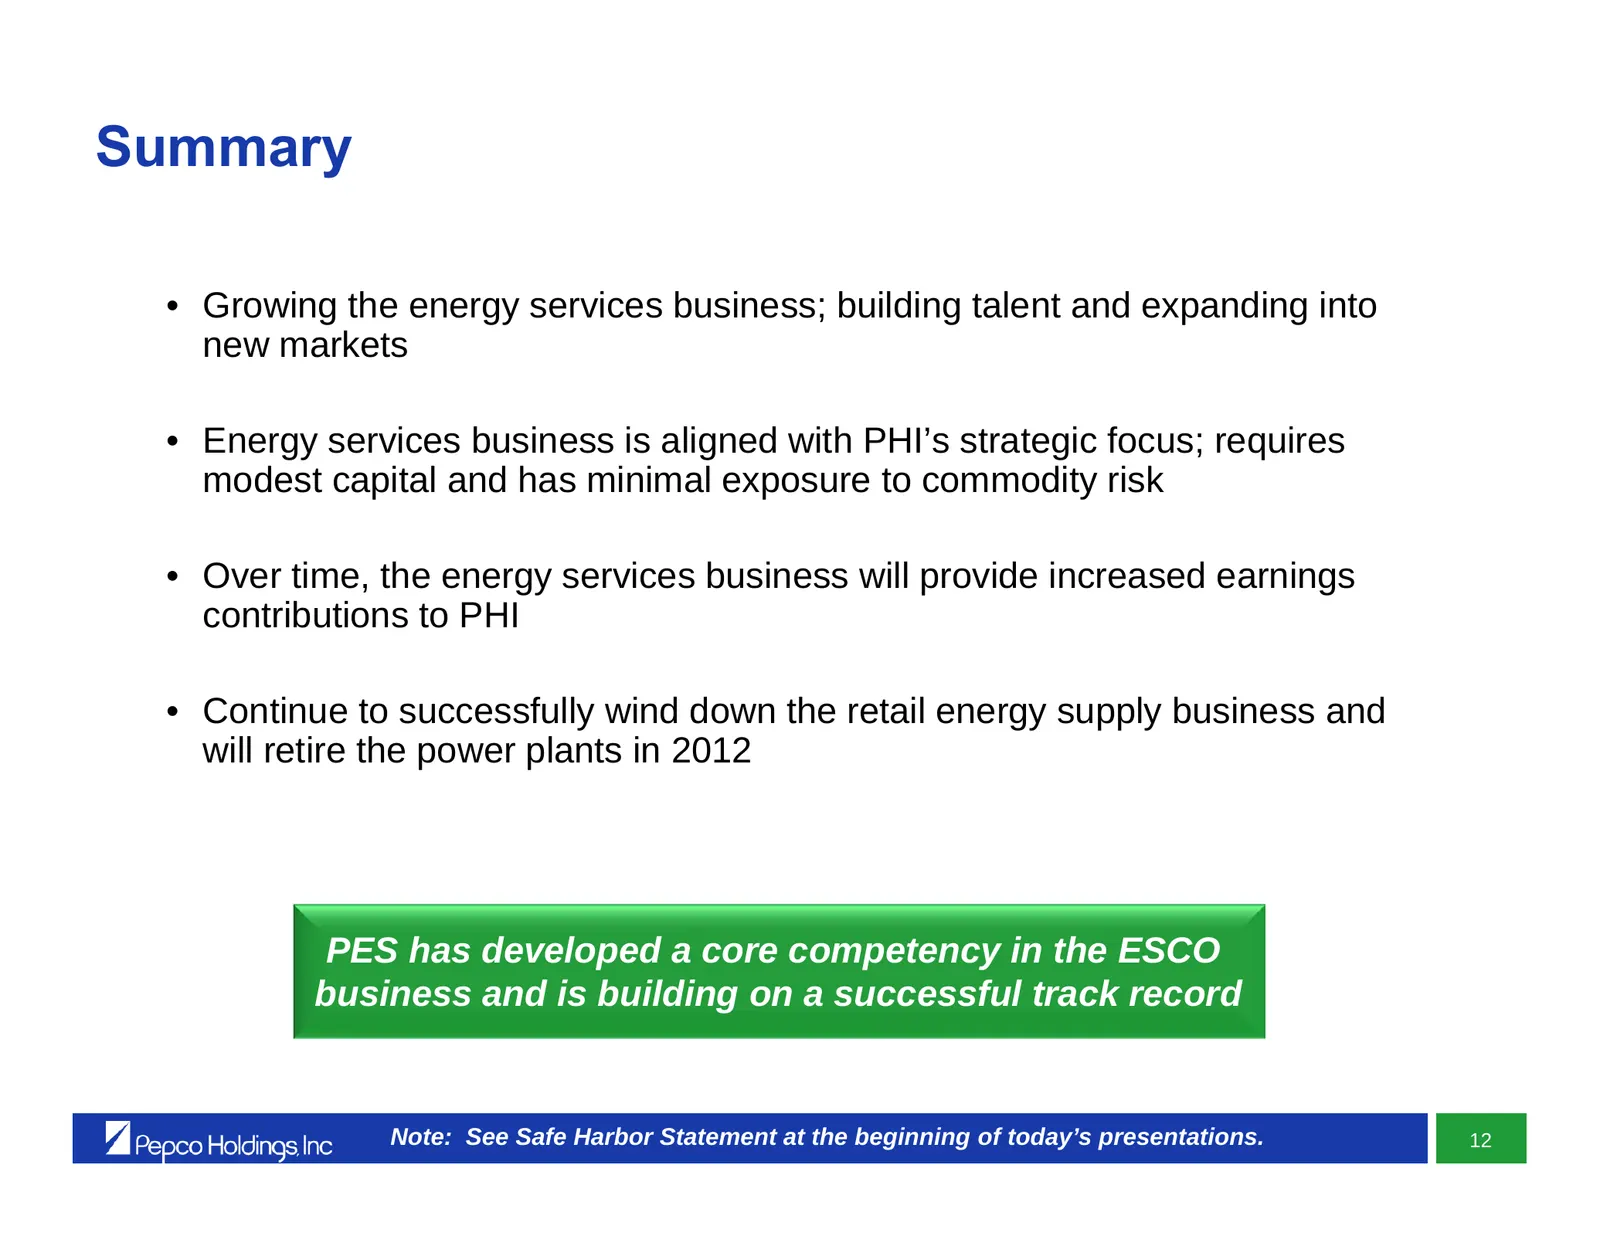
Summary • Growing the energy services business; building talent and expanding into new markets • Energy services business is aligned with PHI’s strategic focus; requires modest capital and has minimal exposure to commodity risk • Over time, the energy services business will provide increased earning
Slide 97: Pepco Energy Services Overview
Pepco Energy Services Overview John Huffman President & Chief Executive Officer, Pepco Energy Services 96
Slide 98: Appendix
Appendix y | Pepco Holdings Inc L |
Slide 99: PES Annual Earnings
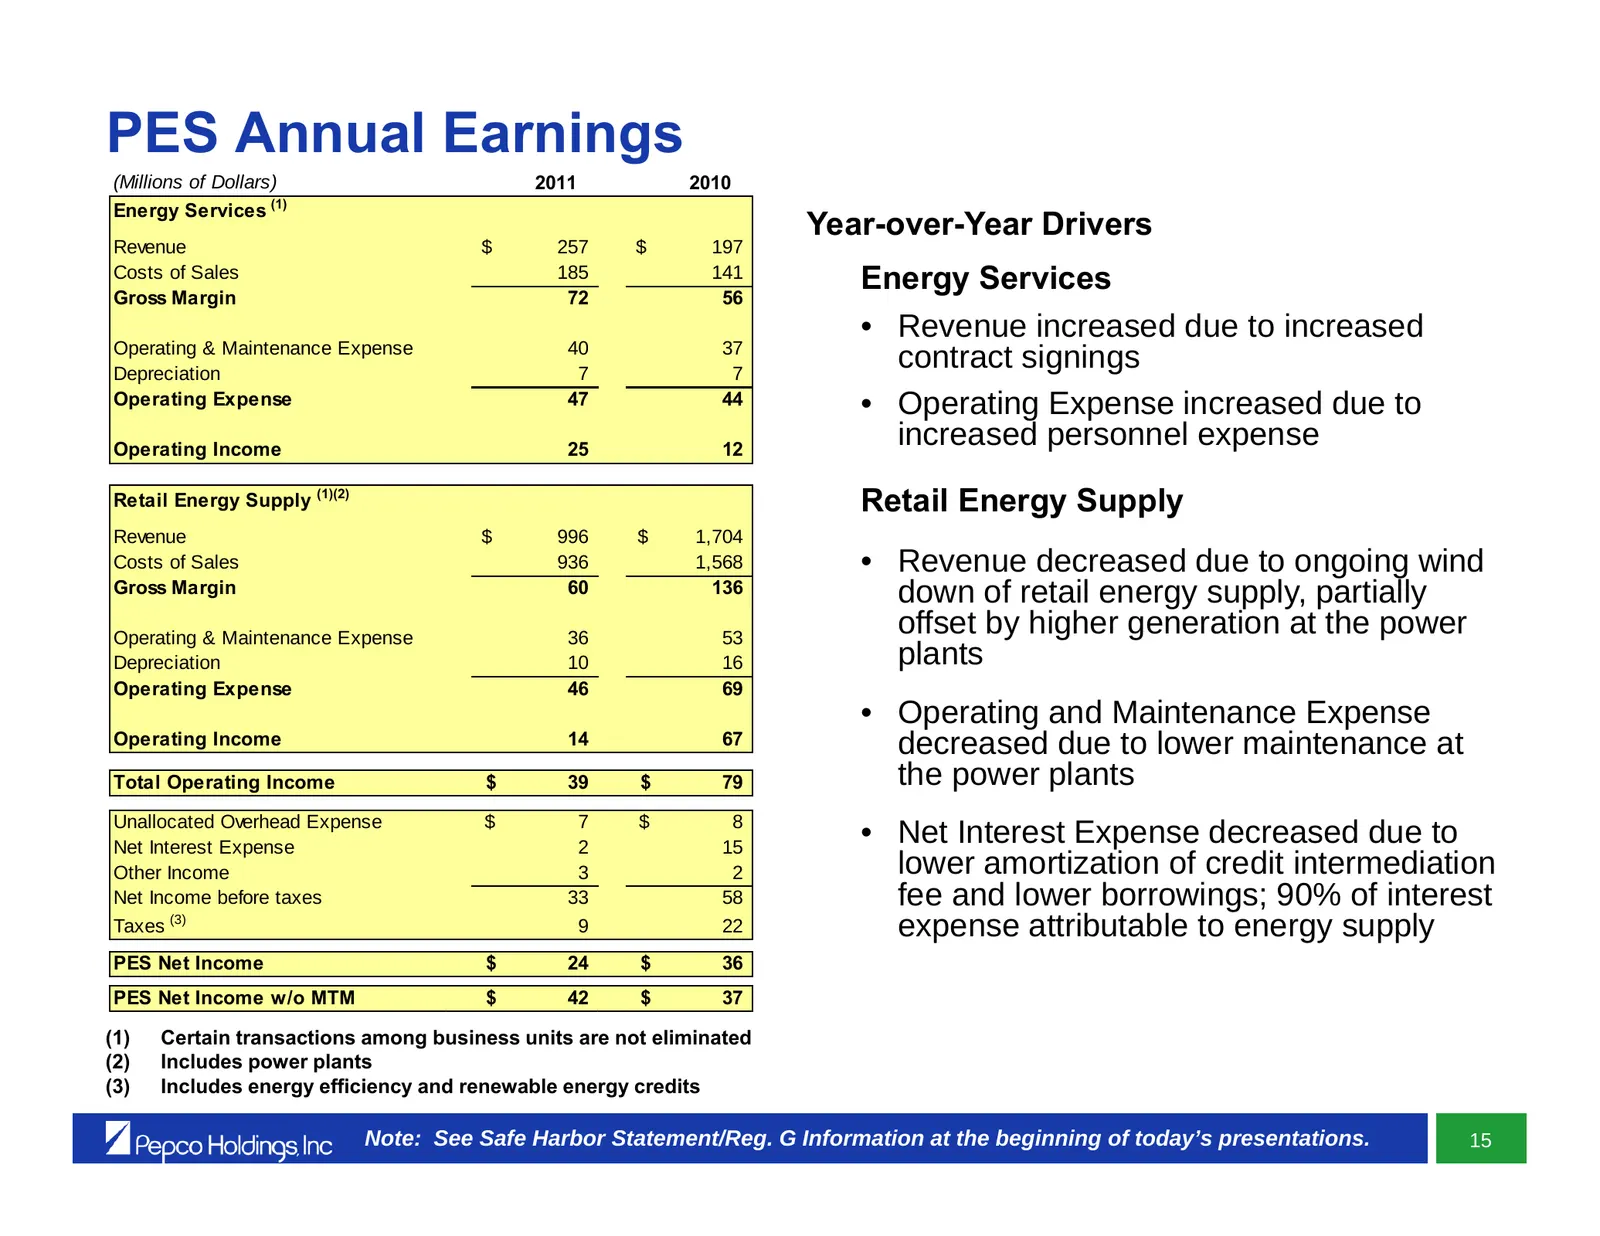
PES Annual Earnings (Millions of Dollars) 2011 2010 Energy Services (1) Year-over-Year Drivers Revenue $ 257 $ 197 Costs of Sales Gross Margin 185 72 141 56 Energy Services • Revenue increased due to increased Operating & Maintenance Expense 40 37 Depreciation 7 7 contract signings Operating Expense
Slide 100: Pepco Energy Services – Energy Services Earnings Components
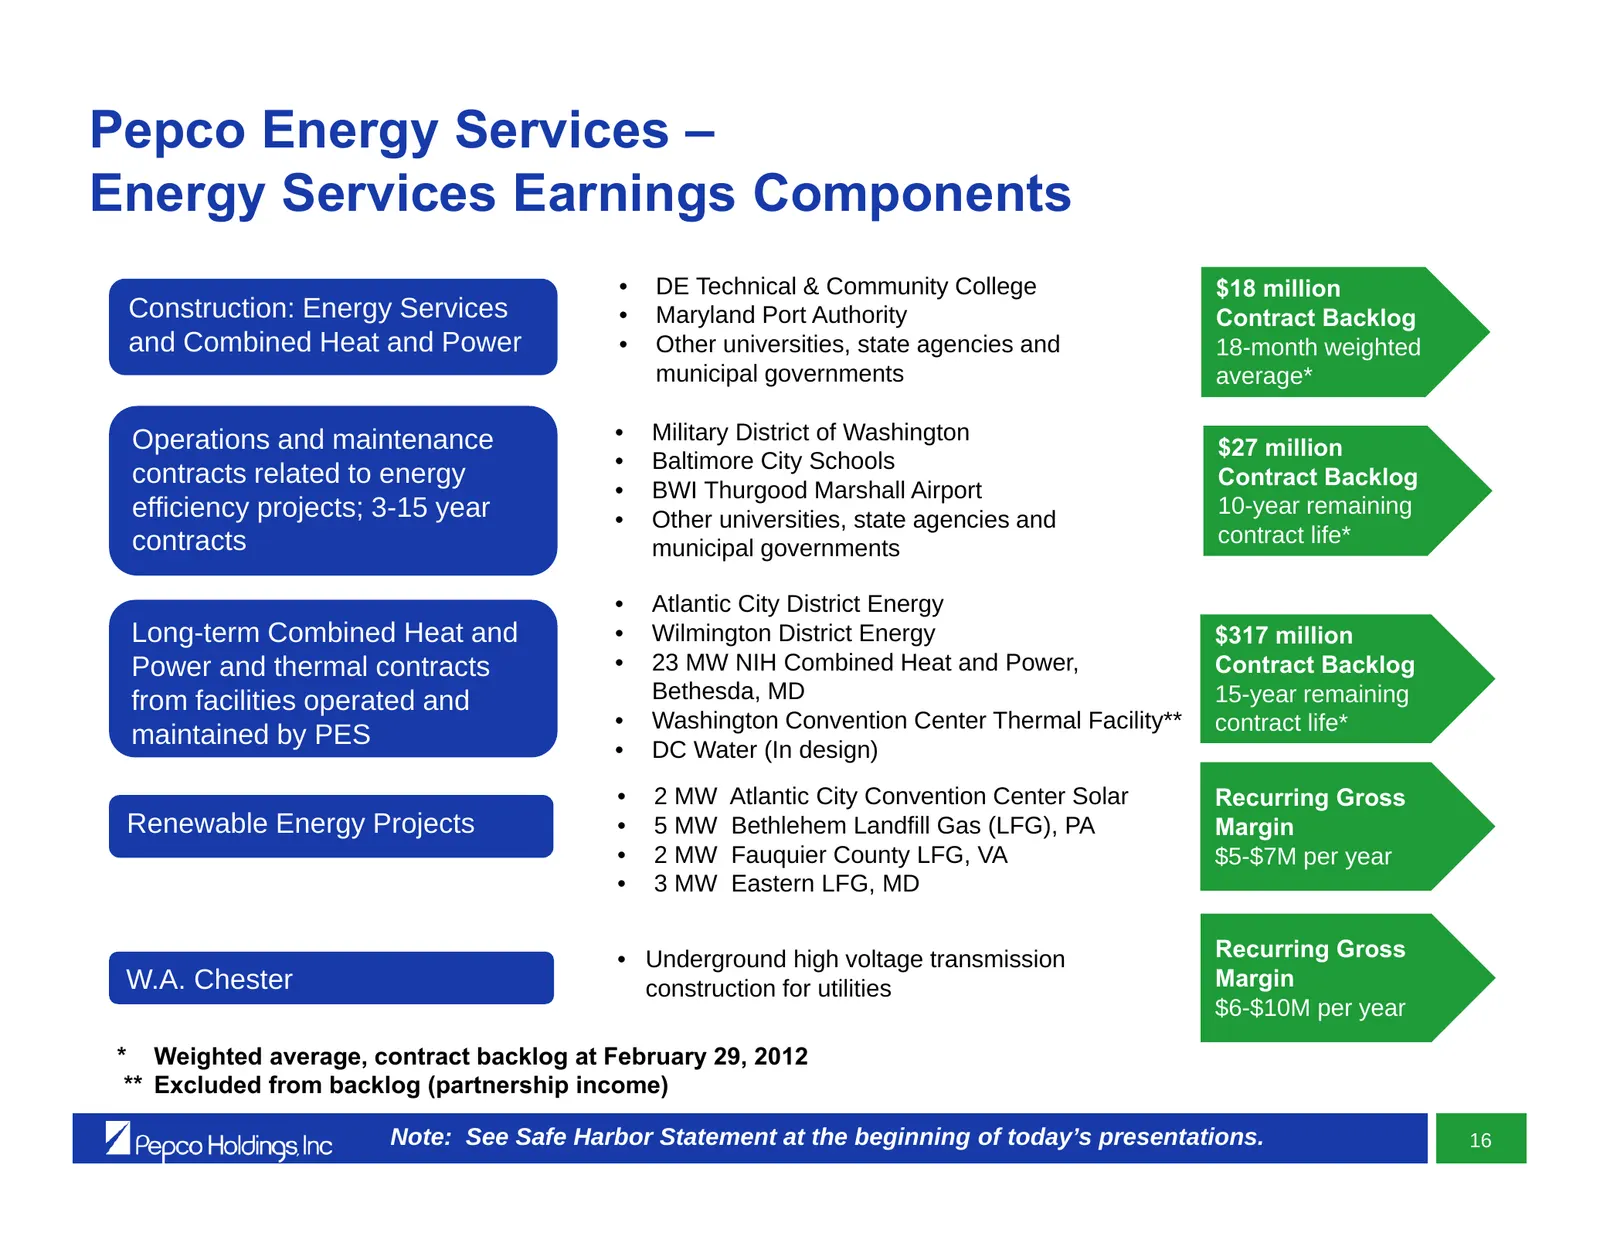
Pepco Energy Services – Energy Services Earnings Components • DE Technical & Community College $18 million Construction: Energy Services • Maryland Port Authority Contract Backlog and Combined Heat and Power • Other universities, state agencies and 18-month weighted municipal governments average* Op

Slide 101: Financial Overview
Financial Overview Tony Kamerick Senior Vice President & Chief Financial Officer
Slide 102: Financial Objectives
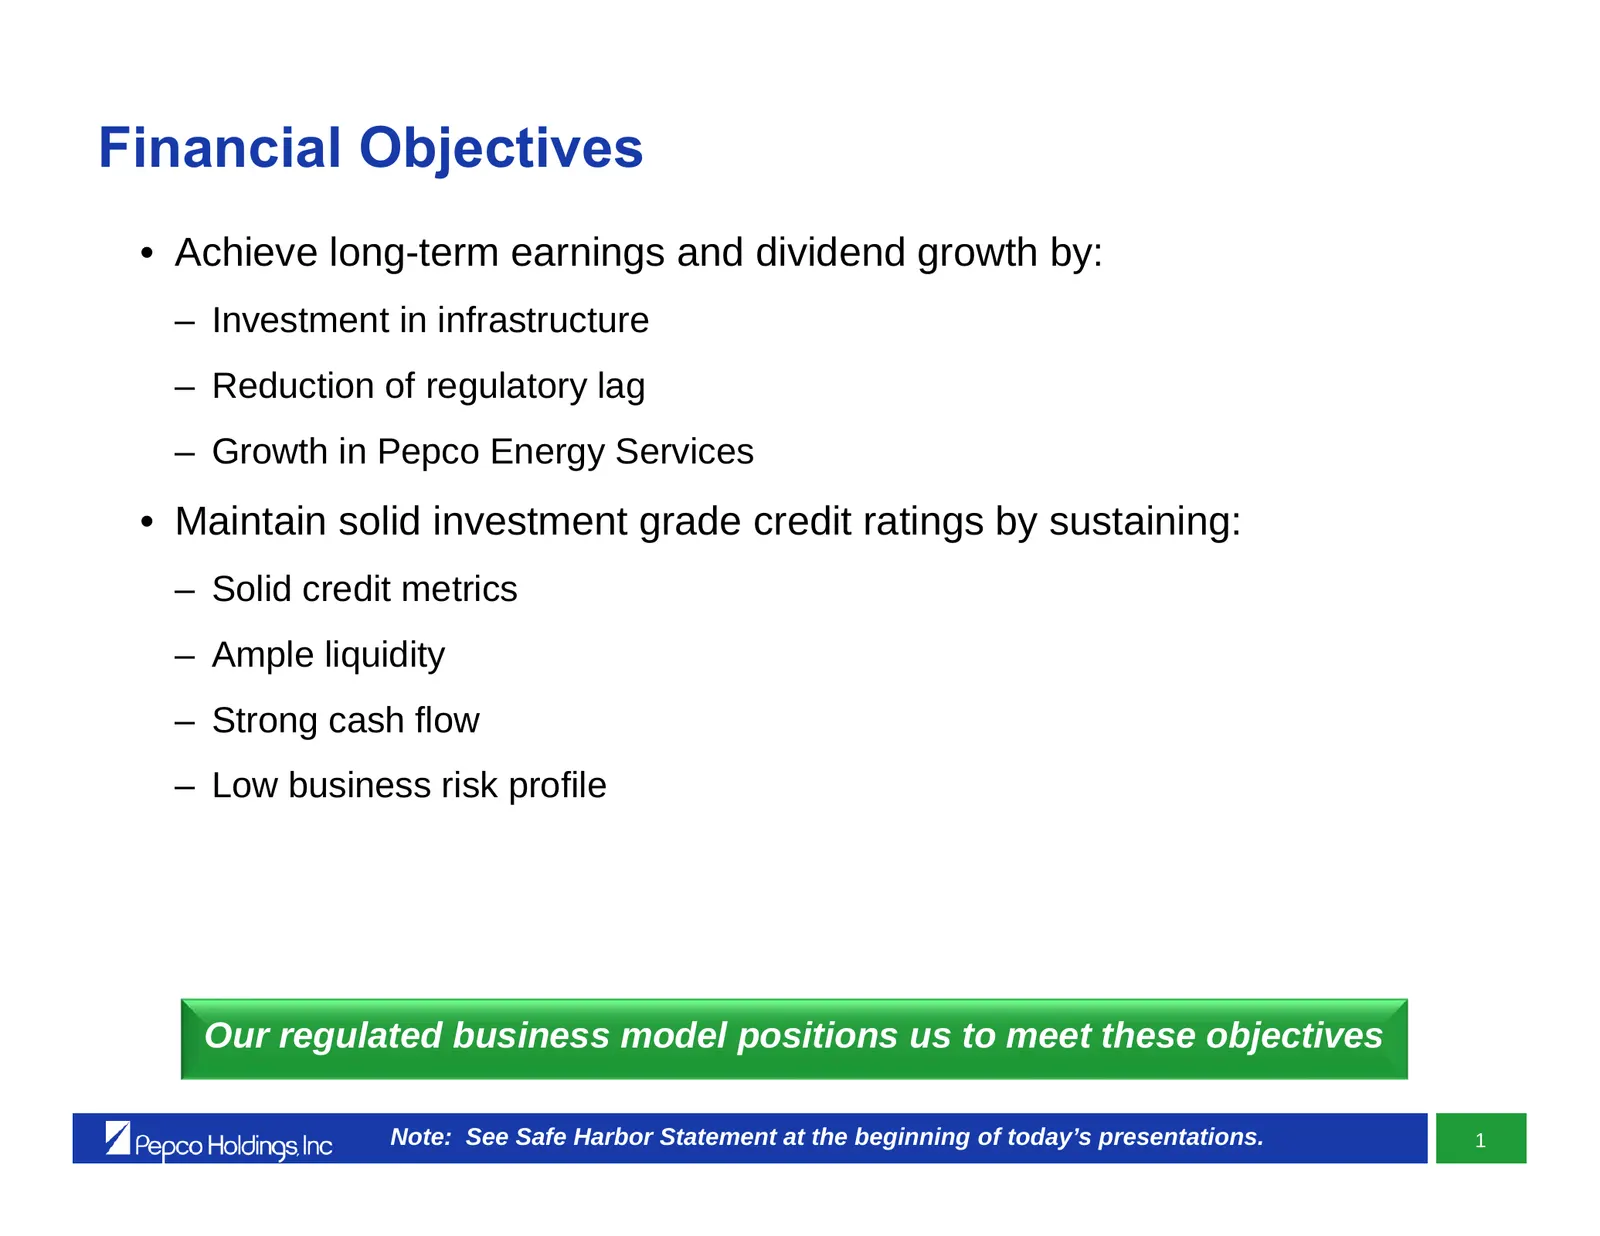
Financial Objectives • Achieve long-term earnings and dividend growth by: – Investment in infrastructure – Reduction of regulatory lag – Growth in Pepco Energy Services • Maintain solid investment grade credit ratings by sustaining: – Solid credit metrics – Ample liquidity – Strong cash flow – Low b
Slide 103: Projected Capital Expenditures – 2012 - 2016
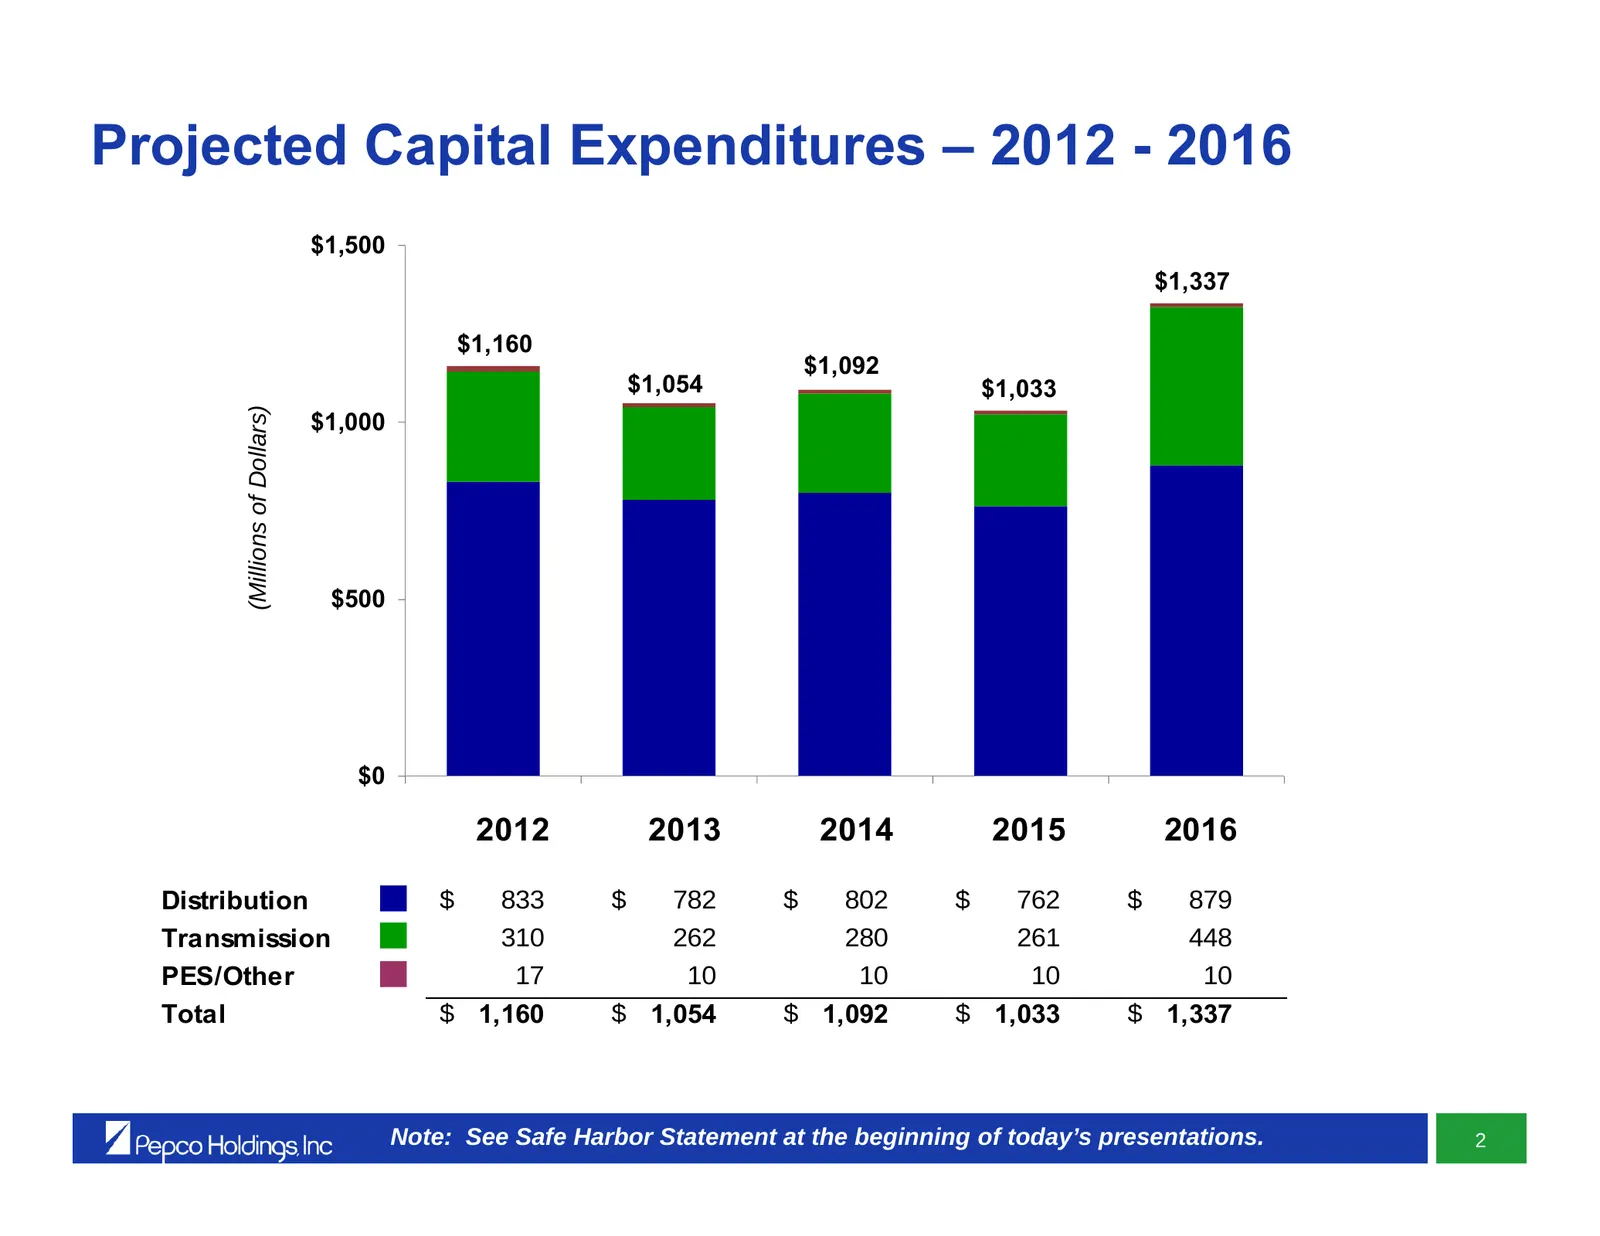
Projected Capital Expenditures – 2012 - 2016 $1,500 $1,337 $1,160 $1,092 $1,054 $1,033 (Millions of Dollars) $1,000 $500 $0 2012 2013 2014 2015 2016 2012 2013 2014 2015 2016 Distribution $ 833 $ 782 $ 802 $ 762 $ 879 Transmission 310 262 280 261 448 PES/Other 17 10 10 10 10 Total $ 1,160 $ 1,0
Slide 104: Infrastructure Investment – The Driver of Growth
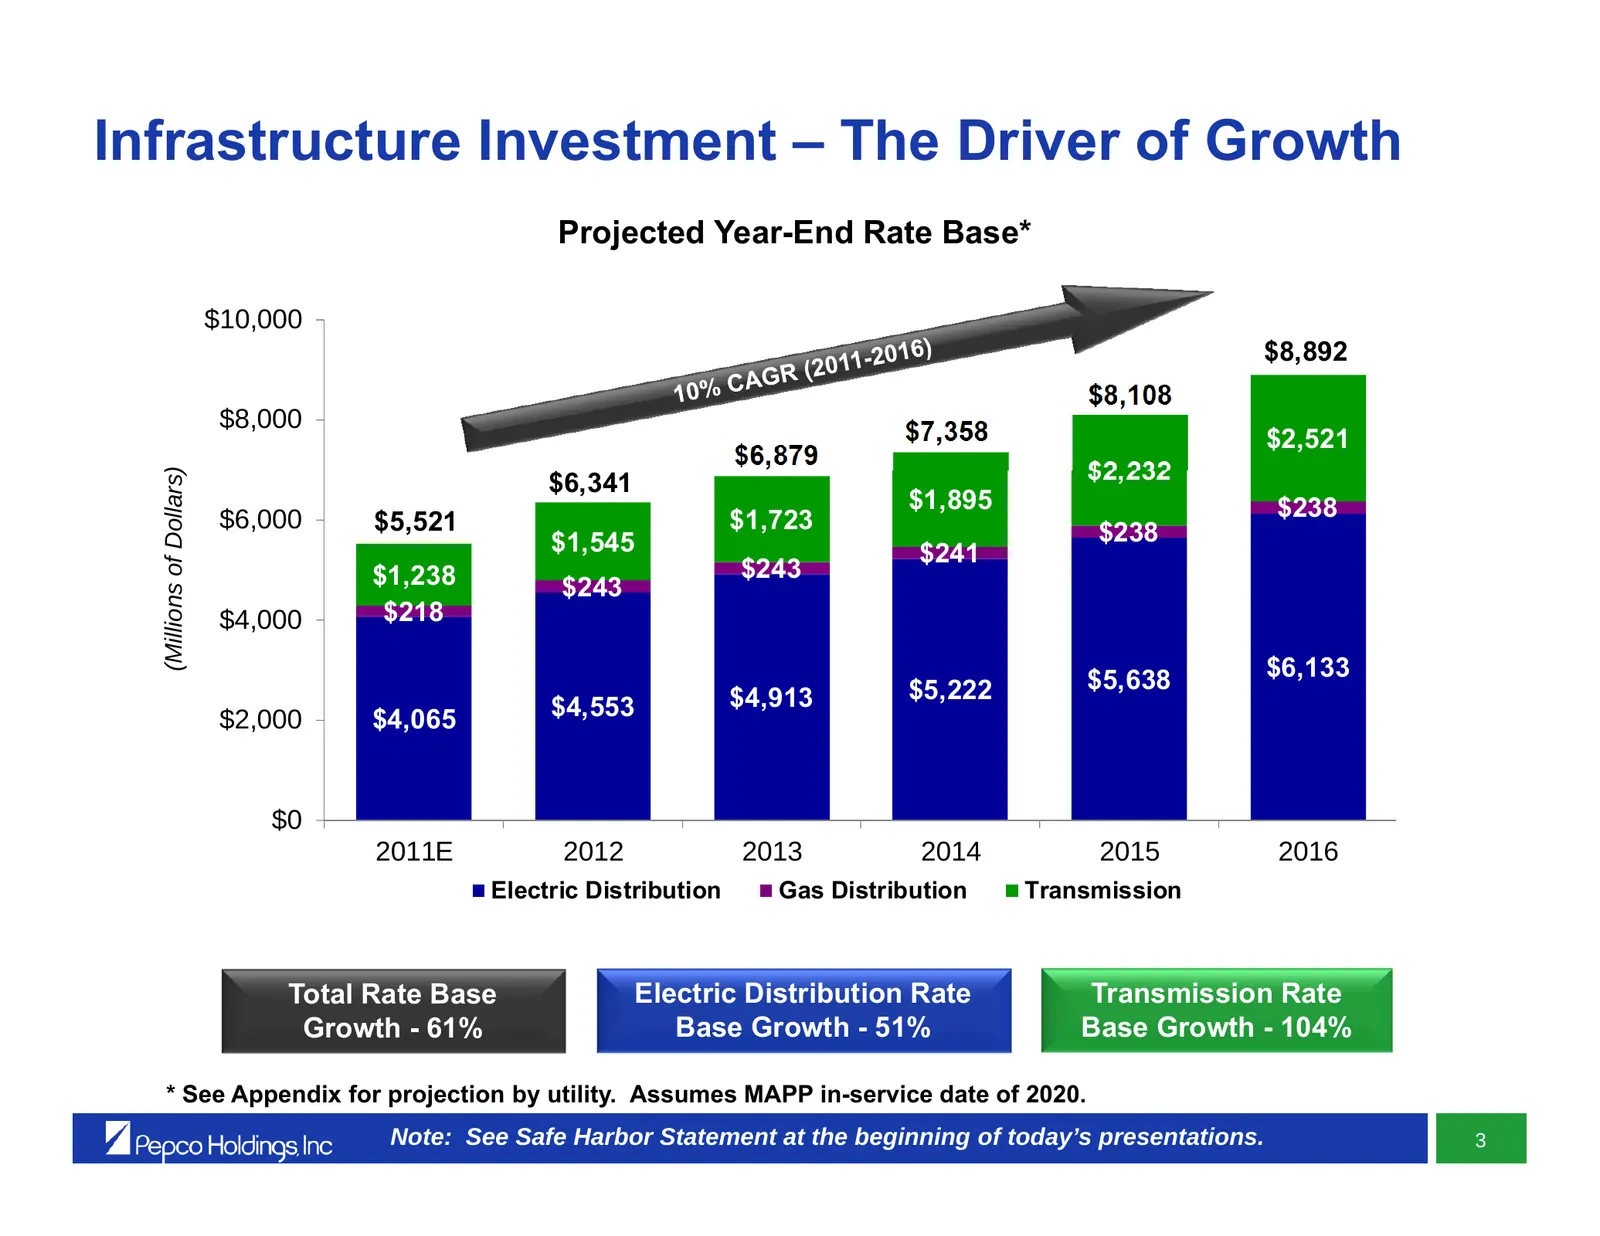
Infrastructure Investment – The Driver of Growth Projected Year-End Rate Base* $10,000 $8,892 $8,108 $8,000 $7,358 $2,521 $6,879 $2,232 (Millions of Dollars) $6,341 $1,895 $238 $6,000 $5,521 $1,723 $238 $1,545 $241 $1,238 $243 $243 $4,000 $218 $5,638 $6,133 $4,913 $5,222 $2,000 $4,065 $4,553 $0 2011
Slide 105: Transmission Rate Base and Earnings
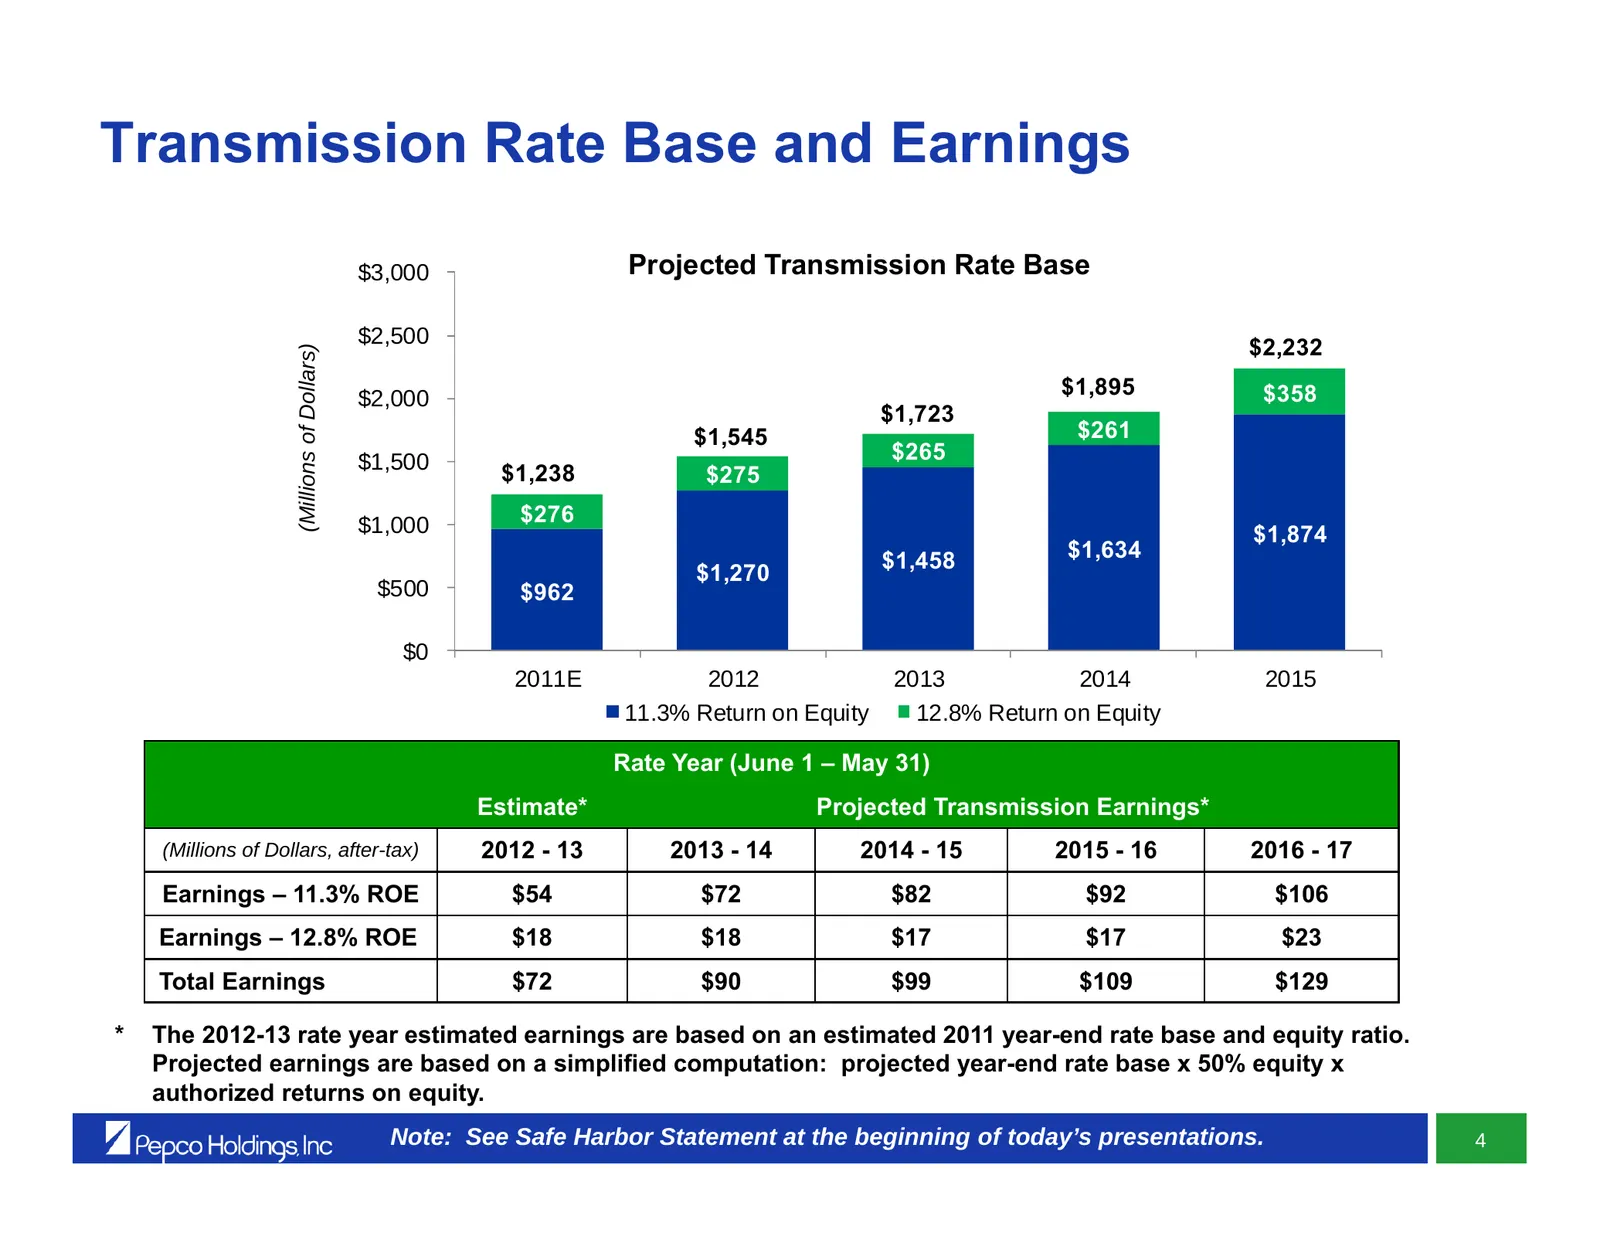
Transmission Rate Base and Earnings $3,000 Projected Transmission Rate Base $2,500 $2,232 (Millions of Dollars) $1,895 $358 $2,000 $1,723 $1,545 $261 $1,500 $265 $1,238 $275 $1,000 $276 $1,874 $1,458 $1,634 $1,270 $500 $962 $0 2011E 2012 2013 2014 2015 11.3% Return on Equity 12.8% Return on Equity R
Slide 106: Strengthened Credit Profile
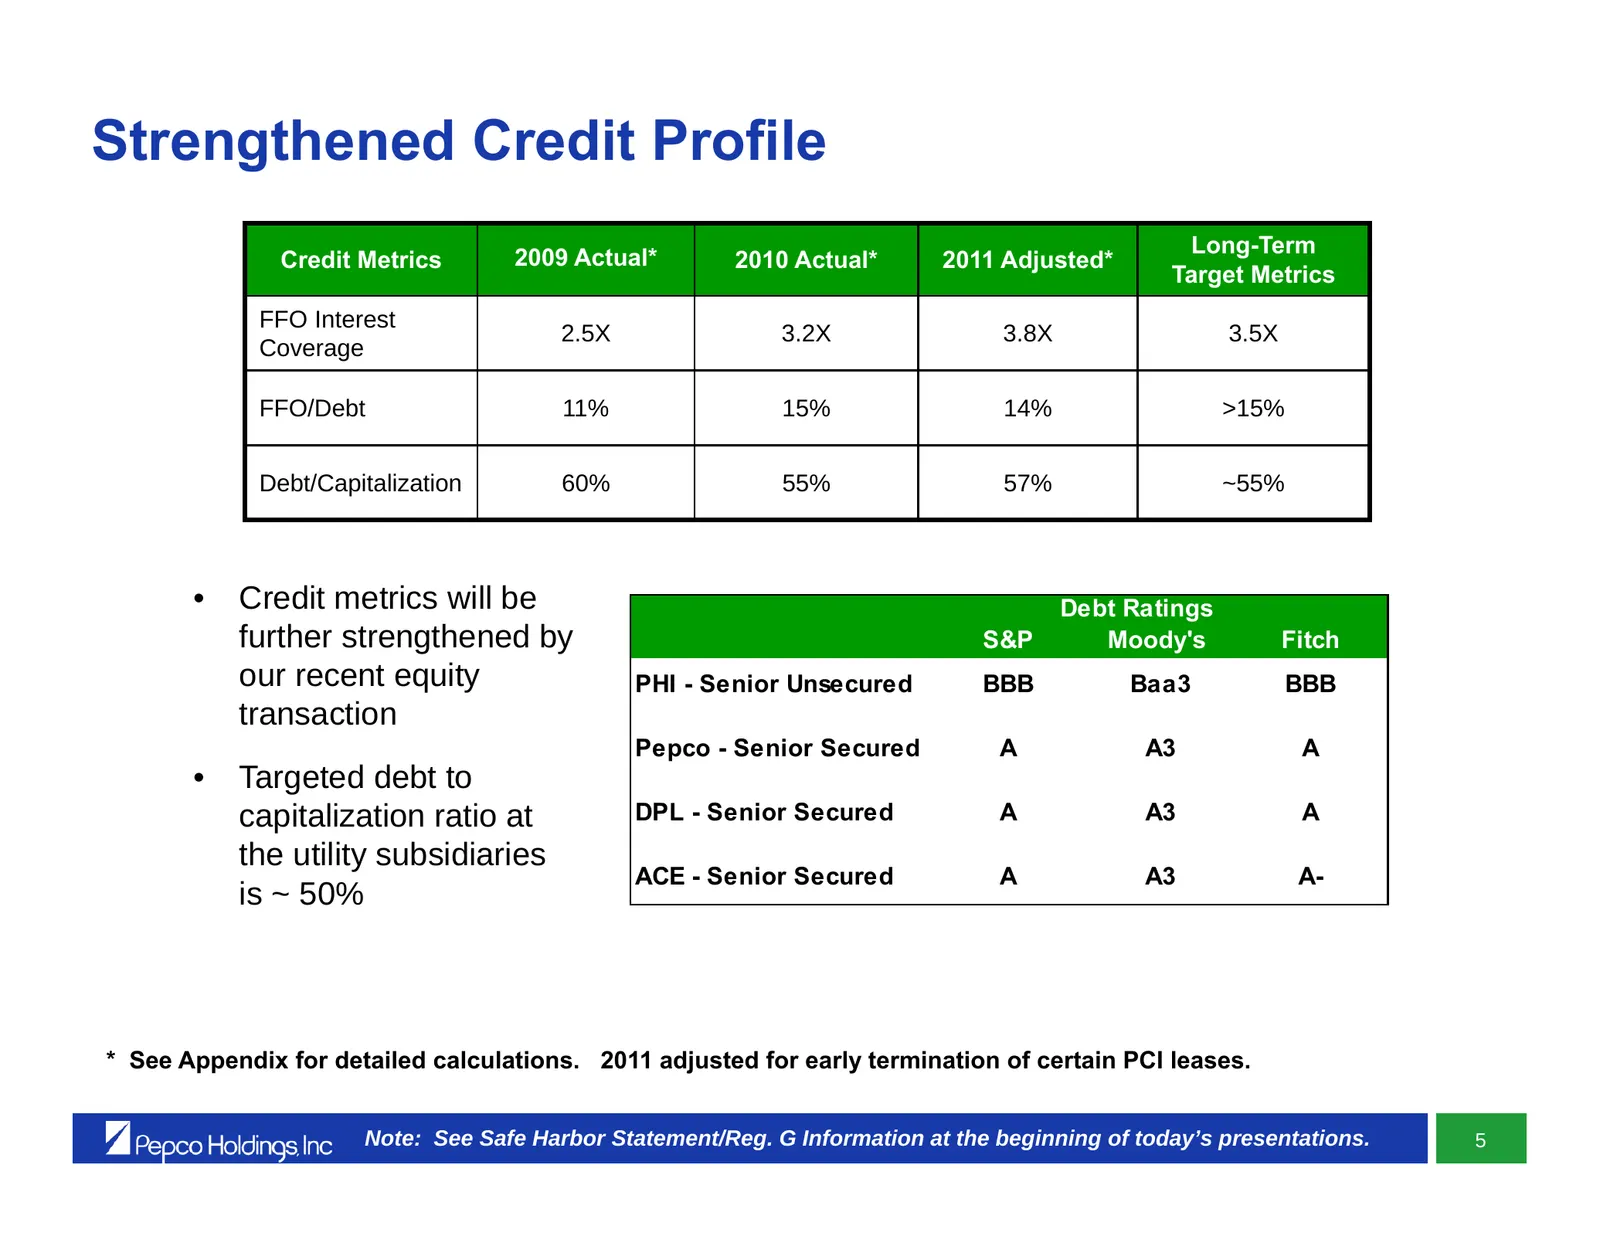
Strengthened Credit Profile Long-Term Credit Metrics 2009 Actual* 2010 Actual* 2011 Adjusted* Target Metrics FFO Interest 2.5X 3.2X 3.8X 3.5X Coverage FFO/Debt 11% 15% 14% >15% Debt/Capitalization 60% 55% 57% ~55% • Credit metrics will be Debt Ratings further strengthened by S&P Moody's Fitch our re
Slide 107: Liquidity Position
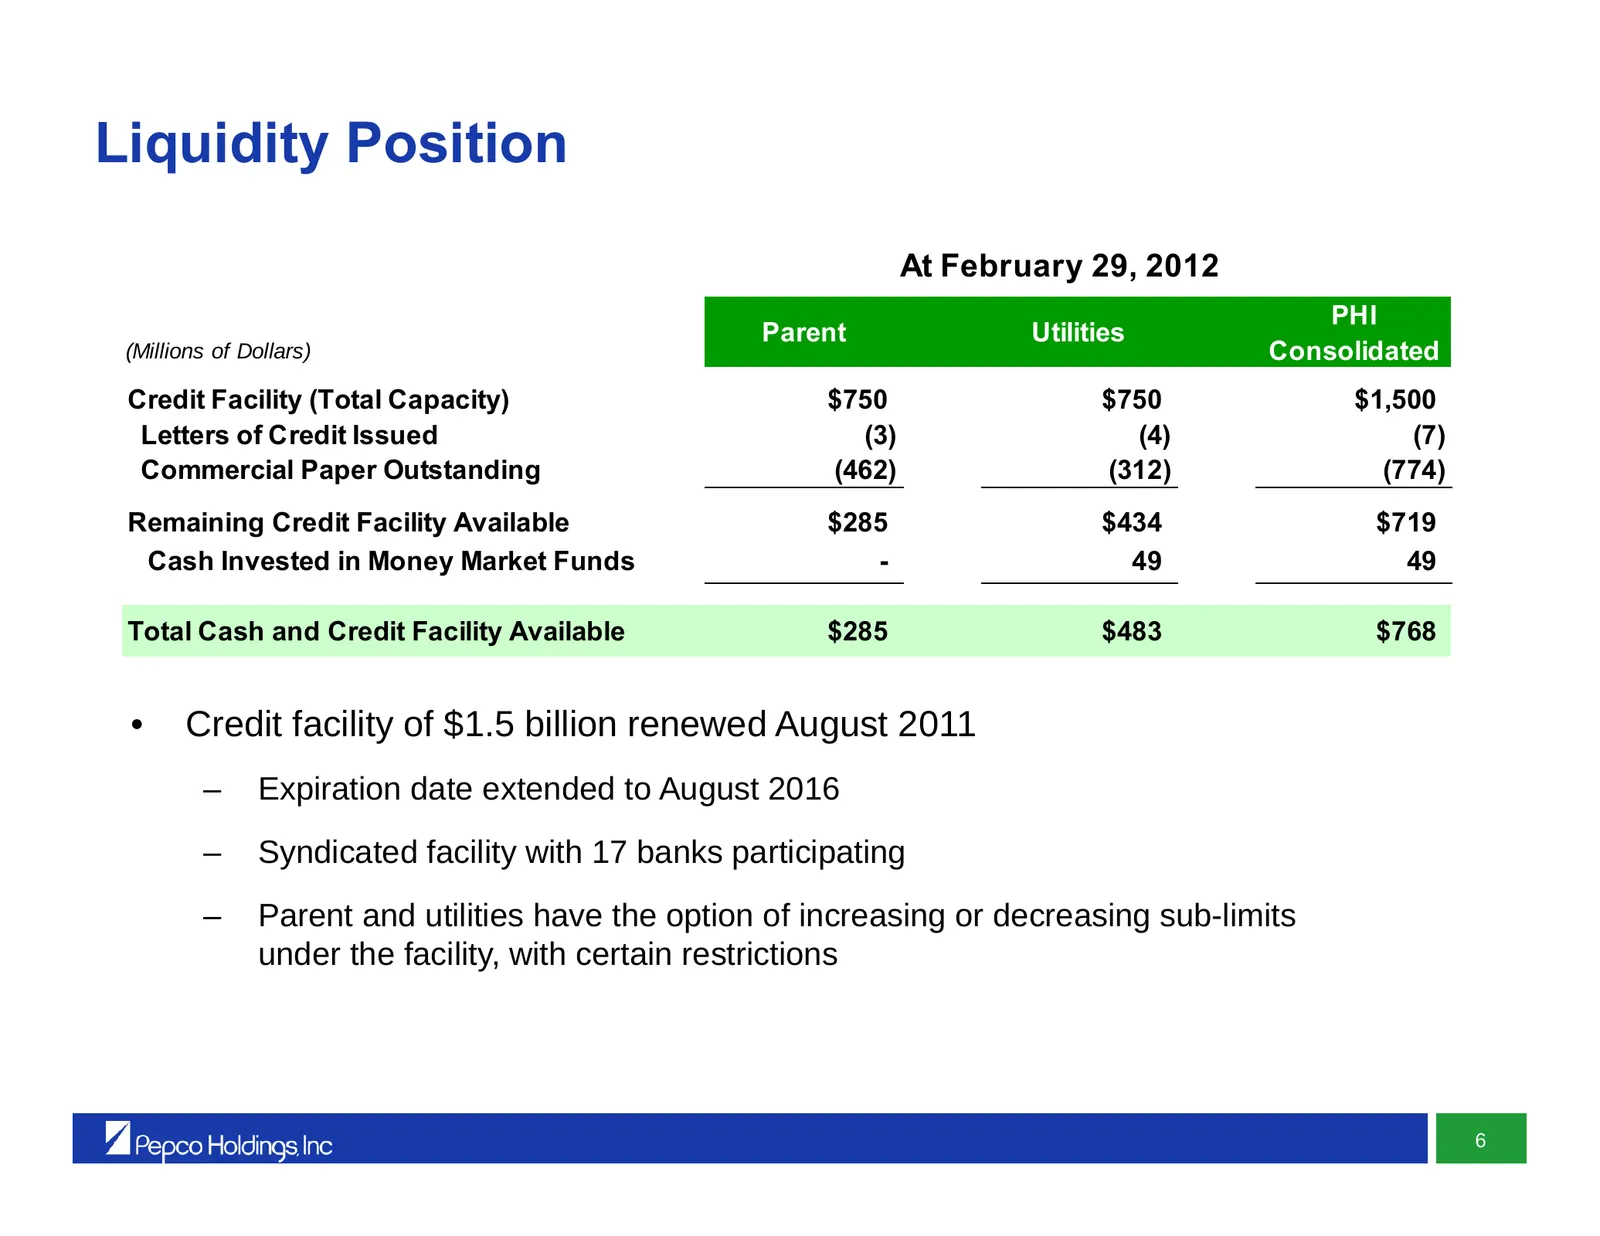
Liquidity Position At February 29, 2012 PHI Parent Utilities (Millions of Dollars) Consolidated Credit Facility (Total Capacity) $750 $750 $1,500 Letters of Credit Issued (3) (4) (7) Commercial Paper Outstanding (462) (312) (774) Remaining Credit Facility Available $285 $434 $719 Cash Invested in Mo
Slide 108: 2012 Financing Activity
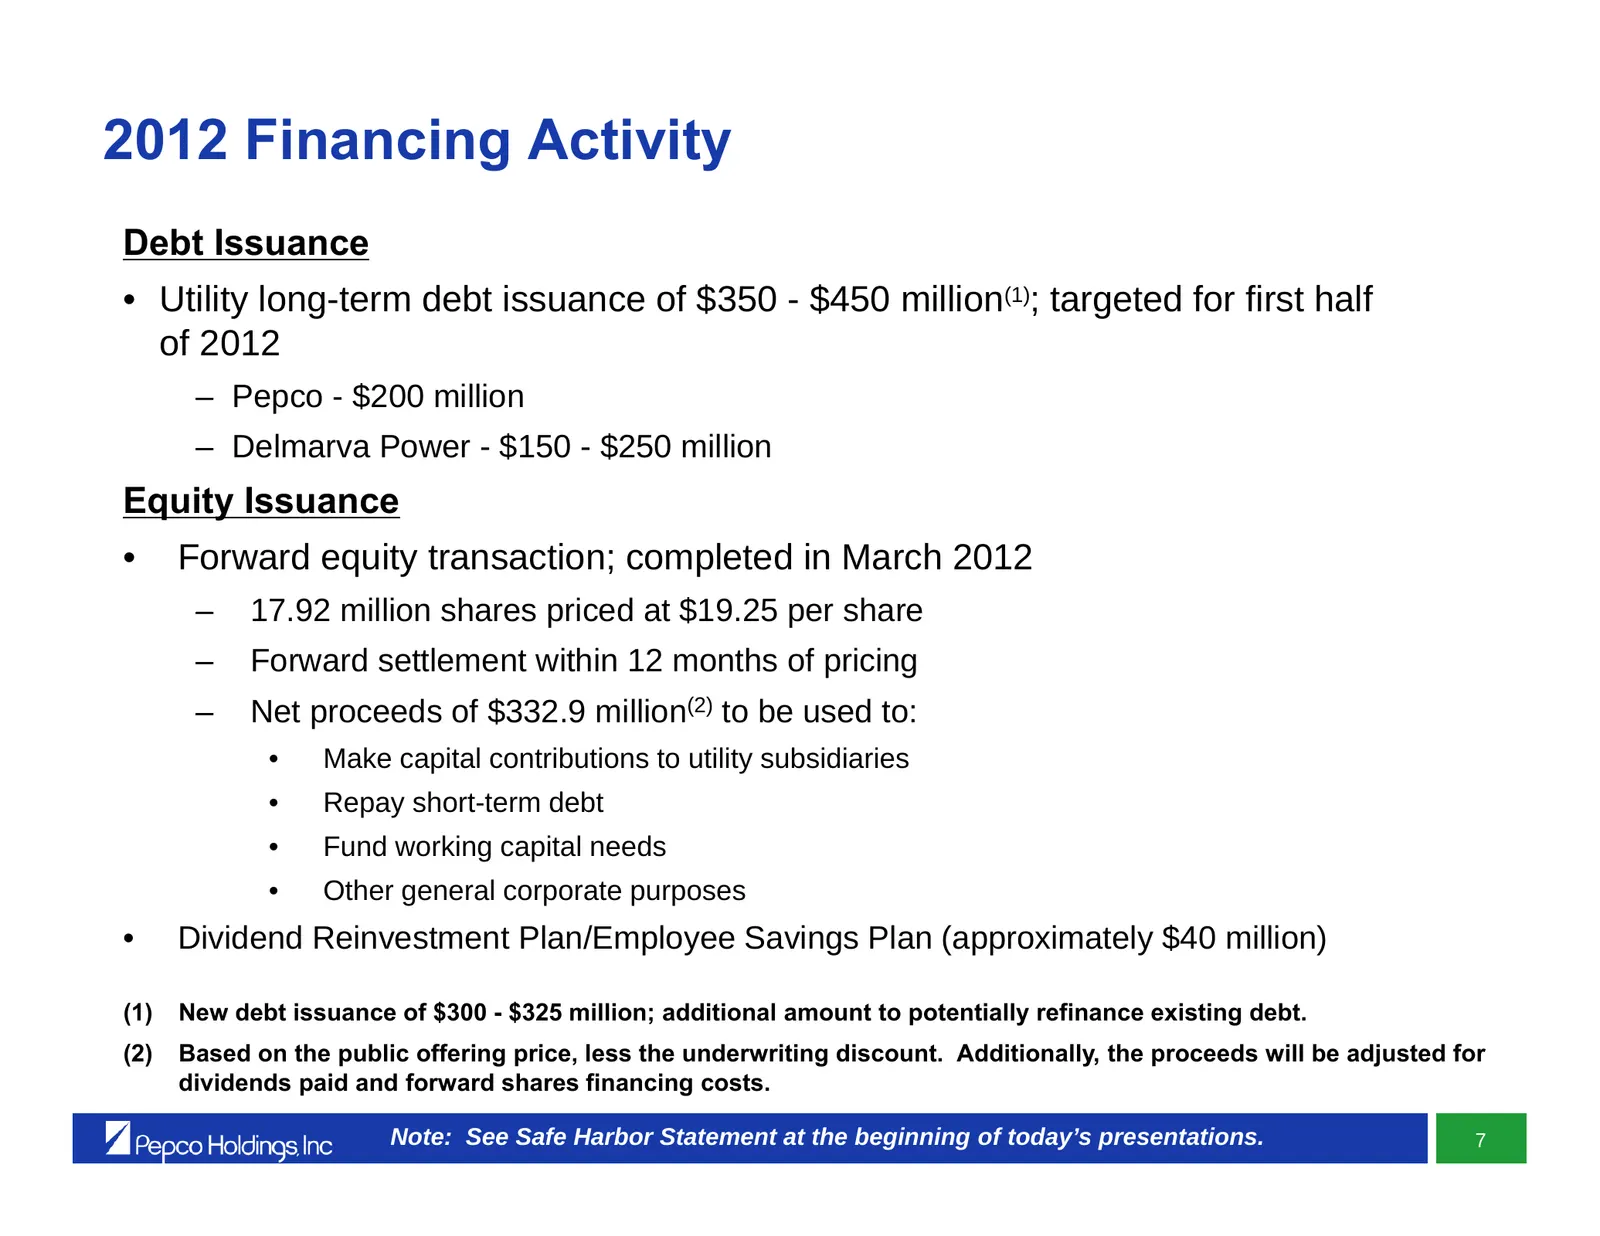
2012 Financing Activity Debt Issuance • Utility long-term debt issuance of $350 - $450 million(1); targeted for first half of 2012 – Pepco - $200 million – Delmarva Power - $150 - $250 million Equity Issuance • Forward equity transaction; completed in March 2012 – 17.92 million shares priced at $19.
Slide 109: Manageable Debt Maturity Schedule
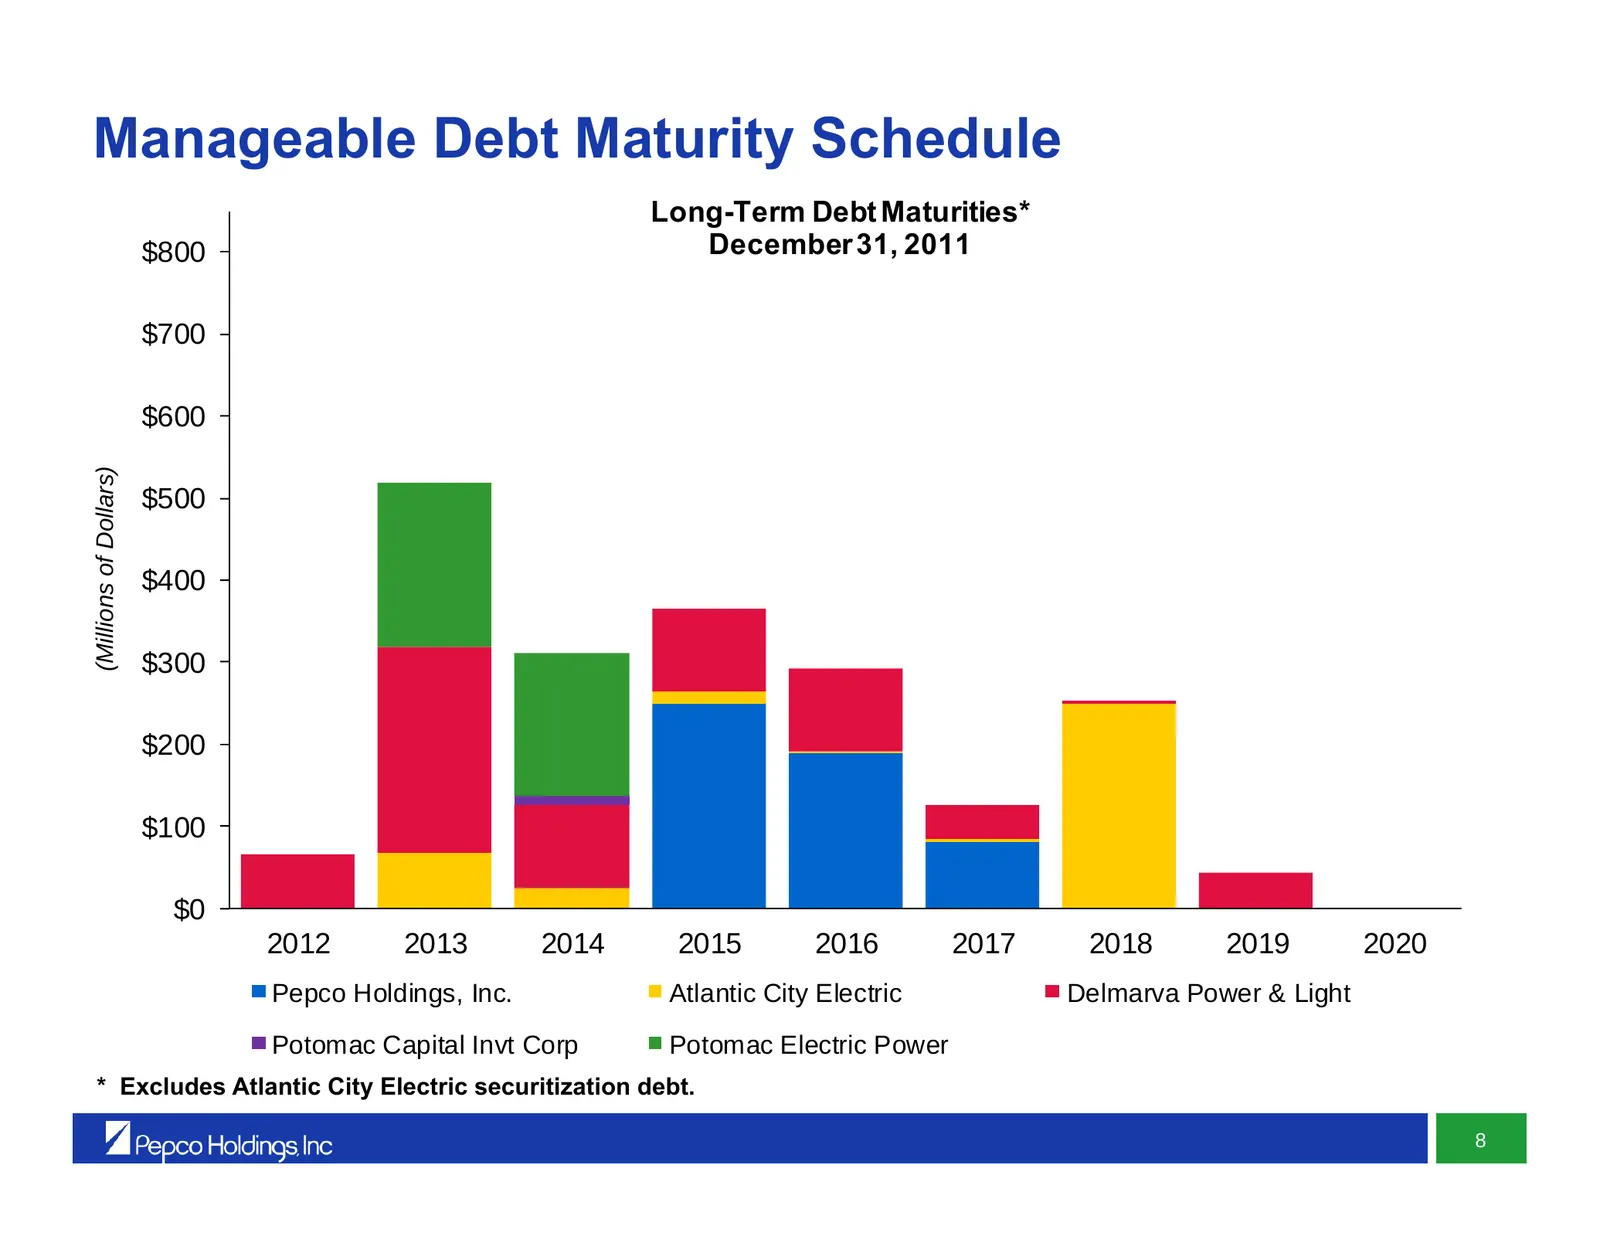
Manageable Debt Maturity Schedule Long-Term Debt Maturities* $800 December 31, 2011 $700 $600 (Millions of Dollars) $500 $400 $300 $200 $100 $0 2012 2013 2014 2015 2016 2017 2018 2019 2020 Pepco Holdings, Inc. Atlantic City Electric Delmarva Power & Light Potomac Capital Invt Corp Potomac Electric P
Slide 110: Principal Sources & Uses of Cash
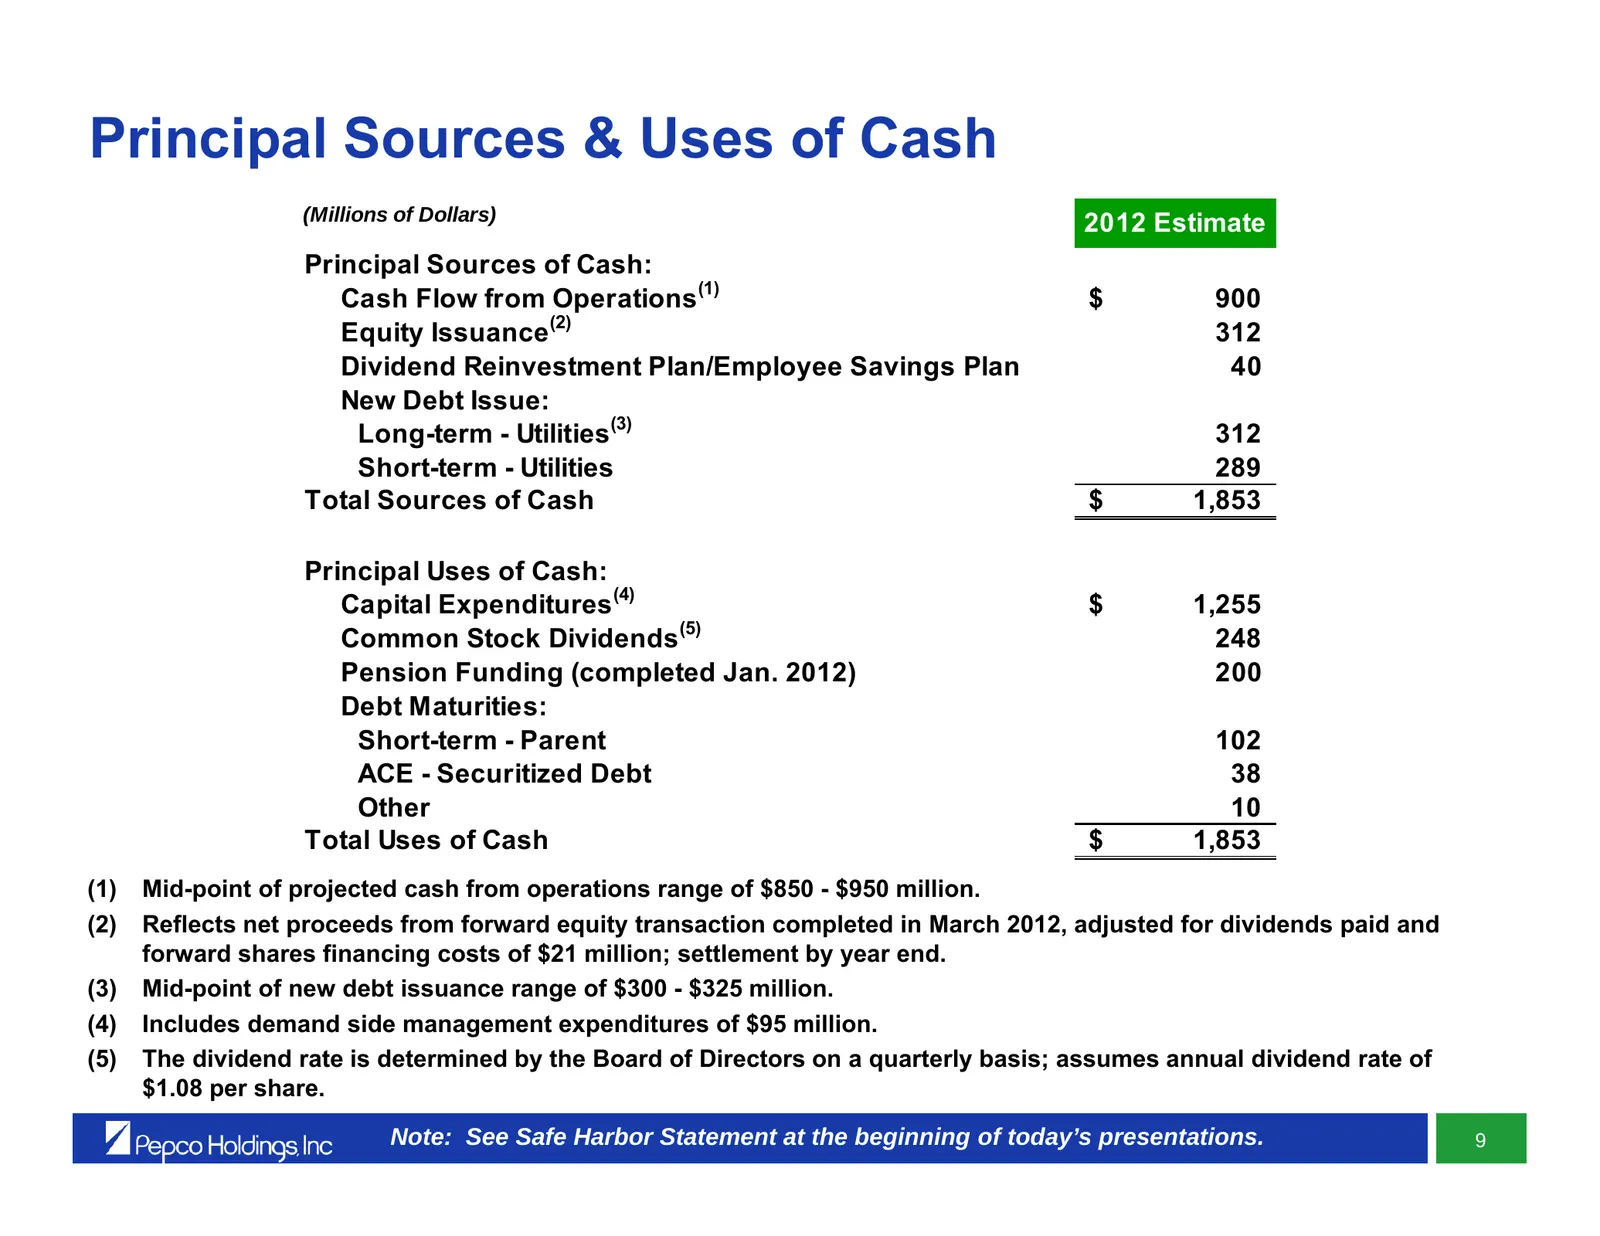
Principal Sources & Uses of Cash (Millions of Dollars) 2012 Estimate Principal Sources of Cash: (1) Cash Flow from Operations $ 900 (2) Equity Issuance 312 Dividend Reinvestment Plan/Employee Savings Plan 40 New Debt Issue: (3) Long-term - Utilities 312 Short-term - Utilities 289 Total Sources of Ca
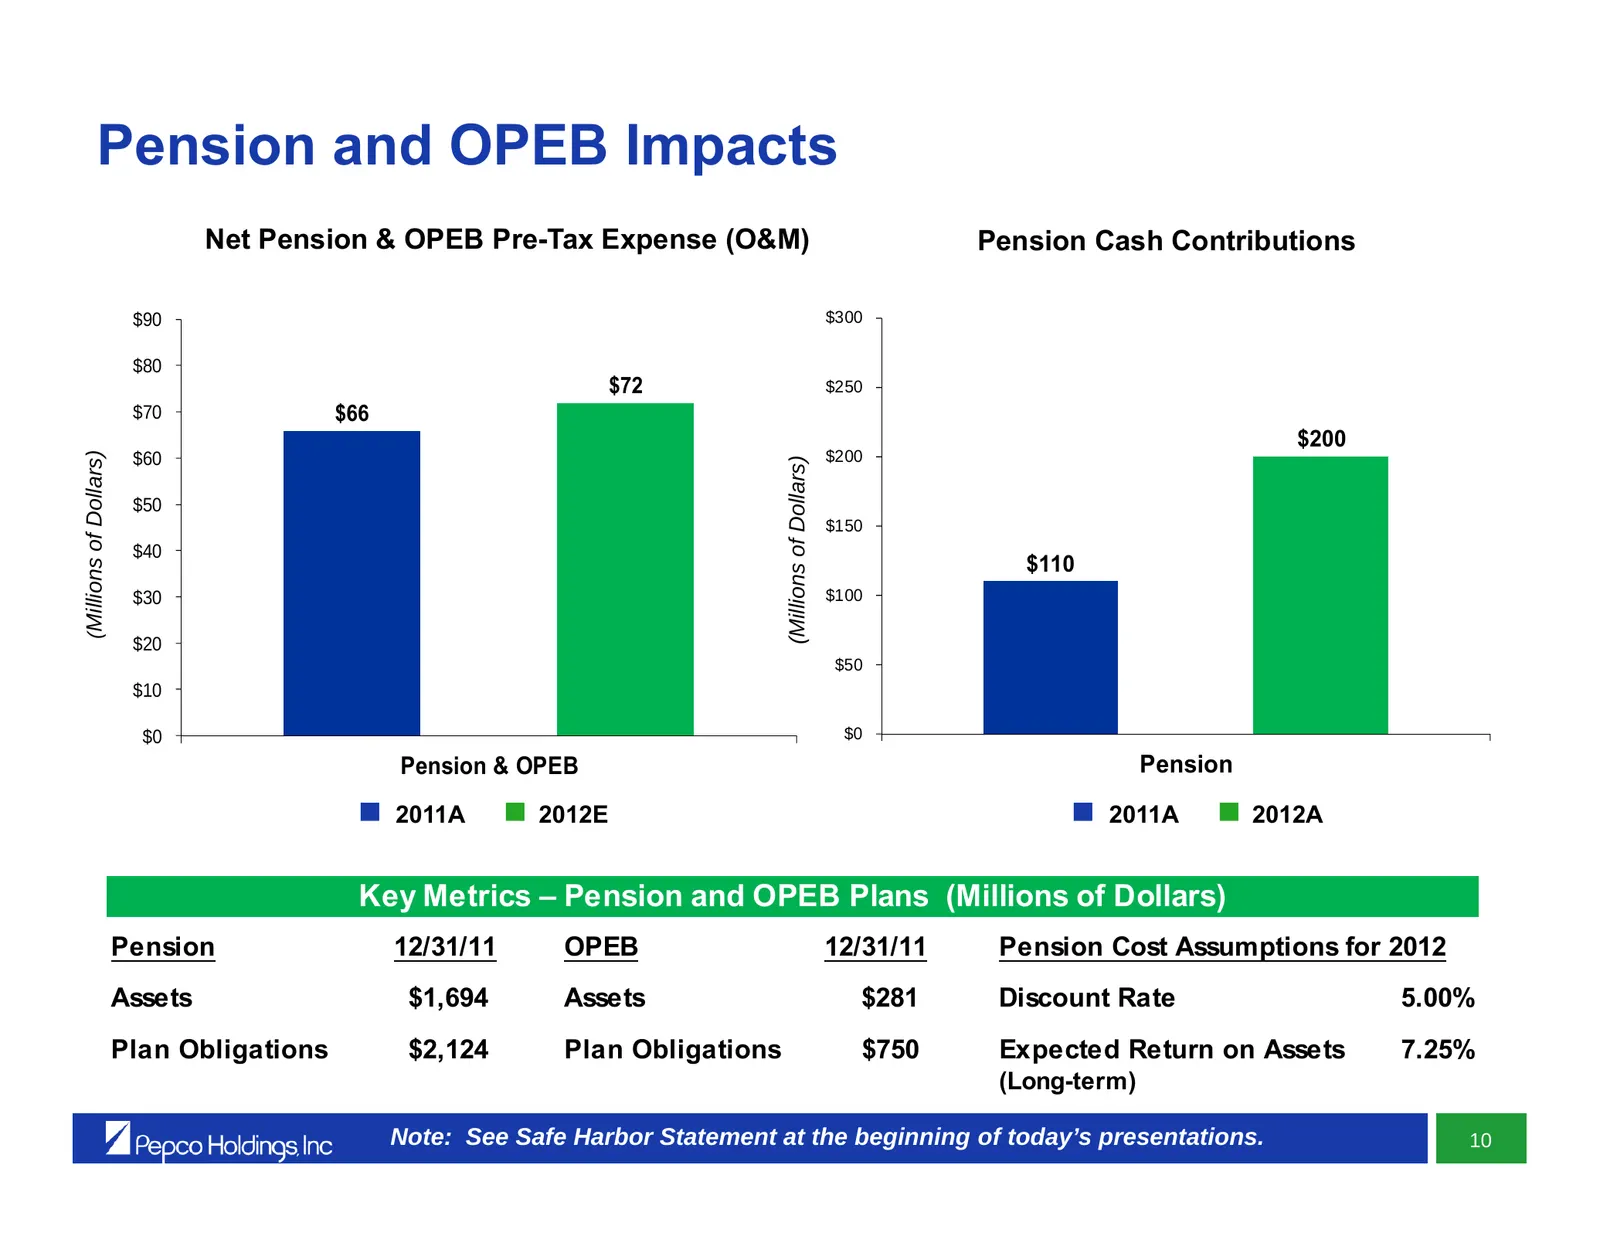
Slide 111: Pension and OPEB Impacts
Pension and OPEB Impacts Net Pension & OPEB Pre-Tax Expense (O&M) Pension Cash Contributions $90 $300 $80 $72 $250 $70 $66 $200 $200 (Millions of Dollars) $60 (Millions of Dollars) $50 $150 $40 $110 $30 $100 $20 $50 $10 $0 $0 Pension & OPEB Pension ■ 2011A ■ 2012E ■ 2011A ■ 2012A Key Metrics – Pensi
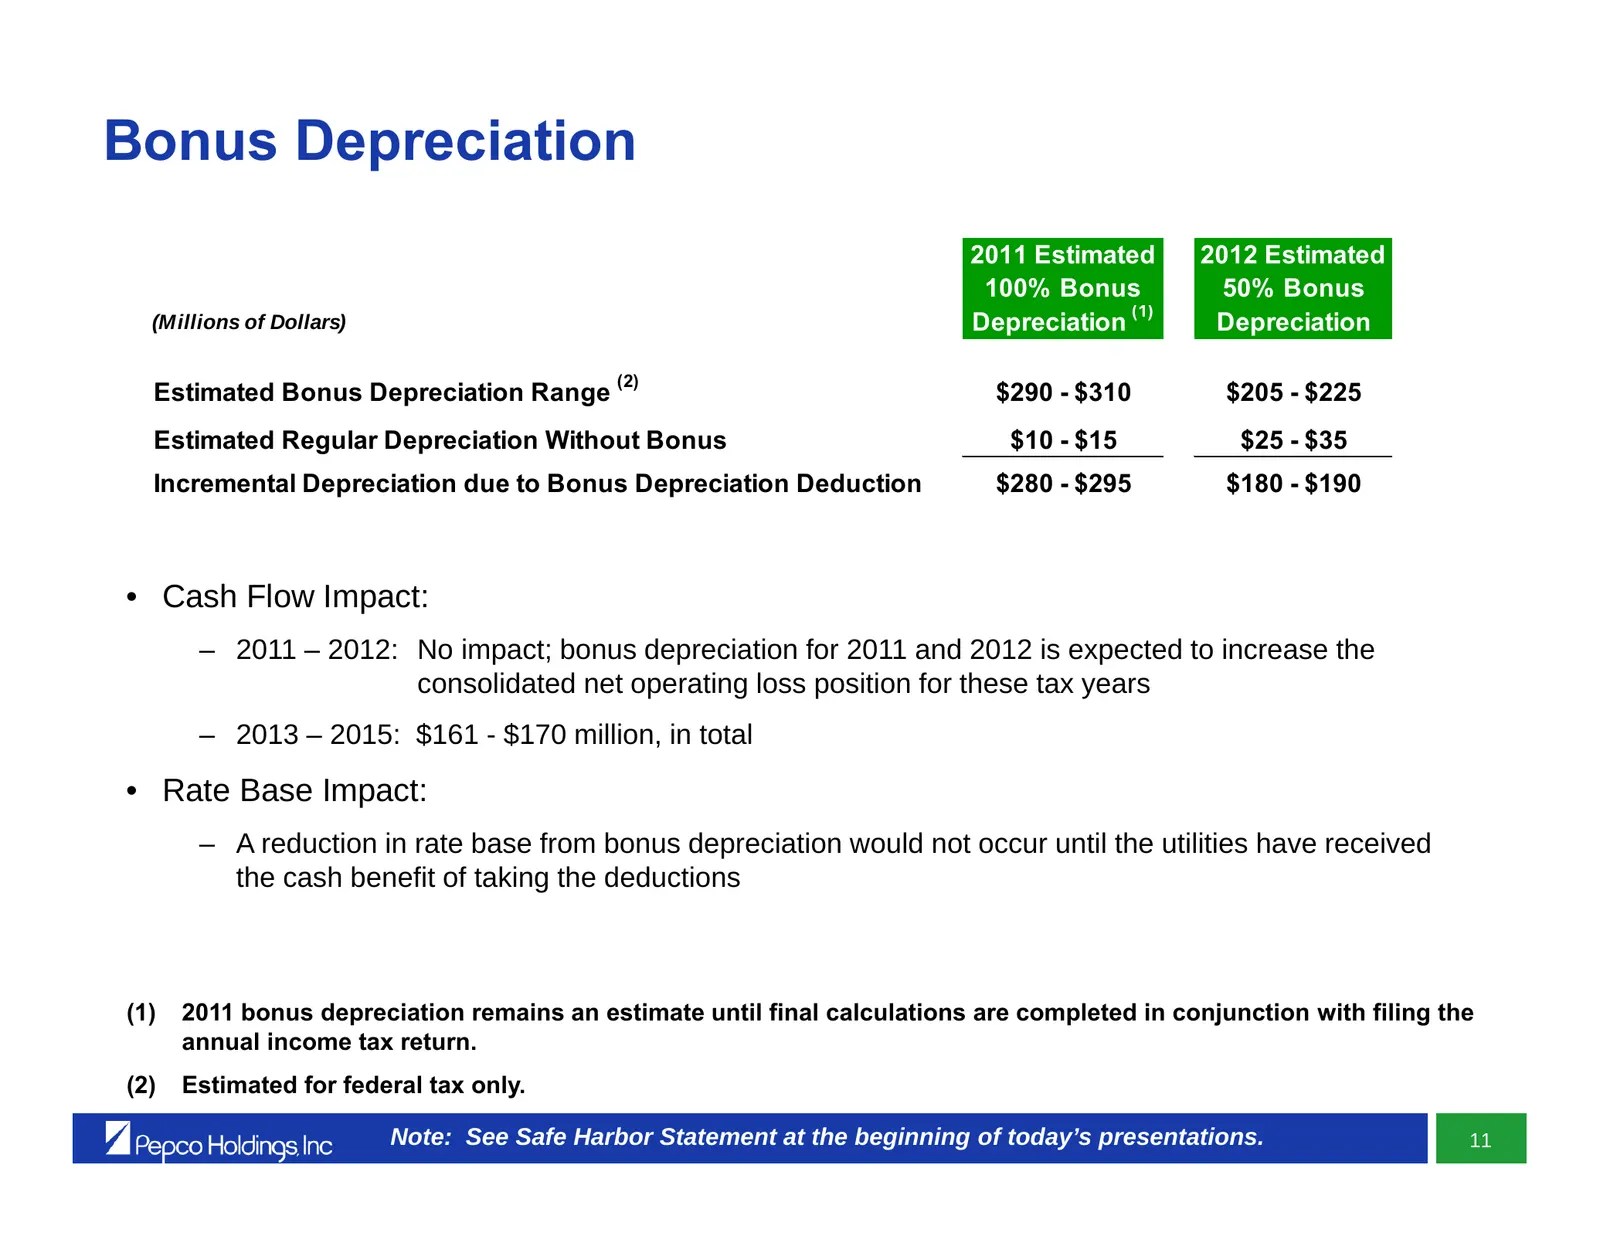
Slide 112: Bonus Depreciation
Bonus Depreciation 2011 Estimated 2012 Estimated 100% Bonus 50% Bonus (1) (Millions of Dollars) Depreciation Depreciation (2) Estimated Bonus Depreciation Range $290 - $310 $205 - $225 Estimated Regular Depreciation Without Bonus $10 - $15 $25 - $35 Incremental Depreciation due to Bonus Depreciation
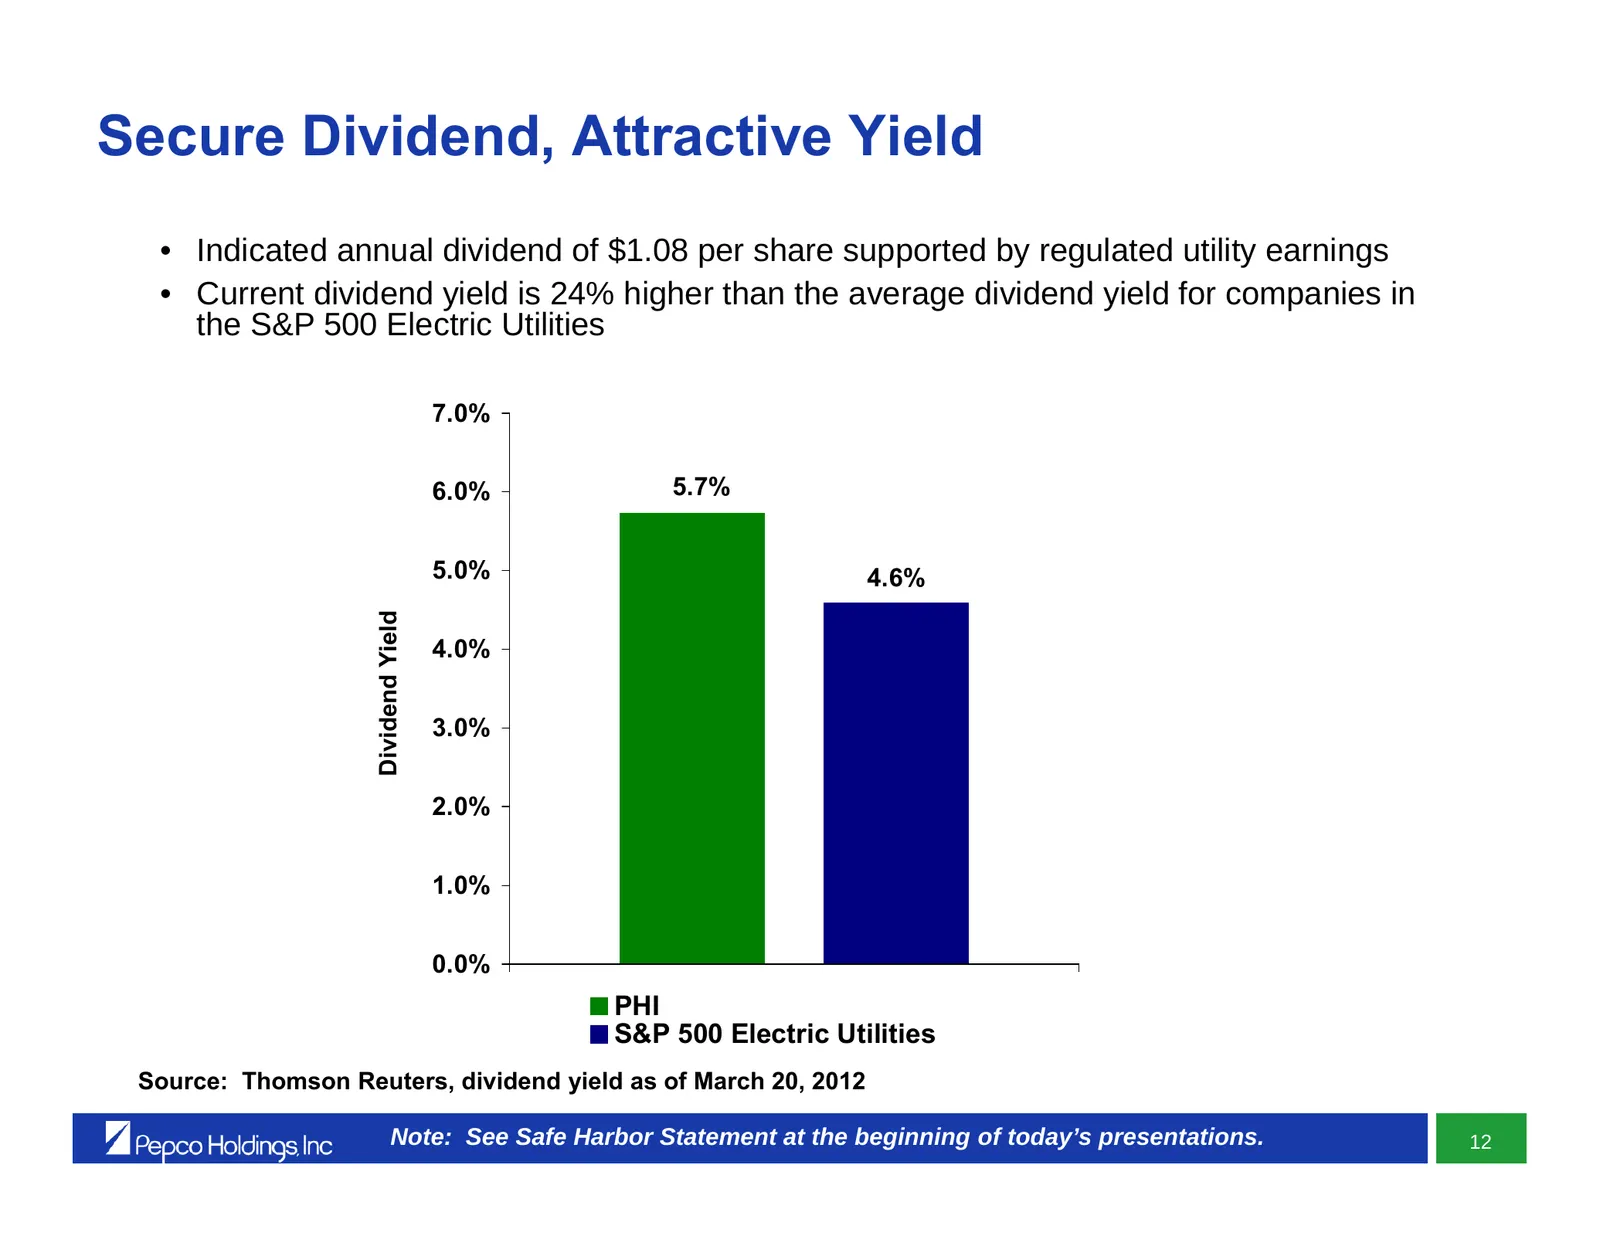
Slide 113: Secure Dividend, Attractive Yield
Secure Dividend, Attractive Yield • Indicated annual dividend of $1.08 per share supported by regulated utility earnings • Current dividend yield is 24% higher than the average dividend yield for companies in the S&P 500 Electric Utilities 7.0% 6.0% 5.7% 5.0% 4.6% Dividend Yield 4.0% 3.0% 2.0% 1.0%
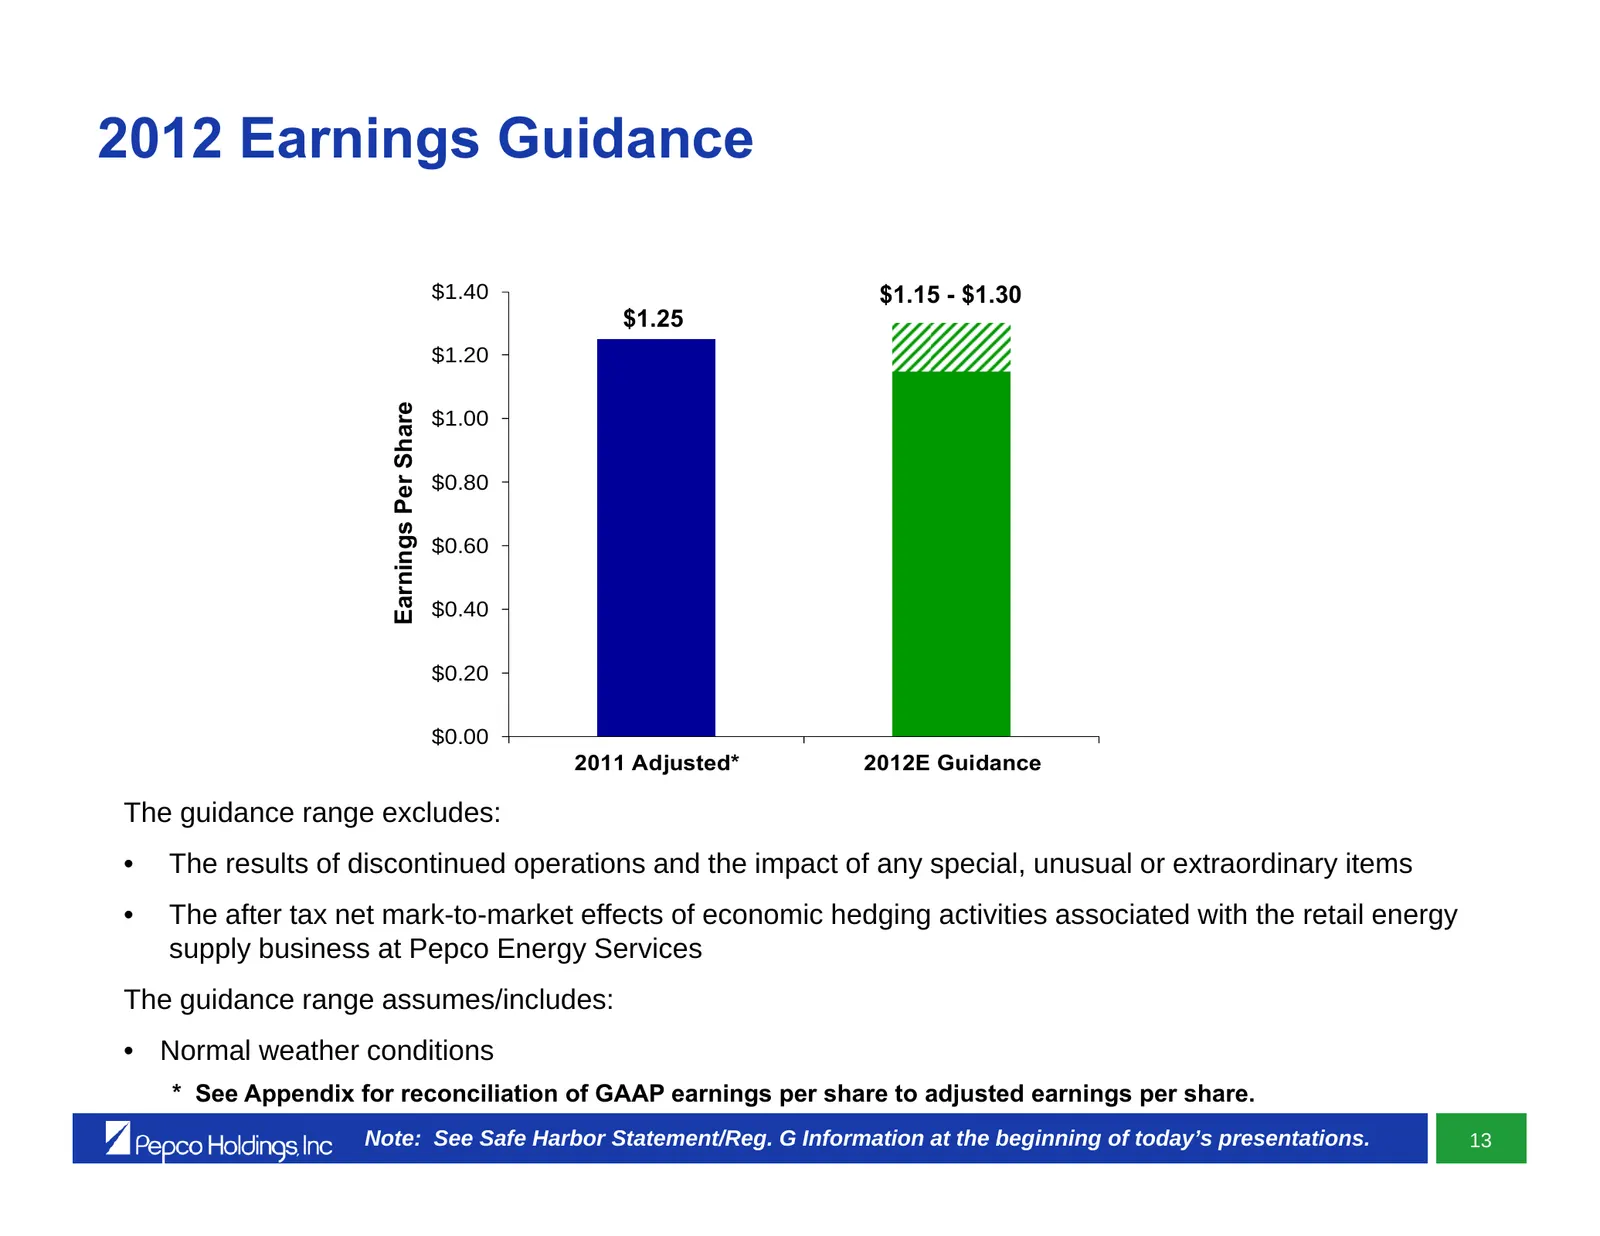
Slide 114: 2012 Earnings Guidance
2012 Earnings Guidance $1.40 $1.15 - $1.30 $1.25 $1.20 Earnings Per Share $1.00 $0.80 $0.60 $0.40 $0.20 $0.00 2011 Adjusted* 2012E Guidance The guidance range excludes: • The results of discontinued operations and the impact of any special, unusual or extraordinary items • The after tax net mark-to-
Slide 115: 2012 Earnings Guidance (continued)
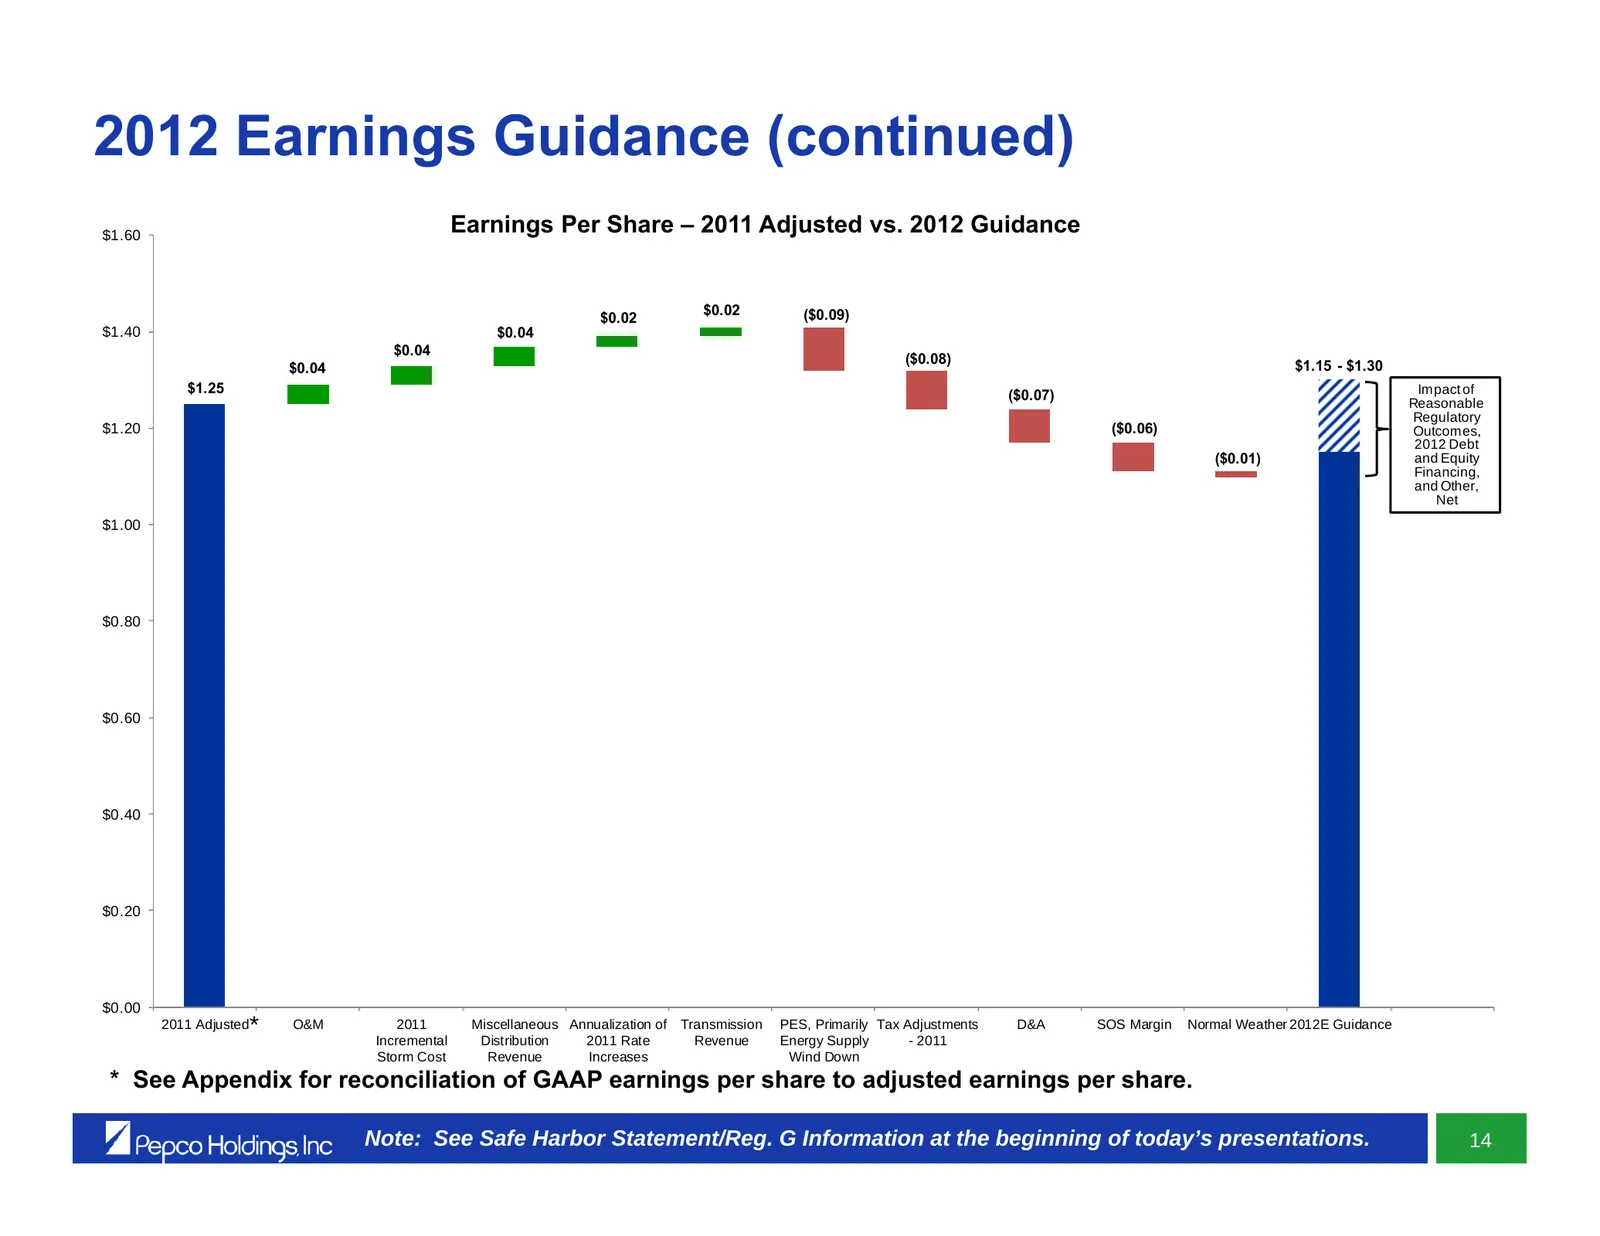
2012 Earnings Guidance (continued) $1.60 Earnings Per Share – 2011 Adjusted vs. 2012 Guidance $0.02 ($0.09) $0.02 $1.40 $0.04 $0.04 ($0.08) $1.15 - $1.30 $0.04 $1.25 ($0.07) Impact of Reasonable Regulatory $1.20 ($0.06) Outcomes, 2012 Debt ($0.01) and Equity Financing, and Other, Net $1.00 $0.80 $0.
Slide 116: 2012 Earnings Guidance Assumptions
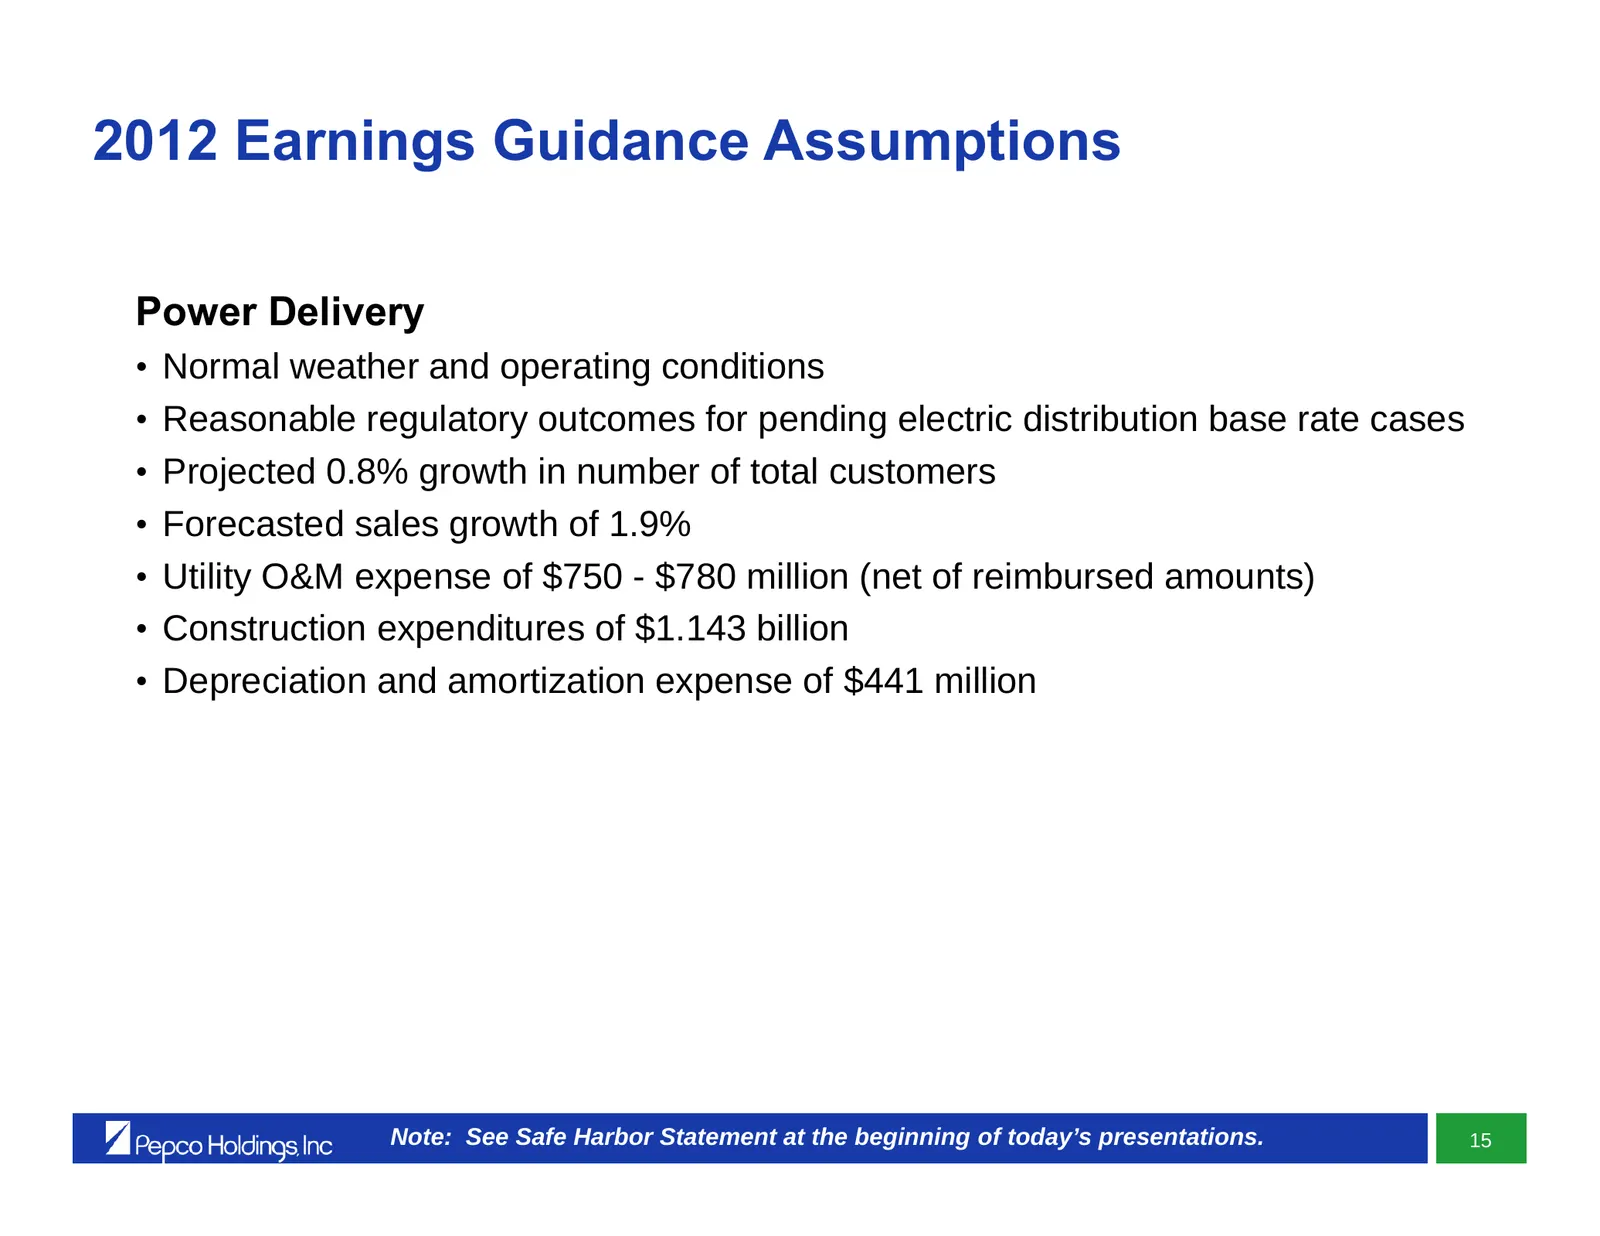
2012 Earnings Guidance Assumptions Power Delivery • Normal weather and operating conditions • Reasonable regulatory outcomes for pending electric distribution base rate cases • Projected 0.8% growth in number of total customers • Forecasted sales growth of 1.9% • Utility O&M expense of $750 - $780 m
Slide 117: 2012 Earnings Guidance Assumptions (continued)
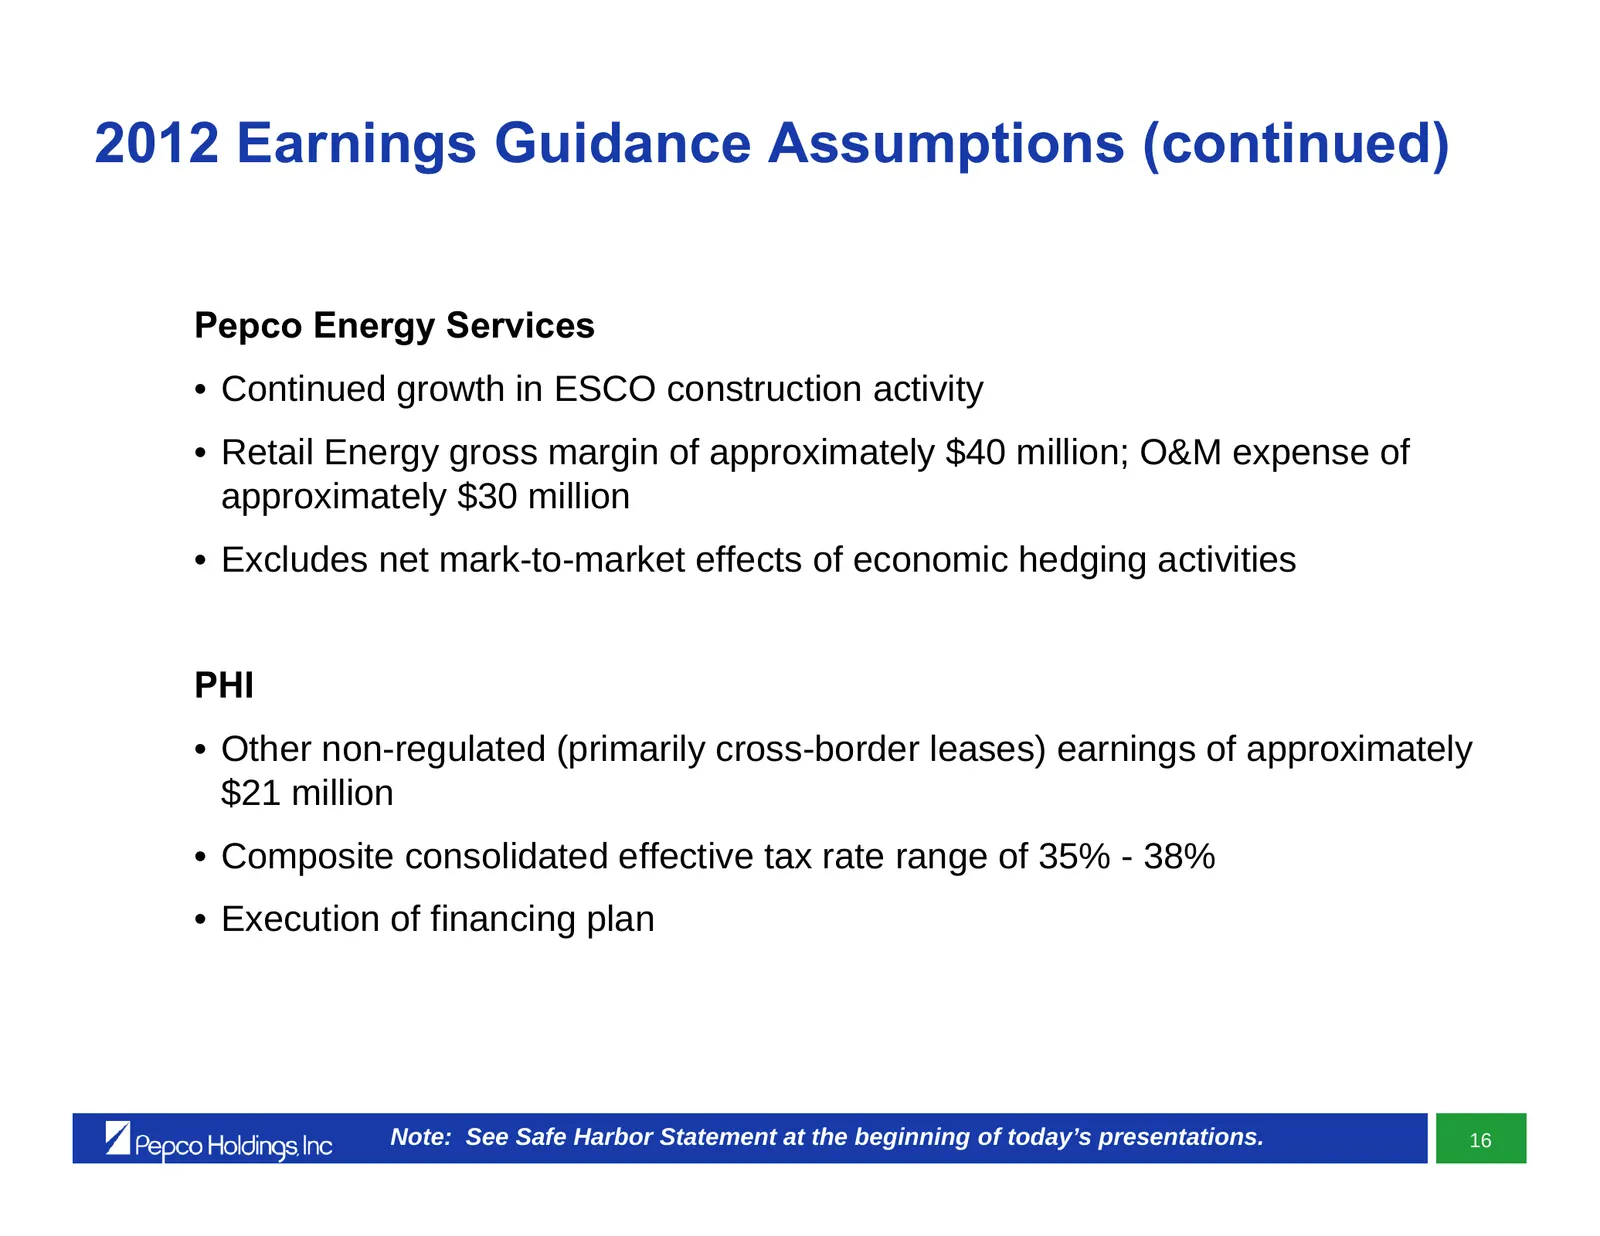
2012 Earnings Guidance Assumptions (continued) Pepco Energy Services • Continued growth in ESCO construction activity • Retail Energy gross margin of approximately $40 million; O&M expense of approximately $30 million • Excludes net mark-to-market effects of economic hedging activities PHI • Other n
Slide 118: Investment Highlights
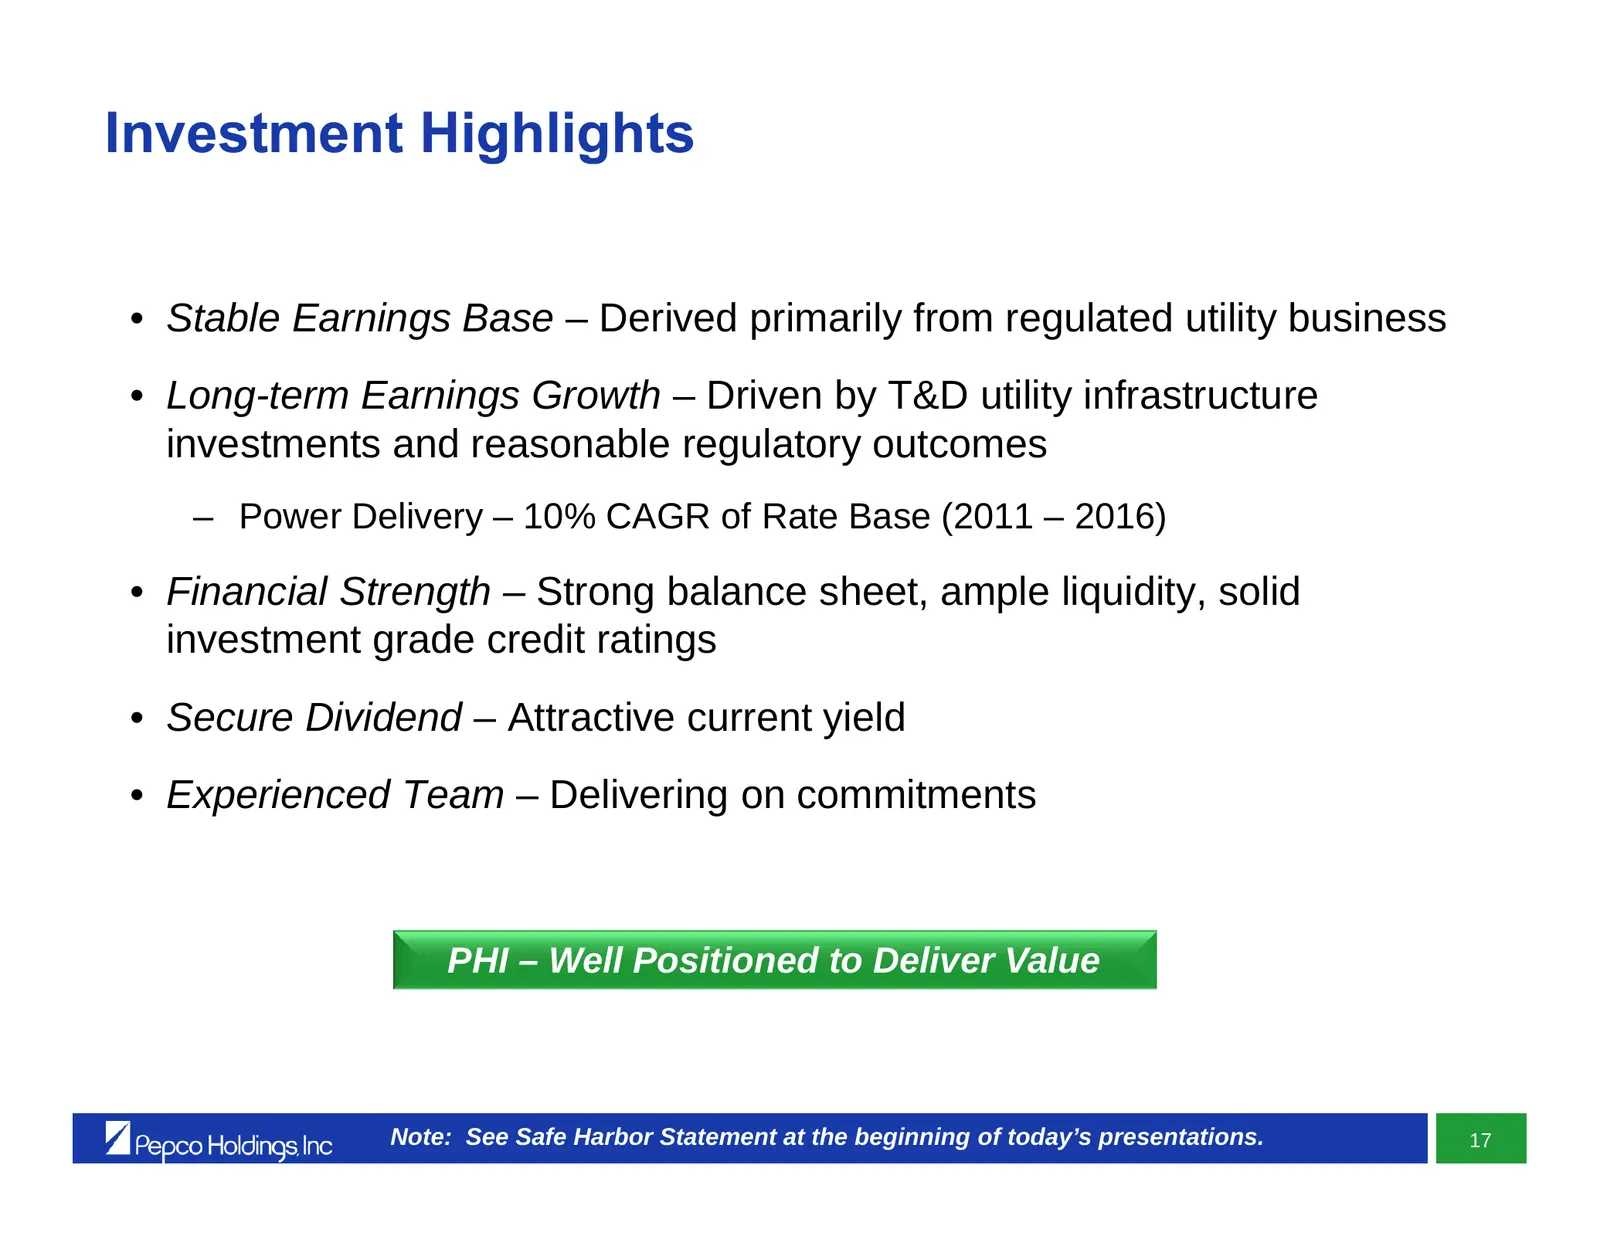
Investment Highlights • Stable Earnings Base – Derived primarily from regulated utility business • Long-term Earnings Growth – Driven by T&D utility infrastructure investments and reasonable regulatory outcomes – Power Delivery – 10% CAGR of Rate Base (2011 – 2016) • Financial Strength – Strong bala
Slide 119: Financial Overview
Financial Overview Tony Kamerick Senior Vice President & Chief Financial Officer
Slide 120: Appendix
Appendix y | Pepco Holdings Inc L |
Slide 121: Sales and Financial Information – Potomac Electric Power Company
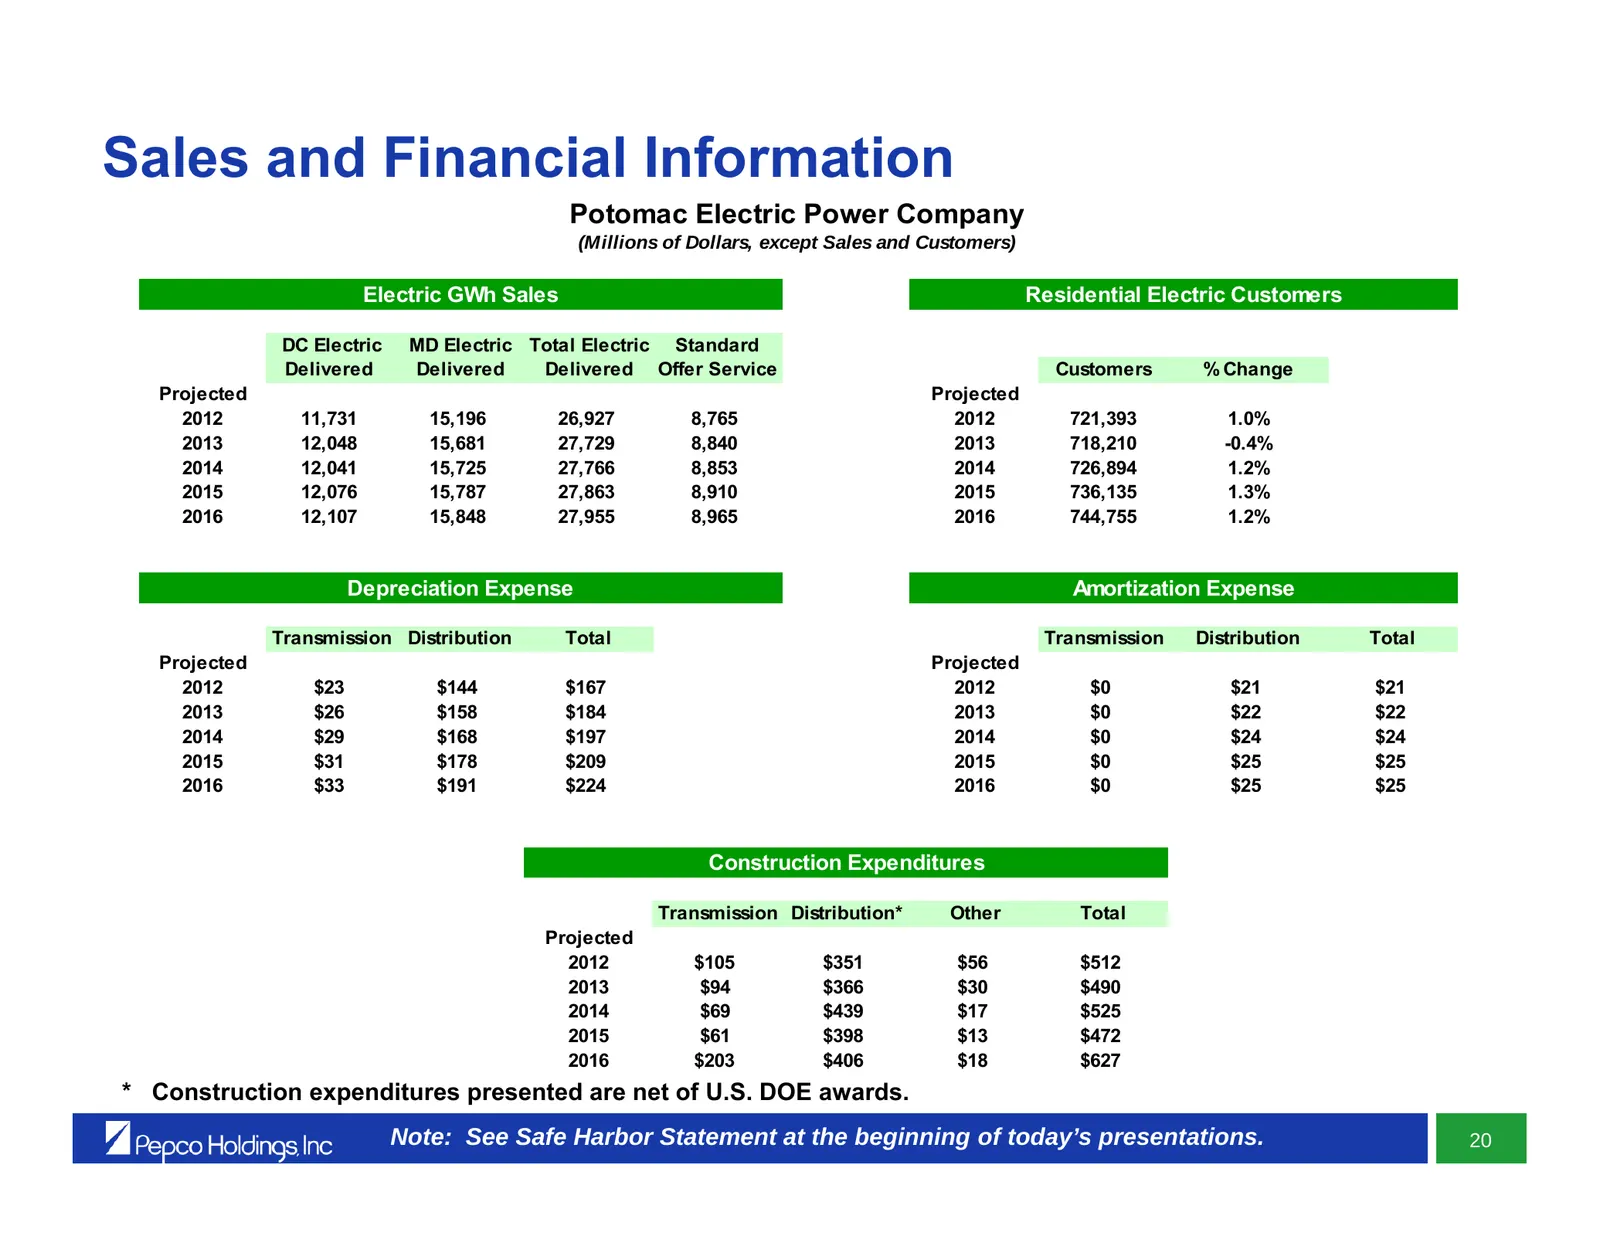
Sales and Financial Information Potomac Electric Power Company (Millions of Dollars, except Sales and Customers) Electric GWh Sales Residential Electric Customers DC Electric MD Electric Total Electric Standard Delivered Delivered Delivered Offer Service Customers % Change Projected Projected 2012 1
Slide 122: Sales and Financial Information – Delmarva Power & Light Company
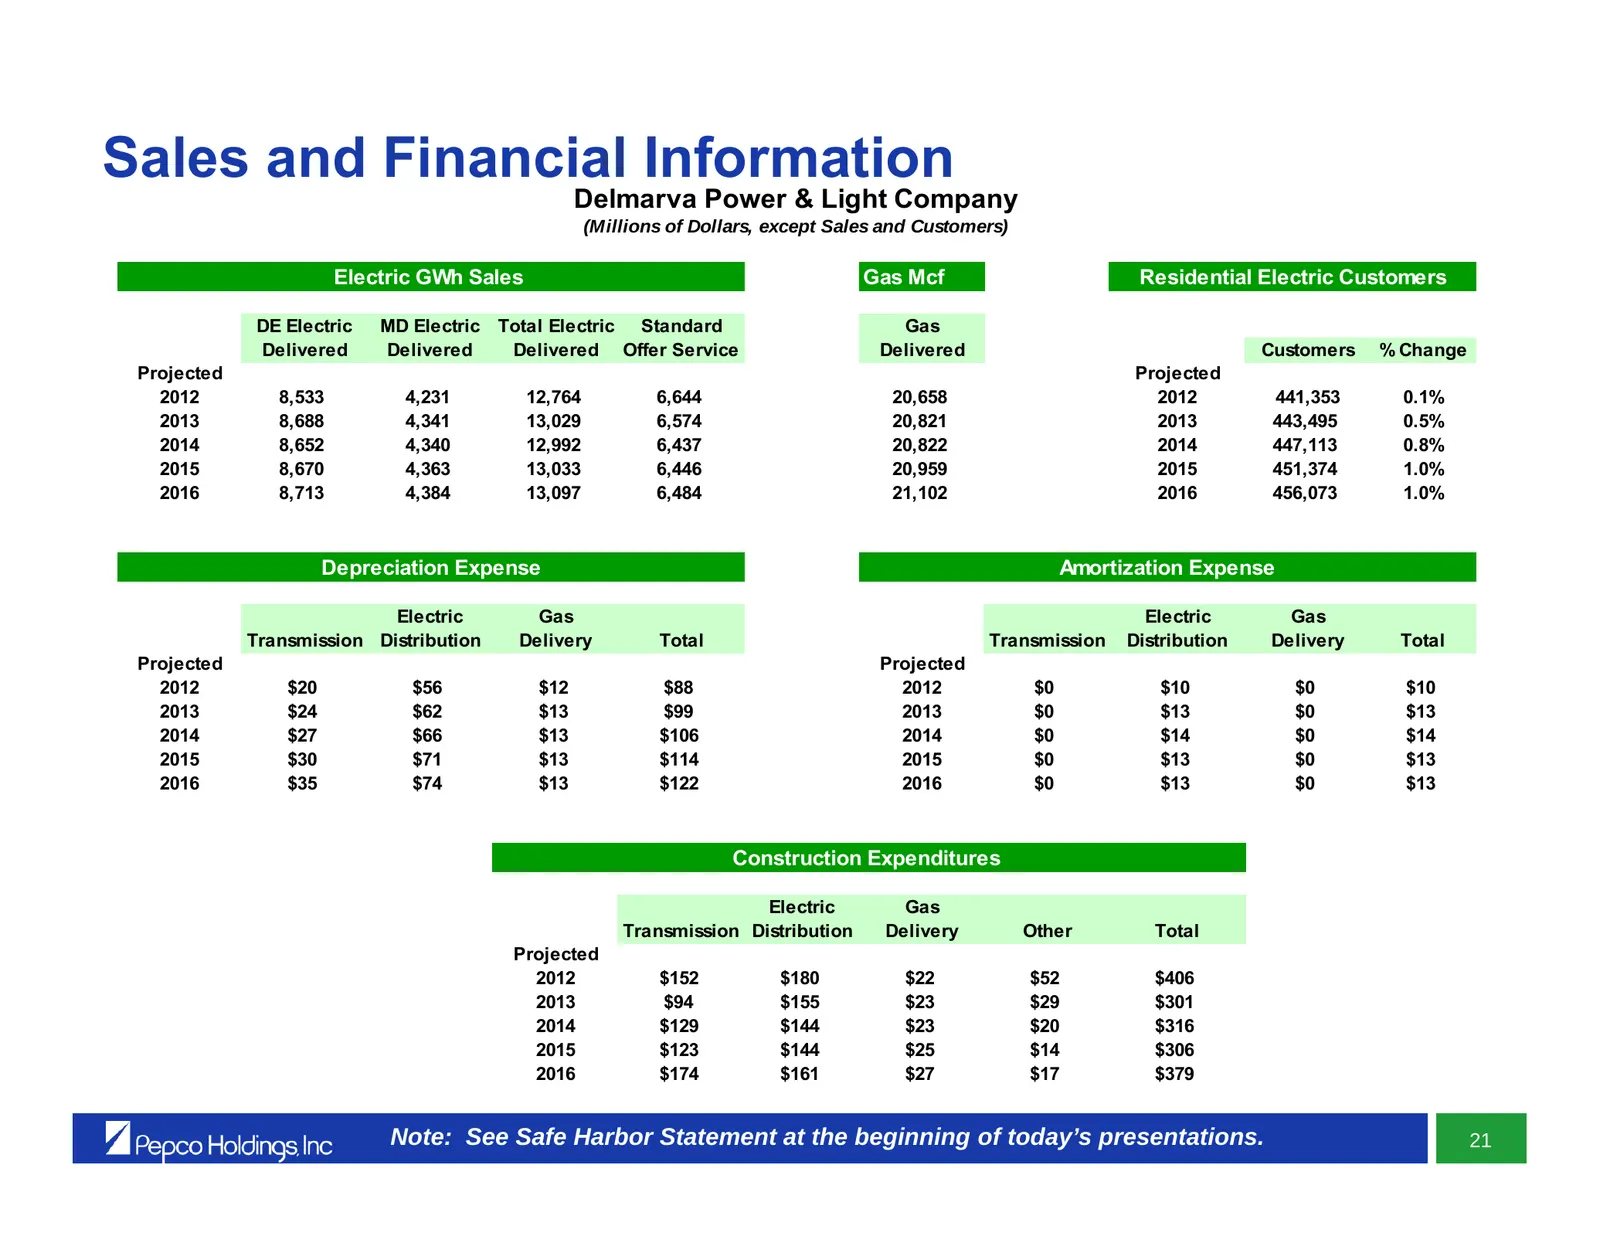
Sales and Financial Information Delmarva Power & Light Company (Millions of Dollars, except Sales and Customers) Electric GWh Sales Gas Mcf Residential Electric Customers DE Electric MD Electric Total Electric Standard Gas Delivered Delivered Delivered Offer Service Delivered Customers % Change Proj
Slide 123: Sales and Financial Information – Atlantic City Electric Company
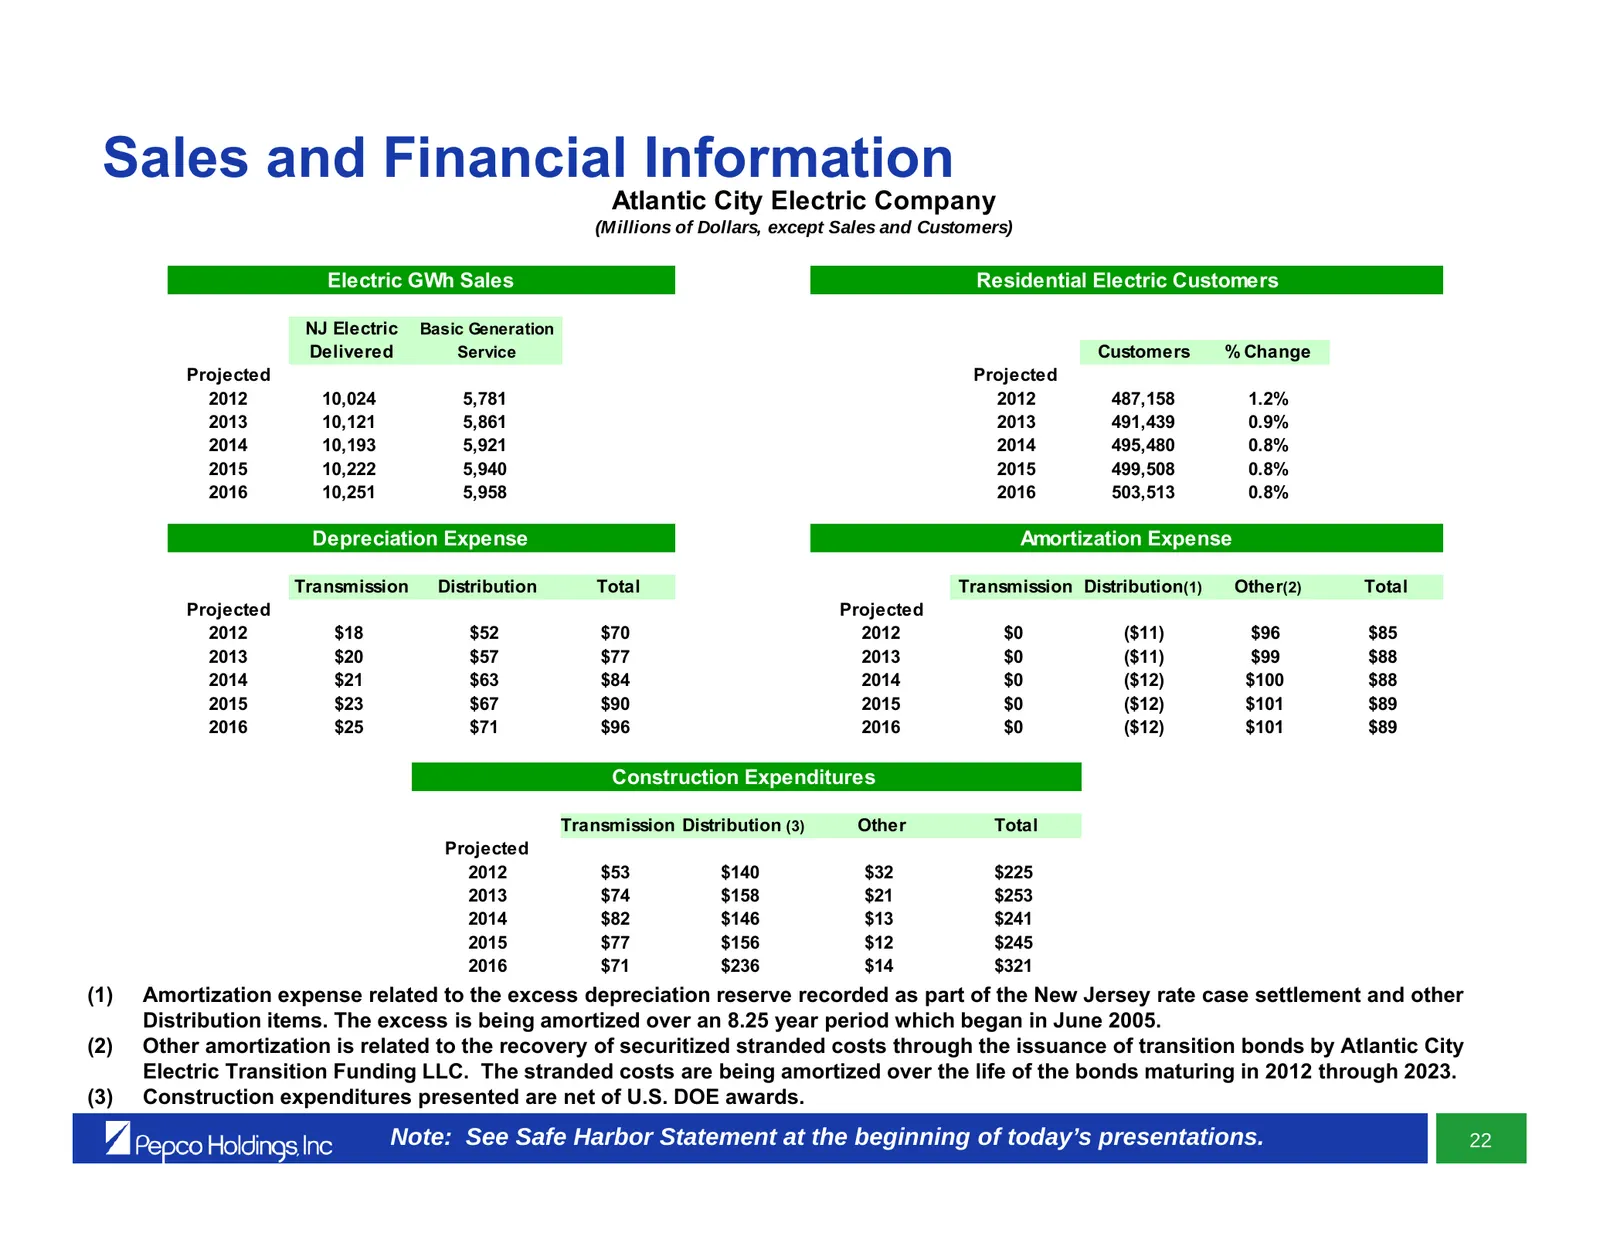
Sales and Financial Information Atlantic City Electric Company (Millions of Dollars, except Sales and Customers) Electric GWh Sales Residential Electric Customers NJ Electric Basic Generation Delivered Service Customers % Change Projected Projected 2012 10,024 5,781 2012 487,158 1.2% 2013 10,121 5,8
Slide 124: Projected Capital Expenditures – 2012 - 2016
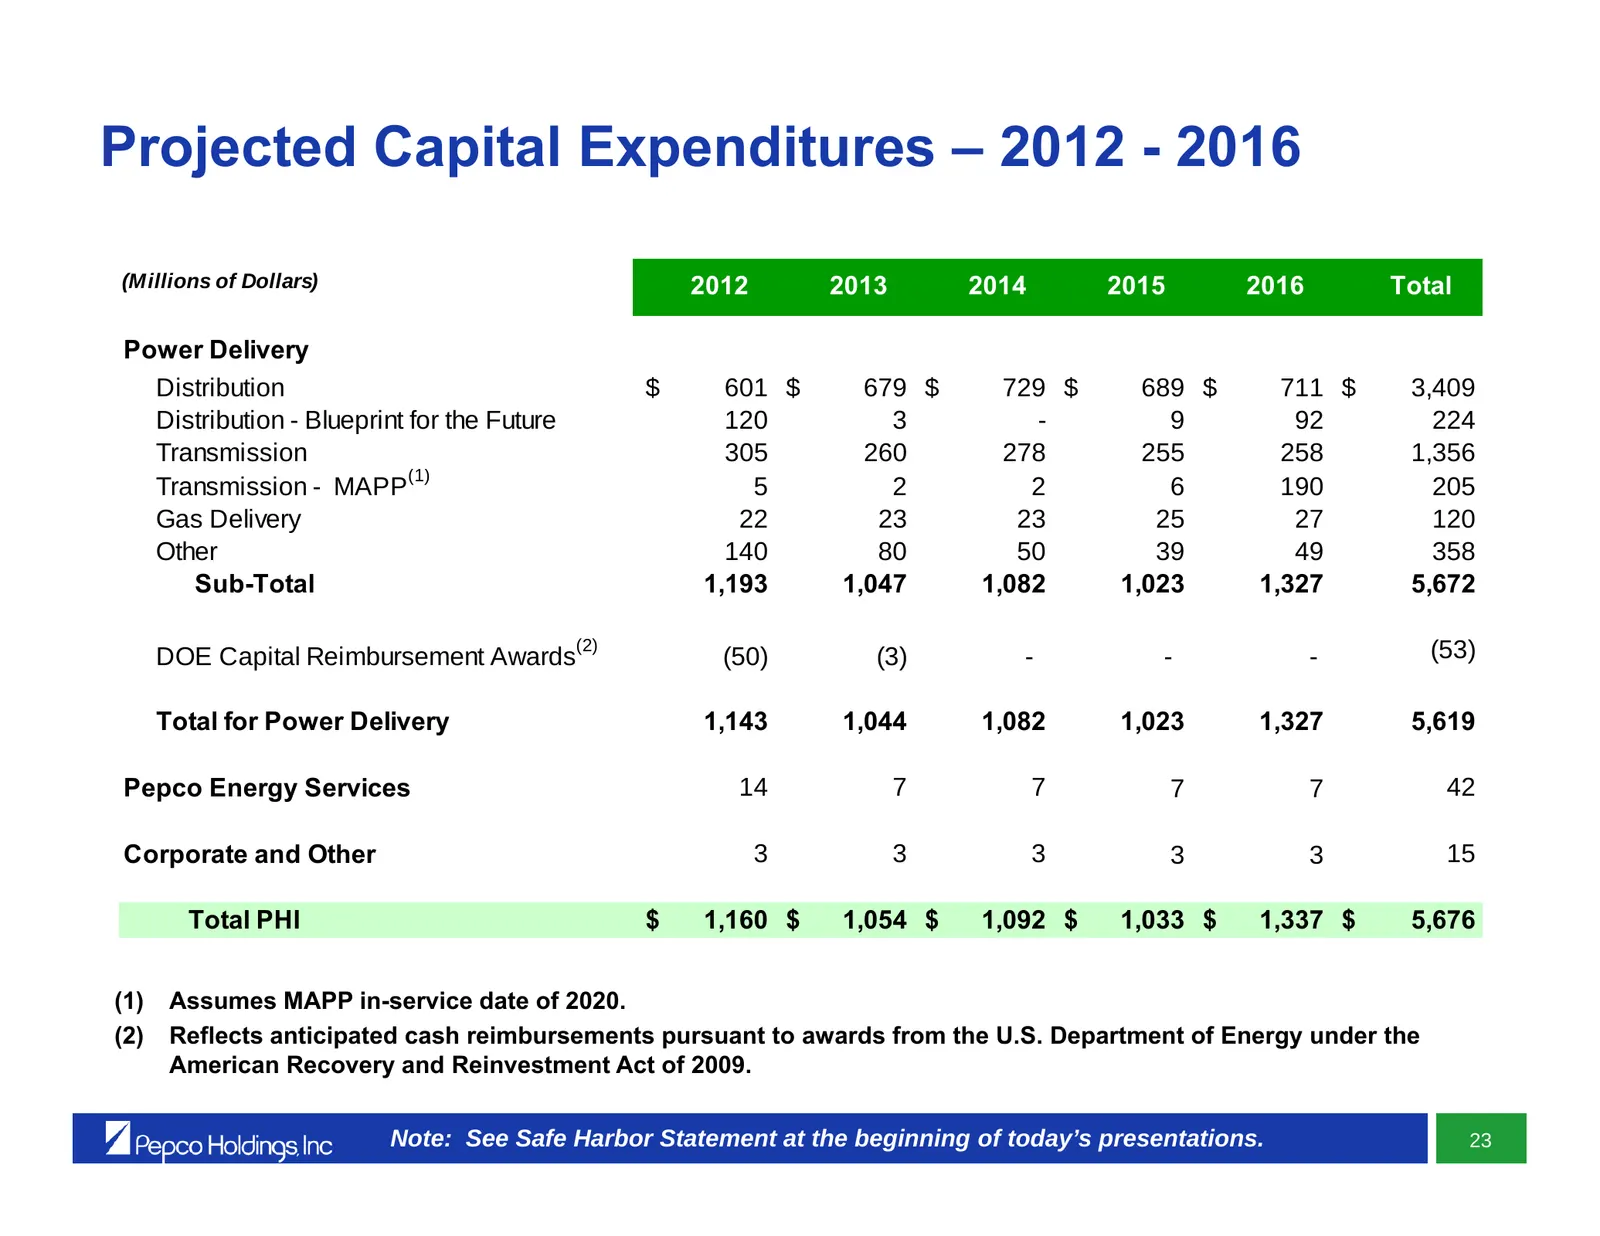
Projected Capital Expenditures – 2012 - 2016 (Millions of Dollars) 2012 2013 2014 2015 2016 Total Power Delivery Distribution $ 601 $ 679 $ 729 $ 689 $ 711 $ 3,409 Distribution - Blueprint for the Future 120 3 - 9 92 224 Transmission 305 260 278 255 258 1,356 (1) Transmission - MAPP 5 2 2 6 190 205
Slide 125: Projected Rate Base by Utility
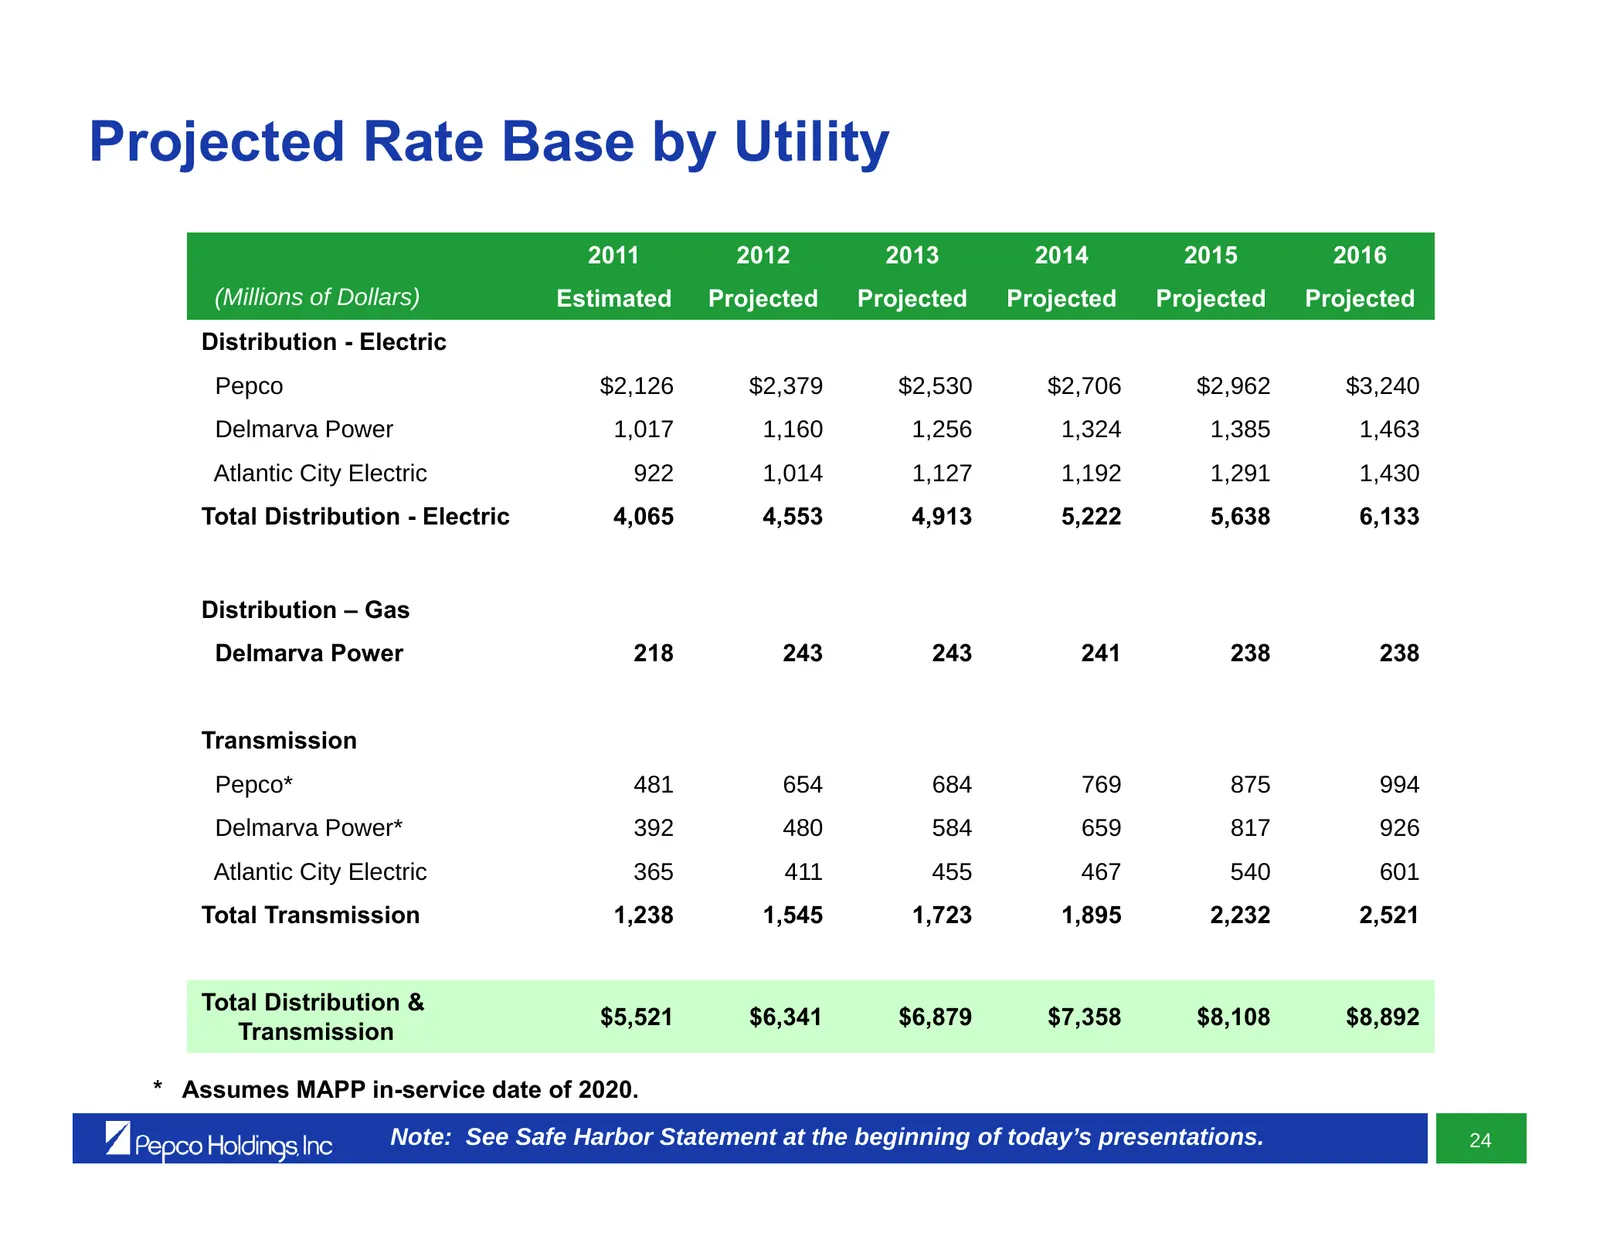
Projected Rate Base by Utility 2011 2012 2013 2014 2015 2016 (Millions of Dollars) Estimated Projected Projected Projected Projected Projected Distribution - Electric Pepco $2,126 $2,379 $2,530 $2,706 $2,962 $3,240 Delmarva Power 1,017 1,160 1,256 1,324 1,385 1,463 Atlantic City Electric 922 1,014 1
Slide 126: Calculation of Credit Metrics
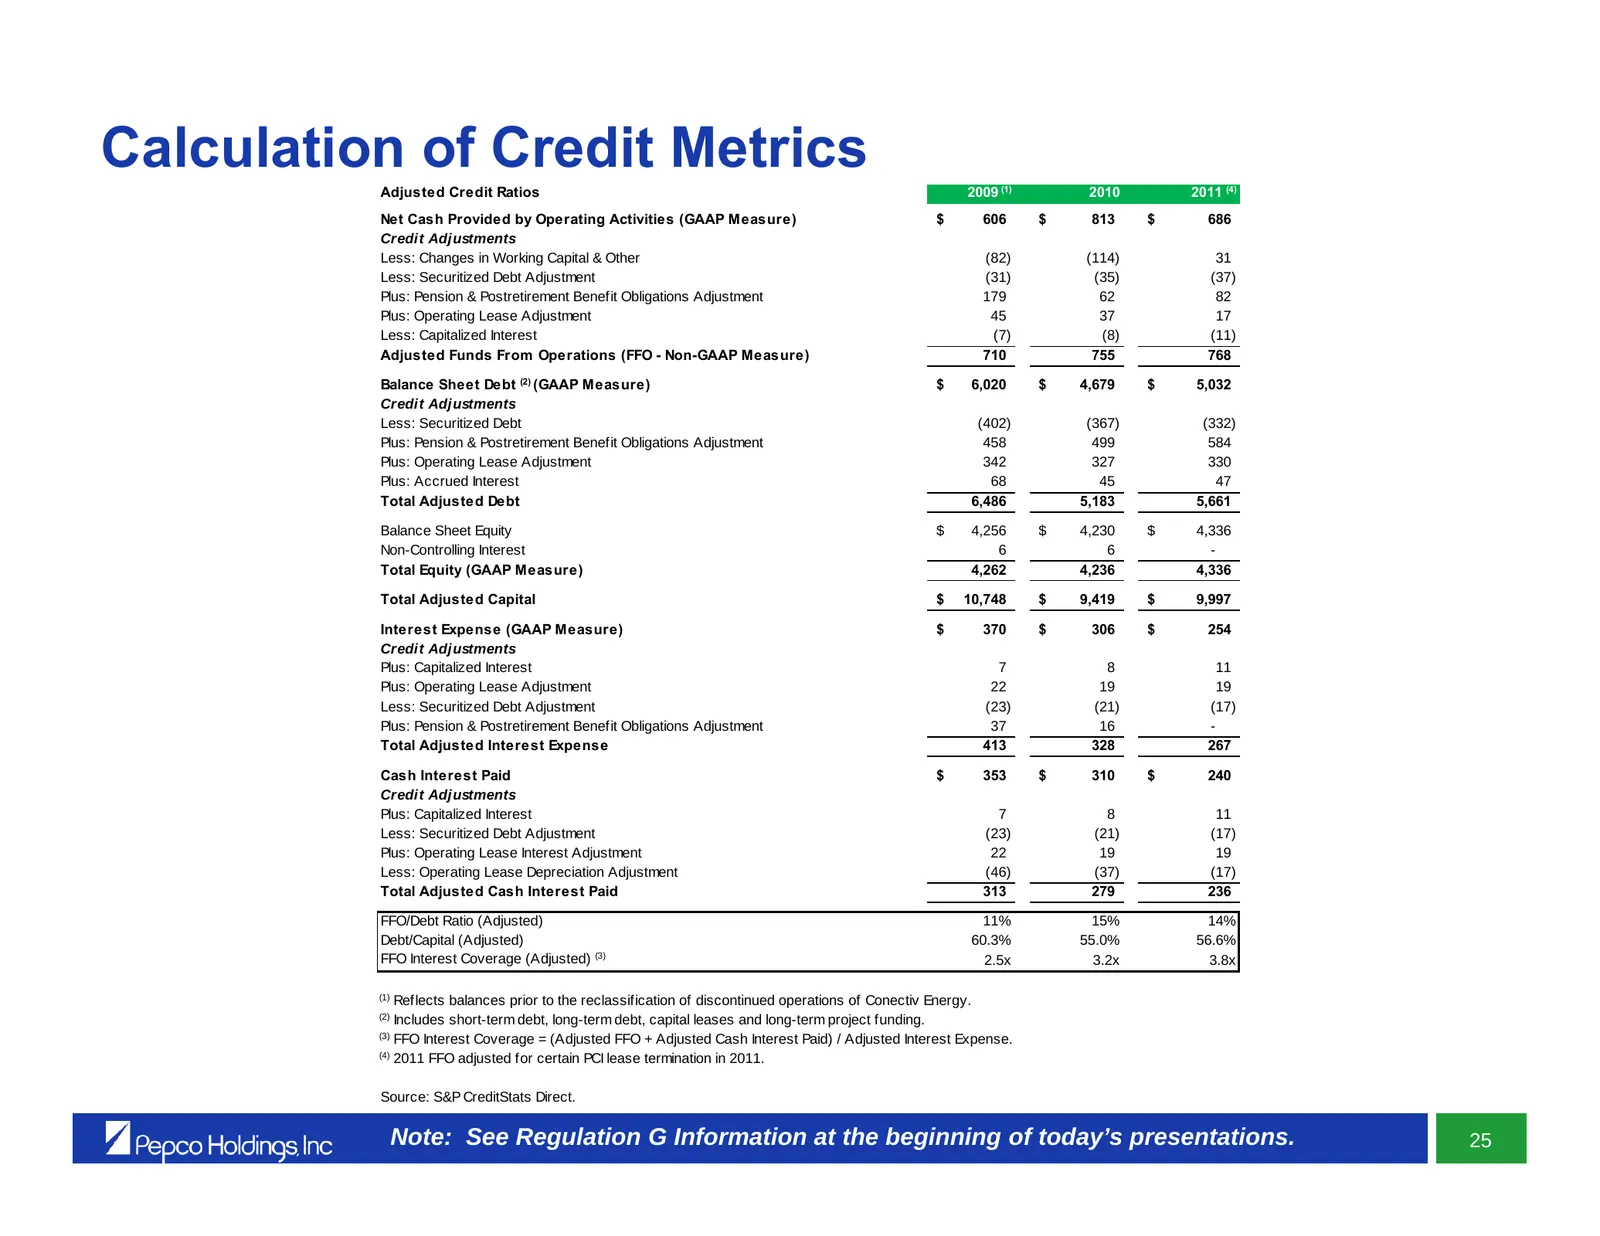
Calculation of Credit Metrics Adjusted Credit Ratios 2009 (1) 2010 2011 (4) Net Cash Provided by Operating Activities (GAAP Measure) $ 606 $ 813 $ 686 Credit Adjustments Less: Changes in Working Capital & Other (82) (114) 31 Less: Securitized Debt Adjustment (31) (35) (37) Plus: Pension & Postretire
Slide 127: Long-term Debt Maturities
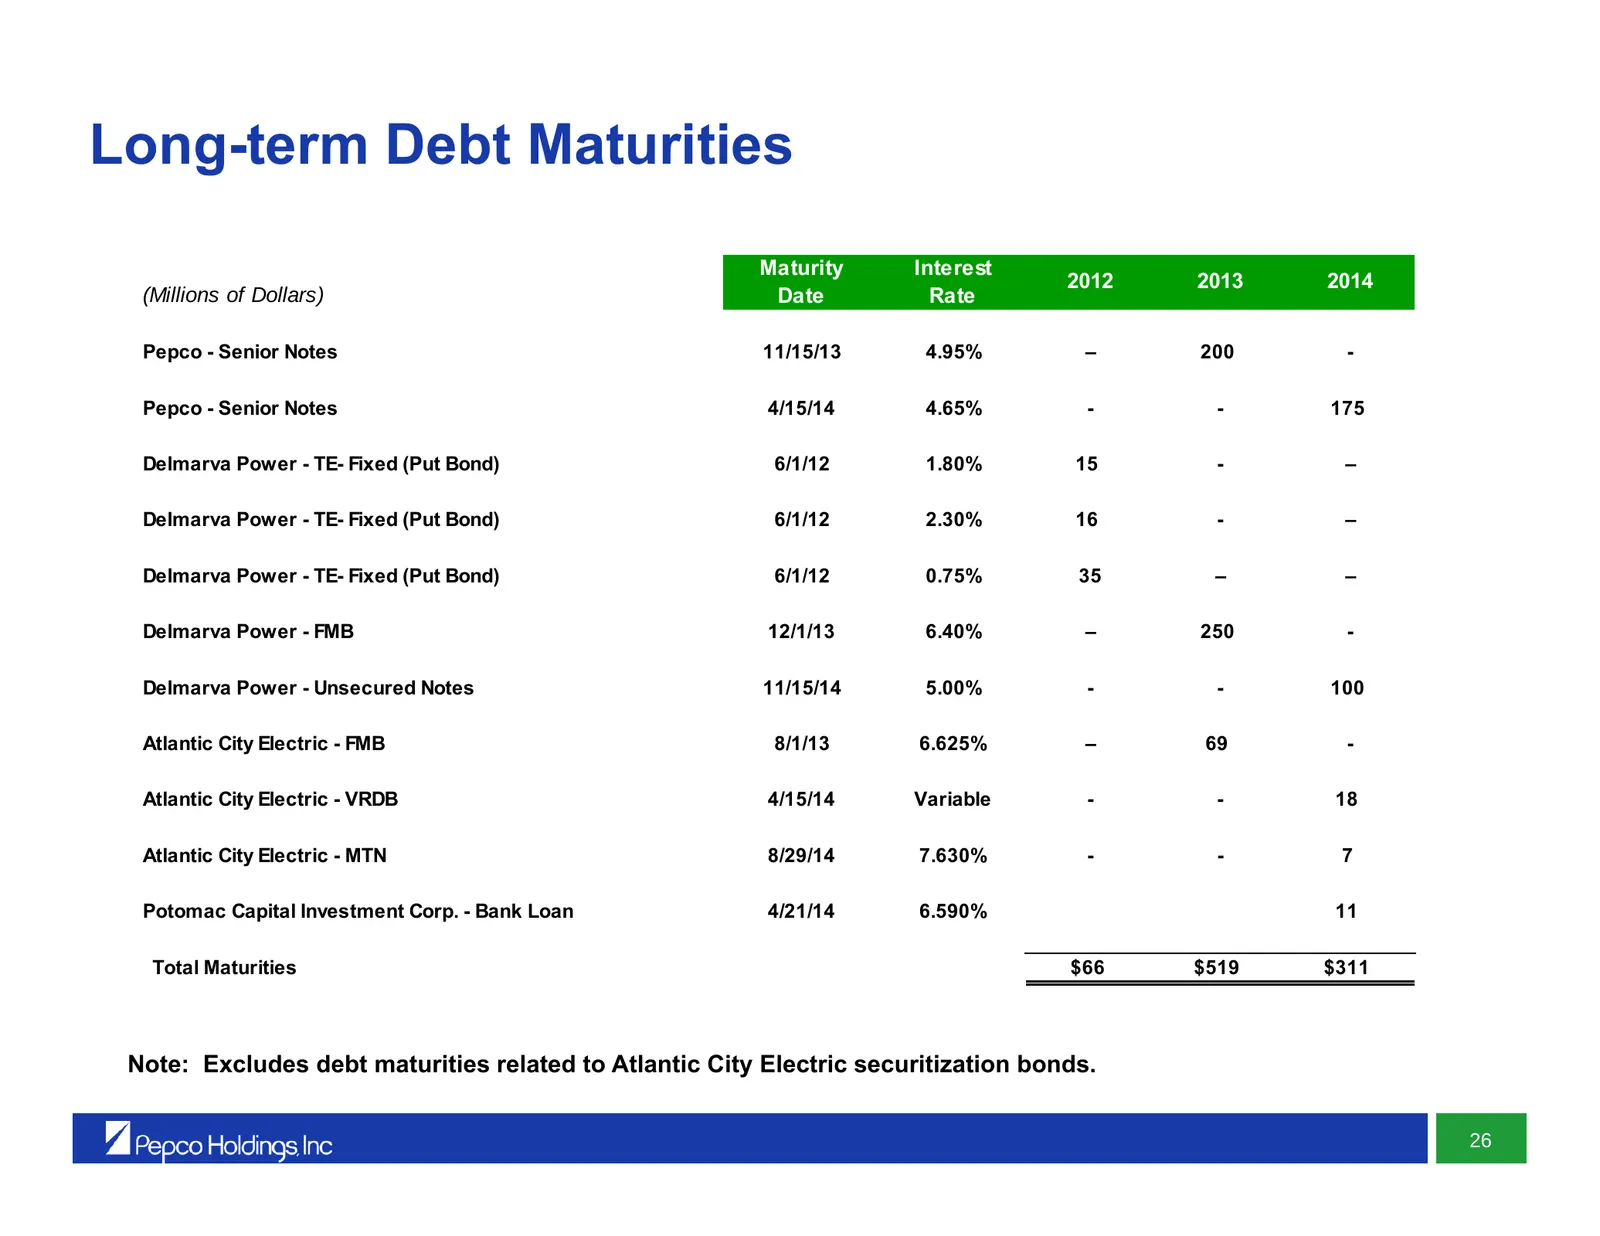
Long-term Debt Maturities Maturity Interest 2012 2013 2014 (Millions of Dollars) Date Rate Pepco - Senior Notes 11/15/13 4.95% – 200 - Pepco - Senior Notes 4/15/14 4.65% - - 175 Delmarva Power - TE- Fixed (Put Bond) 6/1/12 1.80% 15 - – Delmarva Power - TE- Fixed (Put Bond) 6/1/12 2.30% 16 - – Delmar
Slide 128: Cross-Border Energy Lease Status
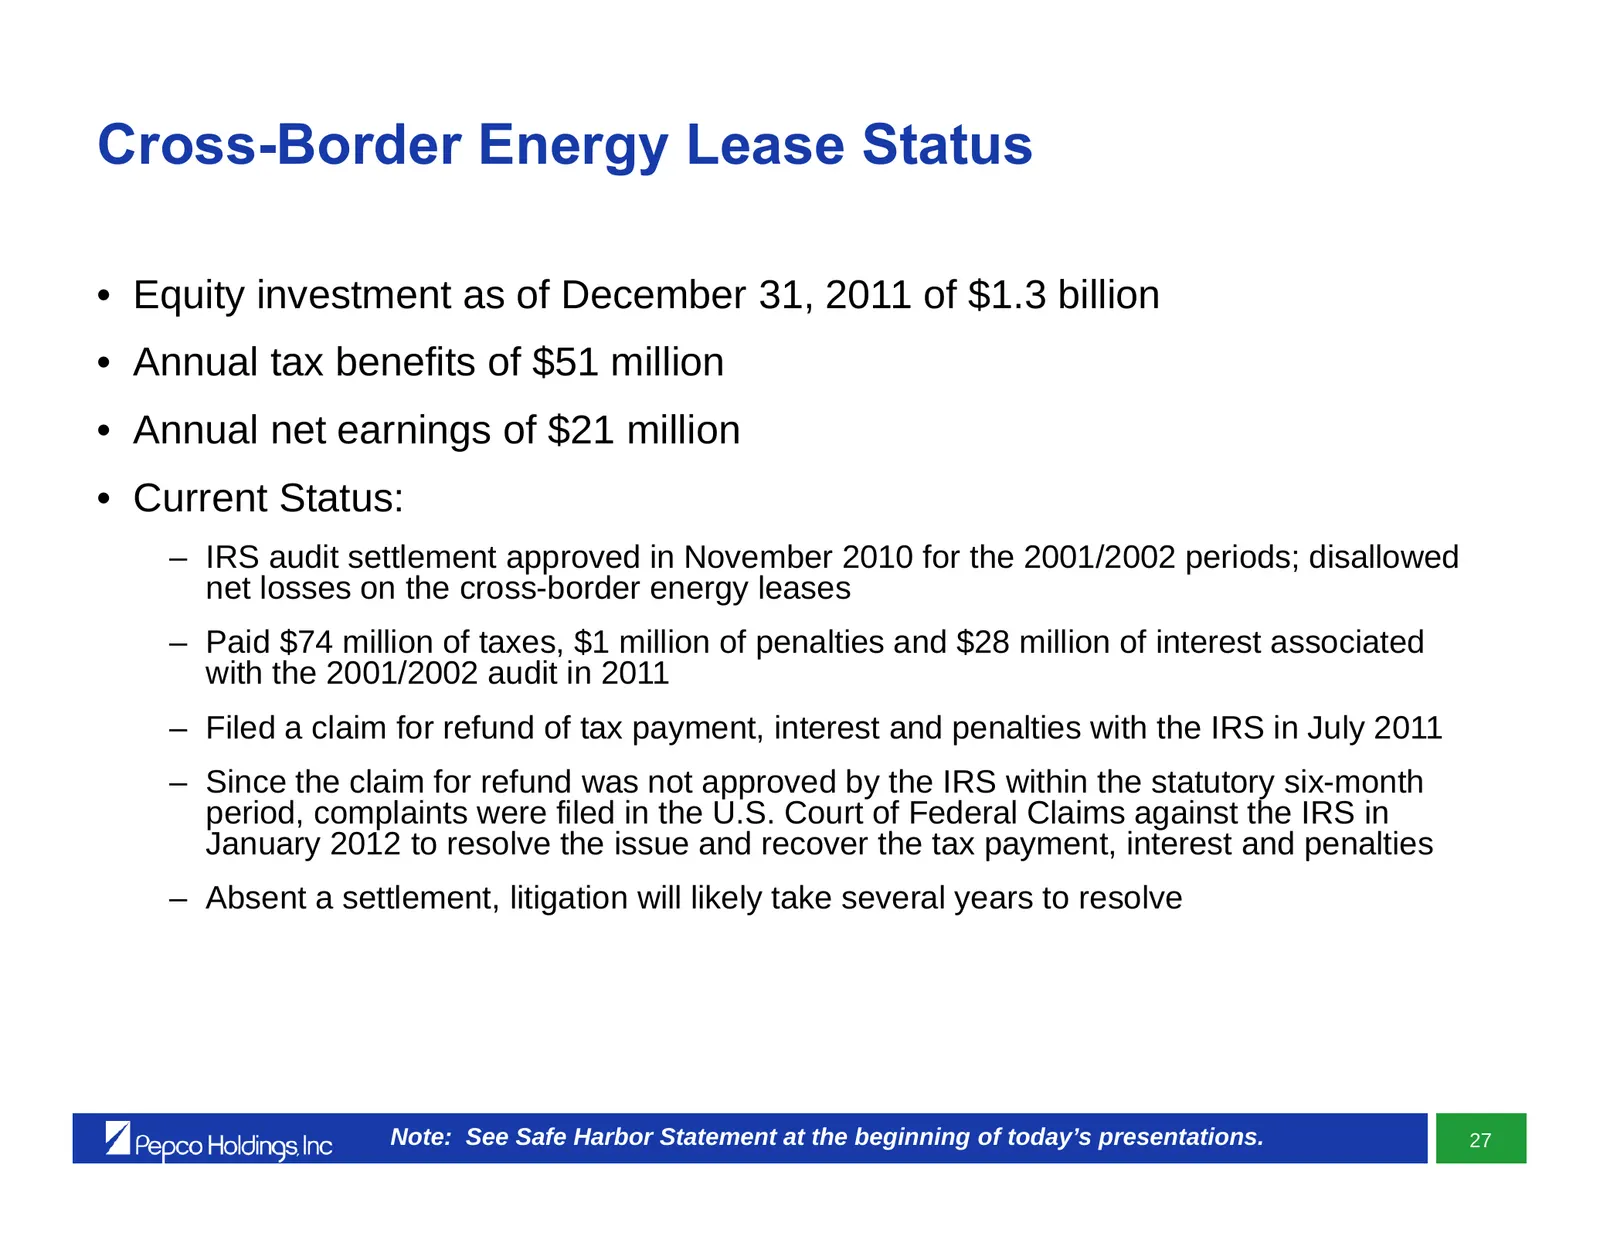
Cross-Border Energy Lease Status • Equity investment as of December 31, 2011 of $1.3 billion • Annual tax benefits of $51 million • Annual net earnings of $21 million • Current Status: – IRS audit settlement approved in November 2010 for the 2001/2002 periods; disallowed net losses on the cross-bord
Slide 129: Cross-Border Energy Lease Portfolio
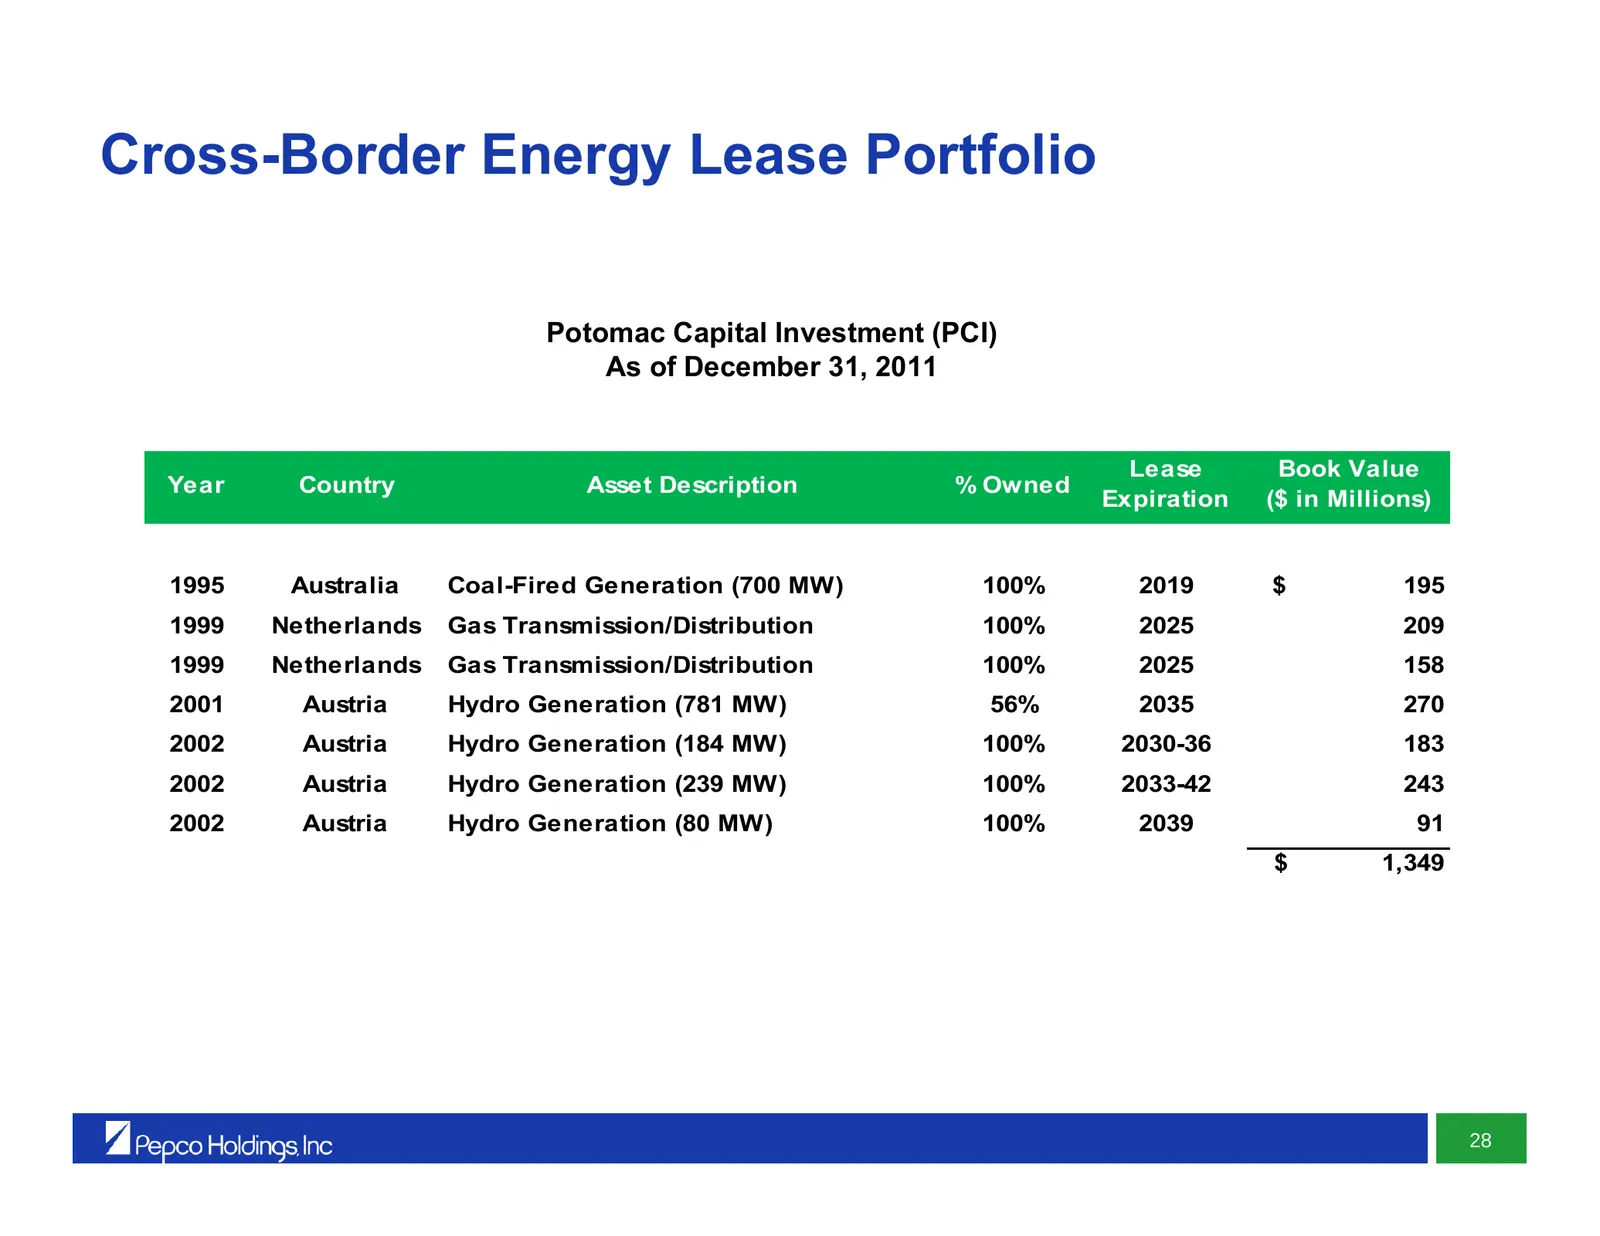
Cross-Border Energy Lease Portfolio Potomac Capital Investment (PCI) As of December 31, 2011 Lease Book Value Year Country Asset Description % Owned Expiration ($ in Millions) 1995 Australia Coal-Fired Generation (700 MW) 100% 2019 $ 195 1999 Netherlands Gas Transmission/Distribution 100% 2025 209 1
Slide 130: Our Approach to Earnings Guidance
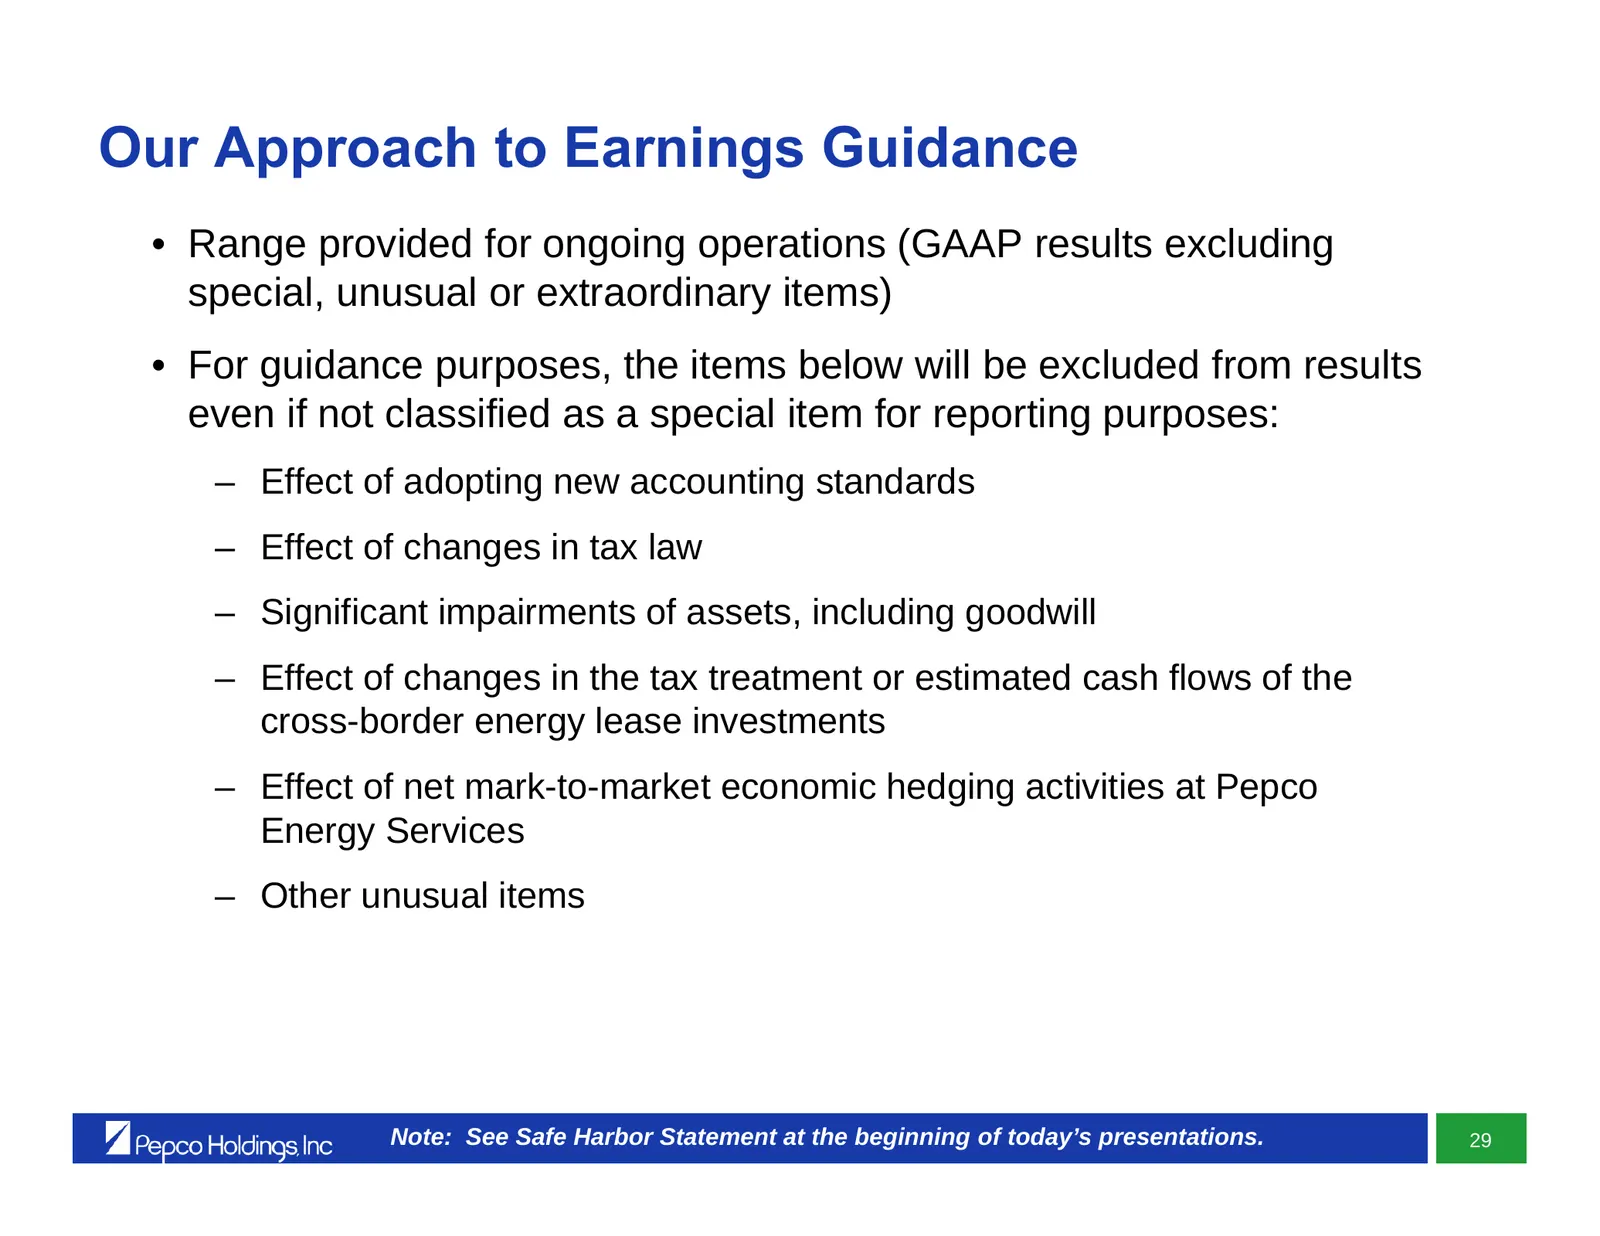
Our Approach to Earnings Guidance • Range provided for ongoing operations (GAAP results excluding special, unusual or extraordinary items) • For guidance purposes, the items below will be excluded from results even if not classified as a special item for reporting purposes: – Effect of adopting new
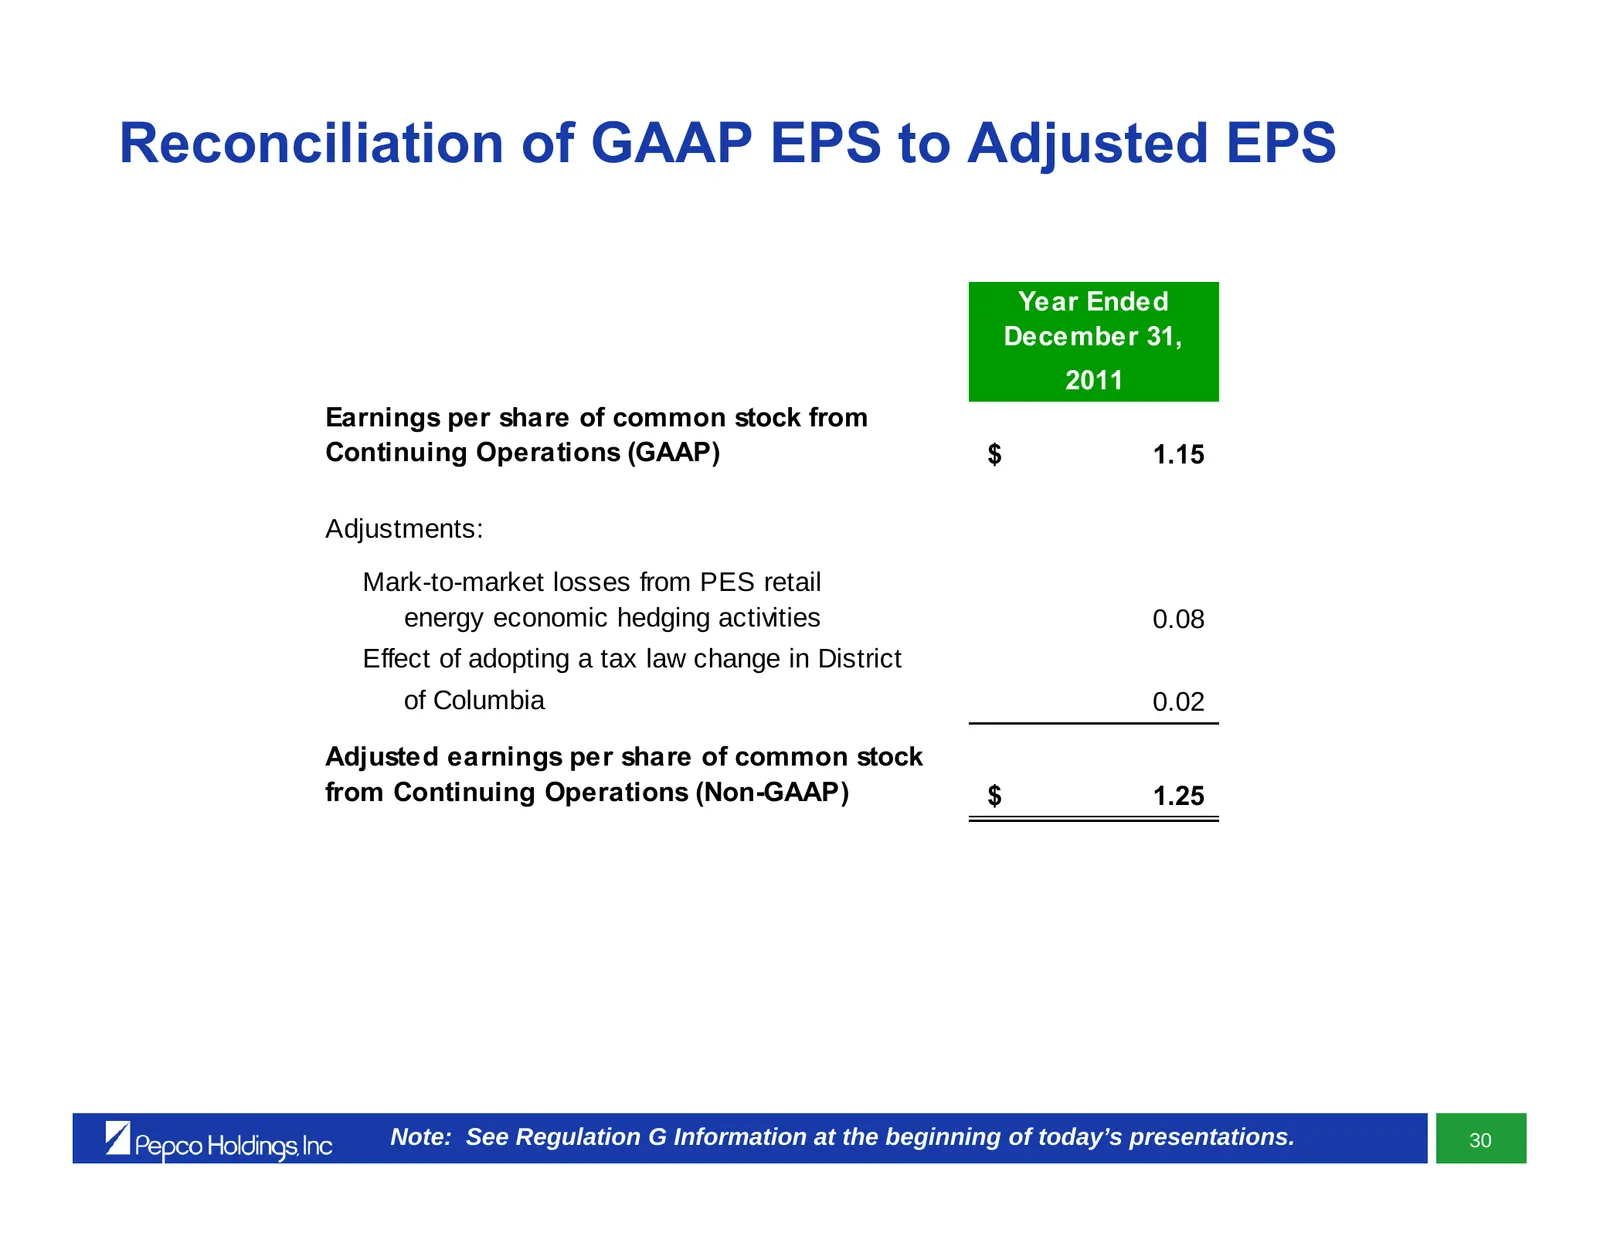
Slide 131: Reconciliation of GAAP EPS to Adjusted EPS
Reconciliation of GAAP EPS to Adjusted EPS Year Ended December 31, 2011 Earnings per share of common stock from Continuing Operations (GAAP) $ 1.15 Adjustments: Mark-to-market losses from PES retail energy economic hedging activities 0.08 Effect of adopting a tax law change in District of Columbia 0
Source: SEC EDGAR · 8-K filed Mar 26, 2012
More decks from Pepco Holdings Inc
 Merger or Acquisition (August 2014)15 slides · Aug 19, 2014
 Merger or Acquisition (May 2014)44 slides · May 23, 2014
 Q1 2014 Earnings Presentation14 slides · May 7, 2014
 Williams Capital Group Midwest Utilities Seminar (April 2014)35 slides · Apr 9, 2014
 Investor Day (March 2014)109 slides · Mar 21, 2014
 Morgan Stanley Utilities Conference 201439 slides · Feb 28, 2014