Otelco — Stifel Nicolaus Technology, Communications & Internet Conference 2011
20 slides from Otelco's conference presentation, Feb 9, 2011
Slide 1: Stifel Nicolaus Technology, Communications & Internet Conference
Stifel Nicolaus Technology, Communications & Internet Conference February 2011 Otelco Inc. (NASDAQ: OTT; TSX: OTT.un)

Slide 2: Safe Harbor Statement
Safe Harbor Statement Some of the statements included herein may include forward-looking statements which reflect the Company’s current views with respect to future events and financial performance. Statements which include the words “expect,” “intend,” “plan,” “believe,” “project,” “anticipate” and
Slide 3: Coming Attractions
Coming Attractions Otelco Inc. will announce Fourth quarter and year 2010 results February 16, 2011 2
Slide 4: Company Overview / Highlights
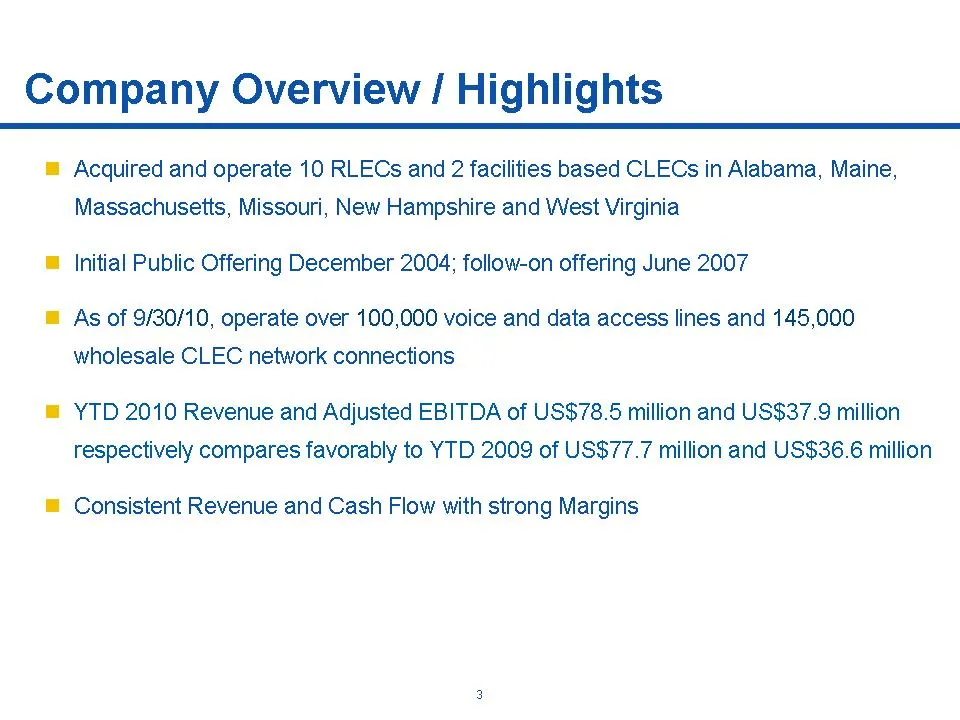
Company Overview / Highlights . Acquired and operate 10 RLECs and 2 facilities based CLECs in Alabama, Maine, Massachusetts, Missouri, New Hampshire and West Virginia . Initial Public Offering December 2004; follow-on offering June 2007 . As of 9/30/10, operate over 100,000 voice and data access lin
Slide 5: OTT Operating Regions
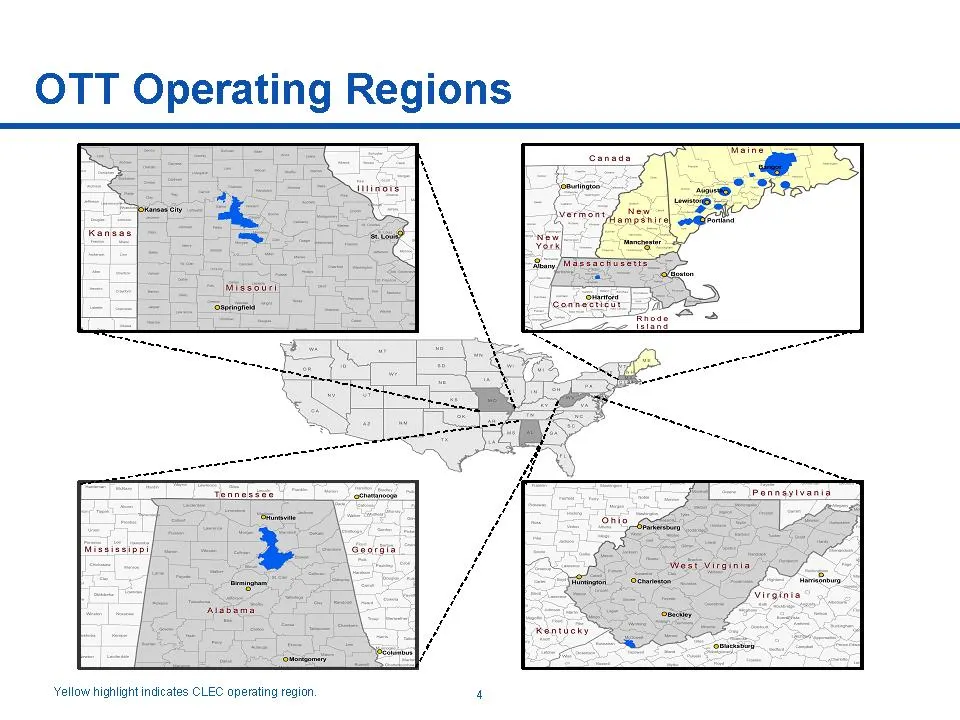
OTT Operating Regions Yellow highlight indicates CLEC operating region. 4
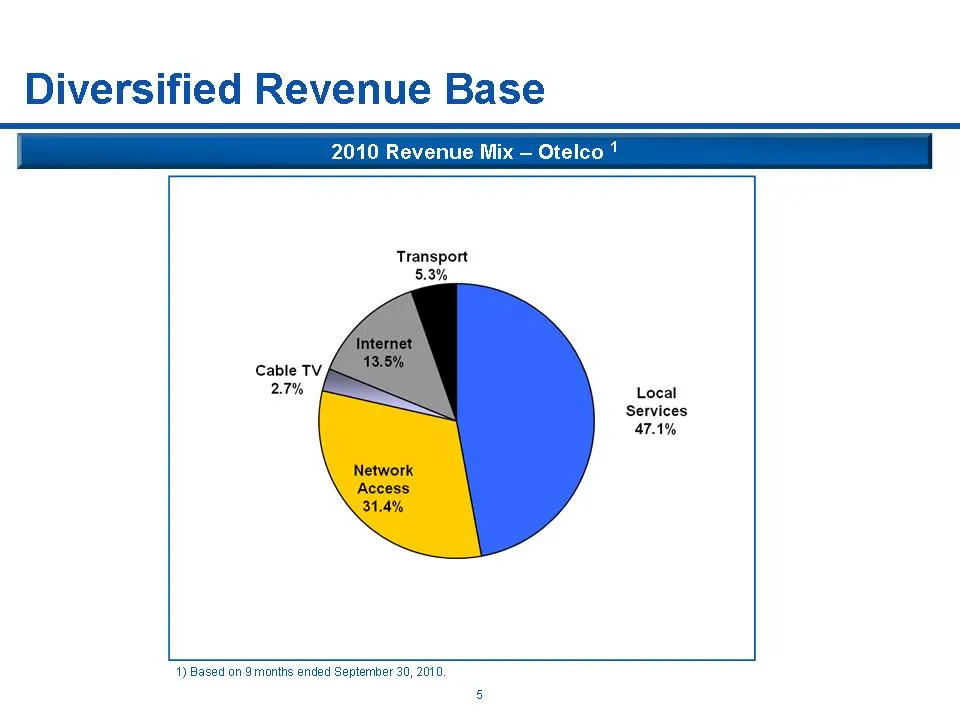
Slide 6: Diversified Revenue Base
Diversified Revenue Base 2010 Revenue Mix – Otelco 1 1) Based on 9 months ended September 30, 2010. 5
Slide 7: Business Strategy
Business Strategy oO; Otelco
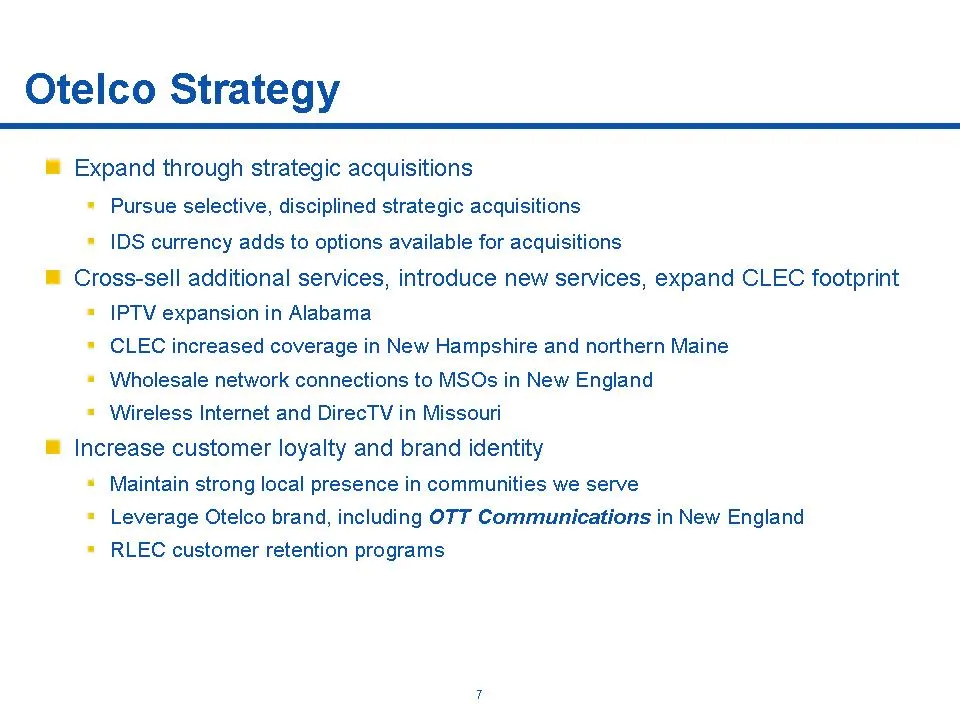
Slide 8: Otelco Strategy
Otelco Strategy . Expand through strategic acquisitions . Pursue selective, disciplined strategic acquisitions . IDS currency adds to options available for acquisitions . Cross-sell additional services, introduce new services, expand CLEC footprint . IPTV expansion in Alabama . CLEC increased covera
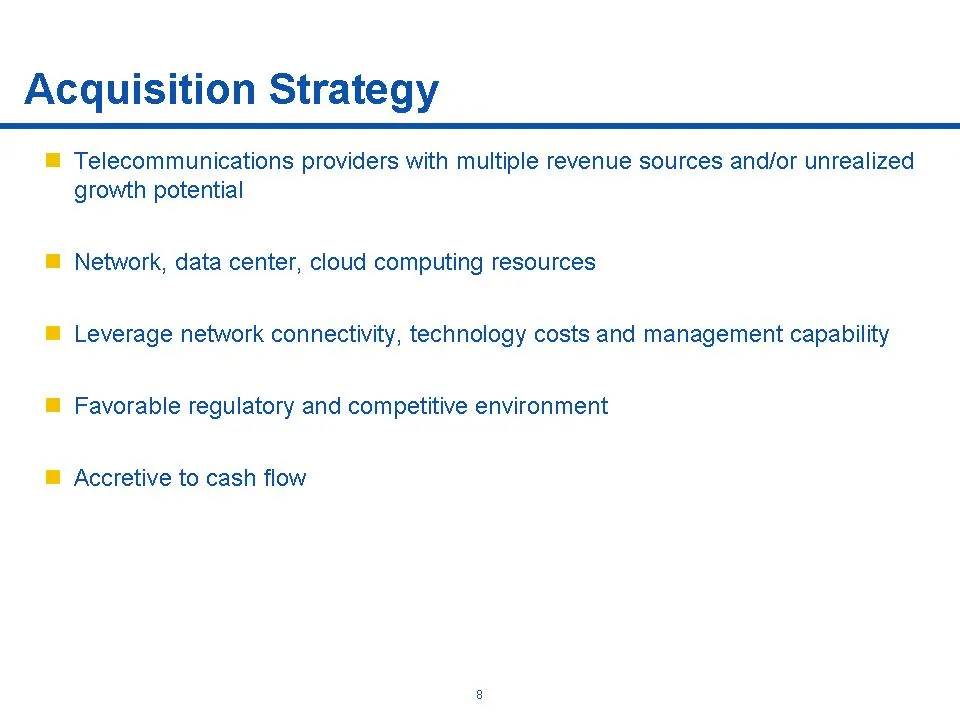
Slide 9: Acquisition Strategy
Acquisition Strategy . Telecommunications providers with multiple revenue sources and/or unrealized growth potential . Network, data center, cloud computing resources . Leverage network connectivity, technology costs and management capability . Favorable regulatory and competitive environment . Accr
Slide 10: Financial Overview
Financial Overview oO; Otelco
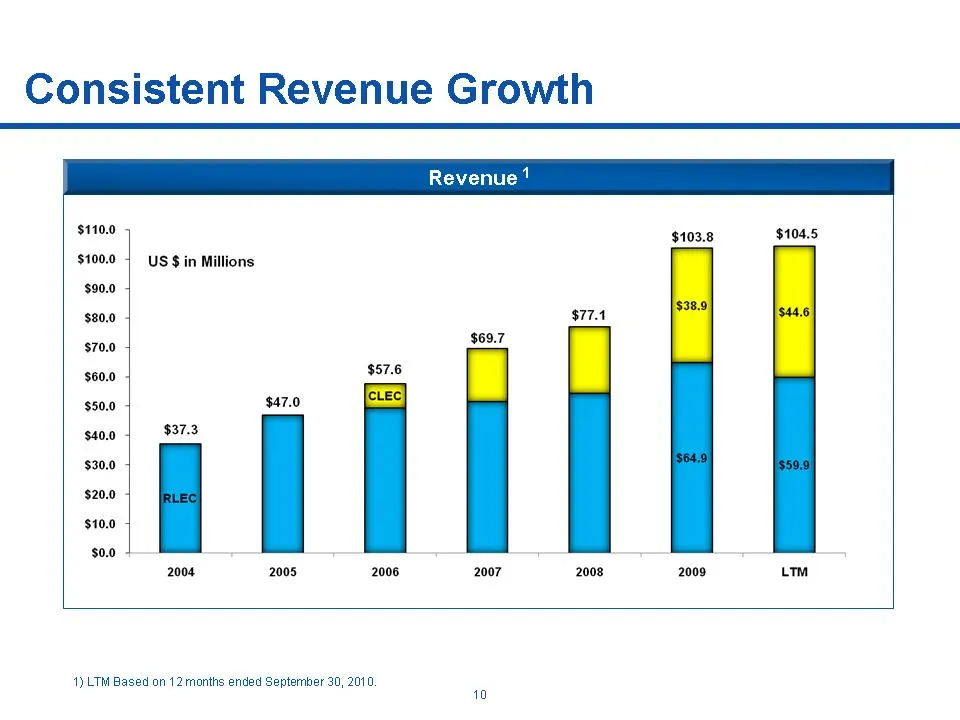
Slide 11: Consistent Revenue Growth
Consistent Revenue Growth Revenue 1 1) LTM Based on 12 months ended September 30, 2010. 10
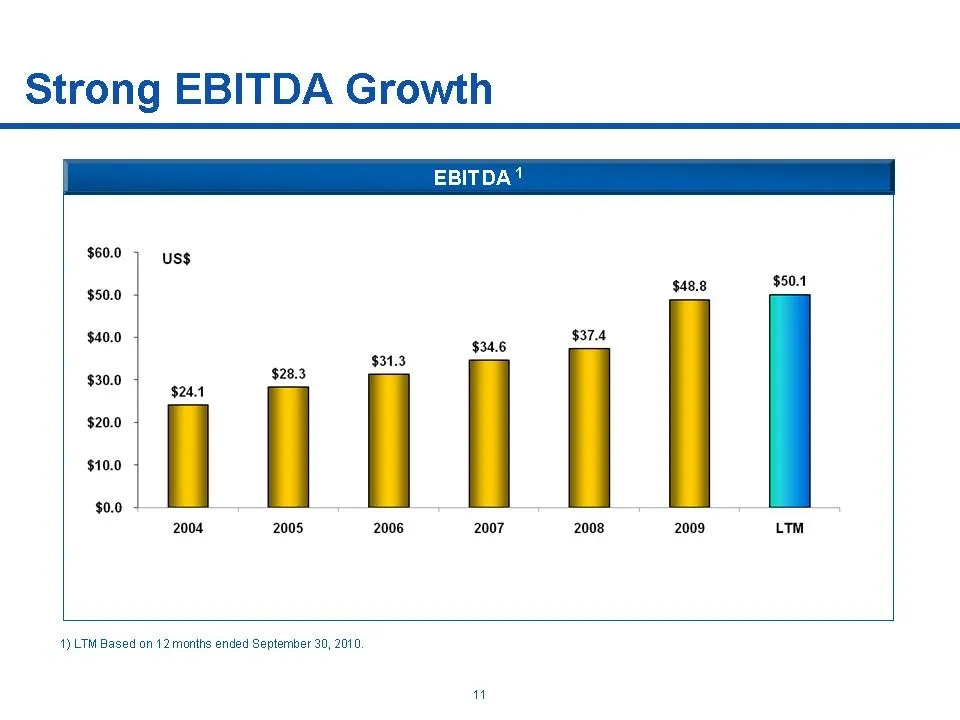
Slide 12: Strong EBITDA Growth
Strong EBITDA Growth EBITDA 1 1) LTM Based on 12 months ended September 30, 2010. 11
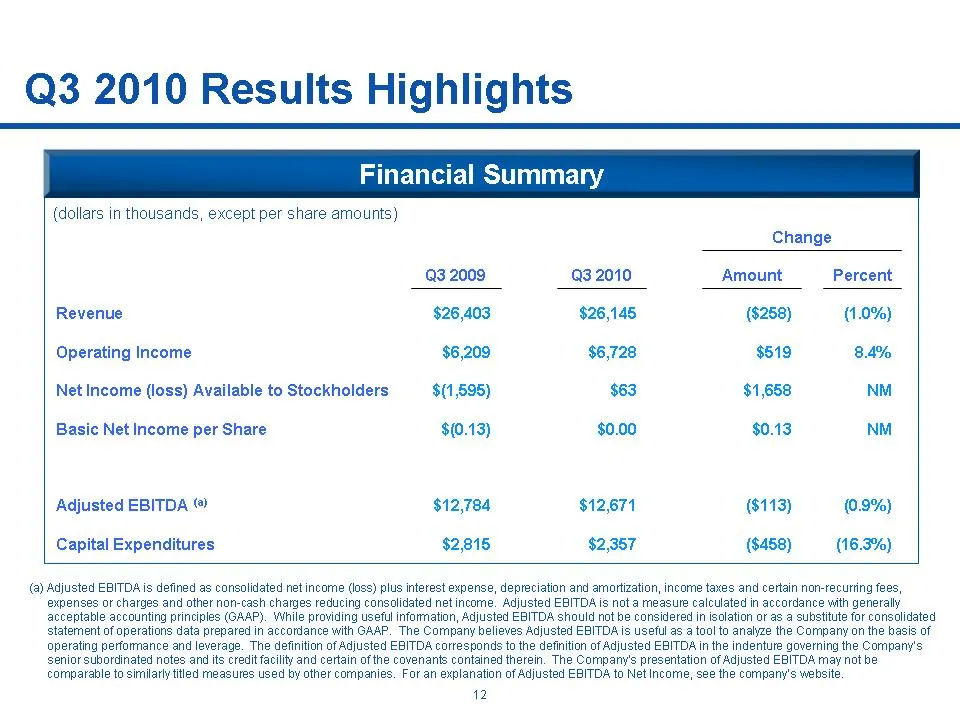
Slide 13: Q3 2010 Results Highlights
Q3 2010 Results Highlights Financial Summary (dollars in thousands, except per share amounts) Change Q3 2009 Q3 2010 Amount Percent Revenue $26,403 $26,145 ($258) (1.0%) Operating Income $6,209 $6,728 $519 8.4% Net Income (loss) Available to Stockholders $(1,595) $63 $1,658 NM Basic Net Income per S
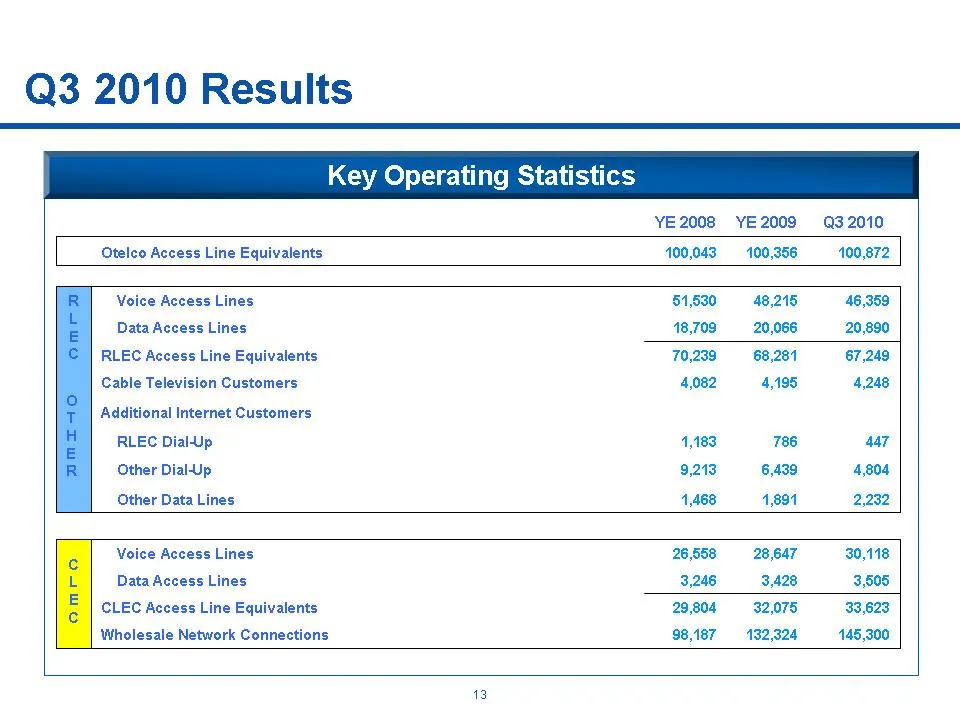
Slide 14: Q3 2010 Results Key Operating Statistics
Q3 2010 Results Key Operating Statistics R L E C O T H E R C L E C YE 2008 YE 2009 Q3 2010 Otelco Access Line Equivalents 100,043 100,356 100,872 Voice Access Lines 51,530 48,215 46,359 Data Access Lines 18,709 20,066 20,890 RLEC Access Line Equivalents 70,239 68,281 67,249 Cable Television Customer
Slide 15: Balance Sheet
Balance Sheet oO; Otelco
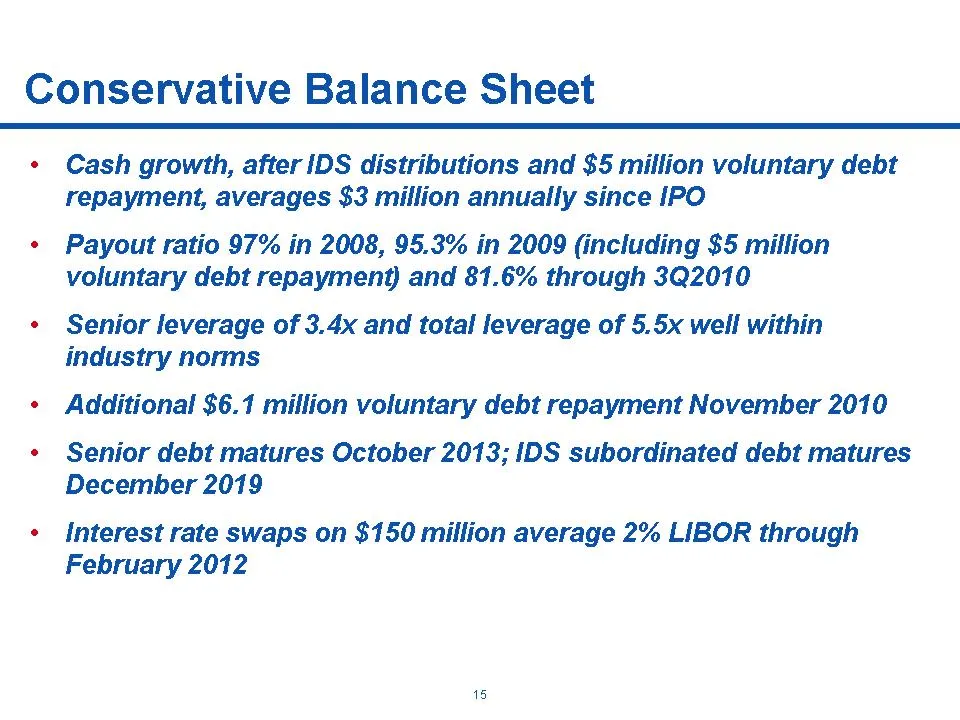
Slide 16: Conservative Balance Sheet
Conservative Balance Sheet • Cash growth, after IDS distributions and $5 million voluntary debt repayment, averages $3 million annually since IPO • Payout ratio 97% in 2008, 95.3% in 2009 (including $5 million voluntary debt repayment) and 81.6% through 3Q2010 • Senior leverage of 3.4x and total lev
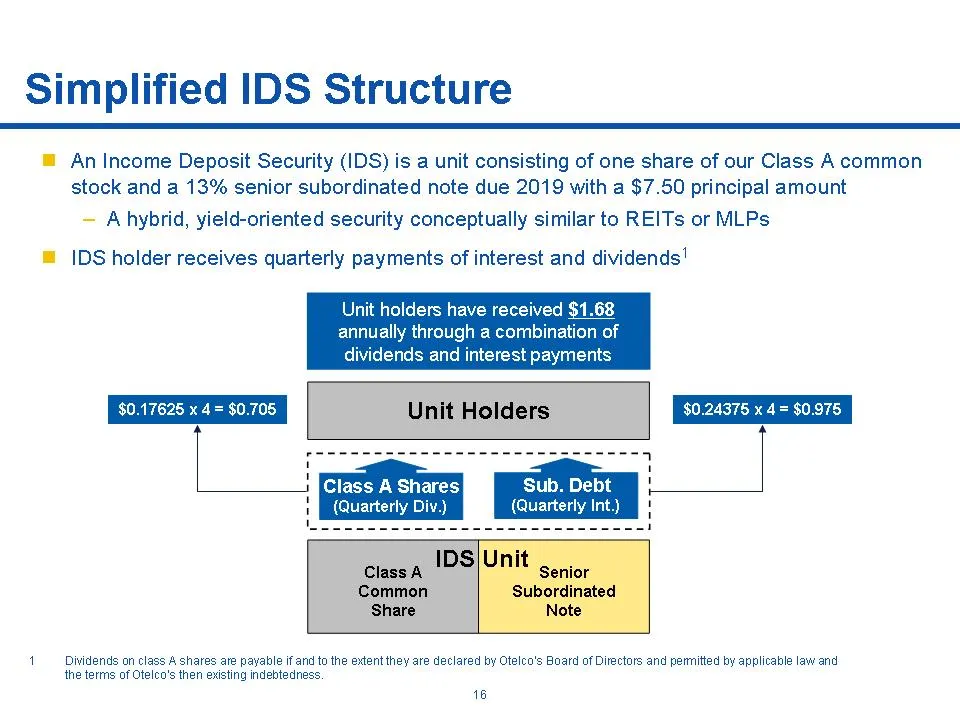
Slide 17: Simplified IDS Structure
Simplified IDS Structure . An Income Deposit Security (IDS) is a unit consisting of one share of our Class A common stock and a 13% senior subordinated note due 2019 with a $7.50 principal amount – A hybrid, yield-oriented security conceptually similar to REITs or MLPs . IDS holder receives quarterl
Slide 18: Dividend Policy
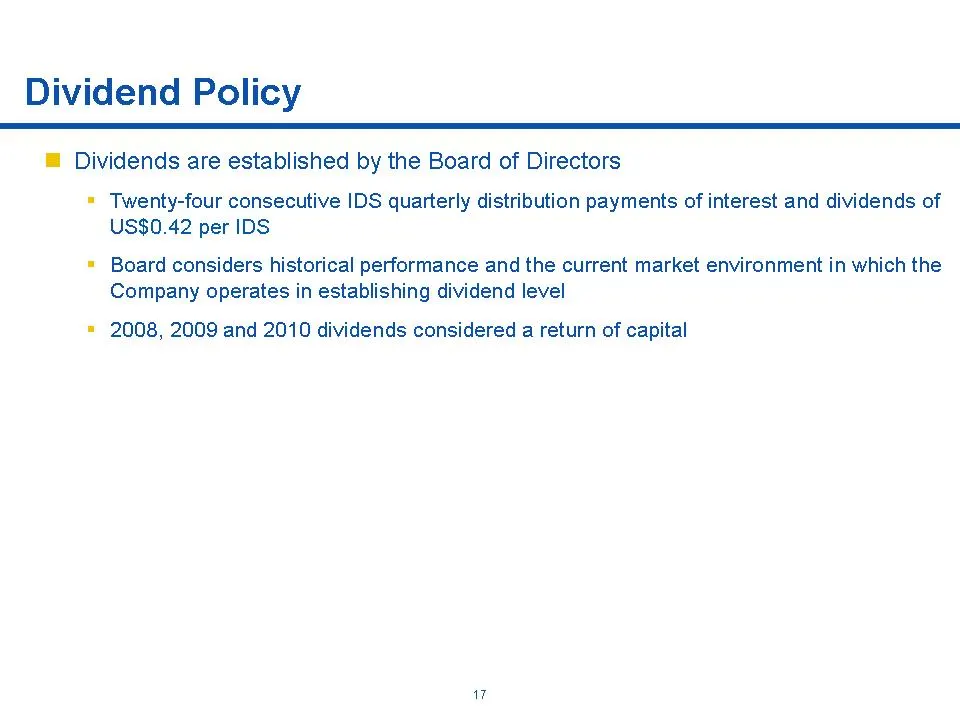
Dividend Policy . Dividends are established by the Board of Directors . Twenty-four consecutive IDS quarterly distribution payments of interest and dividends of US$0.42 per IDS . Board considers historical performance and the current market environment in which the Company operates in establishing d
Slide 19: Cumulative Return
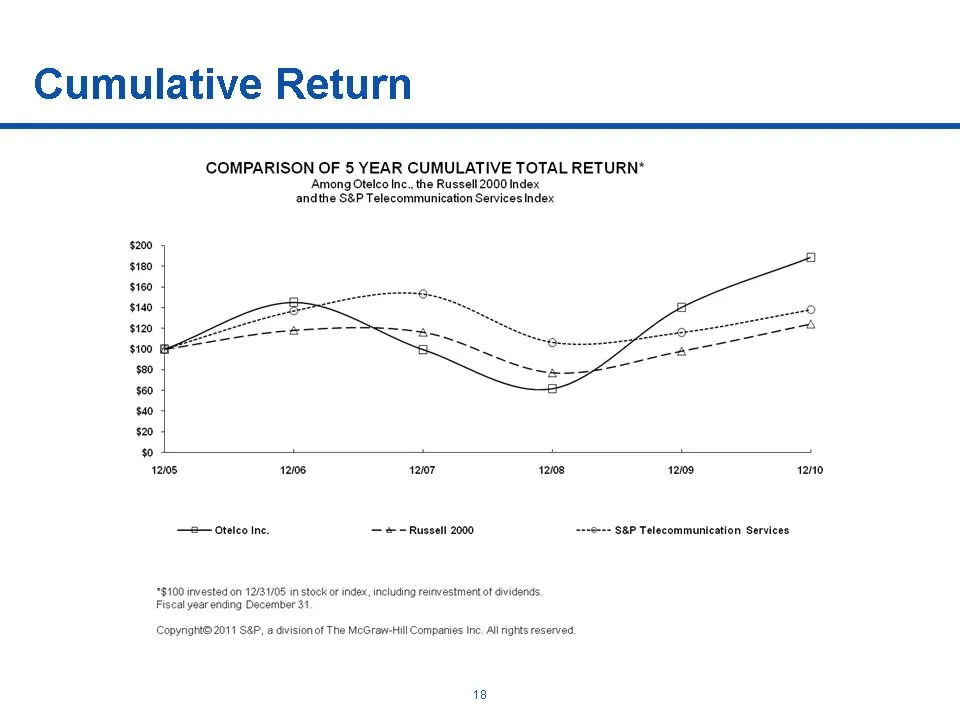
Cumulative Return COMPARISON OF 5 YEAR CUMULATIVE TOTAL RETURN* ‘Among Otelco Inc., the Russell 2000 Index. andthe S&P Telecommunication Servicesindex —S oteteo ine. — =~ Russell 2000 s+-o--+ SBP Telecommunication Services "$100 invested on 12/31/08 in stock or index, including reinvestment of divid
Slide 20: Michael D. Weaver - CEO, Curtis L. Garner, Jr. - CFO
Michael D. Weaver -CEO Curtis L. Garner, Jr. -CFO
Source: SEC EDGAR · 8-K filed Feb 9, 2011
More decks from Otelco Inc
 Investor Presentation (May 2020)18 slides · May 14, 2020
 FY2019 Earnings Presentation34 slides · Mar 9, 2020
 Investor Presentation (August 2019)37 slides · Aug 13, 2019
 Investor Presentation (May 2019)36 slides · May 8, 2019
 FY2018 Earnings Presentation20 slides · Mar 4, 2019
 Q3 2018 Earnings Presentation20 slides · Nov 7, 2018