Detection Technology Oy · OMXHEX:DETEC
Detection Technology Oy — Q1 2017 Earnings Presentation
11 slides from Detection Technology Oy's earnings presentation, Apr 26, 2017

Slide 1: Business Review Q1 2017
BUSINESS REVIEW Q1 2017 PRESIDENT AND CEO HANNU MARTOLA | DETECTION TECHNOLOGY PLC | 26 APRIL 2017 1 26/04/2017 CONFIDENTIAL | Presentation name / Author

Slide 2: Highlights Q1 2017
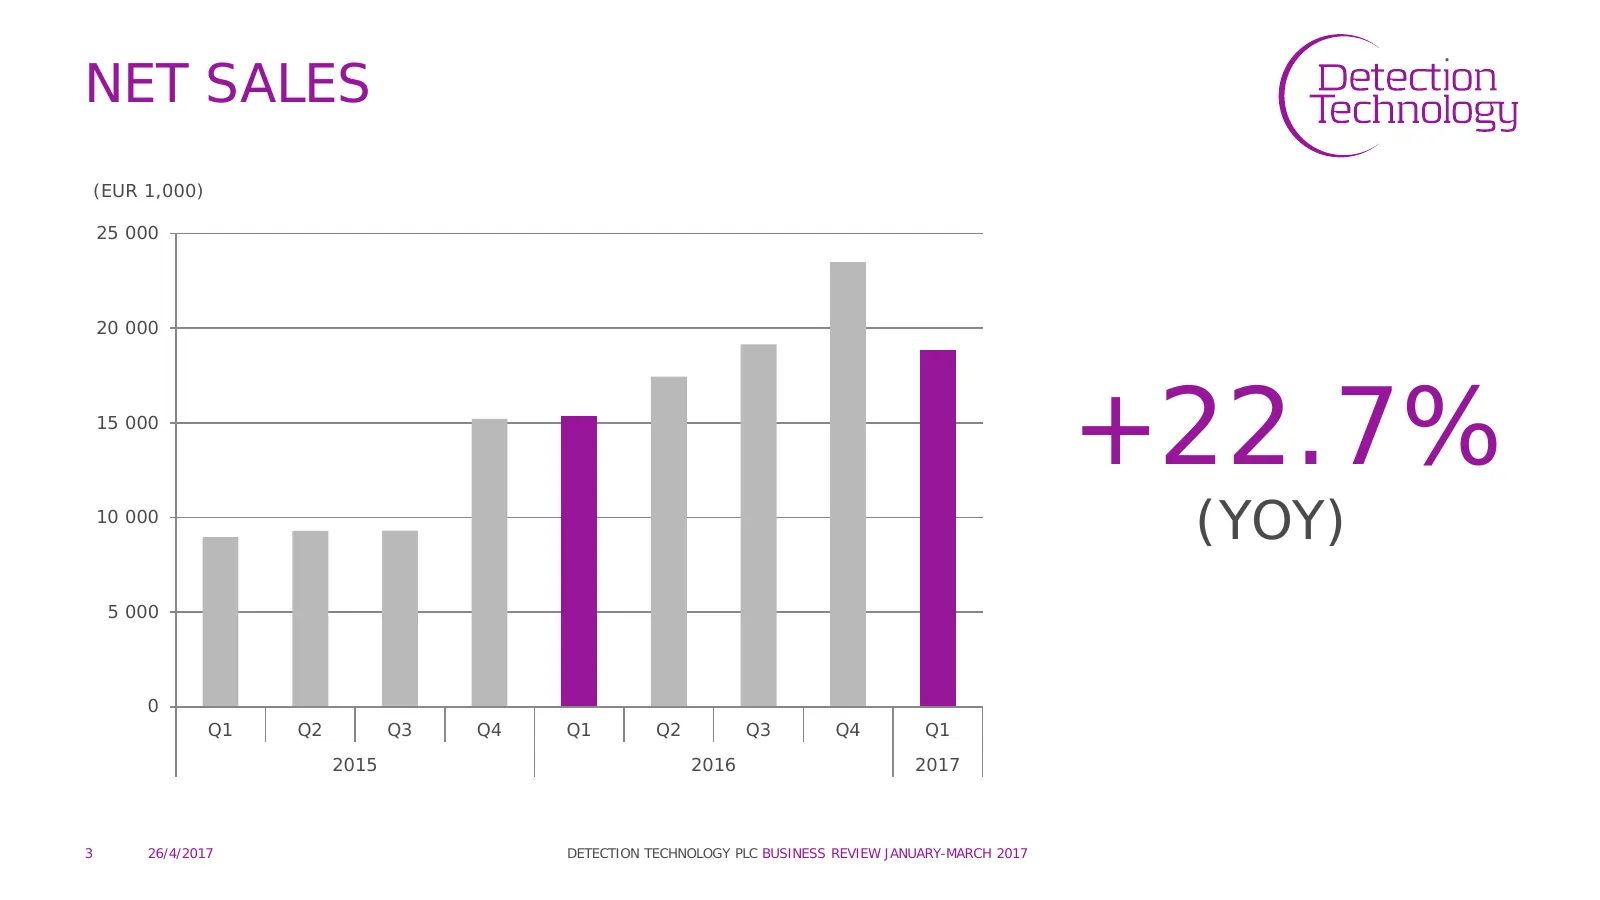
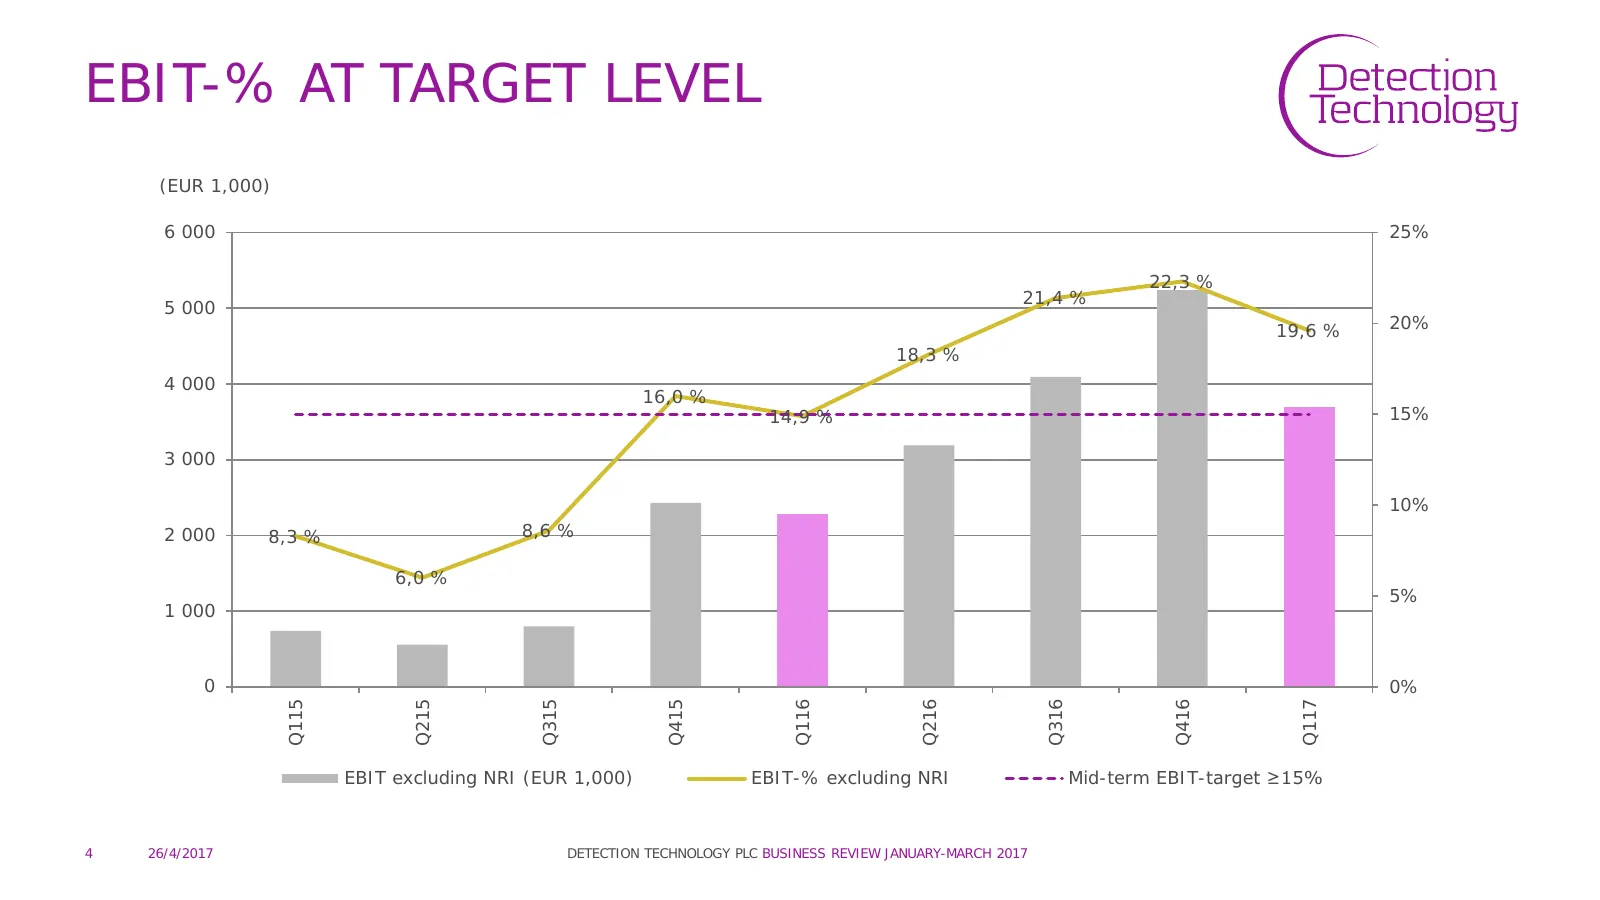
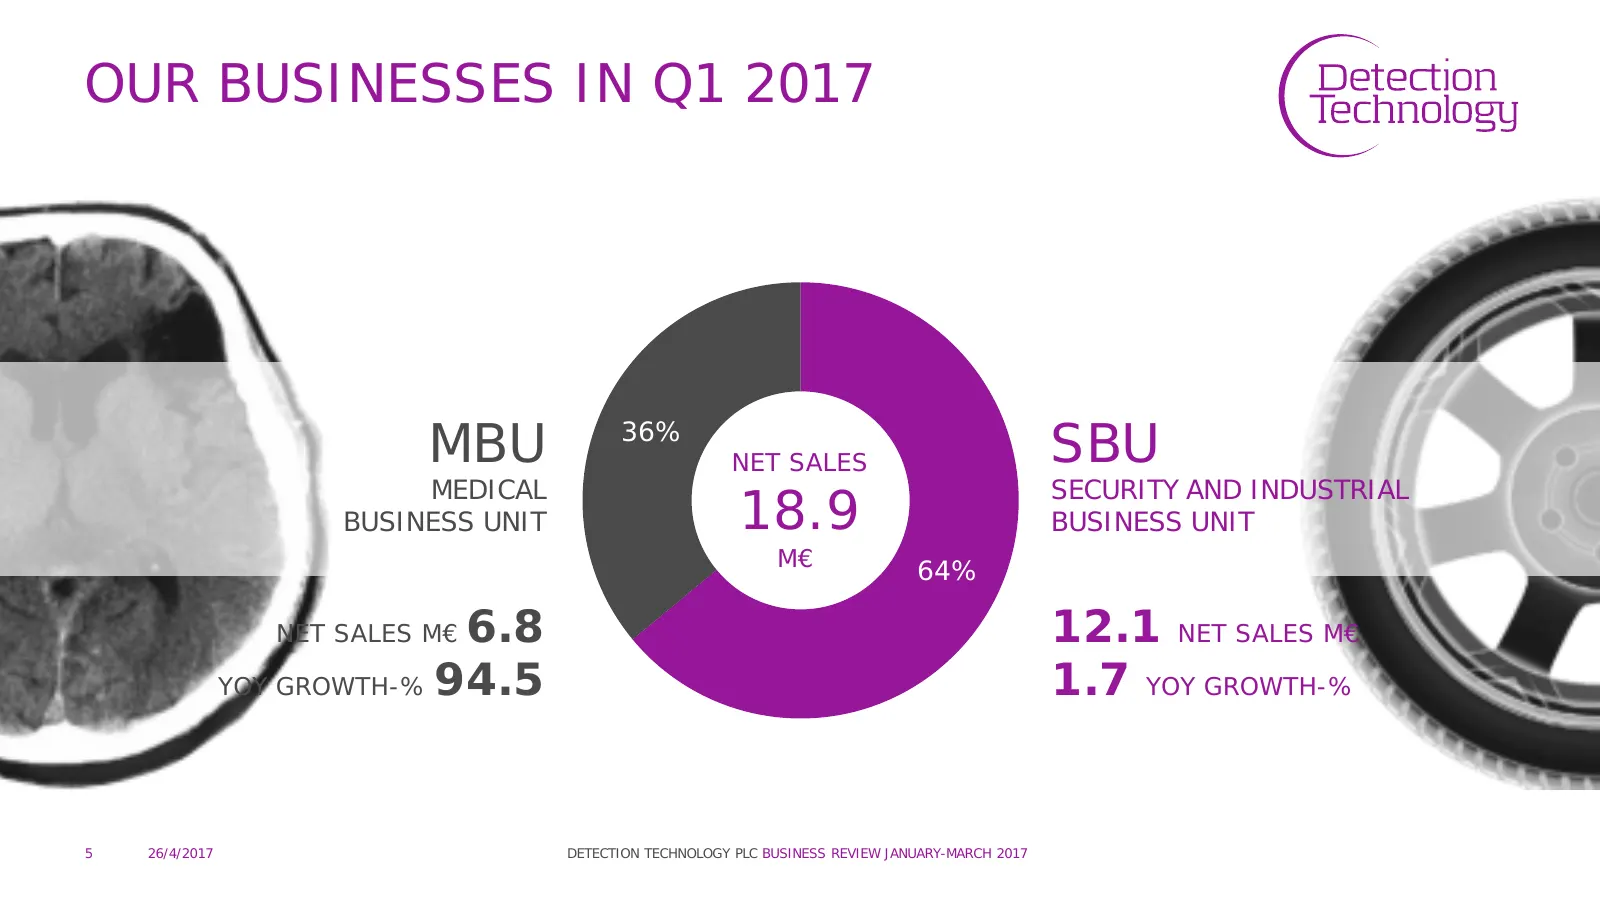
HIGHLIGHTS Q1 2017 • Net sales increased by 22.7% to EUR 18.9 M (15.4) • EBIT was EUR 3.7 M (2.3) • EBIT-% was 19.6% of net sales (14.9%) • MBU sales grew 95% due to good demand for products transferred to production last year • SBU had a moderate growth of 2% as logistics companies reduced their eq
Slide 3: Net Sales
NET SALES (EUR 1,000) 25 000 20 000 15 000 +22.7% 10 000 (YOY) 5 000 0 Q1 Q2 Q3 Q4 Q1 Q2 Q3 Q4 Q1 2015 2016 2017 3 26/4/2017 DETECTION TECHNOLOGY PLC BUSINESS REVIEW JANUARY-MARCH 2017
Slide 4: EBIT-% at Target Level
EBIT-% AT TARGET LEVEL (EUR 1,000) 6 000 25% 22,3 % 21,4 % 5 000 19,6 % 20% 18,3 % 4 000 16,0 % 14,9 % 15% 3 000 10% 2 000 8,3 % 8,6 % 6,0 % 5% 1 000 0 0% Q115 Q215 Q315 Q415 Q116 Q216 Q316 Q416 Q117 EBIT excluding NRI (EUR 1,000) EBIT-% excluding NRI Mid-term EBIT-target ≥15% 4 26/4/2017 DETECTION
Slide 5: Our Businesses in Q1 2017
OUR BUSINESSES IN Q1 2017 MBU 36% NET SALES SBU MEDICAL SECURITY AND INDUSTRIAL BUSINESS UNIT 18.9 BUSINESS UNIT M€ 64% 6.8 NET SALES M€ 12.1 NET SALES M€ YOY GROWTH-% 94.5 1.7 YOY GROWTH-% 5 26/4/2017 DETECTION TECHNOLOGY PLC BUSINESS REVIEW JANUARY-MARCH 2017
Slide 6: Sales Escalated in Americas
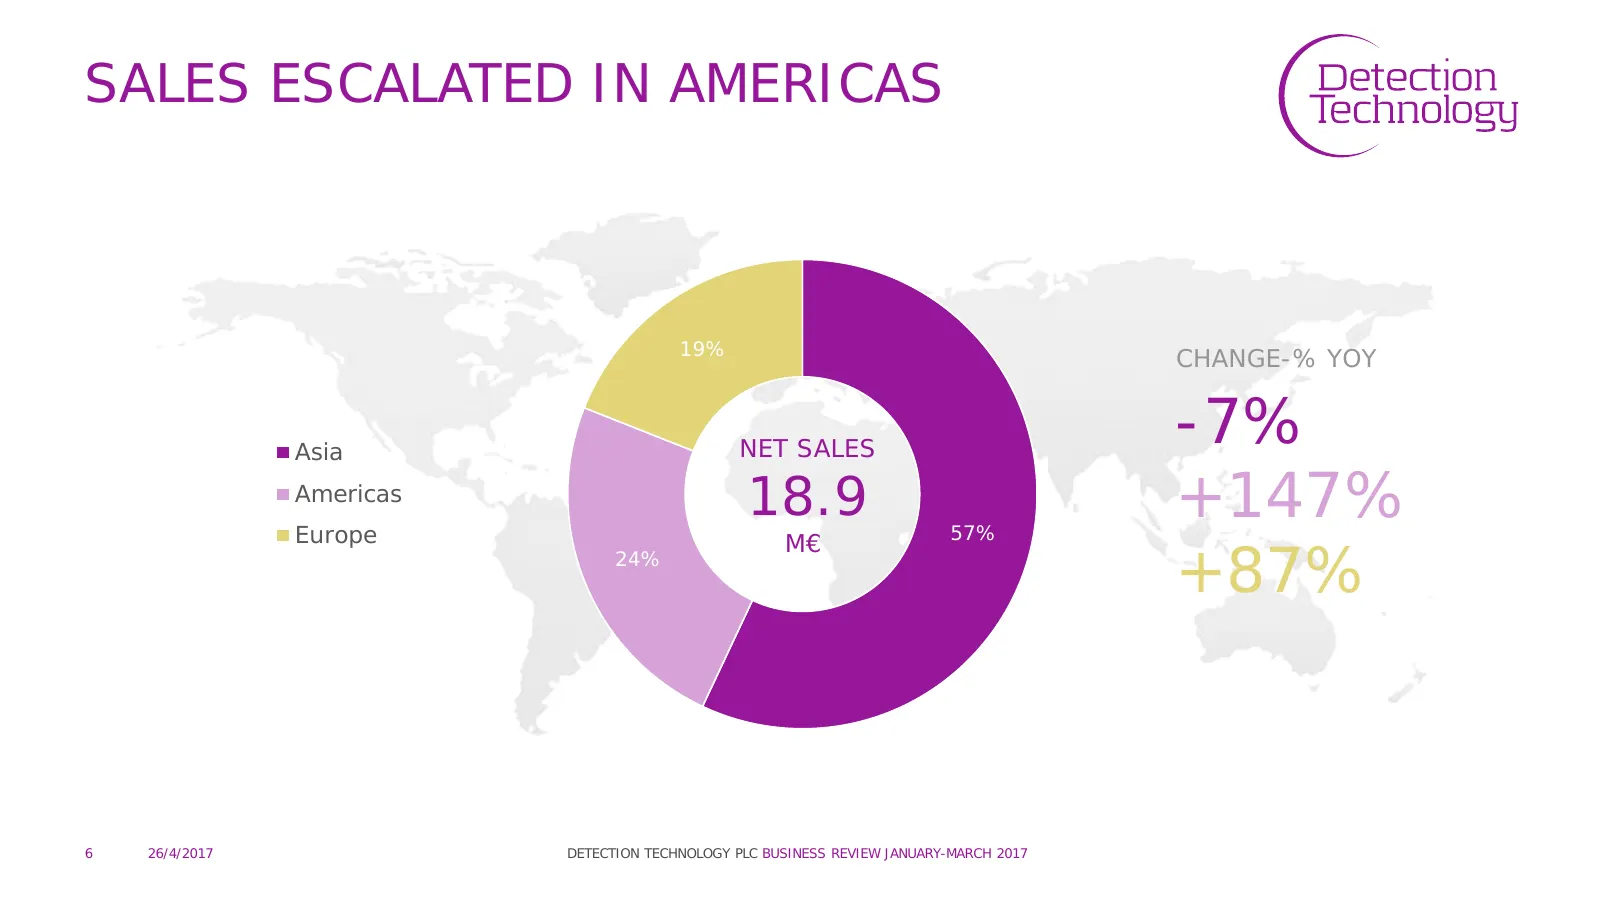
SALES ESCALATED IN AMERICAS 19% CHANGE-% YOY Asia NET SALES -7% Americas Europe 18.9 57% +147% M€ 24% +87% 6 26/4/2017 DETECTION TECHNOLOGY PLC BUSINESS REVIEW JANUARY-MARCH 2017
Slide 7: Key Figures
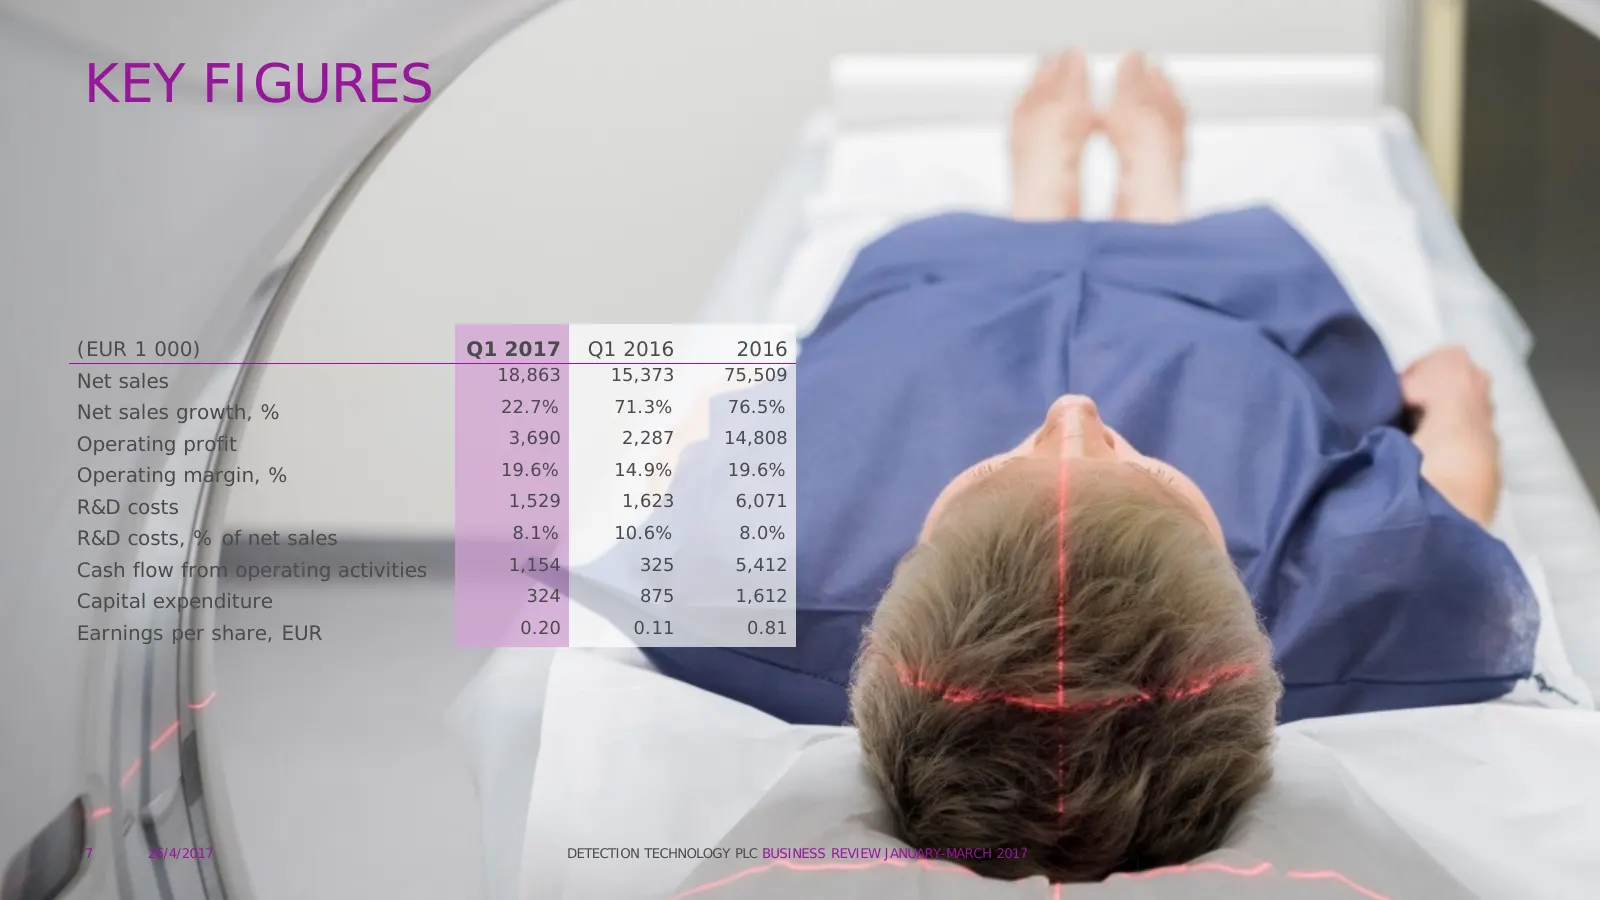
KEY FIGURES (EUR 1 000) Q1 2017 Q1 2016 2016 Net sales 18,863 15,373 75,509 Net sales growth, % 22.7% 71.3% 76.5% Operating profit 3,690 2,287 14,808 Operating margin, % 19.6% 14.9% 19.6% R&D costs 1,529 1,623 6,071 R&D costs, % of net sales 8.1% 10.6% 8.0% Cash flow from operating activities 1,154

Slide 8: Strategy Implementation
STRATEGY IMPLEMENTATION • Focus on ensuring sufficient shipments and production capacity to meet market needs • Expansion of the Beijing factory started, new facilities will be taken into use in May • Winning new customers and projects • Broadening of technology base 8 26/4/2017 DETECTION TECHNOLOGY
Slide 9: Business Outlook
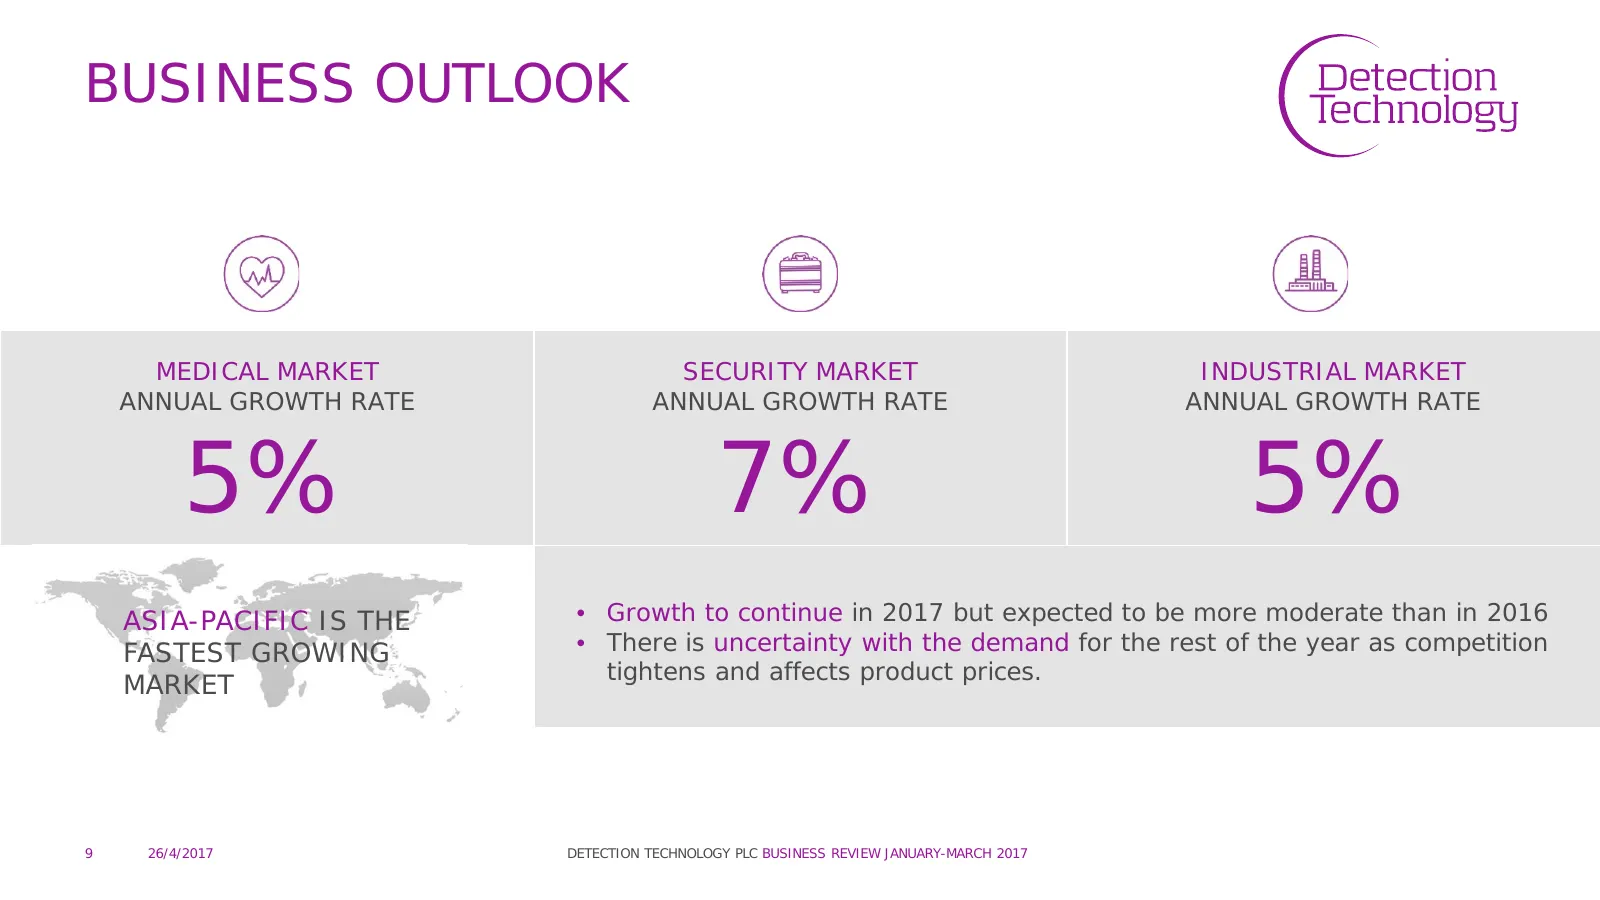
BUSINESS OUTLOOK MEDICAL MARKET SECURITY MARKET INDUSTRIAL MARKET ANNUAL GROWTH RATE ANNUAL GROWTH RATE ANNUAL GROWTH RATE 5% 7% 5% ASIA-PACIFIC IS THE • Growth to continue in 2017 but expected to be more moderate than in 2016 FASTEST GROWING • There is uncertainty with the demand for the rest of th
Slide 10: Financial Targets Unchanged
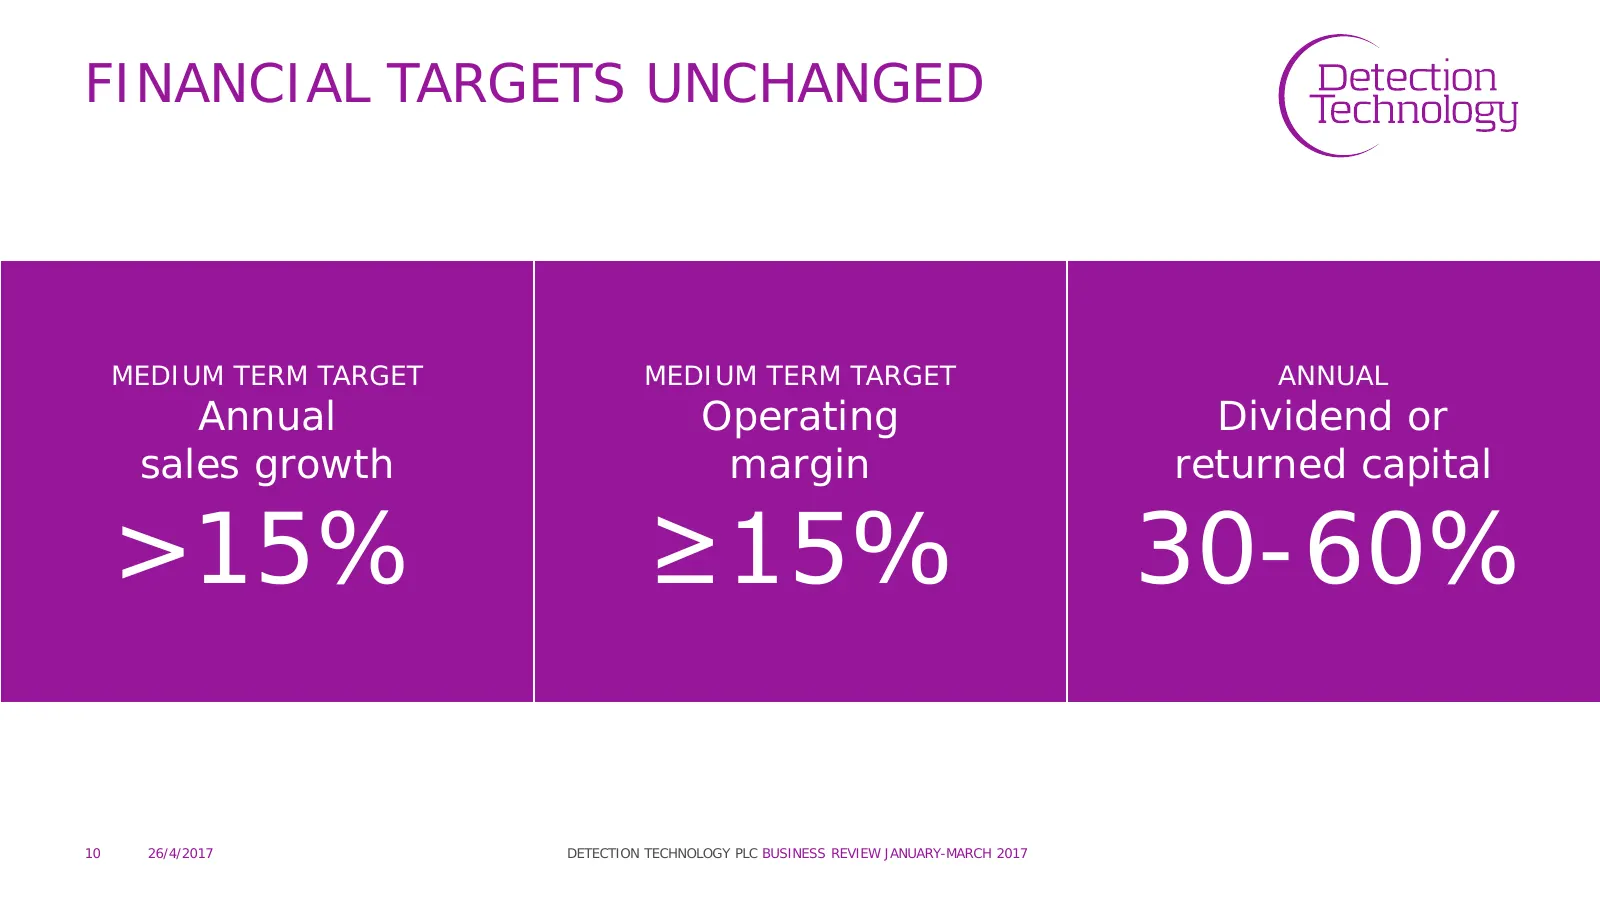
FINANCIAL TARGETS UNCHANGED MEDIUM TERM TARGET MEDIUM TERM TARGET ANNUAL Annual Operating Dividend or sales growth margin returned capital >15% ≥15% 30-60% 10 26/4/2017 DETECTION TECHNOLOGY PLC BUSINESS REVIEW JANUARY-MARCH 2017

Slide 11
Source: Internet Archive copy of deetee.com
More decks from Detection Technology Oy
 Q1 2026 Earnings Presentation15 slides · Apr 23, 2026
 Investor Day (November 2025)79 slides · Nov 18, 2025
 Q3 2025 Earnings Presentation17 slides · Oct 30, 2025
 Q1 2025 Earnings Presentation13 slides · Apr 24, 2025
 Q3 2024 Earnings Presentation17 slides · Oct 29, 2024
 Q1 2024 Earnings Presentation13 slides · Apr 25, 2024