Boston Private Financial Holdings Inc
Boston Private Financial — Q1 2006 Earnings Presentation
15 slides from Boston Private Financial's earnings presentation, Apr 28, 2006

Slide 1: First Quarter Earnings Release
st Quarter Earnings Release April 27, 2006 * * * * * * Exhibit 99.2
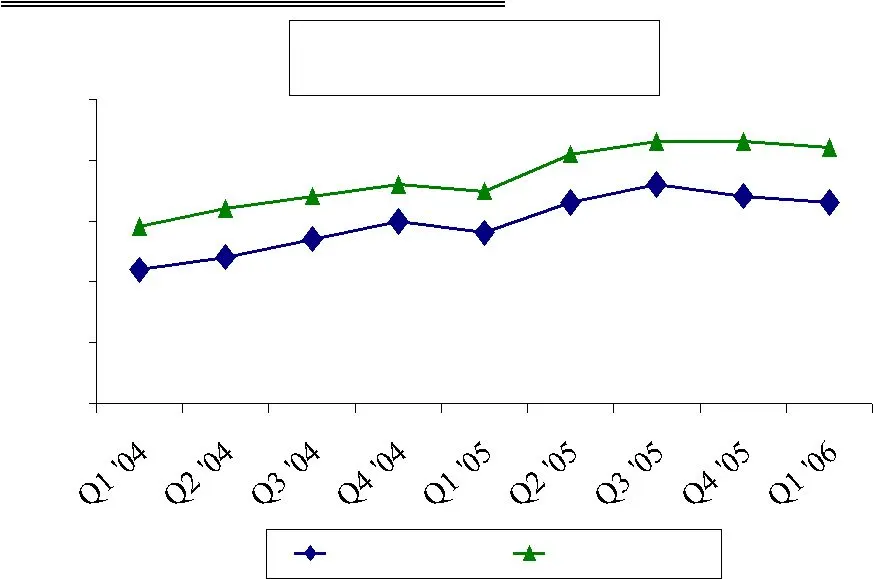
Slide 2: Quarterly Earnings Growth
Quarterly Earnings Growth EPS up 17% over Q1 ‘05 Cash EPS up 19% over Q1 ‘05 $0.24 $0.30 $0.36 $0.35 $0.44 $0.45 $0.31 $0.37 $0.02 $0.12 $0.22 $0.32 $0.42 $0.52 GAAP earnings Cash earnings
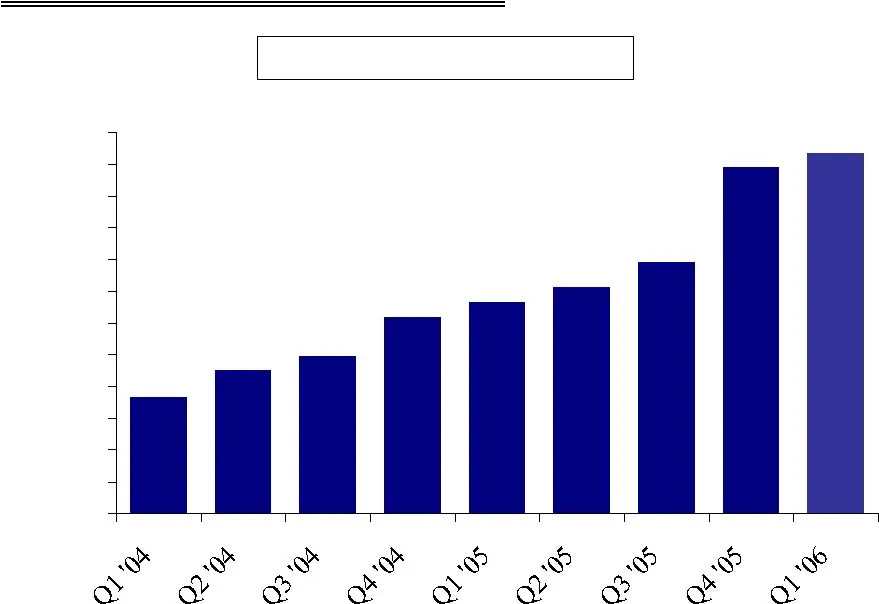
Slide 3: Quarterly Revenue
Quarterly Revenue ($ in Thousands) Revenue Up 3% over Q4 ’05 $43,302 $47,673 $49,872 $55,945 $60,660 $64,770 $79,500 $58,396 $81,850 $25,000 $30,000 $35,000 $40,000 $45,000 $50,000 $55,000 $60,000 $65,000 $70,000 $75,000 $80,000 $85,000
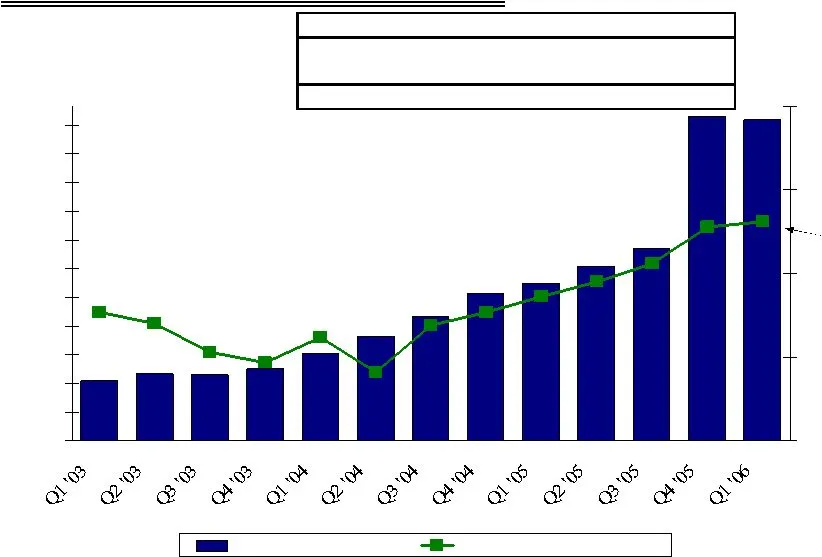
Slide 4: Net Interest Income and Margin
Net Interest Income and Margin $10,000 $13,000 $16,000 $19,000 $22,000 $25,000 $28,000 $31,000 $34,000 $37,000 $40,000 $43,000 3.00% 3.50% 4.00% 4.50% 5.00% Net Interest Income Core Net Interest Margin 4.31% ($ in Thousands) Q1 '06 Q4 '05 Change Q1 '05 Change NIM 4.02% 4.00% 2 bps 3.68% 34 bps Core
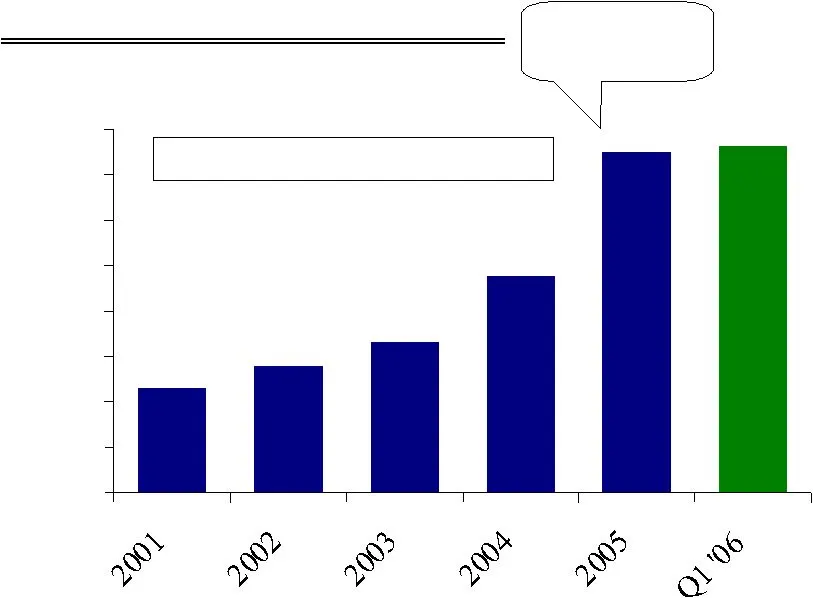
Slide 5: Deposit Growth
Deposit Growth $1,400 $1,145 $1,658 $2,386 $3,748 $3,804 $0 $500 $1,000 $1,500 $2,000 $2,500 $3,000 $3,500 $4,000 ($ in Millions) Up 1.5% over Q4’05 5 Year CAGR 30%
Slide 6: Loan Growth
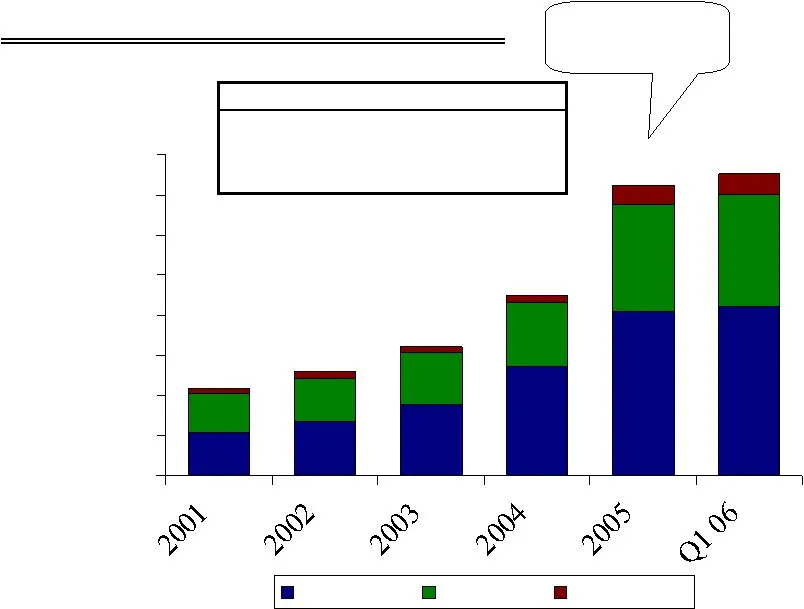
Loan Growth $1,613 $2,249 $3,625 $3,759 $1,301 $1,105 $- $500 $1,000 $1,500 $2,000 $2,500 $3,000 $3,500 $4,000 Commercial Residential HE & Other ($ in Millions) 5 Year CAGR 33% % Change from 2005 Consolidated Commercial Up 3% Residential Up 5% Total Loans Up 4%
Slide 7: Loan Portfolio
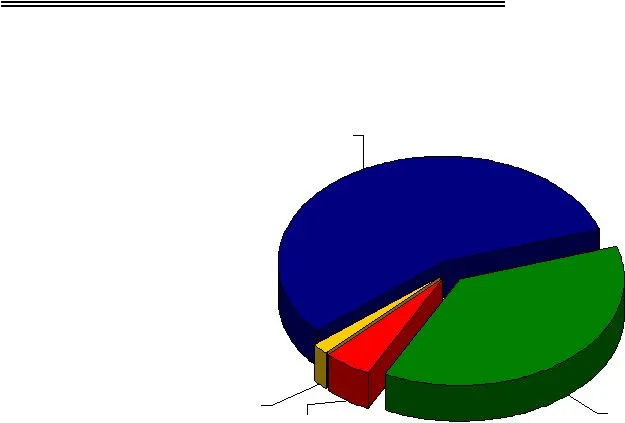
Commercial 56% Residential 37% Home Equity 5% Consumer 2% Loan Portfolio
Slide 8: Commercial Loan Portfolio
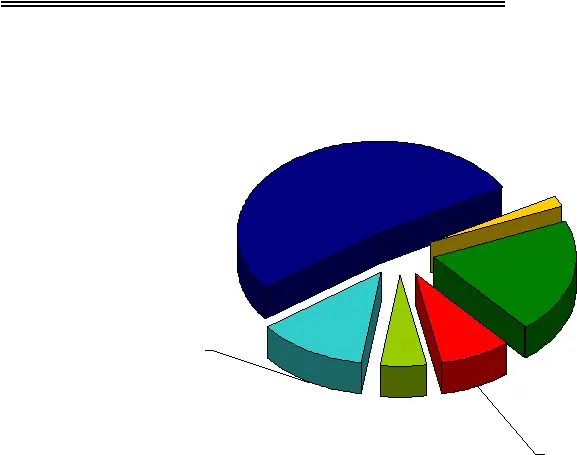
Commercial Loan Portfolio Unsecured 2% Construction 20% Secured by Cash or Marketable Securities 5% Commercial Real Estate 53% Commercial & Industrial 8% Residential Investment Properties 12%
Slide 9: Loan Portfolio Quality
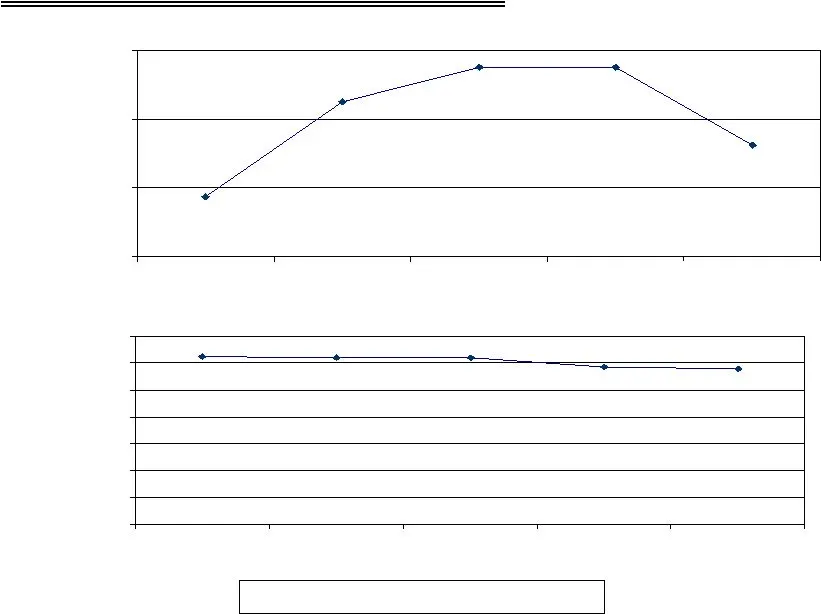
Loan Portfolio Quality 0.13% 0.22% 0.22% 0.07% 0.18% 0.00% 0.08% 0.16% 0.24% Q1 '05 Q2 '05 Q3 '05 Q4 '05 Q1 '06 Non-performing Loans/Total Loans Allowance for Loan Losses*/Total Loans *Includes allowance for off-balance sheet risk 1.16% 1.17% 1.24% 1.25% 1.24% 0.00% 0.20% 0.40% 0.60% 0.80% 1.00% 1.2
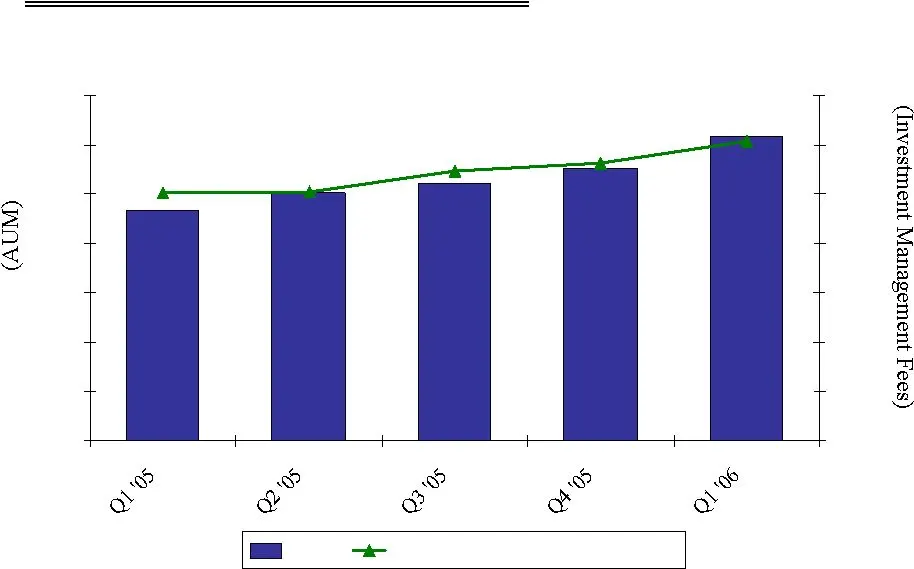
Slide 10: AUM and Investment Management Fees
$15.3 $16.0 $16.4 $17.1 $18.4 $25.2 $25.1 $27.4 $28.1 $30.4 $6.0 $8.0 $10.0 $12.0 $14.0 $16.0 $18.0 $20.0 $- $5 $10 $15 $20 $25 $30 $35 AUM Investment Management Fees Investment Management Fees ($ in Billions) ($ in Millions)
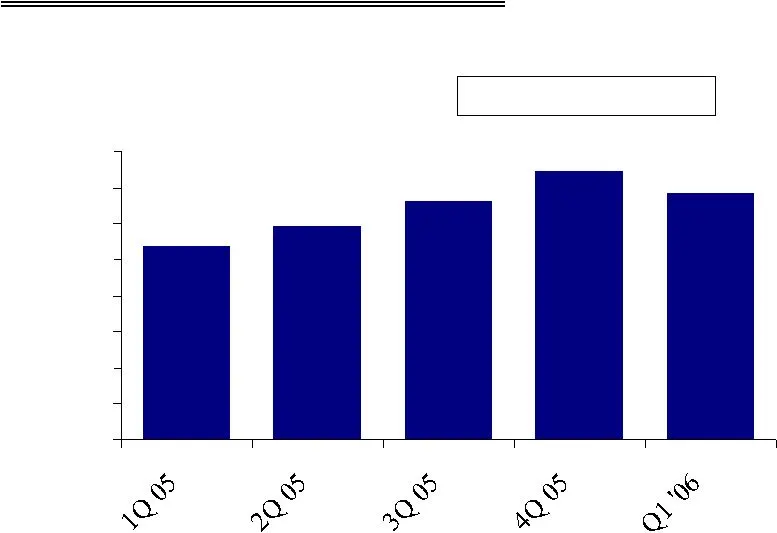
Slide 11: Wealth Advisory Fees
$4,690 $4,579 $4,824 $4,993 $4,869 $3,500 $3,700 $3,900 $4,100 $4,300 $4,500 $4,700 $4,900 $5,100 Wealth Advisory Fees Up 6.3% from Q1 2005 ($ in Thousands)
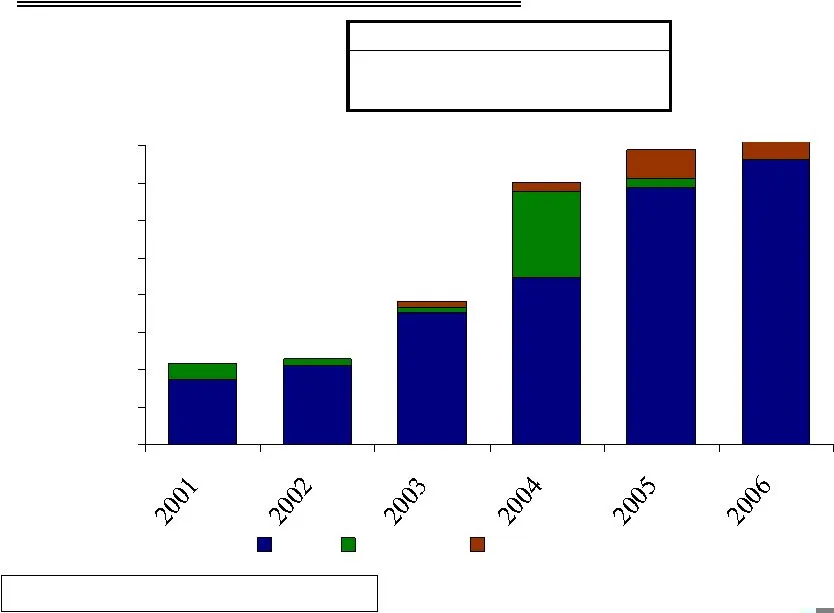
Slide 12: Assets Under Advisory/Management
Assets Under Advisory/Management $6.5 $6.9 $11.4 $21.1 $23.7 $25.4 $0.0 $3.0 $6.0 $9.0 $12.0 $15.0 $18.0 $21.0 $24.0 Core Acquired Unconsolidated ($ in Billions) Cumulative Assets Acquired $12.4 billion Consolidated All Up from 2005 7.3% 7.3% 5 year CAGR 26% 28%
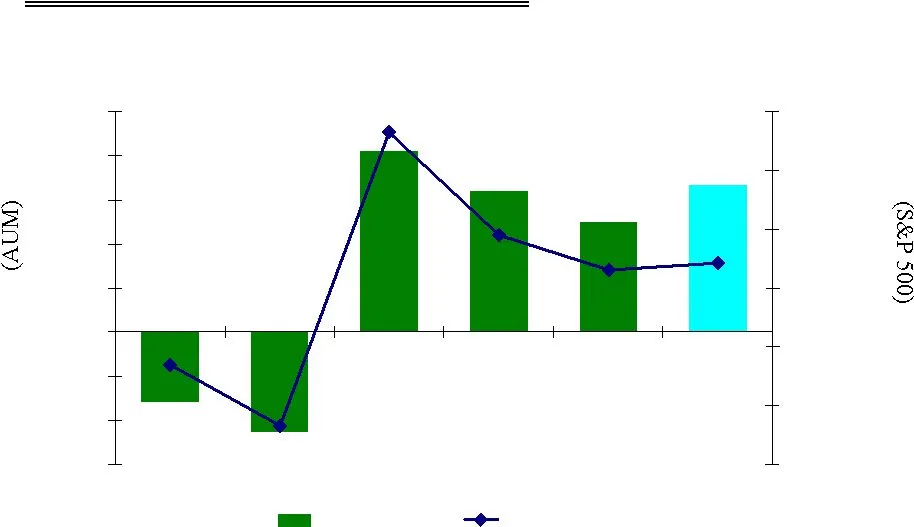
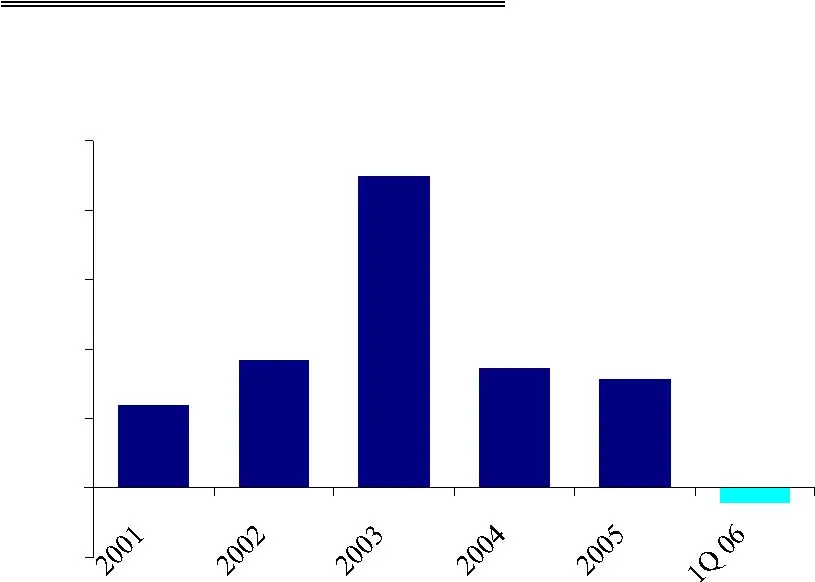
Slide 13: AUA/AUM Market Action
($0.8) ($1.1) $2.0 $1.6 $1.2 $1.7 ($1.5) ($1.0) ($0.5) $0.0 $0.5 $1.0 $1.5 $2.0 $2.5 1Q 06 -30.00% -20.00% -10.00% 0.00% 10.00% 20.00% 30.00% BPFH S&P 500 AUA/AUM – Market Action ($ in Billions)
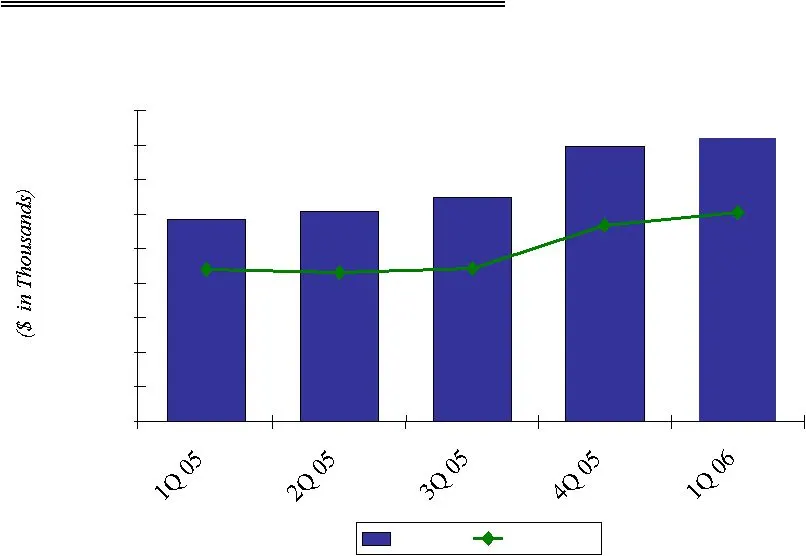
Slide 14: Change In AUA/AUM
$0.6 $0.9 $2.2 $0.8 $0.9 Change In AUA/AUM -$0.5 $0.0 $0.5 $1.0 $1.5 $2.0 $2.5 ` ($ in Billions) (0.5)% ($0.1)
Slide 15: Operating Leverage Year-over-Year
Operating Leverage Year-over-Year Revenues Up 40.2% Over Q1 2005 Expenses Up 37.8% Over Q1 2005 $0 $10,000 $20,000 $30,000 $40,000 $50,000 $60,000 $70,000 $80,000 $90,000 Revenue Expenses
Source: SEC EDGAR · 8-K filed Apr 28, 2006
More decks from Boston Private Financial Holdings Inc
 Proxy Contest (April 2021)28 slides · Apr 9, 2021
 Merger or Acquisition (April 2021)24 slides · Apr 7, 2021
 Proxy Contest (March 2021)50 slides · Mar 30, 2021
 Proxy Contest (February 2021)67 slides · Feb 2, 2021
 Merger or Acquisition (January 2021)15 slides · Jan 4, 2021
 Investor Day (May 2019)52 slides · May 6, 2019