SK Telecom Co., Ltd. · KRX:017670
SK Telecom — Q2 2016 Earnings Presentation
23 slides from SK Telecom's earnings presentation, Sep 21, 2016
Slide 1: SK telecom Investor Presentation
8 CONSECUTIVE MEMBER OF SK telecom Investor Presentation July 2016 April 2016
Slide 2: Disclaimer
Disclaimer This presentation contains forward-looking statements with respect to the financial condition, results of operations and business of SK Telecom and its subsidiaries (the “Company”) and plans and objectives of the management of the Company. The aforementioned forward-looking statements are
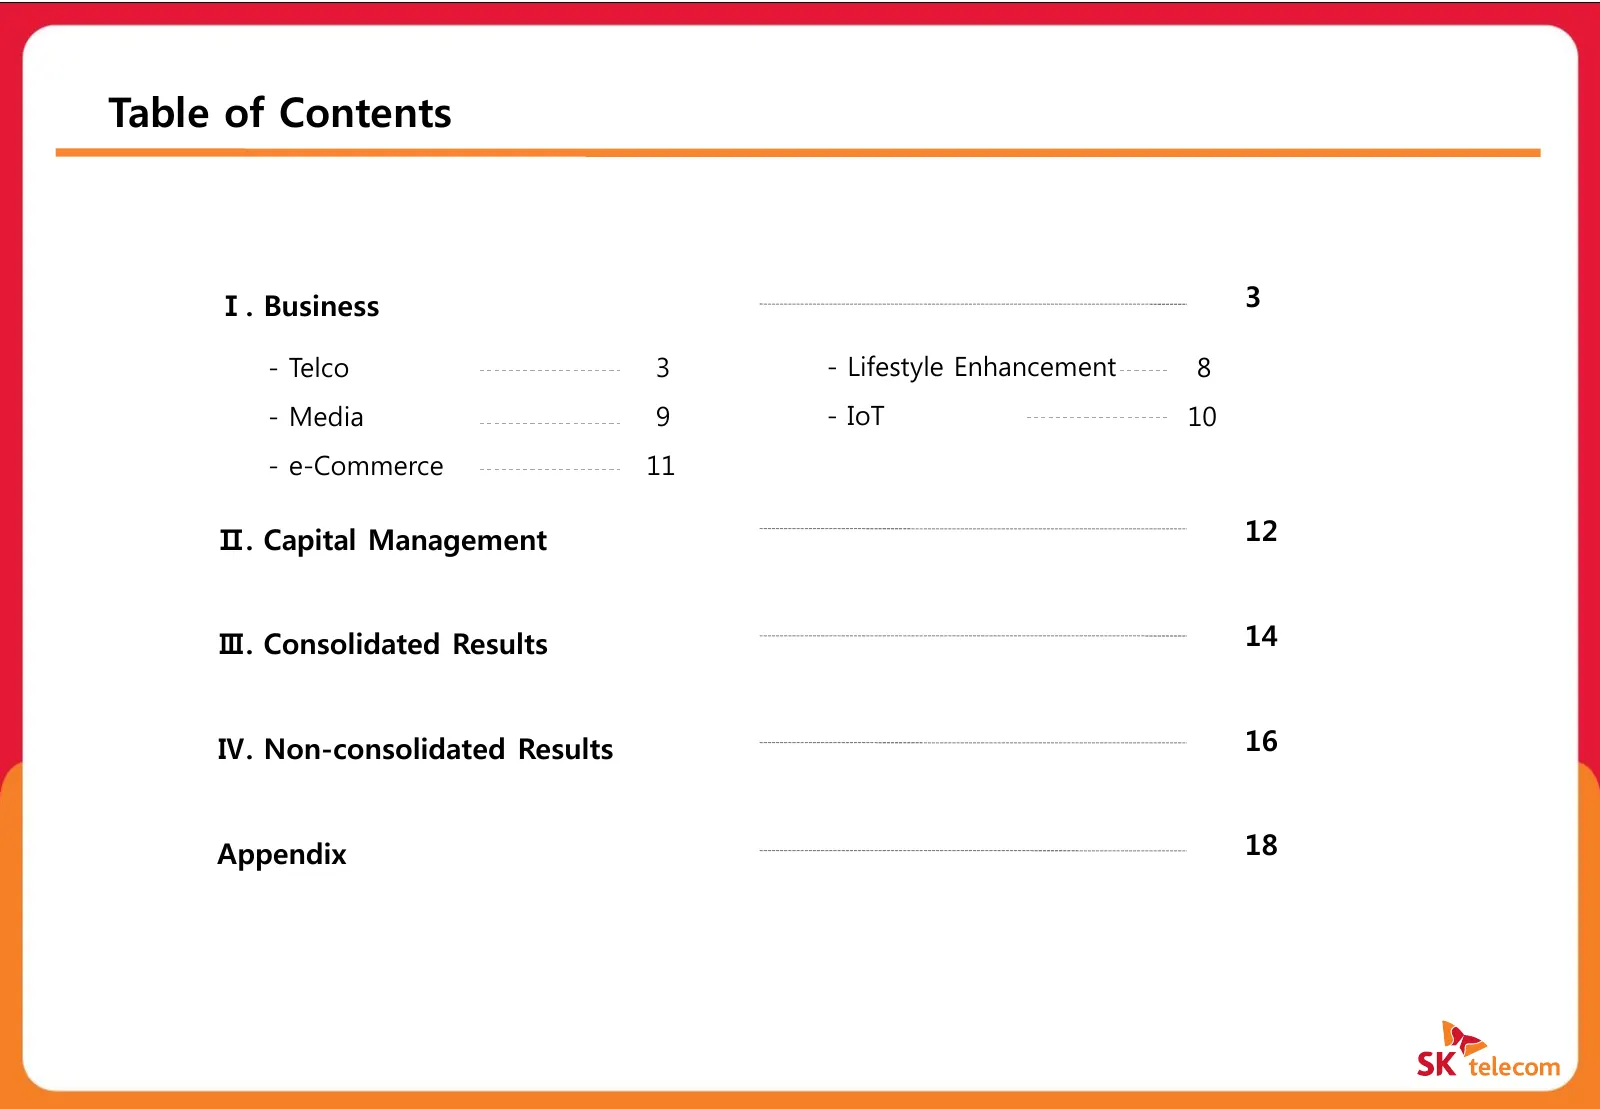
Slide 3: Table of Contents
Table of Contents Ⅰ. Business 3 - Telco 3 - Lifestyle Enhancement 8 - Media 9 - IoT 10 - e-Commerce 11 Ⅱ. Capital Management 12 Ⅲ. Consolidated Results 14 Ⅳ. Non-consolidated Results 16 Appendix 18
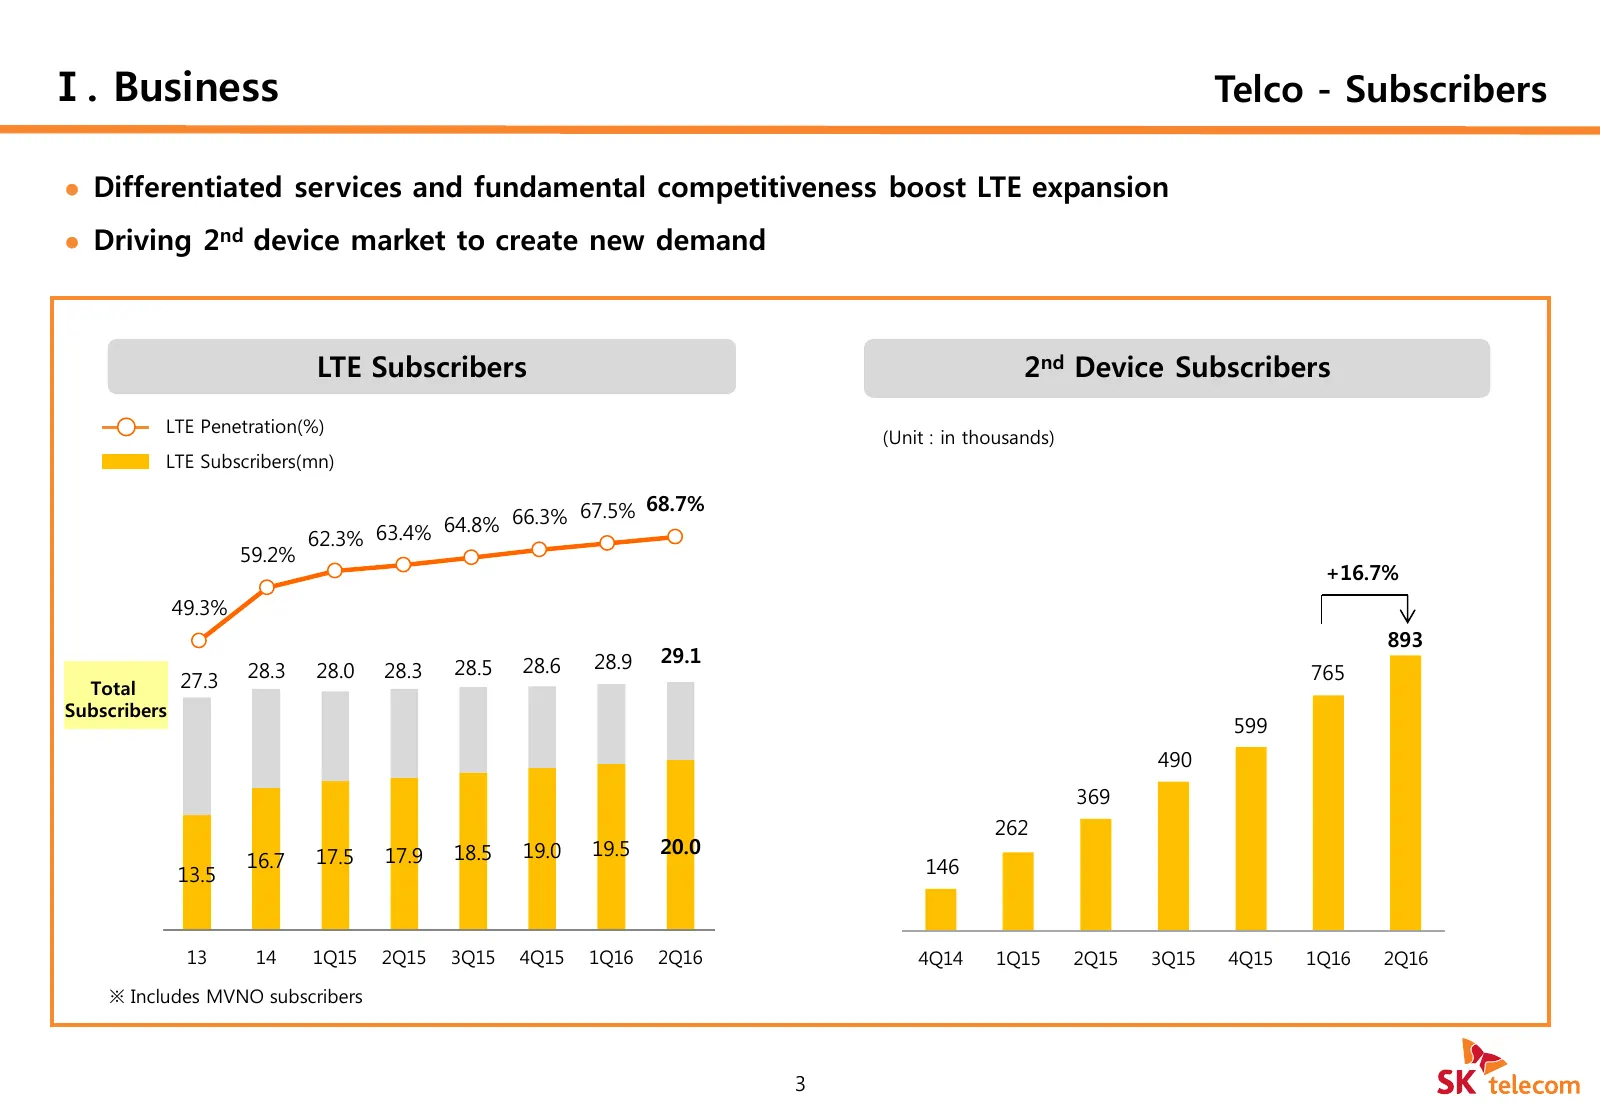
Slide 4: Telco - Subscribers
Ⅰ. Business Telco - Subscribers Differentiated services and fundamental competitiveness boost LTE expansion Driving 2nd device market to create new demand LTE Subscribers 2nd Device Subscribers LTE Penetration(%) (Unit : in thousands) LTE Subscribers(mn) 68.7% 64.8% 66.3% 67.5% 62.3% 63.4% 59.2%
Slide 5: Telco - ARPU
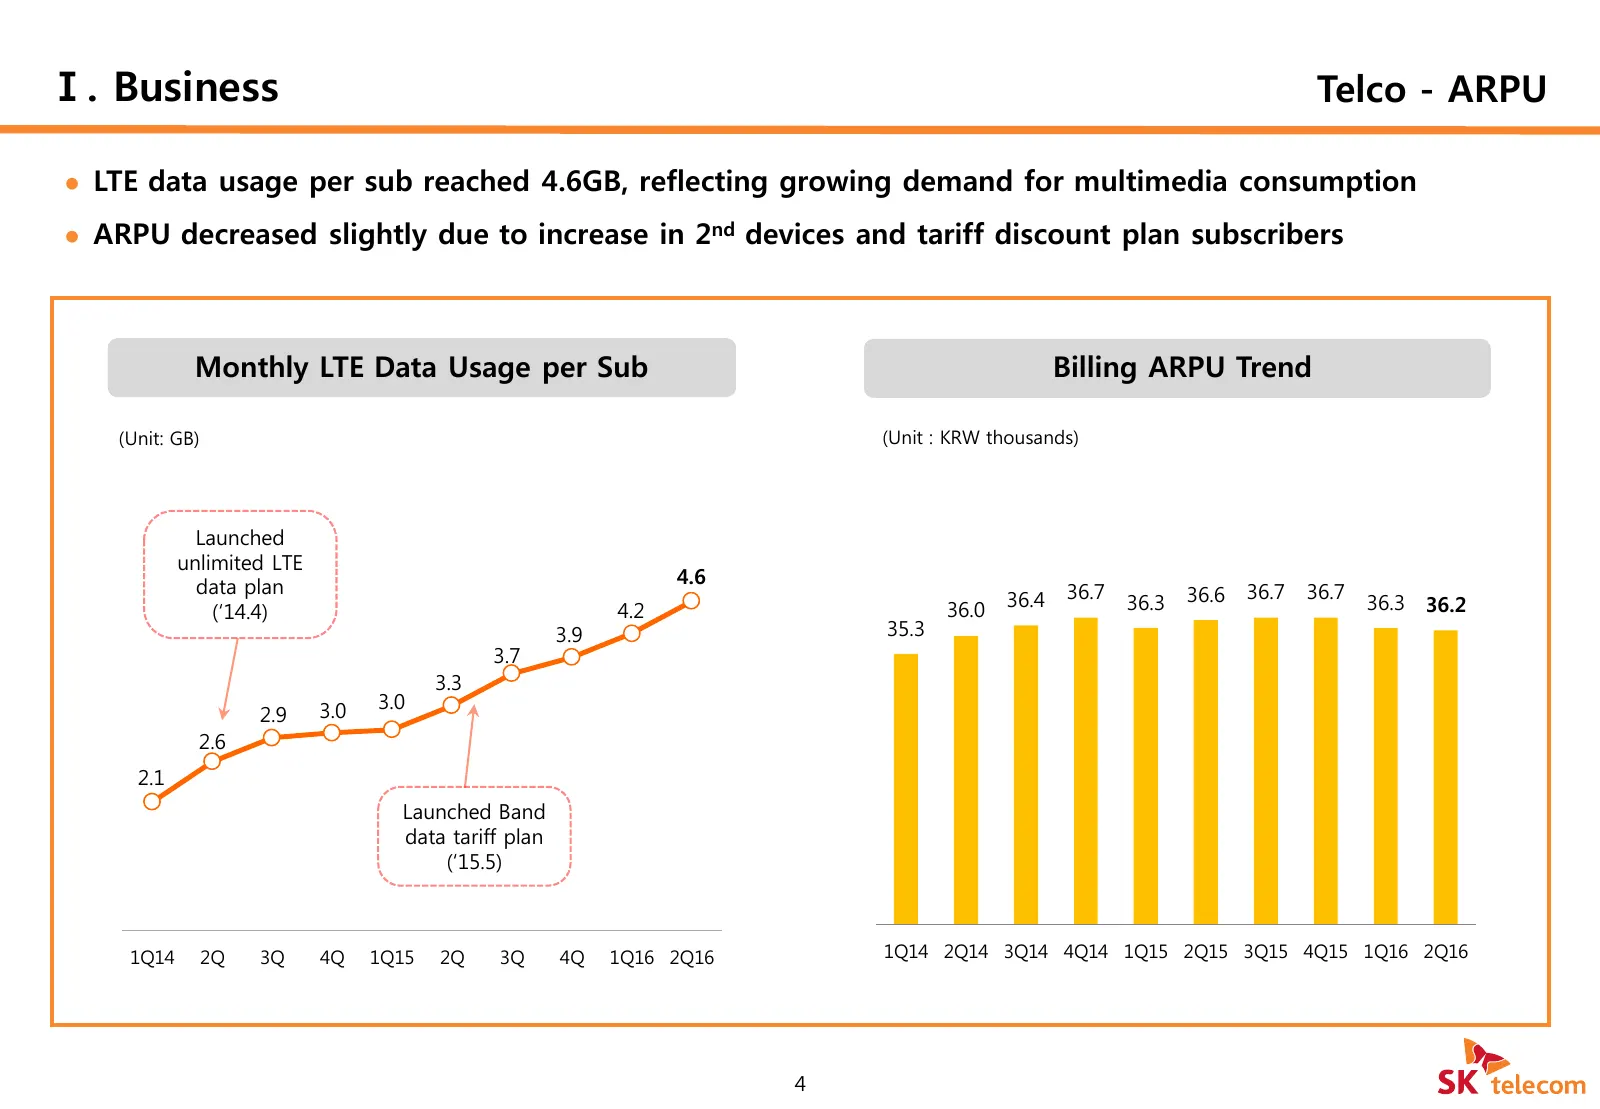
Ⅰ. Business Telco - ARPU LTE data usage per sub reached 4.6GB, reflecting growing demand for multimedia consumption ARPU decreased slightly due to increase in 2nd devices and tariff discount plan subscribers Monthly LTE Data Usage per Sub Billing ARPU Trend (Unit: GB) (Unit : KRW thousands) Laun
Slide 6: Telco – Market Trend
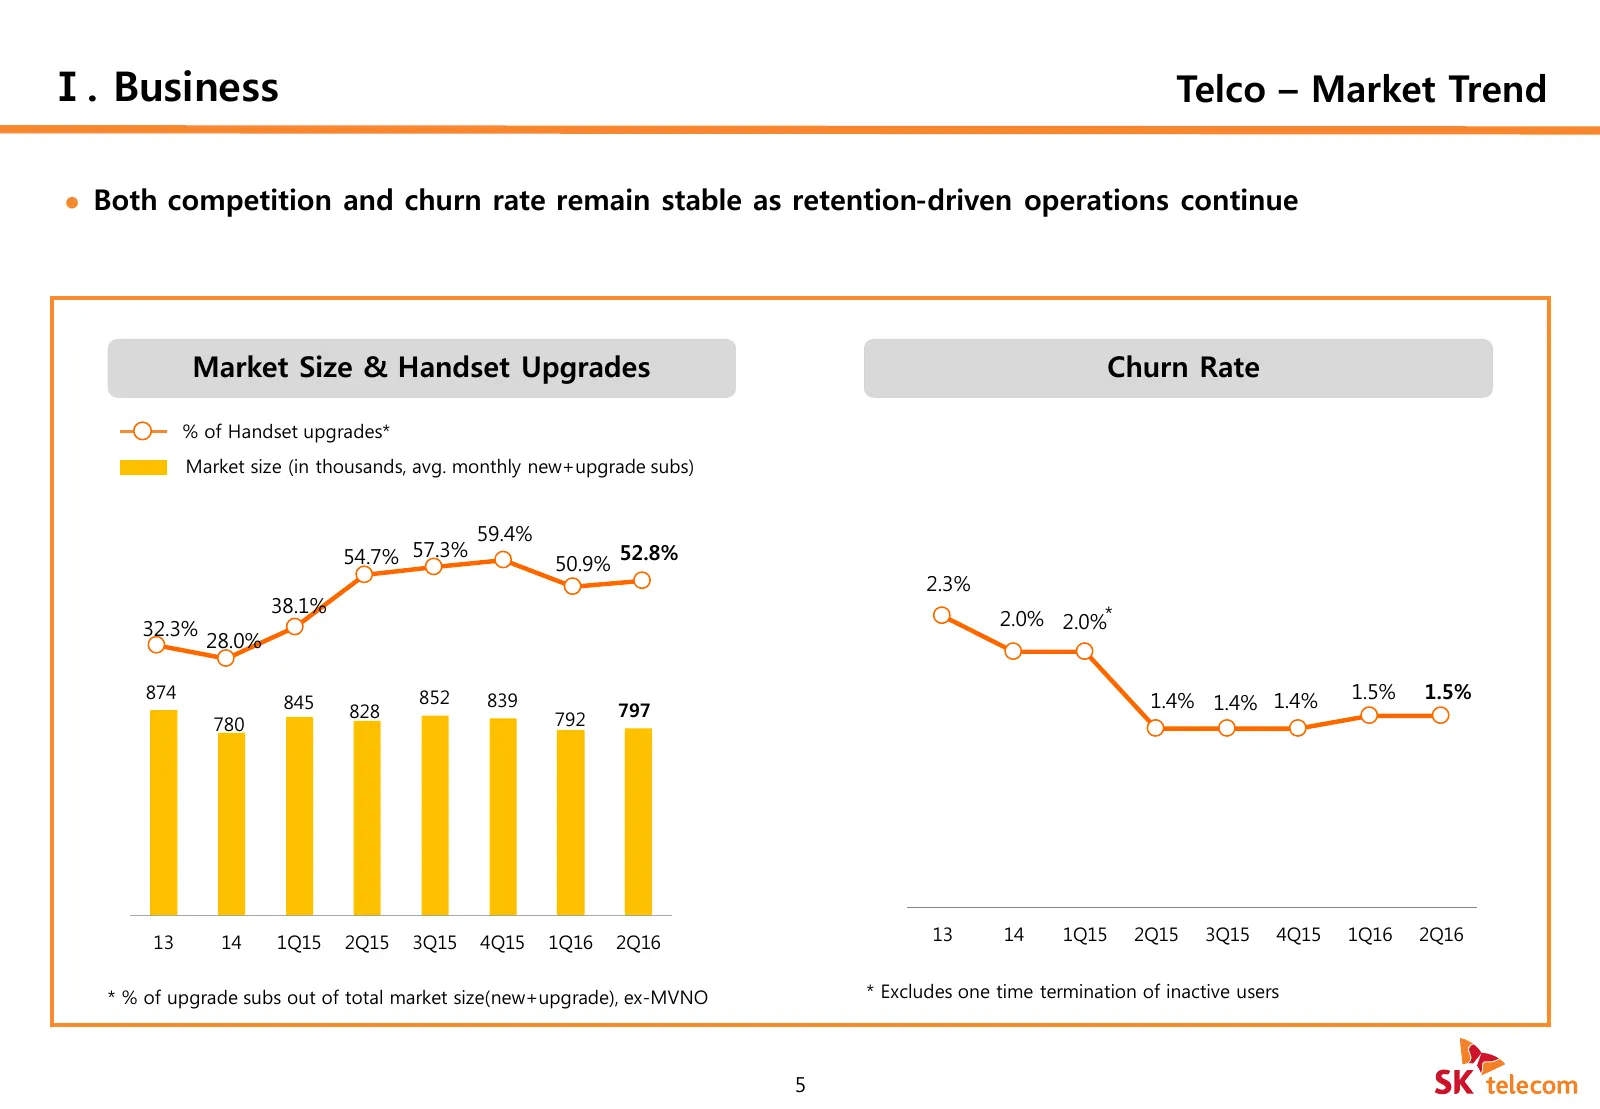
Ⅰ. Business Telco – Market Trend Both competition and churn rate remain stable as retention-driven operations continue Market Size & Handset Upgrades Churn Rate % of Handset upgrades* Market size (in thousands, avg. monthly new+upgrade subs) 59.4% 54.7% 57.3% 50.9% 52.8% 2.3% 38.1% 32.3% 2.0% 2.0%
Slide 7: Telco – Spectrum/CAPEX
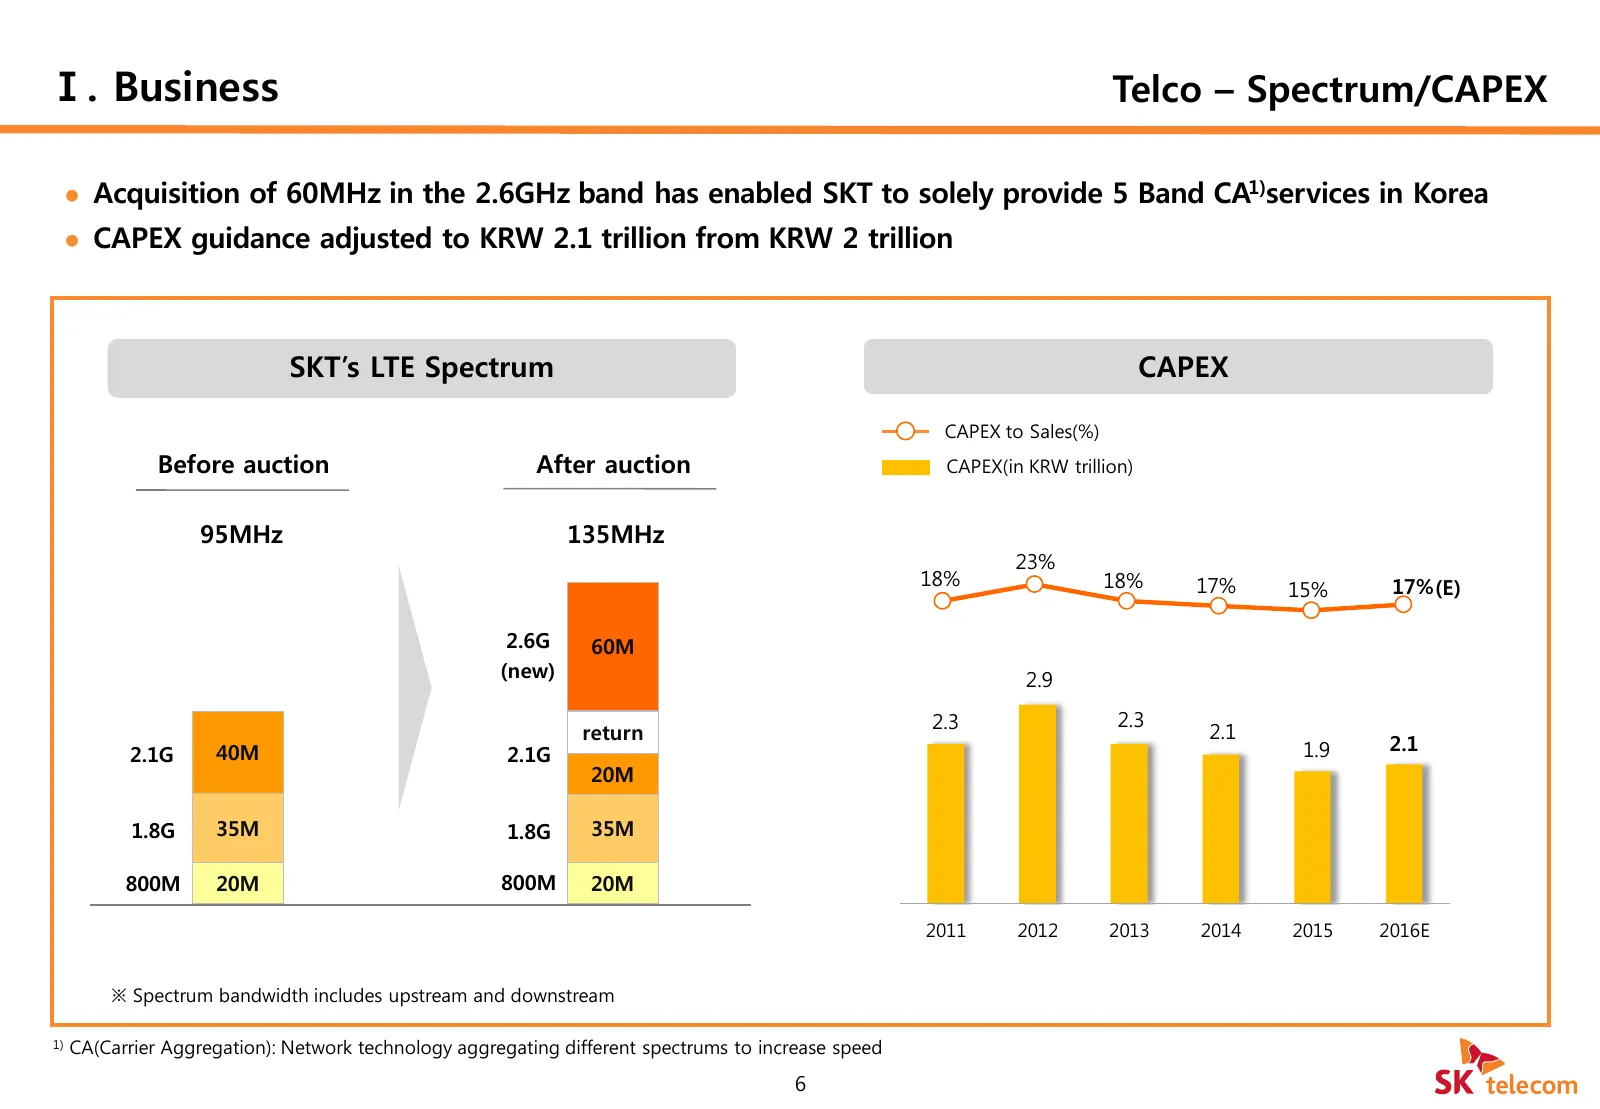
Ⅰ. Business Telco – Spectrum/CAPEX Acquisition of 60MHz in the 2.6GHz band has enabled SKT to solely provide 5 Band CA1)services in Korea CAPEX guidance adjusted to KRW 2.1 trillion from KRW 2 trillion SKT’s LTE Spectrum 50MHz 30MHz 70MHz CAPEX CAPEX to Sales(%) Before auction After auction CAPE
Slide 8: Telco - 5G
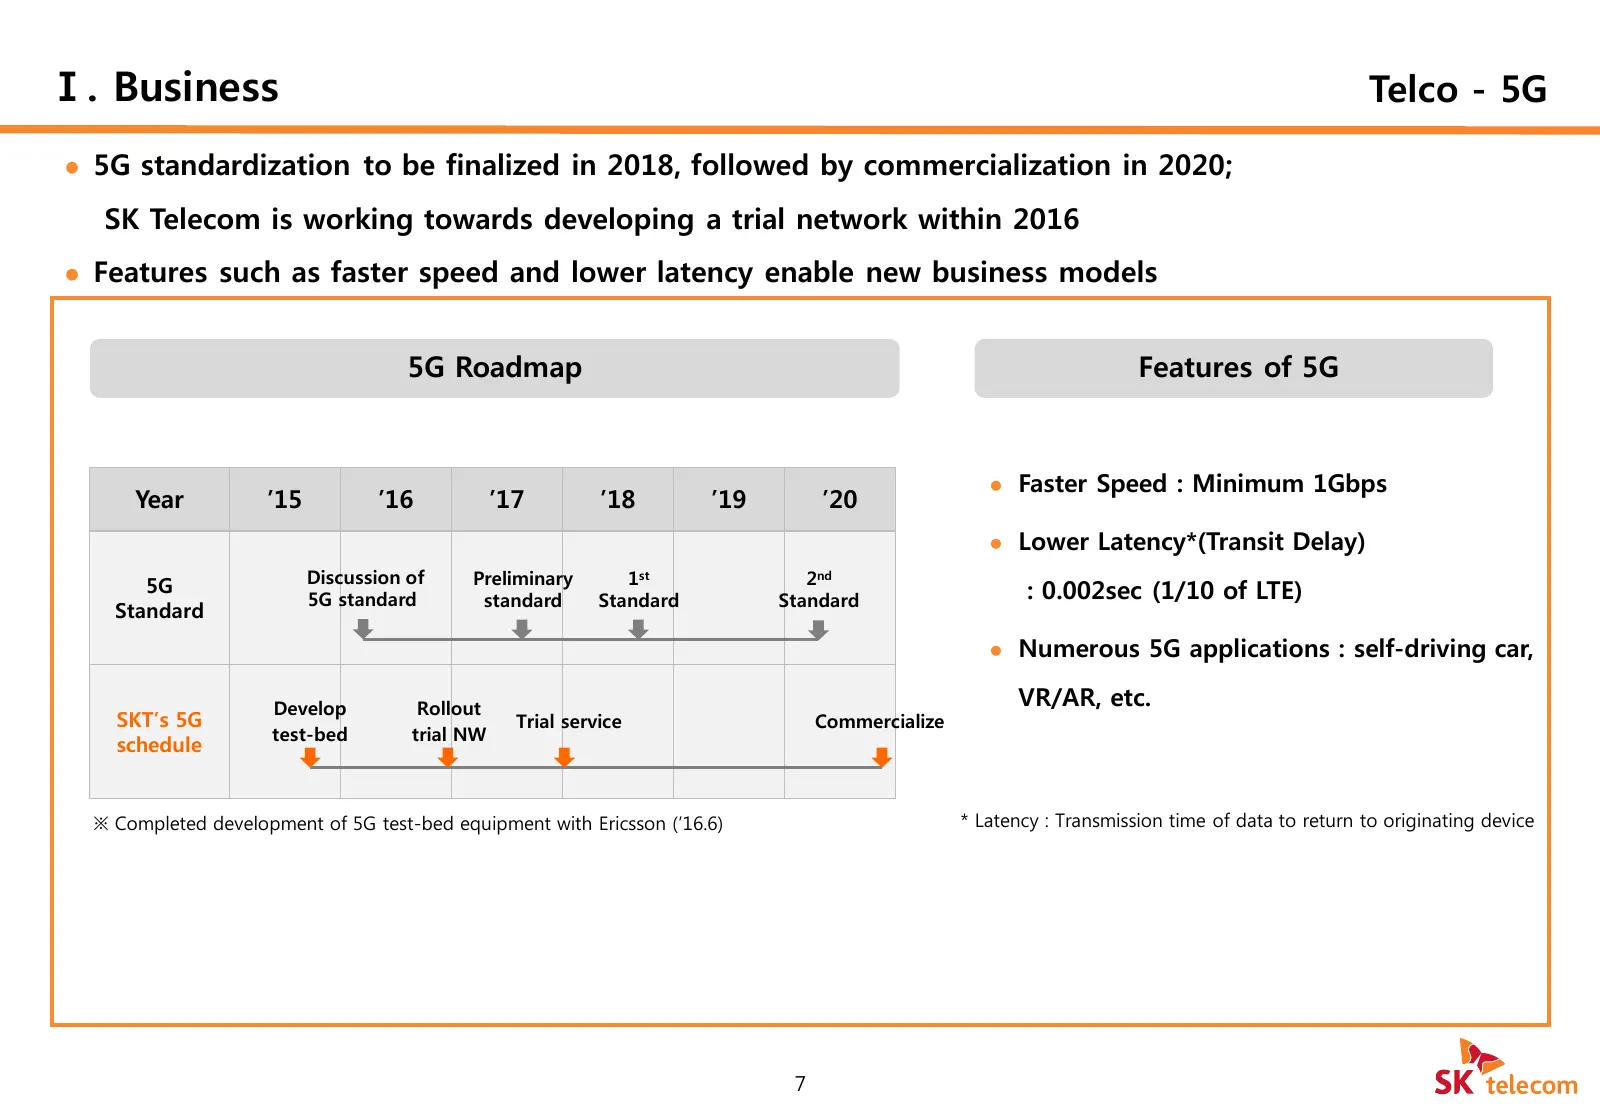
Ⅰ. Business Telco - 5G 5G standardization to be finalized in 2018, followed by commercialization in 2020; SK Telecom is working towards developing a trial network within 2016 Features such as faster speed and lower latency enable new business models 5G Roadmap Features of 5G Faster Speed : Min
Slide 9: Lifestyle Enhancement
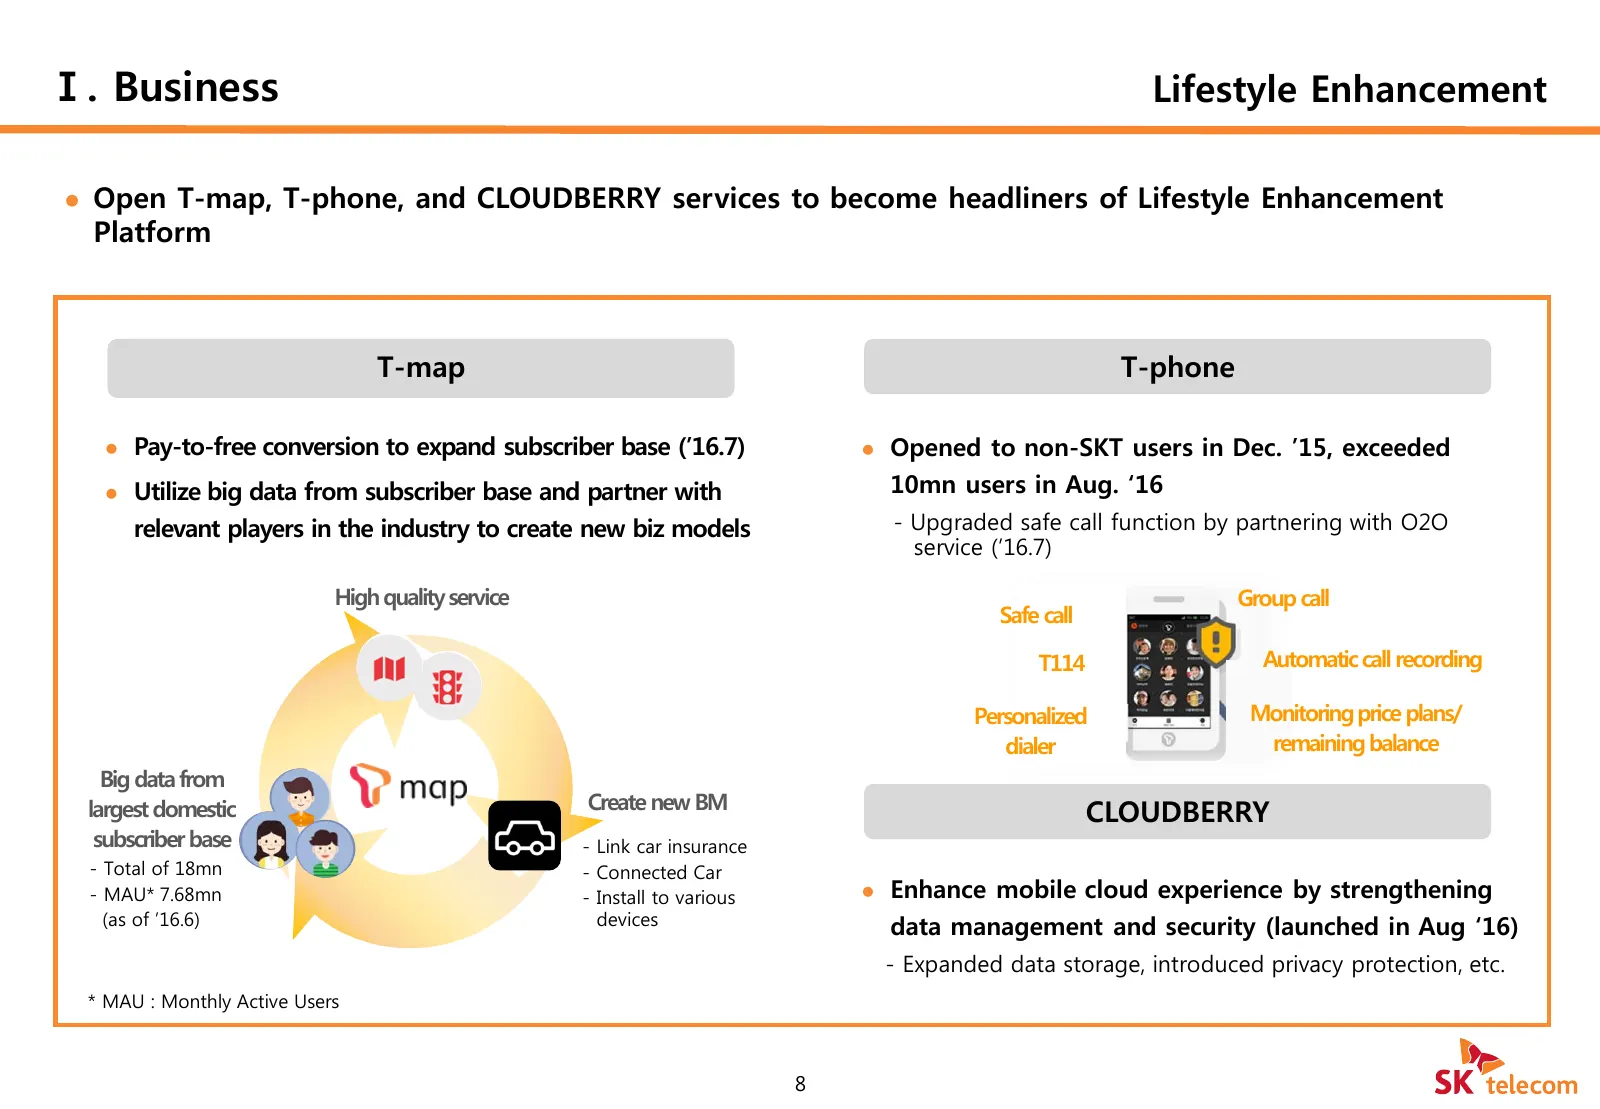
Ⅰ. Business Lifestyle Enhancement Open T-map, T-phone, and CLOUDBERRY services to become headliners of Lifestyle Enhancement Platform 11번가 T-map 2Q 현황 T-phone Pay-to-free conversion to expand subscriber base (’16.7) Opened to non-SKT users in Dec. ’15, exceeded Utilize big data from subscrib
Slide 10: Media
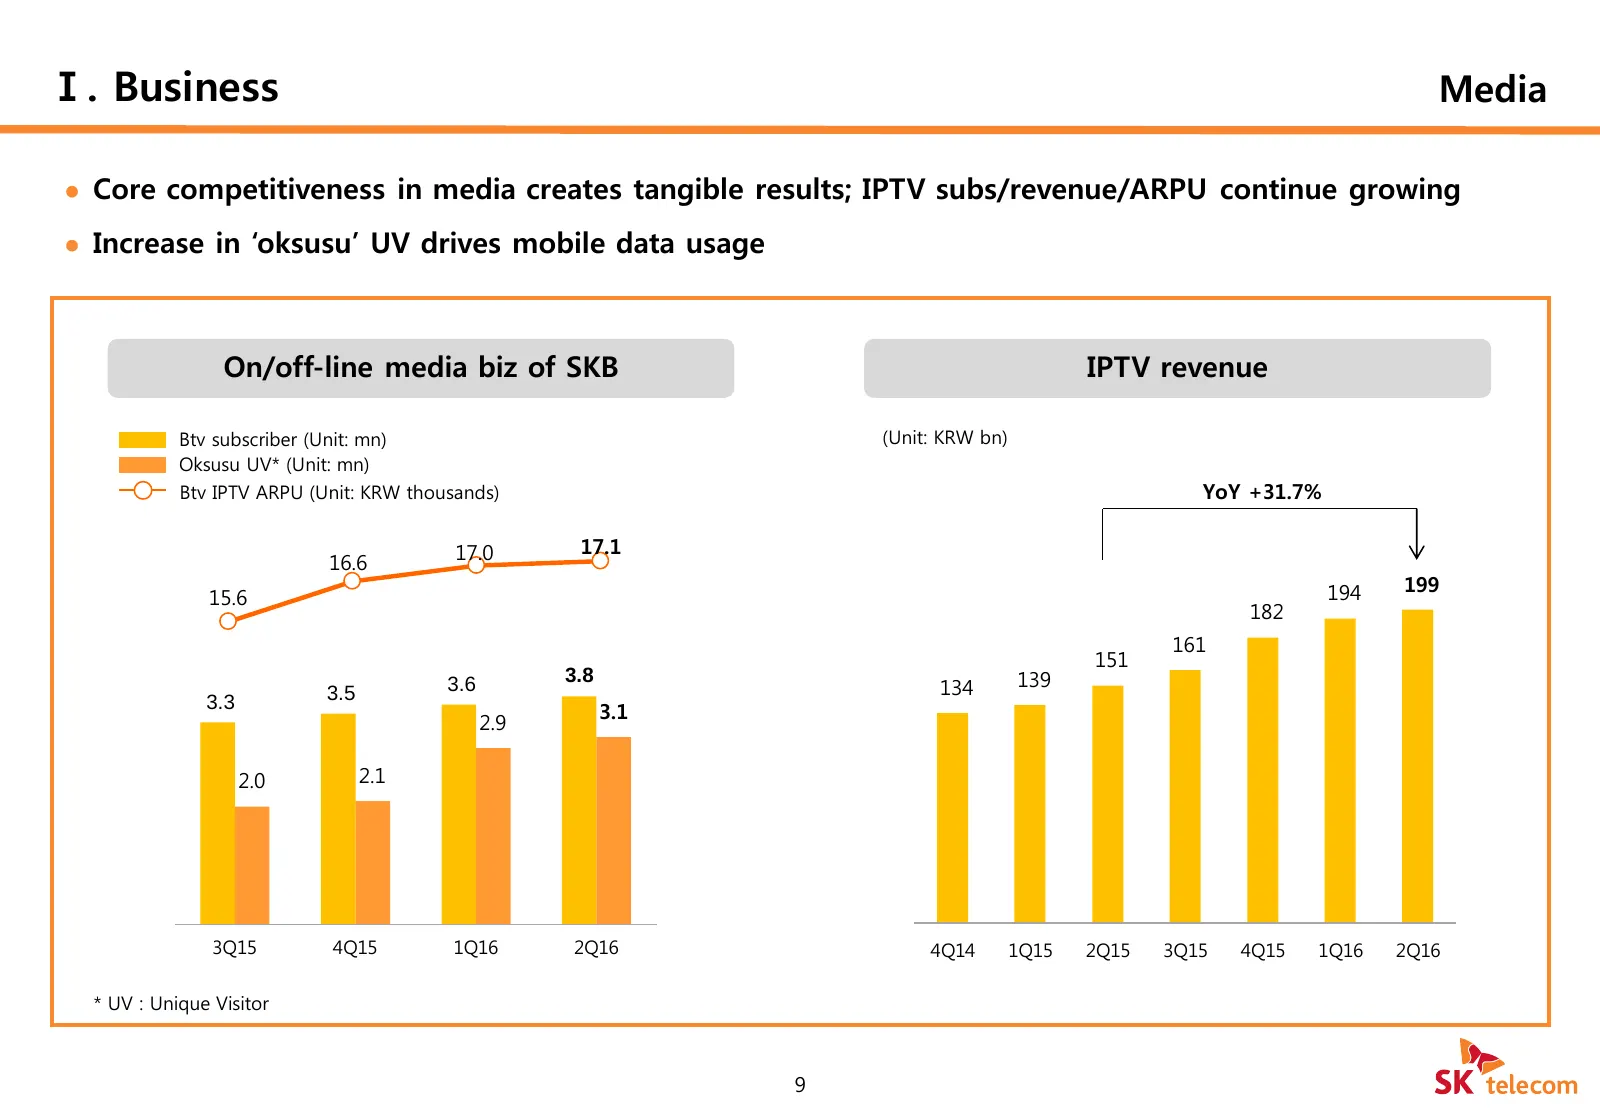
Ⅰ. Business Media Core competitiveness in media creates tangible results; IPTV subs/revenue/ARPU continue growing Increase in ‘oksusu’ UV drives mobile data usage On/off-line media biz of SKB IPTV revenue Btv subscriber (Unit: mn) (Unit: KRW bn) Oksusu UV* (Unit: mn) Btv IPTV ARPU (Unit: KRW tho
Slide 11: IoT
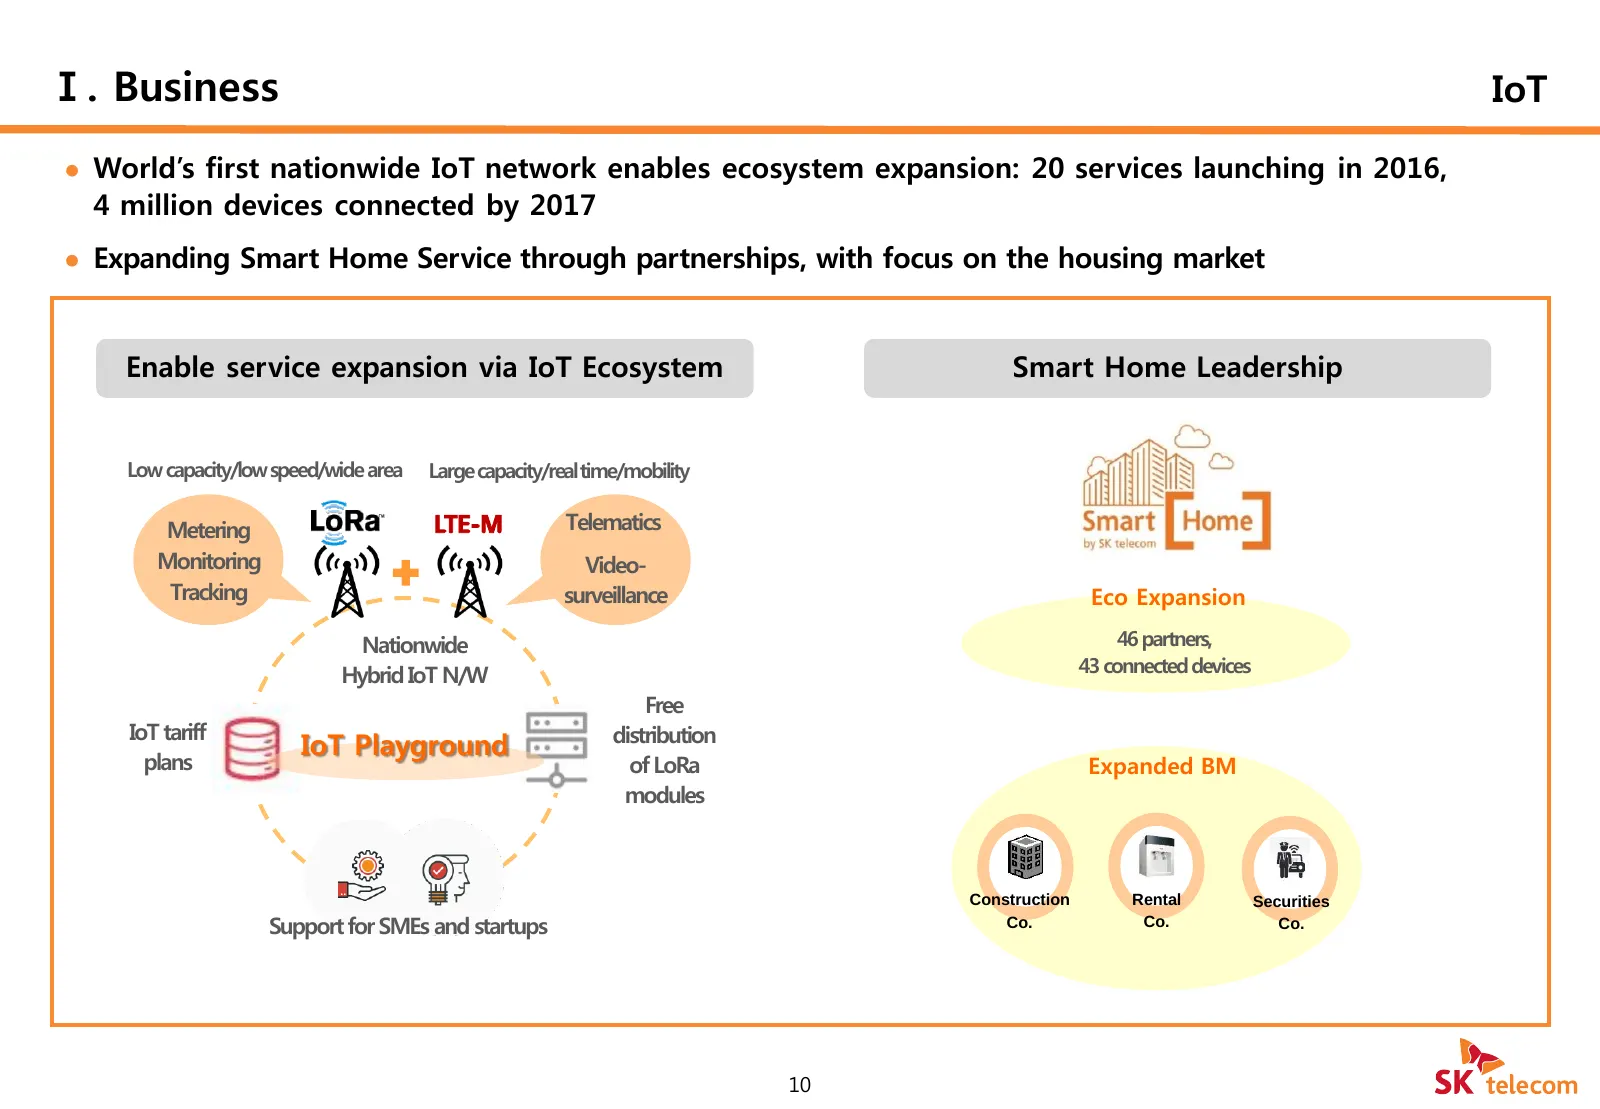
Ⅰ. Business IoT World’s first nationwide IoT network enables ecosystem expansion: 20 services launching in 2016, 4 million devices connected by 2017 Expanding Smart Home Service through partnerships, with focus on the housing market Enable service expansion via IoT Ecosystem Smart Home Leadershi
Slide 12: e-Commerce
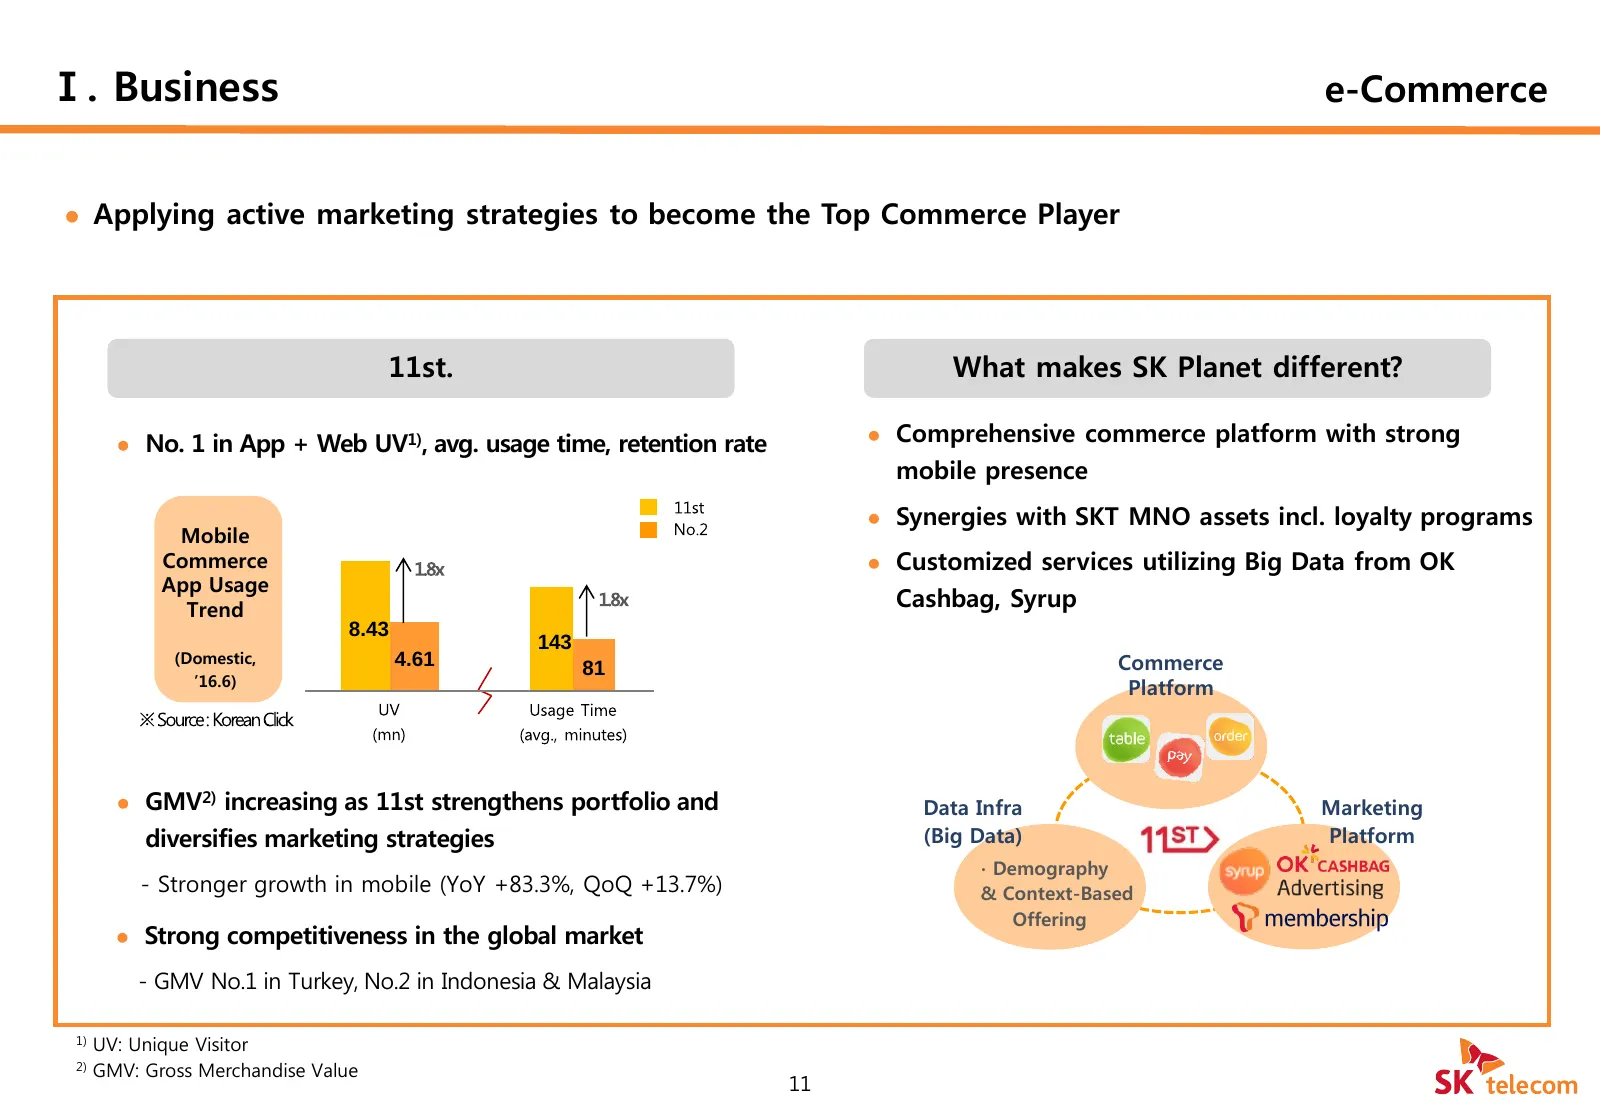
Ⅰ. Business e-Commerce Applying active marketing strategies to become the Top Commerce Player 11번가 11st. 2Q 현황 What makes SK Planet different? No. 1 in App + Web UV1), avg. usage time, retention rate Comprehensive commerce platform with strong mobile presence Synergies with SKT MNO assets in
Slide 13: Capital Mgmt. Policy
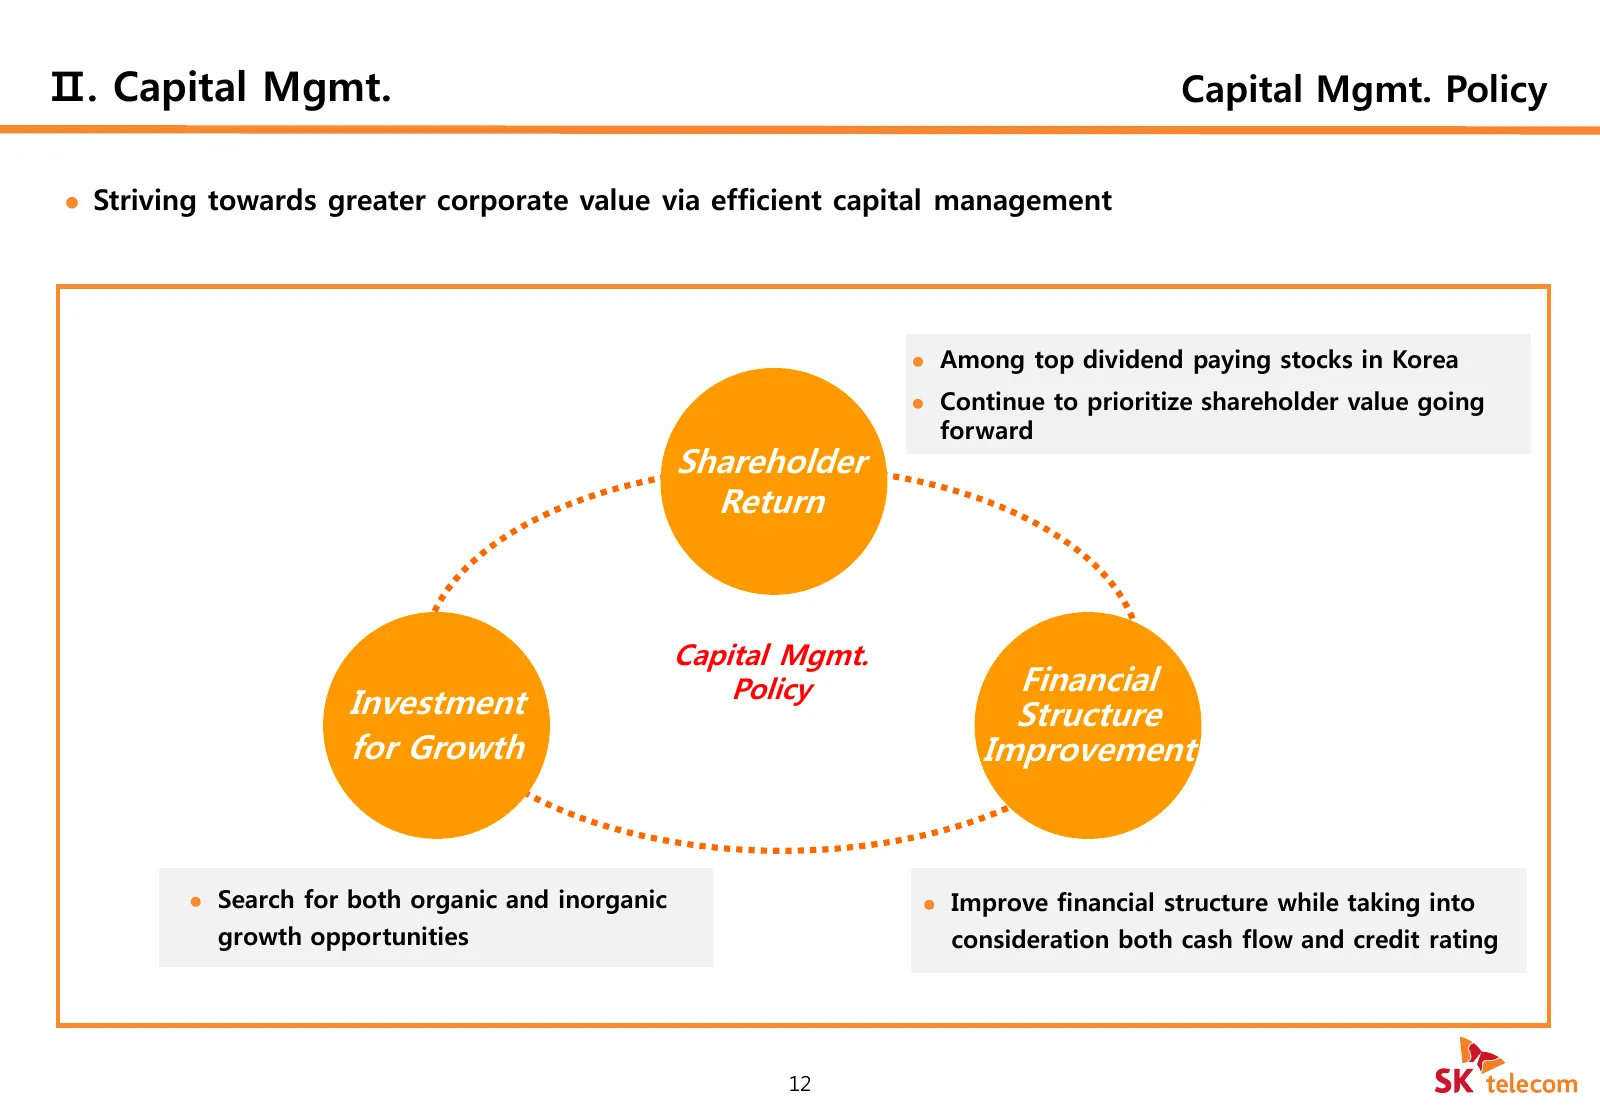
Ⅱ. Capital Mgmt. Capital Mgmt. Policy Striving towards greater corporate value via efficient capital management Among top dividend paying stocks in Korea Continue to prioritize shareholder value going forward Shareholder Return Capital Mgmt. Policy Financial Investment Structure for Growth Imp
Slide 14: Capital Mgmt. Shareholder Return
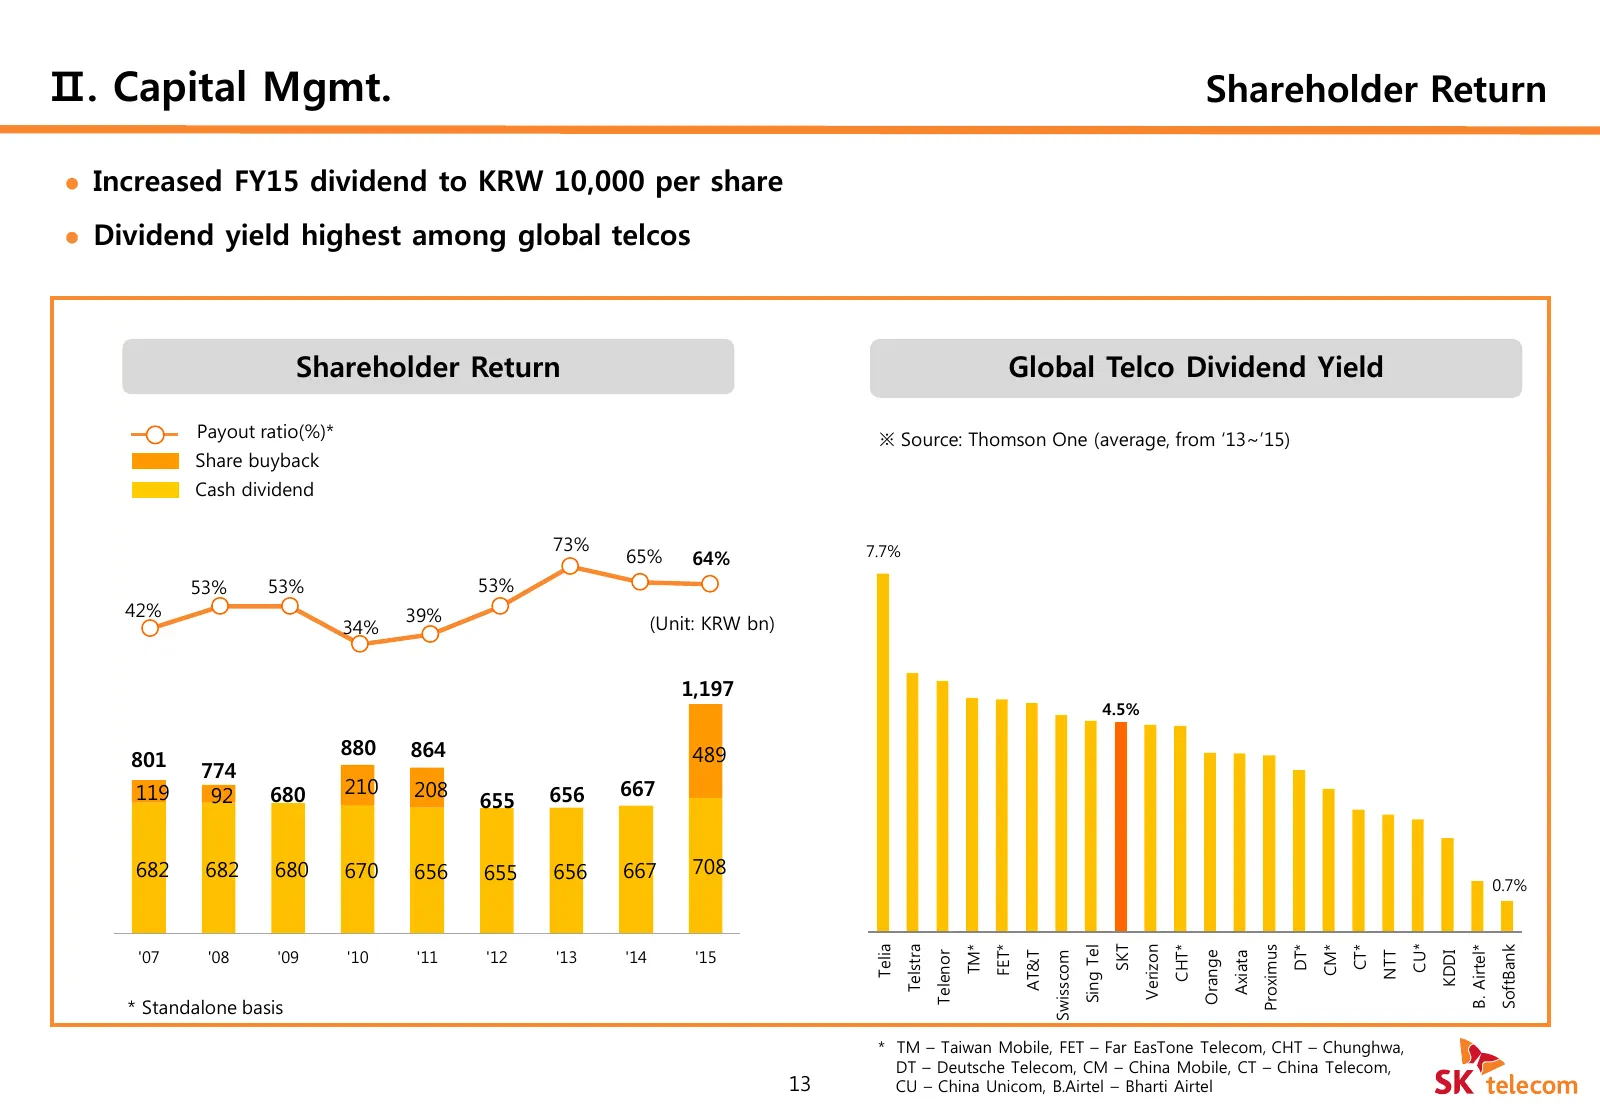
Ⅱ. Capital Mgmt. Shareholder Return Increased FY15 dividend to KRW 10,000 per share Dividend yield highest among global telcos Shareholder Return Global Telco Dividend Yield Payout ratio(%)* ※ Source: Thomson One (average, from ‘13~’15) Share buyback Cash dividend 73% 7.7% 65% 64% 53% 53% 53% 42
Slide 15: Consolidated Results
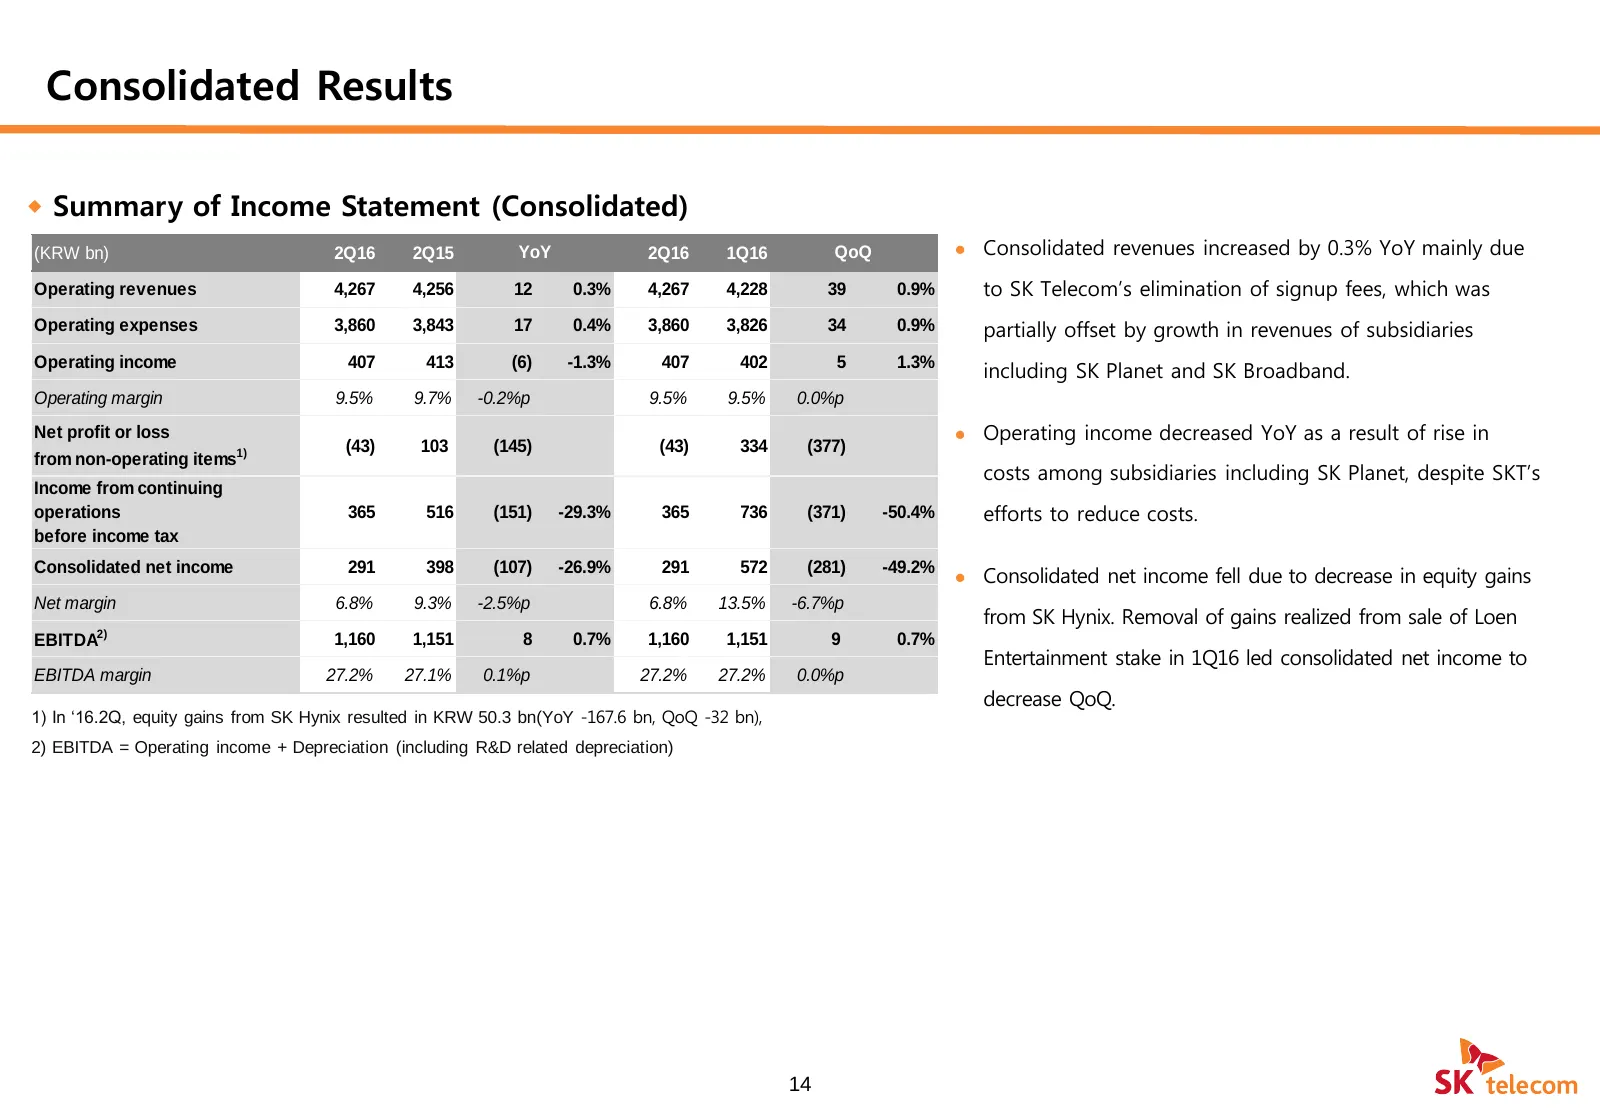
Consolidated Results Summary of Income Statement (Consolidated) (KRW bn) 2Q16 2Q15 YoY 2Q16 1Q16 QoQ Consolidated revenues increased by 0.3% YoY mainly due Operating revenues 4,267 4,256 12 0.3% 4,267 4,228 39 0.9% to SK Telecom’s elimination of signup fees, which was Operating expenses 3,860 3,
Slide 16: Consolidated Results - Operating Expenses
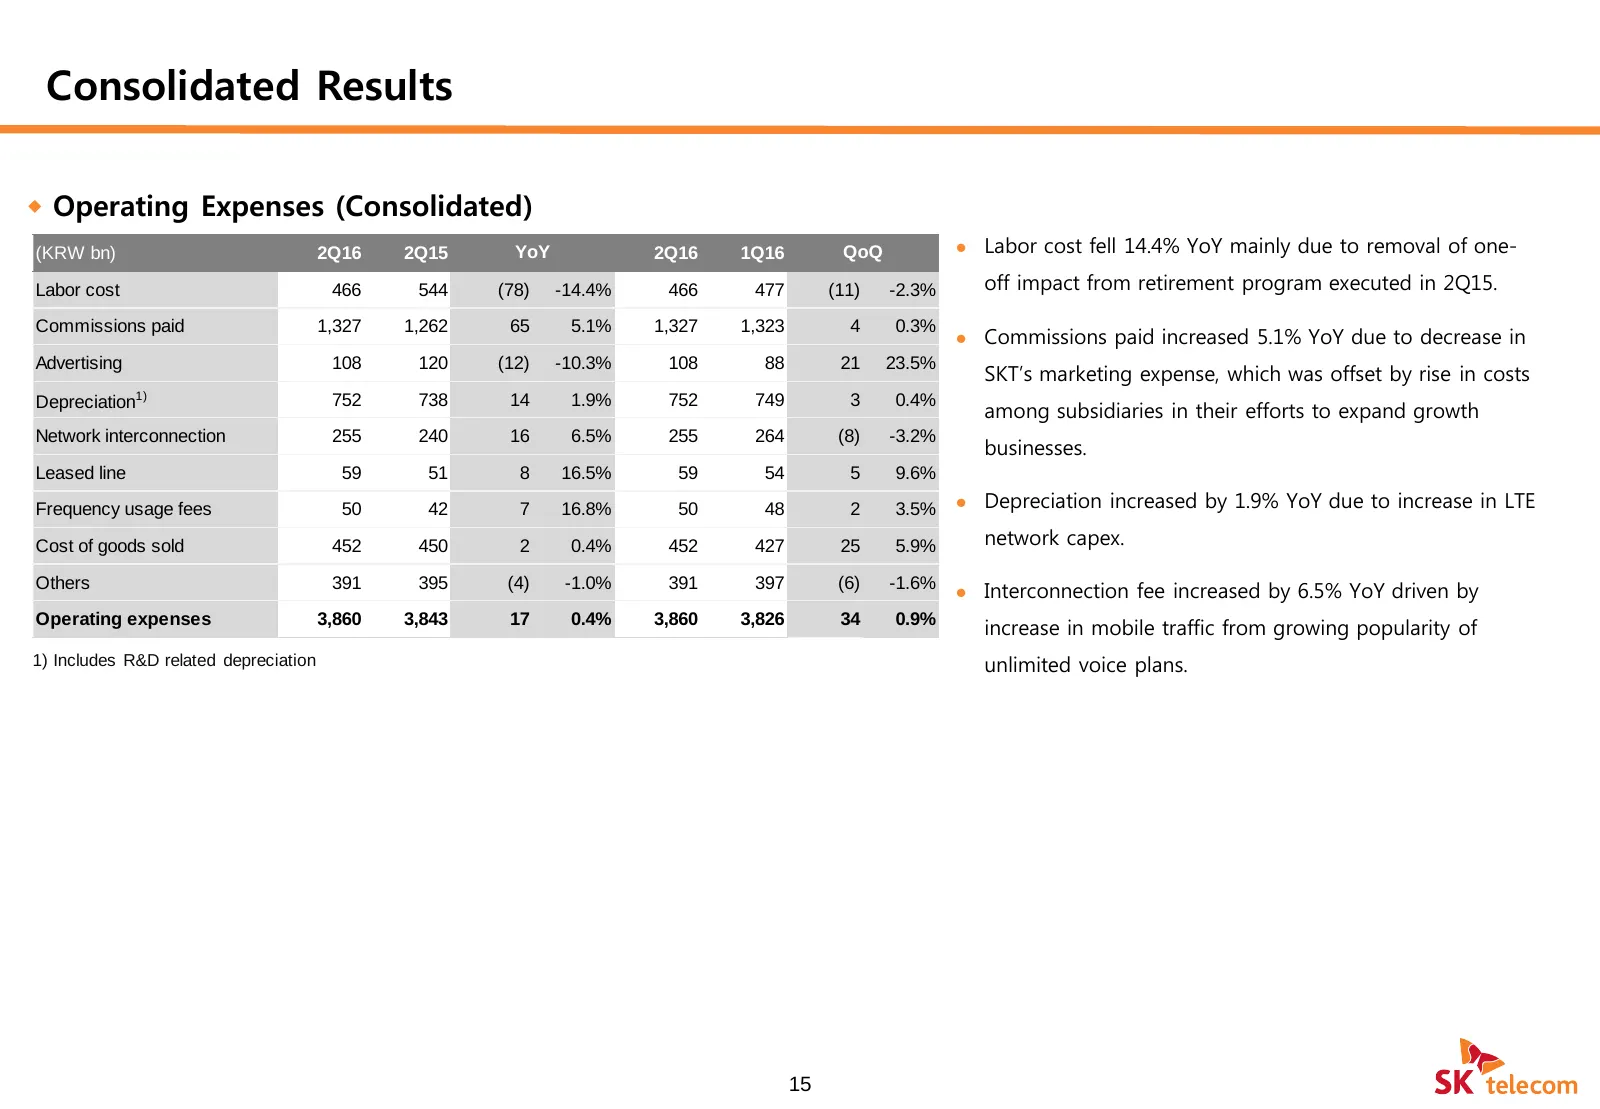
Consolidated Results Operating Expenses (Consolidated) (KRW bn) 2Q16 2Q15 YoY 2Q16 1Q16 QoQ Labor cost fell 14.4% YoY mainly due to removal of one- Labor cost 466 544 (78) -14.4% 466 477 (11) -2.3% off impact from retirement program executed in 2Q15. Commissions paid 1,327 1,262 65 5.1% 1,327 1,
Slide 17: Non-consolidated Results
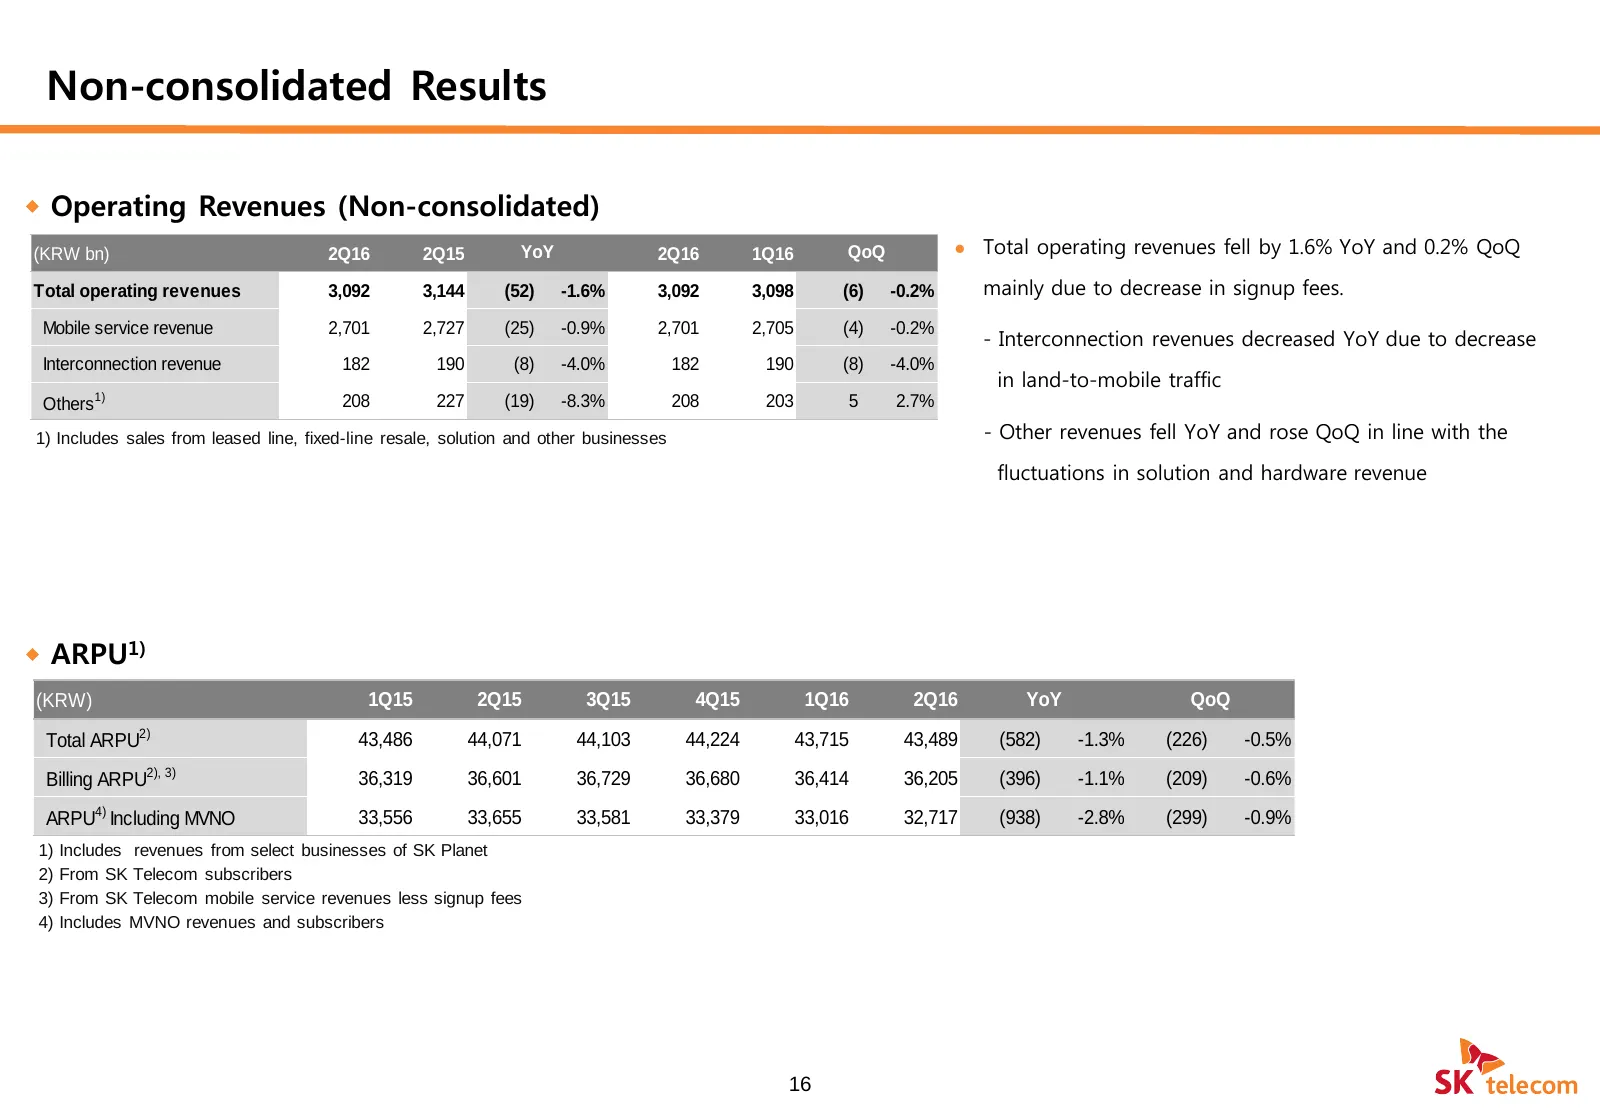
Non-consolidated Results Operating Revenues (Non-consolidated) (KRW bn) 2Q16 2Q15 YoY 2Q16 1Q16 QoQ Total operating revenues fell by 1.6% YoY and 0.2% QoQ Total operating revenues 3,092 3,144 (52) -1.6% 3,092 3,098 (6) -0.2% mainly due to decrease in signup fees. Mobile service revenue 2,701 2,7
Slide 18: Non-consolidated Results - Marketing Expenses & CAPEX
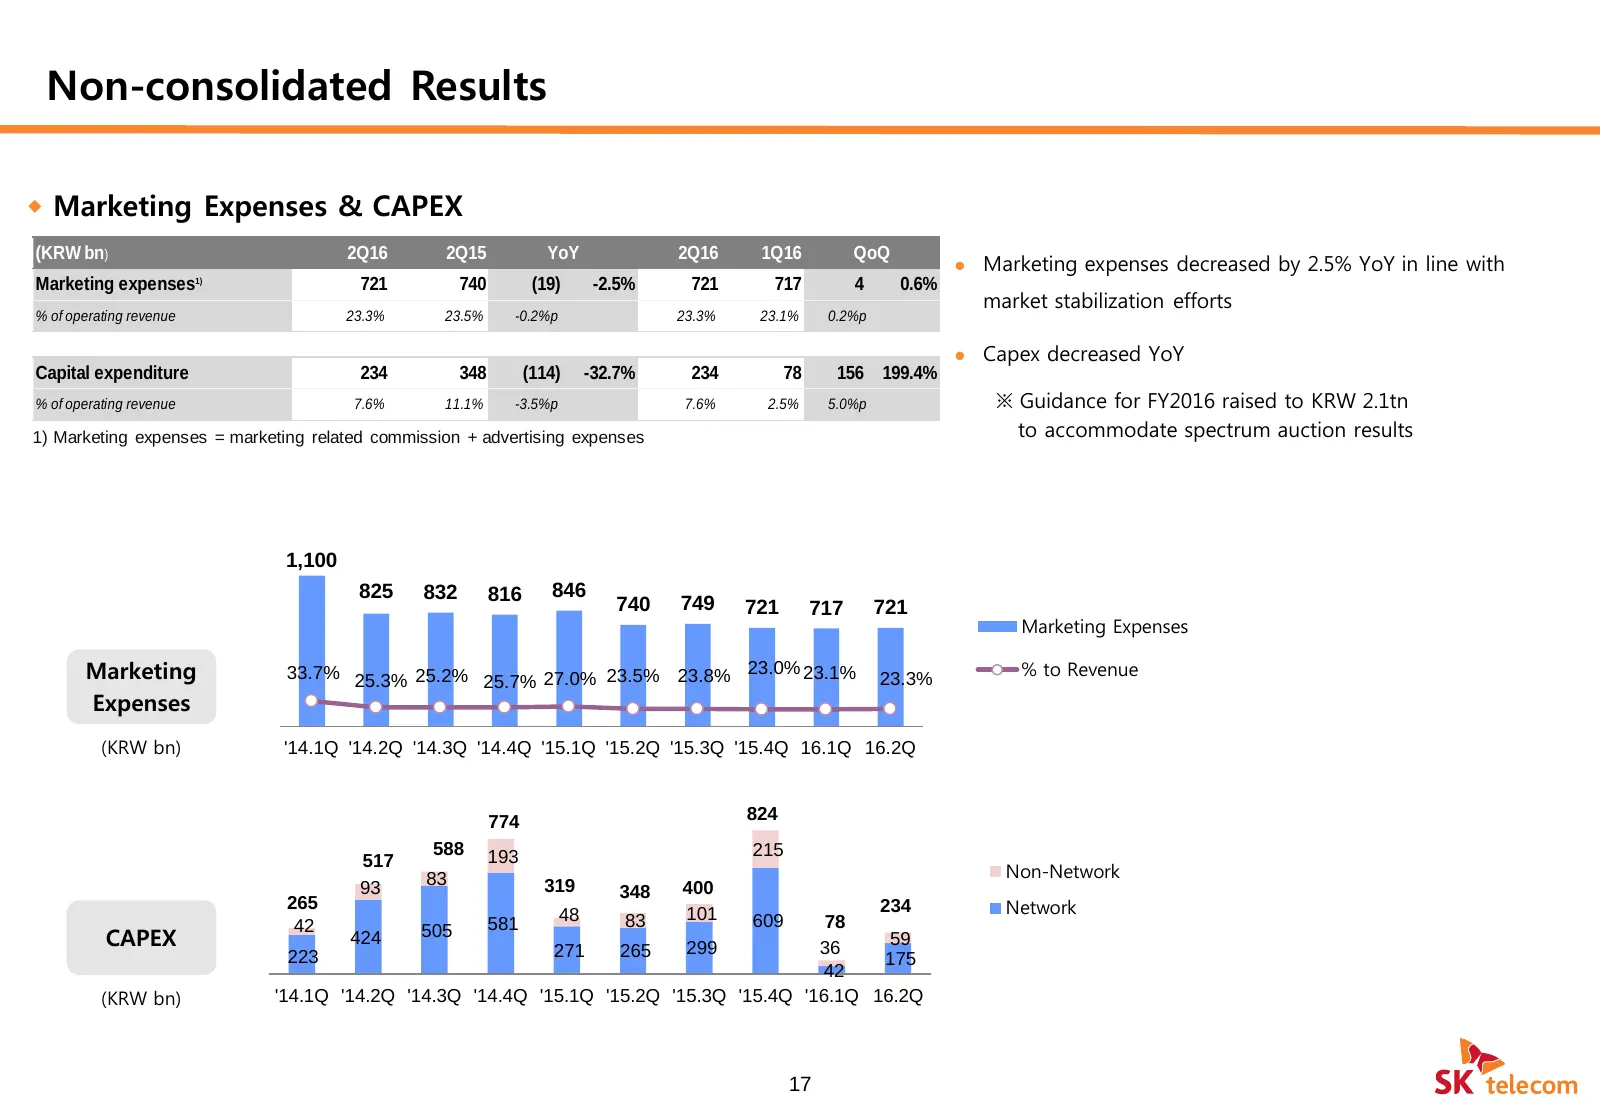
Non-consolidated Results Marketing Expenses & CAPEX (KRW bn) 2Q16 2Q15 YoY 2Q16 1Q16 QoQ Marketing expenses decreased by 2.5% YoY in line with Marketing expenses 1) 721 740 (19) -2.5% 721 717 4 0.6% market stabilization efforts % of operating revenue 23.3% 23.5% -0.2%p 23.3% 23.1% 0.2%p Capex
Slide 19: Appendix - Subscriber Numbers
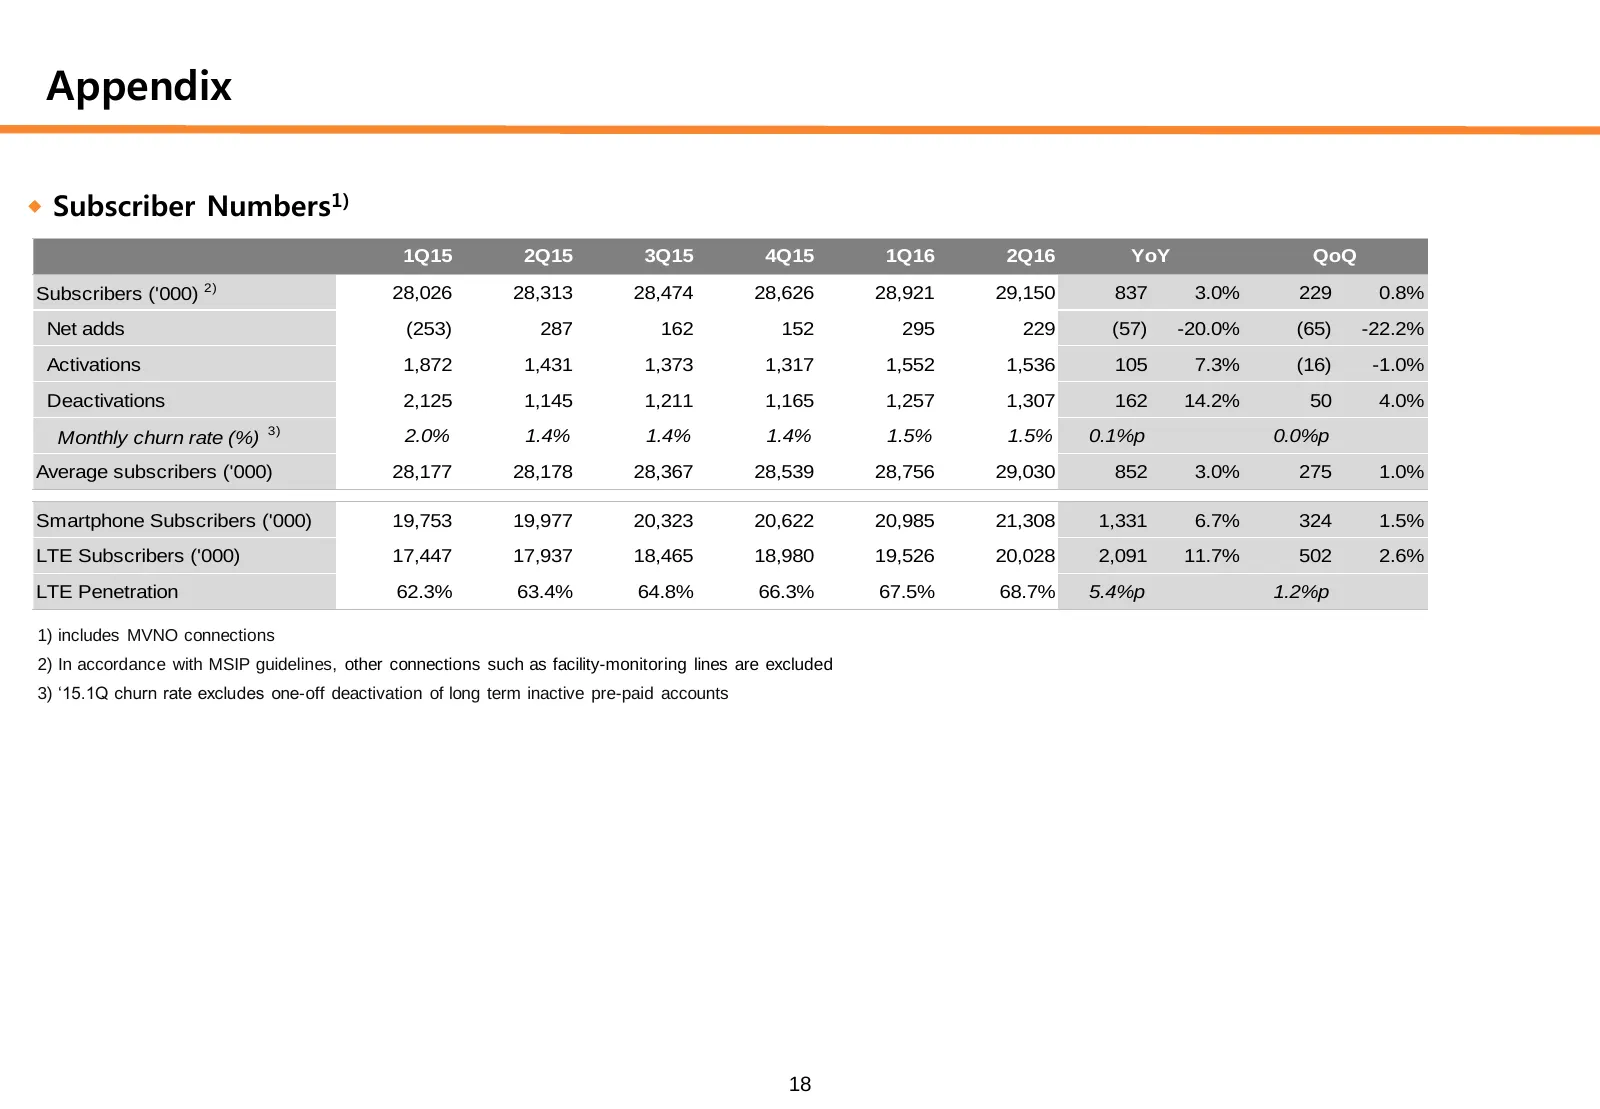
Appendix Subscriber Numbers1) 1Q15 2Q15 3Q15 4Q15 1Q16 2Q16 YoY QoQ Subscribers ('000) 2) 28,026 28,313 28,474 28,626 28,921 29,150 837 3.0% 229 0.8% Net adds (253) 287 162 152 295 229 (57) -20.0% (65) -22.2% Activations 1,872 1,431 1,373 1,317 1,552 1,536 105 7.3% (16) -1.0% Deactivations 2,125 1
Slide 20: Appendix - Consolidated Income Statement
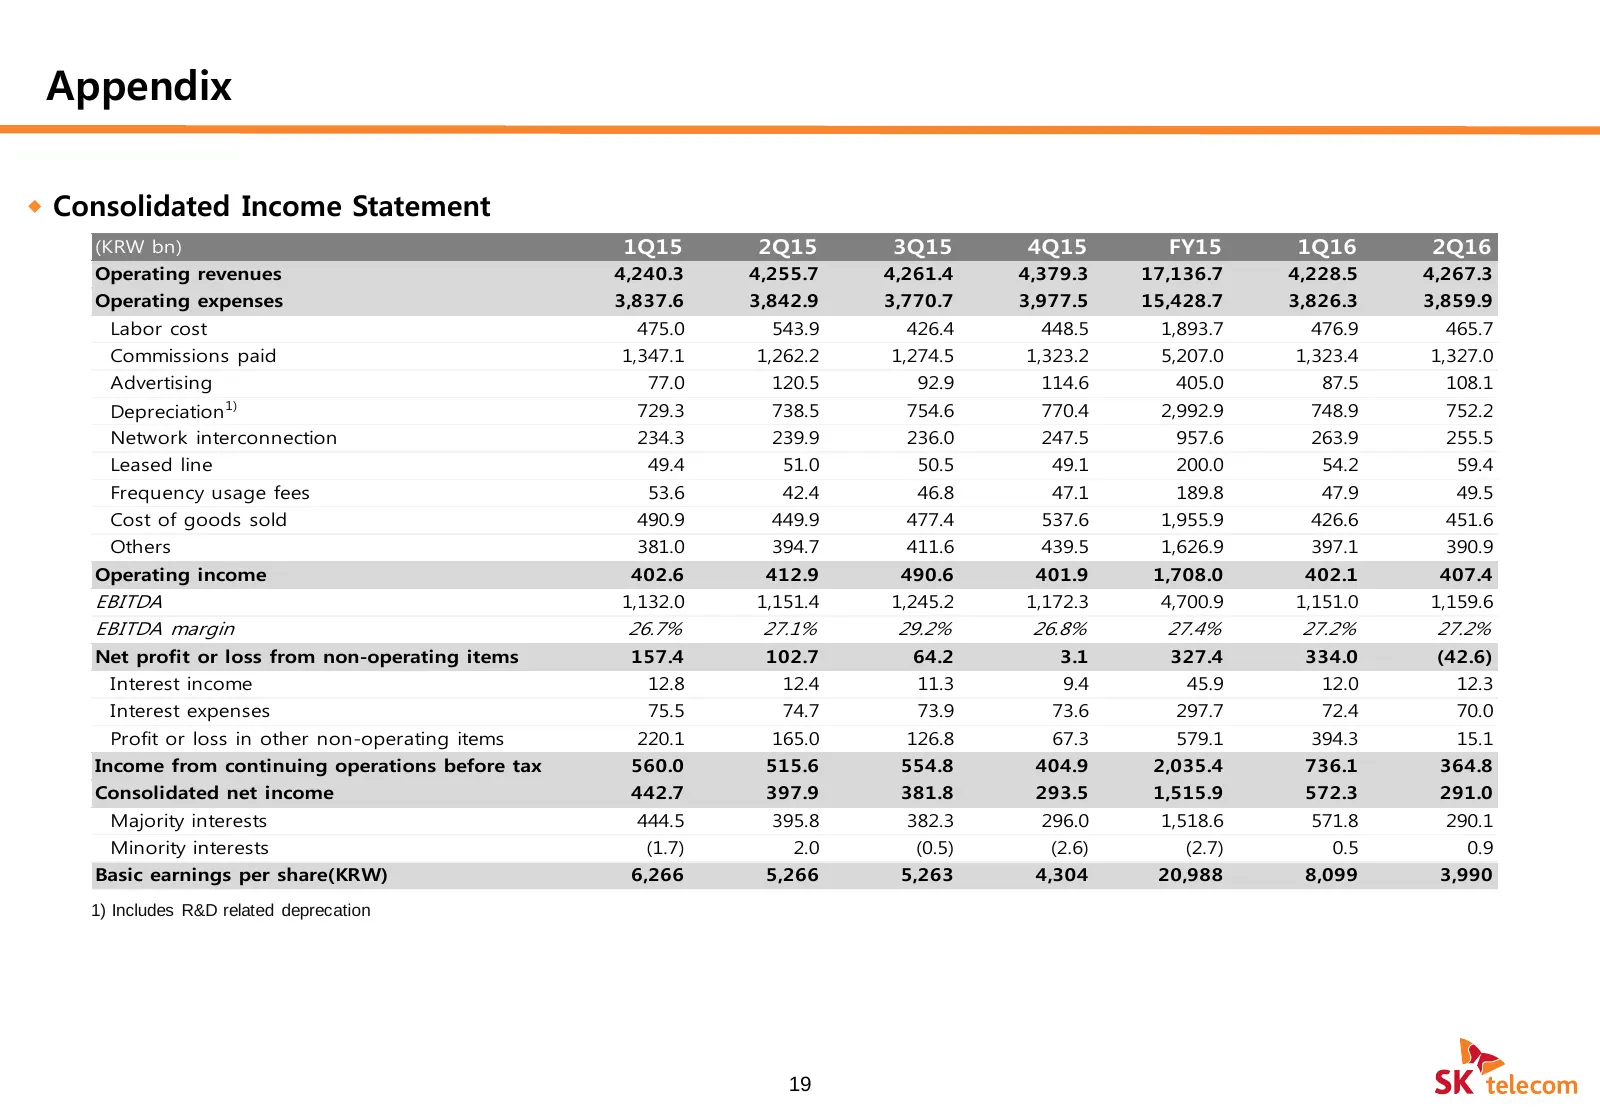
Appendix Consolidated Income Statement (KRW bn) 1Q15 2Q15 3Q15 4Q15 FY15 1Q16 2Q16 Operating revenues 4,240.3 4,255.7 4,261.4 4,379.3 17,136.7 4,228.5 4,267.3 Operating expenses 3,837.6 3,842.9 3,770.7 3,977.5 15,428.7 3,826.3 3,859.9 Labor cost 475.0 543.9 426.4 448.5 1,893.7 476.9 465.7 Commissi
Slide 21: Appendix - Non-consolidated Income Statement
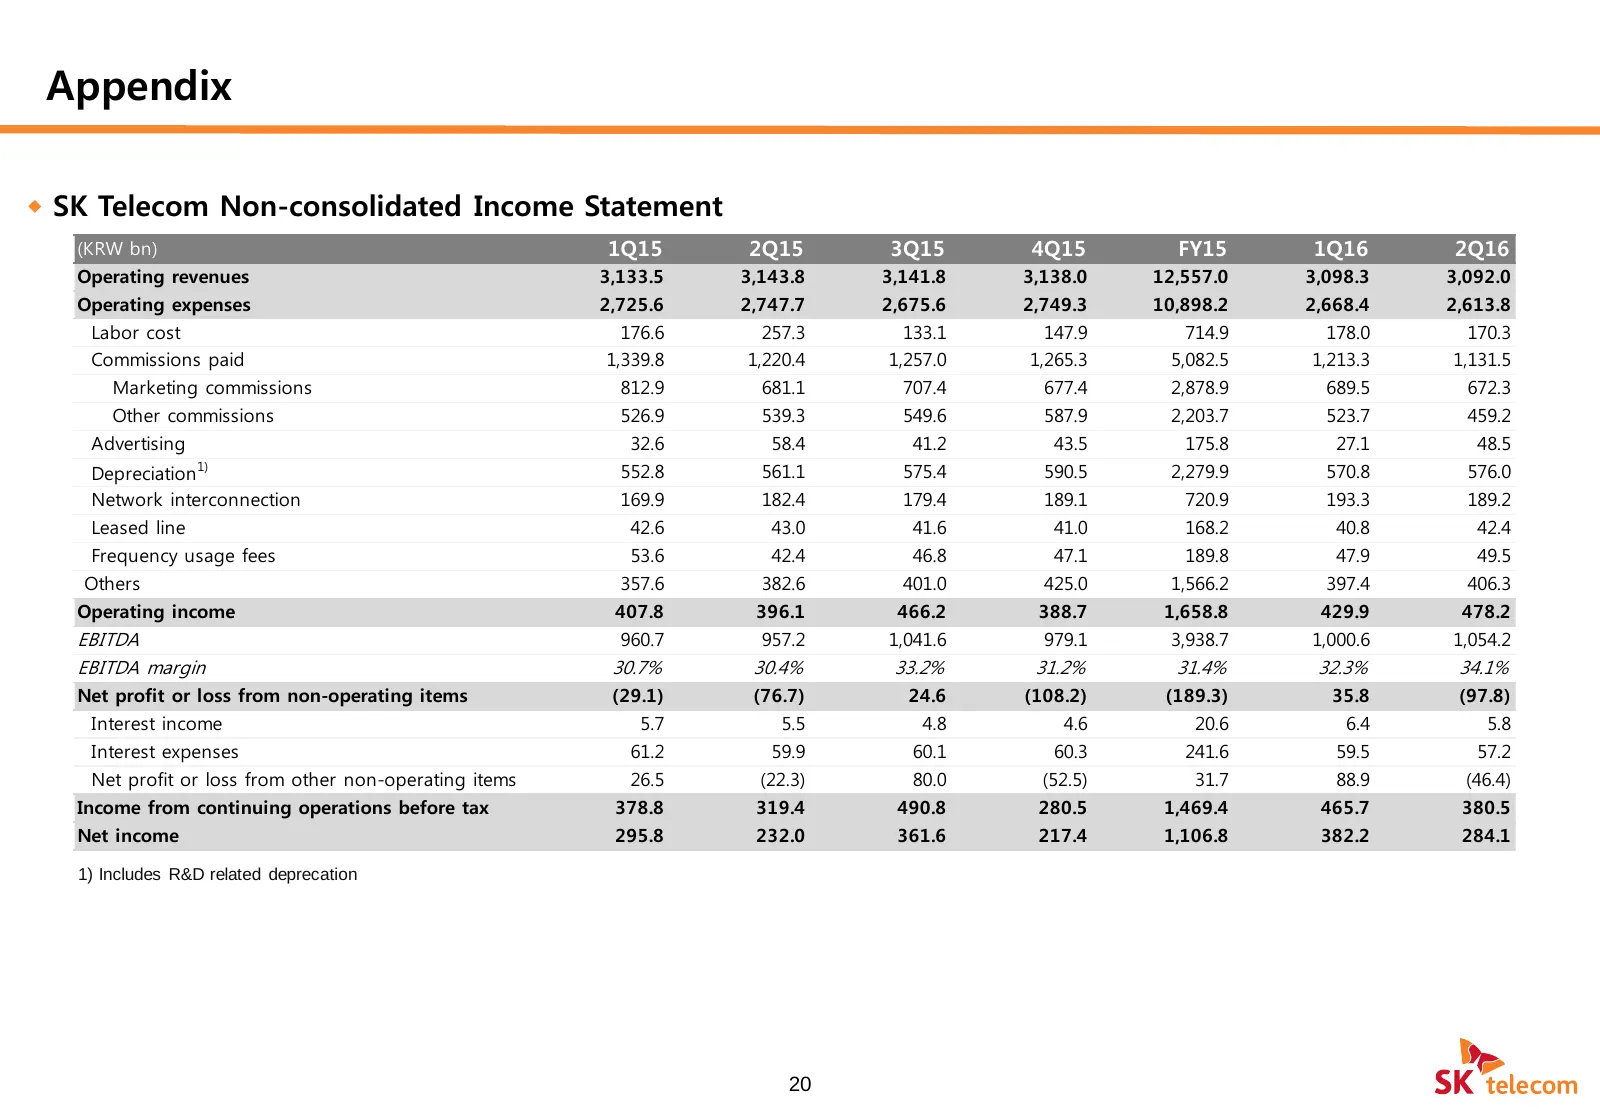
Appendix SK Telecom Non-consolidated Income Statement (KRW bn) 1Q15 2Q15 3Q15 4Q15 FY15 1Q16 2Q16 Operating revenues 3,133.5 3,143.8 3,141.8 3,138.0 12,557.0 3,098.3 3,092.0 Operating expenses 2,725.6 2,747.7 2,675.6 2,749.3 10,898.2 2,668.4 2,613.8 Labor cost 176.6 257.3 133.1 147.9 714.9 178.0 1
Slide 22: Appendix - Consolidated Balance Sheet
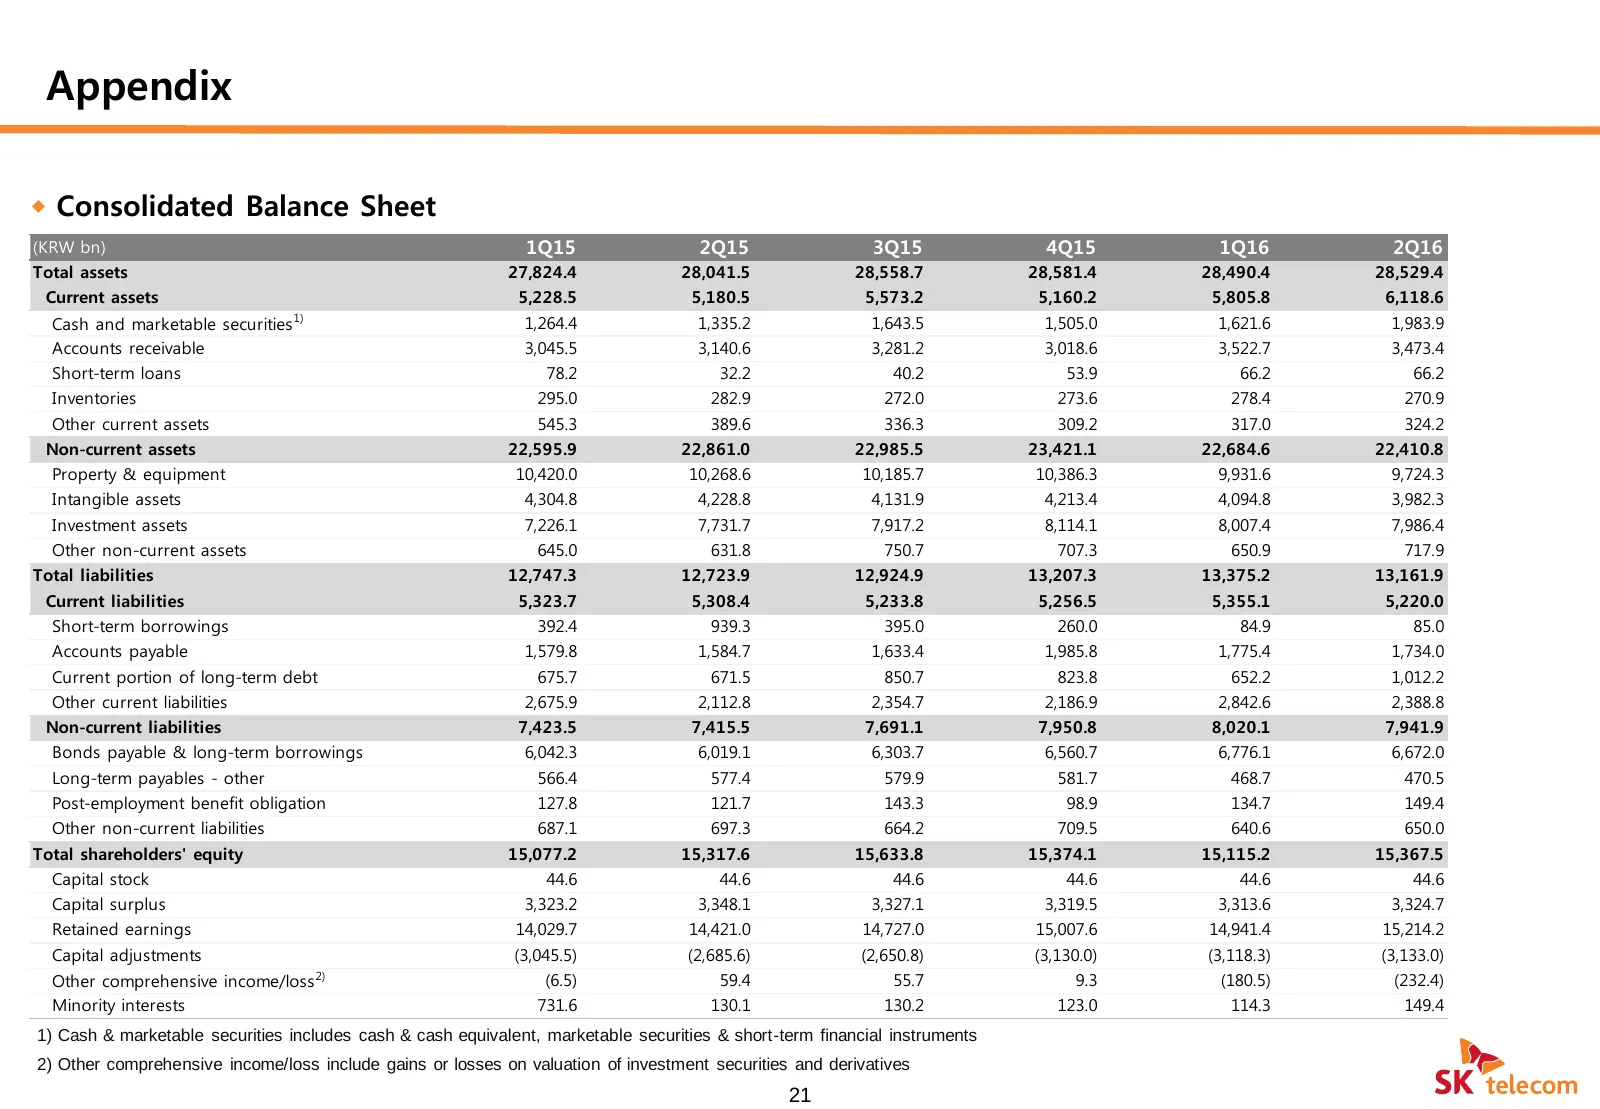
Appendix Consolidated Balance Sheet (KRW bn) 1Q15 2Q15 3Q15 4Q15 1Q16 2Q16 Total assets 27,824.4 28,041.5 28,558.7 28,581.4 28,490.4 28,529.4 Current assets 5,228.5 5,180.5 5,573.2 5,160.2 5,805.8 6,118.6 Cash and marketable securities 1) 1,264.4 1,335.2 1,643.5 1,505.0 1,621.6 1,983.9 Accounts re
Slide 23: Appendix - Non-consolidated Balance Sheet
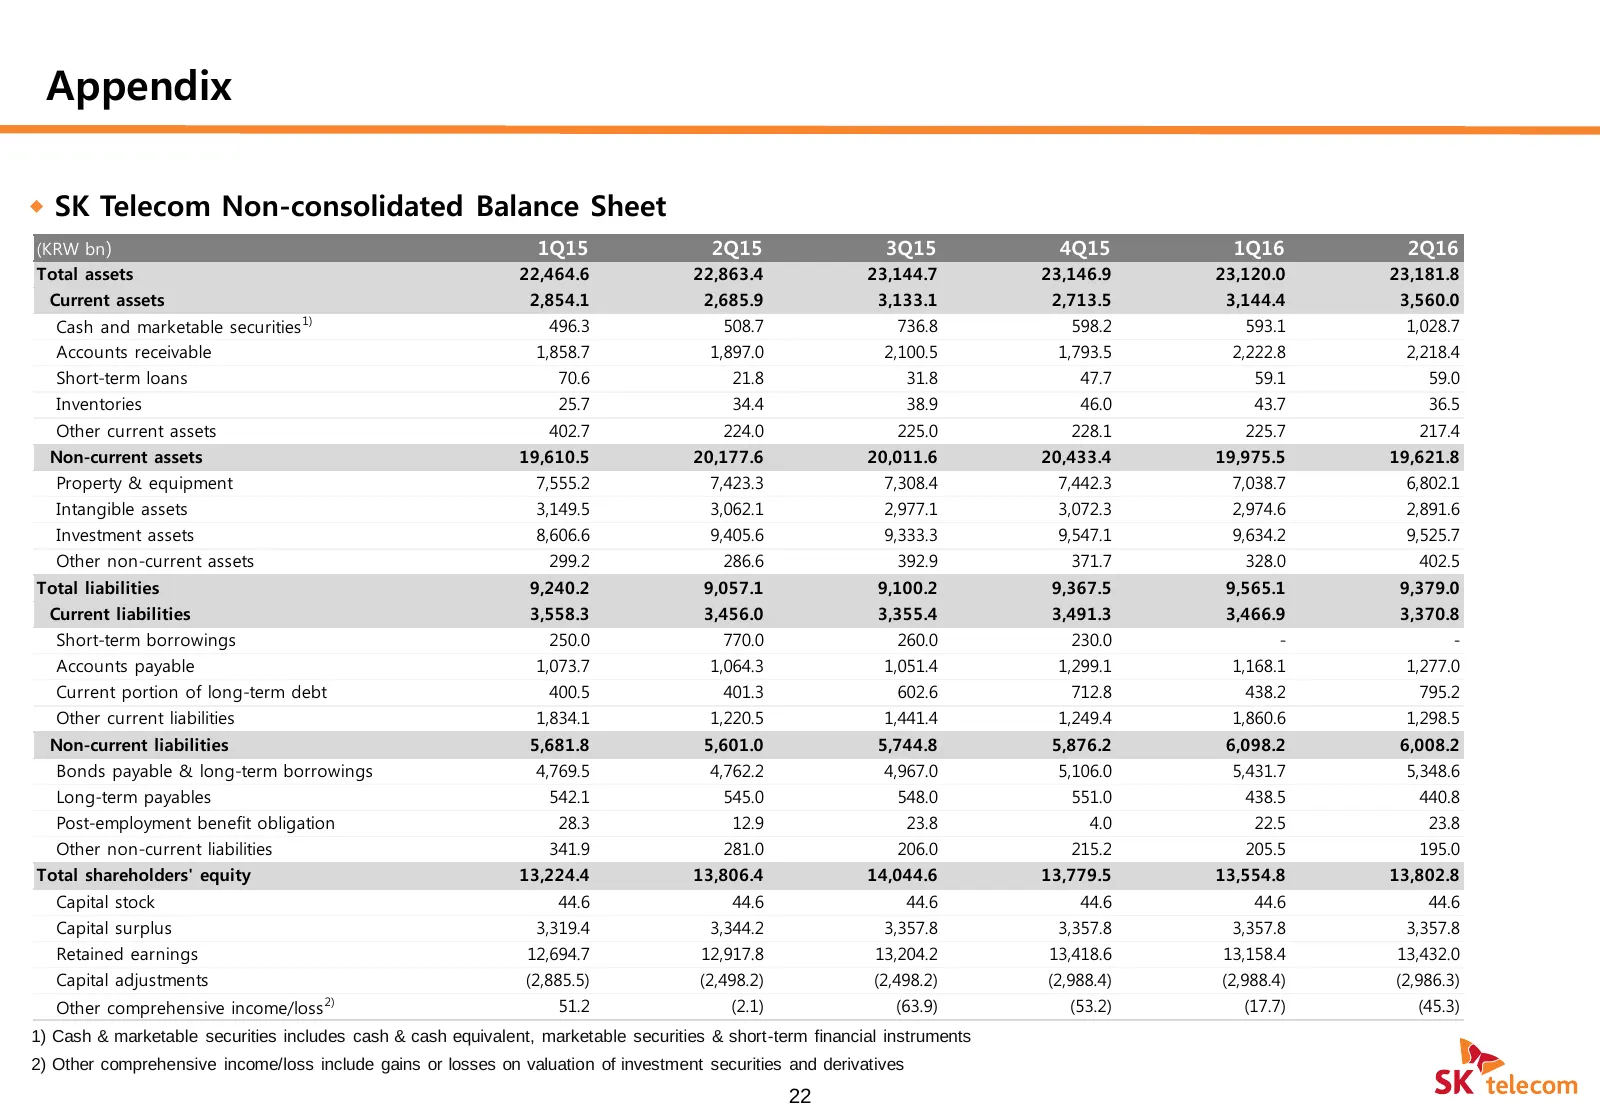
Appendix SK Telecom Non-consolidated Balance Sheet (KRW bn ) 1Q15 2Q15 3Q15 4Q15 1Q16 2Q16 Total assets 22,464.6 22,863.4 23,144.7 23,146.9 23,120.0 23,181.8 Current assets 2,854.1 2,685.9 3,133.1 2,713.5 3,144.4 3,560.0 Cash and marketable securities 1) 496.3 508.7 736.8 598.2 593.1 1,028.7 Accou
Source: Internet Archive copy of sktelecom.com
More decks from SK Telecom Co., Ltd.
 Q3 2026 Earnings Presentation12 slides · Nov 4, 2026
 Q1 2026 Earnings Presentation12 slides · May 7, 2026
 FY2025 Earnings Presentation15 slides · Feb 5, 2026
 Q3 2025 Earnings Presentation18 slides · Oct 31, 2025
 Q2 2025 Earnings Presentation19 slides · Aug 12, 2025
 Q1 2025 Earnings Presentation16 slides · May 12, 2025