First Advantage Corporation · NASDAQ:FA
First Advantage — Q3 2026 Earnings Presentation
27 slides from First Advantage's earnings presentation, Nov 5, 2026
Slide 1: Q3 2026 Earnings Presentation
Q3 2026 Earnings Presentation November 5, 2026 © 2026 First Advantage
Slide 2: Forward-Looking Statements
F O R W AR D - L O OKIN G S TATE M E N TS This presentation contains “forward-looking statements” within the meaning of the Private Securities Litigation Reform Act of 1995. These forward-looking statements reflect our current views with respect to, among other things, our operations and financial p

Slide 3: Q3 2026 Highlights
Q3 2026 Highlights Scott Staples Chief Executive Officer © 2026 First Advantage
Slide 4: Key Messages
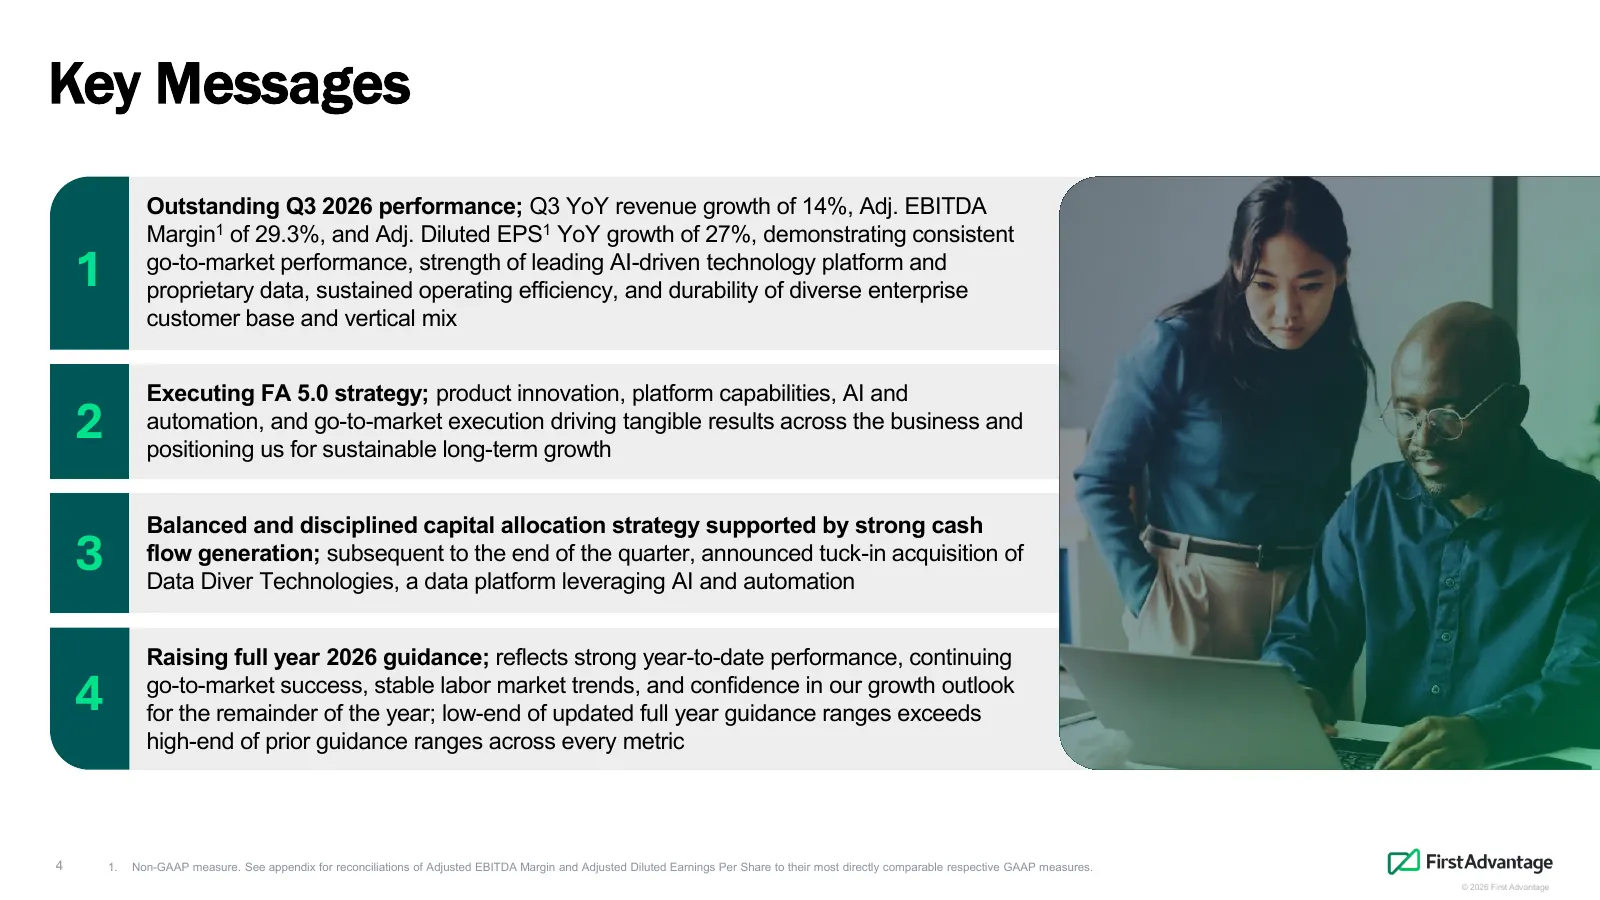
Key Messages Outstanding Q3 2026 performance; Q3 YoY revenue growth of 14%, Adj. EBITDA Margin1 of 29.3%, and Adj. Diluted EPS1 YoY growth of 27%, demonstrating consistent 1 go-to-market performance, strength of leading AI-driven technology platform and proprietary data, sustained operating efficien
Slide 5: Outstanding Q3 2026 Results
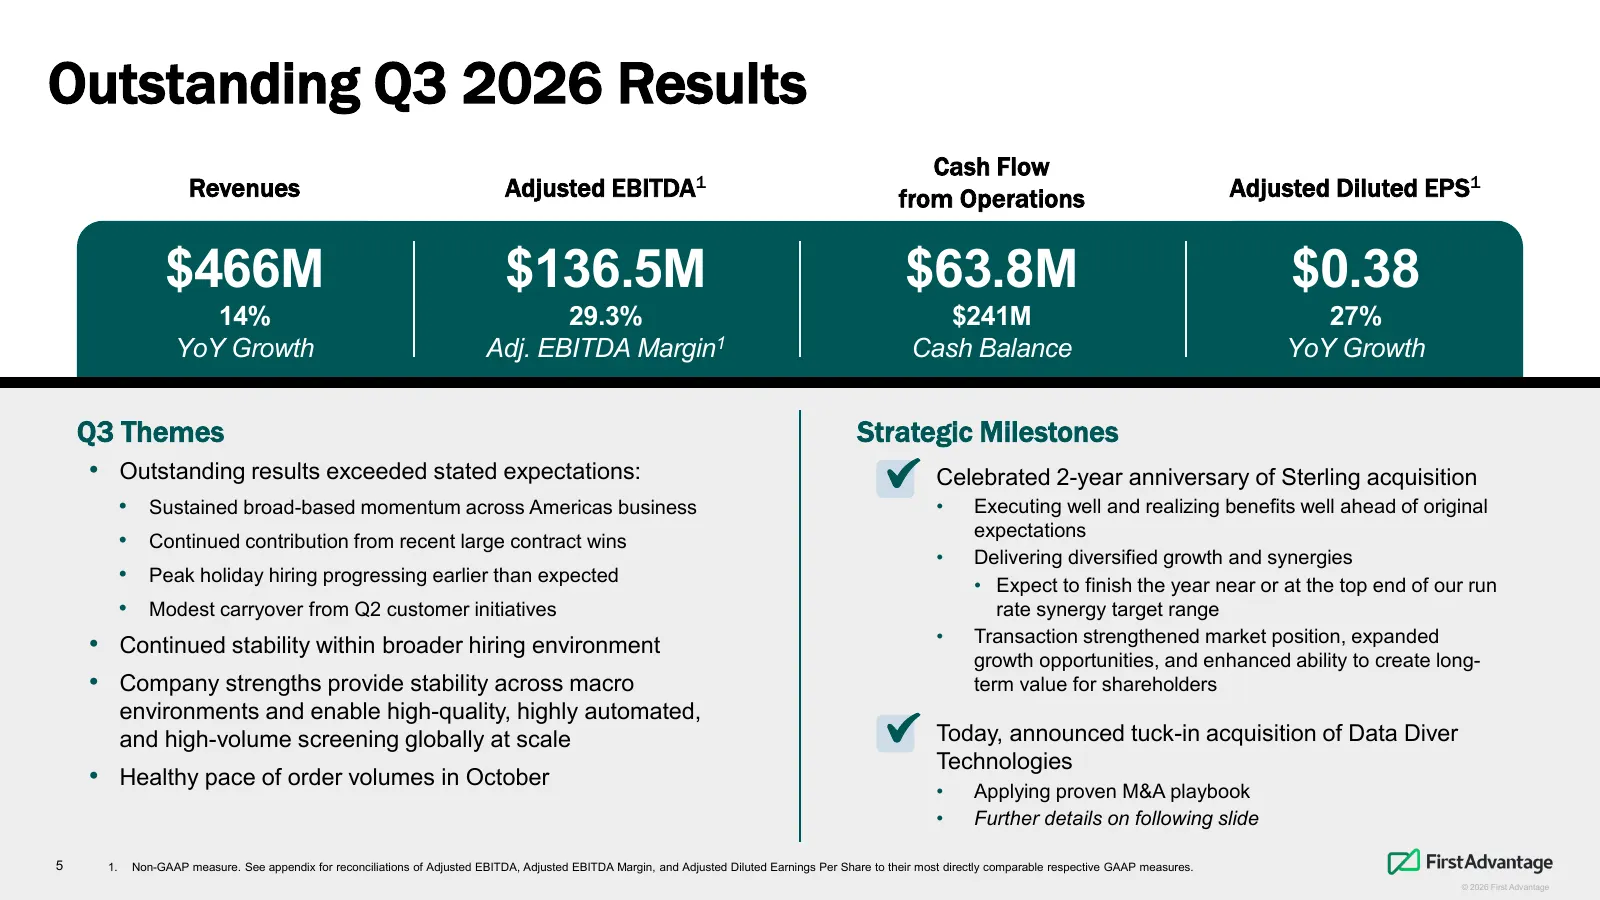
Outstanding Q3 2026 Results Cash Flow Revenues Adjusted EBITDA1 from Operations Adjusted Diluted EPS1 $466M $136.5M $63.8M $0.38 14% 29.3% $241M 27% YoY Growth Adj. EBITDA Margin1 Cash Balance YoY Growth Q3 Themes Strategic Milestones • Outstanding results exceeded stated expectations: Celebrated 2-
Slide 6: Acquisition of Data Diver Technologies
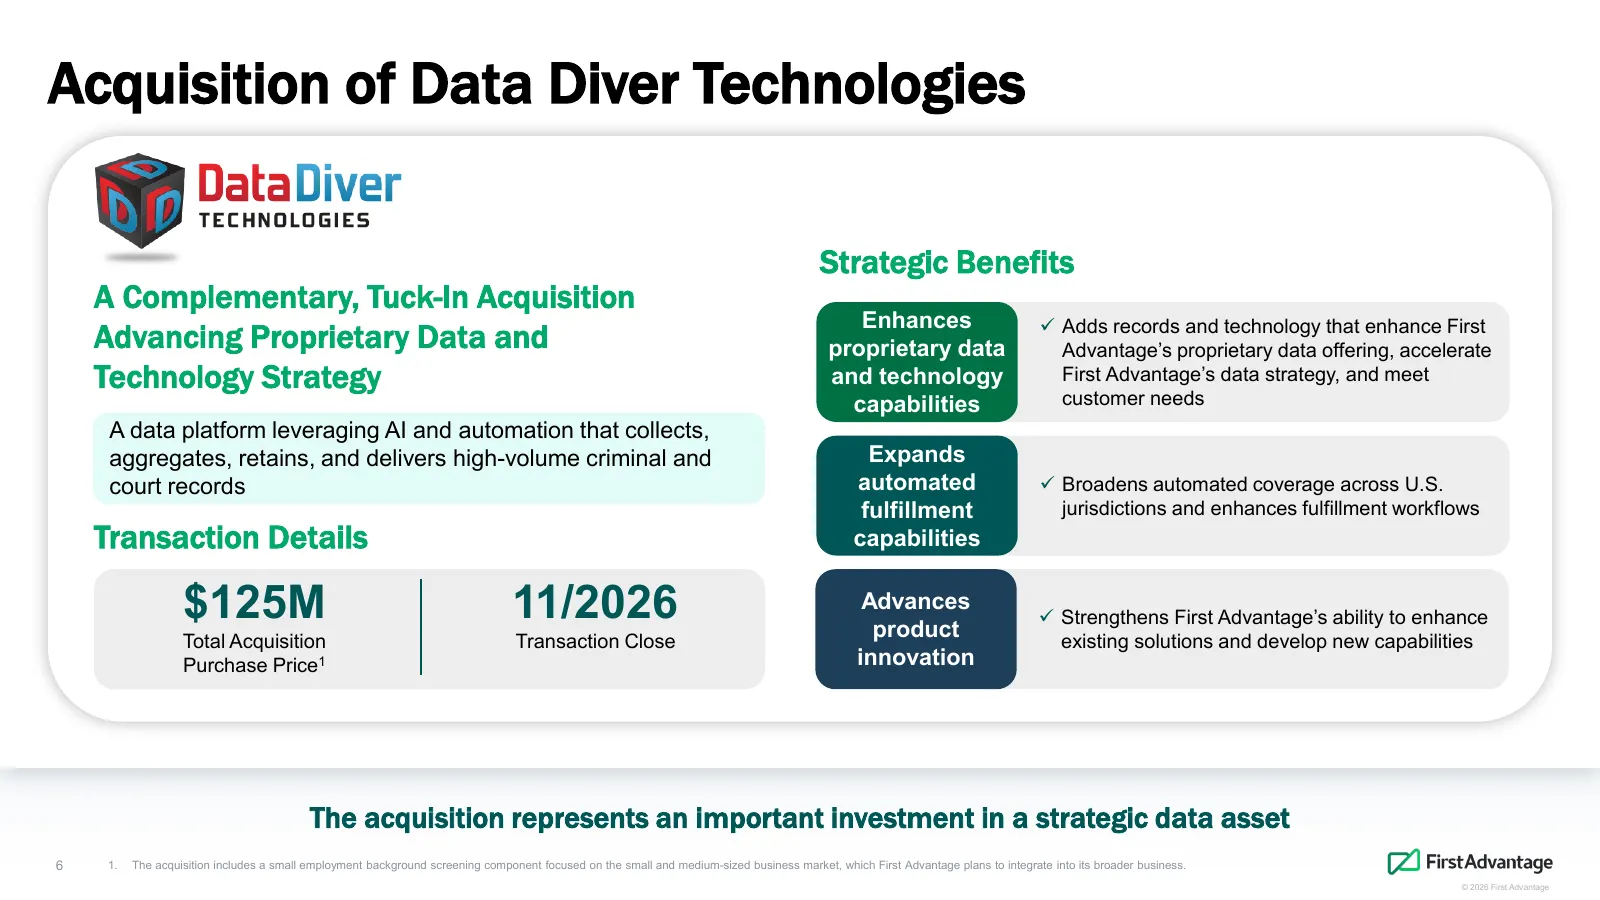
Acquisition of Data Diver Technologies Strategic Benefits A Complementary, Tuck-In Acquisition Enhances Adds records and technology that enhance First Advancing Proprietary Data and proprietary data Advantage’s proprietary data offering, accelerate Technology Strategy and technology First Advantag

Slide 7: Go-to-Market Update
Go-to-Market Update Joelle Smith President © 2026 First Advantage
Slide 8: Revenue Growth Algorithm Drivers
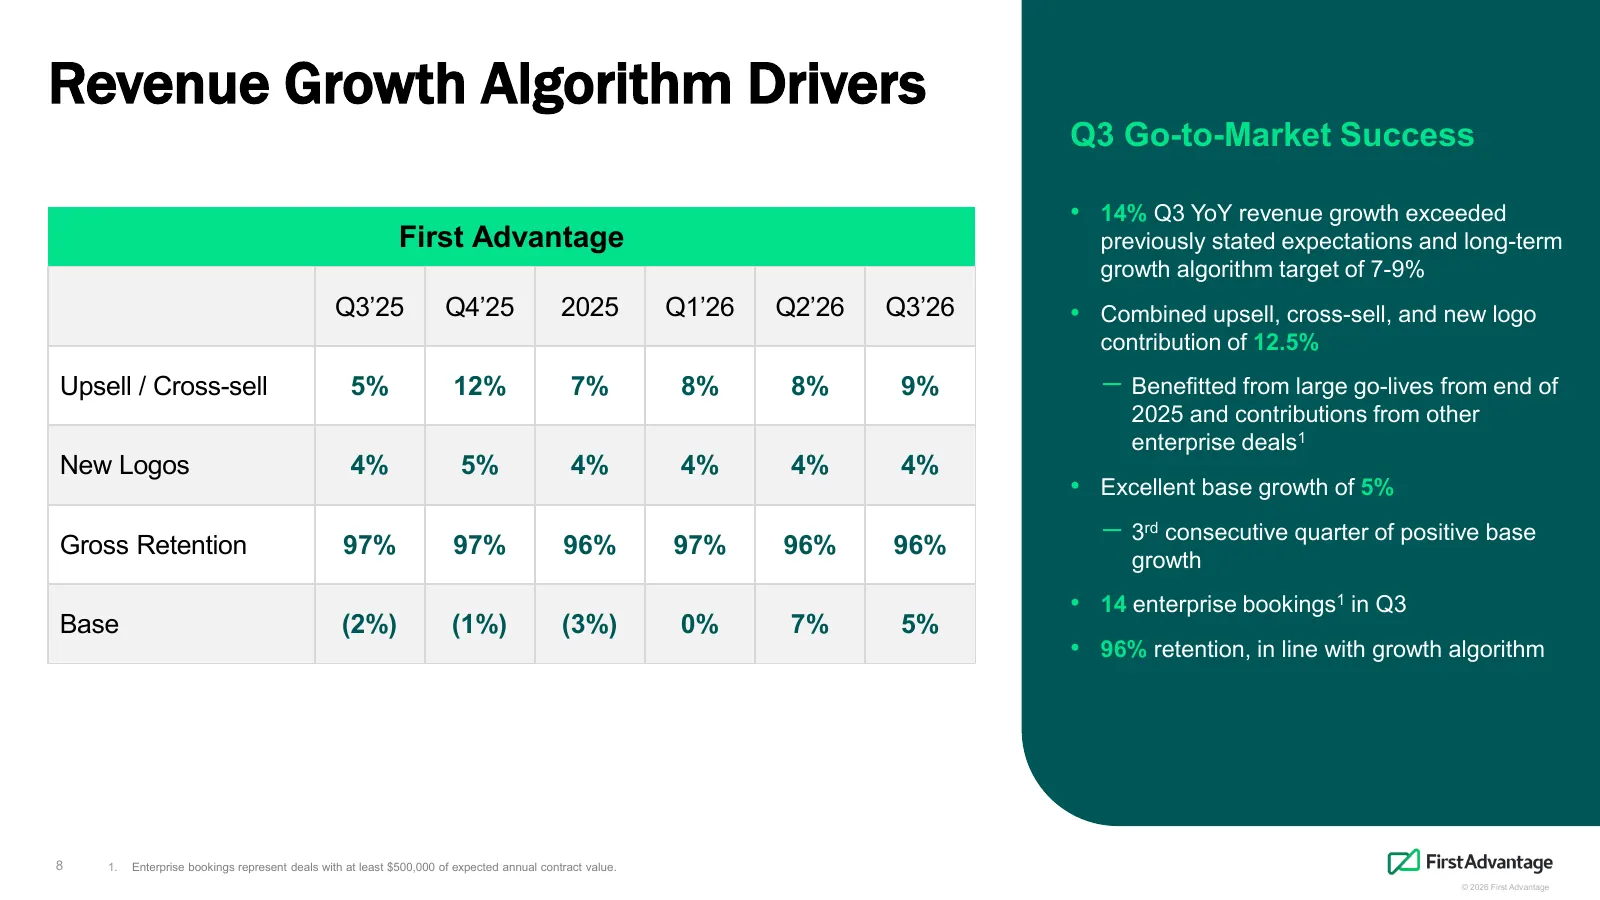
Revenue Growth Algorithm Drivers Q3 Go-to-Market Success • 14% Q3 YoY revenue growth exceeded First Advantage previously stated expectations and long-term growth algorithm target of 7-9% Q3’25 Q4’25 2025 Q1’26 Q2’26 Q3’26 • Combined upsell, cross-sell, and new logo contribution of 12.5% Upsell / Cro
Slide 9: Go-to-Market Update
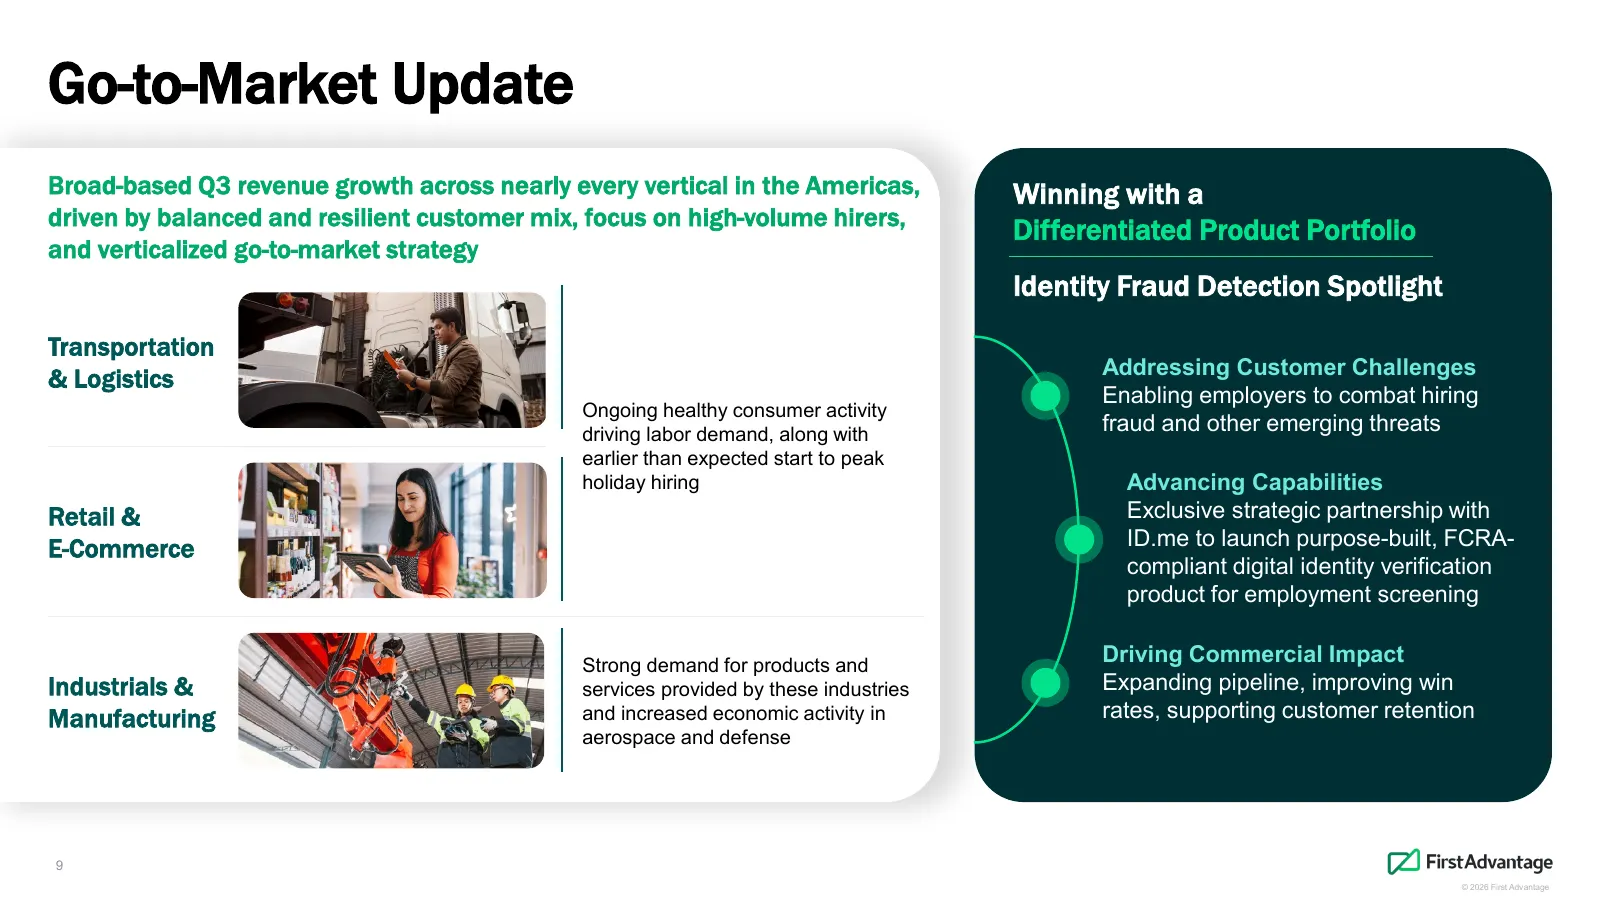
Go-to-Market Update Broad-based Q3 revenue growth across nearly every vertical in the Americas, Winning with a driven by balanced and resilient customer mix, focus on high-volume hirers, Differentiated Product Portfolio and verticalized go-to-market strategy Identity Fraud Detection Spotlight Transp
Slide 10: Enhancing Fulfillment Capabilities
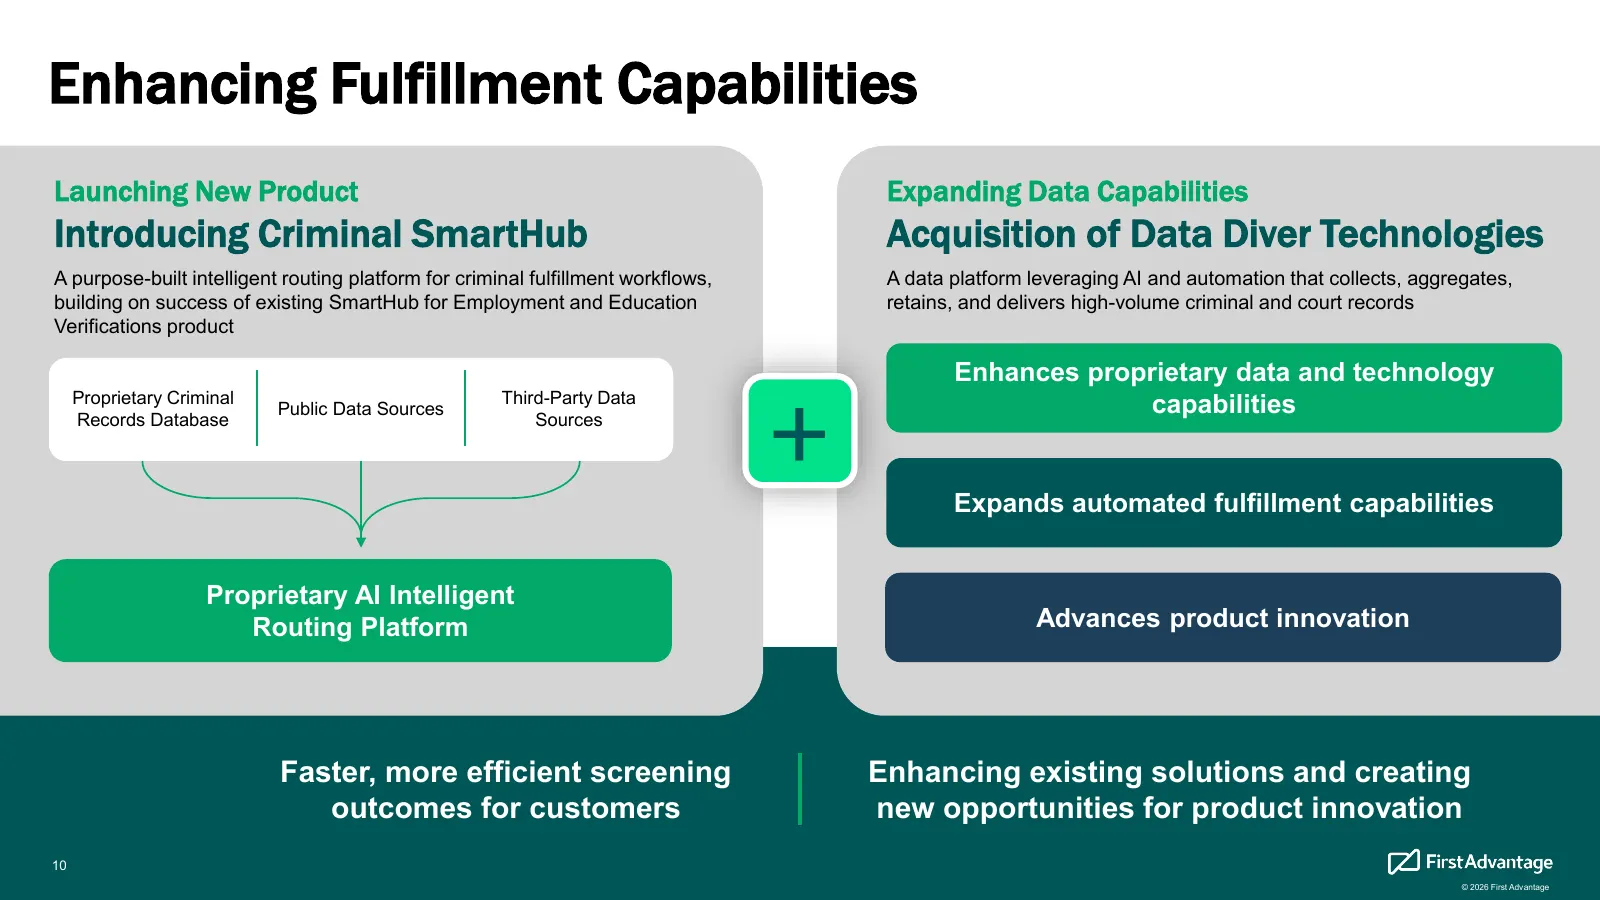
Enhancing Fulfillment Capabilities Launching New Product Expanding Data Capabilities Introducing Criminal SmartHub Acquisition of Data Diver Technologies A purpose-built intelligent routing platform for criminal fulfillment workflows, A data platform leveraging AI and automation that collects, aggre

Slide 11: Financial Results & Outlook
Financial Results & Outlook Steven Marks Chief Financial Officer © 2026 First Advantage
Slide 12: Q3 2026 Financial Results
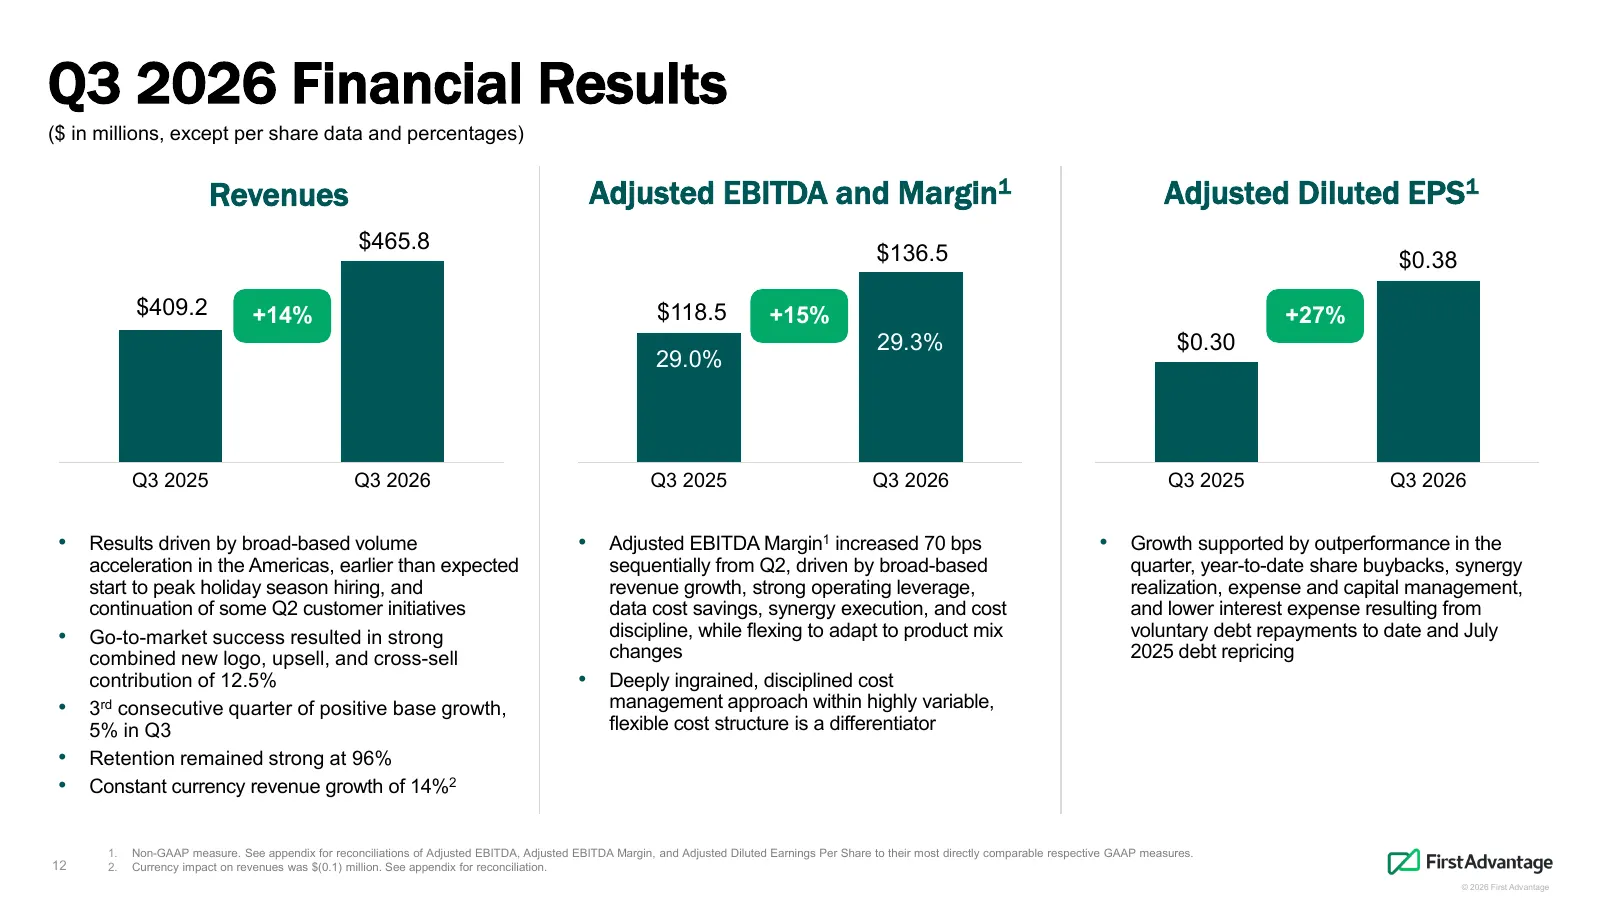
Q3 2026 Financial Results ($ in millions, except per share data and percentages) Revenues Adjusted EBITDA and Margin1 Adjusted Diluted EPS1 $465.8 $136.5 $0.38 $409.2 +14% $118.5 +15% +27% 29.3% $0.30 29.0% Q3 2025 Q3 2026 Q3 2025 Q3 2026 Q3 2025 Q3 2026 • Results driven by broad-based volume • Adju
Slide 13: Cash Flow and Capital Structure
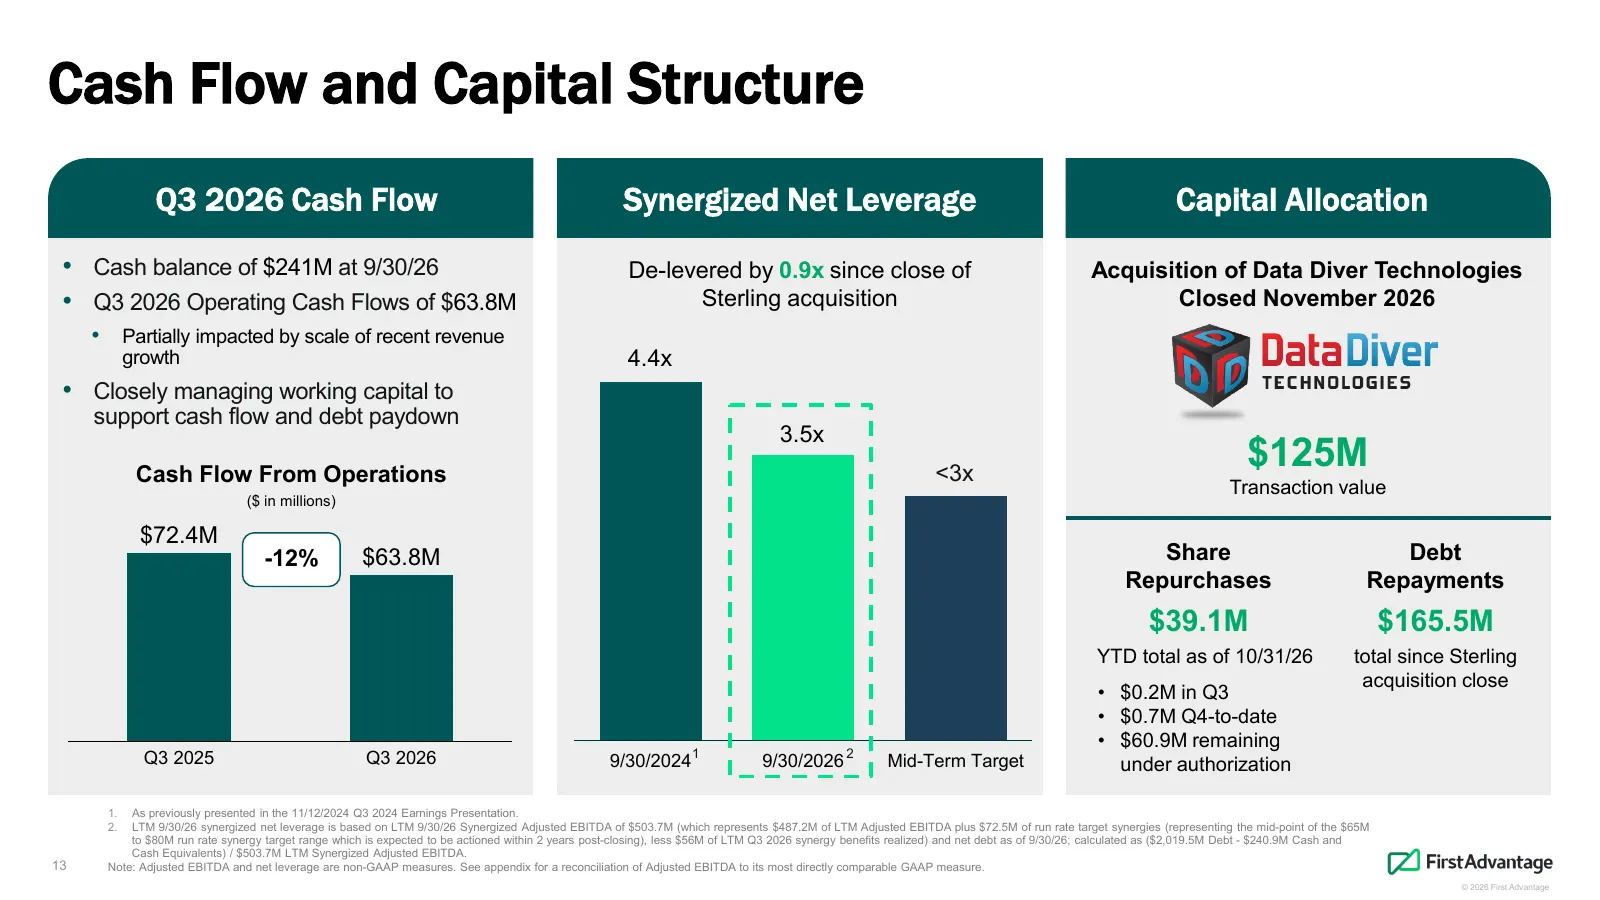
Cash Flow and Capital Structure Q3 2026 Cash Flow Synergized Net Leverage Capital Allocation • Cash balance of $241M at 9/30/26 De-levered by 0.9x since close of Acquisition of Data Diver Technologies • Q3 2026 Operating Cash Flows of $63.8M Sterling acquisition Closed November 2026 • Partially impa
Slide 14: Raising Full Year 2026 Guidance
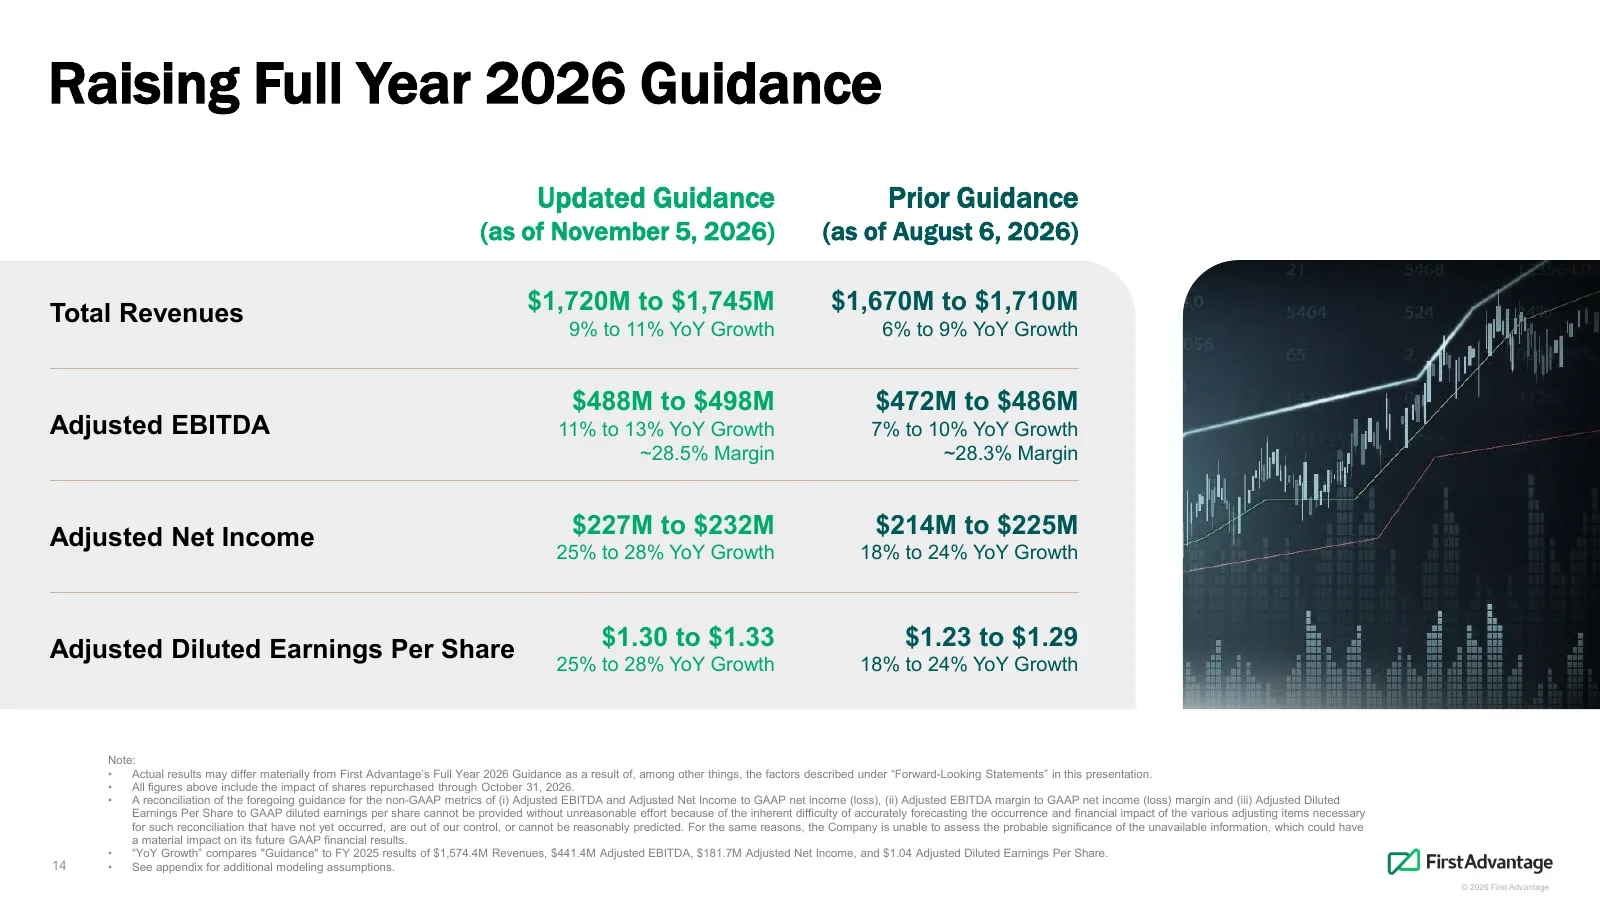
Raising Full Year 2026 Guidance Updated Guidance Prior Guidance (as of November 5, 2026) (as of August 6, 2026) Total Revenues $1,720M to $1,745M $1,670M to $1,710M 9% to 11% YoY Growth 6% to 9% YoY Growth $488M to $498M $472M to $486M Adjusted EBITDA 11% to 13% YoY Growth 7% to 10% YoY Growth ~28.5

Slide 15: Closing Remarks
Closing Remarks Scott Staples Chief Executive Officer © 2026 First Advantage
Slide 16: Investment Thesis and Reaffirmed 2028 Targets
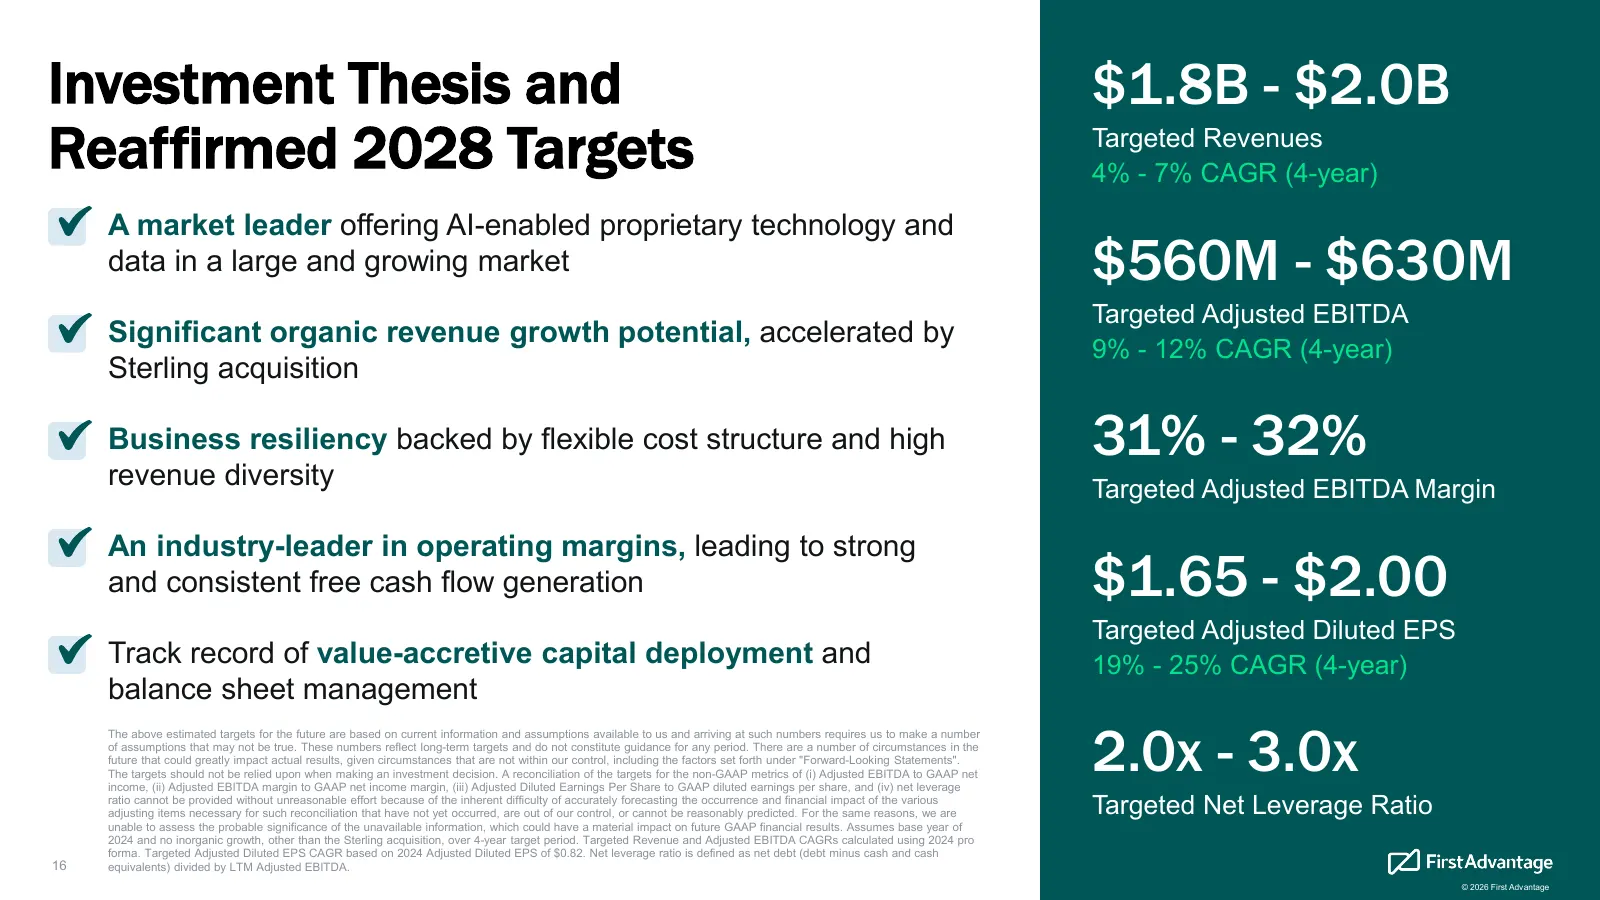
Investment Thesis and $1.8B - $2.0B Reaffirmed 2028 Targets Targeted Revenues 4% - 7% CAGR (4-year) A market leader offering AI-enabled proprietary technology and data in a large and growing market $560M - $630M Targeted Adjusted EBITDA Significant organic revenue growth potential, accelerated by 9%

Slide 17: Appendix
Appendix Supplemental Materials and Reconciliations to GAAP Measures © 2026 First Advantage
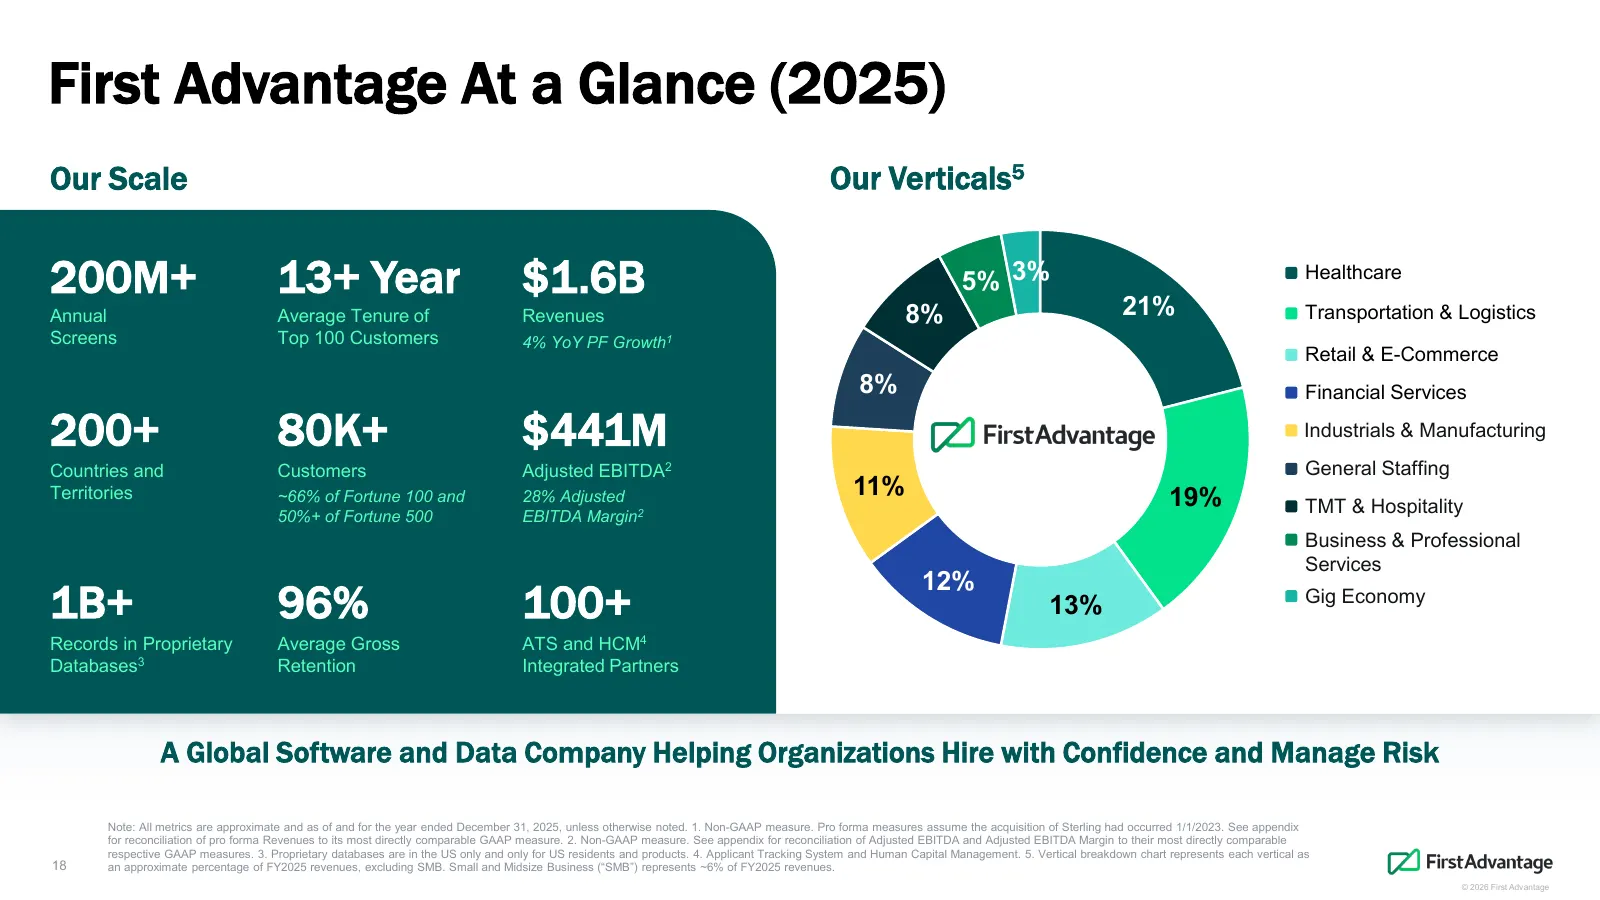
Slide 18: First Advantage At a Glance (2025)
First Advantage At a Glance (2025) Our Scale Our Verticals5 200M+ 13+ Year $1.6B 5% 3% 21% Healthcare Annual Average Tenure of Revenues 8% Transportation & Logistics Screens Top 100 Customers 4% YoY PF Growth1 Retail & E-Commerce 8% Financial Services 200+ 80K+ $441M Industrials & Manufacturing Coun
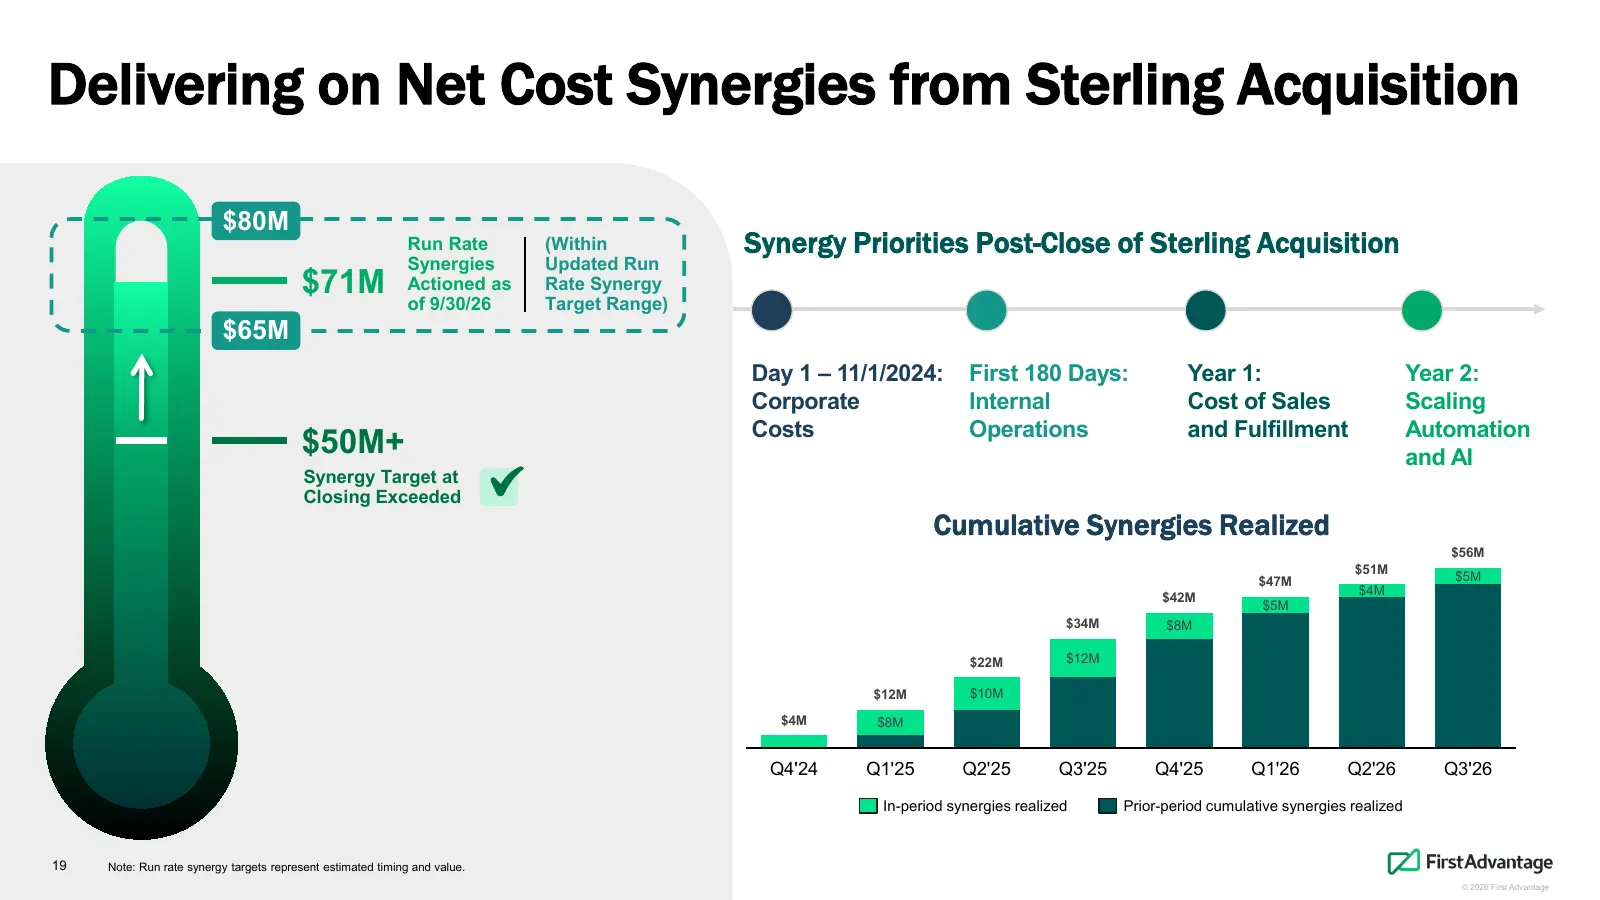
Slide 19: Delivering on Net Cost Synergies from Sterling Acquisition
Delivering on Net Cost Synergies from Sterling Acquisition $80M Run Rate (Within Synergy Priorities Post-Close of Sterling Acquisition Synergies Updated Run $71M Actioned as Rate Synergy of 9/30/26 Target Range) $65M Day 1 – 11/1/2024: First 180 Days: Year 1: Year 2: Corporate Internal Cost of Sales
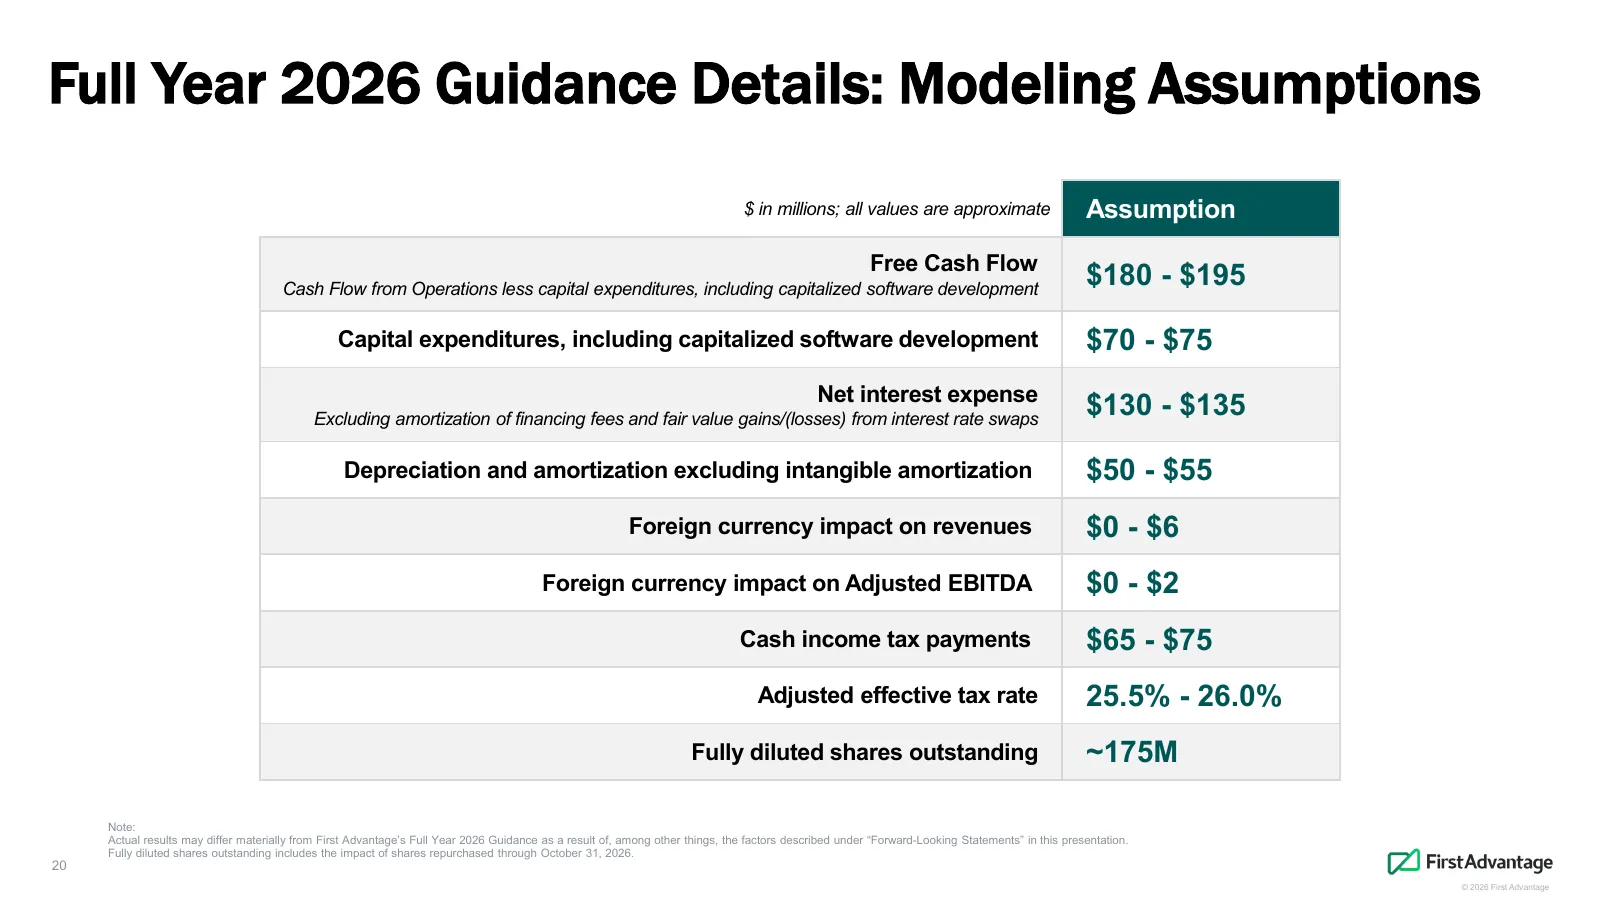
Slide 20: Full Year 2026 Guidance Details: Modeling Assumptions
Full Year 2026 Guidance Details: Modeling Assumptions $ in millions; all values are approximate Assumption Free Cash Flow Cash Flow from Operations less capital expenditures, including capitalized software development $180 - $195 Capital expenditures, including capitalized software development $70 -
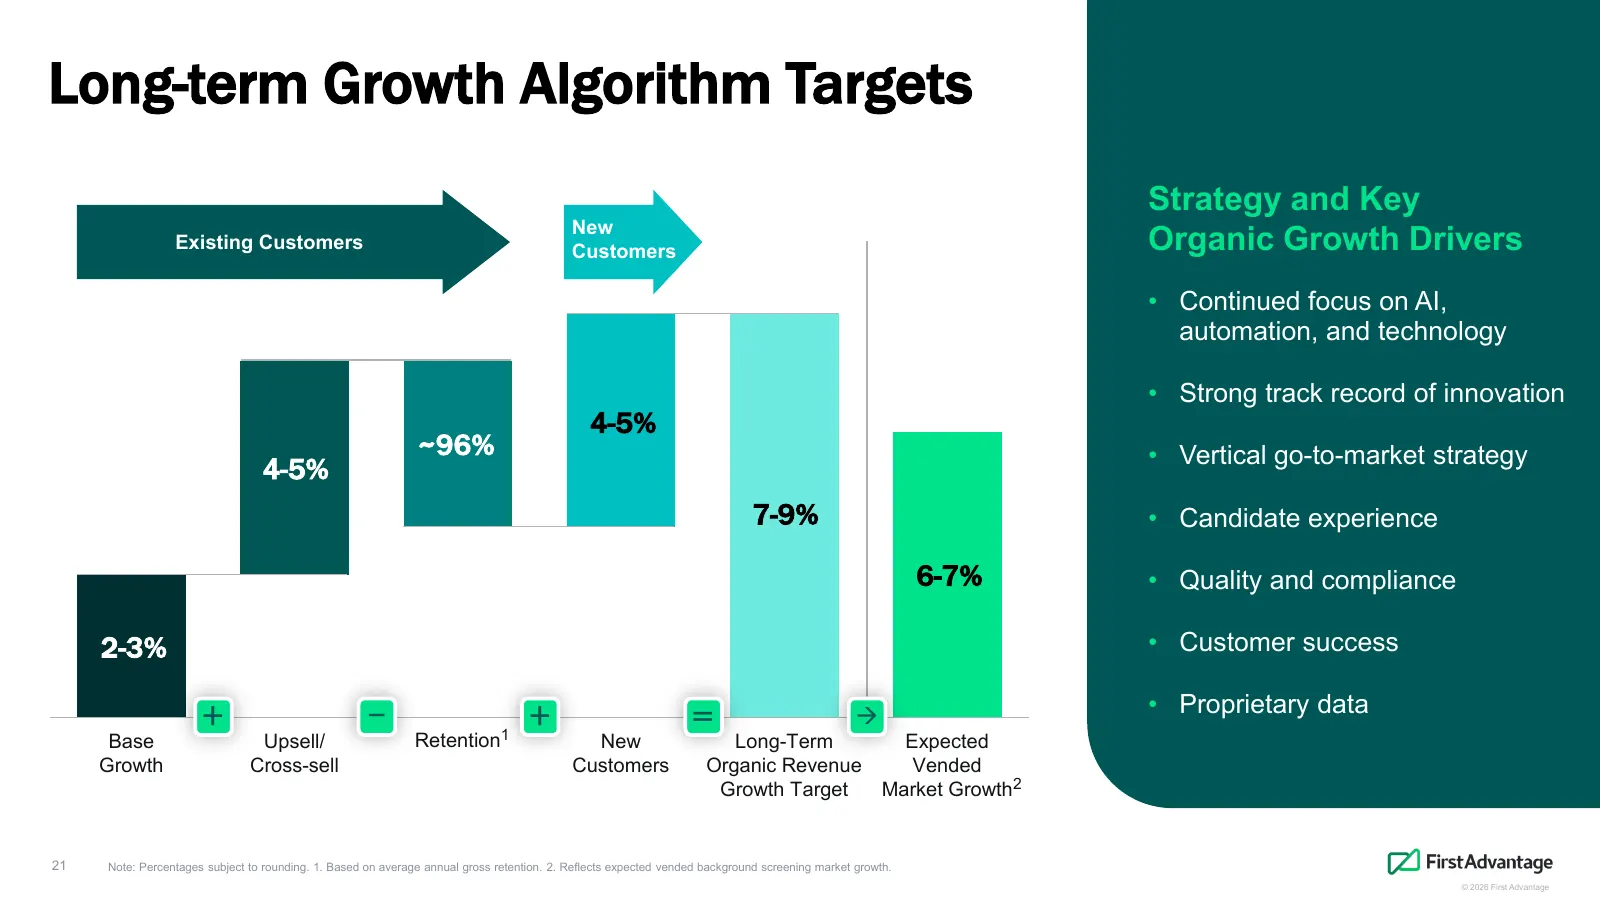
Slide 21: Long-term Growth Algorithm Targets
Long-term Growth Algorithm Targets Strategy and Key New Existing Customers Customers Organic Growth Drivers • Continued focus on AI, automation, and technology • Strong track record of innovation 4-5% ~96% • Vertical go-to-market strategy 4-5% 7-9% • Candidate experience 6-7% • Quality and complianc
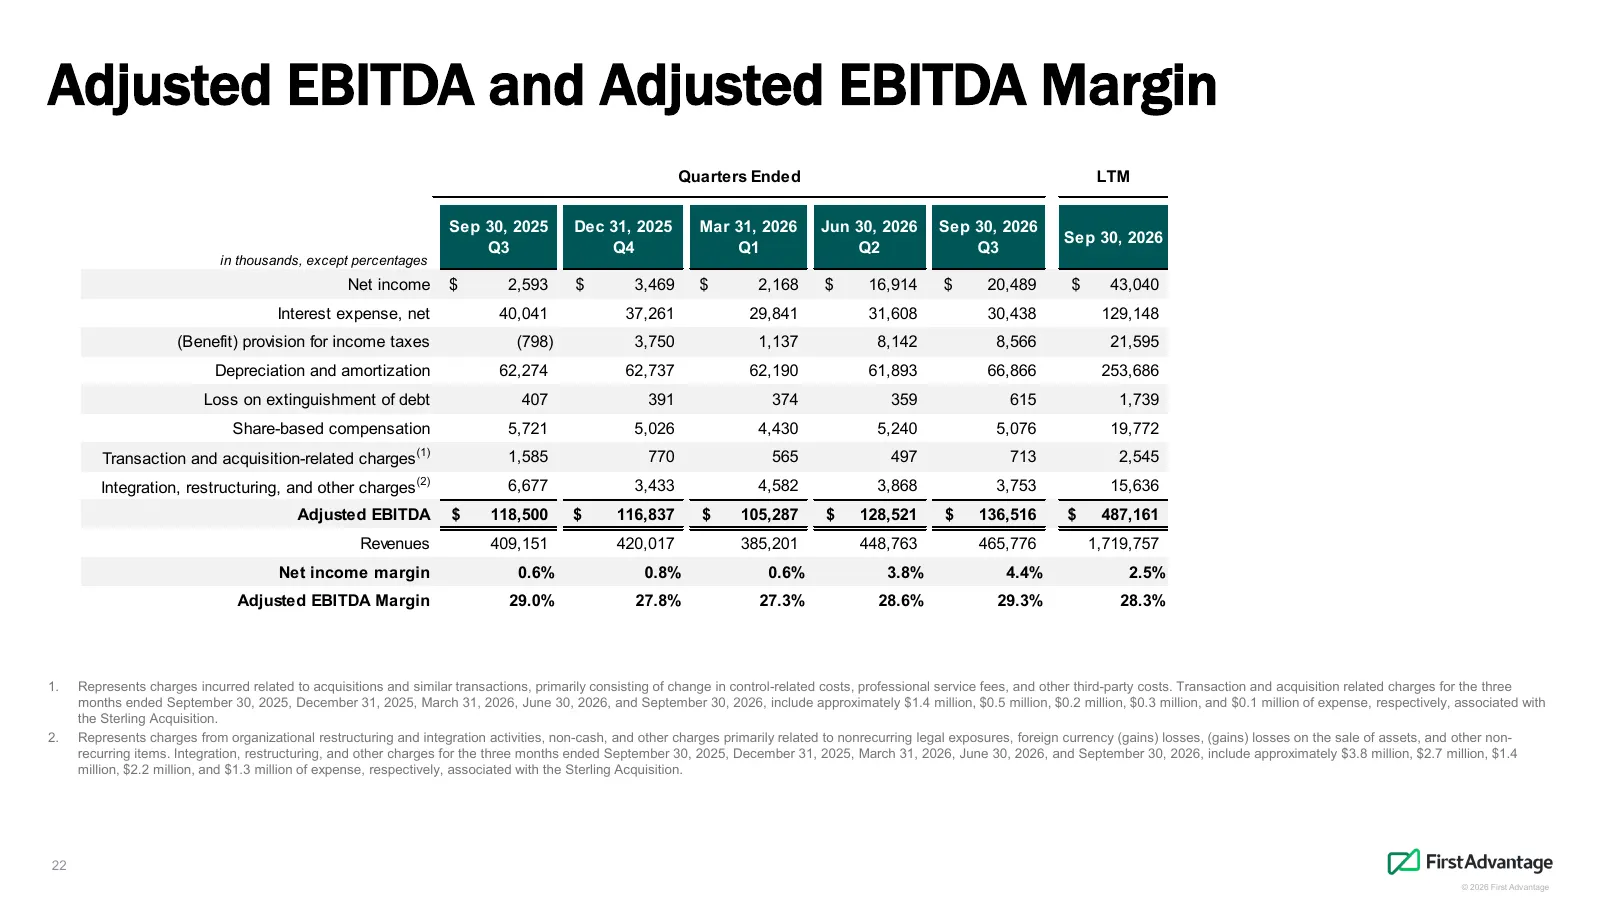
Slide 22: Adjusted EBITDA and Adjusted EBITDA Margin
Adjusted EBITDA and Adjusted EBITDA Margin Quarters Ended LTM Sep 30, 2025 Dec 31, 2025 Mar 31, 2026 Jun 30, 2026 Sep 30, 2026 Sep 30, 2026 Q3 Q4 Q1 Q2 Q3 in thousands, except percentages Net income $ 2,593 $ 3,469 $ 2,168 $ 16,914 $ 20,489 $ 43,040 Interest expense, net 40,041 37,261 29,841 31,608
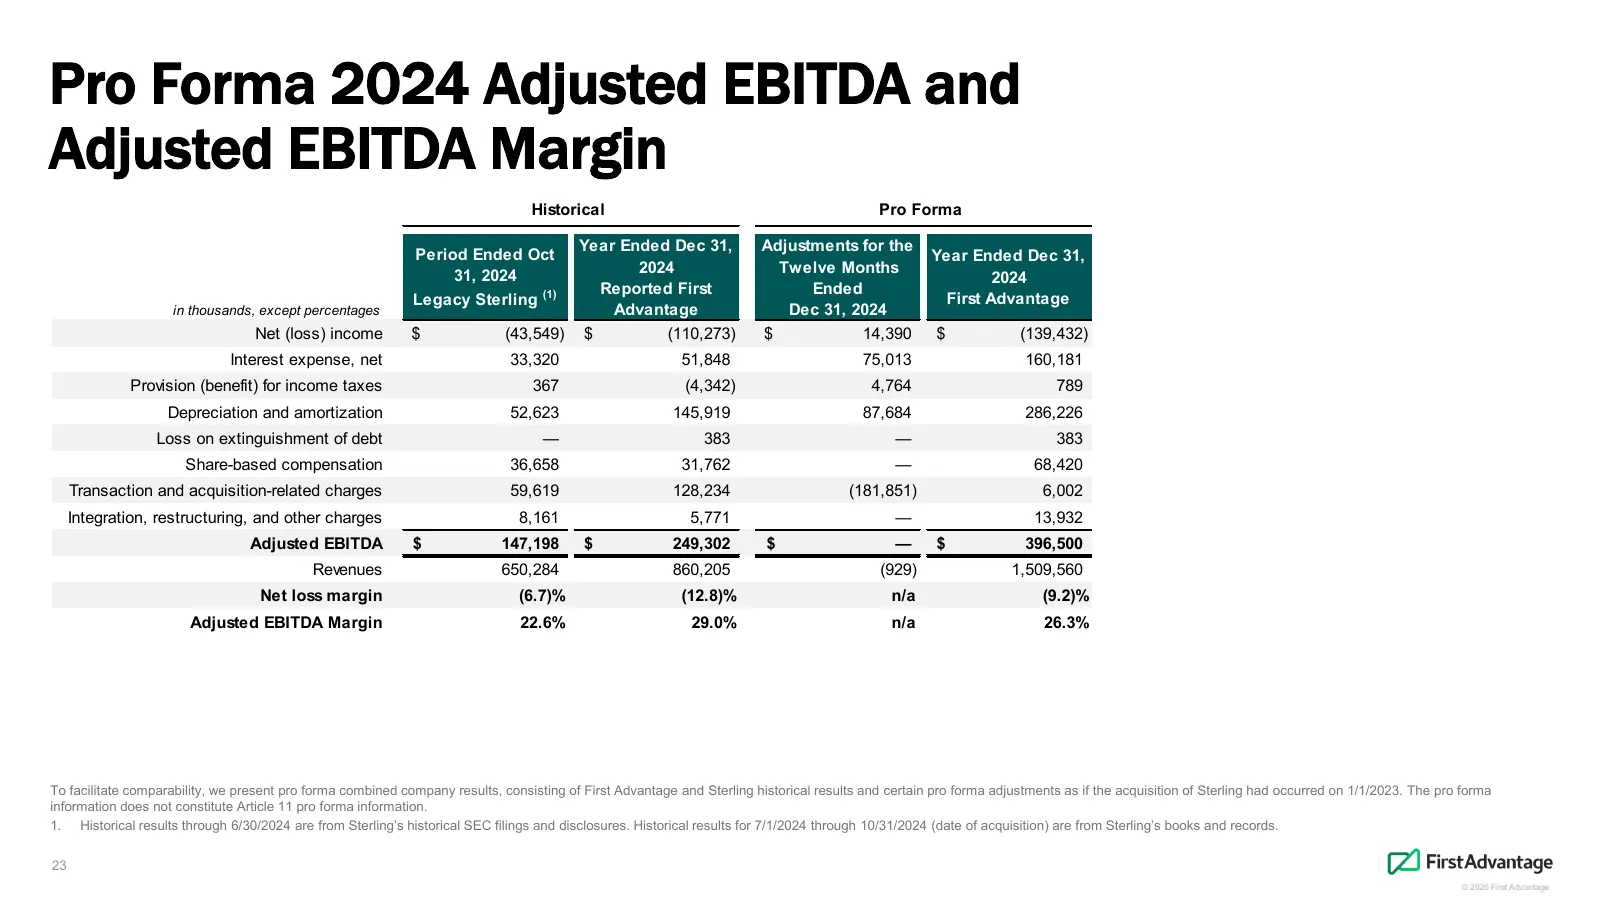
Slide 23: Pro Forma 2024 Adjusted EBITDA and Adjusted EBITDA Margin
Pro Forma 2024 Adjusted EBITDA and Adjusted EBITDA Margin Historical Pro Forma Year Ended Dec 31, Adjustments for the Period Ended Oct Year Ended Dec 31, 2024 Twelve Months 31, 2024 2024 Reported First Ended Legacy Sterling (1) First Advantage in thousands, except percentages Advantage Dec 31, 2024
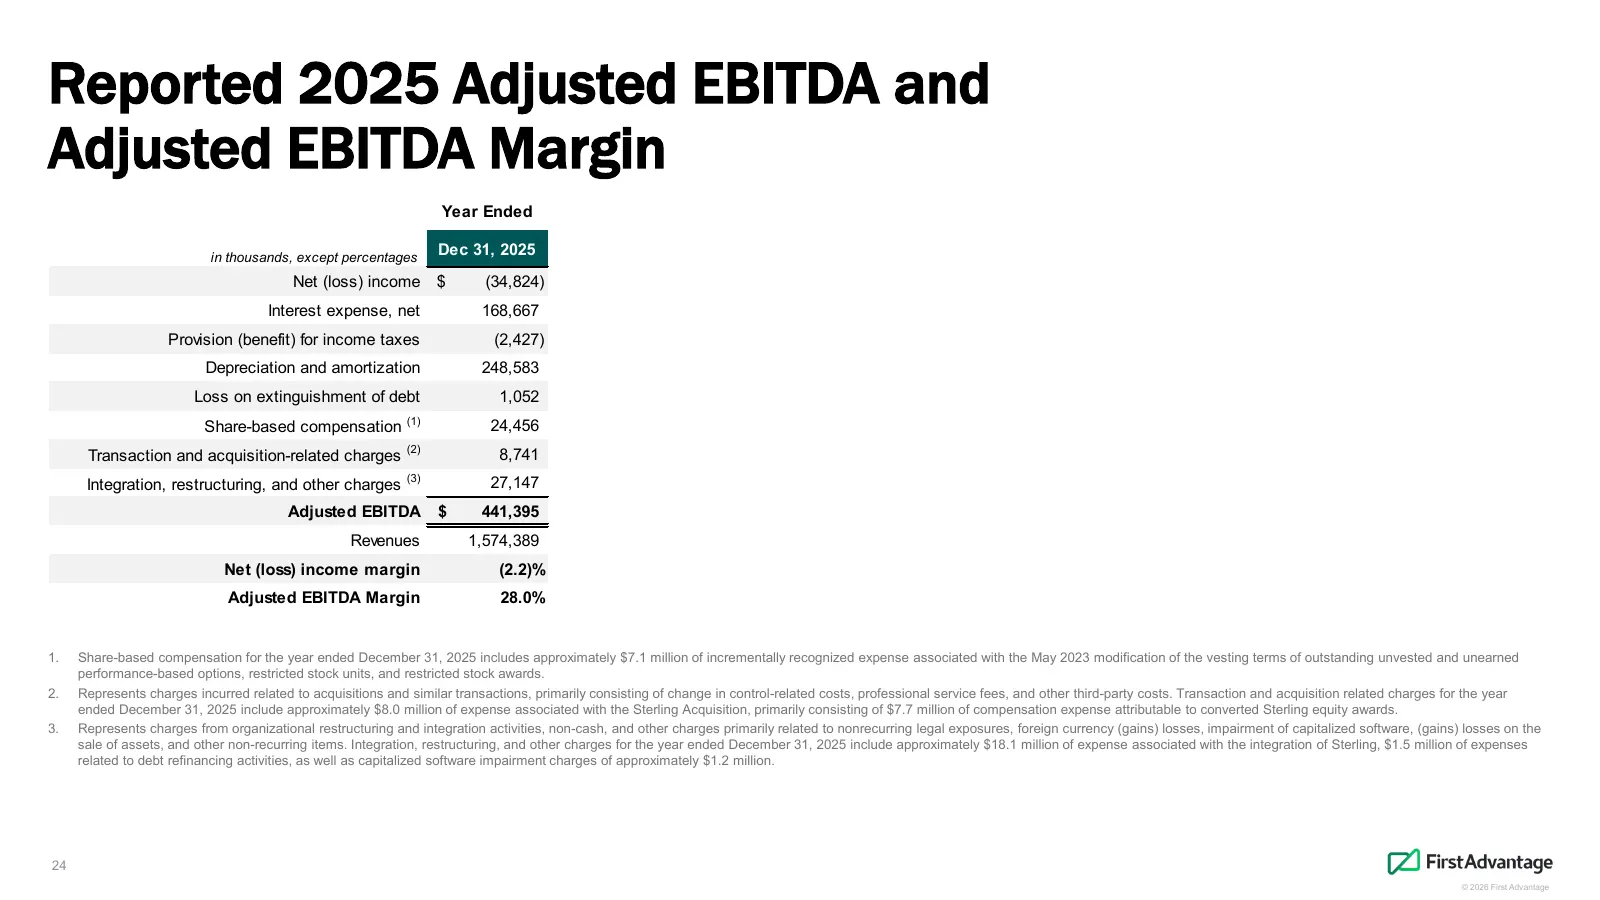
Slide 24: Reported 2025 Adjusted EBITDA and Adjusted EBITDA Margin
Reported 2025 Adjusted EBITDA and Adjusted EBITDA Margin Year Ended in thousands, except percentages Dec 31, 2025 Net (loss) income $ (34,824) Interest expense, net 168,667 Provision (benefit) for income taxes (2,427) Depreciation and amortization 248,583 Loss on extinguishment of debt 1,052 (1) Sha
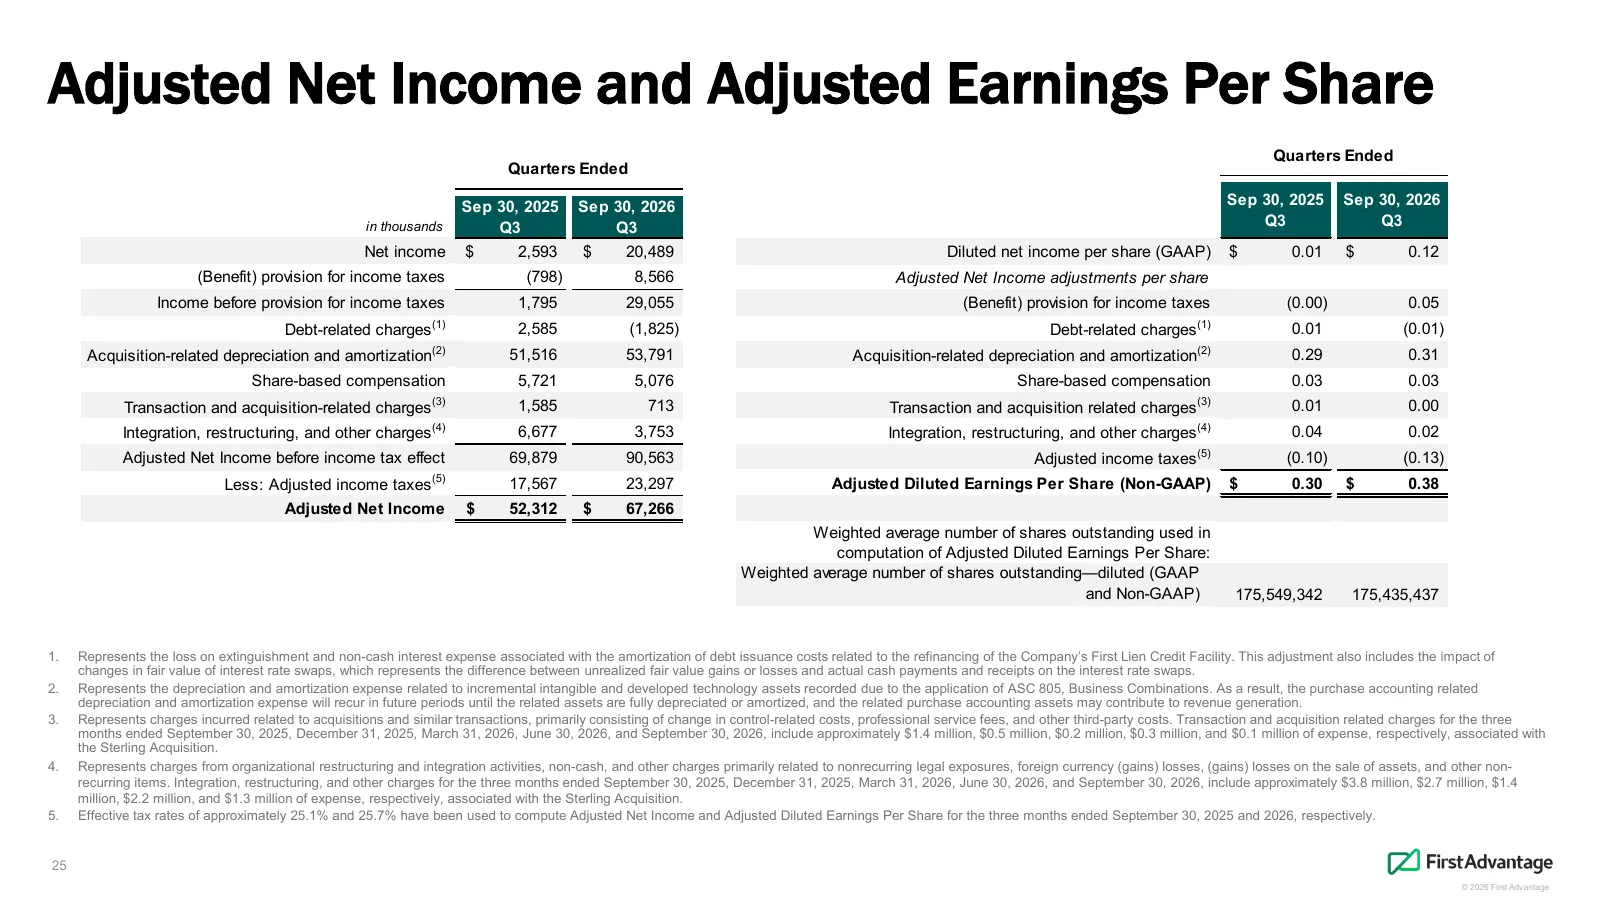
Slide 25: Adjusted Net Income and Adjusted Earnings Per Share
Adjusted Net Income and Adjusted Earnings Per Share Quarters Ended Quarters Ended Sep 30, 2025 Sep 30, 2026 Sep 30, 2025 Sep 30, 2026 in thousands Q3 Q3 Q3 Q3 Net income $ 2,593 $ 20,489 Diluted net income per share (GAAP) $ 0.01 $ 0.12 (Benefit) provision for income taxes (798) 8,566 Adjusted Net I
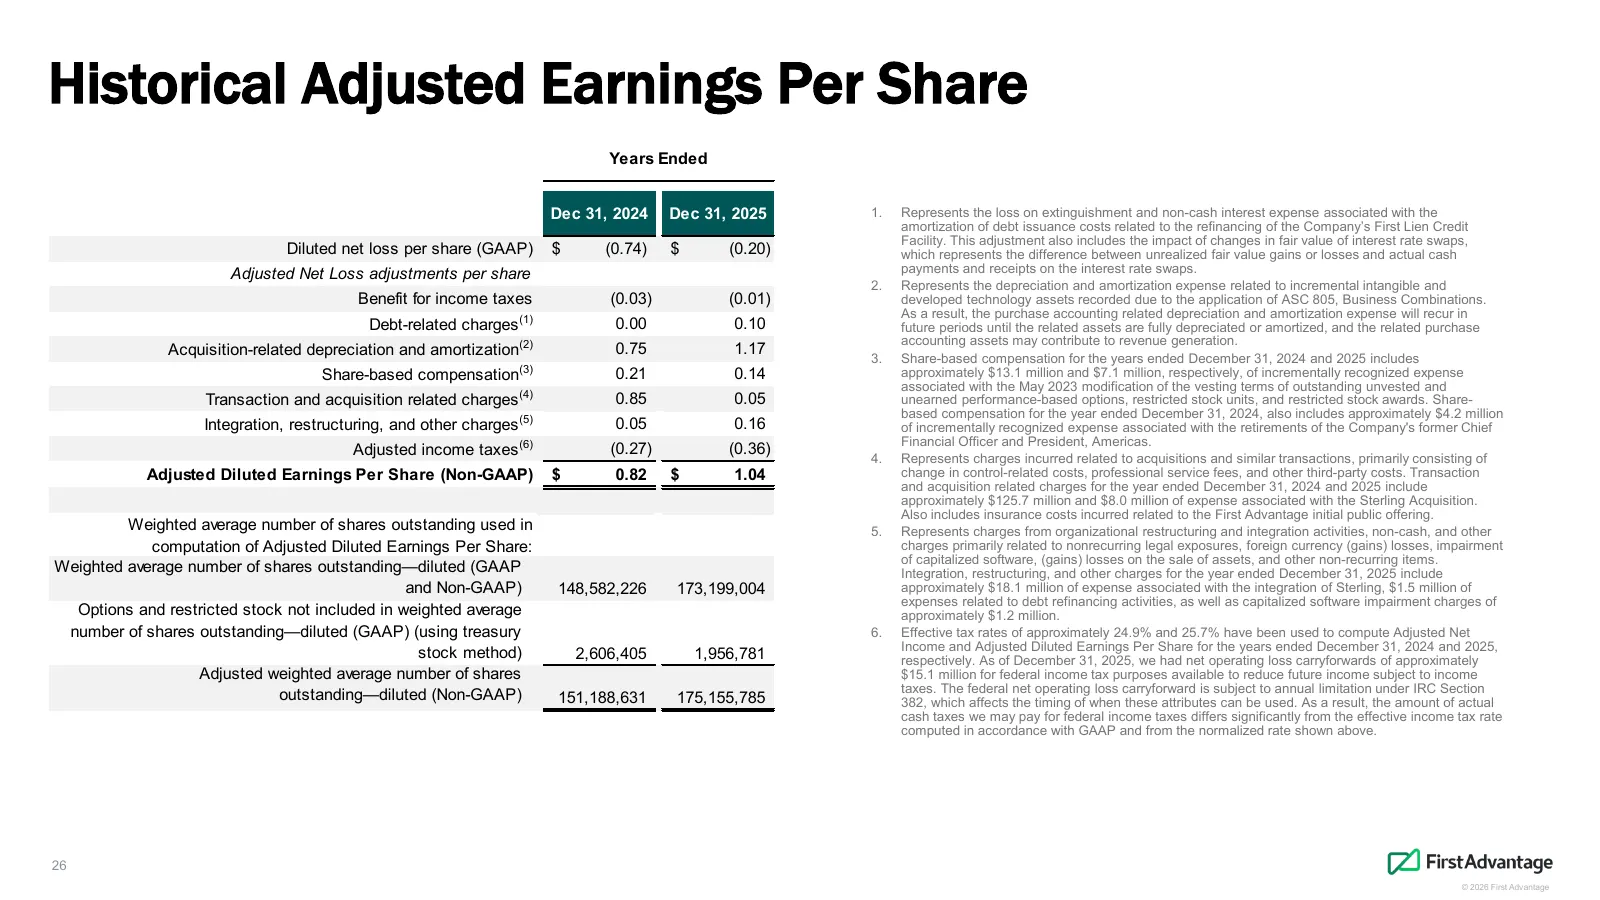
Slide 26: Historical Adjusted Earnings Per Share
Historical Adjusted Earnings Per Share Years Ended Dec 31, 2024 Dec 31, 2025 1. Represents the loss on extinguishment and non-cash interest expense associated with the amortization of debt issuance costs related to the refinancing of the Company’s First Lien Credit Facility. This adjustment also inc
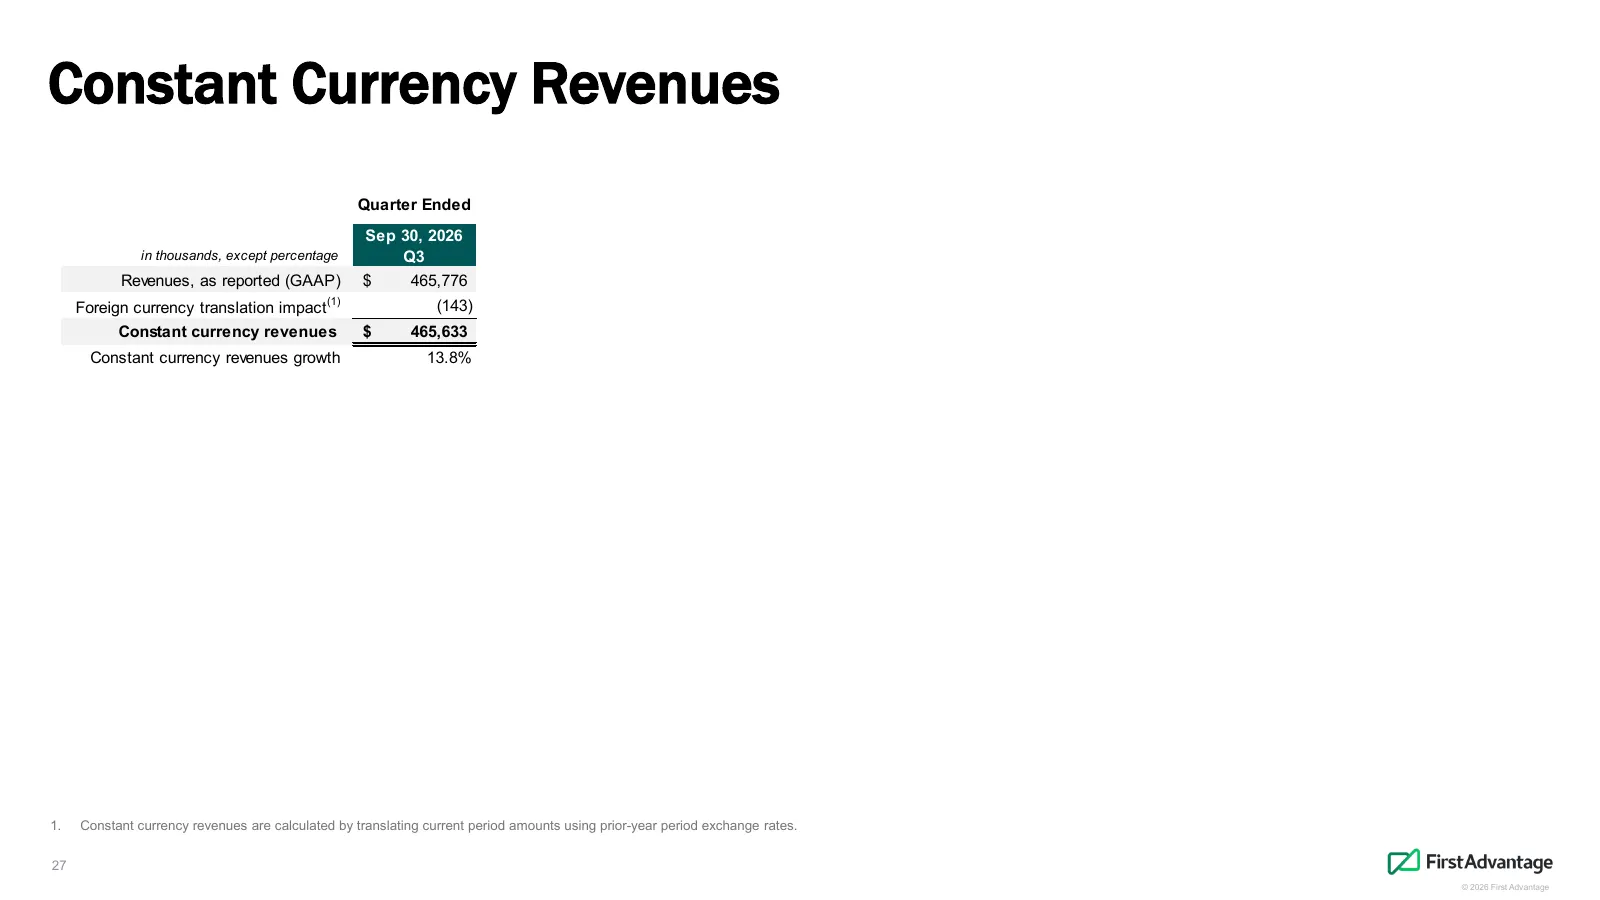
Slide 27: Constant Currency Revenues
Constant Currency Revenues Quarter Ended Sep 30, 2026 in thousands, except percentage Q3 Revenues, as reported (GAAP) $ 465,776 Foreign currency translation impact (1) (143) Constant currency revenues $ 465,633 Constant currency revenues growth 13.8% 1. Constant currency revenues are calculated by t
Source: 6ix earnings call
More decks from First Advantage Corporation
 Q2 2026 Earnings Presentation27 slides · Aug 6, 2026
 Q1 2026 Earnings Presentation25 slides · May 7, 2026
 Q4 2025 Earnings Presentation26 slides · Feb 26, 2026
 Q3 2025 Earnings Presentation29 slides · Nov 6, 2025
 Q2 2025 Earnings Presentation28 slides · Aug 7, 2025
 Investor Day (May 2025)86 slides · May 28, 2025