SGL Carbon SE · XETR:SGL
SGL Carbon — SGL Group — 9M 2014 Earnings Presentation
17 slides from SGL Carbon's earnings presentation, Nov 6, 2014
Slide 1: Results of the First Nine Months 2014 Conference Call
Results of the First Nine Months 2014 Conference Call Wiesbaden l November 6, 2014
Slide 2: Summary
Summary Dr. Jürgen g Köhler CEO Page 2 | Conference Call 9M/ 2014
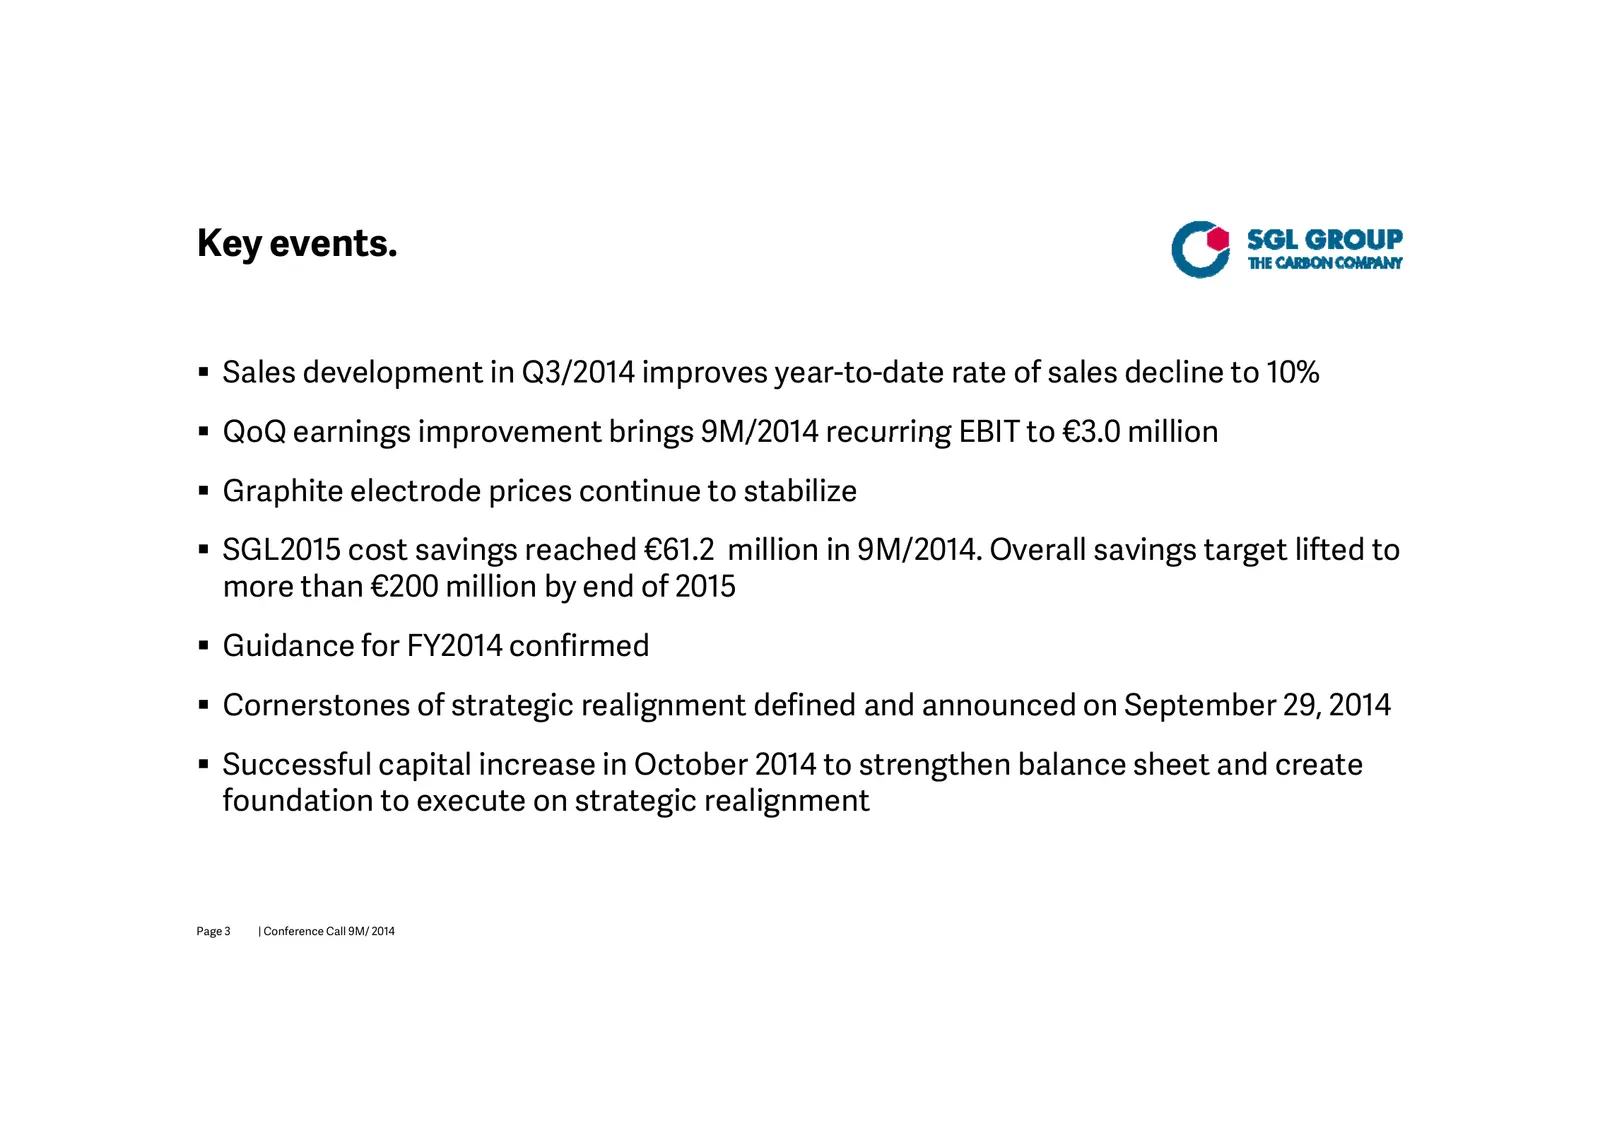
Slide 3: Key events
Key events. Sales development in Q3/2014 improves year-to-date rate of sales decline to 10% QoQ earnings improvement brings 9M/2014 recurring EBIT to €3.0 €3 0 million Graphite electrode prices continue to stabilize g reached €61.2 million in 9M/2014. Overall savings SGL2015 cost savings g t
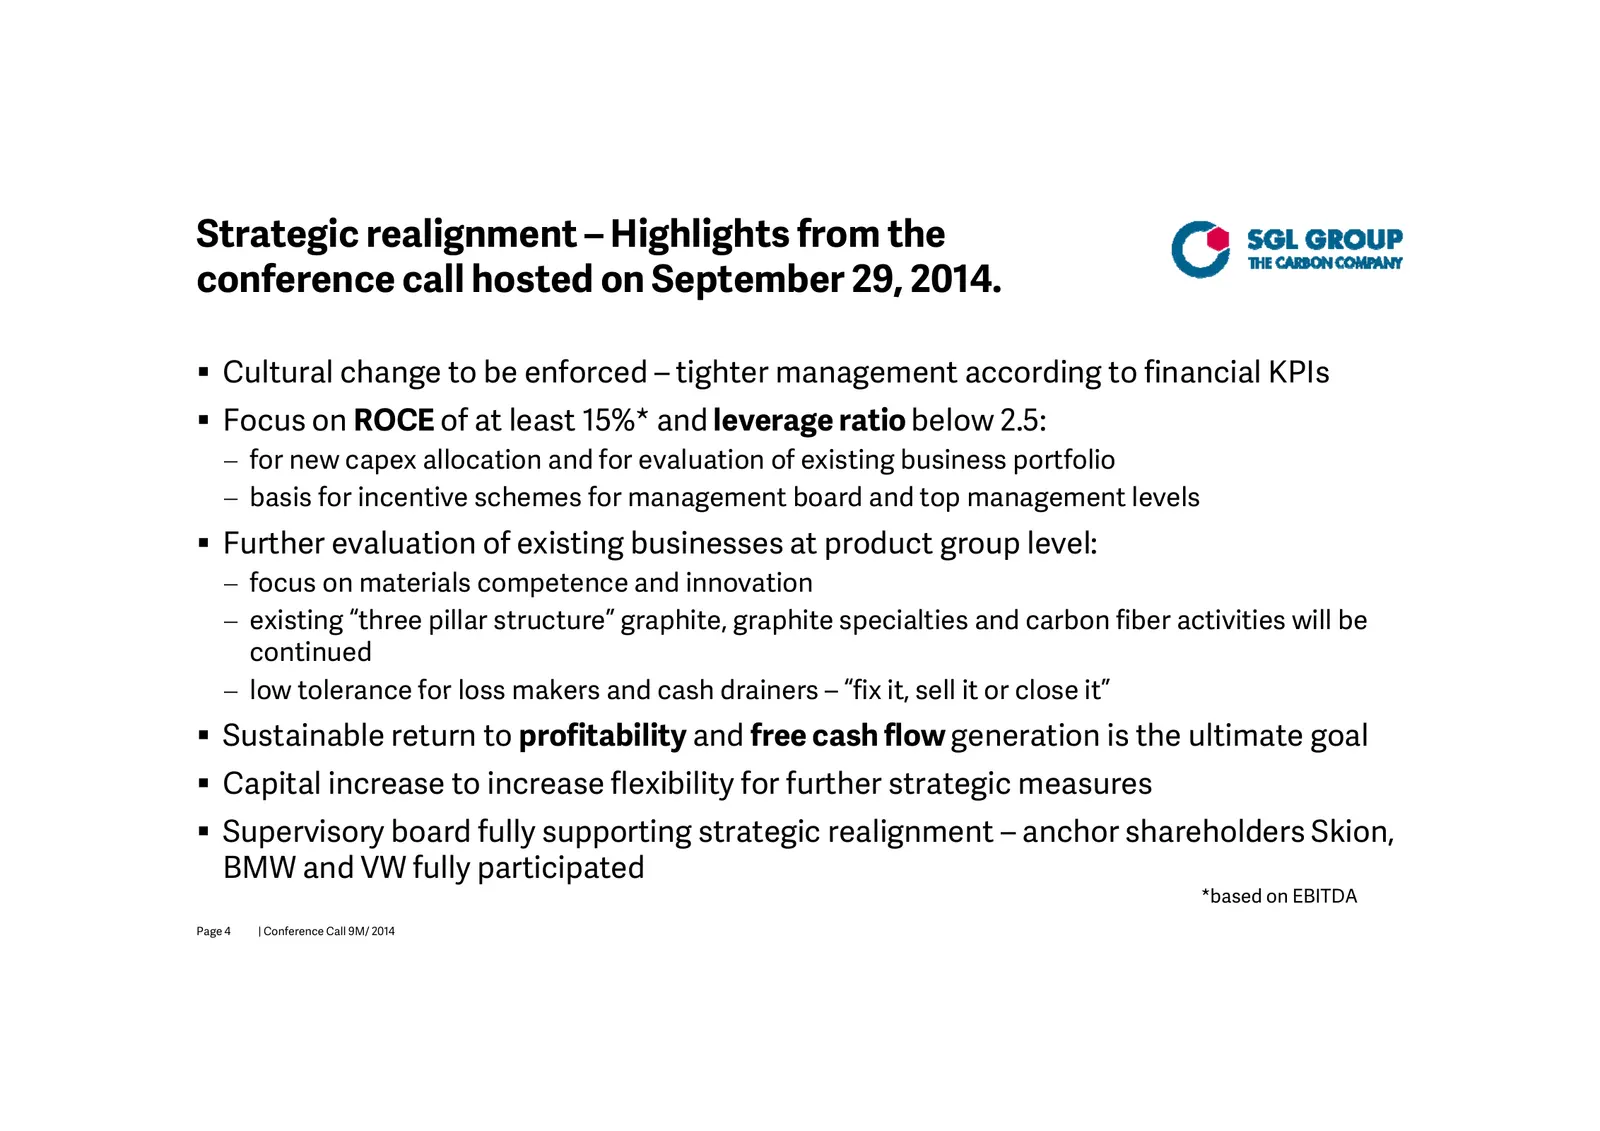
Slide 4: Strategic realignment – Highlights from the conference call hosted on September 29, 2014
Strategic realignment – Highlights from the conference call hosted on September 29, 2014. Cultural change to be enforced – tighter management according to financial KPIs Focus on ROCE of at least 15%* and leverage g ratio below 2.5: for new capex allocation and for evaluation of existing busin
Slide 5: Results of the First Nine Months 2014
Results of the First Nine M Months h 2014 Dr. Michael Majerus CFO Page 5 | Conference Call 9M/ 2014
Slide 6: Performance Products (PP)
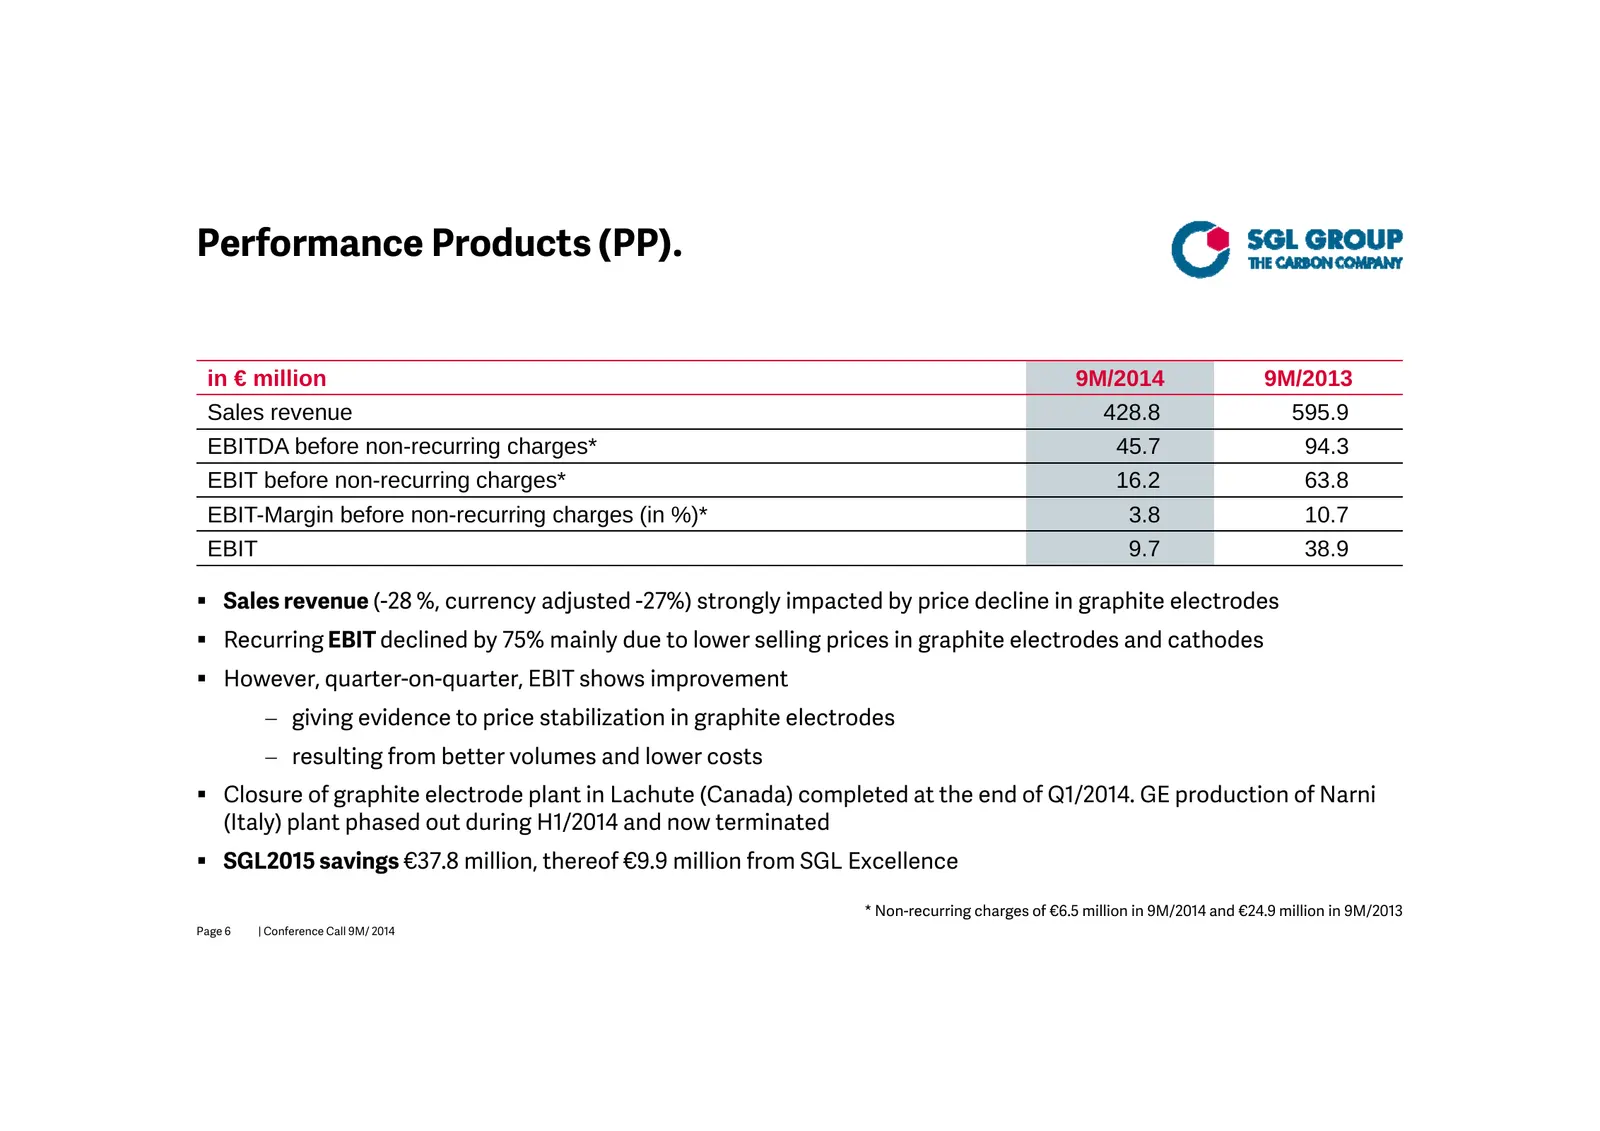
Performance Products (PP). in € million 9M/2014 9M/2013 Sales revenue 428.8 595.9 EBITDA before non-recurring charges* 45.7 94.3 EBIT before non-recurring charges* 16.2 63.8 EBIT-Margin before non-recurring charges (in %)* 3.8 10.7 EBIT 9.7 38.9 Sales revenue (-28 %, currency adjusted -27%) strong
Slide 7: Graphite Specialties (GS)
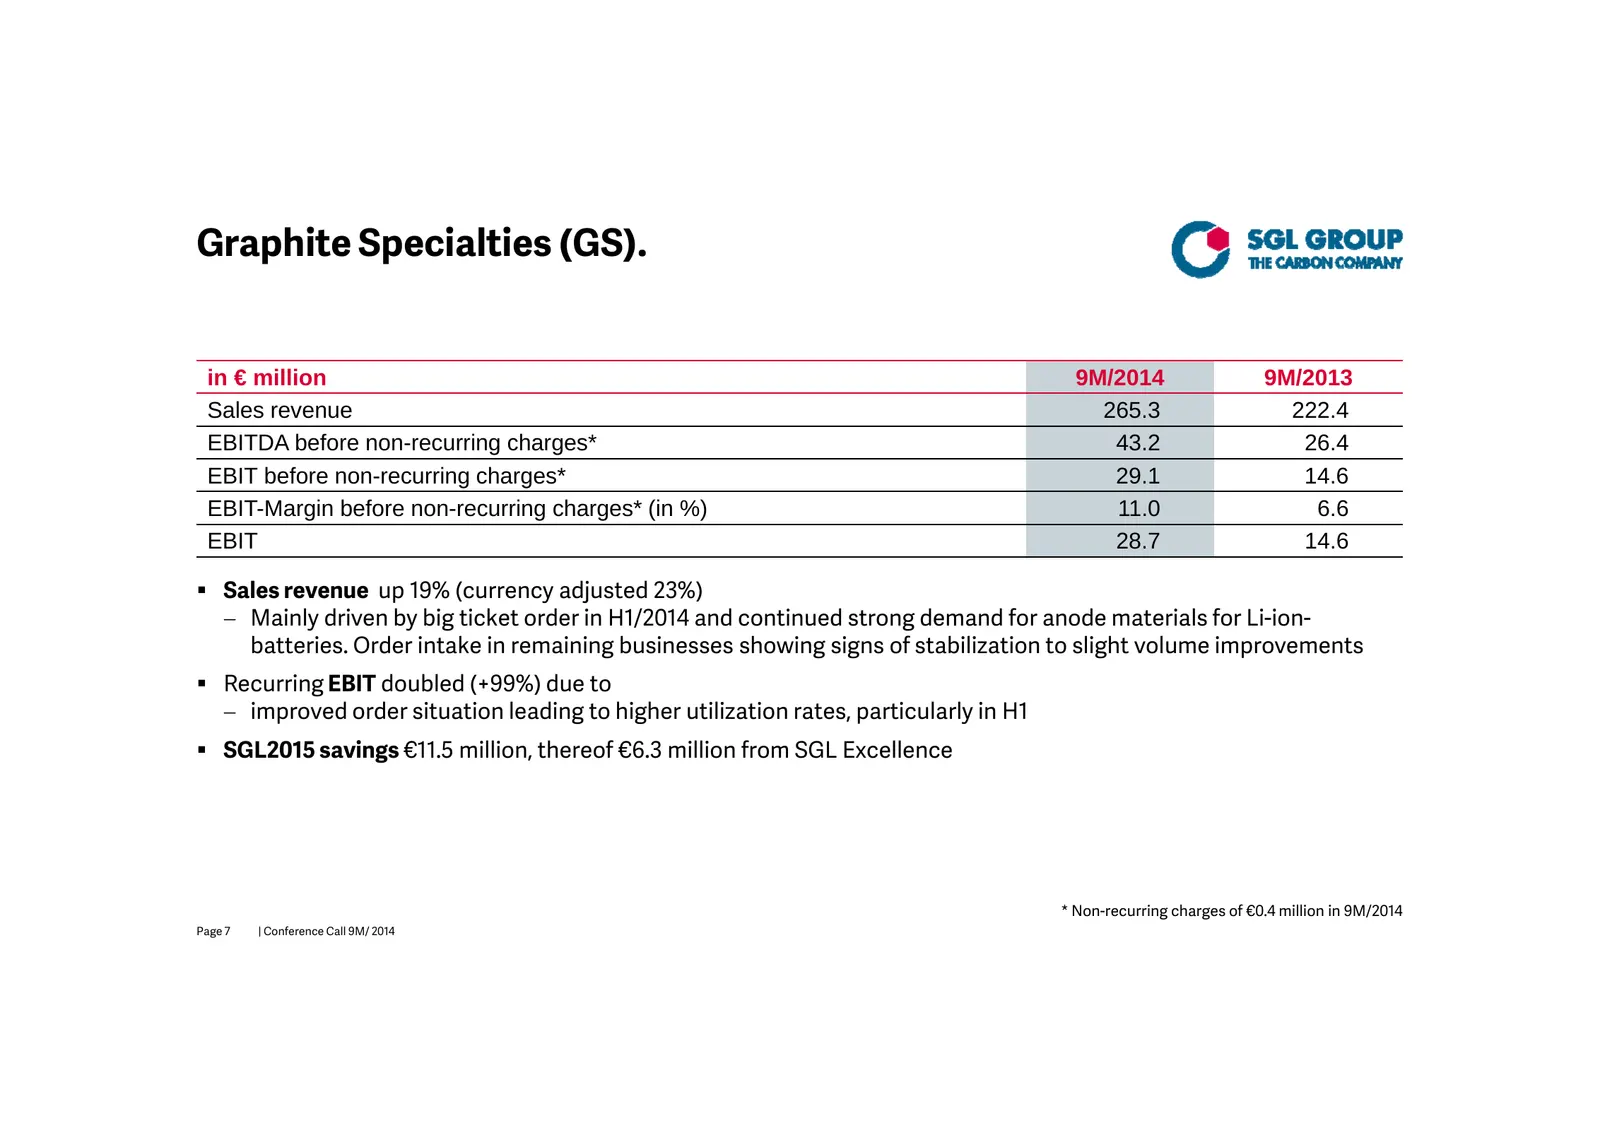
Graphite Specialties (GS). in € million 9M/2014 9M/2013 Sales revenue 265.3 222.4 EBITDA before b f non-recurring i charges* h * 43 2 43.2 26 4 26.4 EBIT before non-recurring charges* 29.1 14.6 EBIT-Margin before non-recurring charges* (in %) 11.0 6.6 EBIT 28.7 14.6 Sales revenue up 19% (currency
Slide 8: Carbon Fibers & Materials (CFM)
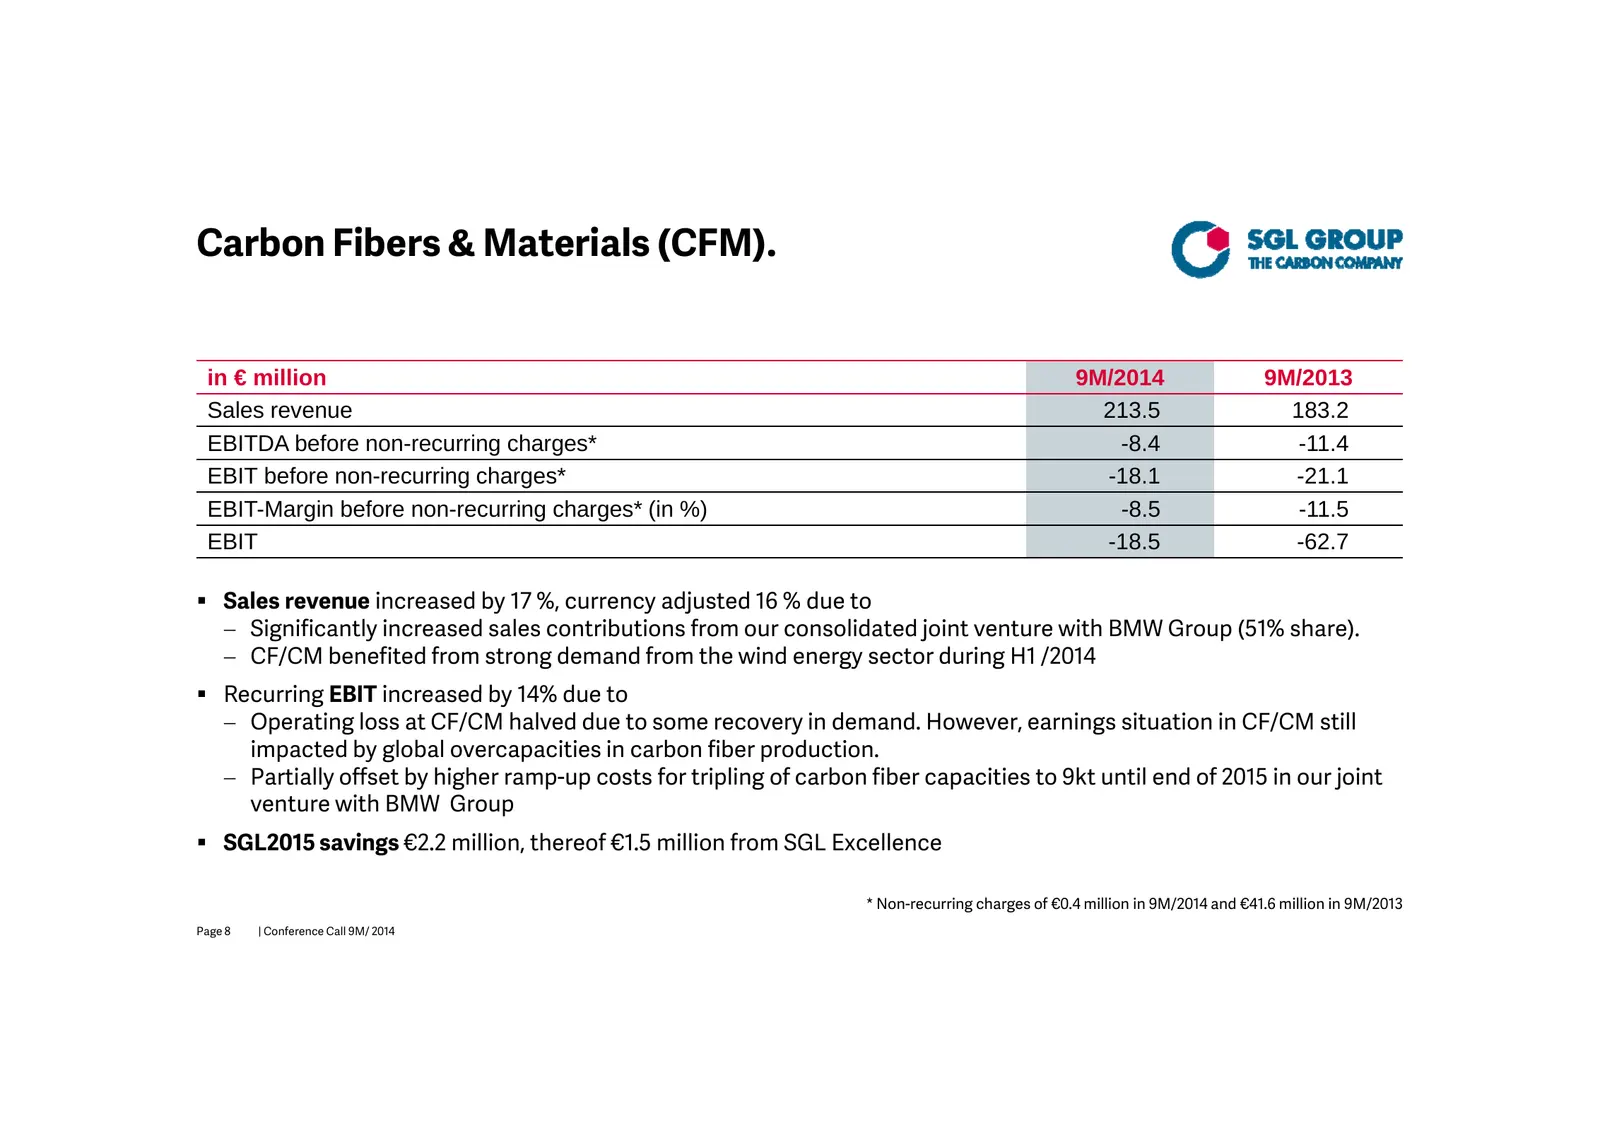
Carbon Fibers & Materials (CFM). in € million 9M/2014 9M/2013 Sales revenue 213.5 183.2 EBITDA before b f non-recurring i charges* h * -8.4 84 -11.4 11 4 EBIT before non-recurring charges* -18.1 -21.1 EBIT-Margin before non-recurring charges* (in %) -8.5 -11.5 EBIT -18.5 -62.7 Sales revenue increa
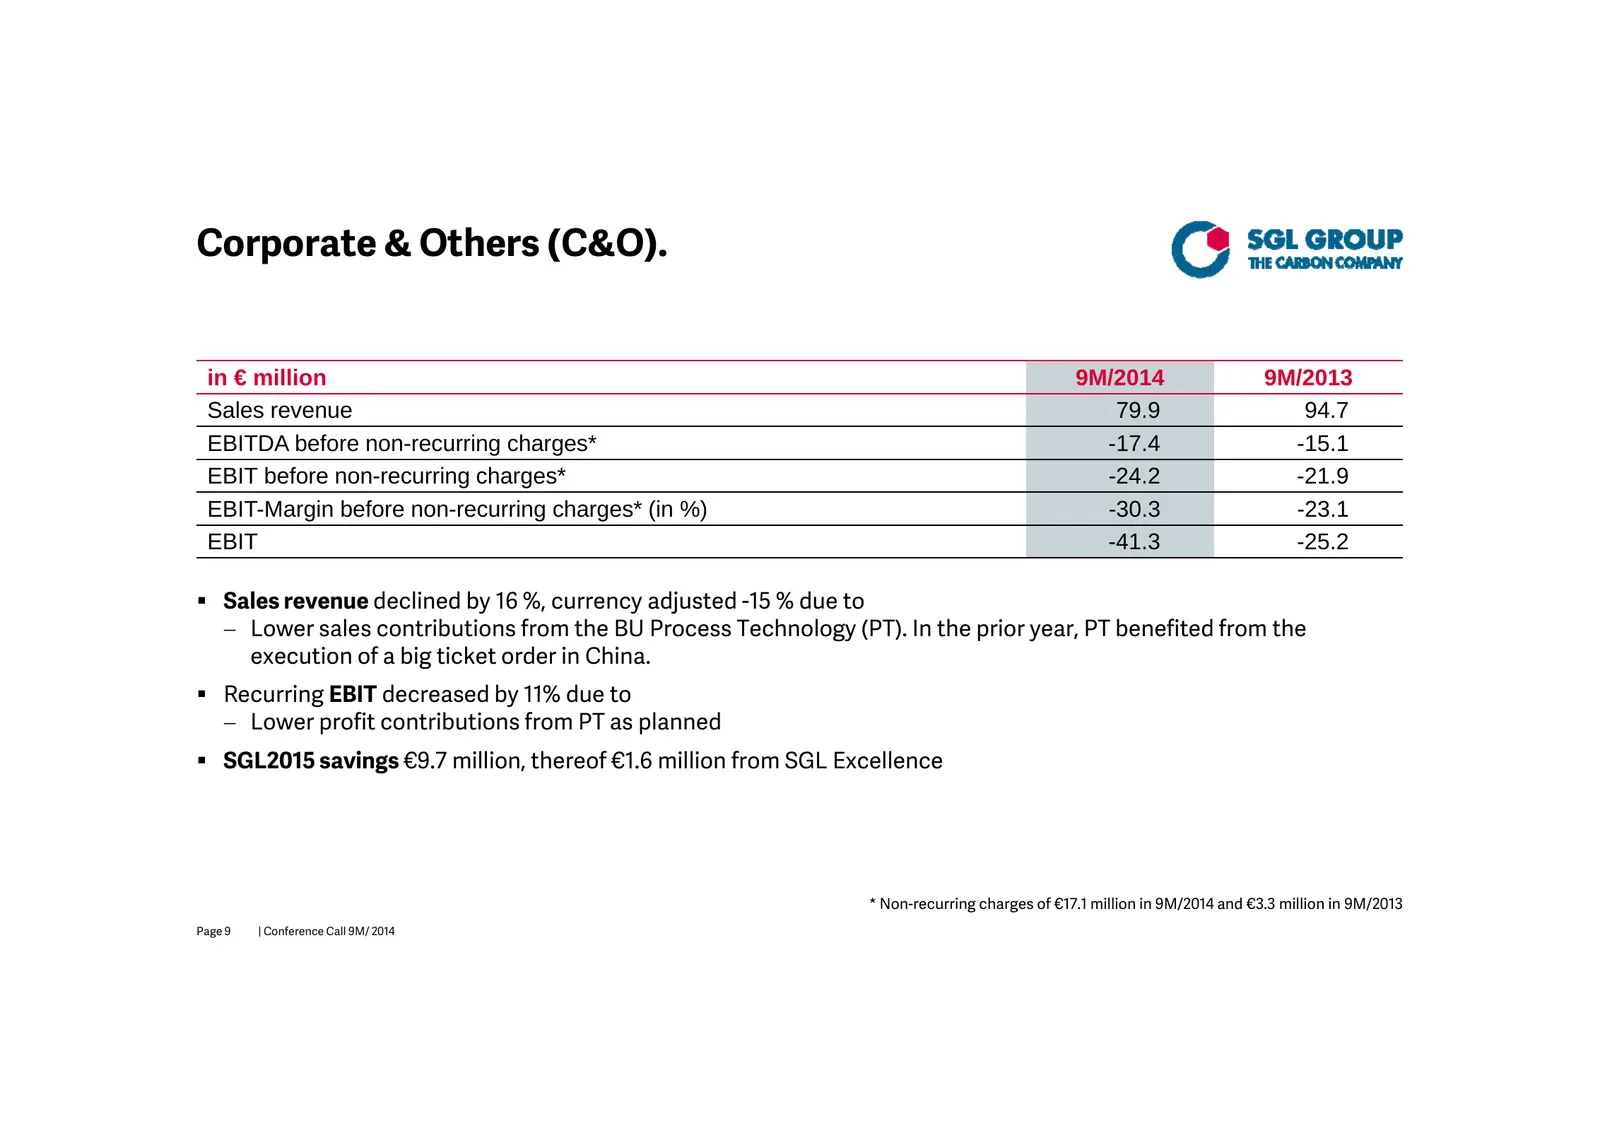
Slide 9: Corporate & Others (C&O)
Corporate & Others (C&O). in € million 9M/2014 9M/2013 Sales revenue 79.9 94.7 EBITDA before b f non-recurring i charges* h * -17.4 17 4 -15.1 15 1 EBIT before non-recurring charges* -24.2 -21.9 EBIT-Margin before non-recurring charges* (in %) -30.3 -23.1 EBIT -41.3 -25.2 Sales revenue declined by
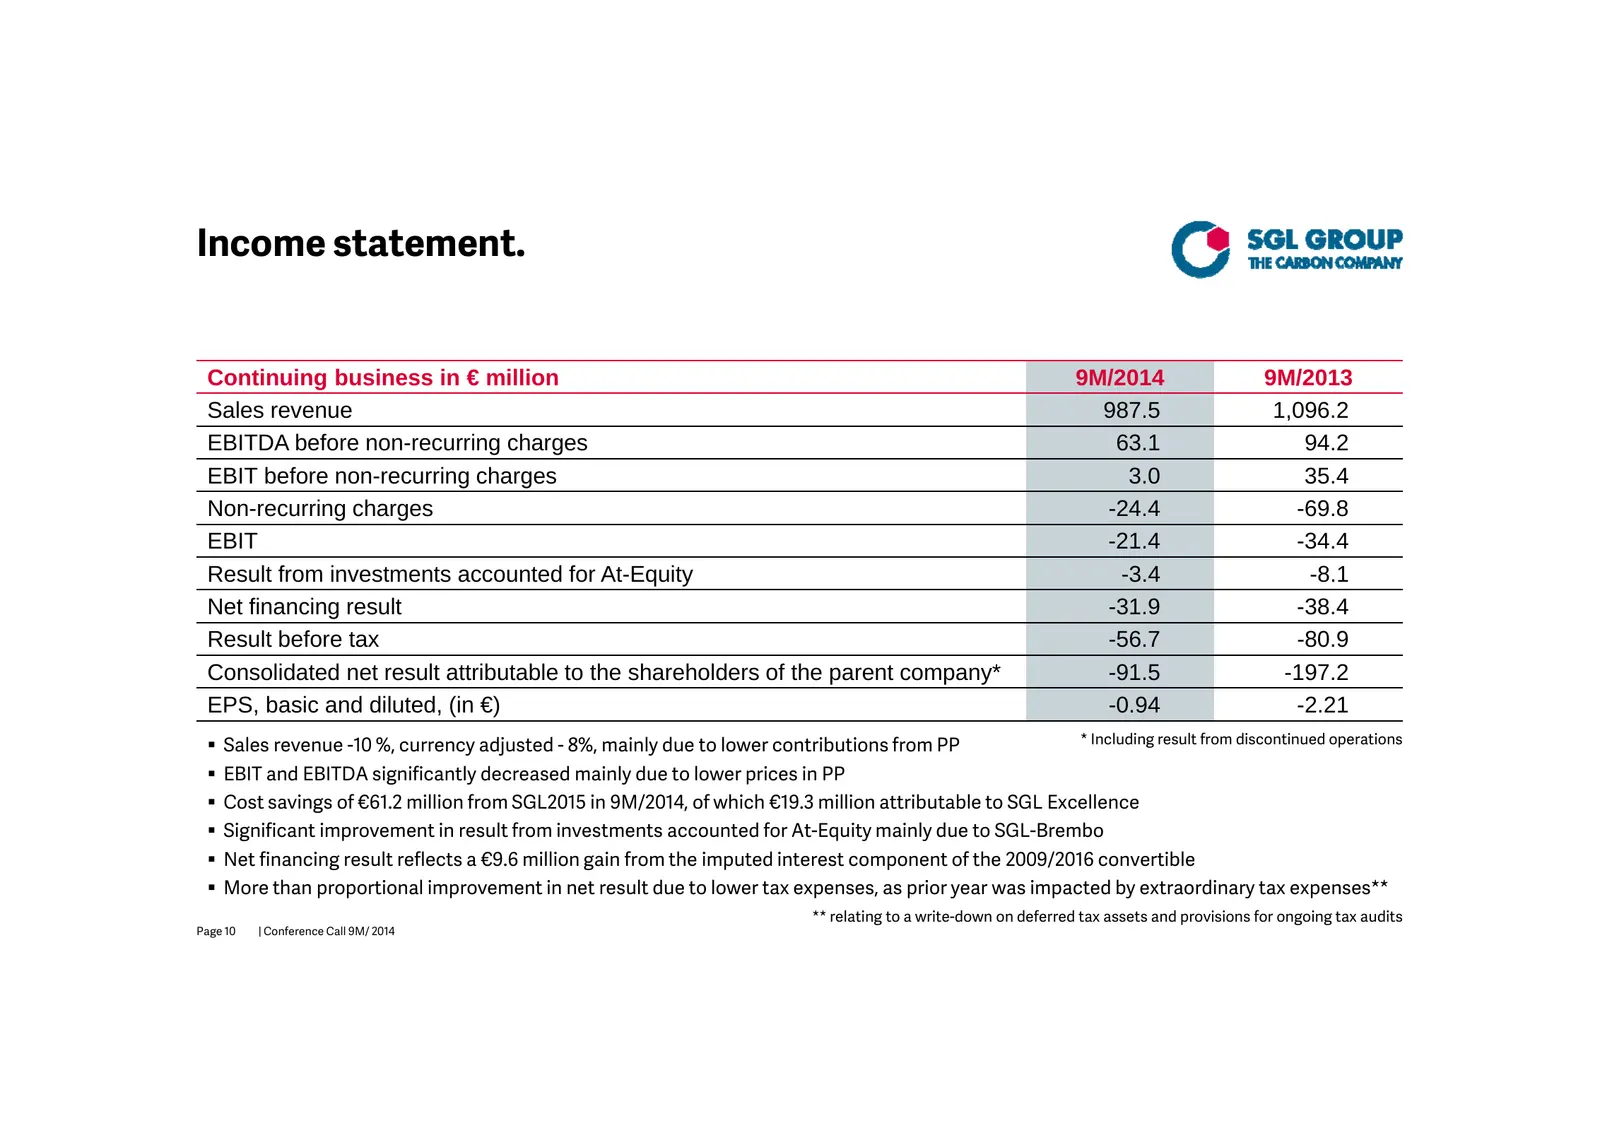
Slide 10: Income statement
Income statement. Continuing business in € million 9M/2014 9M/2013 Sales revenue 987.5 1,096.2 EBITDA before b f non-recurring i charges h 63 1 63.1 94 2 94.2 EBIT before non-recurring charges 3.0 35.4 Non-recurring charges -24.4 -69.8 EBIT -21.4 -34.4 Result from investments accounted for At-Equity
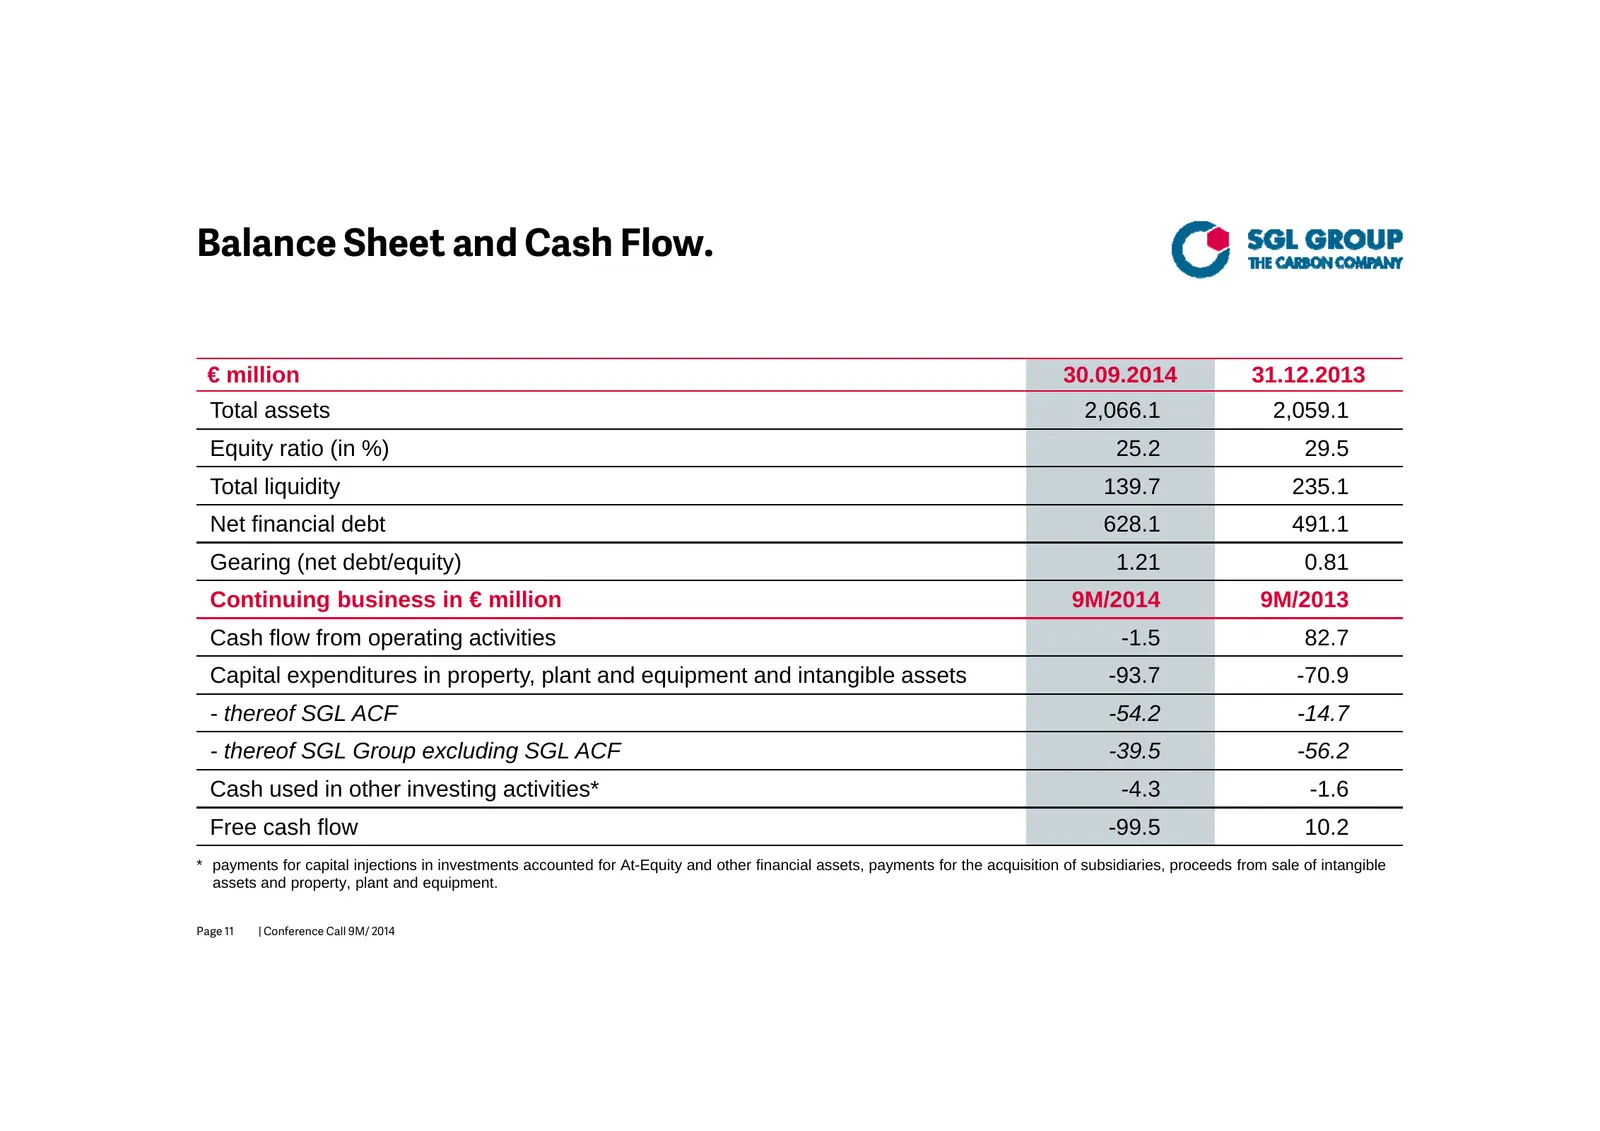
Slide 11: Balance Sheet and Cash Flow
Balance Sheet and Cash Flow. € million 30.09.2014 31.12.2013 Total assets 2,066.1 2,059.1 Equity ratio (in %) 25.2 29.5 Total liquidity 139.7 235.1 Net financial debt 628.1 491.1 Gearing (net debt/equity) 1 21 1.21 0 81 0.81 Continuing business in € million 9M/2014 9M/2013 Cash flow from operating a
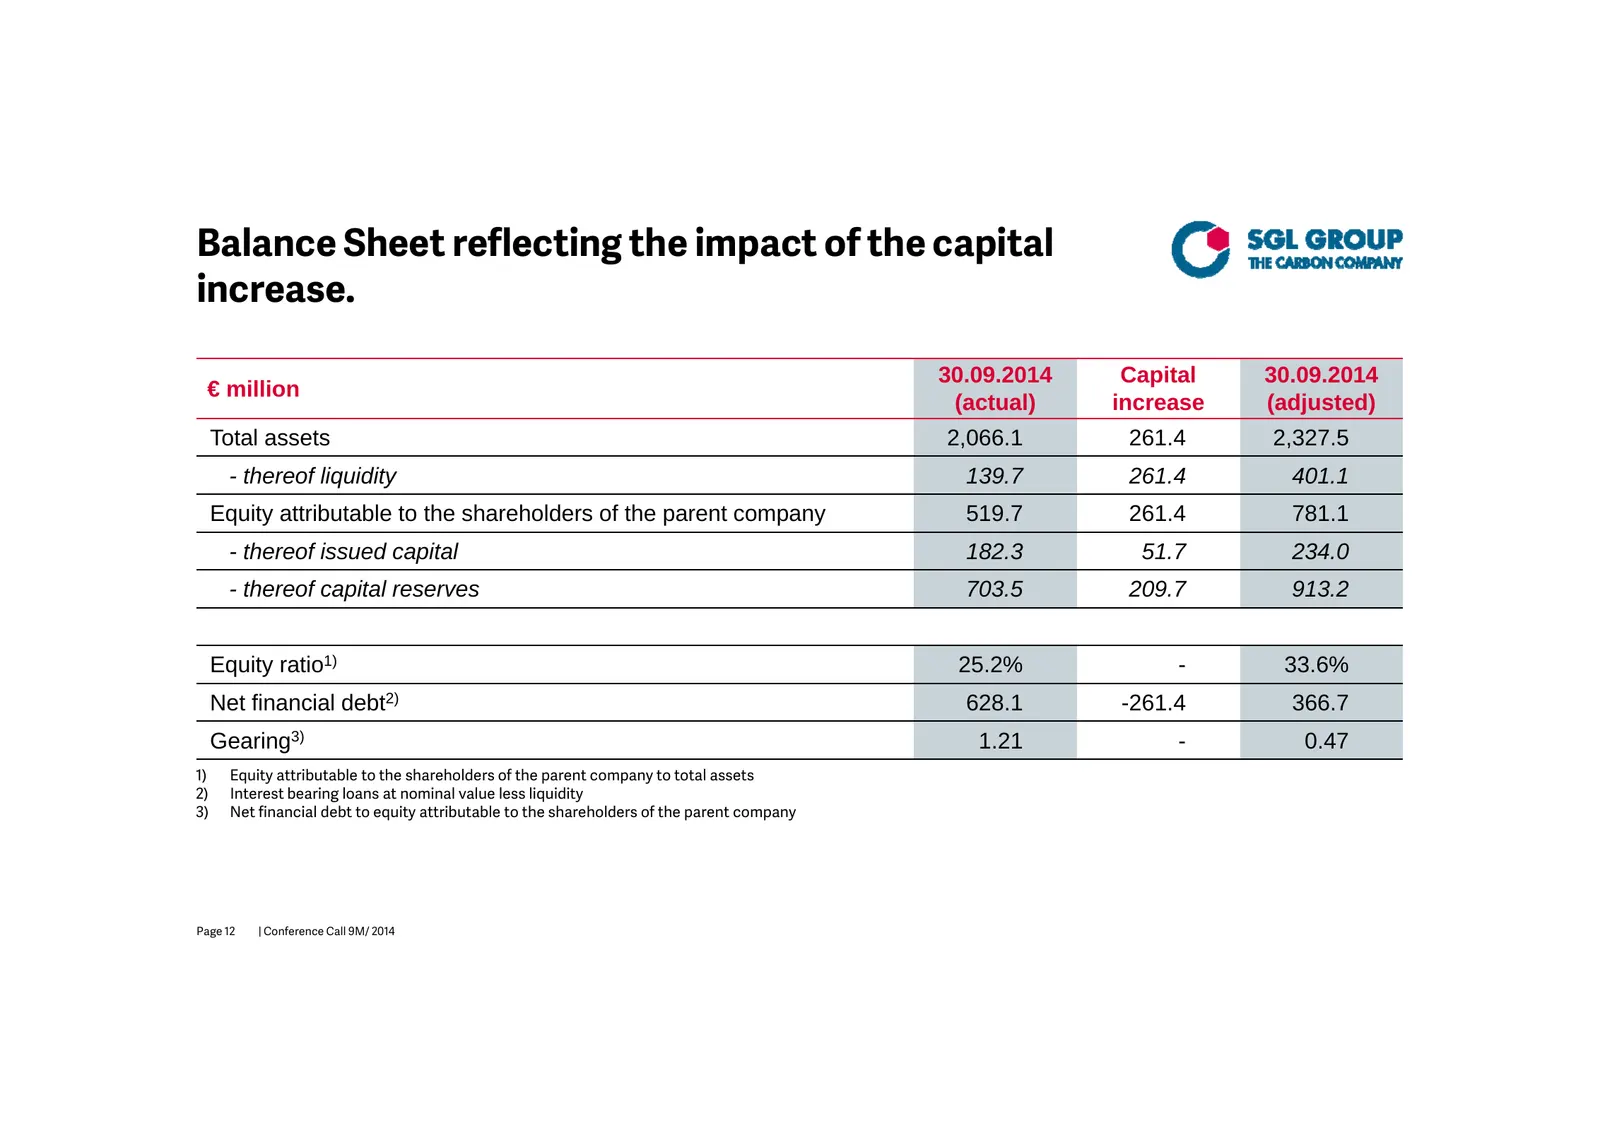
Slide 12: Balance Sheet reflecting the impact of the capital increase
Balance Sheet reflecting the impact of the capital increase. 30.09.2014 Capital 30.09.2014 € million (actual) increase (adjusted) Total assets 2 066 1 2,066.1 261 4 261.4 2 327 5 2,327.5 - thereof liquidity 139.7 261.4 401.1 Equity attributable to the shareholders of the parent company 519.7 261.4 7
Slide 13: Outlook
Outlook Dr. Jürgen g Köhler CEO Page 13 | Conference Call 9M/ 2014
Slide 14: Outlook 2014 – Reporting segments
Outlook 2014 – Reporting segments. Performance Products (PP): Significantly lower sales and EBIT compared to FY2013 expected due to lower graphite electrode prices. Prices stabilized on low levels Graphite Specialties (GS): Significant increase in sales and EBIT compared to FY2013 due to big tic
Slide 15: SGL Group – Full year guidance 2014 confirmed as announced in March 2014
SGL Group – Full year guidance 2014 confirmed as announced in March 2014. Mainly due to PP, full year Group Sales expected to decline compared to FY2013 similar to the decline after 9M/2014 Group G recurring i EBIT: EBIT anticipated ti i t d to t be b down d significantly i ifi tl compared d to
Slide 16: Thank you for your attention! Your questions, please
Thank you for your attention ! Your questions, please Page 16 | Analyst Conference March 2014
Slide 17: Important note
Important note This p presentation contains forward looking g statements based on the information currentlyy available to us and on our current projections and assumptions. By nature, forward looking statements are associated with known and unknown risks and uncertainties, as a consequence of which
Source: Internet Archive copy of sglgroup.com
More decks from SGL Carbon SE
 9M 2026 Earnings Presentation30 slides · Nov 5, 2026
 9M 2026 Earnings Presentation17 slides · Nov 5, 2026
 Q3 2024 Earnings Presentation28 slides · Nov 7, 2024
 H1 2024 Earnings Presentation18 slides · Aug 8, 2024
 Q1 2024 Earnings Presentation19 slides · May 8, 2024
 ESG Presentation (March 2024)7 slides · Mar 22, 2024