PRA Health Sciences — Merger or Acquisition (February 2021)
36 slides from PRA Health Sciences's merger presentation, Feb 24, 2021
Slide 1: Creating A World Leading Healthcare Intelligence and Clinical CRO
Creating A World Leading Healthcare Intelligence and Clinical CRO Transaction Announcement February 24", 2021
Slide 2: Forward-Looking Statements
Forwar oking Stateme:
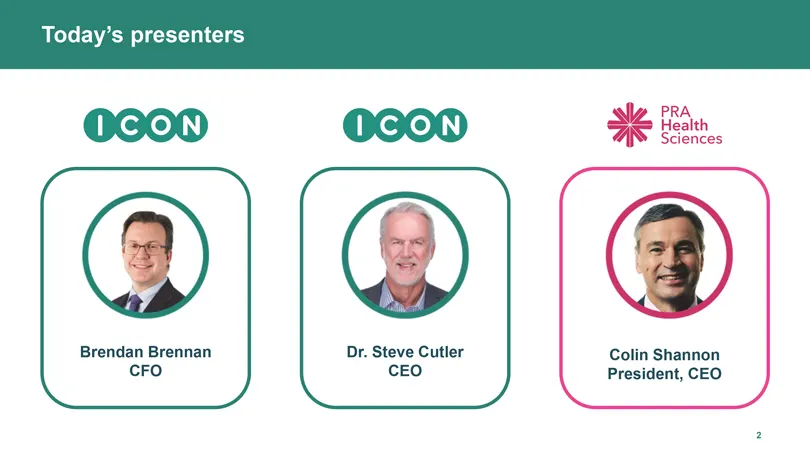
Slide 3: Today's presenters
Today’s presenters Dr. Steve Cutler CEO Brendan Brennan CFO Colin Shannon President, CEO
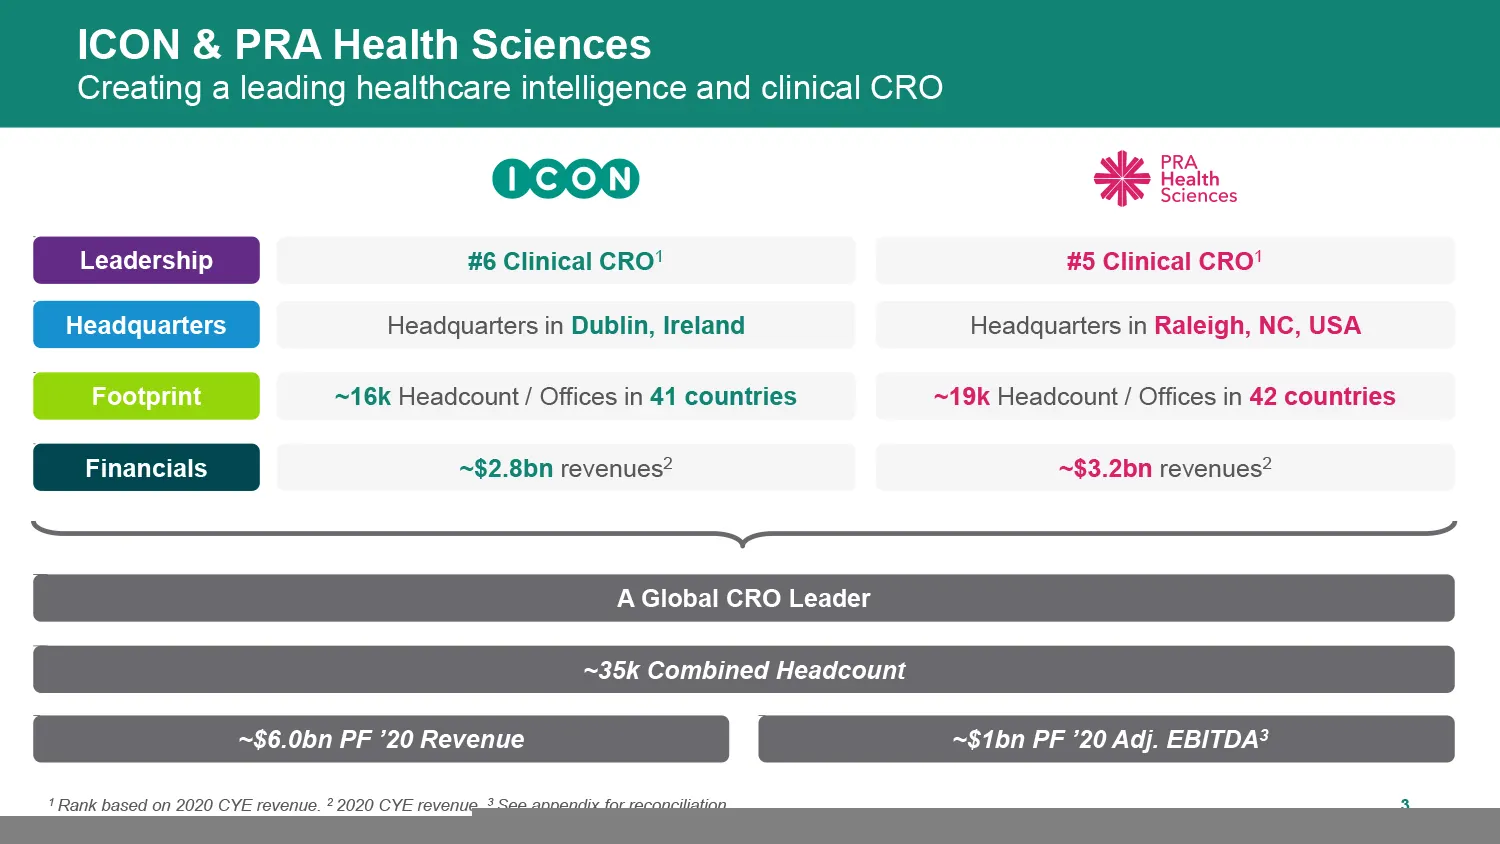
Slide 4: ICON & PRA Health Sciences
ICON & PRA Health Sciences Creating a leading healthcare intelligence and clinical CRO 0600 #6 Clinical CRO' Headquarters in Dublin, Ireland Headquarters in ~16k Headcount / Offices in 41 countries Headcount / Offices in ~$2.8bn revenues? revenues? A Global CRO Leader ~35k Combined Headcount ~$6.0bn
Slide 5: Together, we are stronger
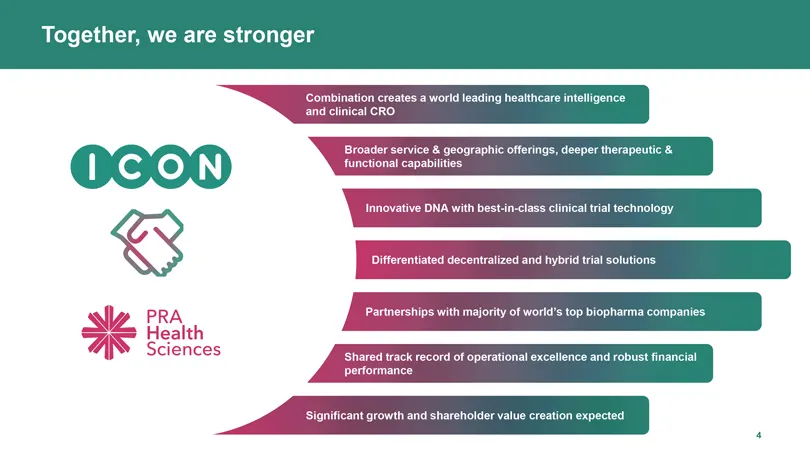
Together, we are stronger Combination creates a world leading healthcare intelligence and clinical CRO service & geographic offerings, deeper therapeutic & nctional capabilities, tive DNA with best-in-class clinical trial technology 8 centralized and hybrid trial solutions. ps with majority of world
Slide 6: Significant growth and shareholder value creation expected
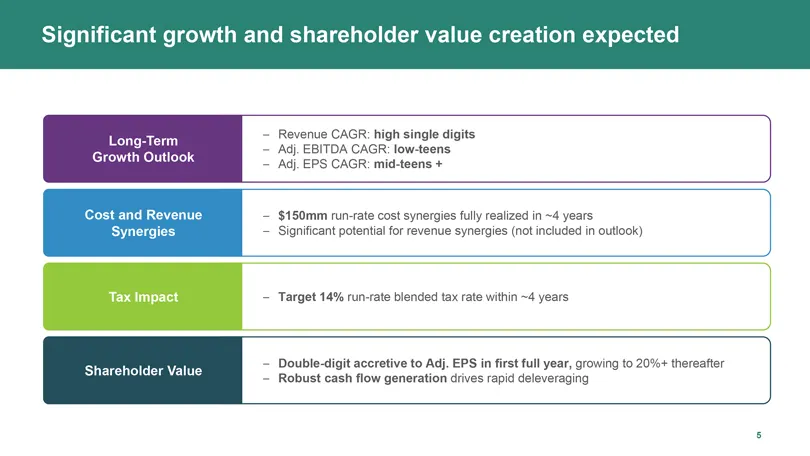
Significant growth and shareholder value creation expected Long-Term Growth Outlook Cost and Revenue Synergies Shareholder Value Revenue CAGR: high single digits ‘Adj. EBITDA CAGR: low-teens ‘Adj EPS CAGR: mid-teens + $150mm run-rate cost synergies fully realized in ~4 years Significant potential fo
Slide 7: Transaction summary
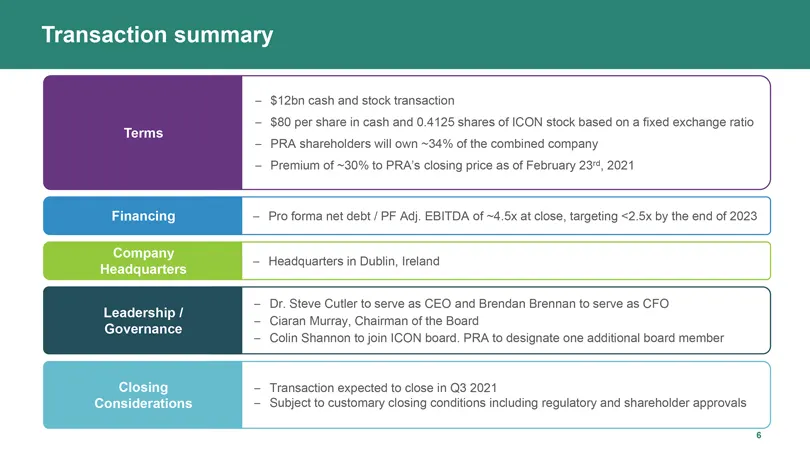
Transaction summary Leadership / Governance $12bn cash and stock transaction ‘$80 per share in cash and 0.4125 shares of ICON stock based on a fixed exchange ratio PRA shareholders will own ~34% of the combined company Premium of ~30% to PRA’s closing price as of February 23°, 2021 Pro forma net deb

Slide 8: Investment highlights
Investment highlights
Slide 9: As healthcare markets change, customer needs are evolving
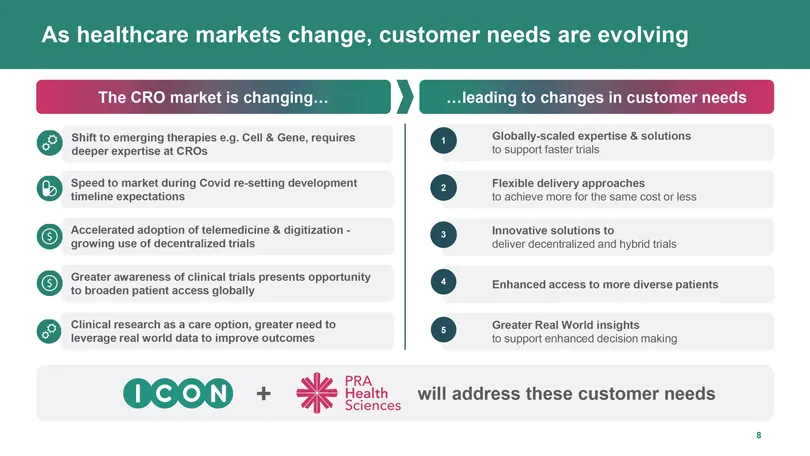
As healthcare markets change, customer needs are evolving RO market is cl Shift to emerging therapies e.g. Cell & Gene, requires deeper expertise at CROs Speed to market during Covid re-setting development timeline expectations ‘Accelerated adoption of telemedicine & digitization - ‘growing use of d
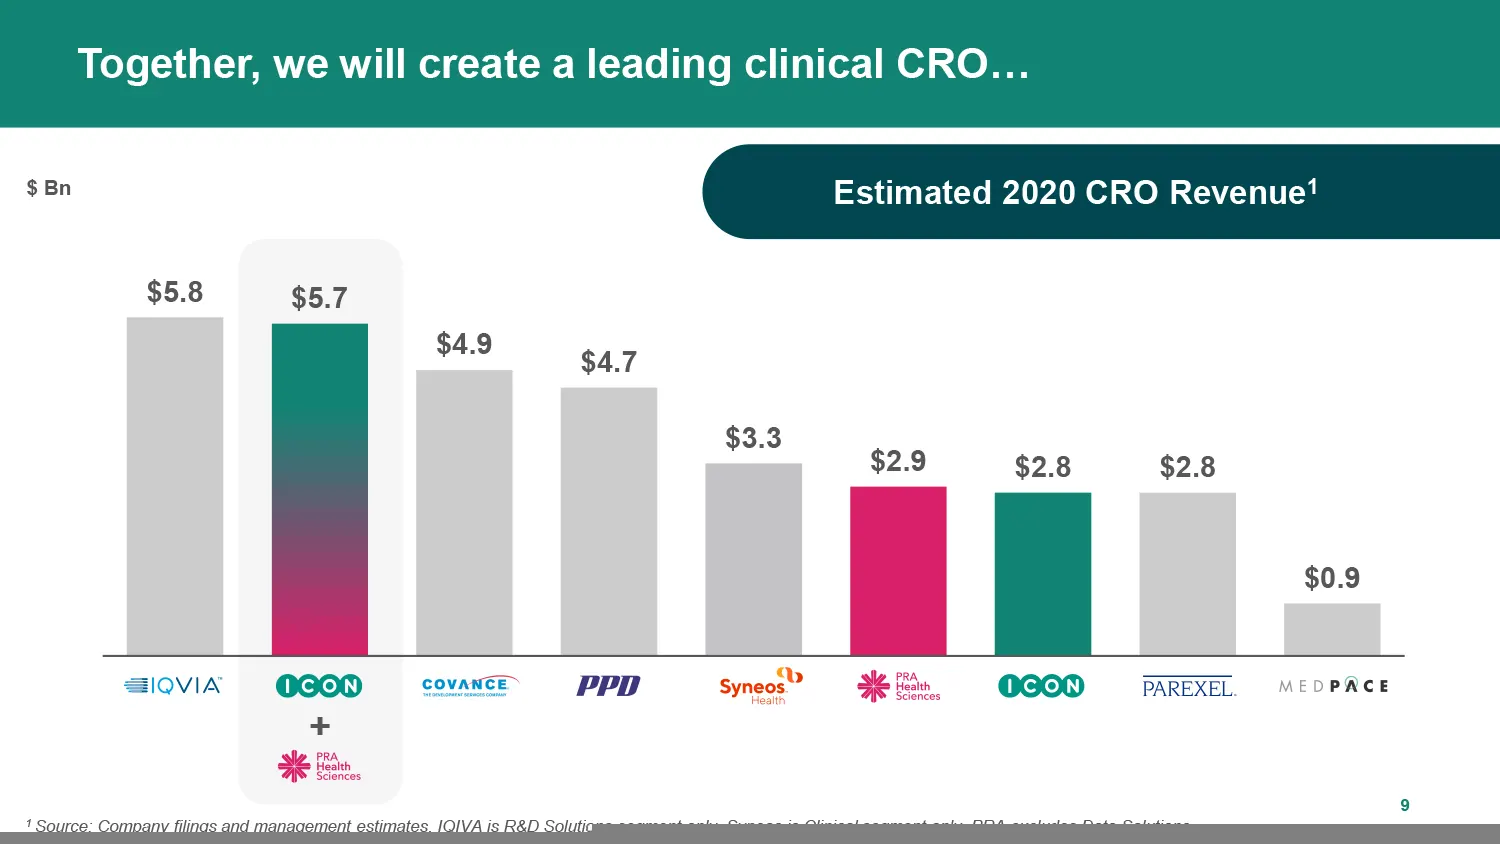
Slide 10: Together, we will create a leading clinical CRO
Together, we will create a leading clinical CRO... $Bn Estimated 2020 CRO Revenue’ $5.8 $5.7 $4.90 $4.7 $3.3 $2.9 $2.8 $2.8 $0.9 OAL | CO.N] PPD CLC ON) PAREXEL PACE
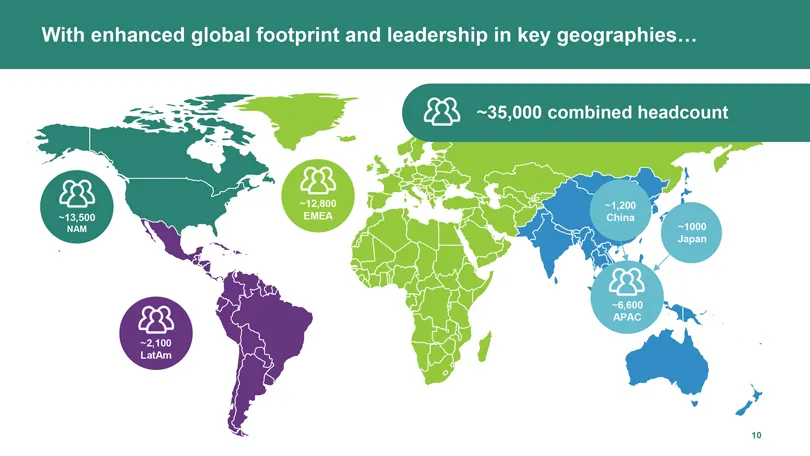
Slide 11: With enhanced global footprint and leadership in key geographies
With enhanced global footprint and leadership in key geographies.
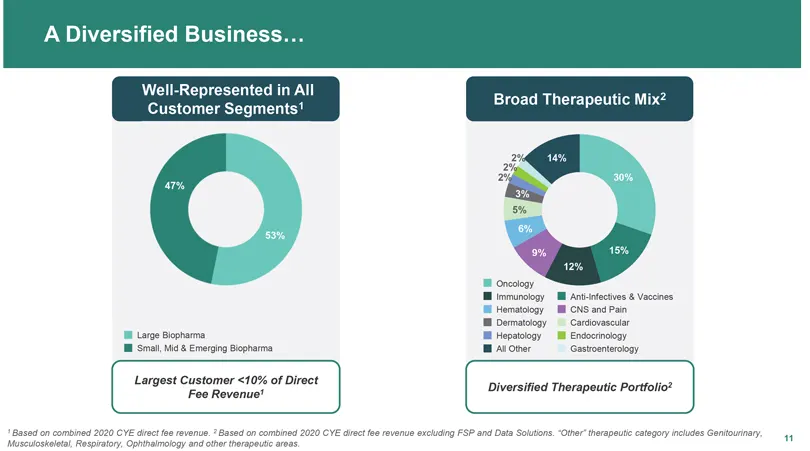
Slide 12: A Diversified Business
A Diversified Business... Well-Represented in All 5 Customer Segments? ee le A 7BN % 4 Cardiovascular Lage Blopharma Hepatology Bl Endocrinology I Smal, Mid & Emerging pharma MAlone:——Gastoenteoogy Largest Customer <10% of Direct peig abe Diversified Therapeutic Portfolio? Based on combined 2020 CYE
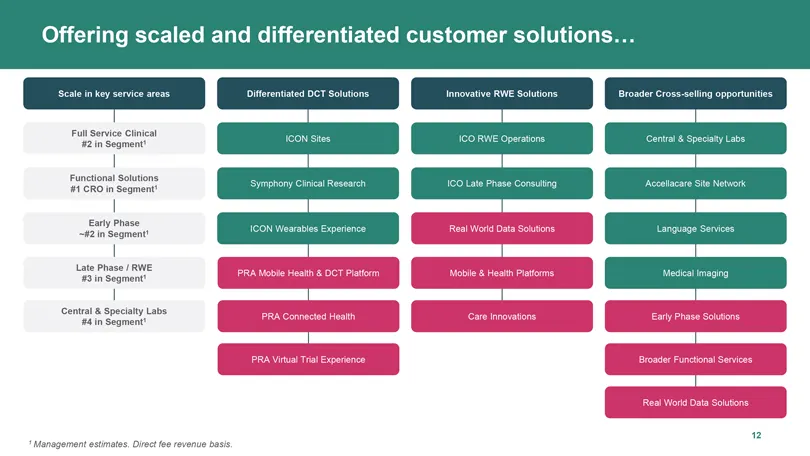
Slide 13: Segment leadership
12 in Segment #1.¢RO in Segment Late Phase / RWE #3 in Sogment 14 in Segment Innovative RIVE Solutions Broader Cross-seling opportunites ICON Stes ICO RWE Operas ICON Weara Language Services
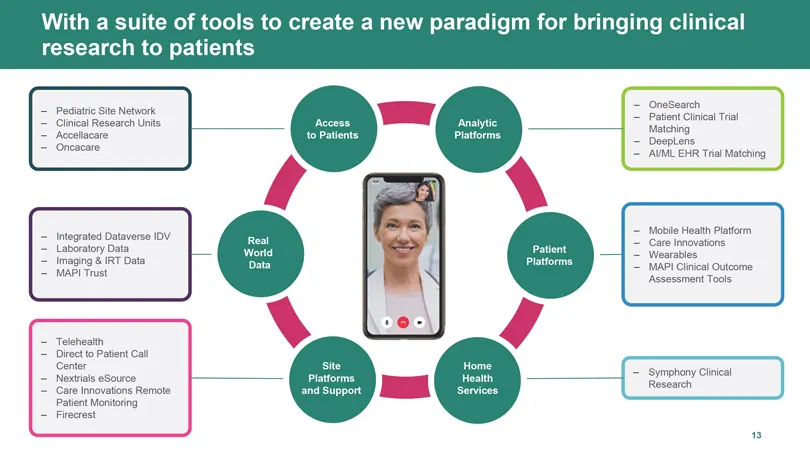
Slide 14: With a suite of tools to create a new paradigm for bringing clinical research to patients
With a suite of tools to create a new paradigm for bringing clinical research to patients sie newen ‘OneSearch Pediatric Site Network Patient Clinical Trial Matching DeepLens = AUML EHR Trial Matching Recess to Patients le Heath Patform Real Innovations Worta ables Data IAP Cinical Outcome site Plat

Slide 15: Financial highlights
Financial highlights
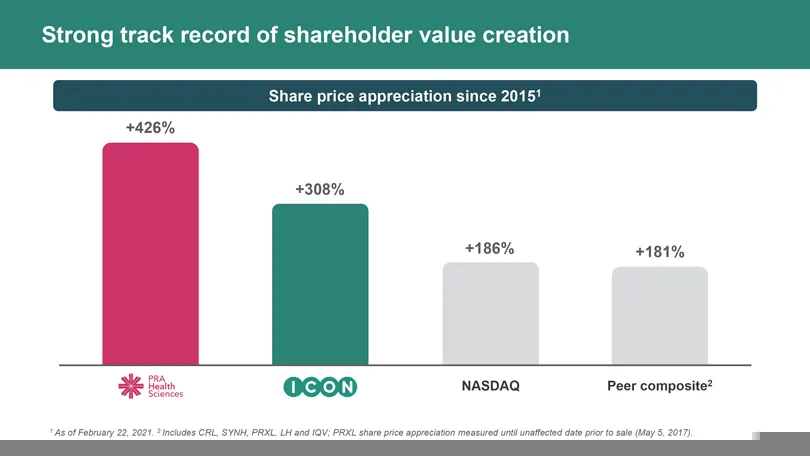
Slide 16: Strong track record of shareholder value creation
Strong track record of shareholder value creation since 2015! +426% +308% +186% +184% NASDAQ Peer composite?
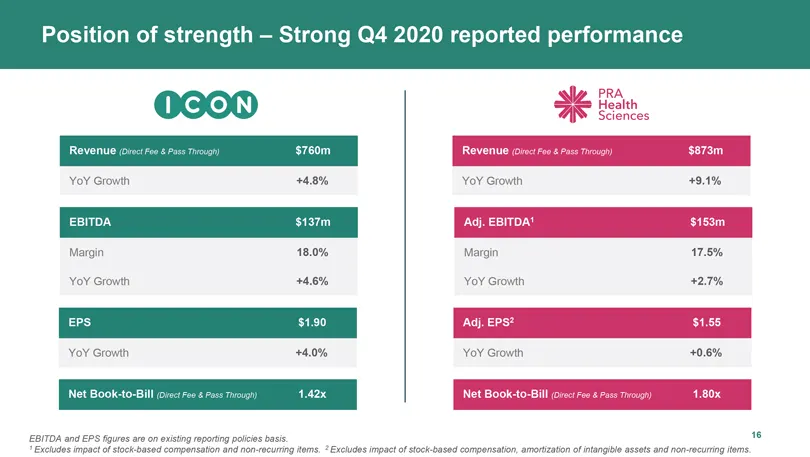
Slide 17: Position of strength — Strong Q4 2020 reported performance
Position of strength — Strong Q4 2020 reported performance Revenue $760m YoY Growth 49.1% Margi 17.5% YoY Growth 42.7% YoY Growth +0.6%
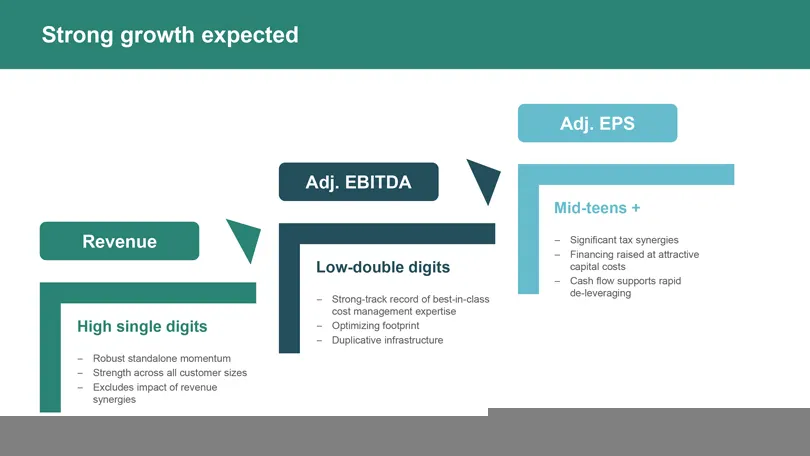
Slide 18: Strong growth expected
Strong growth expected Revenue Y High single digits = Robust standalone momentum ~ Strength across all customer sizes ~ Excludes impact of revenue synergies Adj. EBITDA v = Strong-track record of bestin-class ost management expertise = Optimizing footprint = Duplicative infrastructure Significant ta
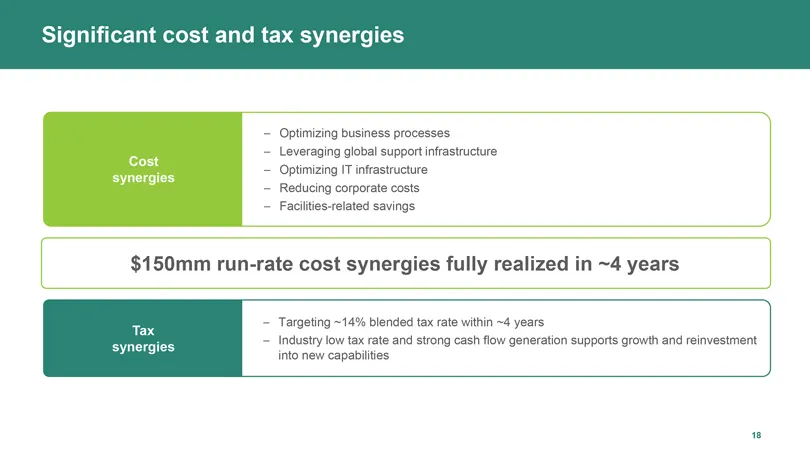
Slide 19: Significant cost and tax synergies
icant cost and tax synergies = Optimizing business processes = Leveraging global support infrastructure = Optimizing IT infrastructure ~ Reducing corporate costs ~ Facilities-related savings $150mm run-rate cost synergies fully realized in ~4 years = Targeting ~14% blended tax rate within ~4 years ~
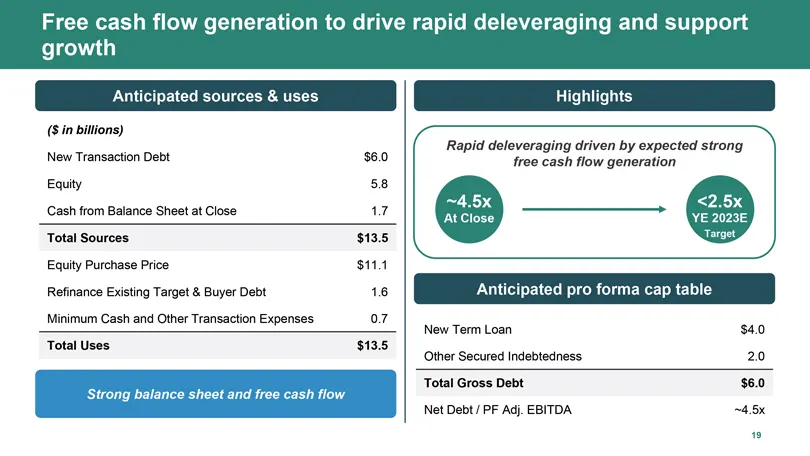
Slide 20: Free cash flow generation to drive rapid deleveraging and support growth
Free cash flow generation to drive rapid deleveraging and support growth Total Sources: $13.5 Total Uses $13.5 Rapid deleveraging driven by expected strong free cash flow generation o—_ @ Anticipated pro forma cap table New Term Loan $4.0 Other Secured Indebtedness. 2.0 Total Gross Debt $6.0 Net Deb
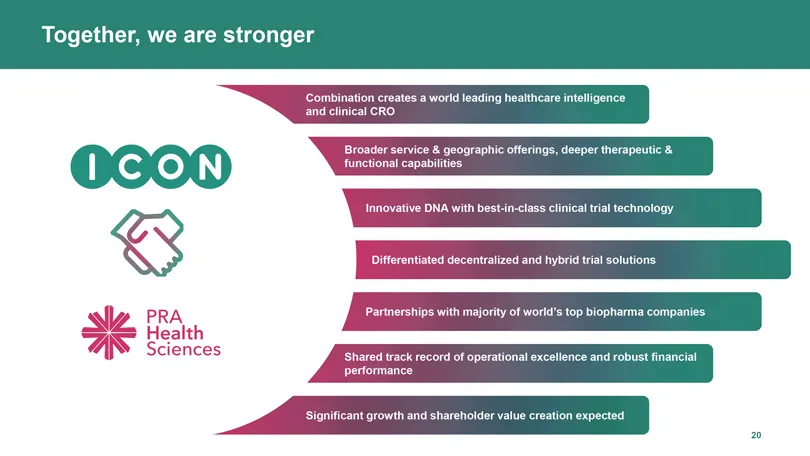
Slide 21: Together, we are stronger
Together, we are stronger Combination creates a world leading healthcare intelligence and clinical CRO service & geographic offerings, deeper therapeutic & nctional capabilities, tive DNA with best-in-class clinical trial technology 8 centralized and hybrid trial solutions. ps with majority of world
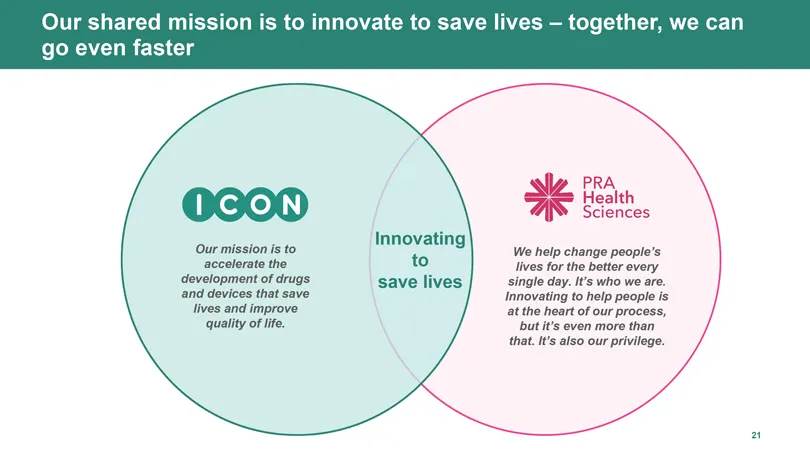
Slide 22: Our shared mission is to innovate to save lives — together, we can go even faster
Our shared mission is to innovate to save lives — together, we can go even faster PRA Health Sciences We help change people's OCOD Our mission is to Inpeveting ‘accelerate the to lives for the better every development of drugs save lives single day. It's who we are. and devices that save Innovating

Slide 23: Appendix
Appendix
Slide 24: 2020 CYE Reconciliation of Pro Forma Financials
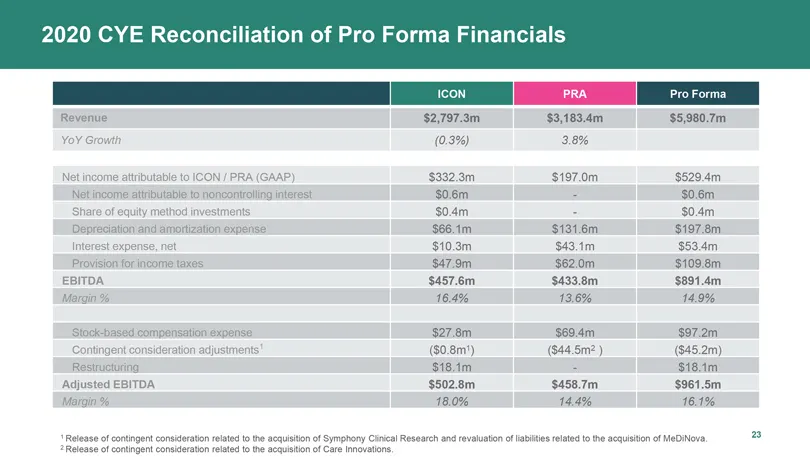
2020 CYE Reconciliation of Pro Forma Financials Revenue $2,797.3m $3,183.4m $5,980.7m YoY Growth (0.3%) 3.8% Net income attributable to ICON / PRA (GAAP) $3323m $197.0m $529.4m Net income attributable to noncontroliing interest $0.6m. - $0.6m Share of equity method investments 0.4m - 0.4m Depreciati

Slide 25: ICON Q4 & FY 2020
ICON Q4 & FY 2020
Slide 26: Backlog metrics
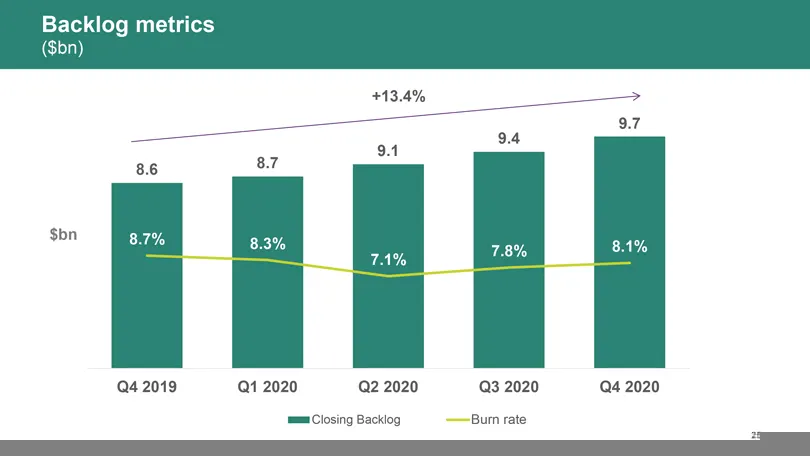
Backlog metrics ($bn) ame 87% 8.3% 78% 8.1% 7.1% Q4 2019 Q1 2020 Q2 2020 Q3 2020 Q4 2020 mm Closing Backlog Burn rate
Slide 27: Revenue: quarterly & annual
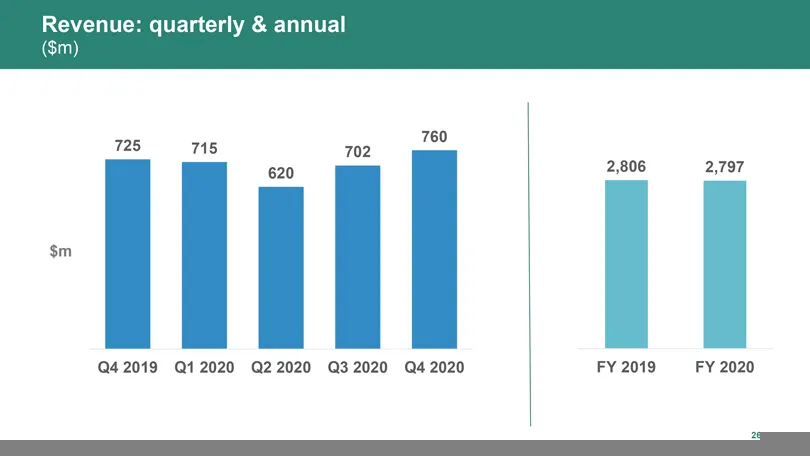
Revenue: quarterly & annual ($m) 725 15 702 760 _ 2,806 2,797 $m Q42019 Q1 2020 Q22020 Q3 2020 Q4 2020 FY 2019 FY 2020 err,
Slide 28: Gross margin: quarterly and annual
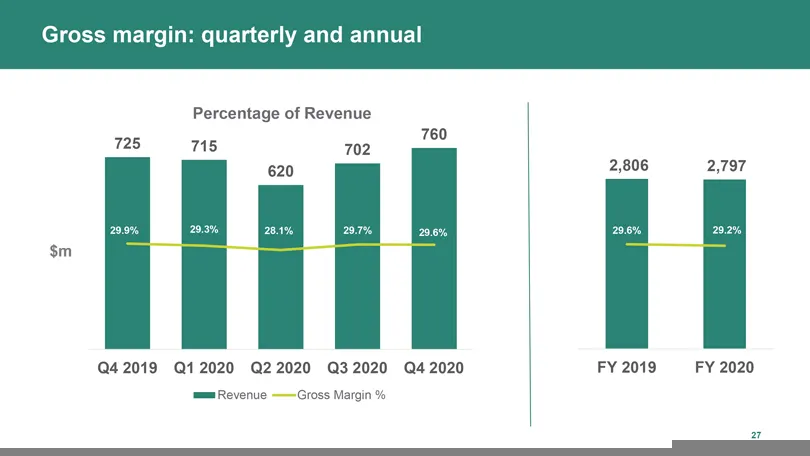
Gross margin: quarterly and annual Percentage of Revenue 725 715 702 620 $m i J Q42019 Q12020 Q22020 Q32020 a4 2020 mm Revenue —Gross Margin % 760 2,806 2,797 FY 2019 FY 2020
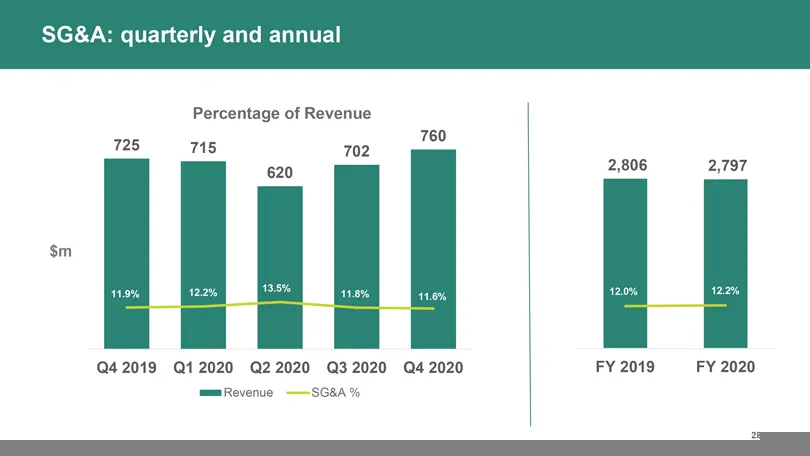
Slide 29: SG&A: quarterly and annual
SG&A: quarterly and annual Percentage of Revenue 760 725 715 702 620 ee 118% 11.08% Q42019 Q12020 Q22020 Q32020 a4 2020 mmRevenue. —SG&A% 2,806 2,797 120% FY 2019 FY 2020 errr,
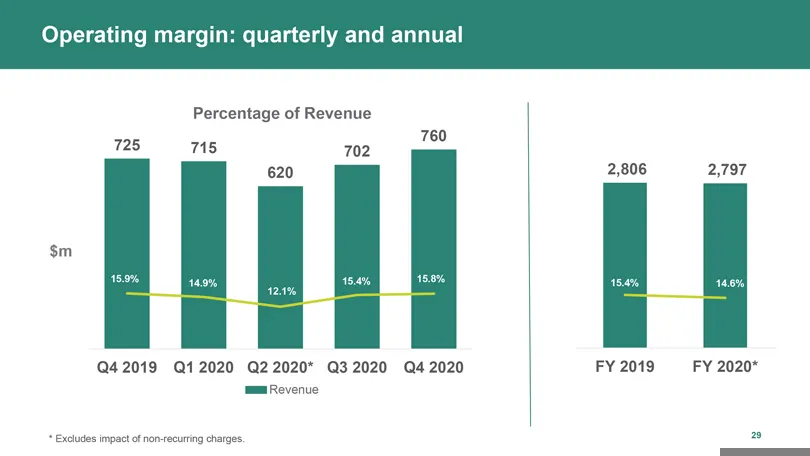
Slide 30: Operating margin: quarterly and annual
Operating margin: quarterly and annual Percentage of Revenue 725 715 702 620 $m 15.9% 154% 121% 760 Q4 2019 Q1 2020 Q22020* Q3 2020 Q42020 mm Revenue Excludes impact of nonrecurring charges, 2,806 2,797 15.4% FY 2019 FY 2020*
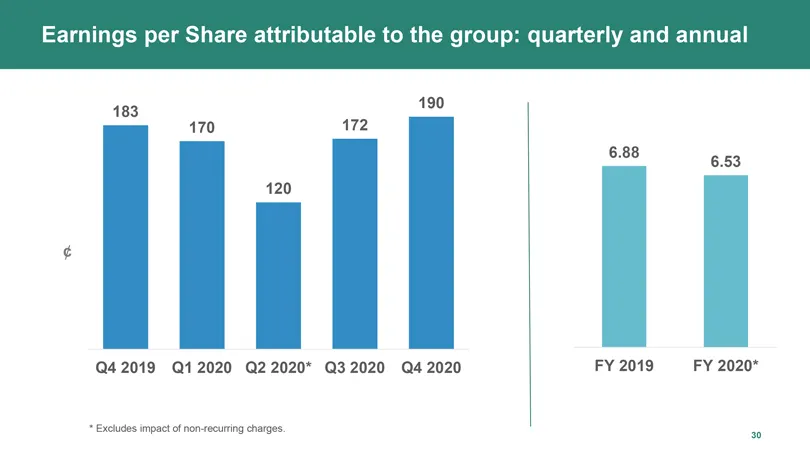
Slide 31: Earnings per Share attributable to the group: quarterly and annual
Earnings per Share attributable to the group: quarterly and annual 183 190 4170 172 6.88 6.53 120 Q42019 Q12020 Q22020* Q32020 a4 2020 FY 2019 FY 2020* * Excludes impact of non-recurring charges. so
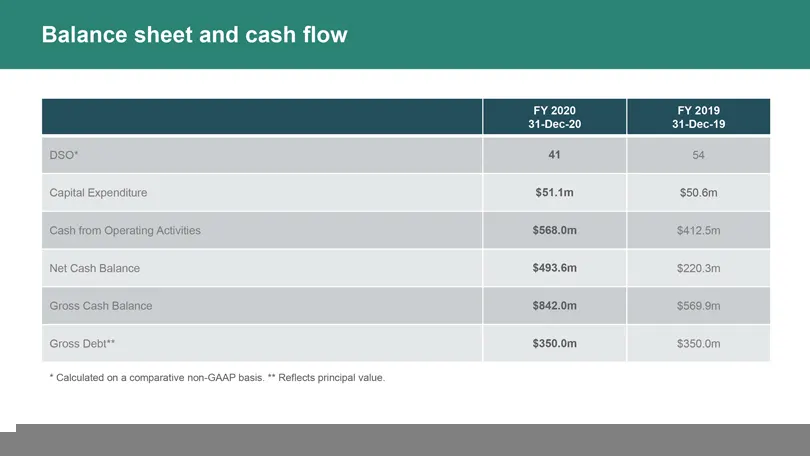
Slide 32: Balance sheet and cash flow
Balance sheet and cash flow FY 2020 FY 2019 31-Dec-20 31-Dec-19 Dso" re 54 Capital Expenitur $51.1m $50,6m Cash from Operating Activities $568.0m $4125m ssh Balanc $493.6m Gross Cash Balance $842.0m Gross Debt $350.0m $350.0m Calculated on a comparative non-GAAP basis. * Reflects principal value.
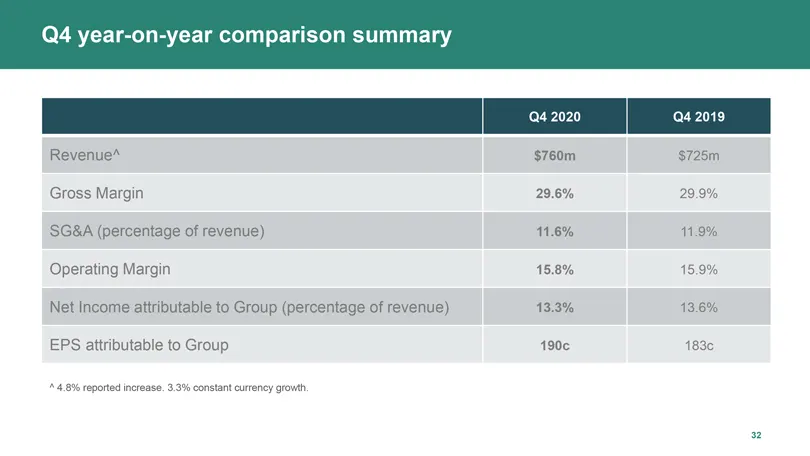
Slide 33: Q4 year-on-year comparison summary
Q4 year-on-year comparison summary Revenue* $760m $725m Gross Margin 29.6% 29.9% SG&A (percentage of revenue) 11.6% 11.9% Operating Margin 15.8% 15.9% Net Income attributable to Group (percentage of revenue) 13.3% 13.6% EPS attributable to Group 190¢ 183¢ * 4.8% reported increase. 3.3% constant curr
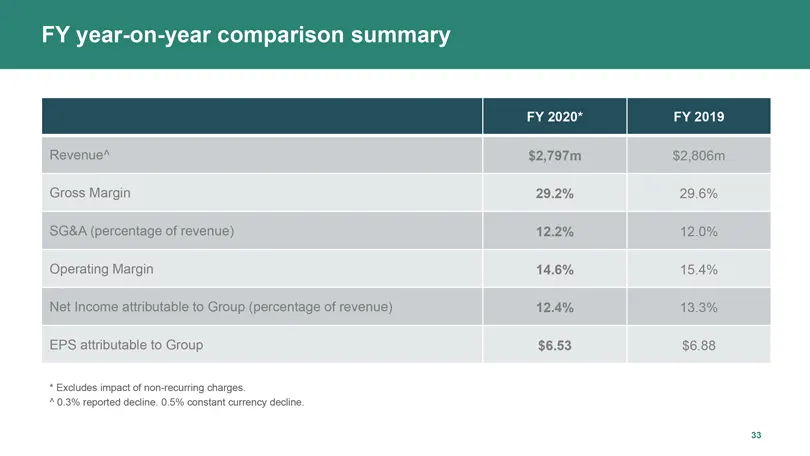
Slide 34: FY year-on-year comparison summary
FY year-on-year comparison summary Revenue’ $2,797m $2,806m Gross Margin 29.2% 29.6% SG8A (percentage of revenue) 12.2% 12.0% Operating Margin 14.6% 15.4% Net Income attributable to Group (percentage of revenue) 12.4% 13.3% EPS attributable to Group $6.53 $6.88 * Excludes impact of non securing char
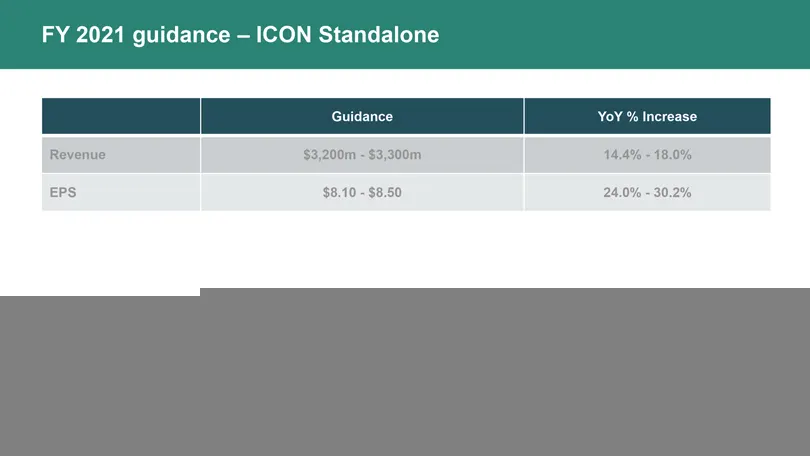
Slide 35: FY 2021 guidance — ICON Standalone
FY 2021 guidance — ICON Standalone P| cance | ative rears Revenue $3,200m - $3,300m 14.4% - 18.0% EPS $8.10 - $8.50 24.0% - 30.2%
Slide 36: iconplc.com
iconplc.com mn @re
Source: SEC EDGAR · 425 filed Feb 24, 2021
More decks from PRA Health Sciences Inc
 Merger or Acquisition (February 2021)13 slides · Feb 26, 2021
 Merger or Acquisition (February 2021)13 slides · Feb 24, 2021
 Q4 2016 Earnings Presentation17 slides · Feb 22, 2017
 Q3 2016 Earnings Presentation17 slides · Nov 2, 2016
 Q2 2016 Earnings Presentation16 slides · Jul 28, 2016
 Q1 2016 Earnings Presentation16 slides · Apr 27, 2016