BASE, Inc. · TSE:4477
BASE — Q3 2026 Earnings Presentation
37 slides from BASE's earnings presentation, Nov 5, 2026
Slide 1: Q3 FY2026 Materials for Financial Results Presentation
Q3 of Fiscal Year Ending December 31, 2026 Materials for Financial Results Presentation BASE, Inc. (Tokyo Stock Exchange Growth: 4477) November 5, 2026
Slide 2: Table of Contents
Table of Contents 1. Company Overview 2. Executive Summary 3. Results for Q3 of the Fiscal Year Ending December 31, 2026 4. Reference Materials 2

Slide 3: 1. Company Overview
1. Company Overview
Slide 4: Mission
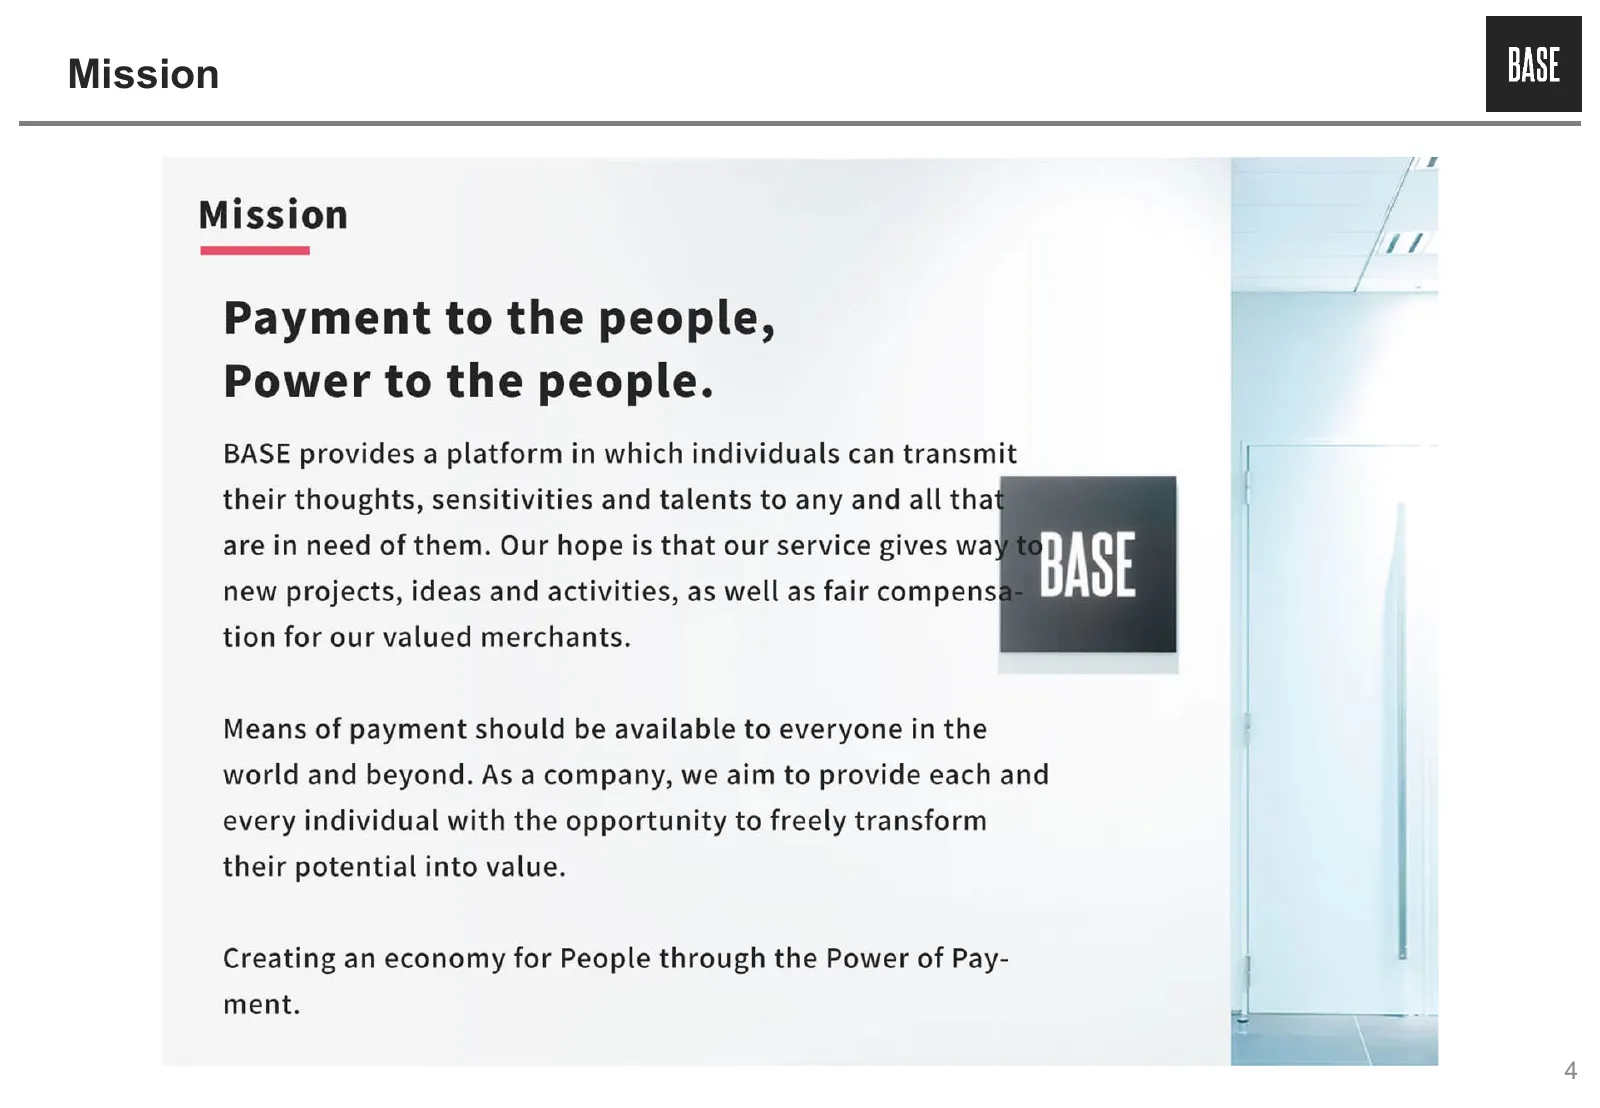
Mission Mission Payment to the people, Power to the people. BASE provides a platform in which individuals can transmit | their thoughts, sensitivities and talents to any and all tha are in need of them. Our hope is that our service gives wa BASE new projects, ideas and activities, as well as fair co
Slide 5: Service Outline
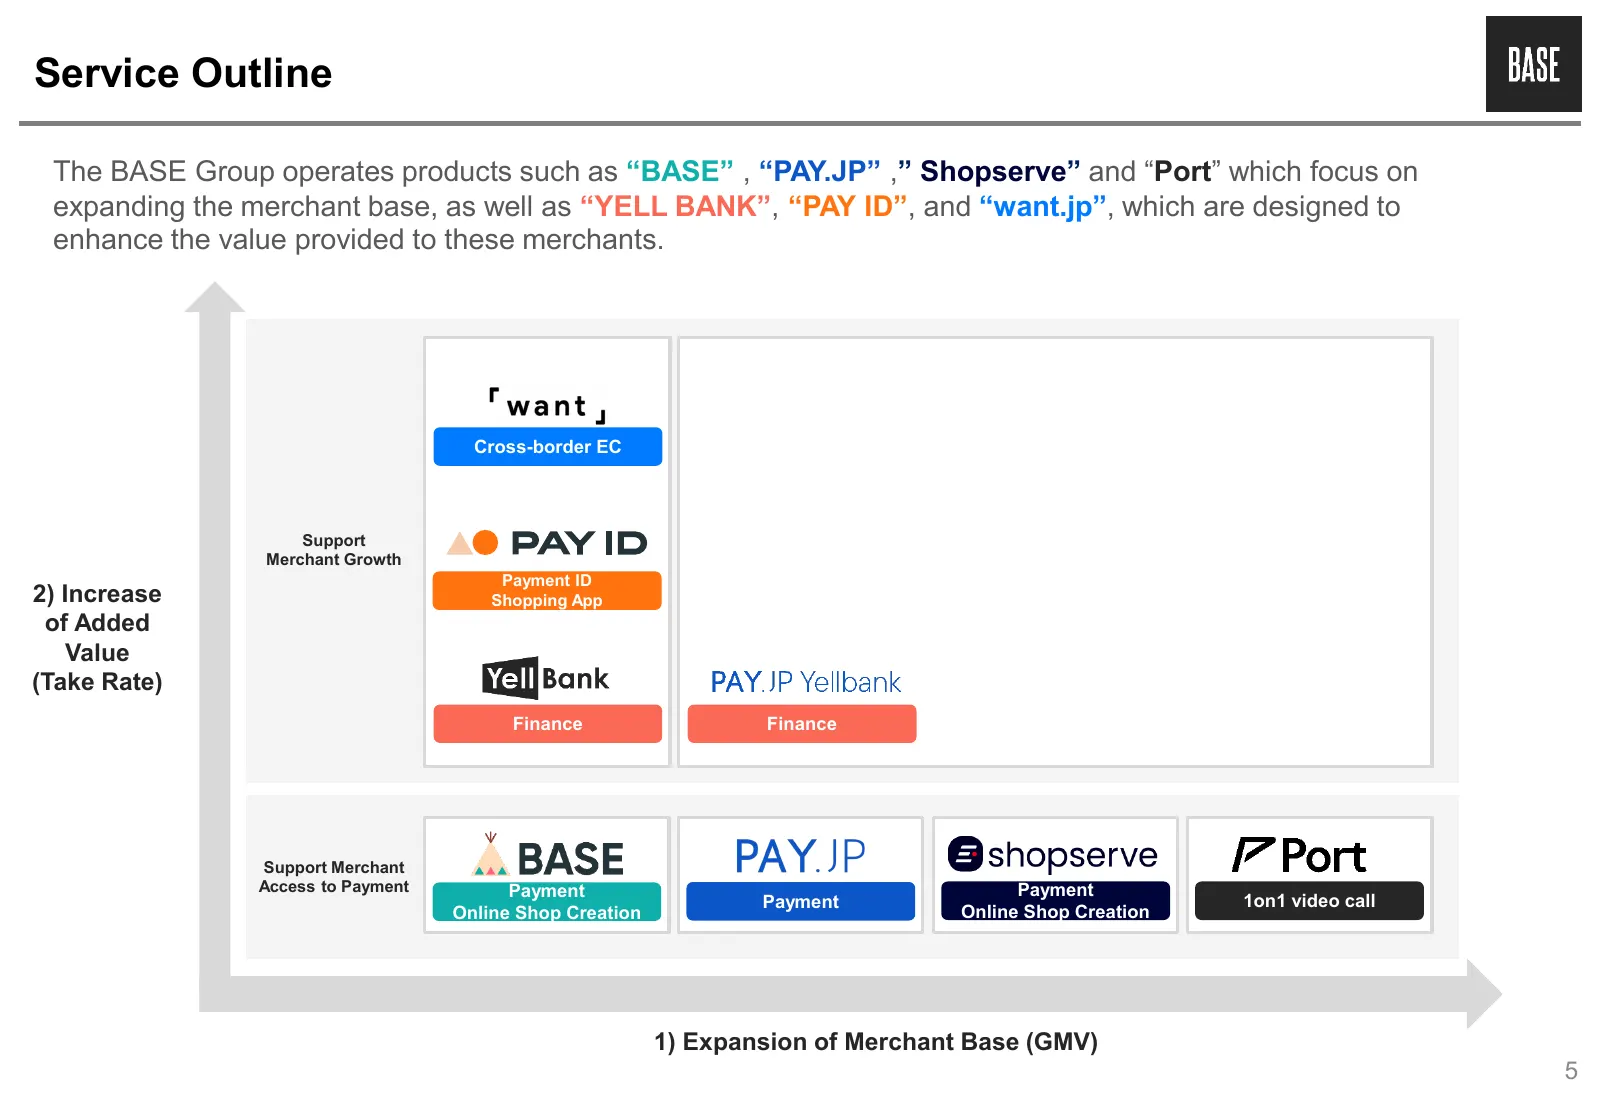
Service Outline The BASE Group operates products such as “BASE” , “PAY.JP” ,” Shopserve” and “Port” which focus on expanding the merchant base, as well as “YELL BANK”, “PAY ID”, and “want.jp”, which are designed to enhance the value provided to these merchants. Cross-border EC Support Merchant Growt
Slide 6: 2. Executive Summary
2. Executive Summary
Slide 7: Executive Summary
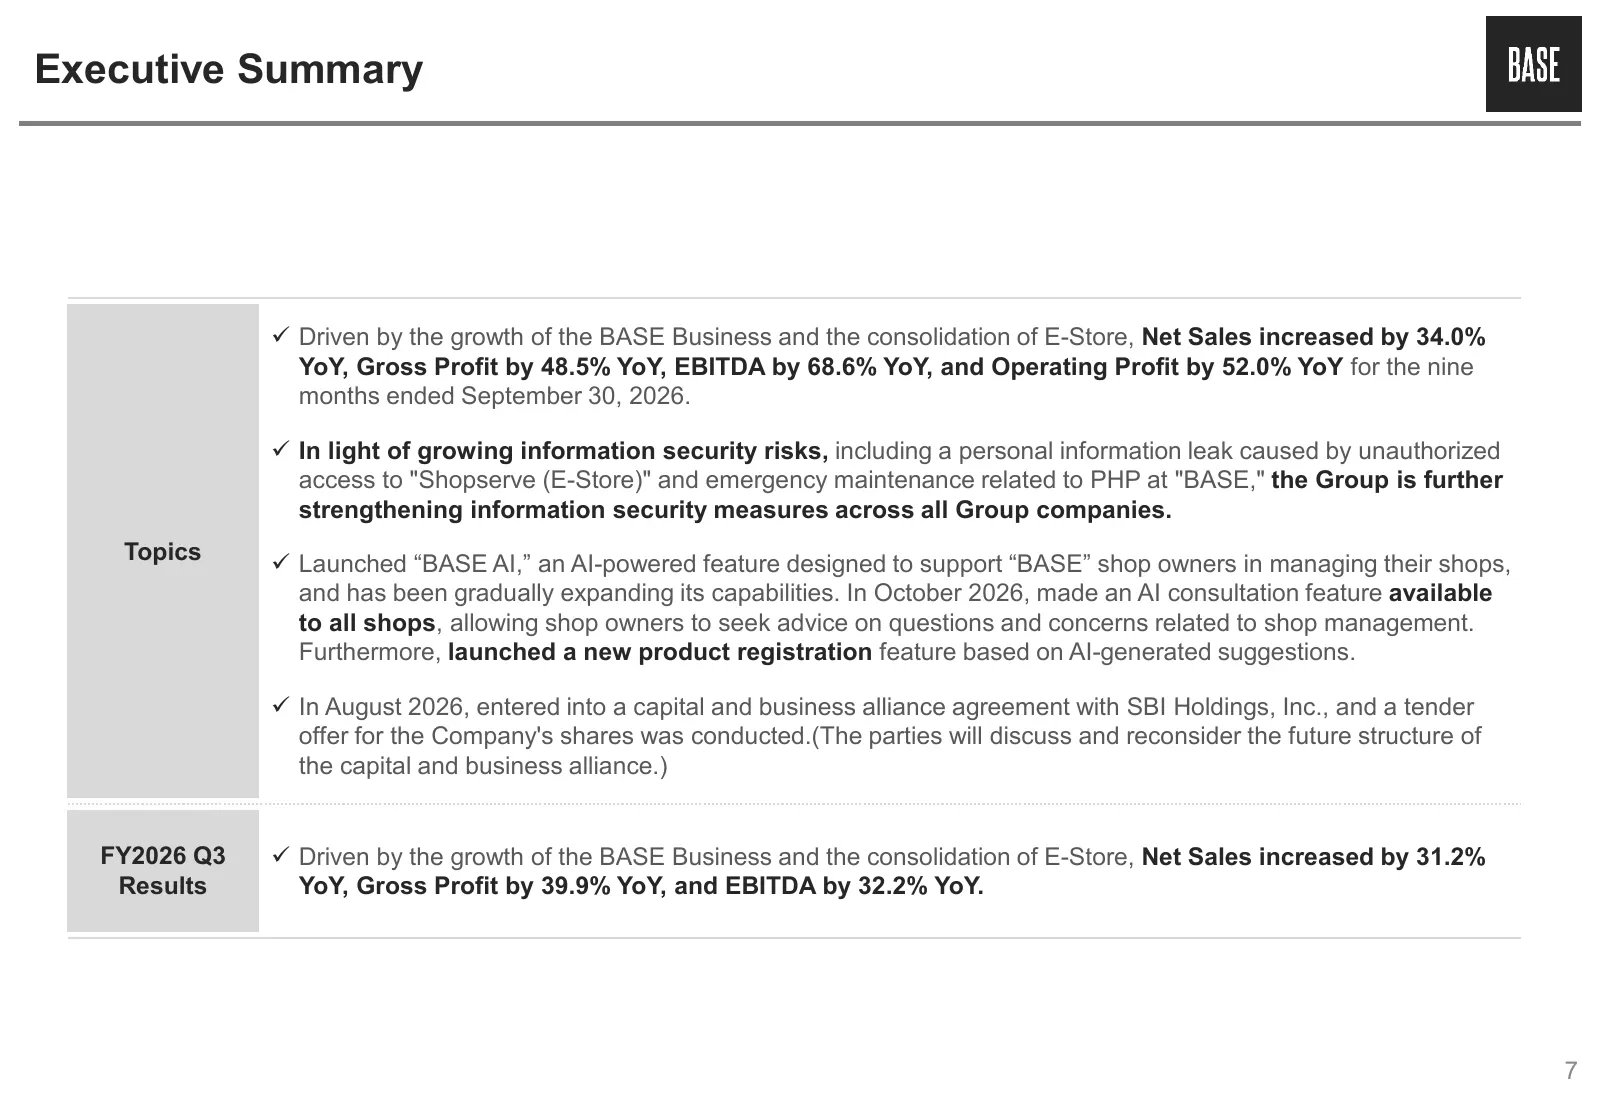
Executive Summary Driven by the growth of the BASE Business and the consolidation of E-Store, Net Sales increased by 34.0% YoY, Gross Profit by 48.5% YoY, EBITDA by 68.6% YoY, and Operating Profit by 52.0% YoY for the nine months ended September 30, 2026. In light of growing information security
Slide 8: Policies for FY2026 and Progress
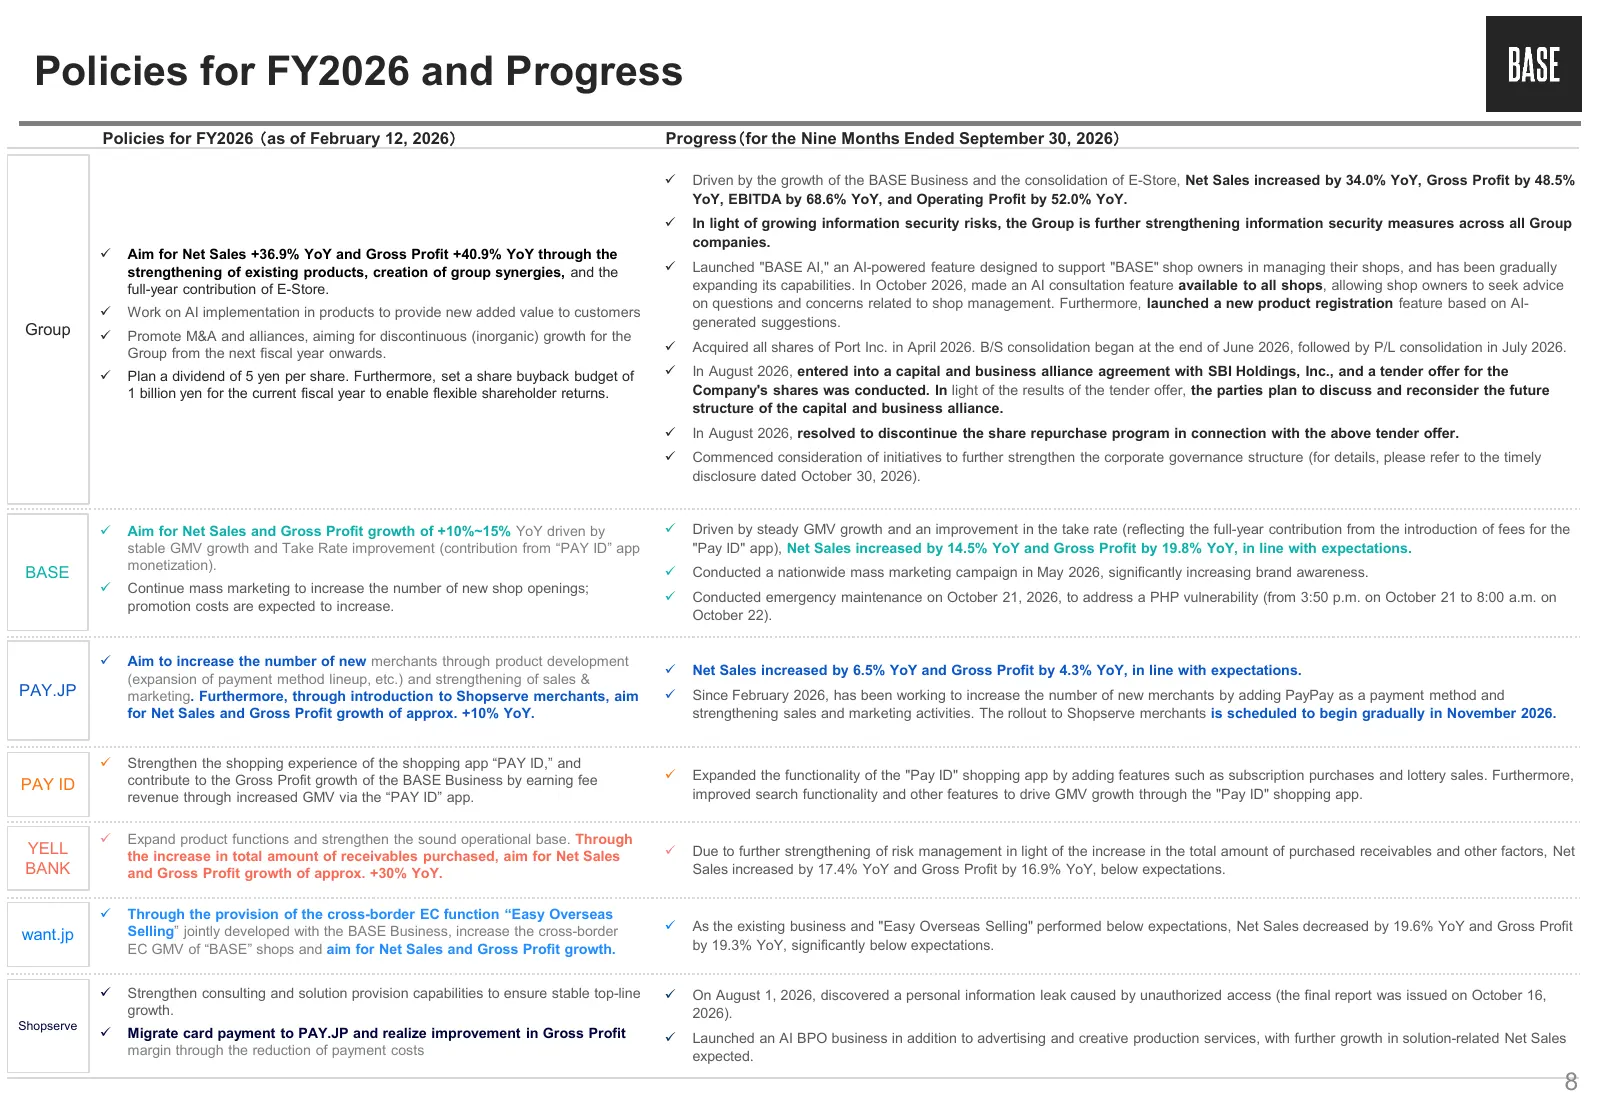
Policies for FY2026 and Progress Policies for FY2026 (as of February 12, 2026) Progress(for the Nine Months Ended September 30, 2026) Driven by the growth of the BASE Business and the consolidation of E-Store, Net Sales increased by 34.0% YoY, Gross Profit by 48.5% YoY, EBITDA by 68.6% YoY, and Op
Slide 9: The Group Growth
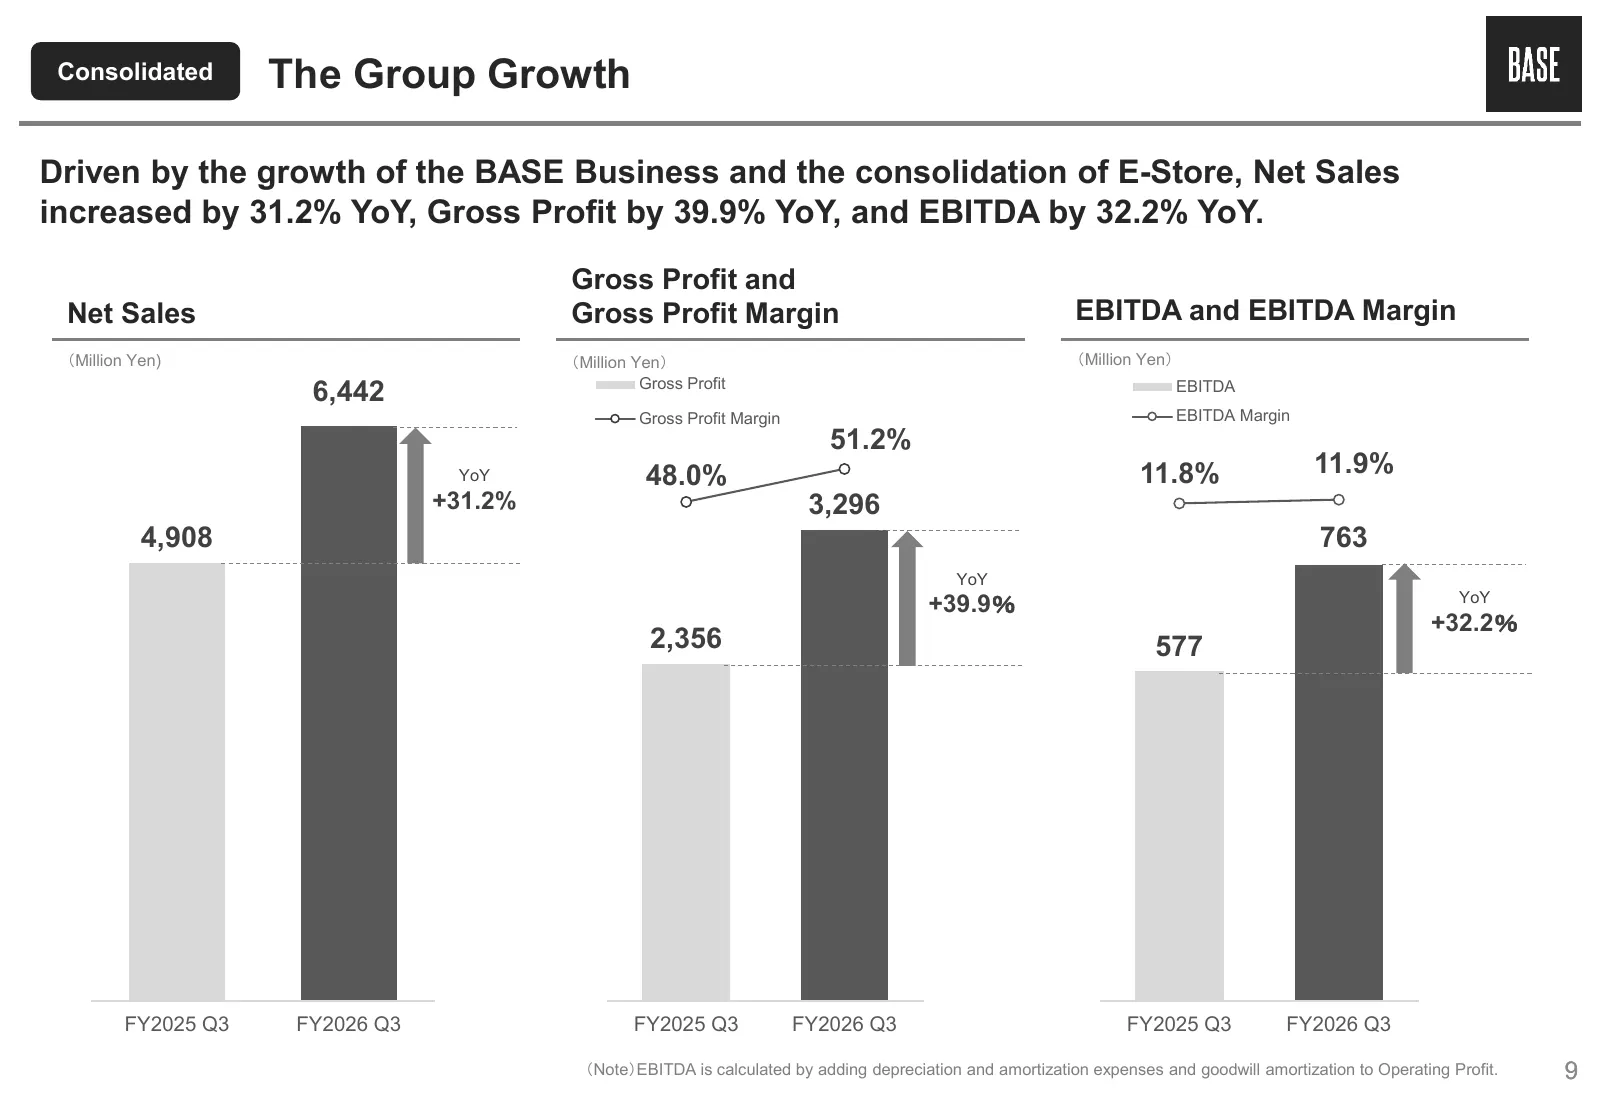
Consolidated The Group Growth Driven by the growth of the BASE Business and the consolidation of E-Store, Net Sales increased by 31.2% YoY, Gross Profit by 39.9% YoY, and EBITDA by 32.2% YoY. Gross Profit and Net Sales Gross Profit Margin EBITDA and EBITDA Margin (Million Yen) (Million Yen) (Million
Slide 10: Progress on the AI Strategy for the BASE Business
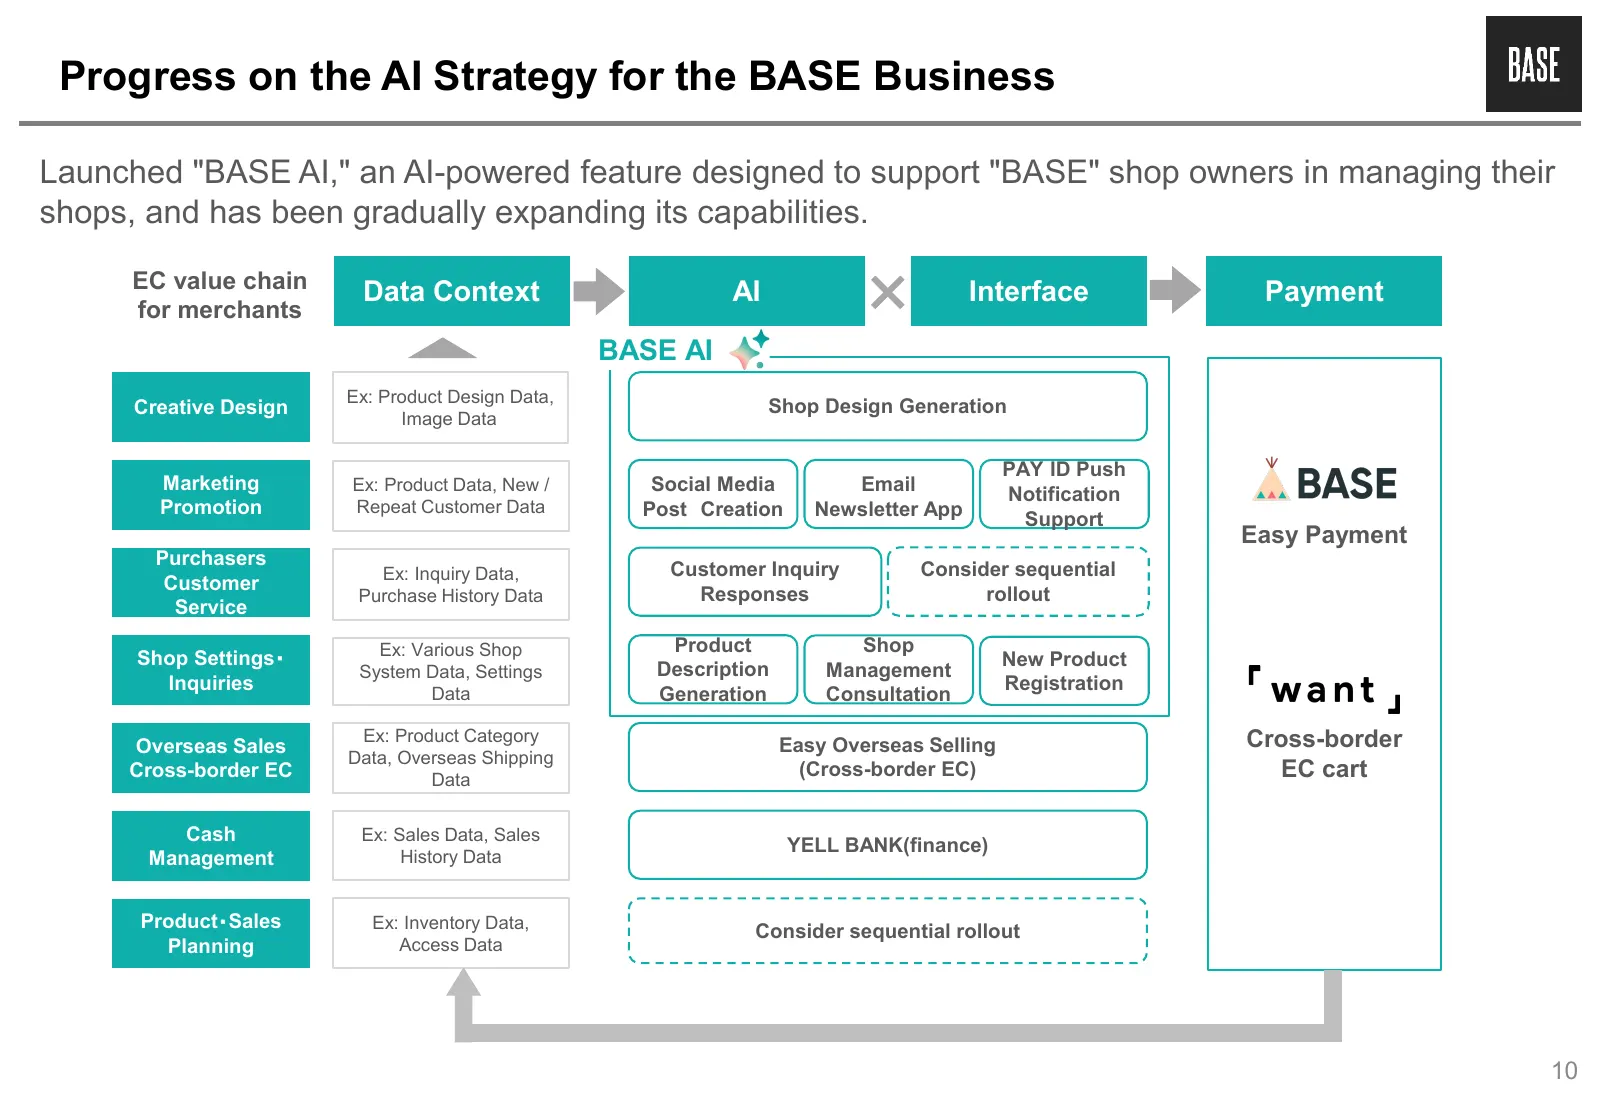
Progress on the AI Strategy for the BASE Business Launched "BASE AI," an AI-powered feature designed to support "BASE" shop owners in managing their shops, and has been gradually expanding its capabilities. EC value chain Data Context AI Interface Payment for merchants BASE AI Ex: Product Design Dat
Slide 11: New Features Added to "BASE AI"
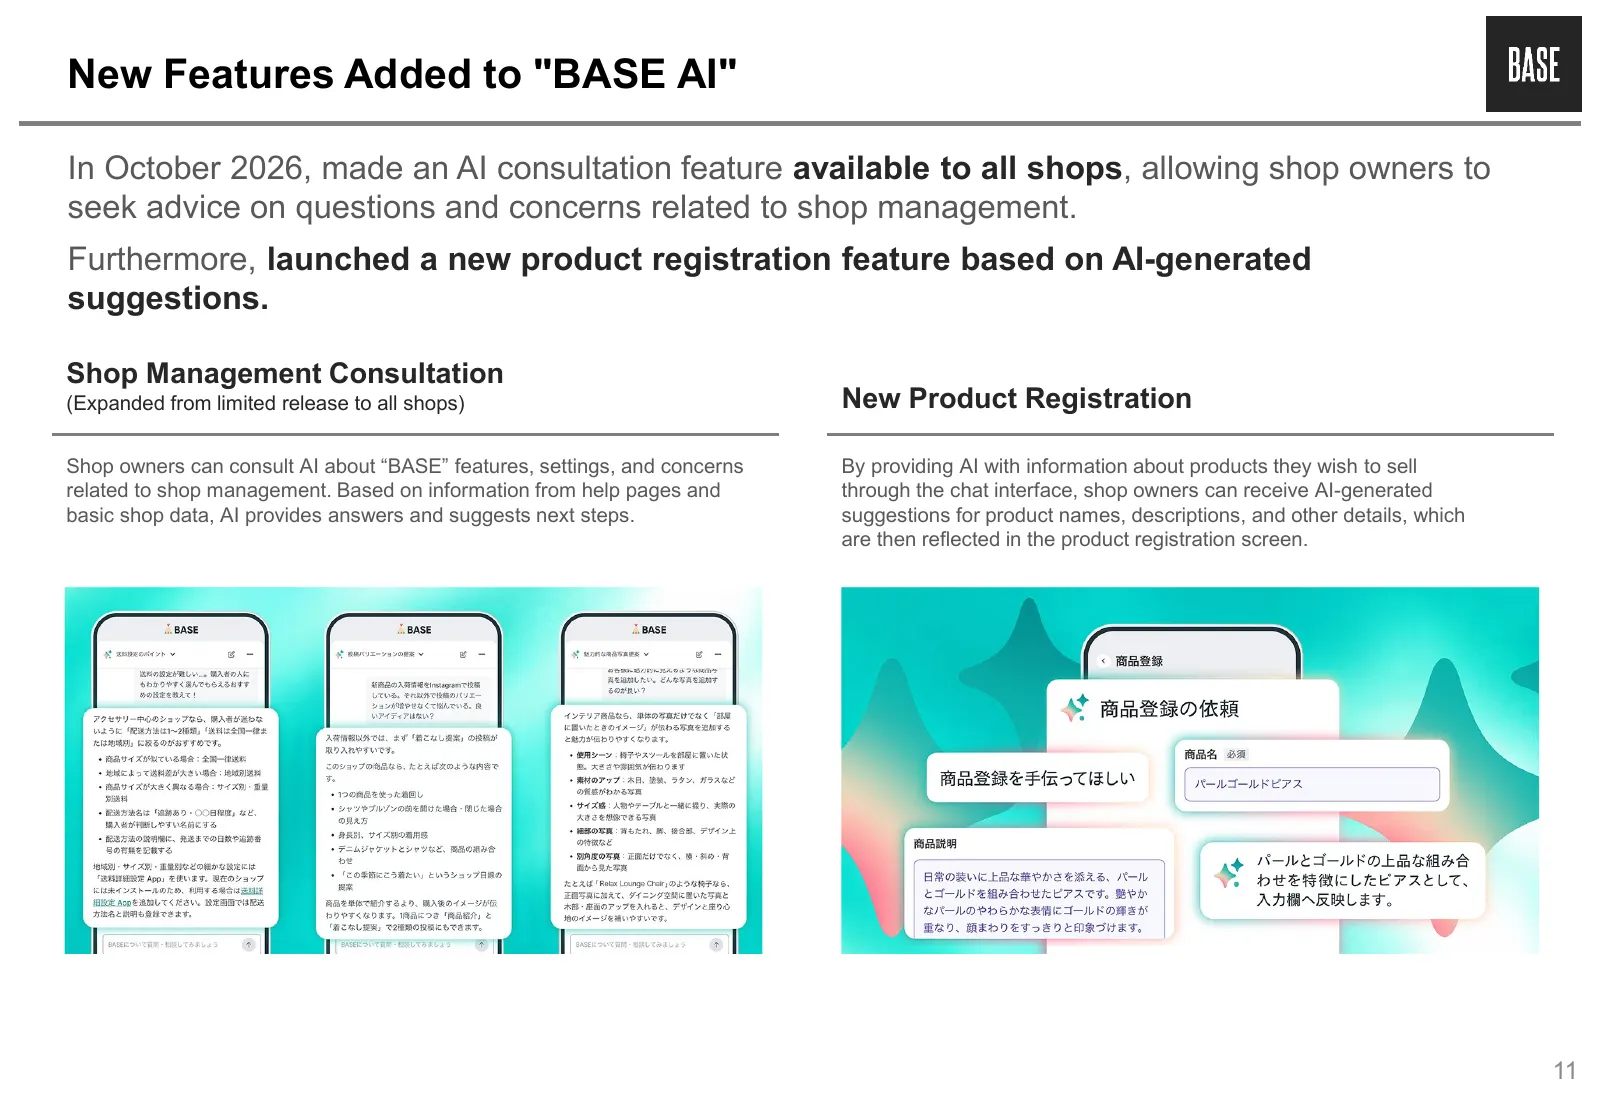
New Features Added to "BASE AI" In October 2026, made an AI consultation feature available to all shops, allowing shop owners to seek advice on questions and concerns related to shop management. Furthermore, launched a new product registration feature based on AI-generated suggestions. Shop Manageme
Slide 12: Capital and Business Alliance with SBI Holdings, Inc.
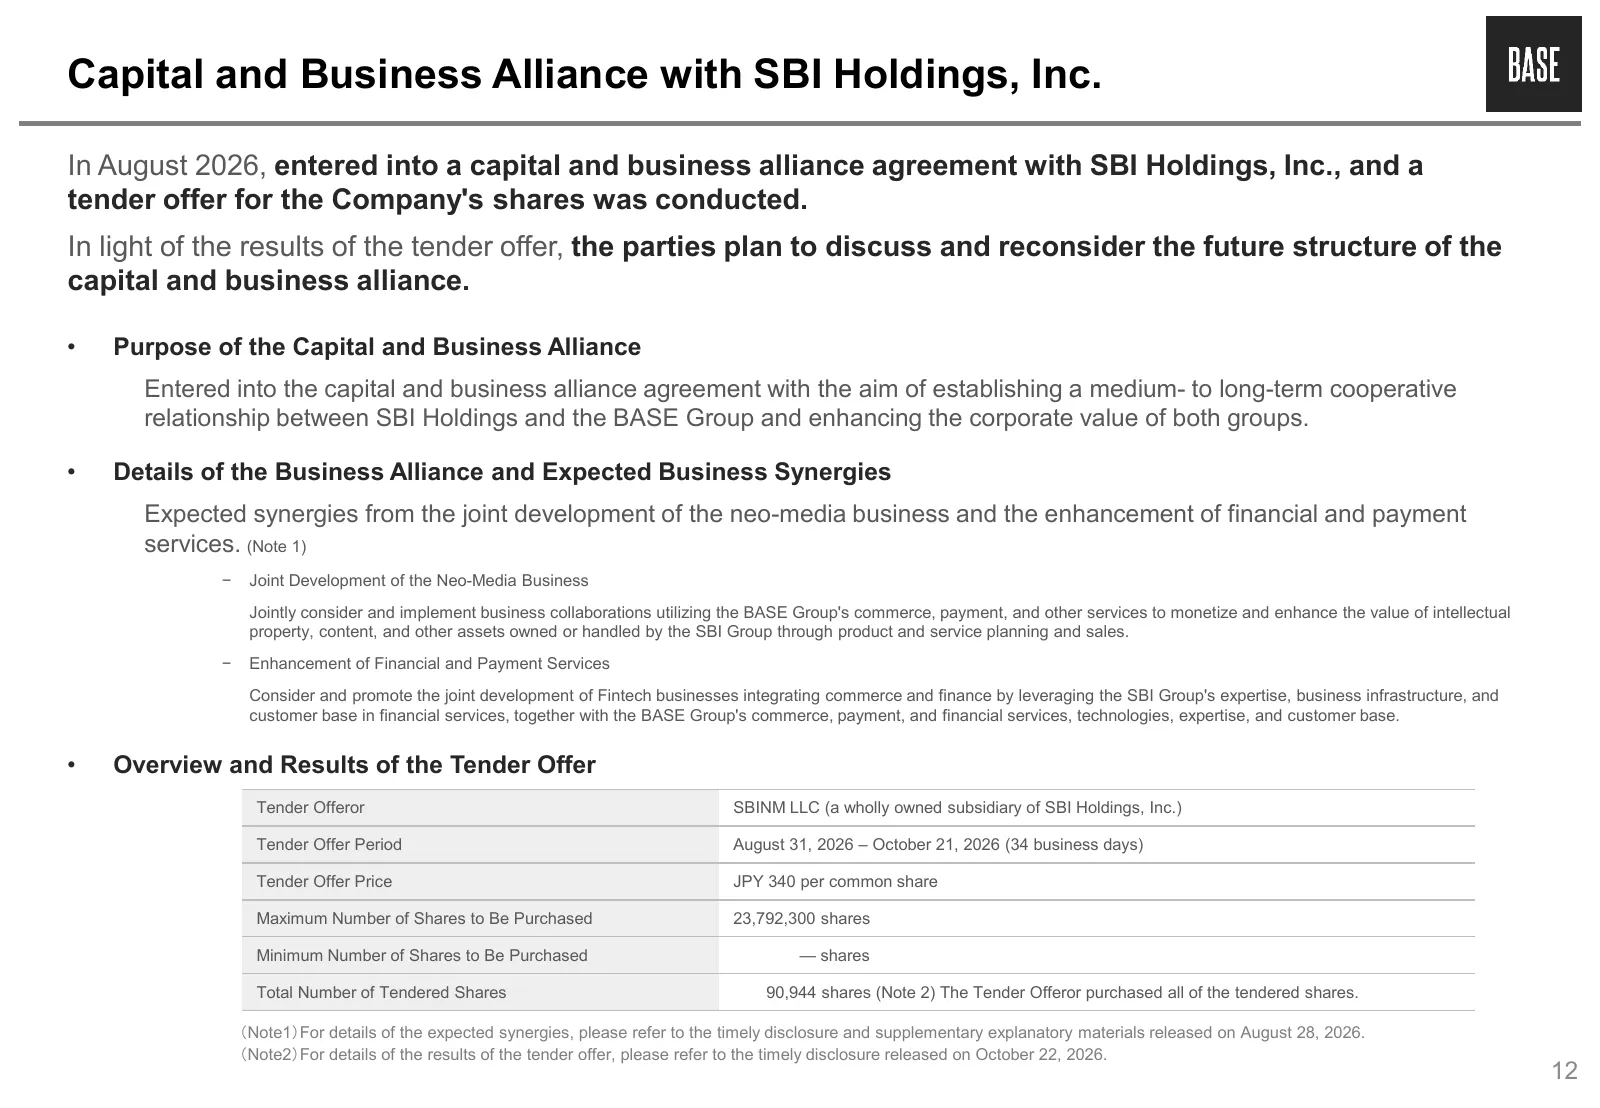
Capital and Business Alliance with SBI Holdings, Inc. In August 2026, entered into a capital and business alliance agreement with SBI Holdings, Inc., and a tender offer for the Company's shares was conducted. In light of the results of the tender offer, the parties plan to discuss and reconsider the
Slide 13: 3. Results for Q3 of the Fiscal Year Ending December 31, 2026
3. Results for Q3 of the Fiscal Year Ending December 31, 2026
Slide 14: Financial Highlights for FY2026 Q3 Results
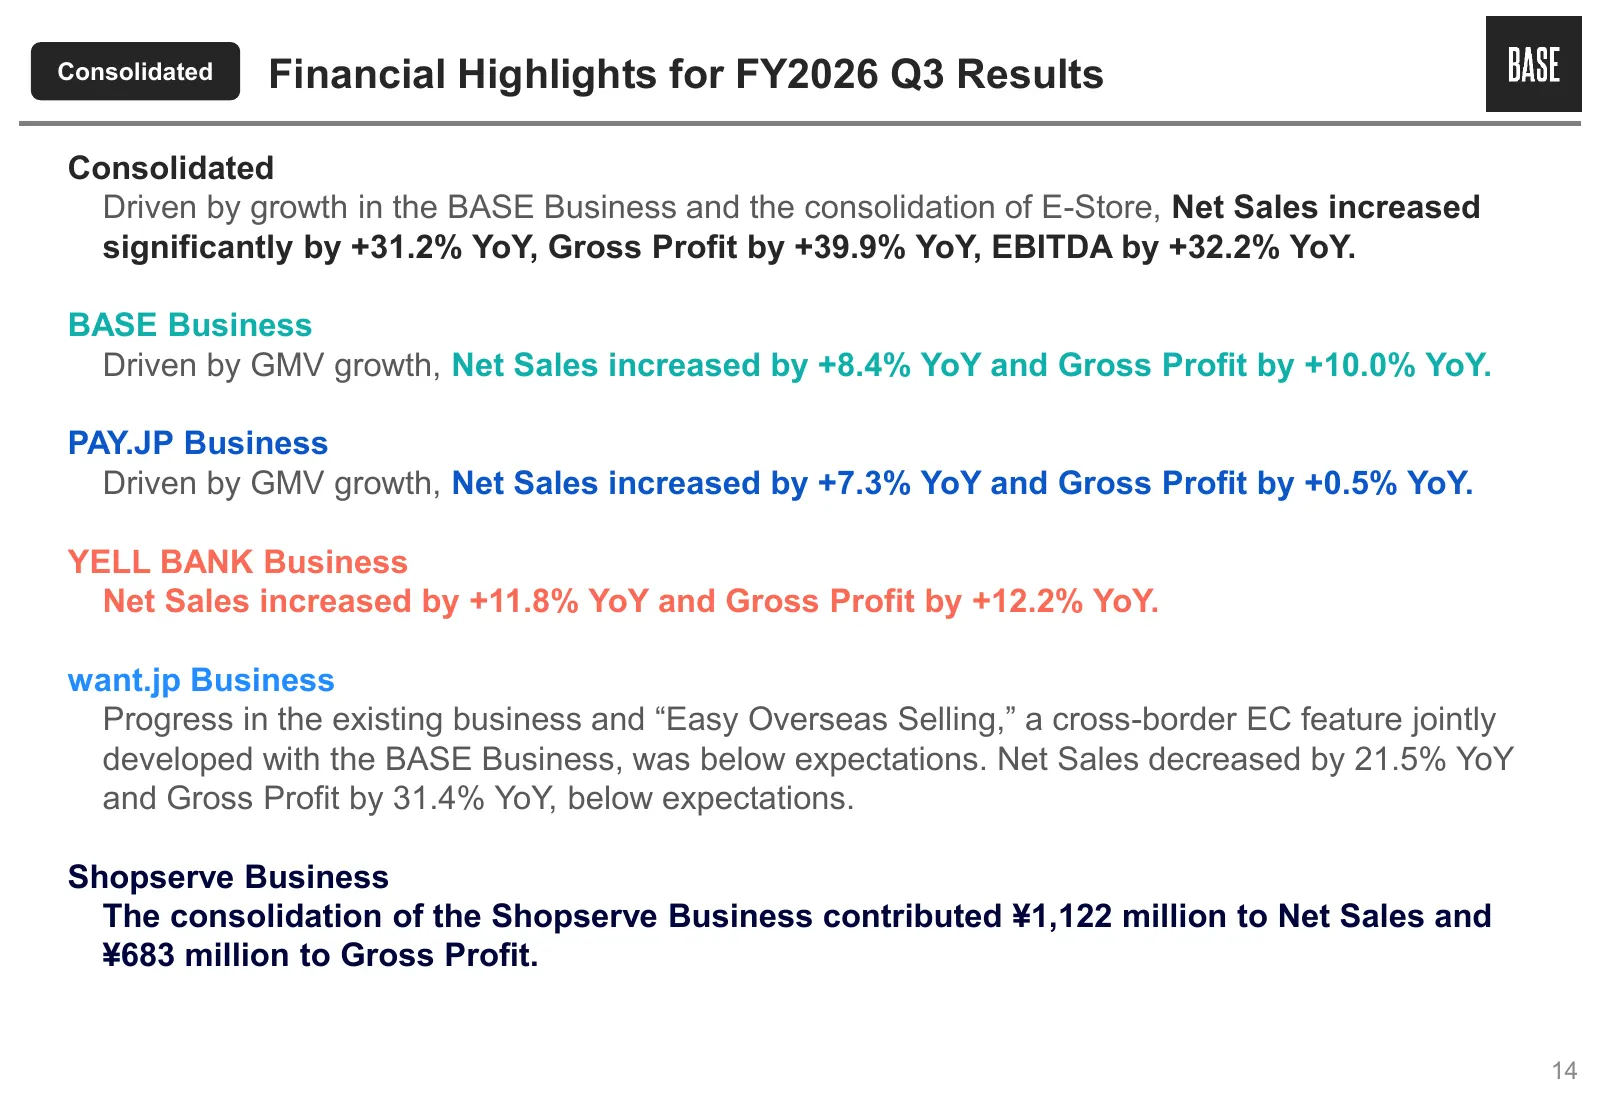
Consolidated Financial Highlights for FY2026 Q3 Results Consolidated Driven by growth in the BASE Business and the consolidation of E-Store, Net Sales increased significantly by +31.2% YoY, Gross Profit by +39.9% YoY, EBITDA by +32.2% YoY. BASE Business Driven by GMV growth, Net Sales increased by +
Slide 15: FY2026 Q3 Results
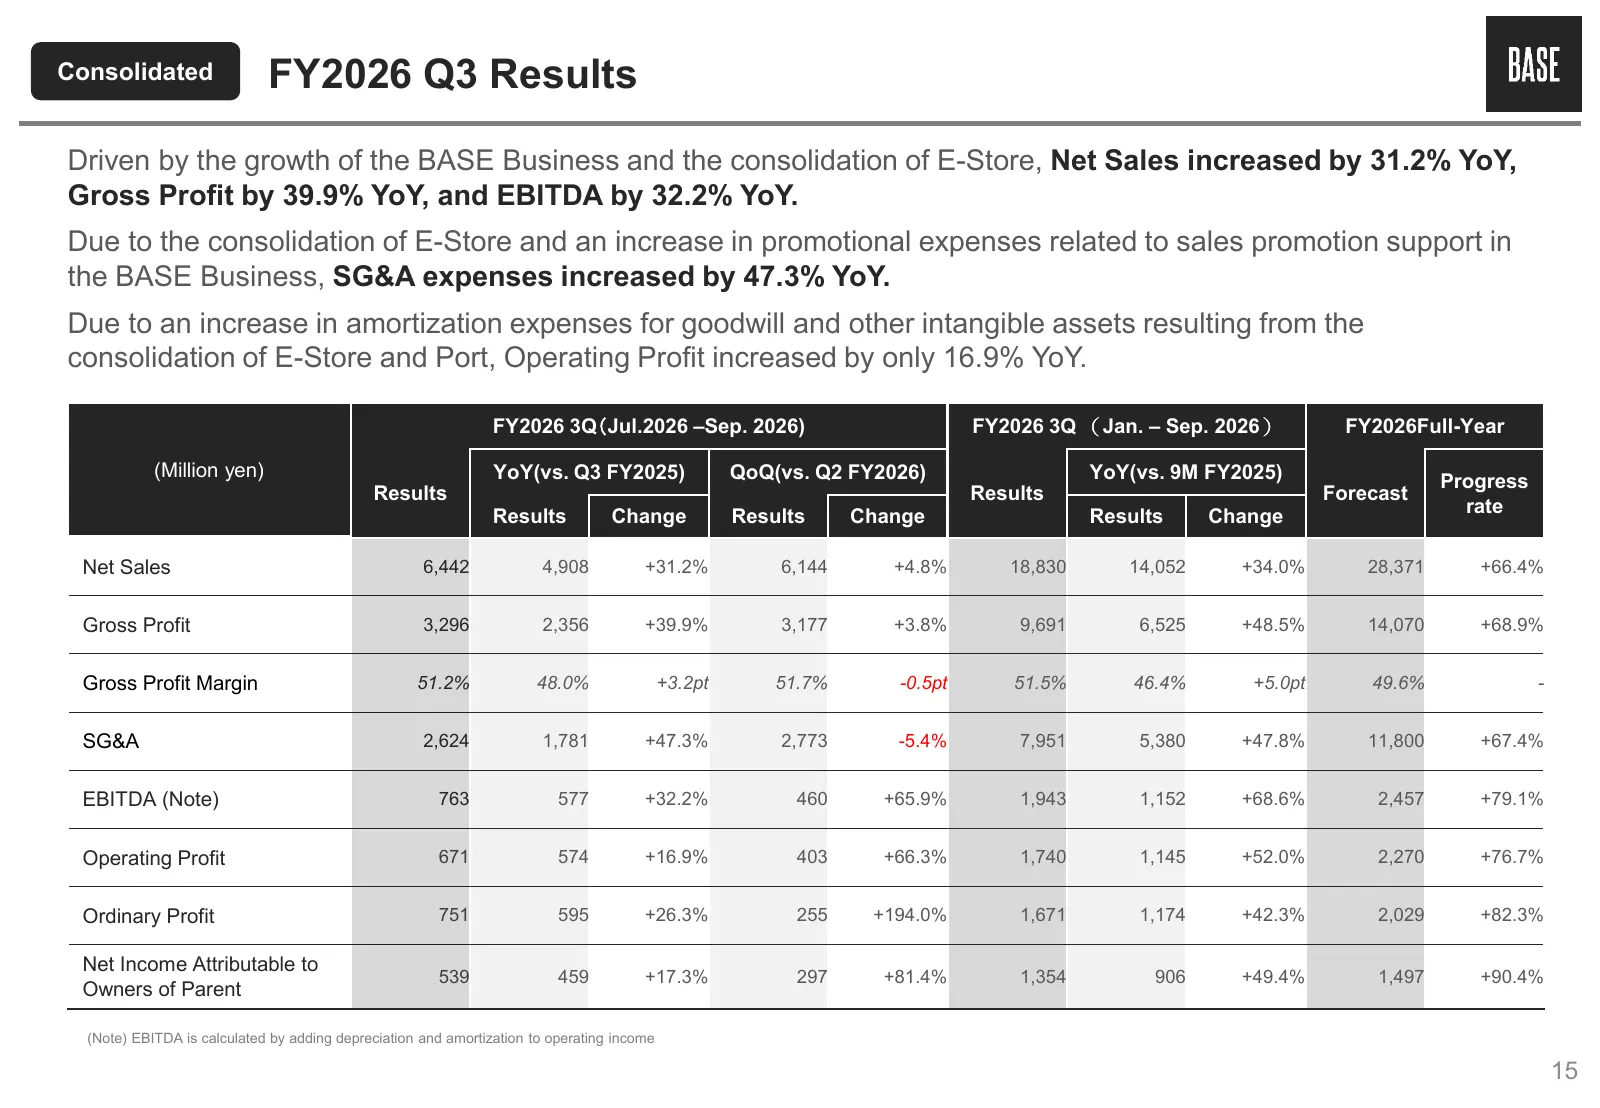
Consolidated FY2026 Q3 Results Driven by the growth of the BASE Business and the consolidation of E-Store, Net Sales increased by 31.2% YoY, Gross Profit by 39.9% YoY, and EBITDA by 32.2% YoY. Due to the consolidation of E-Store and an increase in promotional expenses related to sales promotion supp
Slide 16: Consolidated Balance Sheet
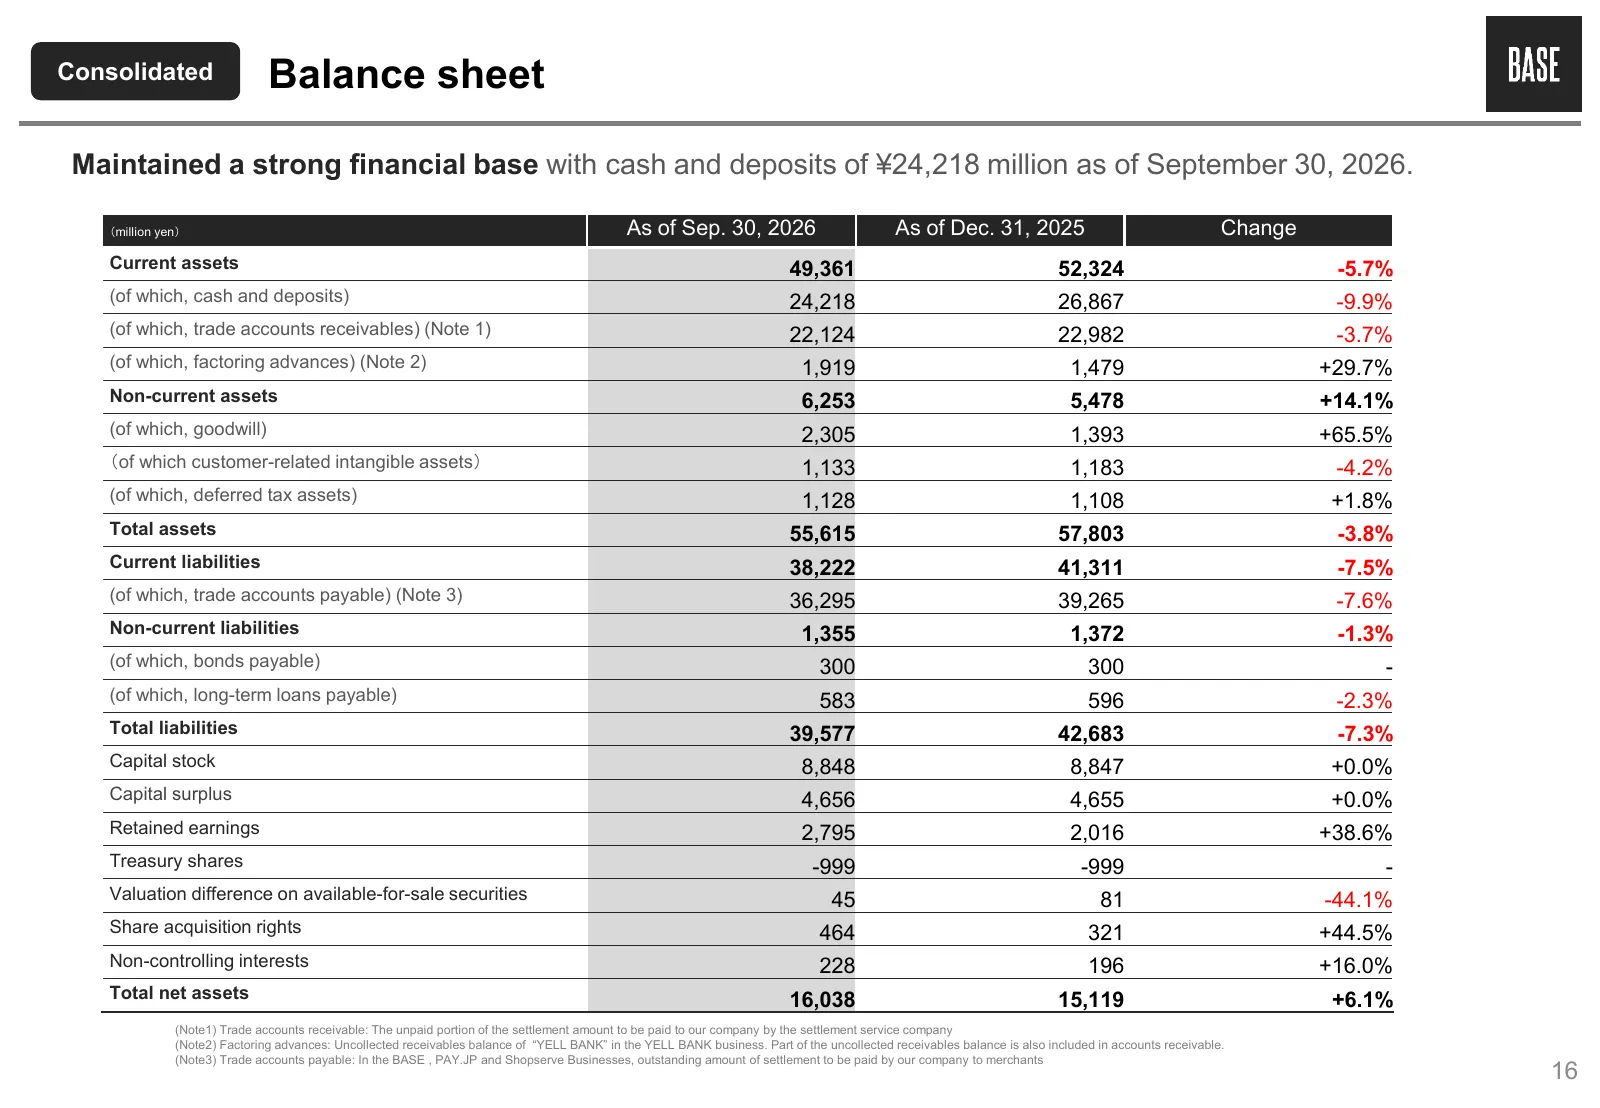
Consolidated Balance sheet Maintained a strong financial base with cash and deposits of ¥24,218 million as of September 30, 2026. (million yen) As of Sep. 30, 2026 As of Dec. 31, 2025 Change Current assets 49,361 52,324 -5.7% (of which, cash and deposits) 24,218 26,867 -9.9% (of which, trade account
Slide 17: Trend in Group GMV, Net Sales and Net Sales Ratio
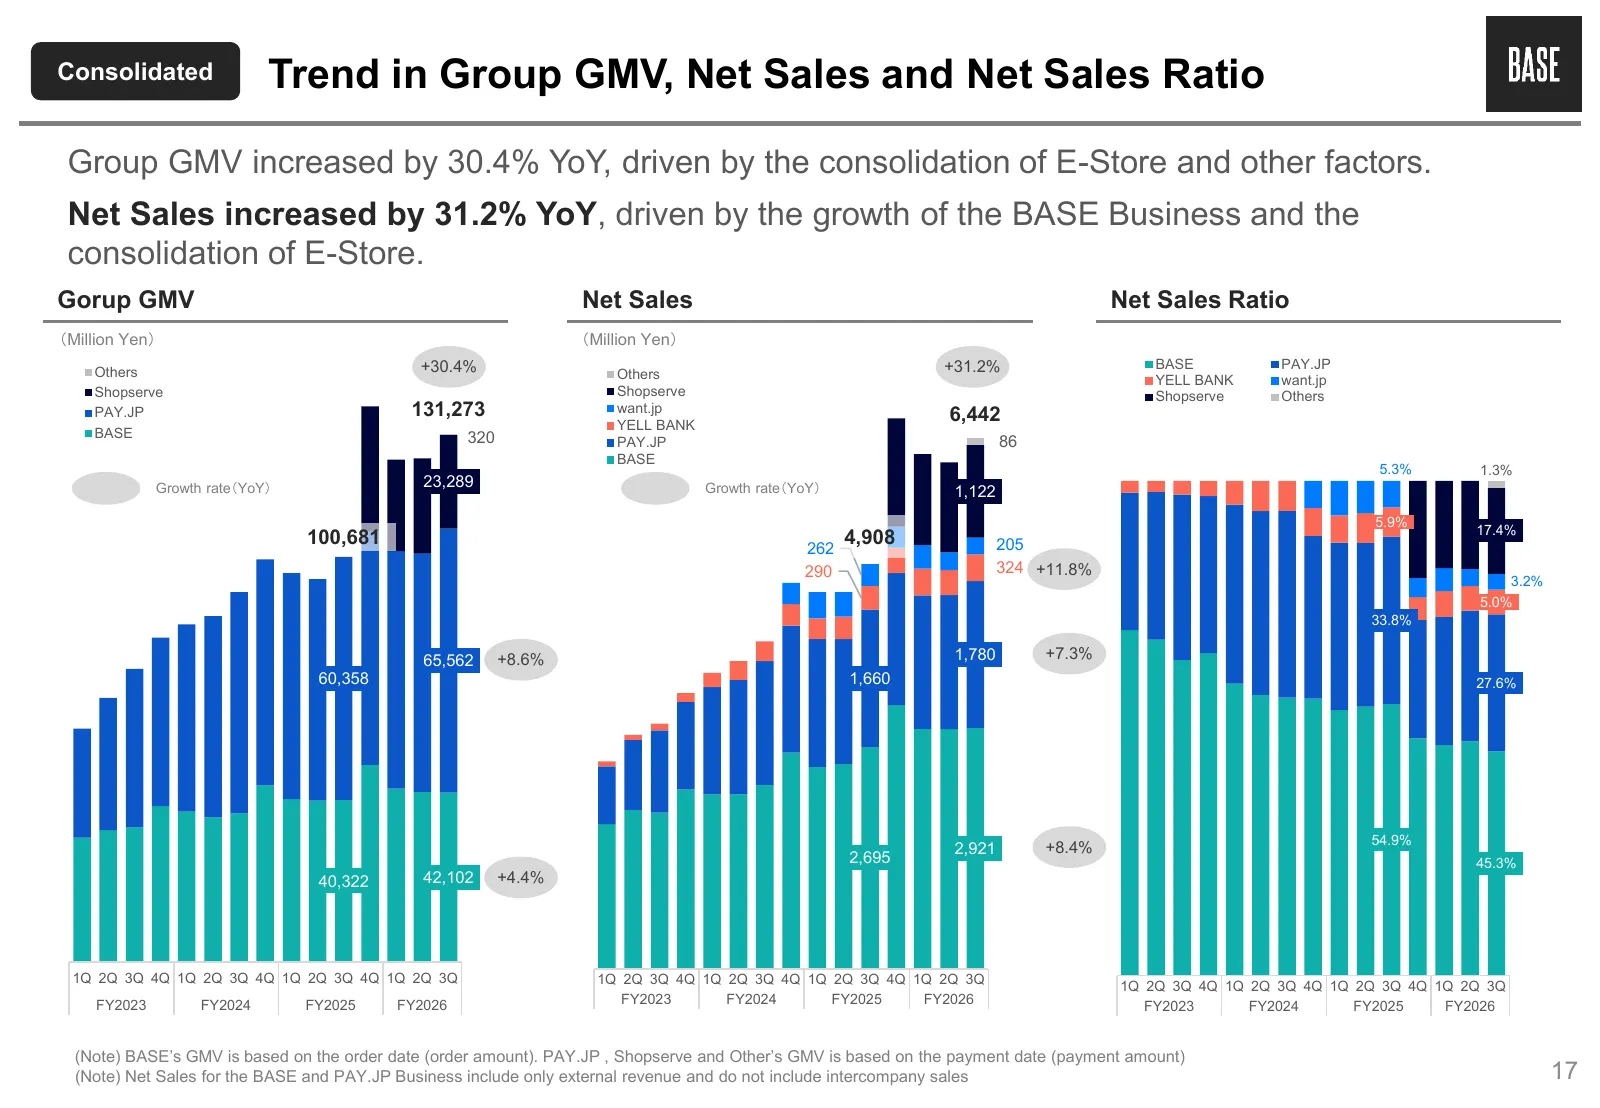
Consolidated Trend in Group GMV, Net Sales and Net Sales Ratio Group GMV increased by 30.4% YoY, driven by the consolidation of E-Store and other factors. Net Sales increased by 31.2% YoY, driven by the growth of the BASE Business and the consolidation of E-Store. Gorup GMV Net Sales Net Sales Ratio
Slide 18: Trend in Gross Profit, SG&A Expenses, EBITDA and Operating Profit
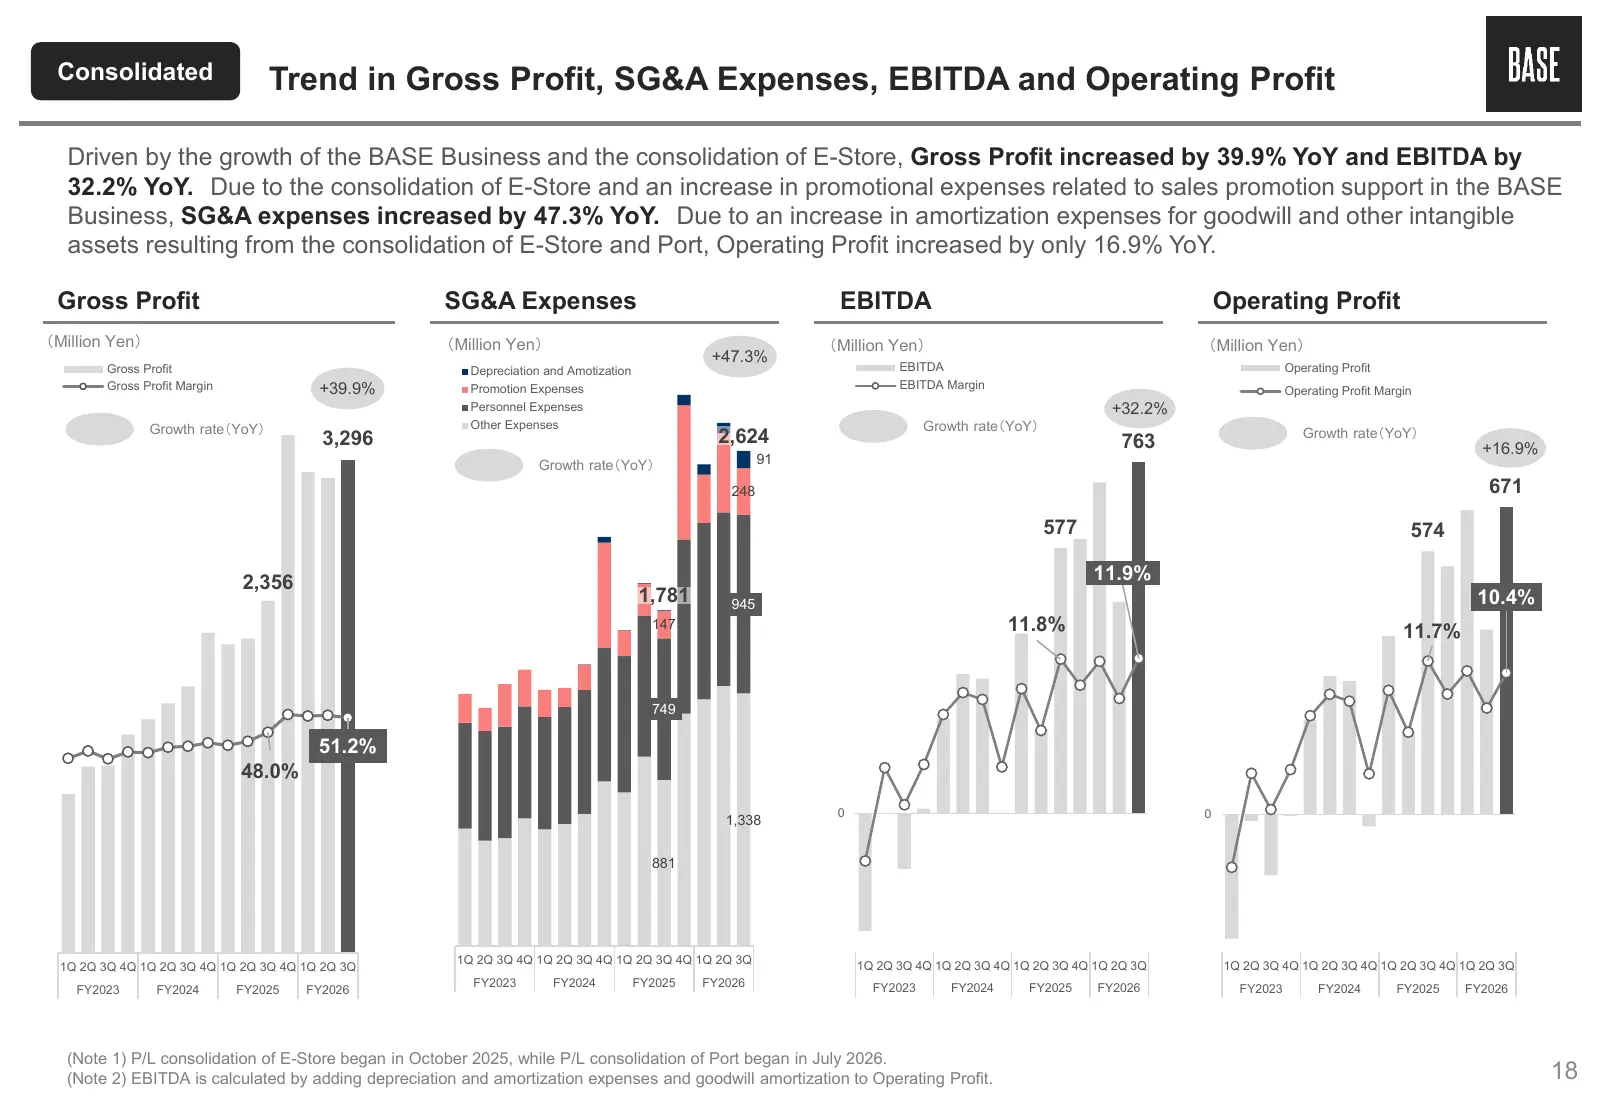
Consolidated Trend in Gross Profit, SG&A Expenses, EBITDA and Operating Profit Driven by the growth of the BASE Business and the consolidation of E-Store, Gross Profit increased by 39.9% YoY and EBITDA by 32.2% YoY. Due to the consolidation of E-Store and an increase in promotional expenses related
Slide 19: BASE Business Trend in GMV, Take Rate, Net Sales and Gross Profit
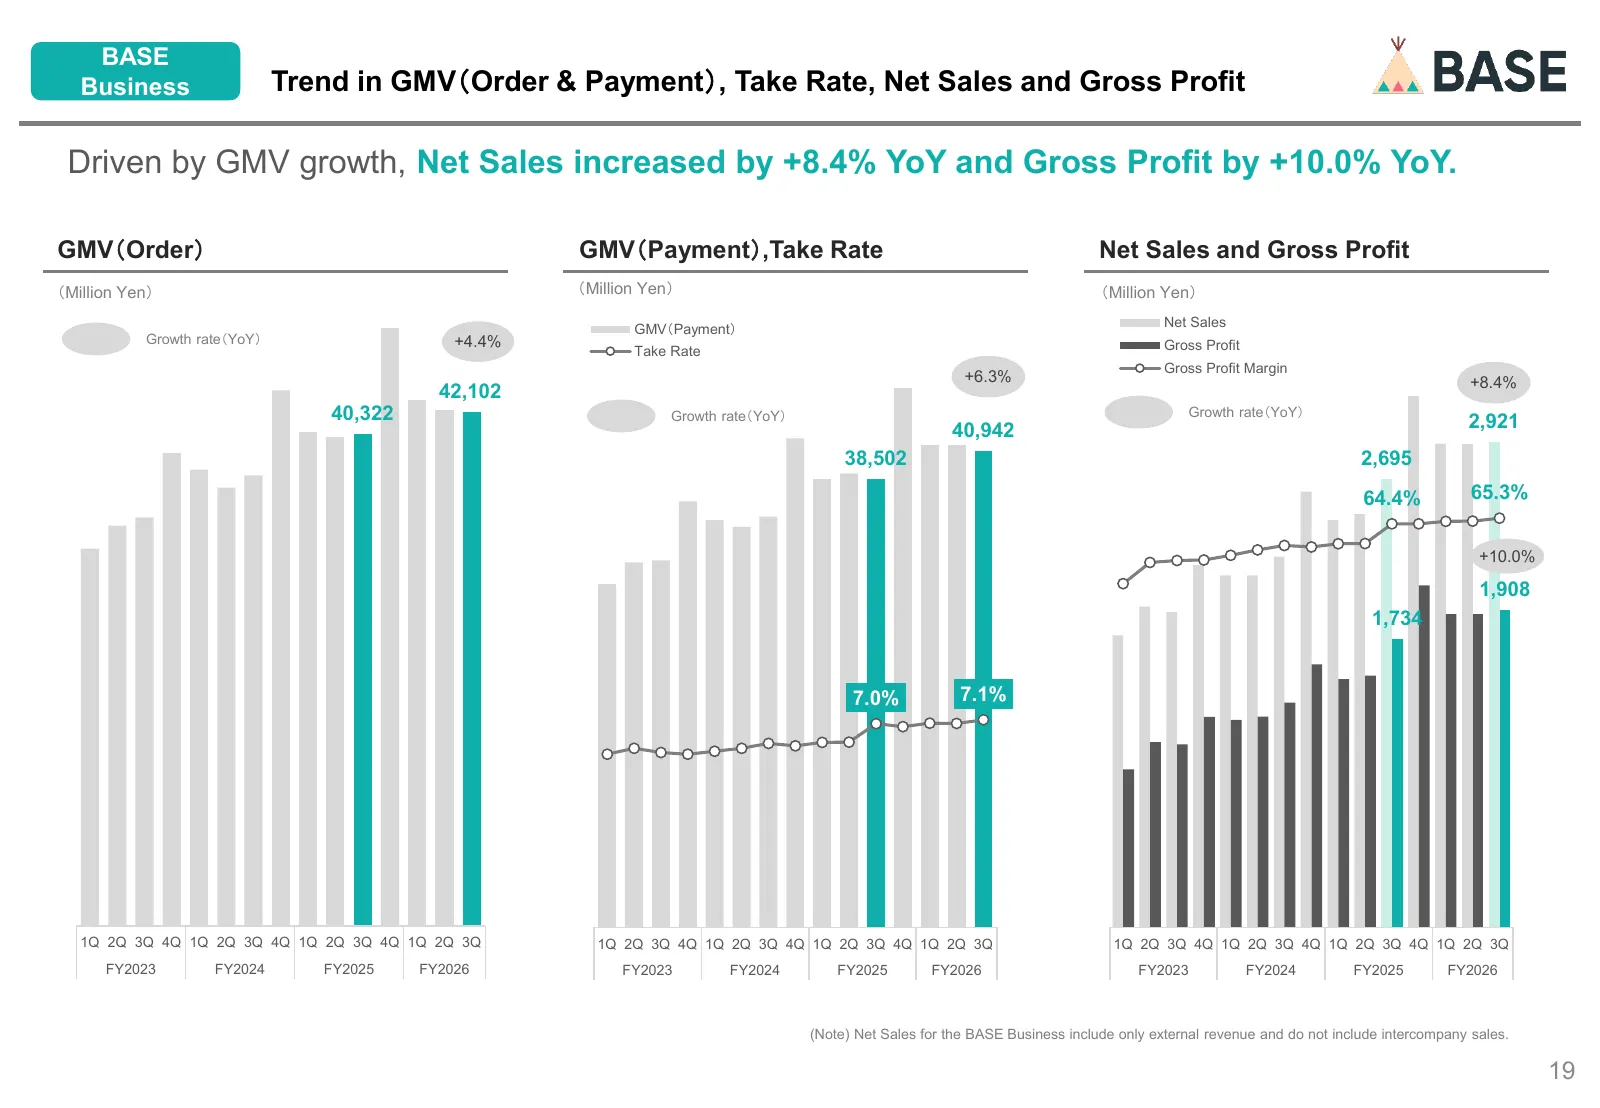
BASE Business Trend in GMV(Order & Payment), Take Rate, Net Sales and Gross Profit Driven by GMV growth, Net Sales increased by +8.4% YoY and Gross Profit by +10.0% YoY. GMV(Order) GMV(Payment),Take Rate Net Sales and Gross Profit (Million Yen) (Million Yen) (Million Yen) GMV(Payment) Net Sales Grow
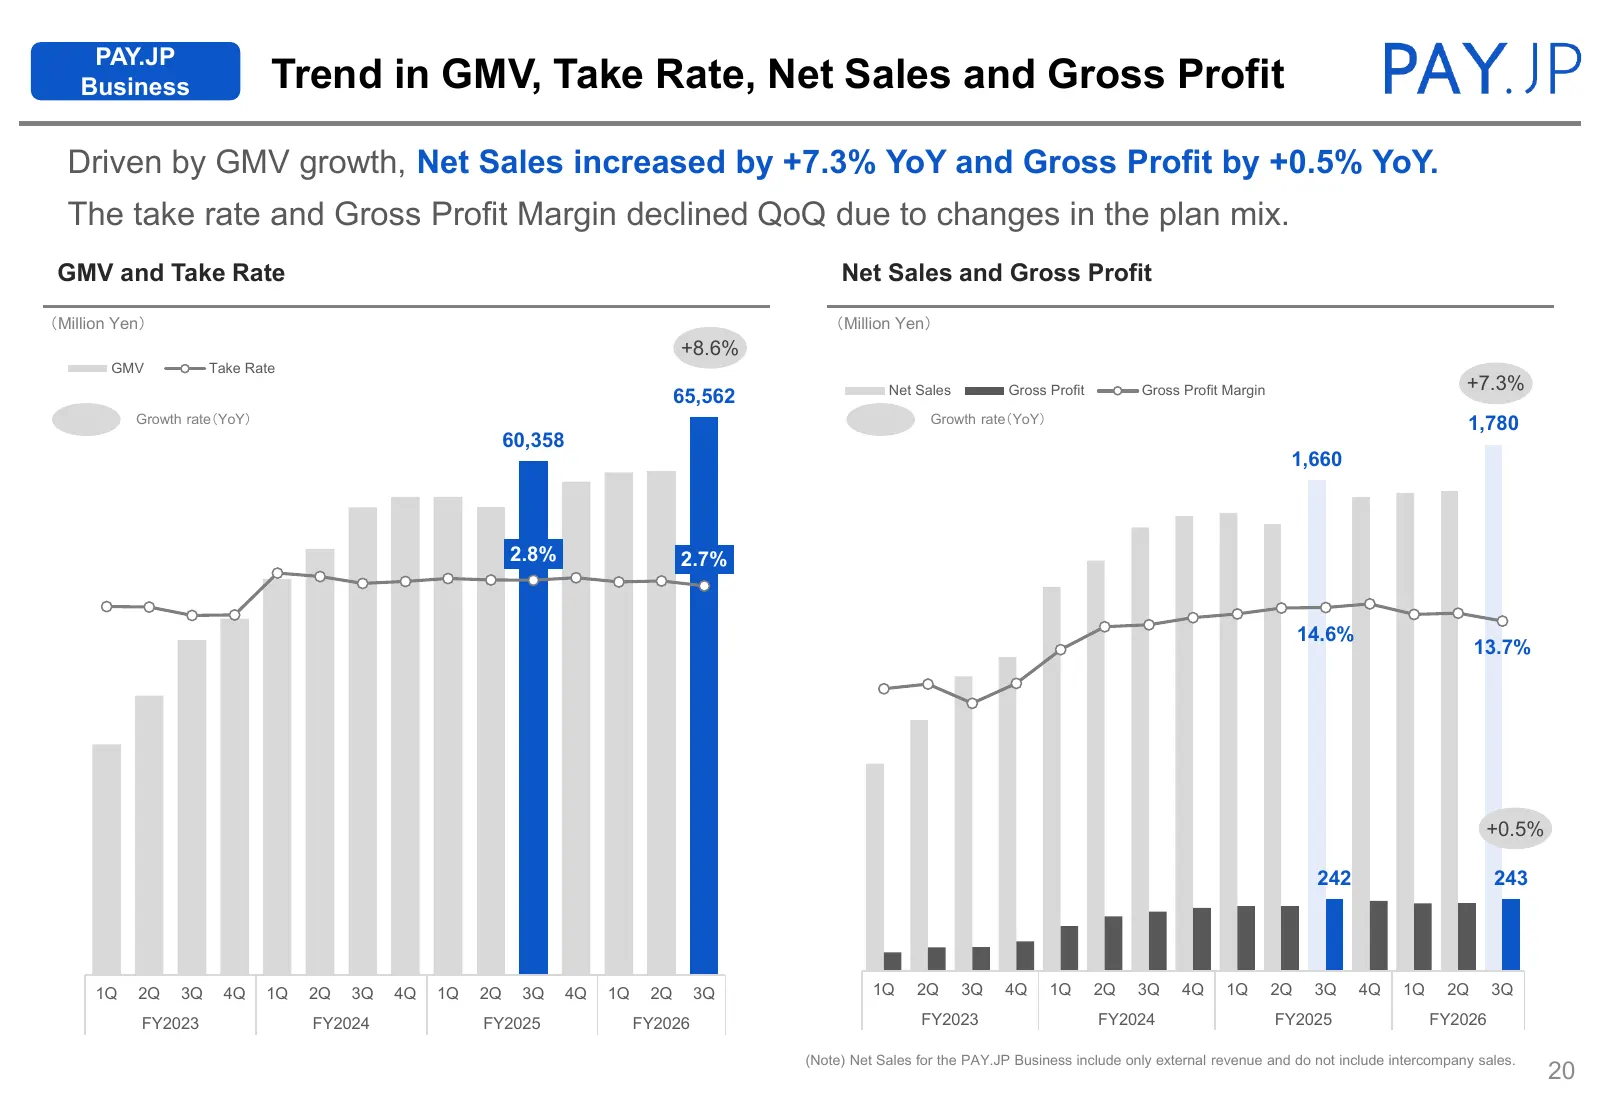
Slide 20: PAY.JP Business Trend in GMV, Take Rate, Net Sales and Gross Profit
PAY.JP Business Trend in GMV, Take Rate, Net Sales and Gross Profit Driven by GMV growth, Net Sales increased by +7.3% YoY and Gross Profit by +0.5% YoY. The take rate and Gross Profit Margin declined QoQ due to changes in the plan mix. GMV and Take Rate Net Sales and Gross Profit (Million Yen) (Mil
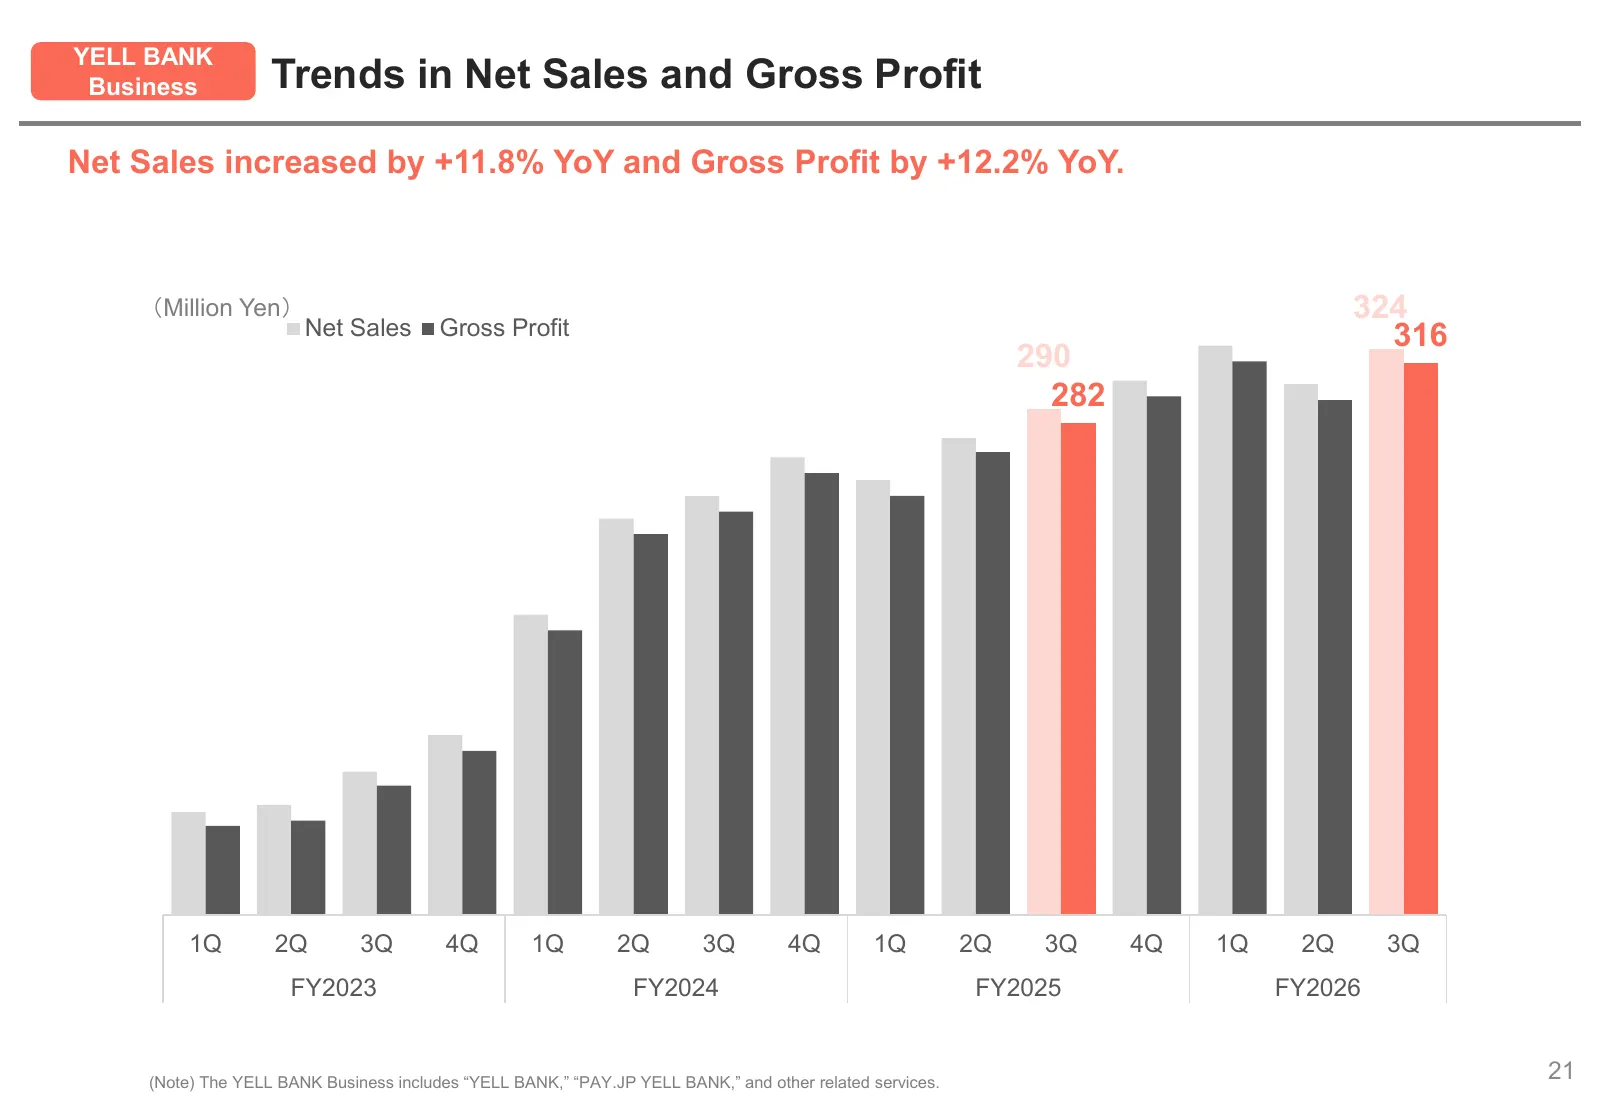
Slide 21: YELL BANK Business Trends in Net Sales and Gross Profit
YELL BANK Business Trends in Net Sales and Gross Profit Net Sales increased by +11.8% YoY and Gross Profit by +12.2% YoY. (Million Yen) 324 Net Sales Gross Profit 316 290 282 1Q 2Q 3Q 4Q 1Q 2Q 3Q 4Q 1Q 2Q 3Q 4Q 1Q 2Q 3Q FY2023 FY2024 FY2025 FY2026 (Note) The YELL BANK Business includes “YELL BANK,”
Slide 22: 4. Reference Materials
4. Reference Materials
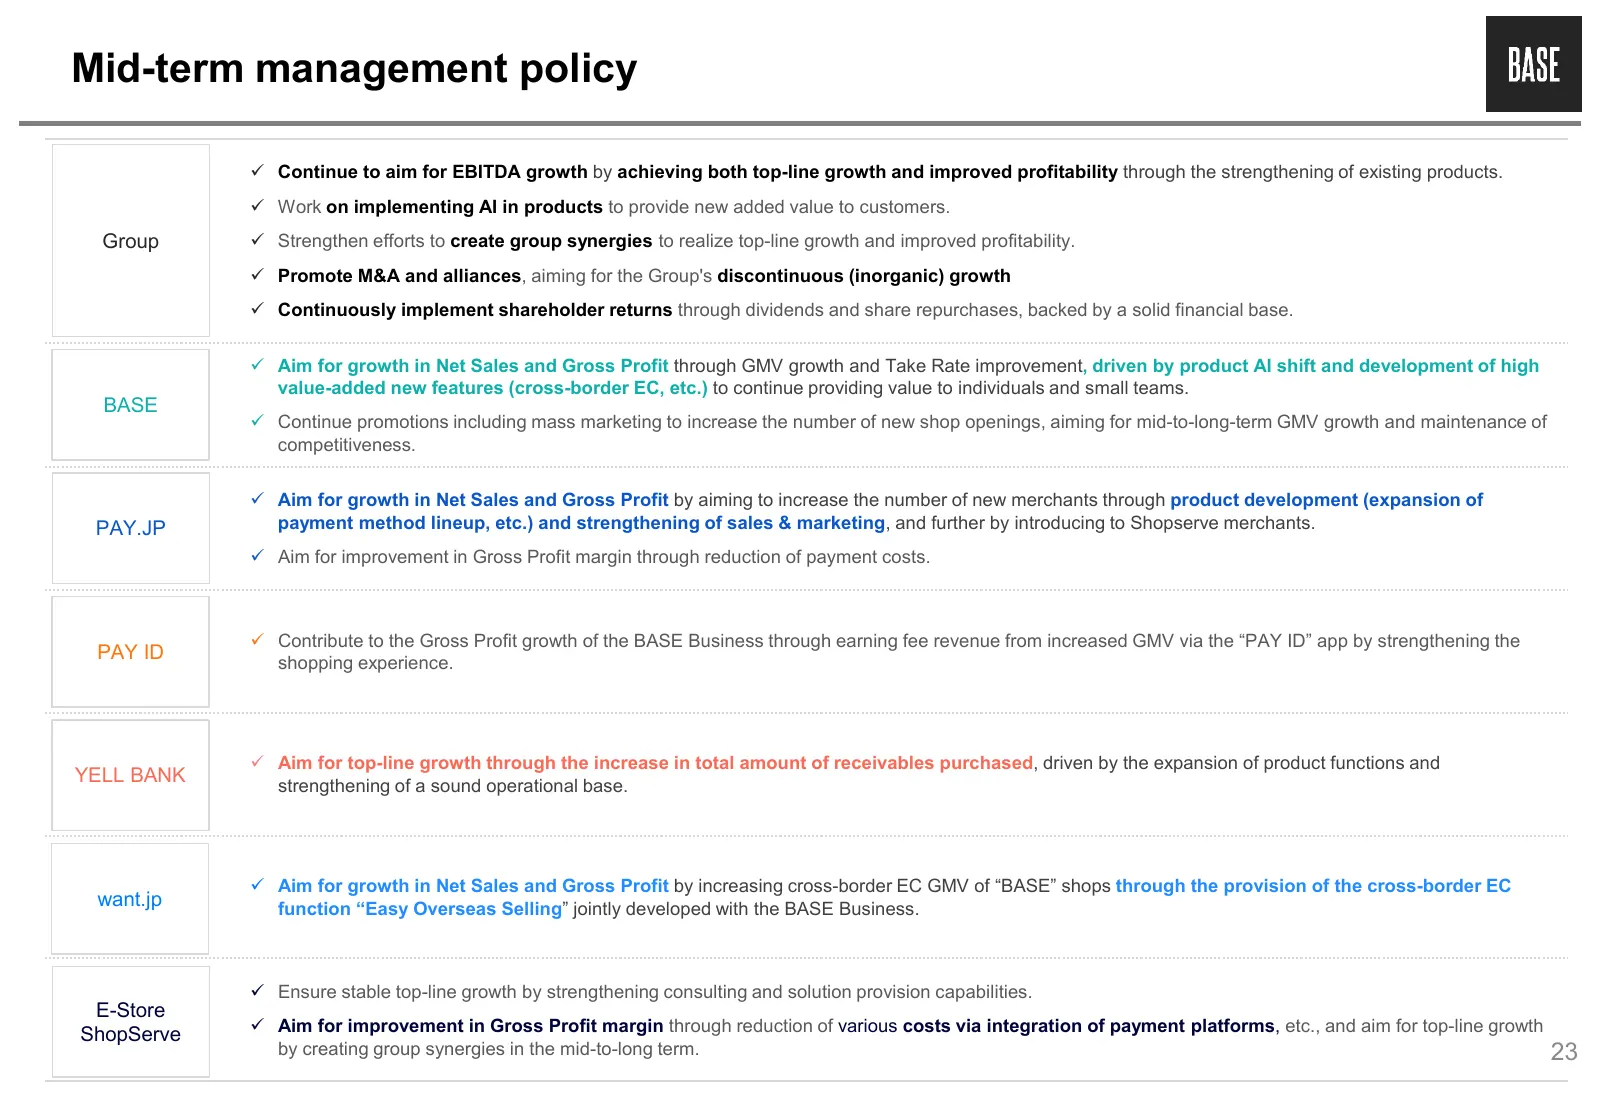
Slide 23: Mid-term management policy
Mid-term management policy Continue to aim for EBITDA growth by achieving both top-line growth and improved profitability through the strengthening of existing products. Work on implementing AI in products to provide new added value to customers. Group Strengthen efforts to create group synerg
Slide 24: Mid-term Growth Strategy
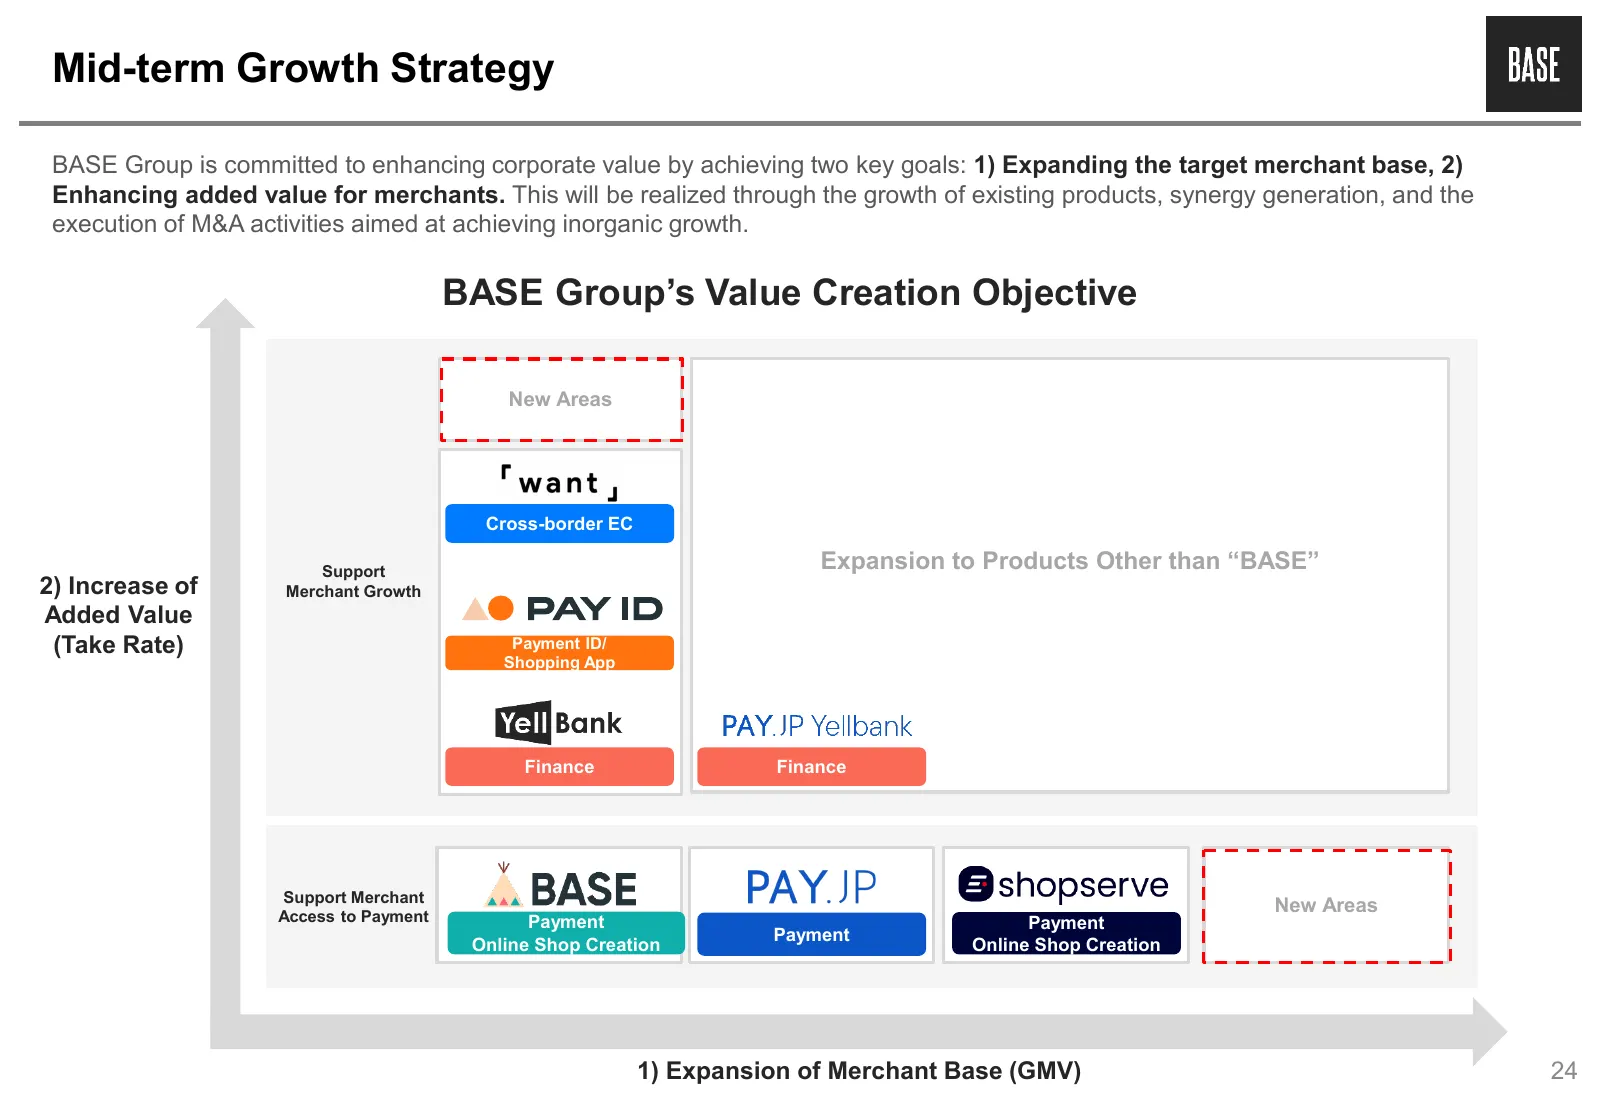
Mid-term Growth Strategy BASE Group is committed to enhancing corporate value by achieving two key goals: 1) Expanding the target merchant base, 2) Enhancing added value for merchants. This will be realized through the growth of existing products, synergy generation, and the execution of M&A activit
Slide 25: Mid-term Management Plan
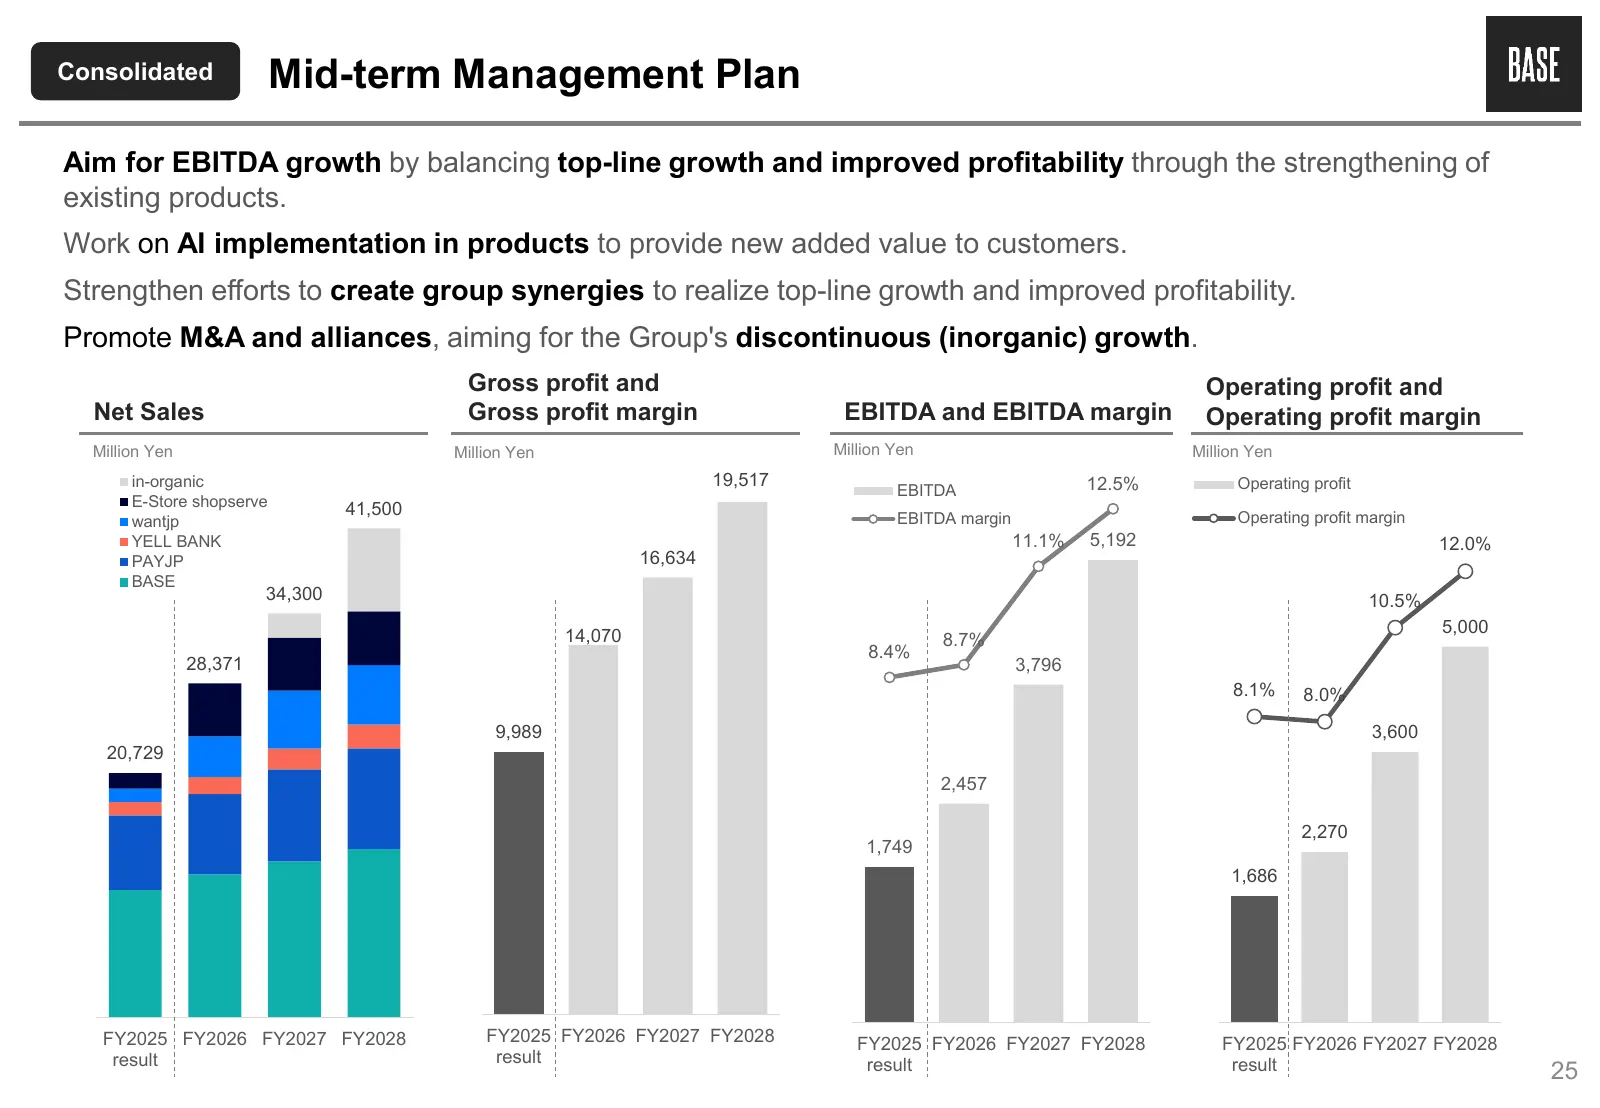
Consolidated Mid-term Management Plan Aim for EBITDA growth by balancing top-line growth and improved profitability through the strengthening of existing products. Work on AI implementation in products to provide new added value to customers. Strengthen efforts to create group synergies to realize t
Slide 26: Group AI Strategy
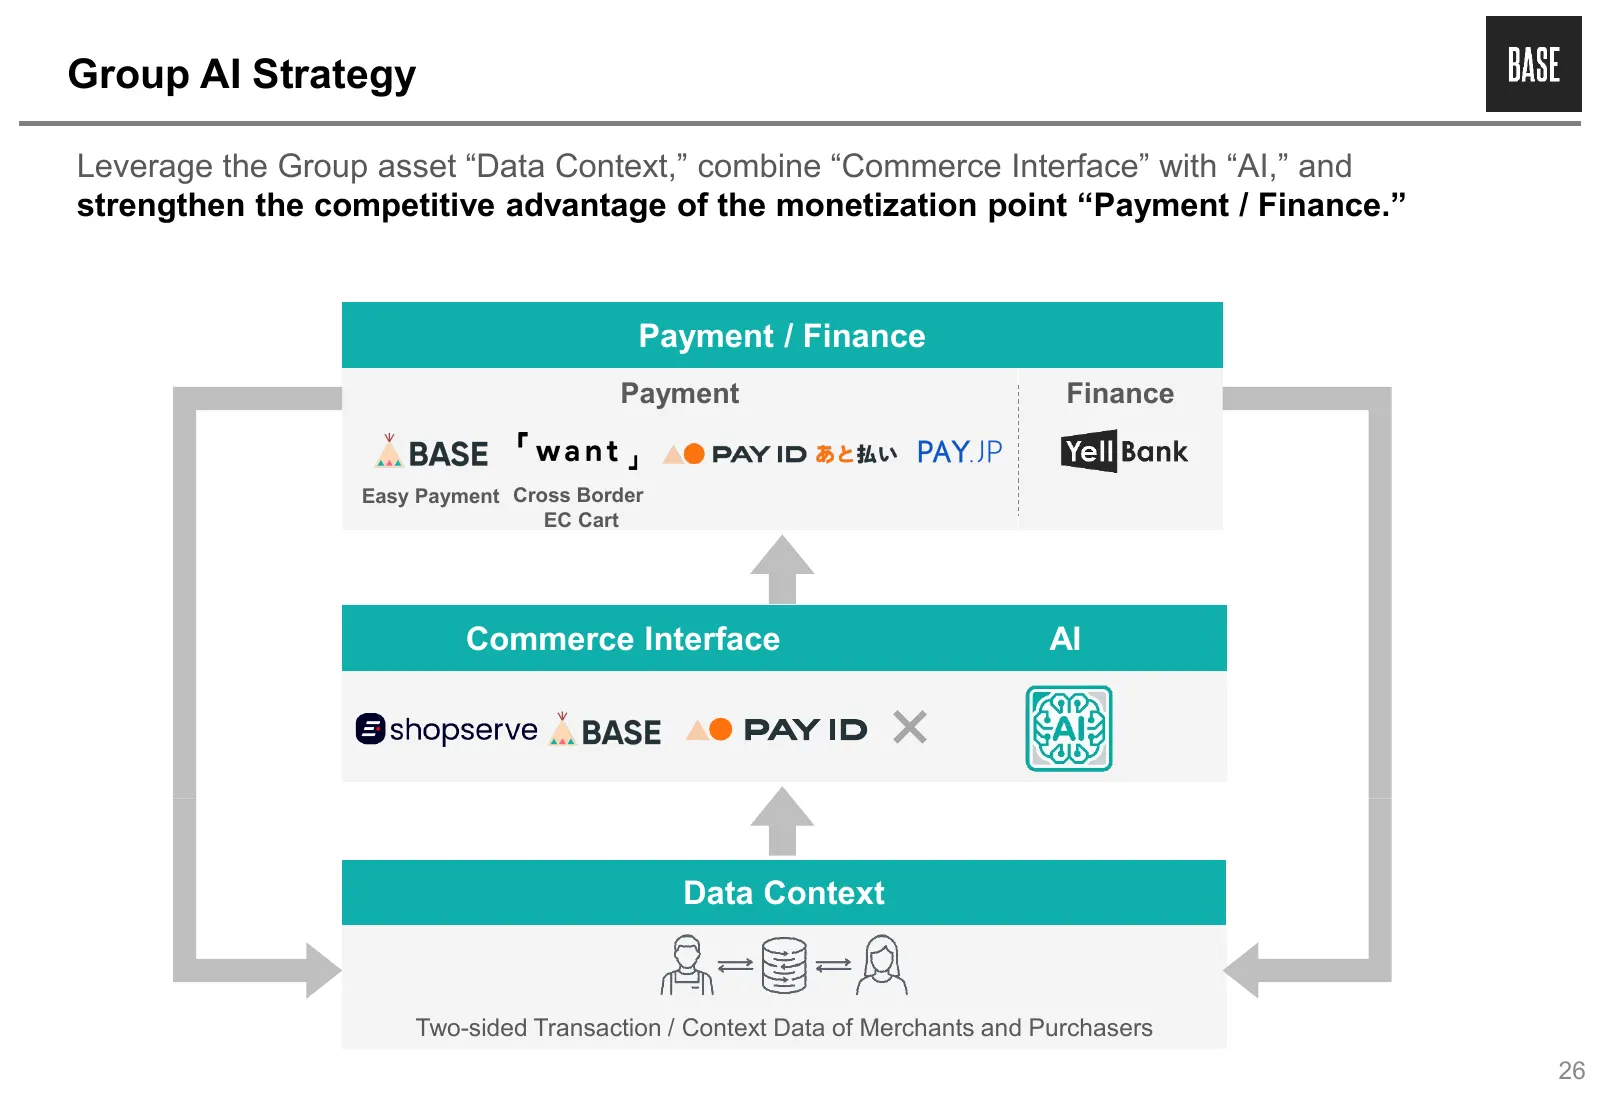
Group AI Strategy Leverage the Group asset “Data Context,” combine “Commerce Interface” with “AI,” and strengthen the competitive advantage of the monetization point “Payment / Finance.” Payment / Finance Payment Finance Easy Payment Cross Border EC Cart Commerce Interface AI Data Context Two-sided
Slide 27: BASE business AI Strategy
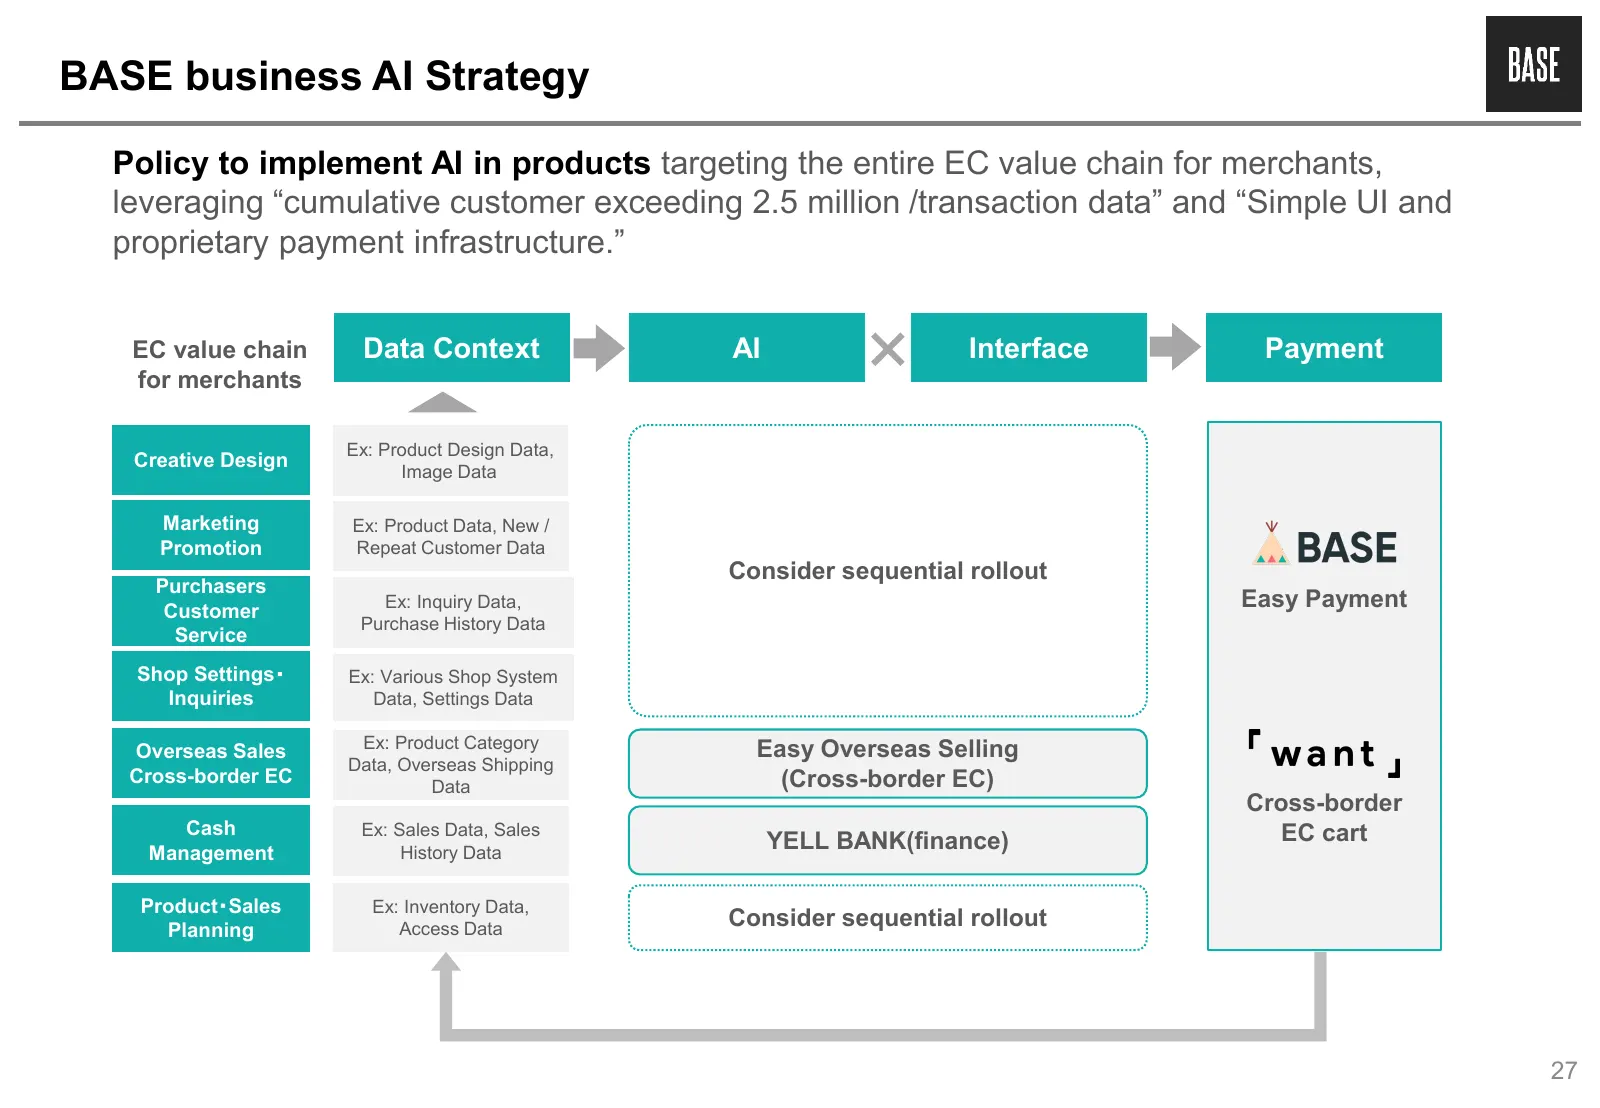
BASE business AI Strategy Policy to implement AI in products targeting the entire EC value chain for merchants, leveraging “cumulative customer exceeding 2.5 million /transaction data” and “Simple UI and proprietary payment infrastructure.” EC value chain Data Context AI Interface Payment for mercha
Slide 28: Examples of AI Utilization in Products
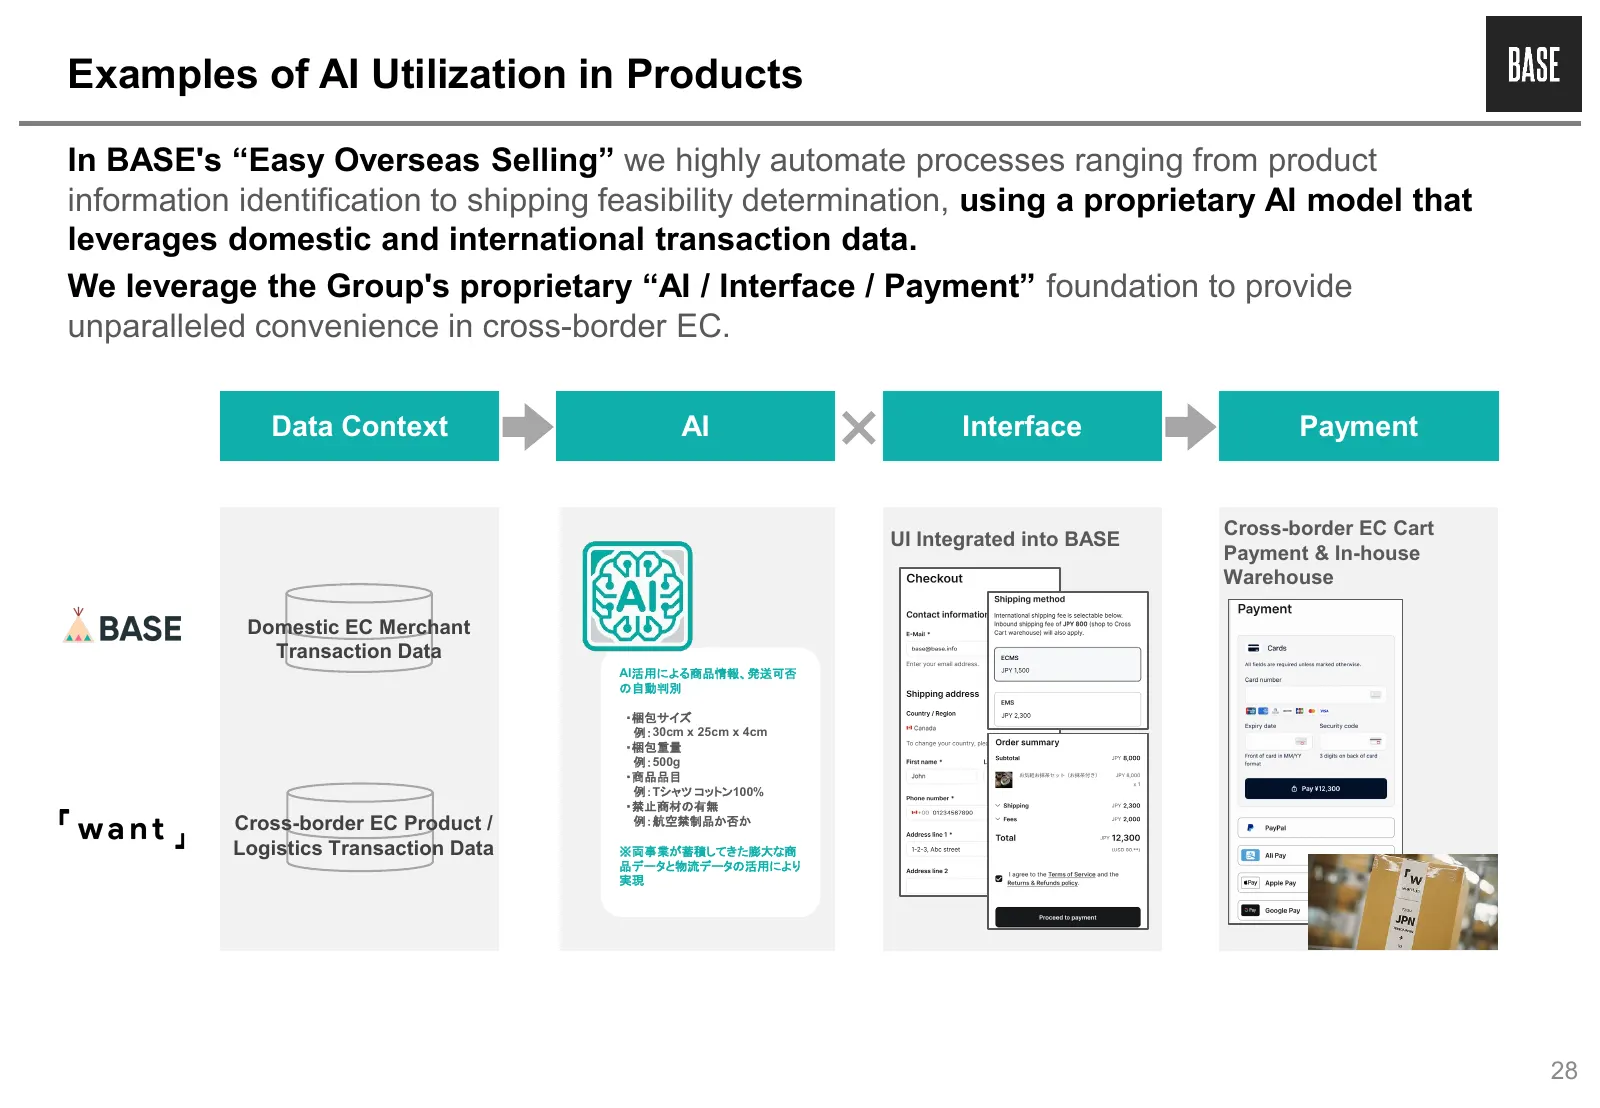
Examples of AI Utilization in Products In BASE's “Easy Overseas Selling” we highly automate processes ranging from product information identification to shipping feasibility determination, using a proprietary AI model that leverages domestic and international transaction data. We leverage the Group'
Slide 29: Creation of Group Synergies
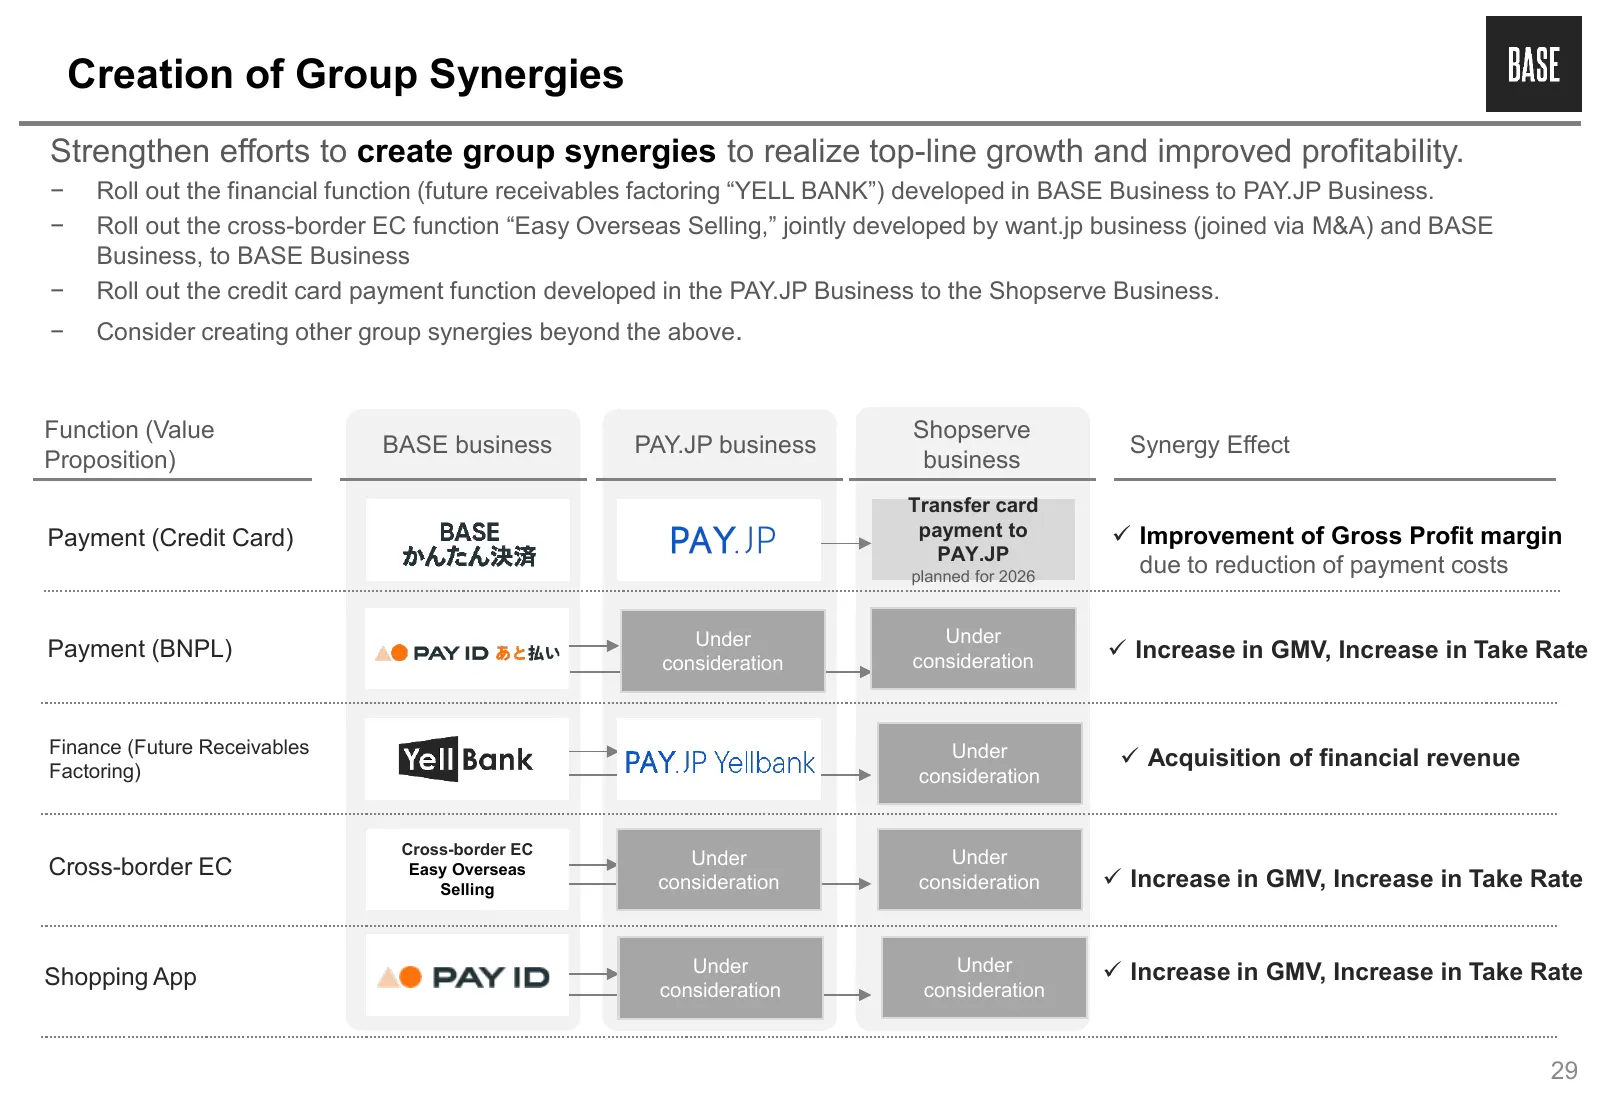
Creation of Group Synergies Strengthen efforts to create group synergies to realize top-line growth and improved profitability. − Roll out the financial function (future receivables factoring “YELL BANK”) developed in BASE Business to PAY.JP Business. − Roll out the cross-border EC function “Easy Ov
Slide 30: Discontinuous (Inorganic) Growth through M&A and Alliances
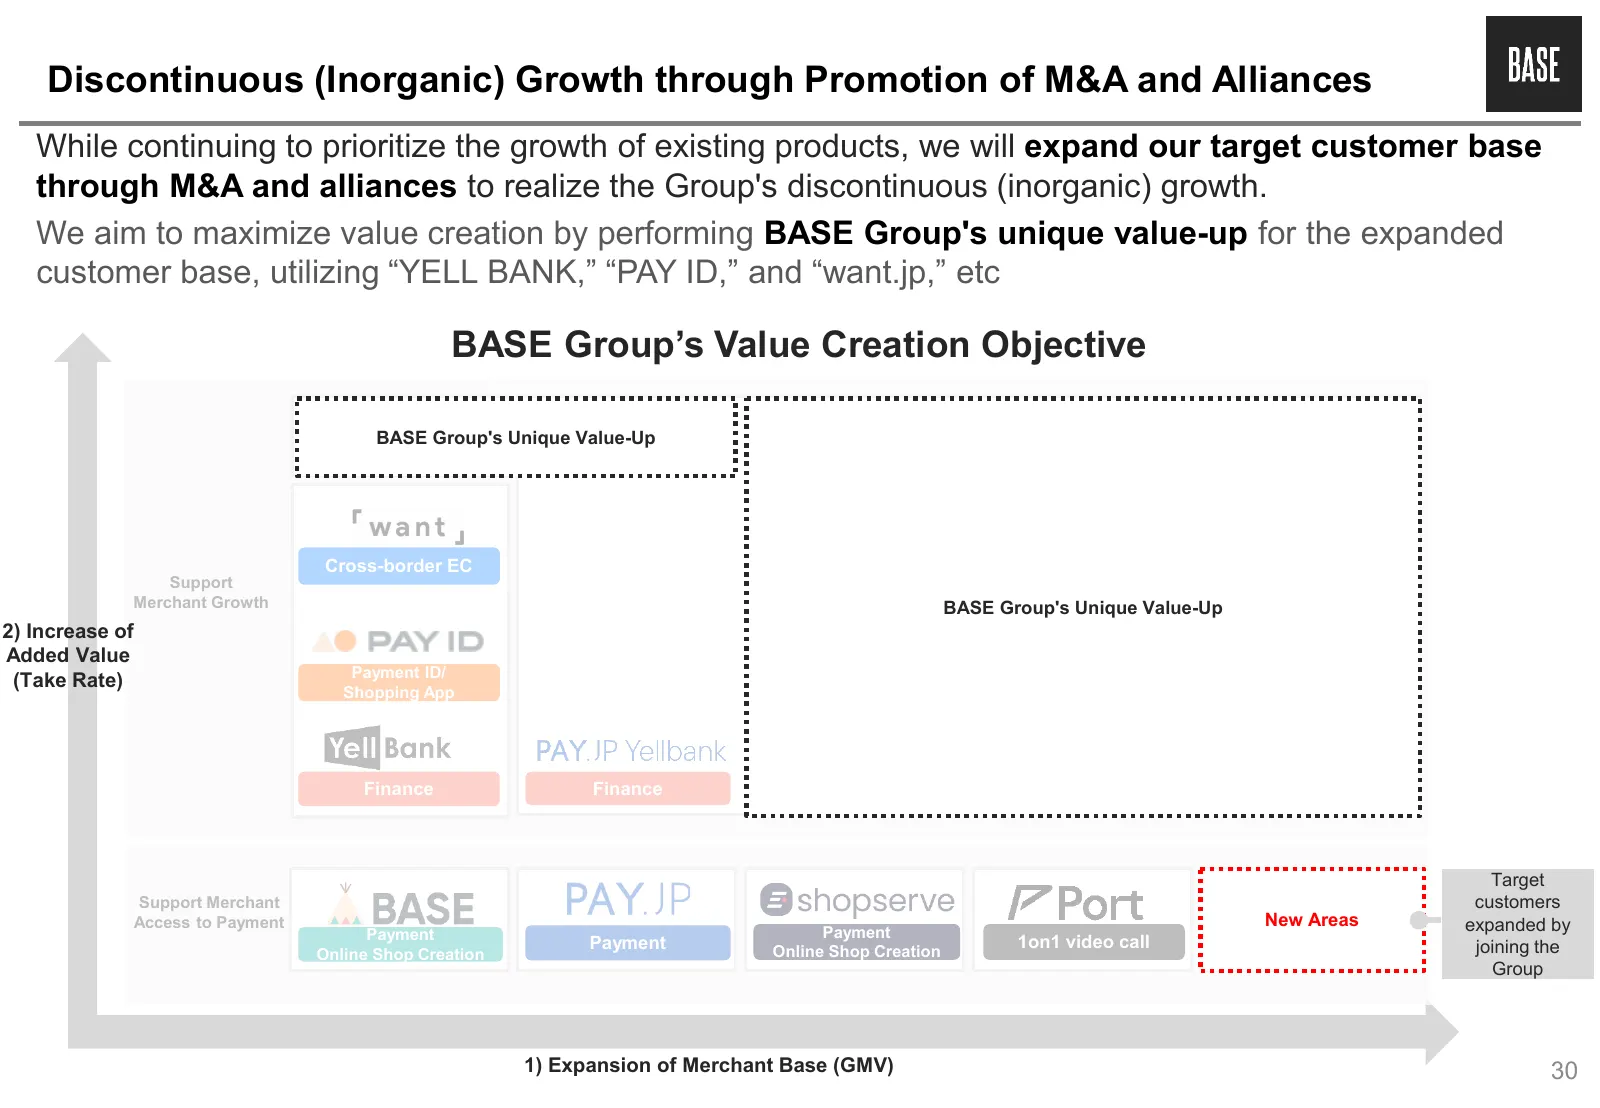
Discontinuous (Inorganic) Growth through Promotion of M&A and Alliances While continuing to prioritize the growth of existing products, we will expand our target customer base through M&A and alliances to realize the Group's discontinuous (inorganic) growth. We aim to maximize value creation by perf
Slide 31: Areas Under Consideration for M&A
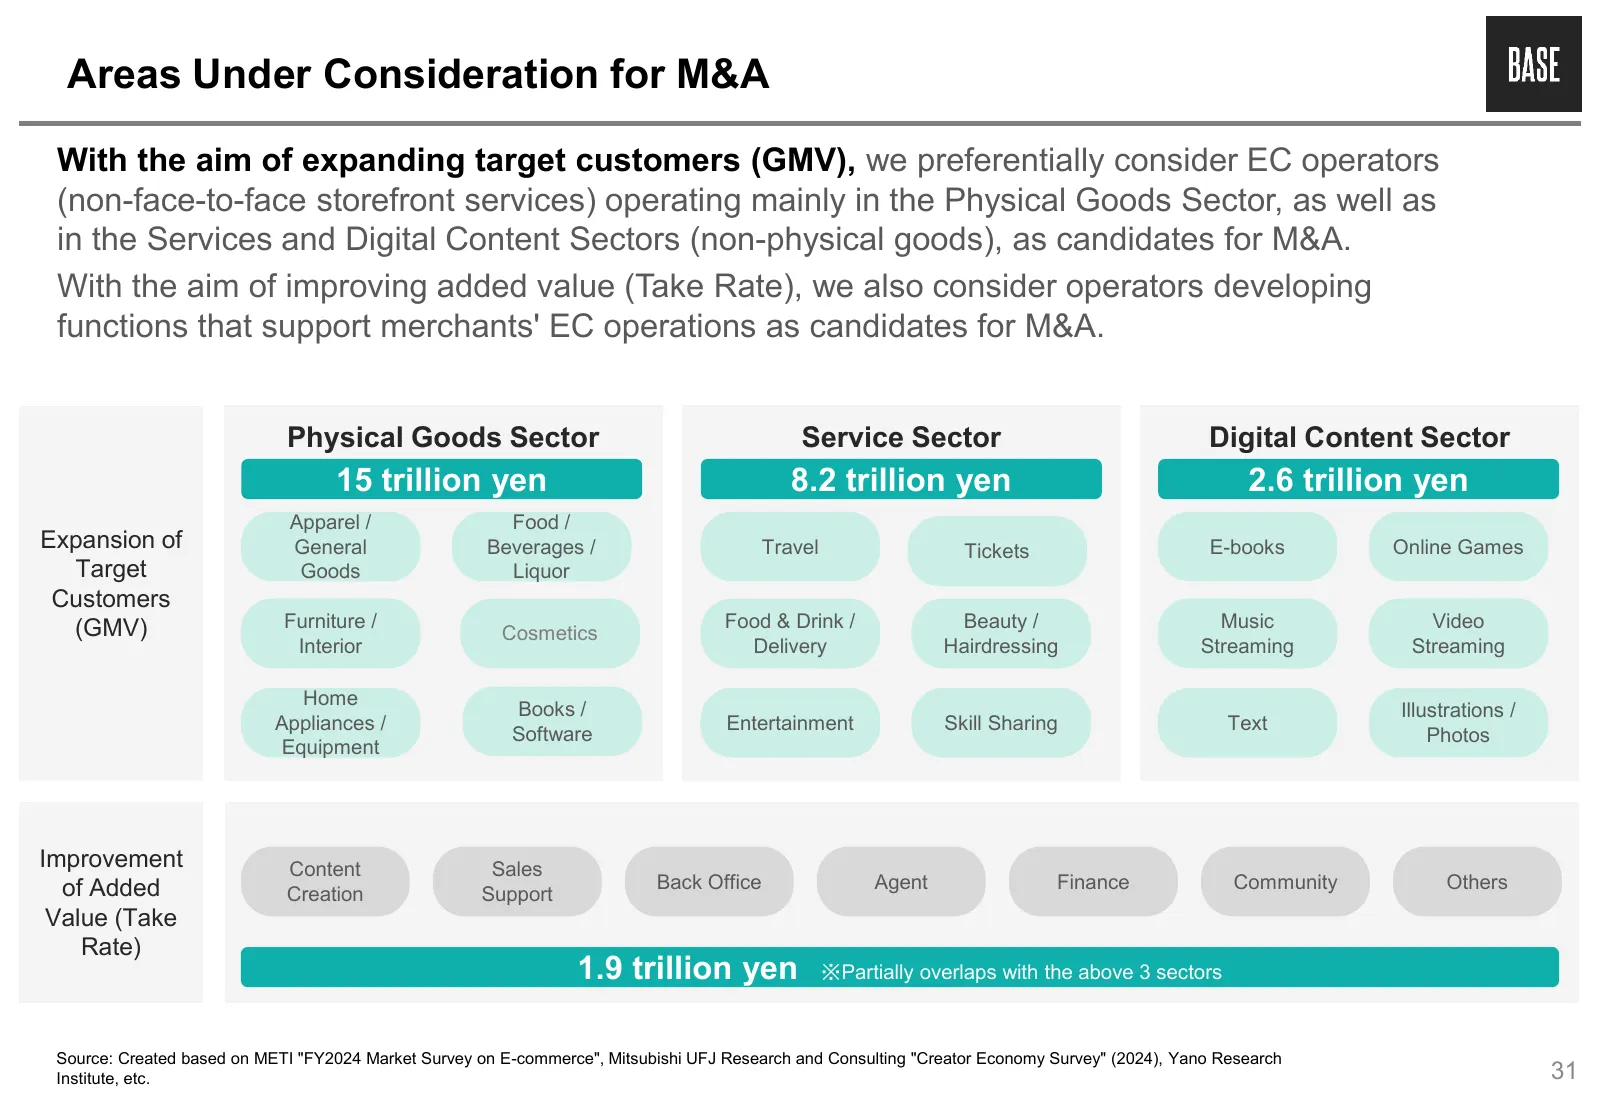
Areas Under Consideration for M&A With the aim of expanding target customers (GMV), we preferentially consider EC operators (non-face-to-face storefront services) operating mainly in the Physical Goods Sector, as well as in the Services and Digital Content Sectors (non-physical goods), as candidates
Slide 32: Policies for FY2026
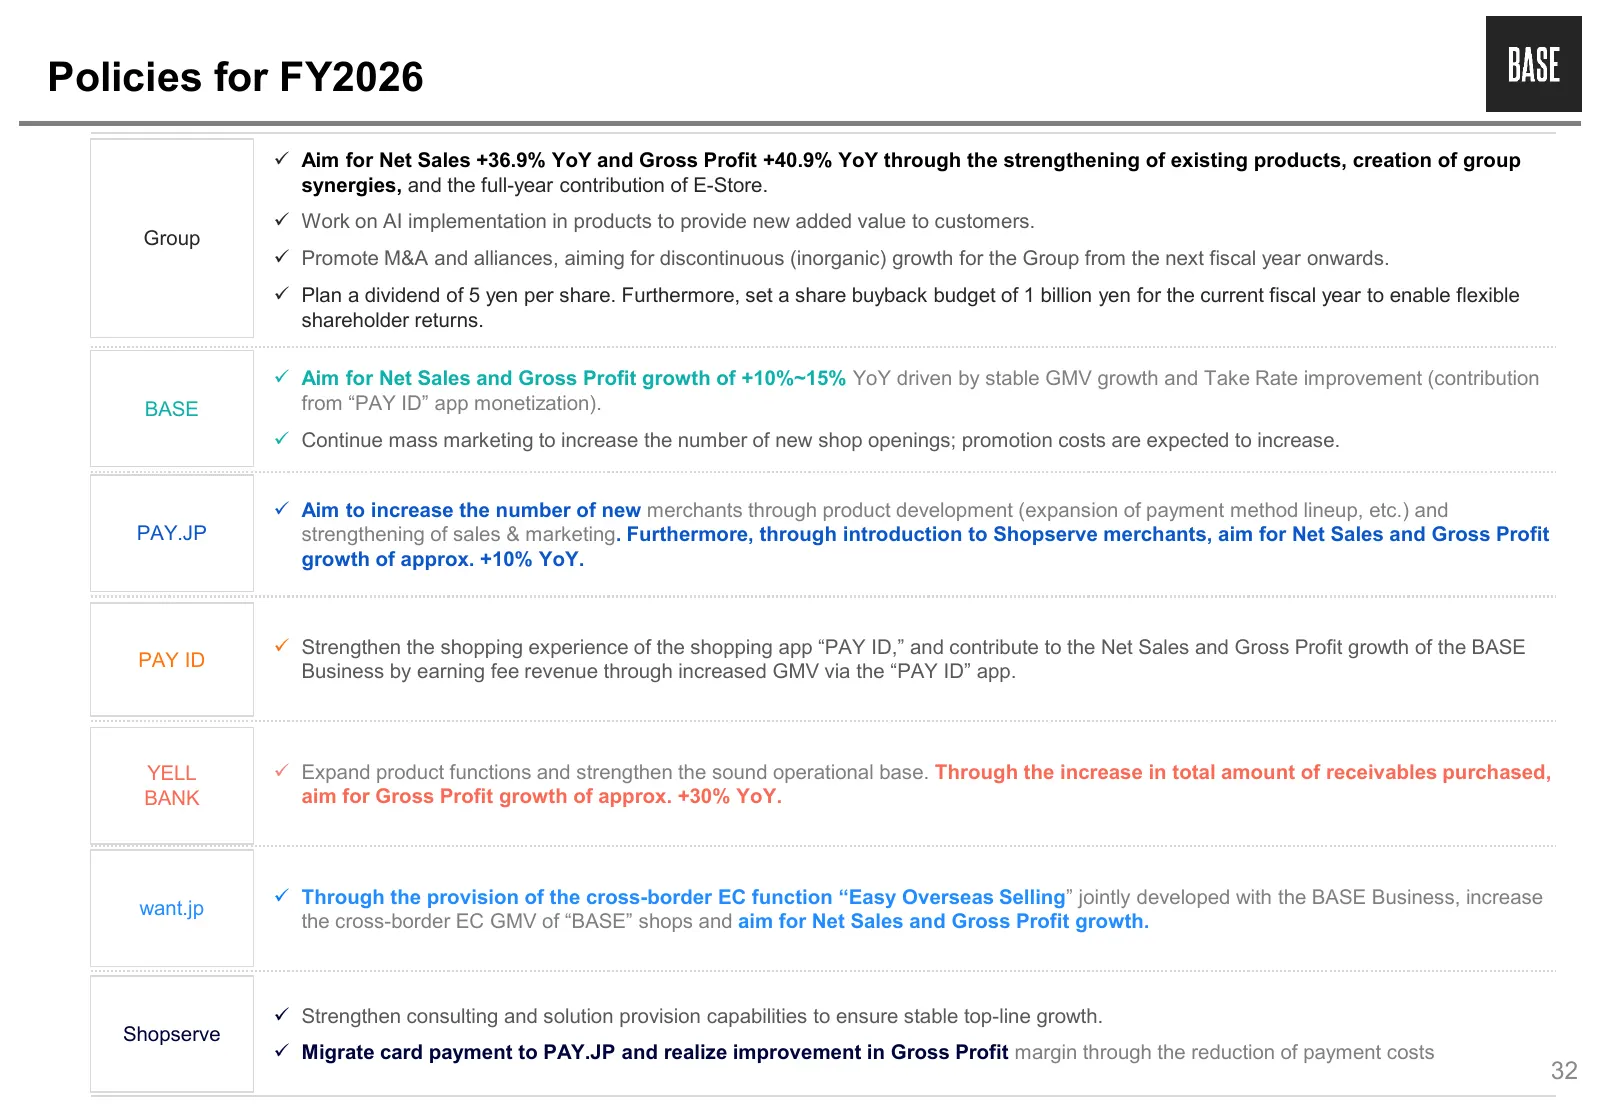
Policies for FY2026 Aim for Net Sales +36.9% YoY and Gross Profit +40.9% YoY through the strengthening of existing products, creation of group synergies, and the full-year contribution of E-Store. Work on AI implementation in products to provide new added value to customers. Group Promote M&A
Slide 33: FY2026 Full-Year Earnings Forecast
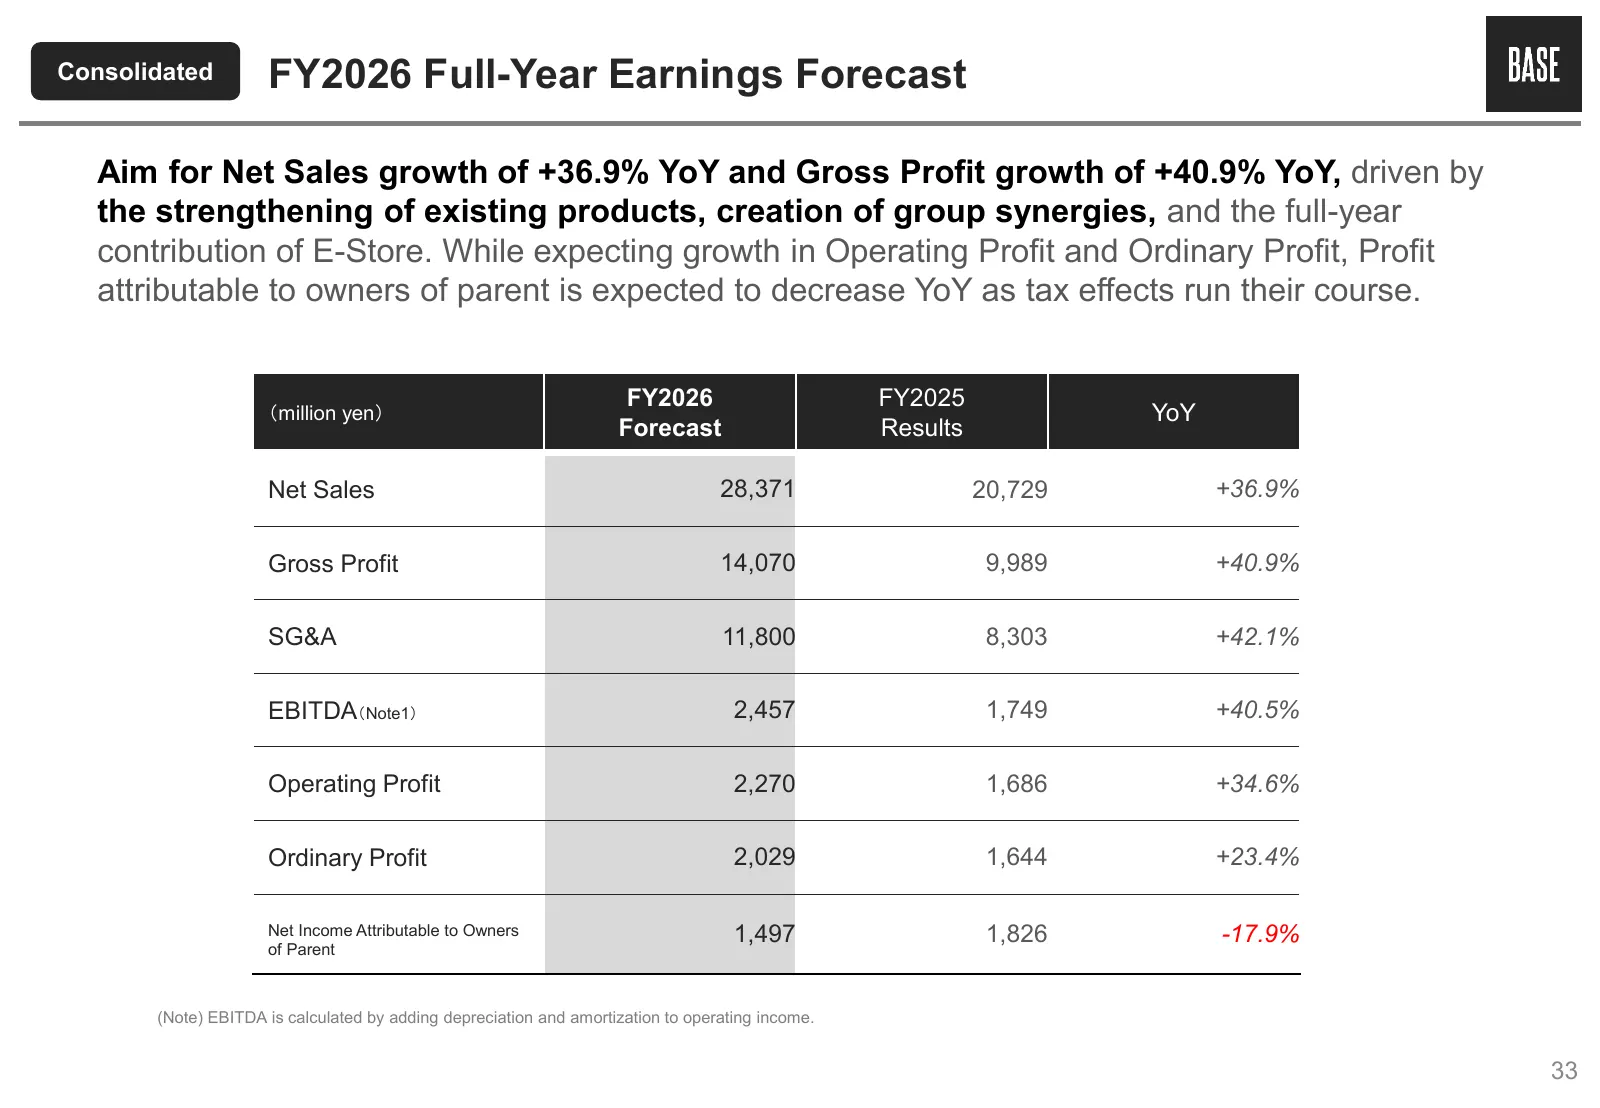
Consolidated FY2026 Full-Year Earnings Forecast Aim for Net Sales growth of +36.9% YoY and Gross Profit growth of +40.9% YoY, driven by the strengthening of existing products, creation of group synergies, and the full-year contribution of E-Store. While expecting growth in Operating Profit and Ordin
Slide 34: Shareholder Return Policy
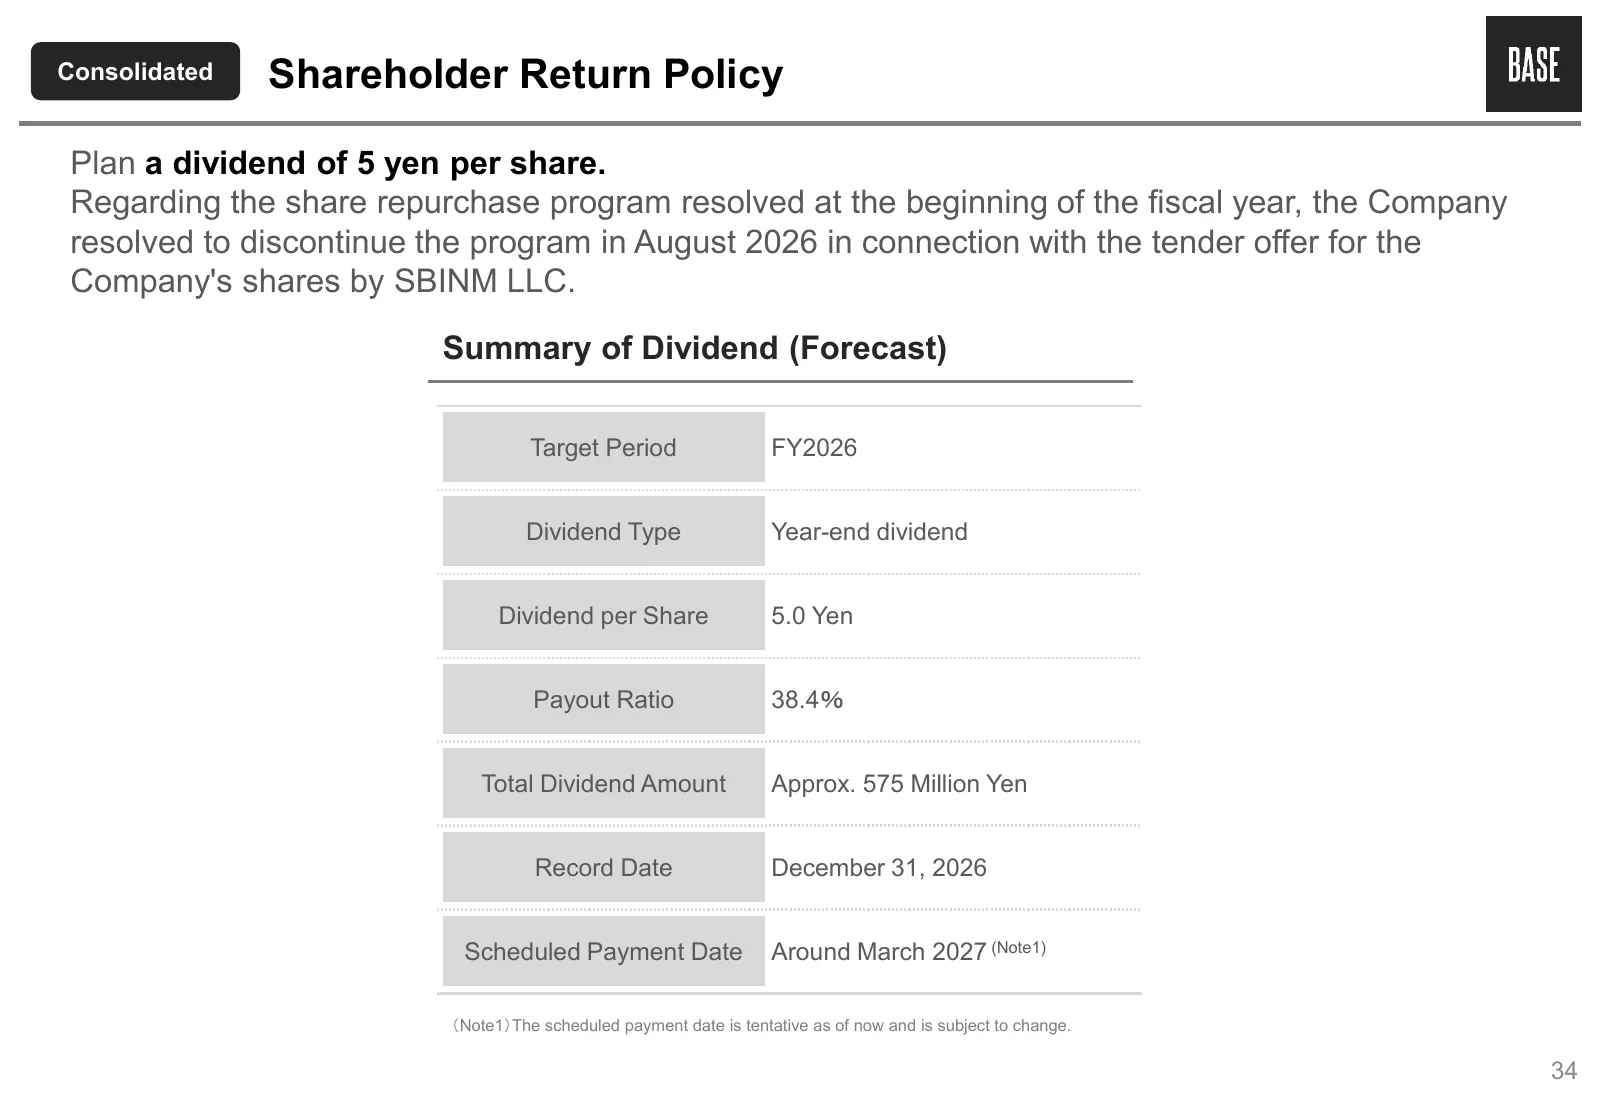
Consolidated Shareholder Return Policy Plan a dividend of 5 yen per share. Regarding the share repurchase program resolved at the beginning of the fiscal year, the Company resolved to discontinue the program in August 2026 in connection with the tender offer for the Company's shares by SBINM LLC. Su
Slide 35: Initiatives to Further Strengthen the Corporate Governance Structure
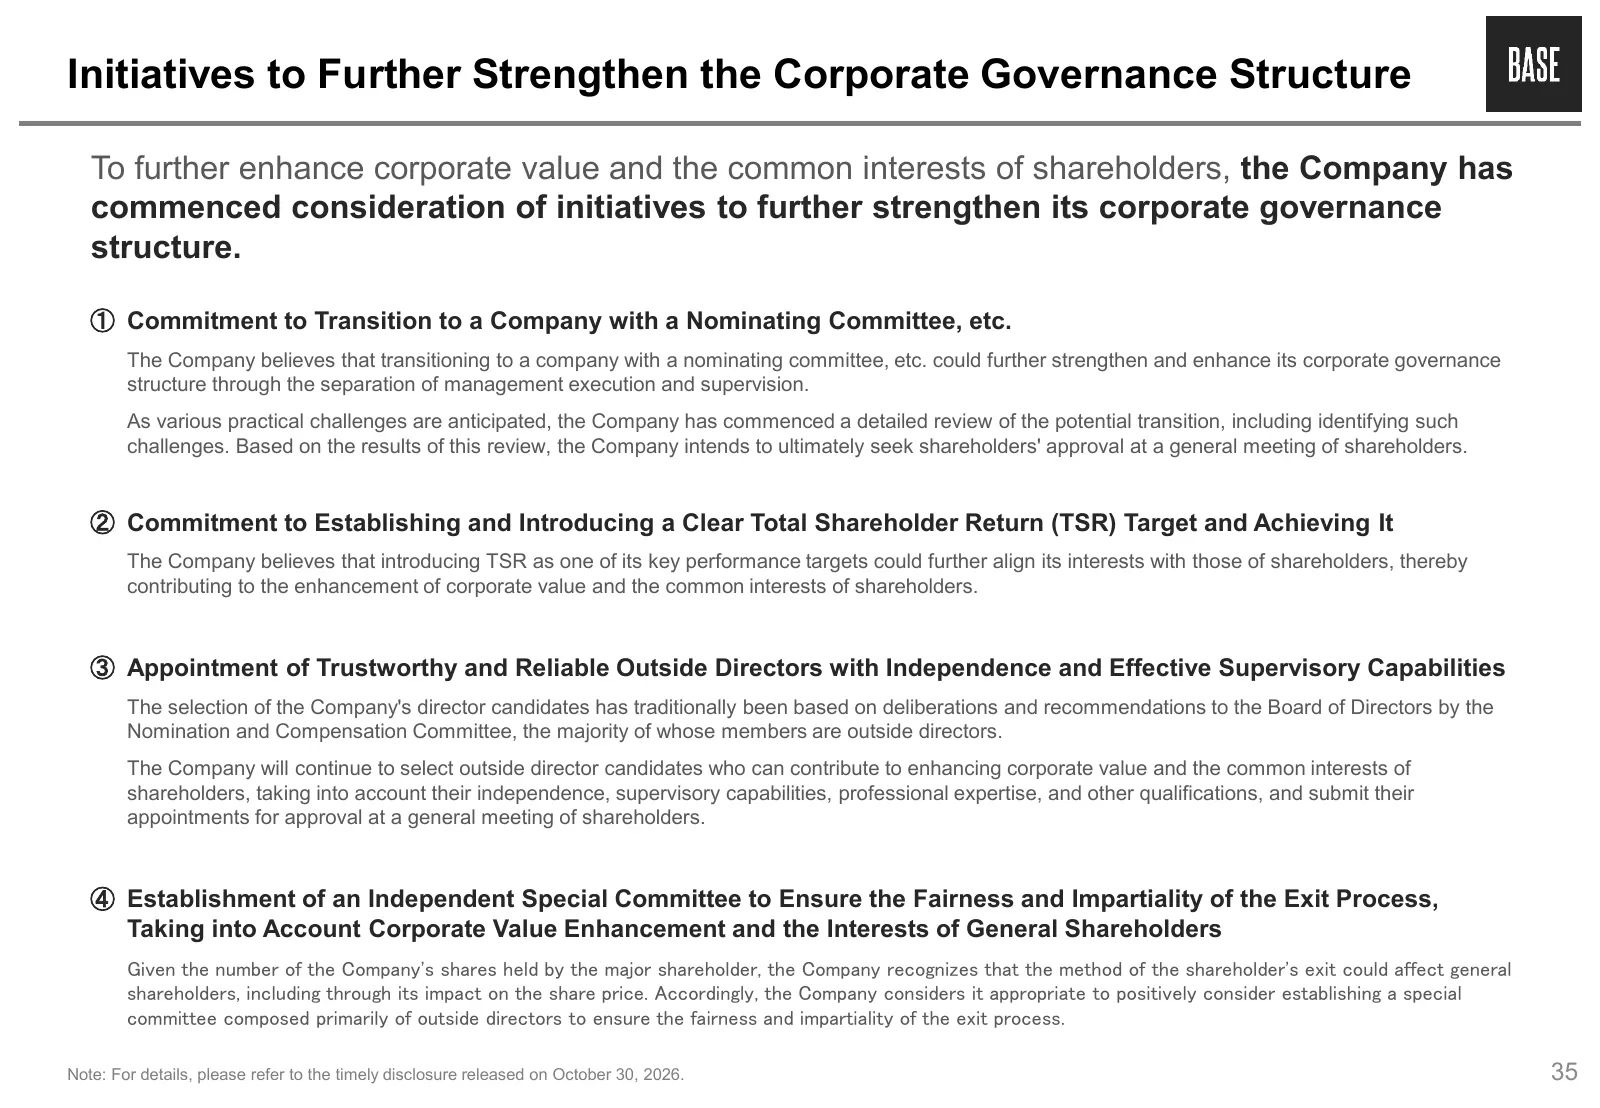
Initiatives to Further Strengthen the Corporate Governance Structure To further enhance corporate value and the common interests of shareholders, the Company has commenced consideration of initiatives to further strengthen its corporate governance structure. ① Commitment to Transition to a Company w
Slide 36: Handling of these Materials
Handling of these Materials This document has been prepared by BASE, Inc. (the “Company”) solely for information purpose only. This document does not constitute or form part of and should not be construed as, an offer to sell or issue or the solicitation of an offer to buy or acquire securities of t
Slide 37
Source: TDnet disclosure via 6ix News