Rumo SA · BMFBOVESPA:RAIL3
Rumo SA — Rumo ALL — Investor Presentation (November 2015)
41 slides from Rumo SA's investor presentation, November 2015

Slide 1: Rumo ALL Institutional Presentation 2015
RUMO ALL INSTITUTIONAL PRESENTATION 2015
Slide 2: Disclaimer
2 Disclaimer This presentation contains estimates and forward-looking statements regarding our strategy and opportunities for future growth. Such information is mainly based on our current expectations and estimates or projections of future events and trends, which affect or may affect our business
Slide 3: Rumo ALL Timeline
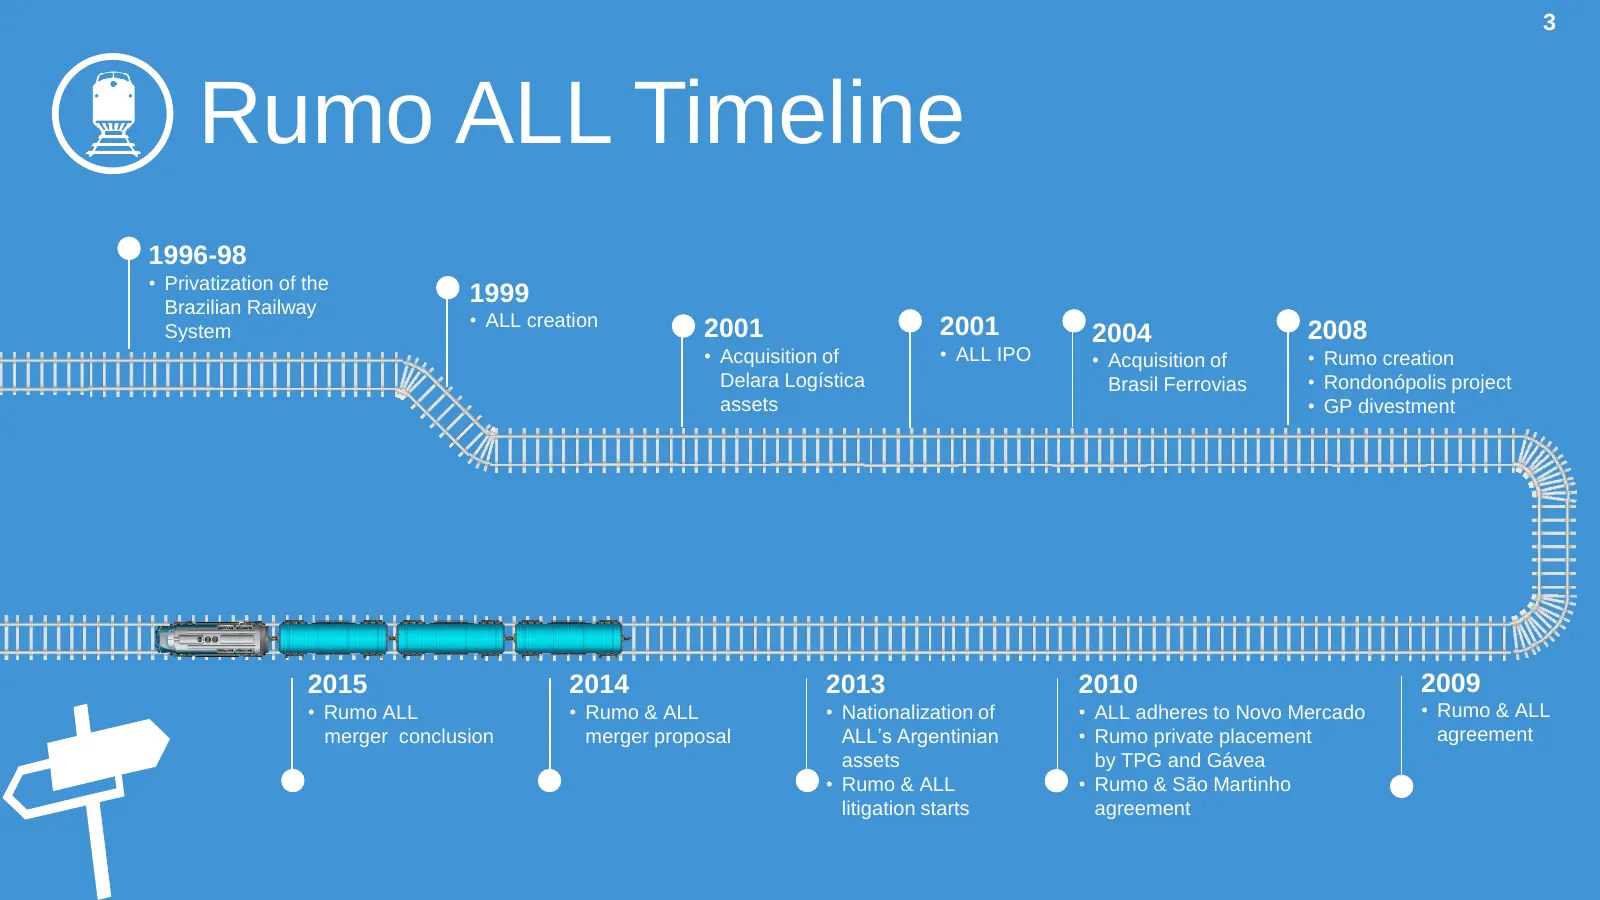
3 Rumo ALL Timeline 1996-98 • Privatization of the Brazilian Railway 1999 • ALL creation 2001 2001 System 2004 2008 • Acquisition of • ALL IPO • Acquisition of • Rumo creation Delara Logística Brasil Ferrovias • Rondonópolis project assets • GP divestment 2015 2014 2013 2010 2009 • Rumo ALL • Rumo &

Slide 4: Rumo ALL Assets
RUMO ALL ASSETS }=————
Slide 5: Railway Network
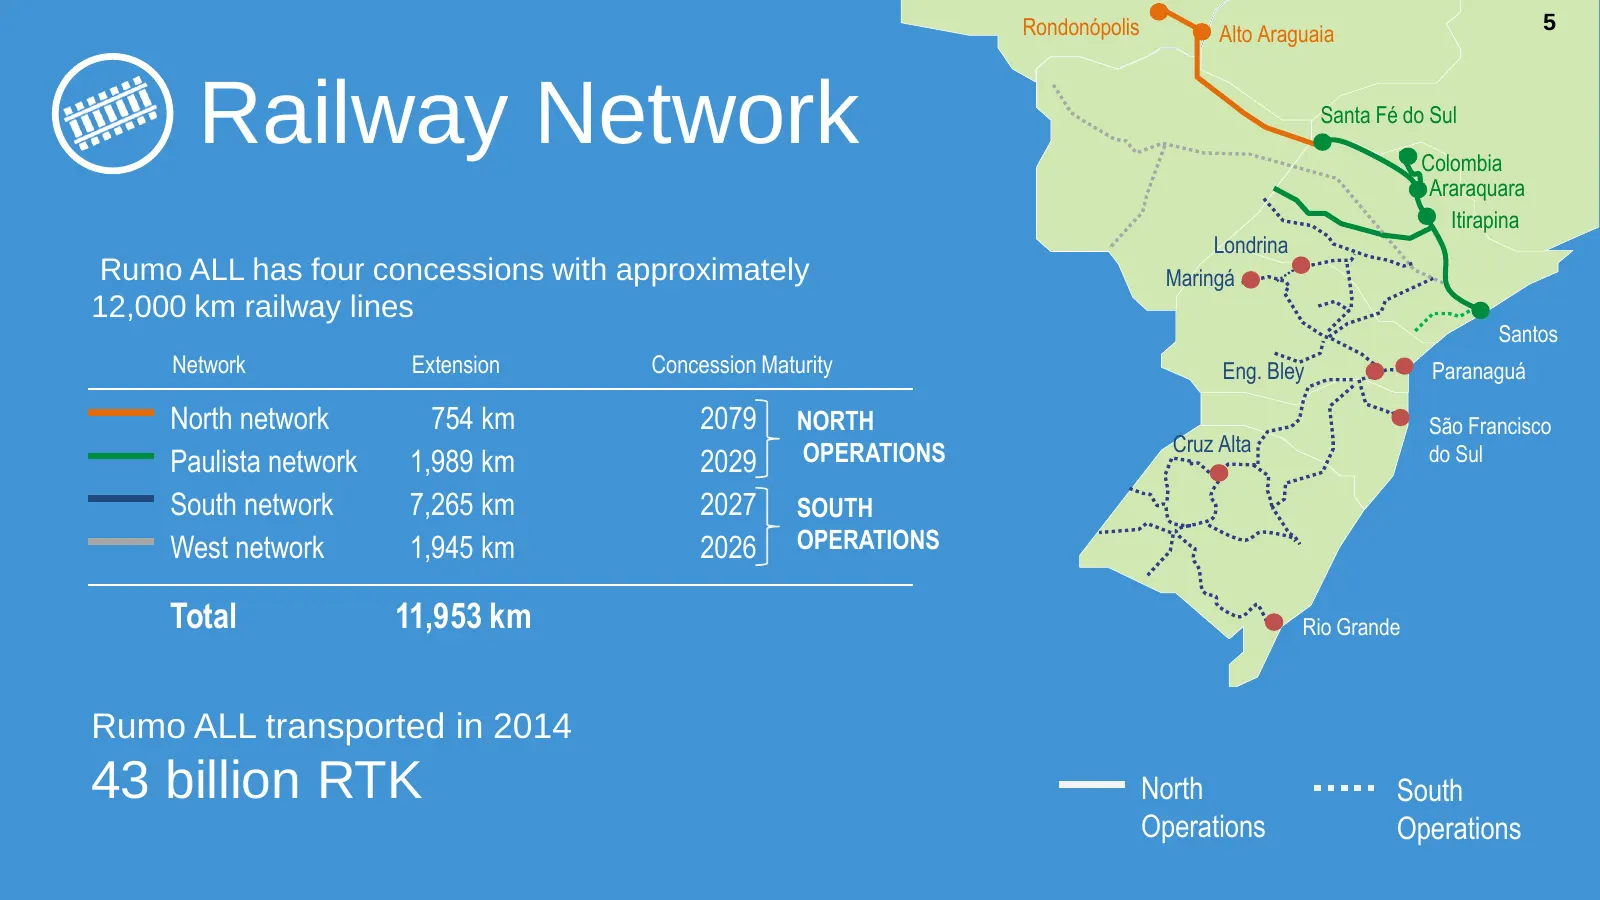
Rondonópolis Alto Araguaia 5 Railway Network Santa Fé do Sul Colombia Araraquara Itirapina Londrina Rumo ALL has four concessions with approximately Maringá 12,000 km railway lines Santos Network Extension Concession Maturity Eng. Bley Paranaguá North network 754 km 2079 NORTH São Francisco OPERATIO
Slide 6: Rolling Stock
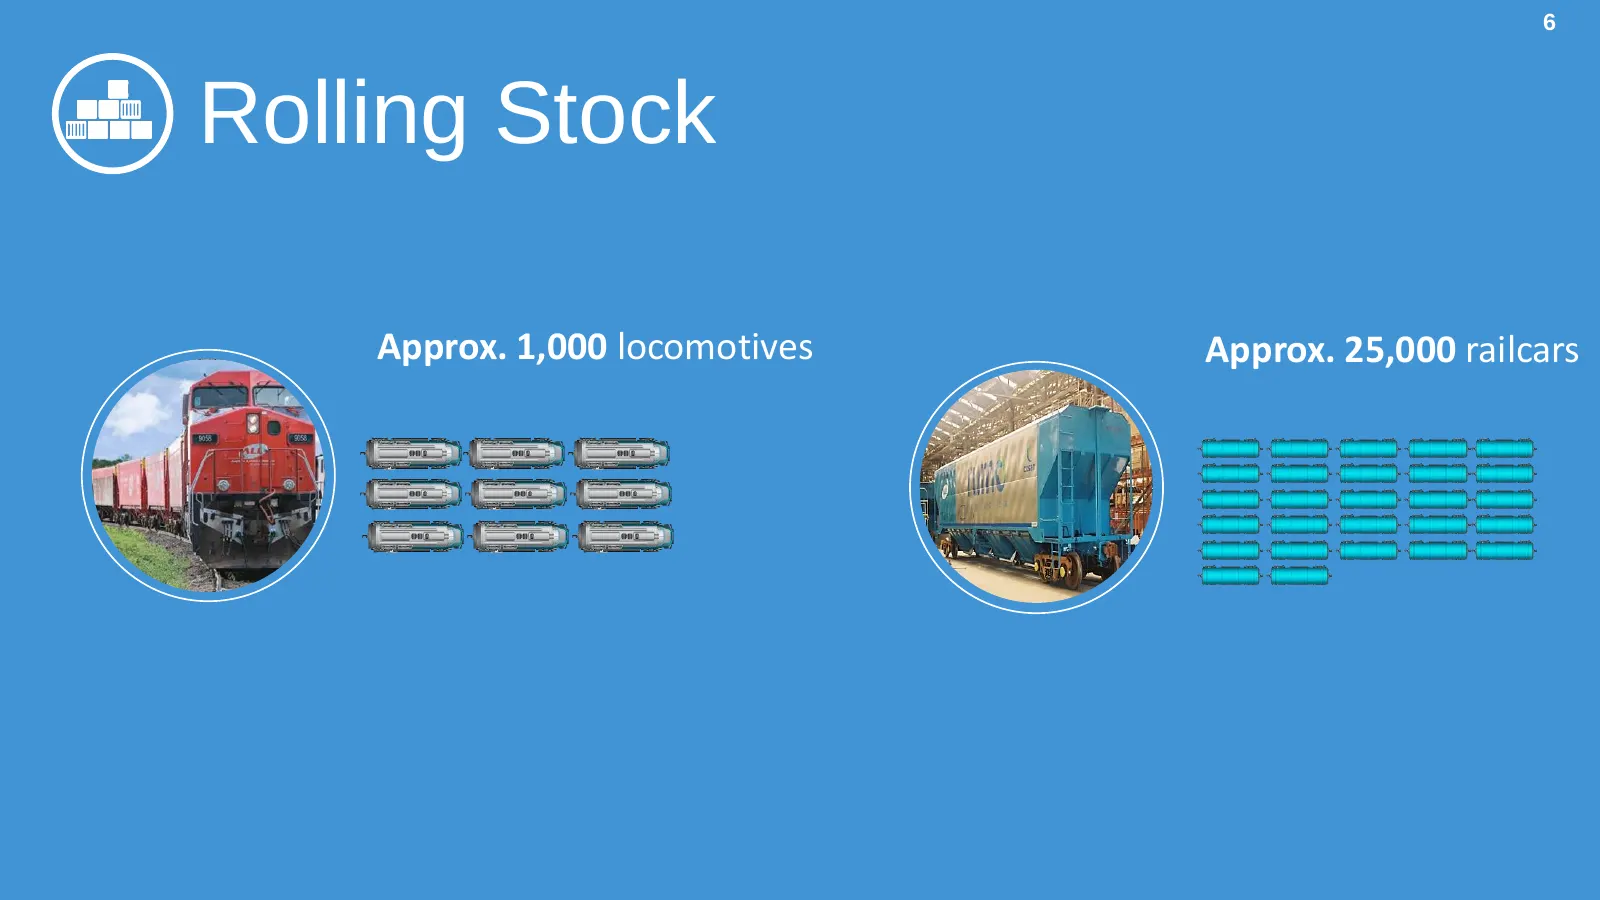
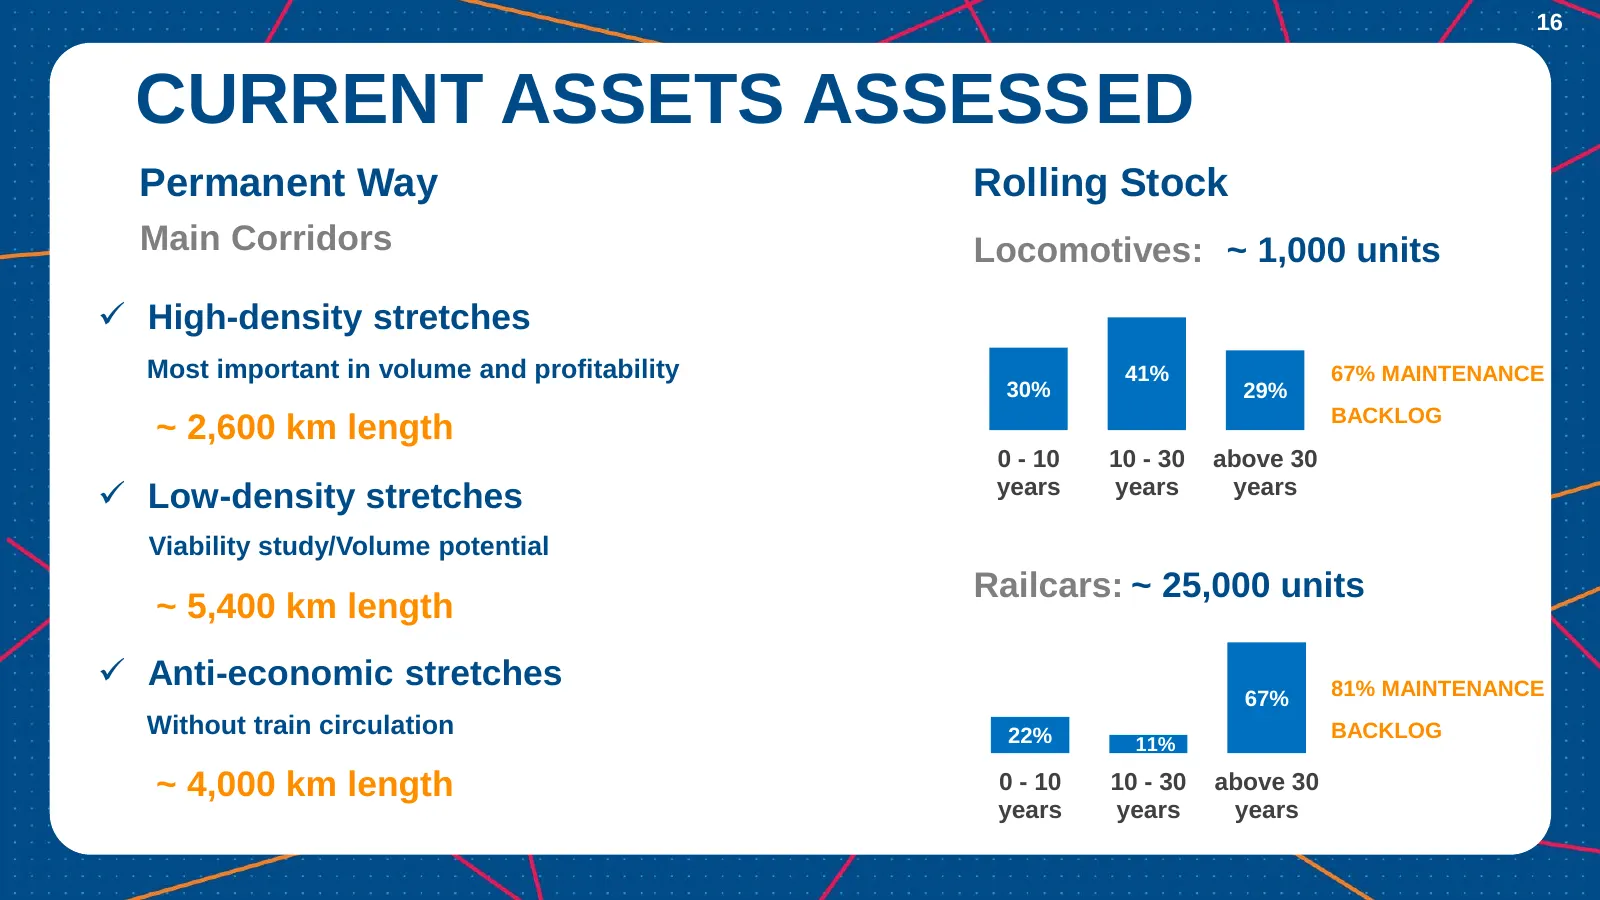
6 Rolling Stock Approx. 1,000 locomotives Approx. 25,000 railcars
Slide 7: Port and Inland Terminals
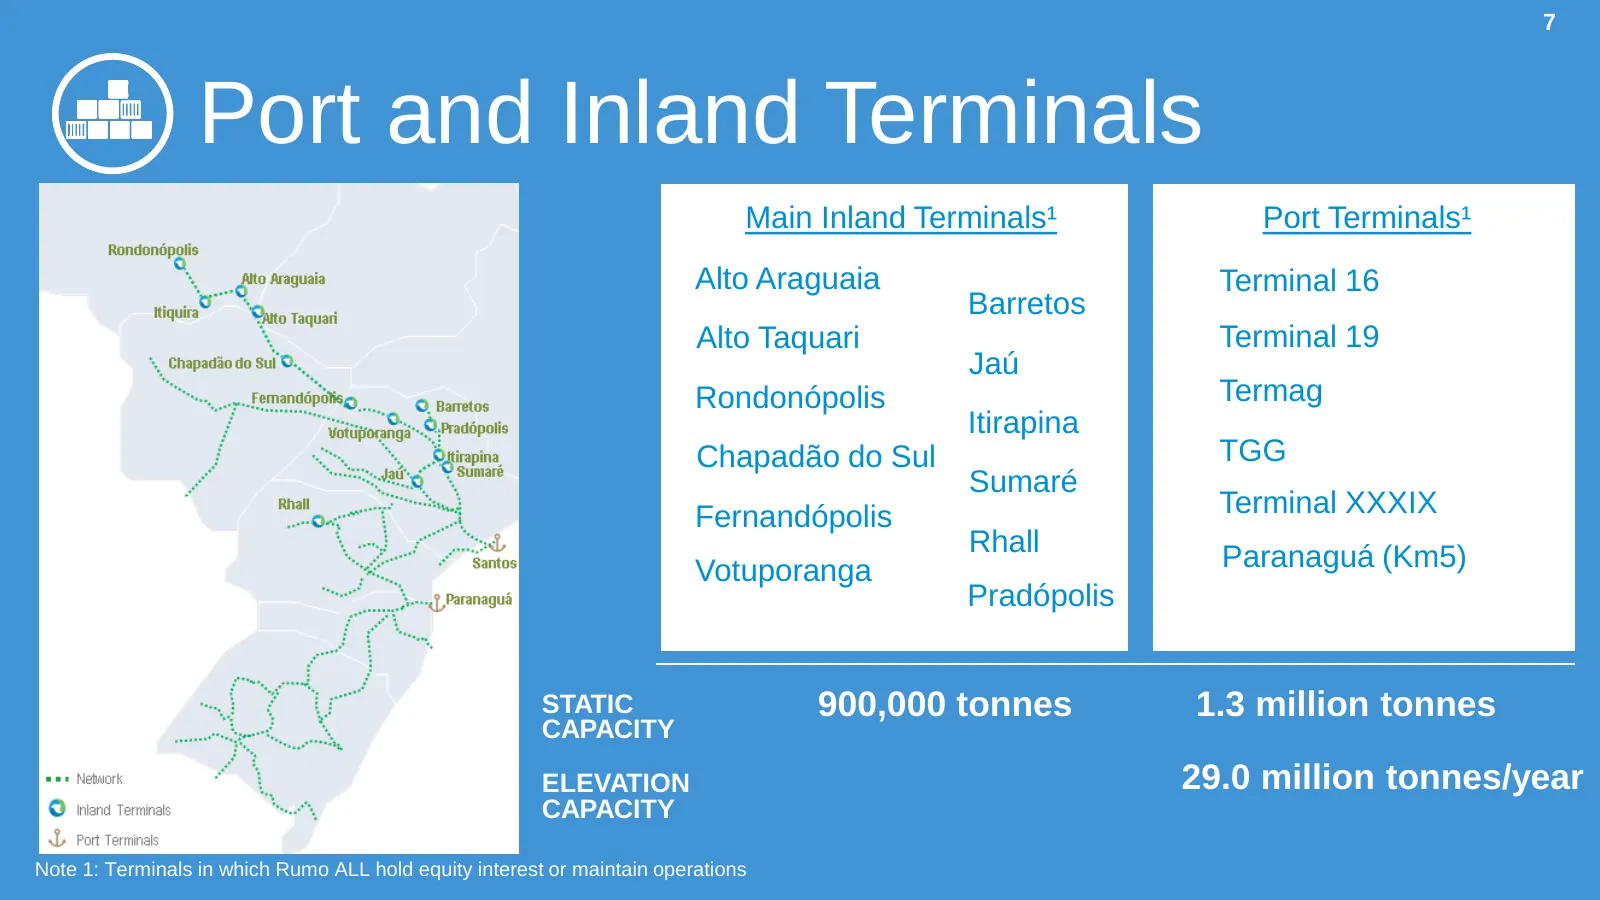
7 Port and Inland Terminals Main Inland Terminals¹ Port Terminals¹ Alto Araguaia Terminal 16 Barretos Alto Taquari Terminal 19 Jaú Rondonópolis Termag Itirapina Chapadão do Sul TGG Sumaré Fernandópolis Terminal XXXIX Rhall Paranaguá (Km5) Votuporanga Pradópolis STATIC 900,000 tonnes 1.3 million tonn

Slide 8: Governance
GOVERNANCE UU
Slide 9: Ownership Structure
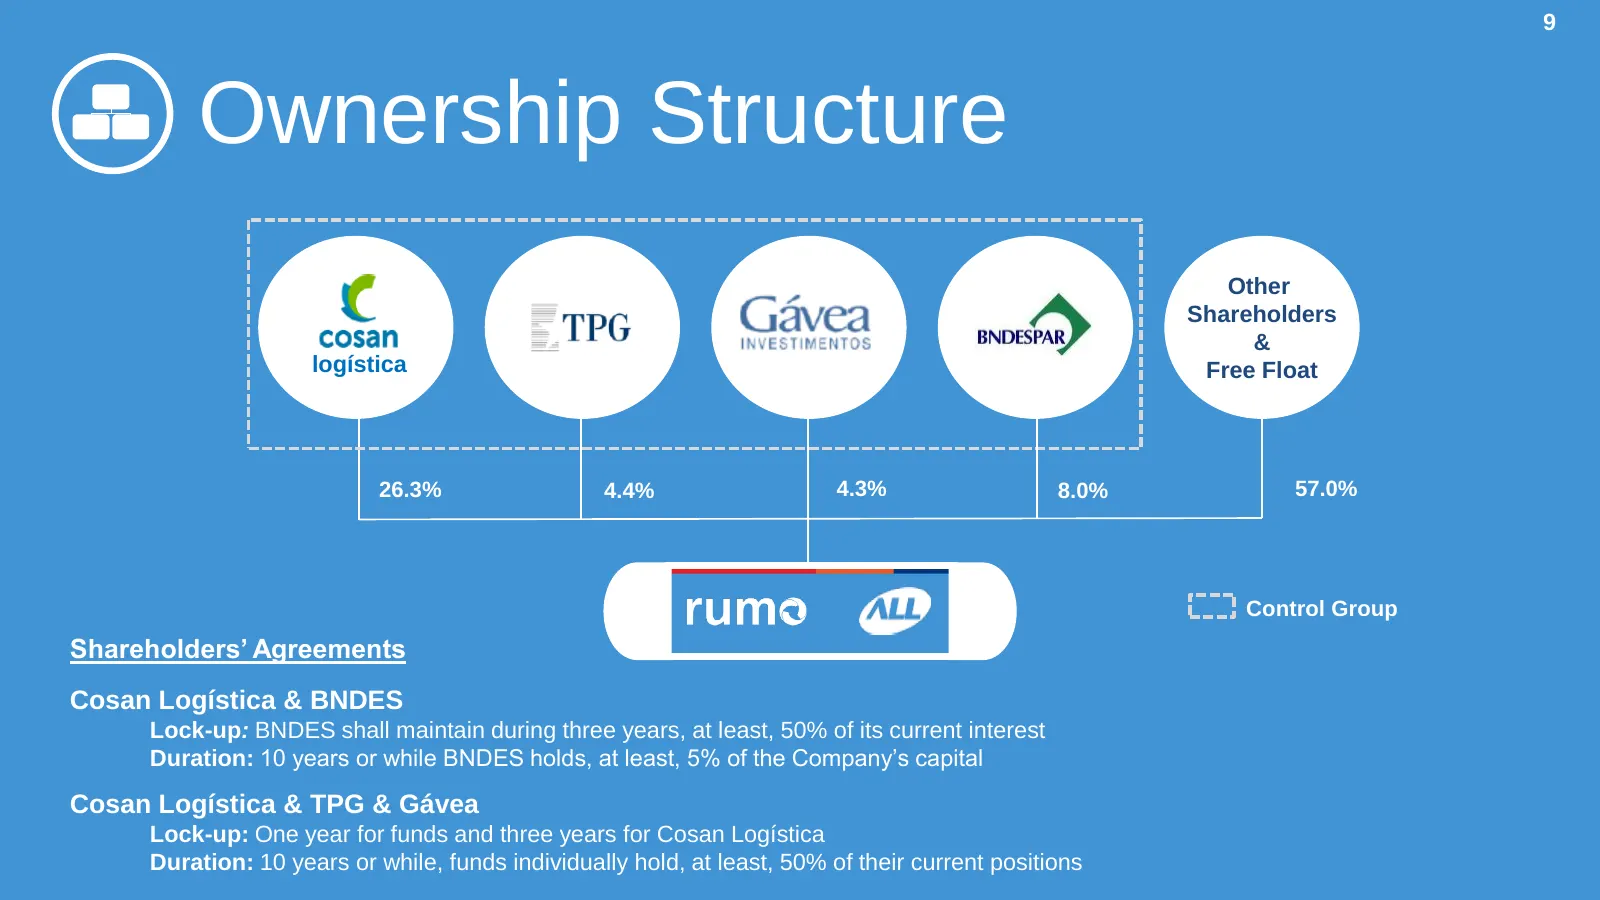
9 . . . Ownership Structure Other Shareholders & logística Free Float 26.3% 4.4% 4.3% 8.0% 57.0% Control Group Shareholders’ Agreements Cosan Logística & BNDES Lock-up: BNDES shall maintain during three years, at least, 50% of its current interest Duration: 10 years or while BNDES holds, at least, 5
Slide 10: Management
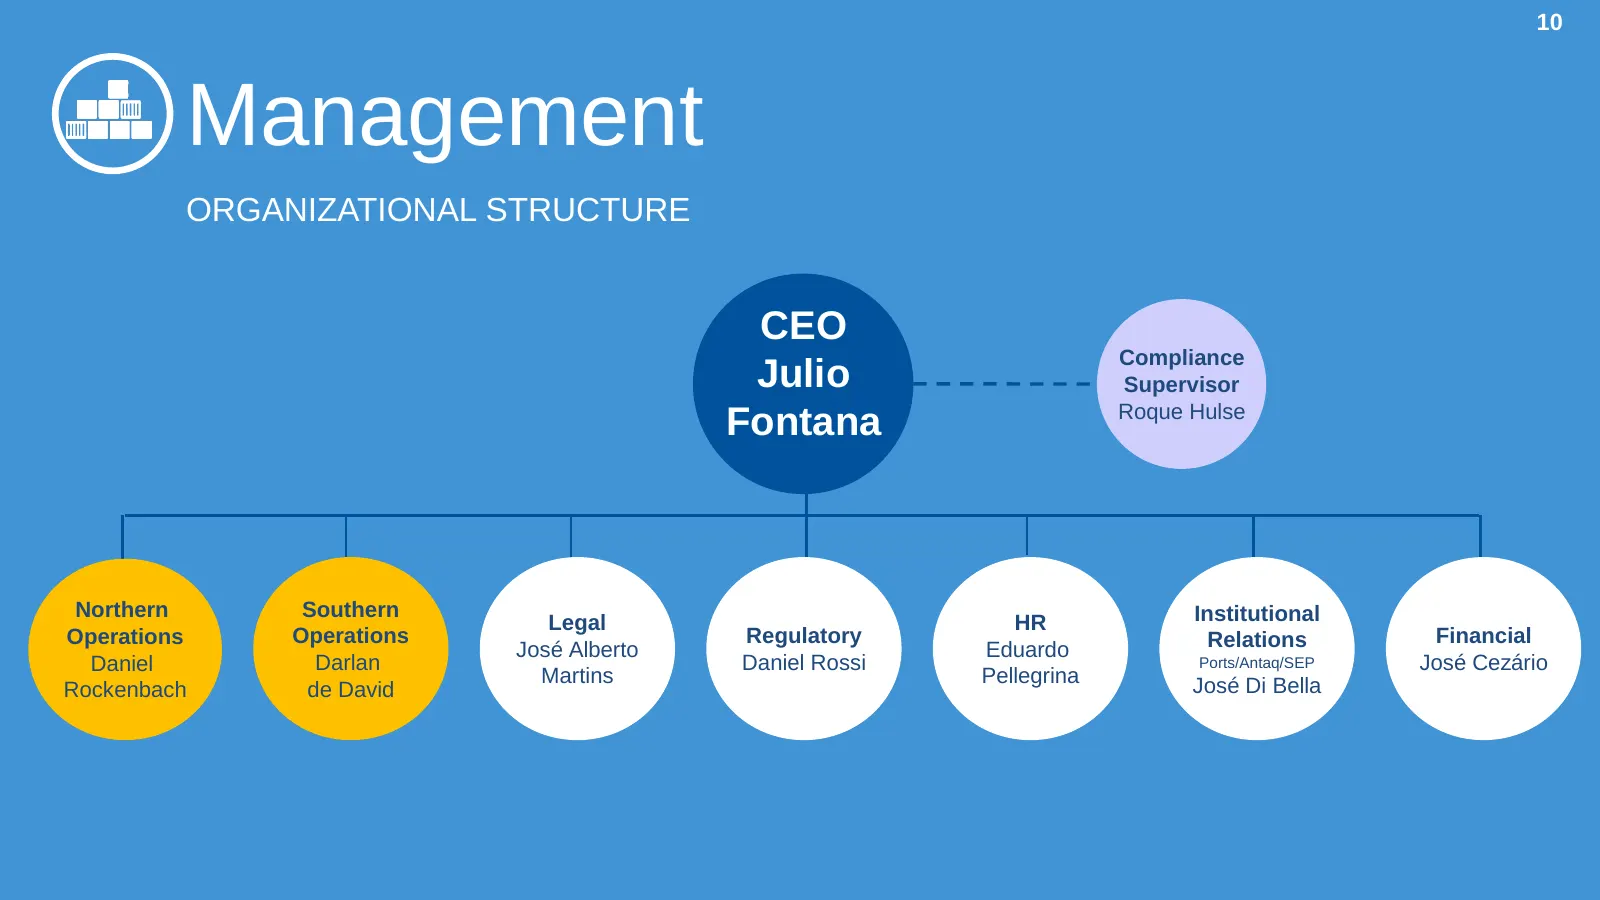
10 Management ORGANIZATIONAL STRUCTURE CEO Compliance Julio Supervisor Roque Hulse Fontana Northern Southern Institutional Legal HR Operations Operations Regulatory Relations Financial José Alberto Eduardo Daniel Darlan Daniel Rossi Ports/Antaq/SEP José Cezário Martins Pellegrina José Di Bella Rocke
Slide 11: Business Units
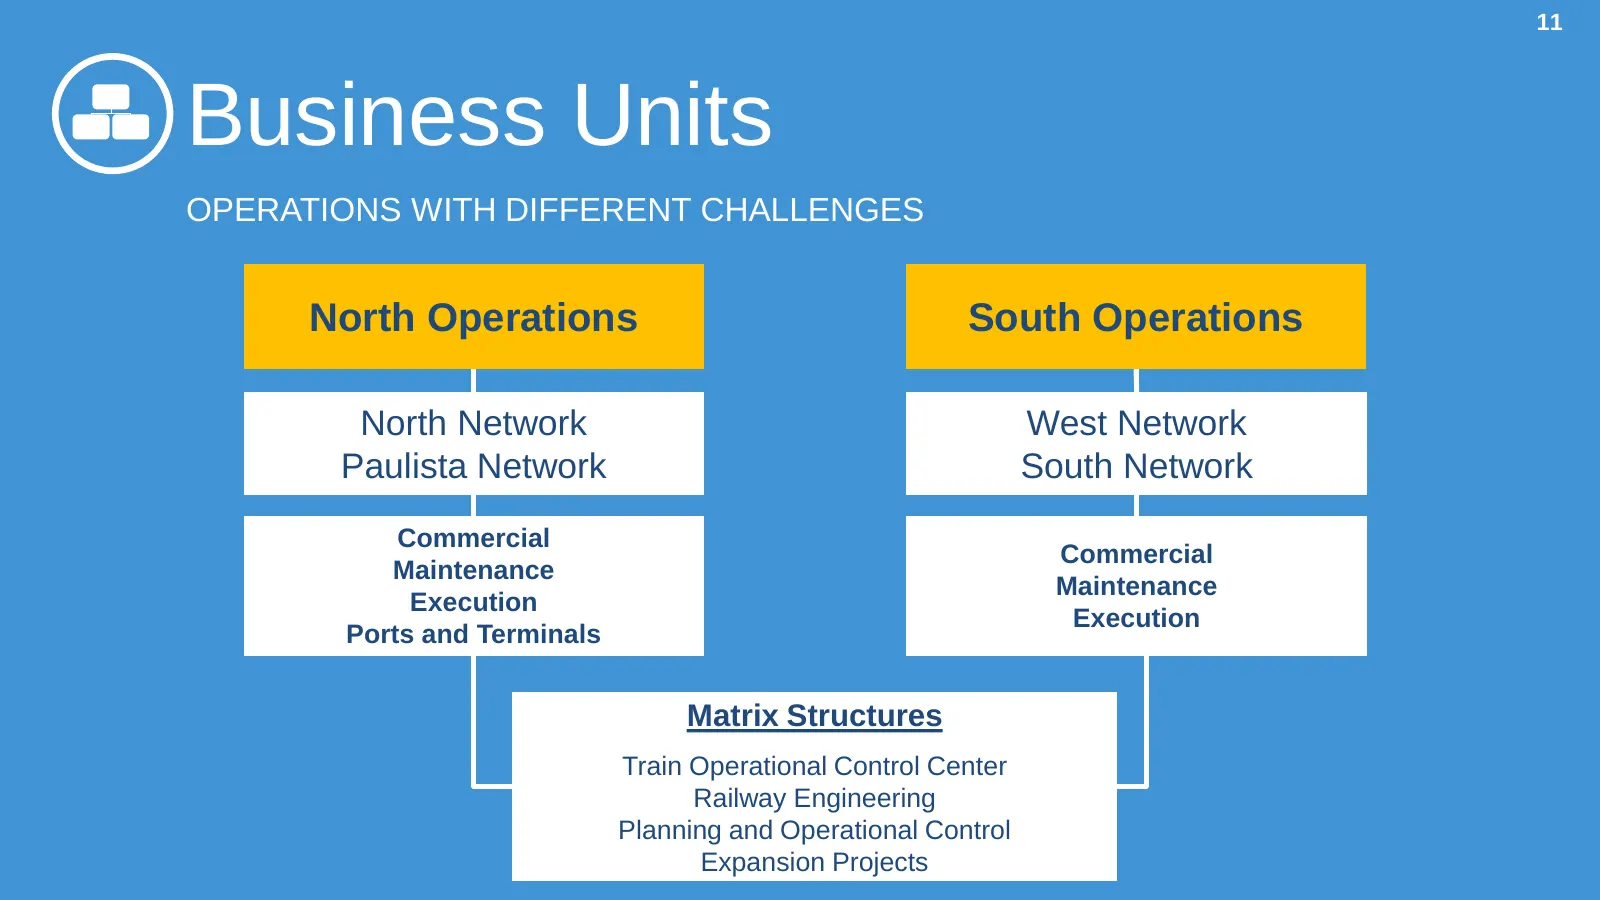
11 . . . Business Units OPERATIONS WITH DIFFERENT CHALLENGES North Operations South Operations North Network West Network Paulista Network South Network Commercial Commercial Maintenance Maintenance Execution Execution Ports and Terminals Matrix Structures Train Operational Control Center Railway En
Slide 12: Governance
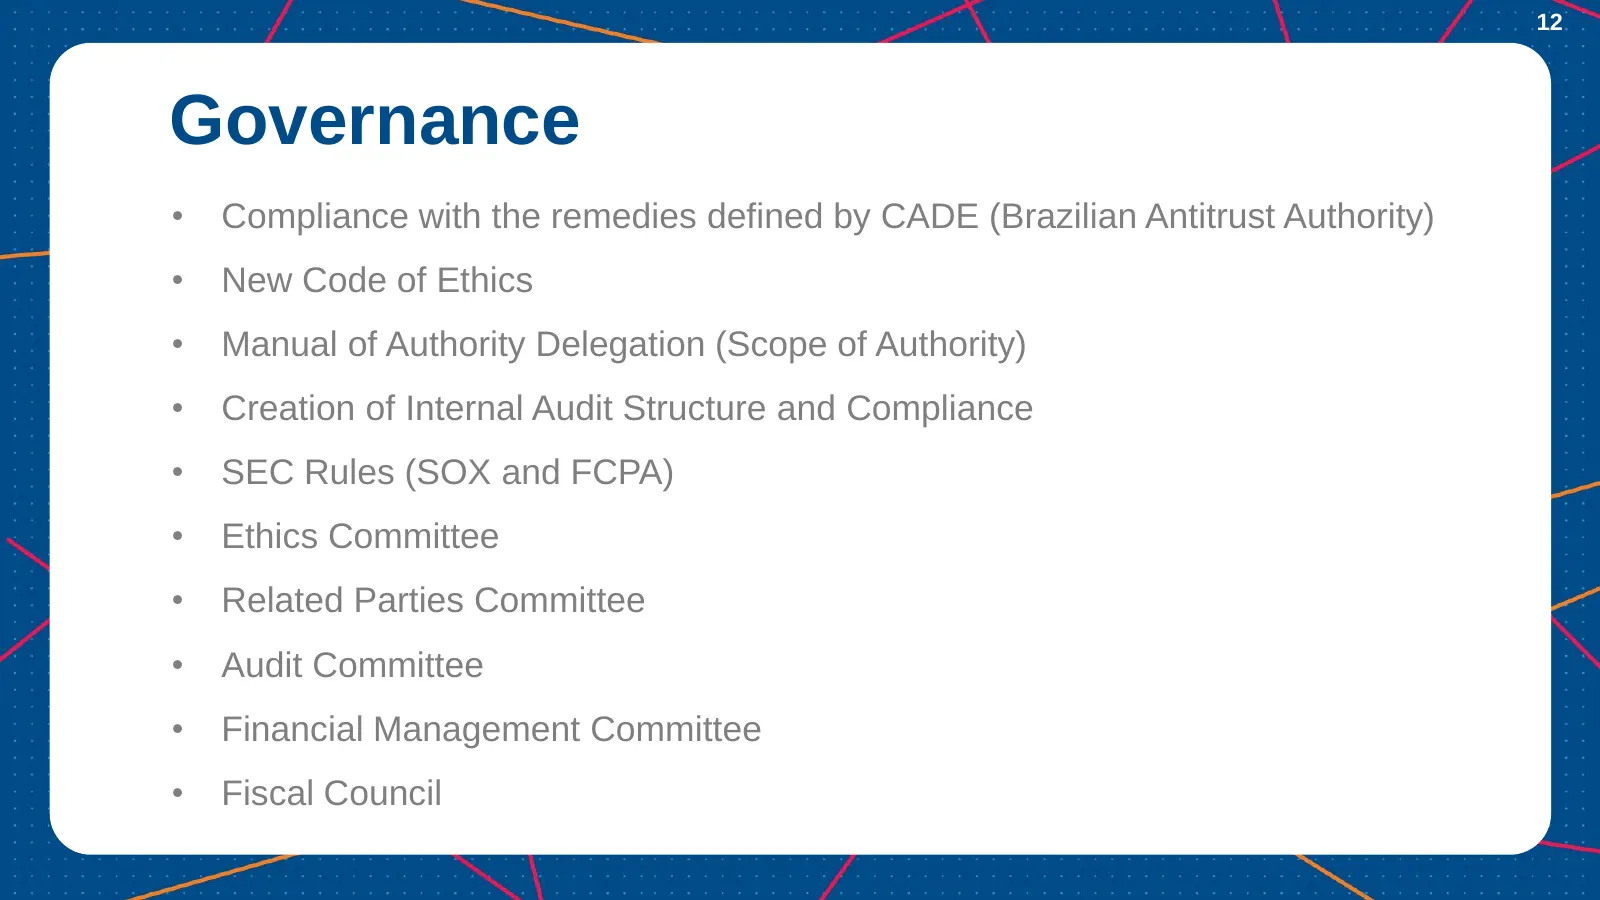
12 Governance • Compliance with the remedies defined by CADE (Brazilian Antitrust Authority) • New Code of Ethics • Manual of Authority Delegation (Scope of Authority) • Creation of Internal Audit Structure and Compliance • SEC Rules (SOX and FCPA) • Ethics Committee • Related Parties Committee • Au

Slide 13: Compensation Policy
13 COMPENSATION POLICY
Slide 14: Compensation New Guidelines
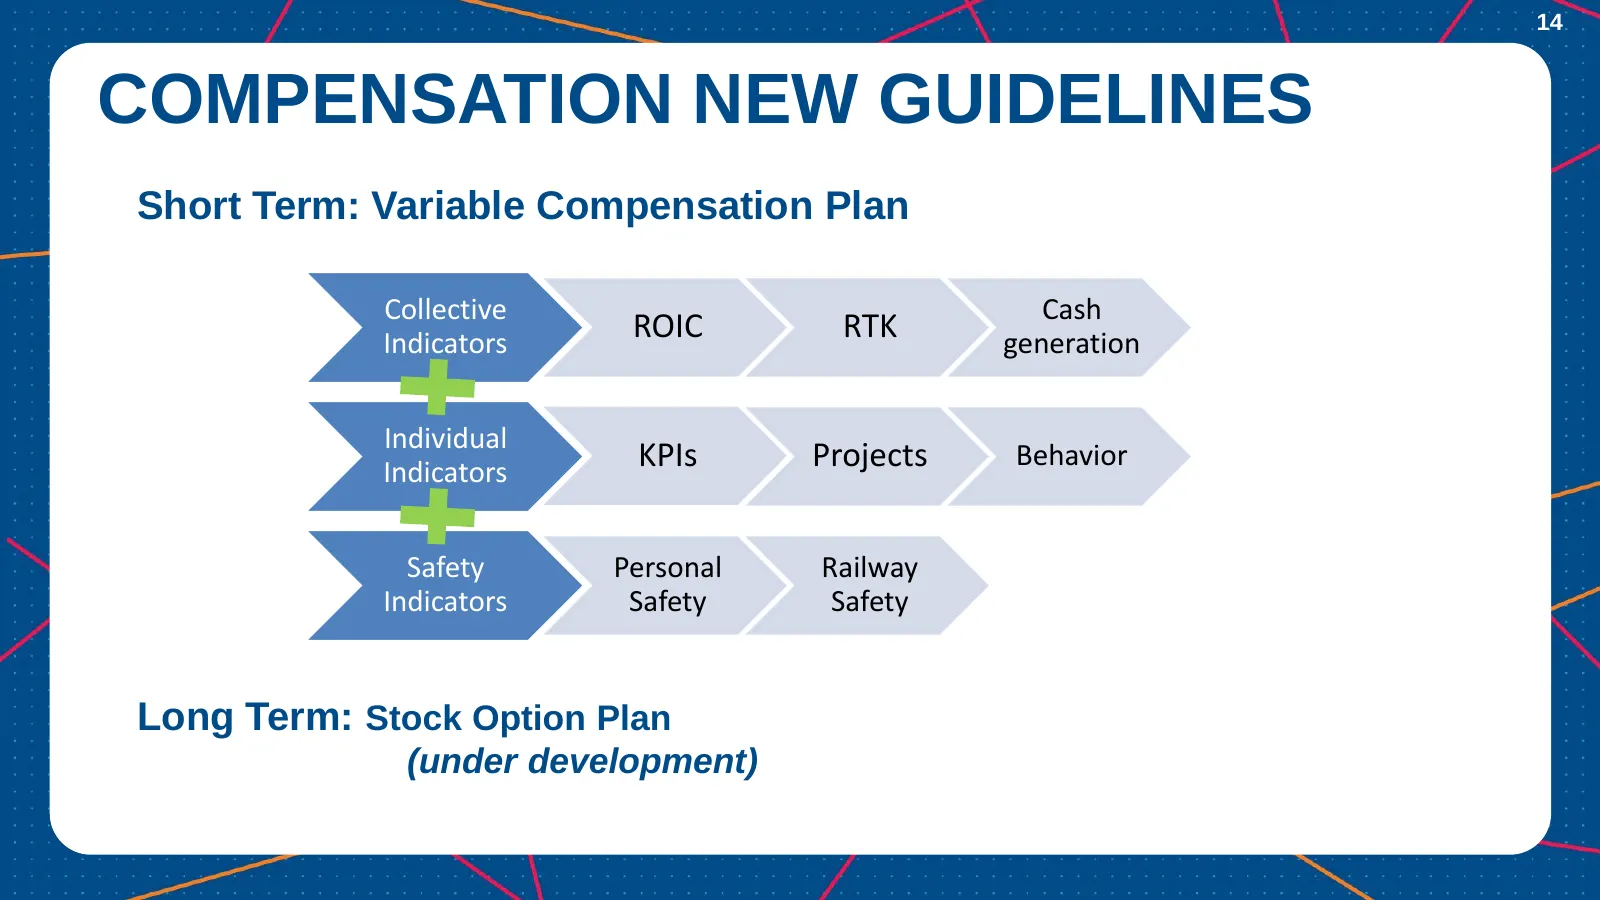
14 COMPENSATION NEW GUIDELINES Short Term: Variable Compensation Plan Collective Cash Indicators ROIC RTK generation Individual Indicators KPIs Projects Behavior Safety Personal Railway Indicators Safety Safety Long Term: Stock Option Plan (under development)

Slide 15: Current Status
CURRENT — STATUS aT
Slide 16: Current Assets Assessed
16 CURRENT ASSETS ASSESS ED Permanent Way Rolling Stock Main Corridors Locomotives: ~ 1,000 units High-density stretches Most important in volume and profitability 41% 67% MAINTENANCE 30% 29% BACKLOG ~ 2,600 km length 0 - 10 10 - 30 above 30 Low-density stretches years years years Viability stud

Slide 17: Investments
17 INVESTMENTS BUSINESS PLAN
Slide 18: Capex Plan
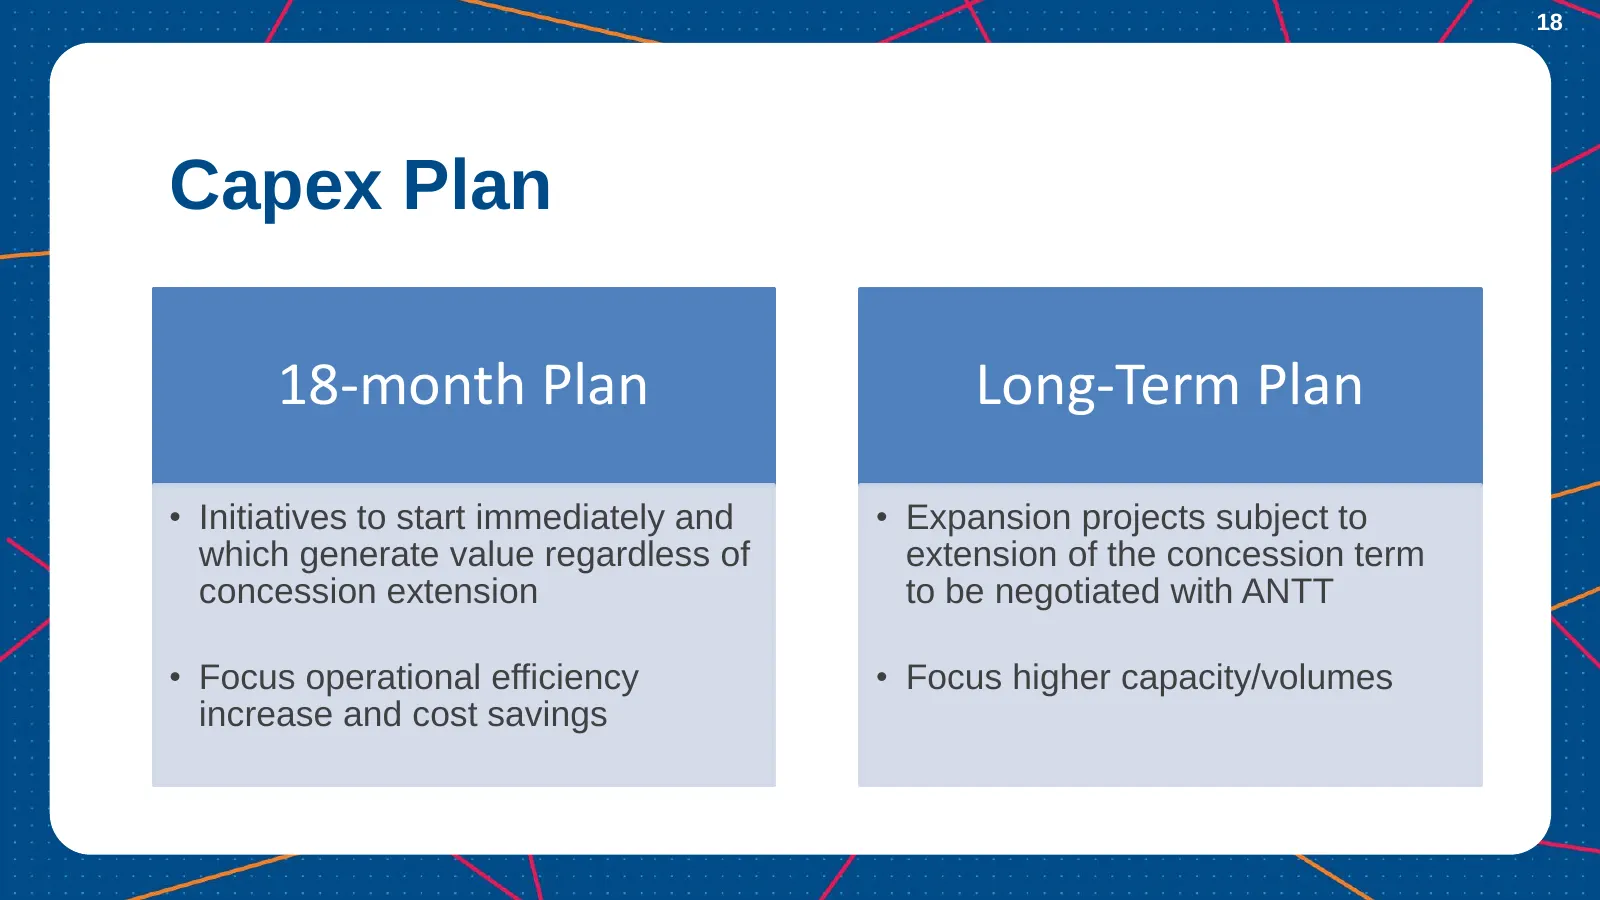
18 Capex Plan 18-month Plan Long-Term Plan • Initiatives to start immediately and • Expansion projects subject to which generate value regardless of extension of the concession term concession extension to be negotiated with ANTT • Focus operational efficiency • Focus higher capacity/volumes increas
Slide 19: 18-month Plan
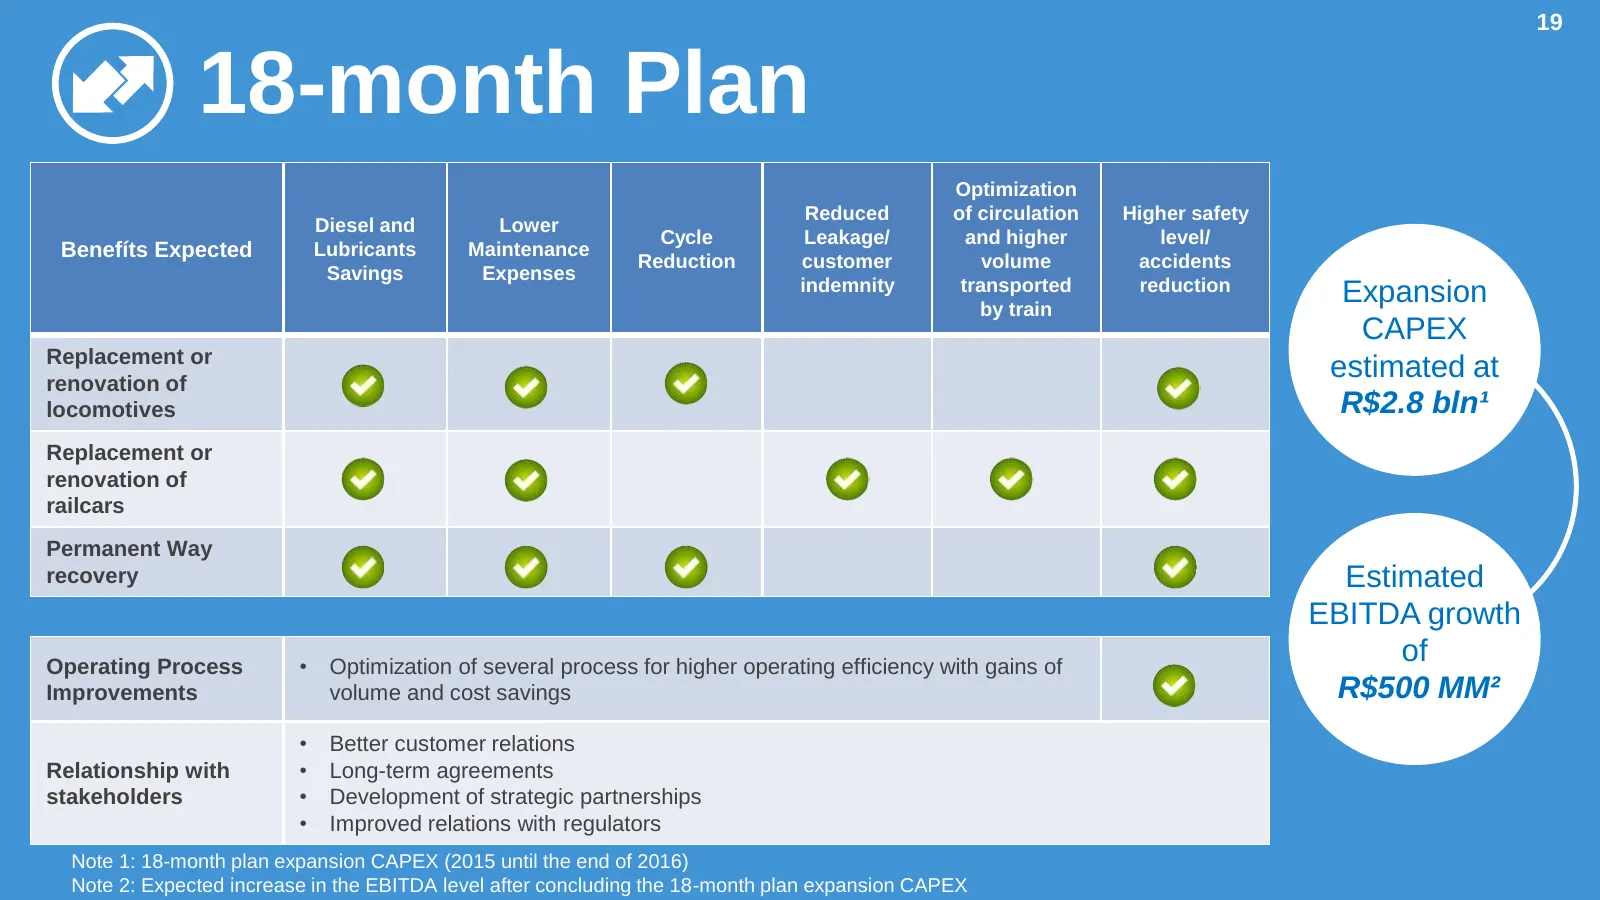
19 18-month Plan Optimization Reduced of circulation Higher safety Diesel and Lower Cycle Leakage/ and higher level/ Benefíts Expected Lubricants Maintenance Reduction customer volume accidents Savings Expenses indemnity transported reduction by train Expansion CAPEX Replacement or renovation of
Slide 20: Operational Improvements | Rolling Stock
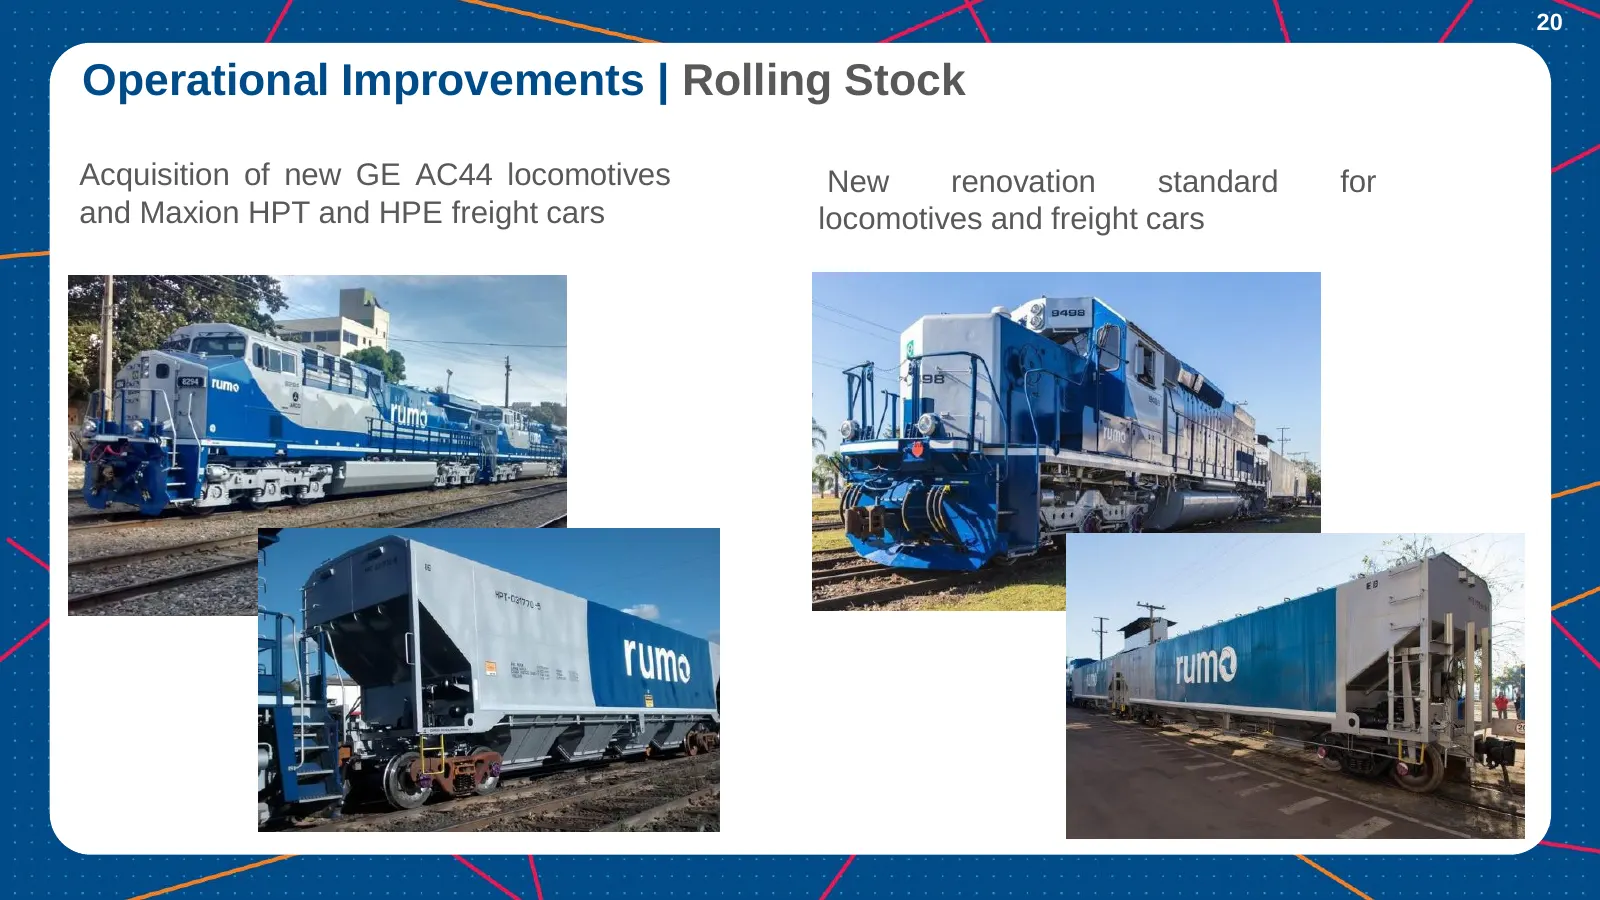
20 Operational Improvements | Rolling Stock Acquisition of new GE AC44 locomotives New renovation standard for and Maxion HPT and HPE freight cars locomotives and freight cars
Slide 21: Operational Improvements | North Operations
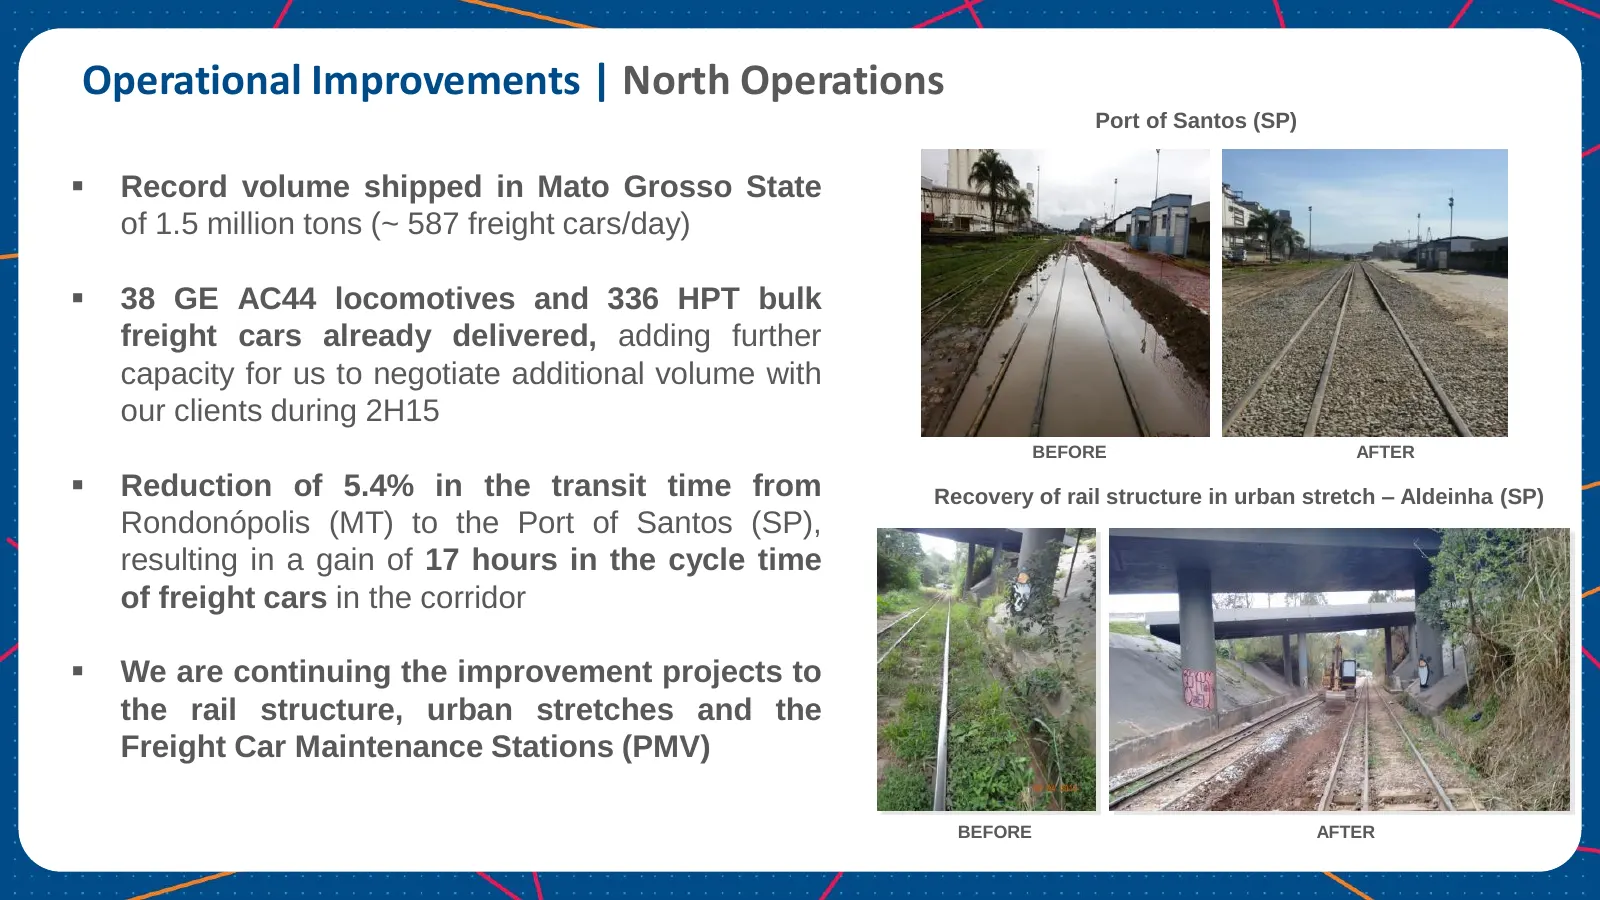
Operational Improvements | North Operations Port of Santos (SP) Record volume shipped in Mato Grosso State of 1.5 million tons (~ 587 freight cars/day) 38 GE AC44 locomotives and 336 HPT bulk freight cars already delivered, adding further capacity for us to negotiate additional volume with our c
Slide 22: Operational Improvements | South Operations
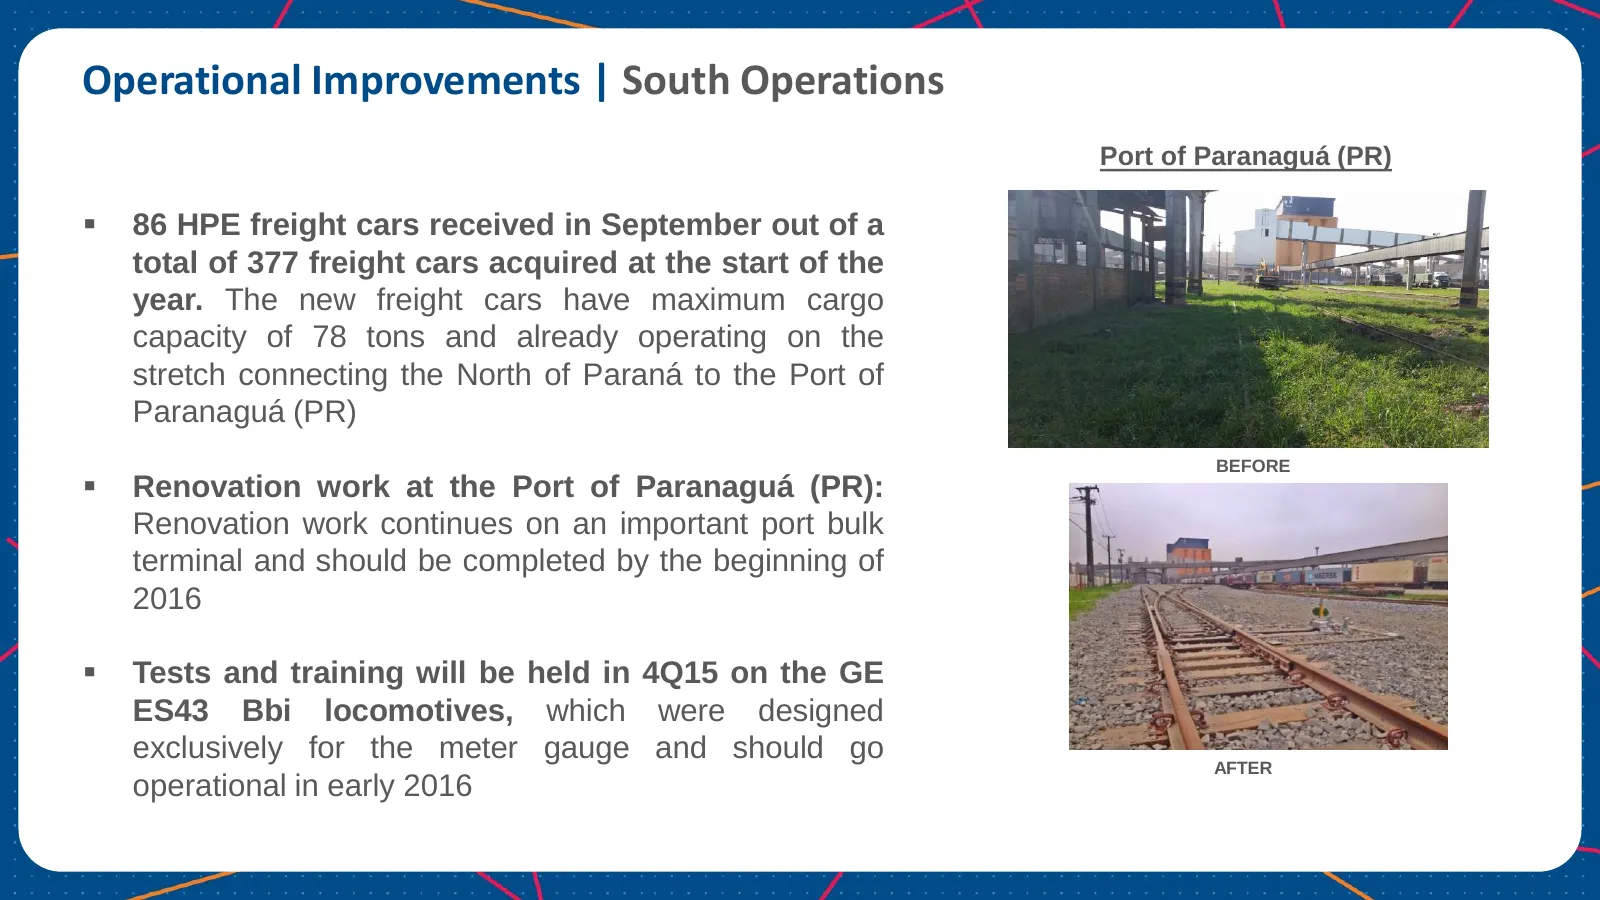
Operational Improvements | South Operations Port of Paranaguá (PR) 86 HPE freight cars received in September out of a total of 377 freight cars acquired at the start of the year. The new freight cars have maximum cargo capacity of 78 tons and already operating on the stretch connecting the North o
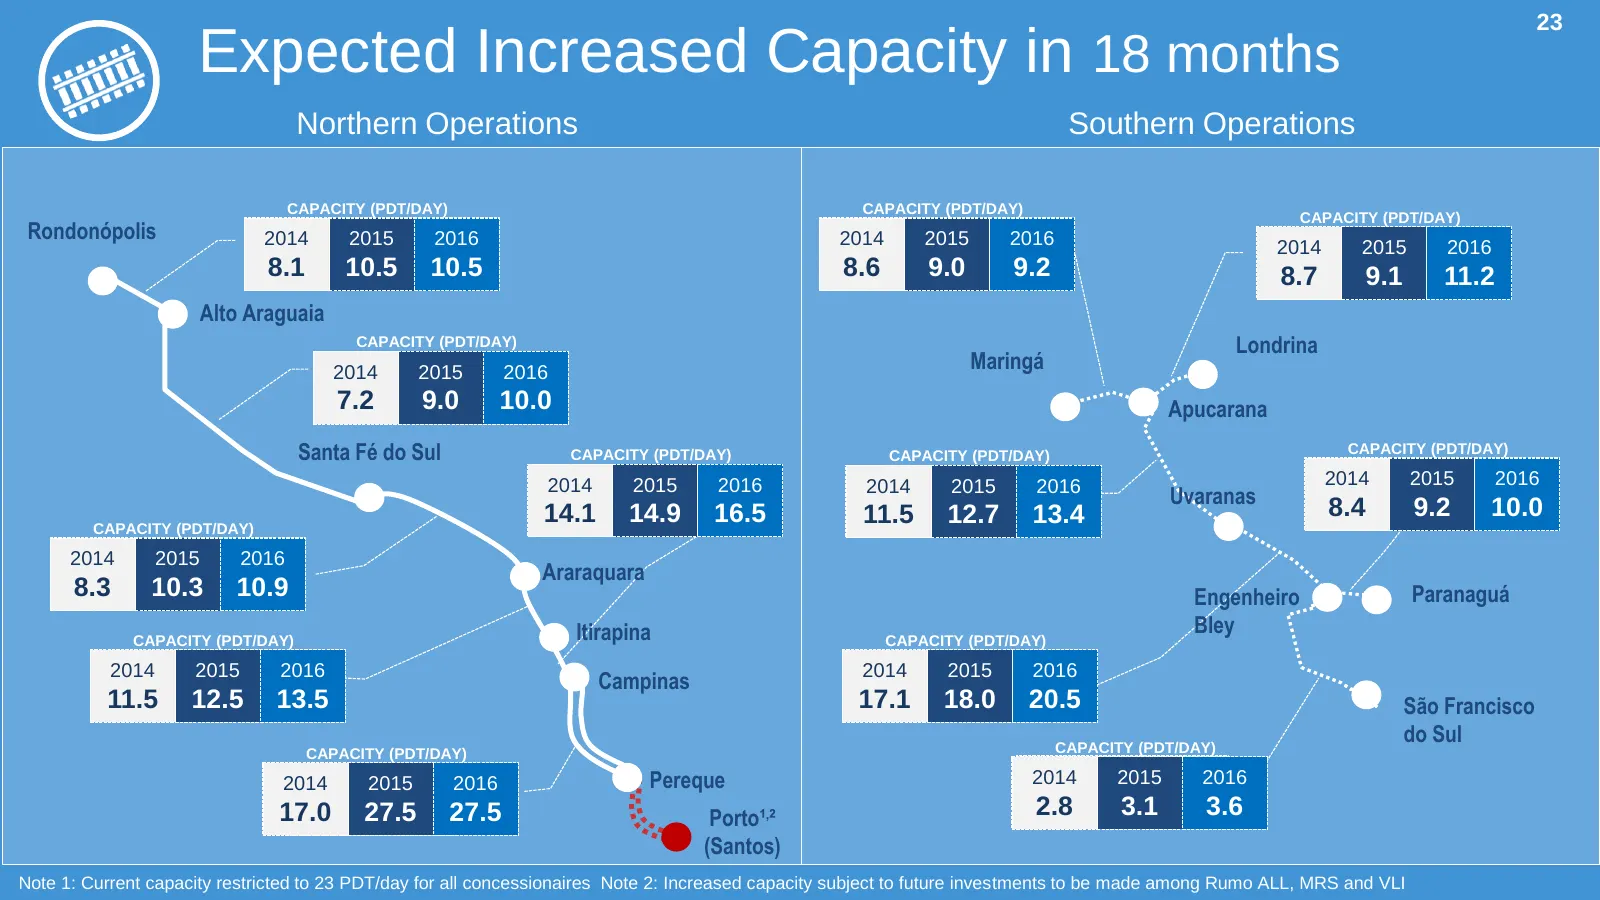
Slide 23: Expected Increased Capacity in 18 Months
23 Expected Increased Capacity in 18 months Northern Operations Southern Operations CAPACITY (PDT/DAY) CAPACITY (PDT/DAY) CAPACITY (PDT/DAY) Rondonópolis 2014 2015 2016 2014 2015 2016 2014 2015 2016 8.1 10.5 10.5 8.6 9.0 9.2 8.7 9.1 11.2 Alto Araguaia CAPACITY (PDT/DAY) Londrina 2014 2015 2016 Marin
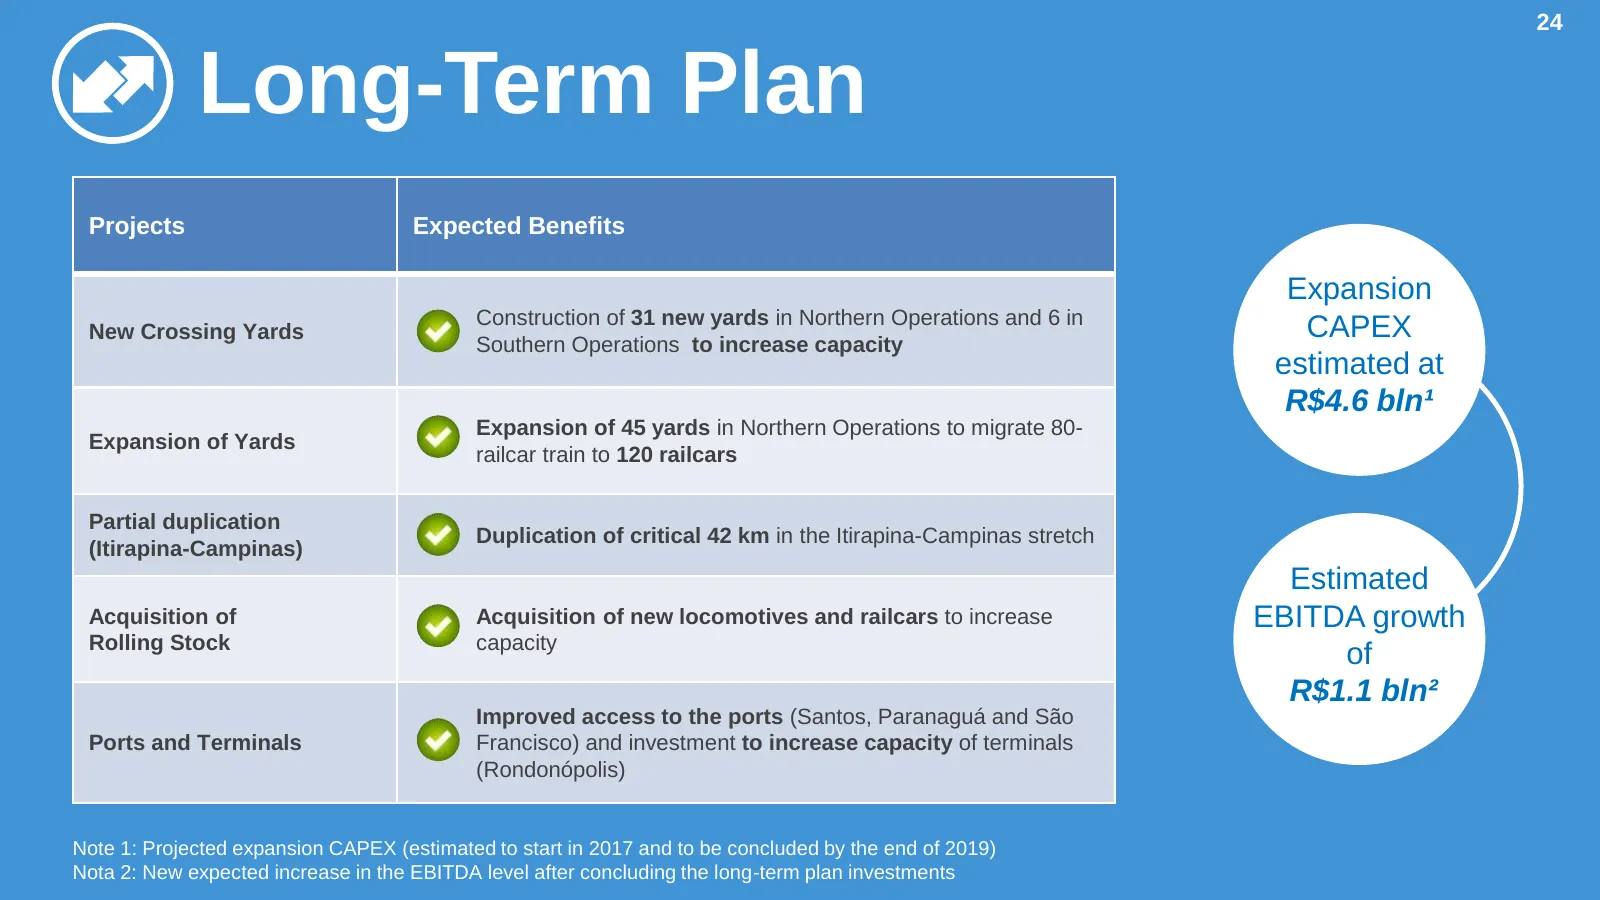
Slide 24: Long-Term Plan
24 Long-Term Plan Projects Expected Benefits Expansion Construction of 31 new yards in Northern Operations and 6 in New Crossing Yards Southern Operations to increase capacity CAPEX estimated at R$4.6 bln¹ Expansion of 45 yards in Northern Operations to migrate 80- Expansion of Yards railcar train t
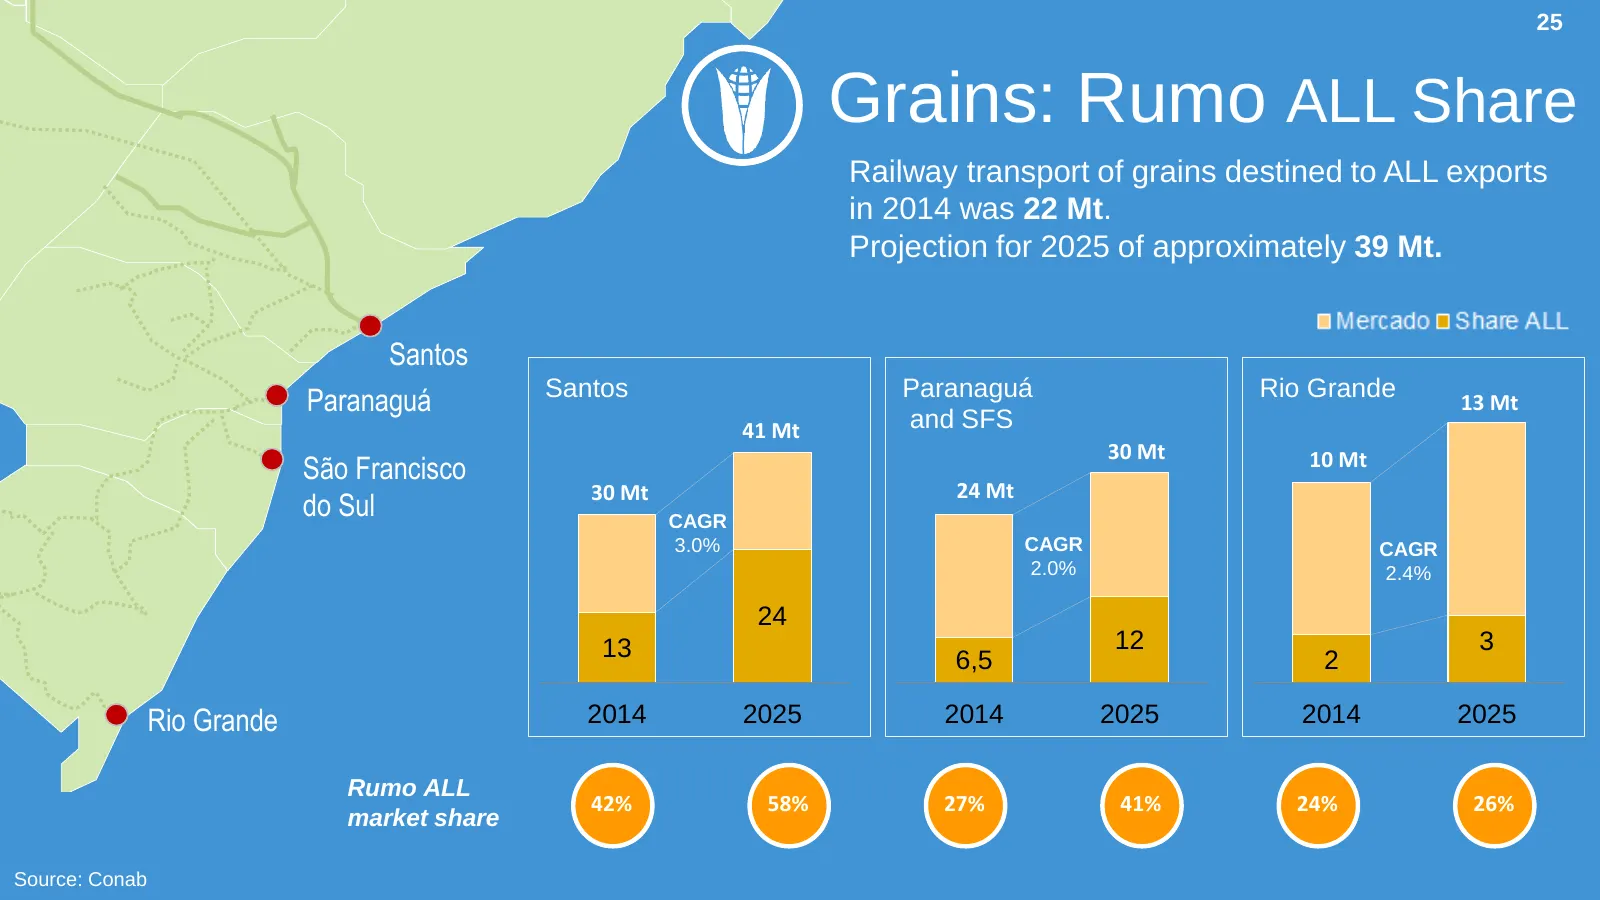
Slide 25: Grains: Rumo ALL Share
25 Grains: Rumo ALL Share Railway transport of grains destined to ALL exports in 2014 was 22 Mt. Projection for 2025 of approximately 39 Mt. Santos Santos Paranaguá Rio Grande Paranaguá 13 Mt 41 Mt and SFS 30 Mt 10 Mt São Francisco 30 Mt 24 Mt do Sul CAGR 3.0% CAGR CAGR 2.0% 2.4% 24 13 12 3 6,5 2 Ri
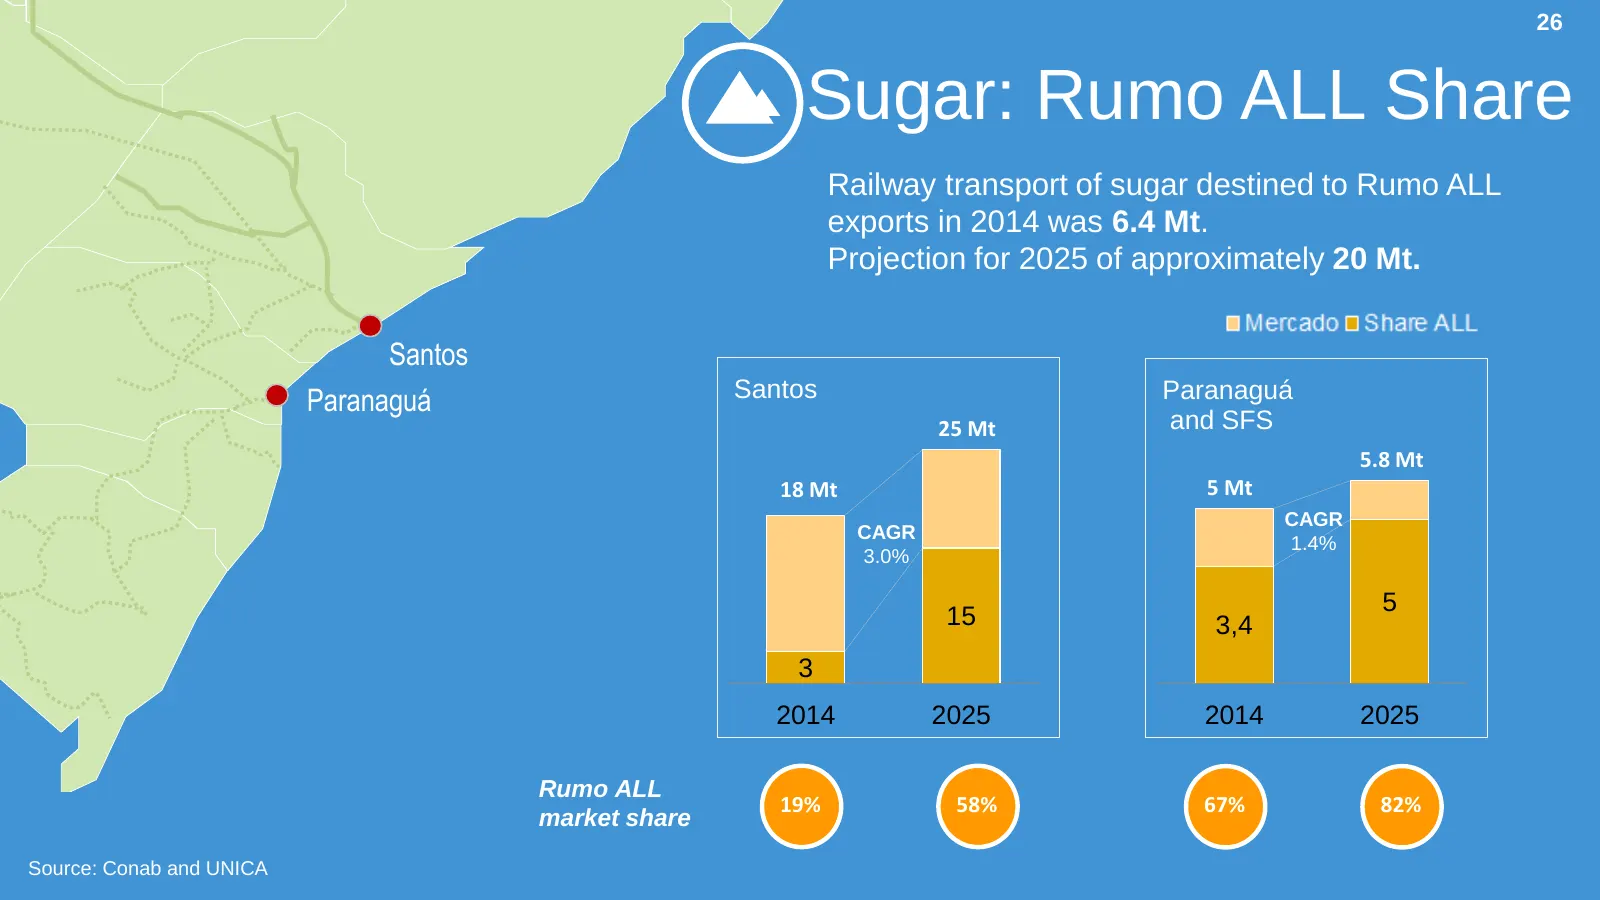
Slide 26: Sugar: Rumo ALL Share
26 Sugar: Rumo ALL Share Railway transport of sugar destined to Rumo ALL exports in 2014 was 6.4 Mt. Projection for 2025 of approximately 20 Mt. Santos Paranaguá Santos Paranaguá 25 Mt and SFS 5.8 Mt 18 Mt 5 Mt CAGR CAGR 1.4% 3.0% 5 15 3,4 3 2014 2025 2014 2025 Rumo ALL 19% 58% 67% 82% market share
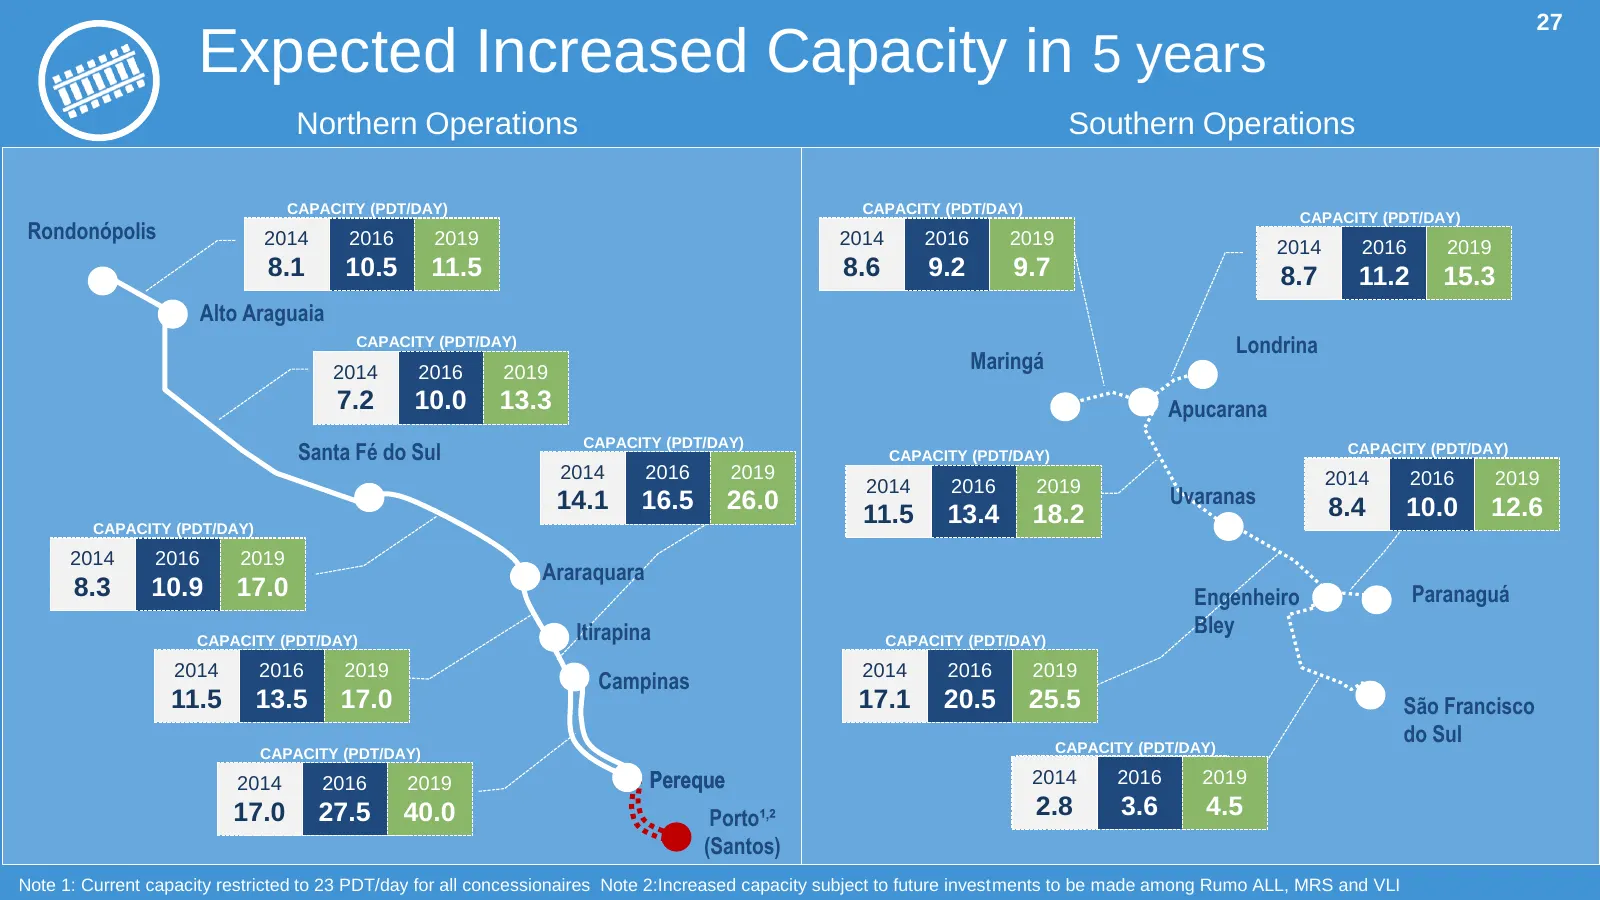
Slide 27: Expected Increased Capacity in 5 Years
27 Expected Increased Capacity in 5 years Northern Operations Southern Operations CAPACITY (PDT/DAY) CAPACITY (PDT/DAY) CAPACITY (PDT/DAY) Rondonópolis 2014 2016 2019 2014 2016 2019 2014 2016 2019 8.1 10.5 11.5 8.6 9.2 9.7 8.7 11.2 15.3 Alto Araguaia CAPACITY (PDT/DAY) Londrina 2014 2016 2019 Maring
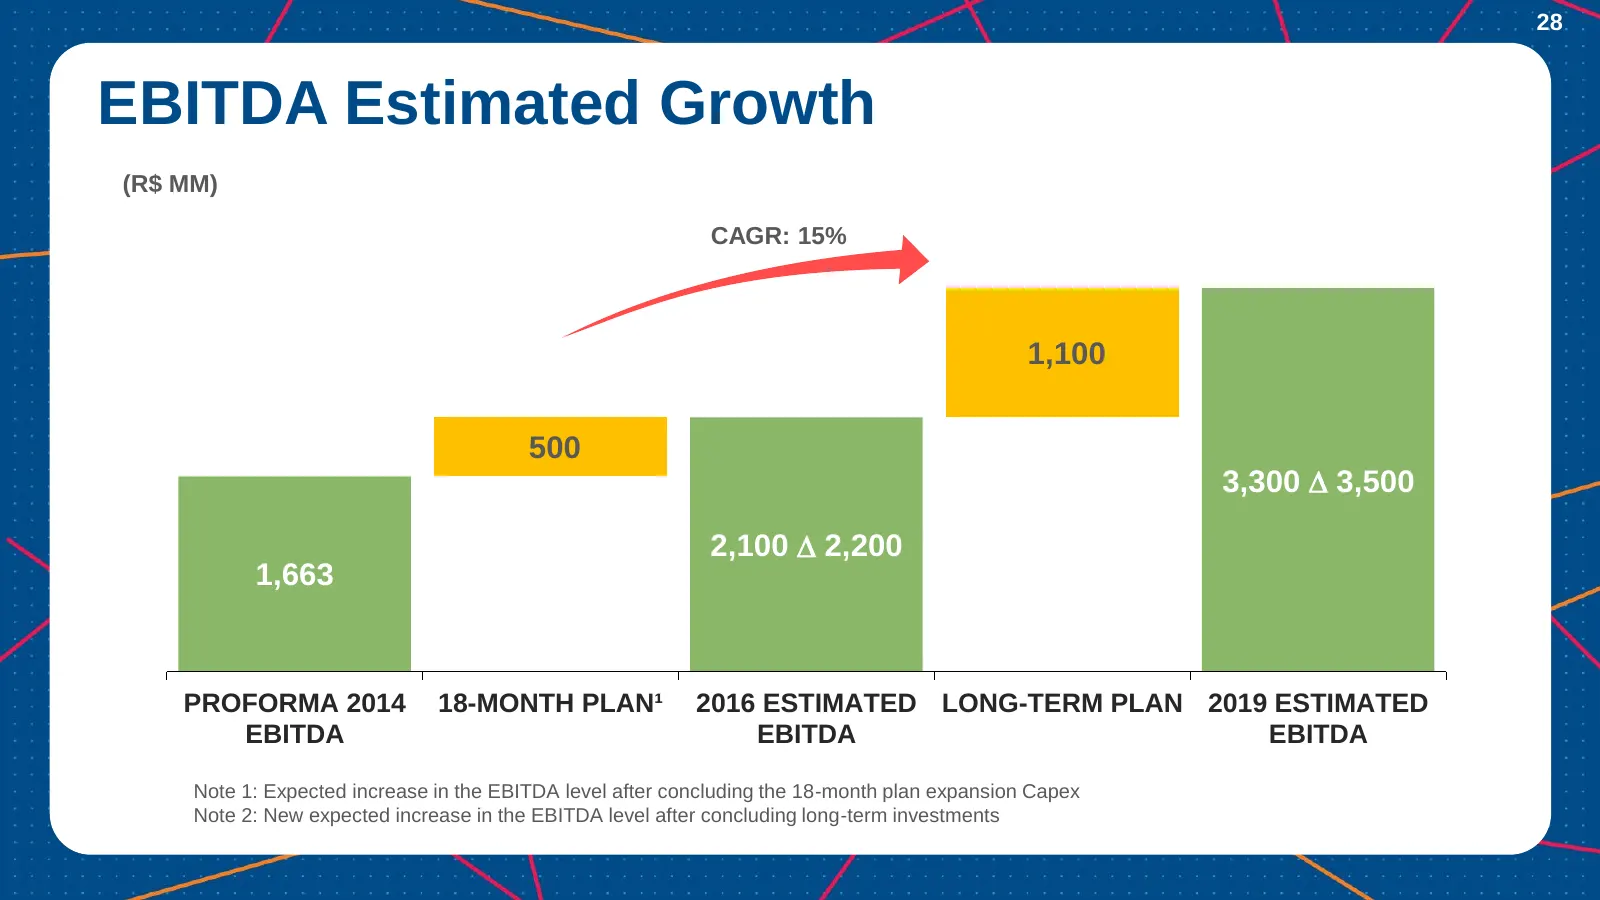
Slide 28: EBITDA Estimated Growth
28 EBITDA Estimated Growth (R$ MM) CAGR: 15% 1,100 500 3,300 D 3,500 2,100 D 2,200 1,663 PROFORMA 2014 18-MONTH PLAN¹ 2016 ESTIMATED LONG-TERM PLAN 2019 ESTIMATED EBITDA EBITDA EBITDA Note 1: Expected increase in the EBITDA level after concluding the 18-month plan expansion Capex Note 2: New expecte

Slide 29: Expansion Plan Financing
EXPANSION PLAN -— FINANCING a
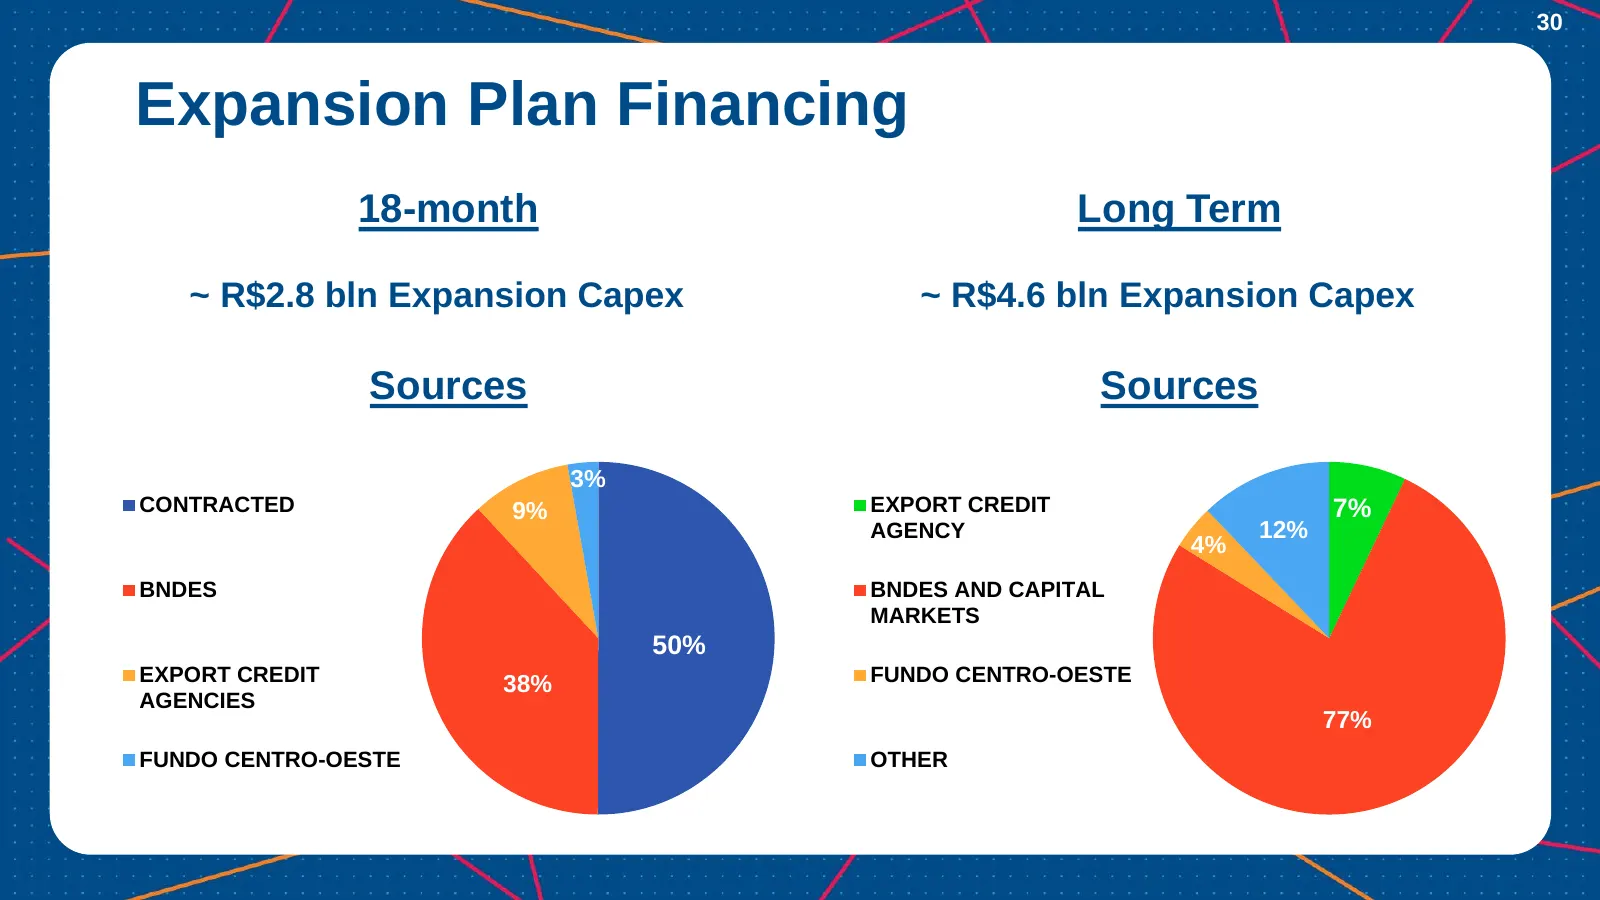
Slide 30: Expansion Plan Financing
30 Expansion Plan Financing 18-month Long Term ~ R$2.8 bln Expansion Capex ~ R$4.6 bln Expansion Capex Sources Sources 3% CONTRACTED 9% EXPORT CREDIT 7% AGENCY 12% 4% BNDES BNDES AND CAPITAL MARKETS 50% EXPORT CREDIT 38% FUNDO CENTRO-OESTE AGENCIES 77% FUNDO CENTRO-OESTE OTHER

Slide 31: Results 3Q15
31 RESULTS 3Q15
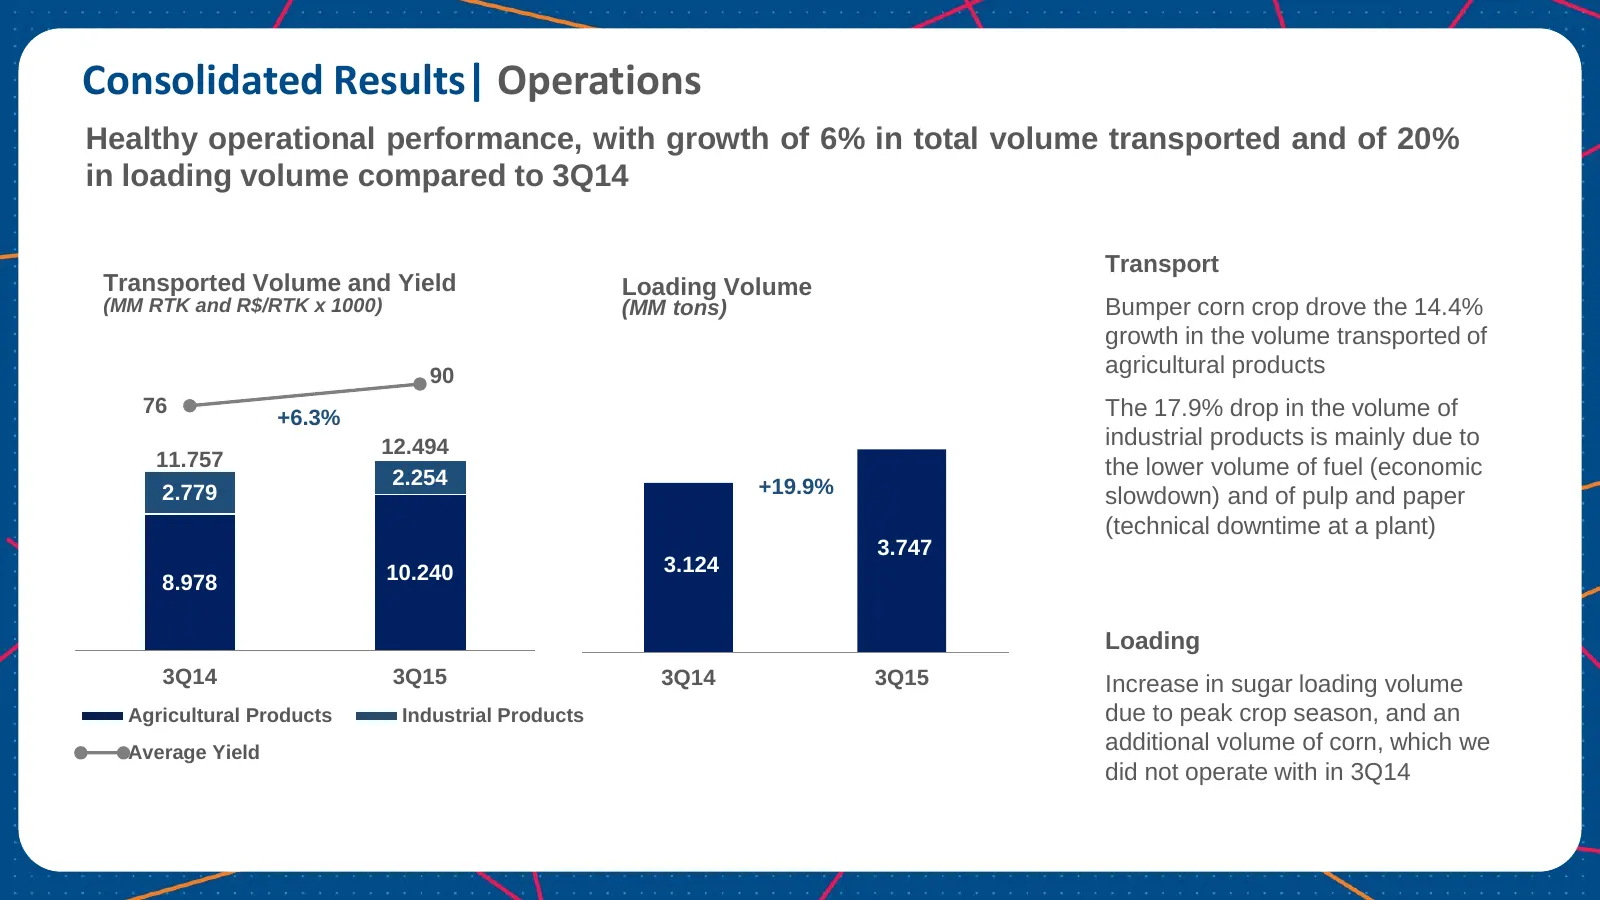
Slide 32: Consolidated Results | Operations
Consolidated Results| Operations Healthy operational performance, with growth of 6% in total volume transported and of 20% in loading volume compared to 3Q14 Transport Transported Volume and Yield Loading Volume (MM RTK and R$/RTK x 1000) (MM tons) Bumper corn crop drove the 14.4% growth in the volu
Slide 33: Consolidated Results | Financial
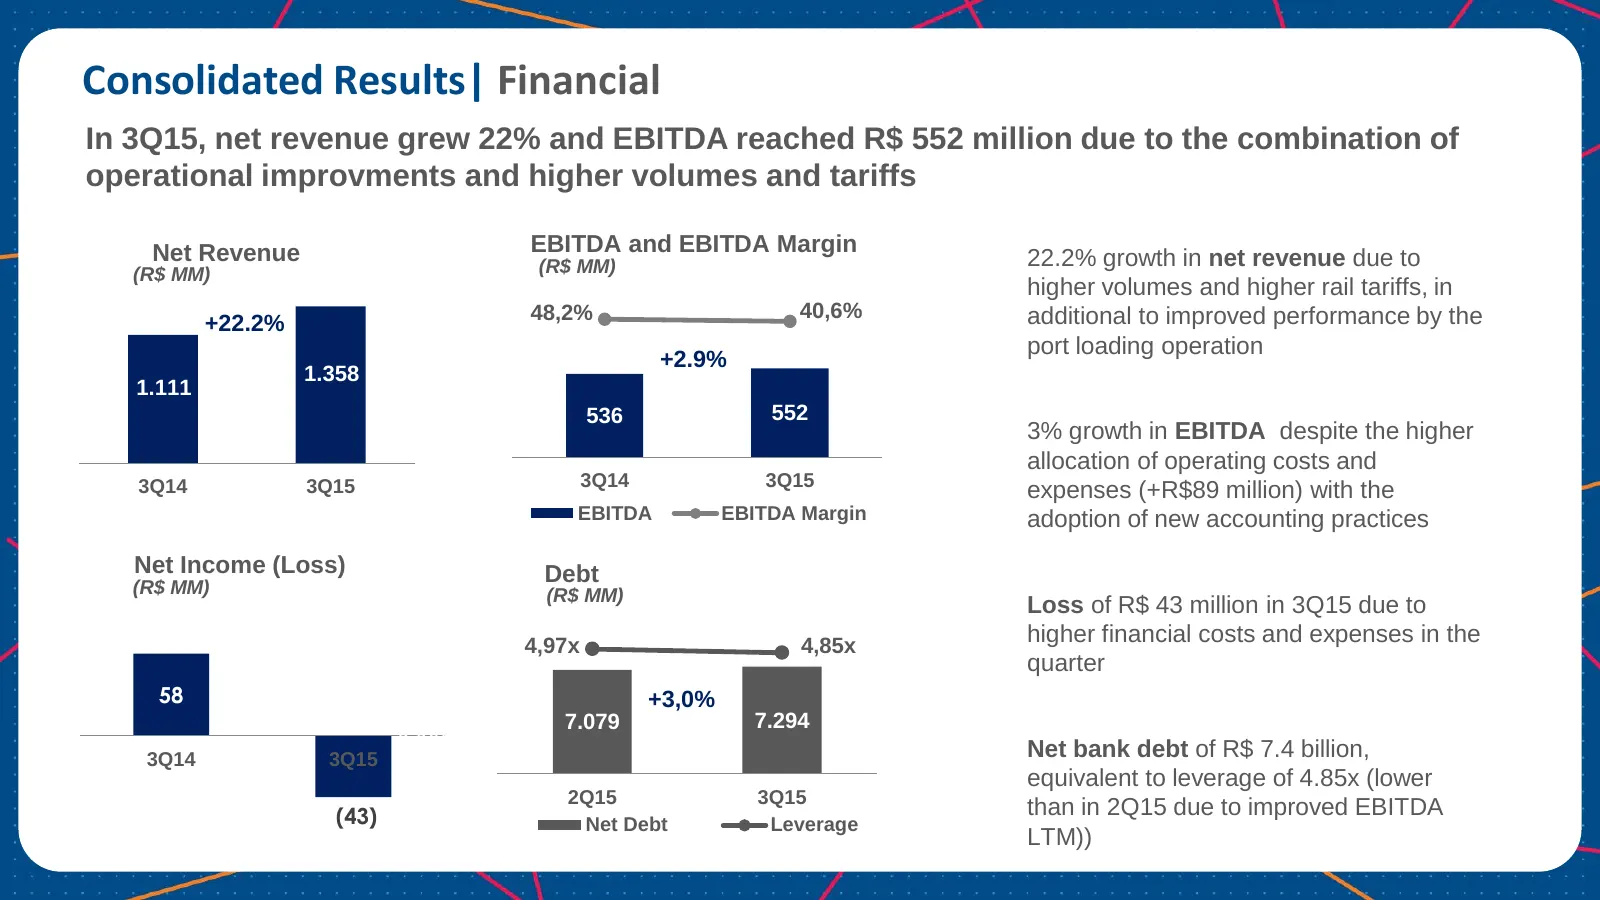
Consolidated Results| Financial In 3Q15, net revenue grew 22% and EBITDA reached R$ 552 million due to the combination of operational improvments and higher volumes and tariffs Net Revenue EBITDA and EBITDA Margin (R$ MM) 22.2% growth in net revenue due to (R$ MM) higher volumes and higher rail tari
Slide 34: Debt
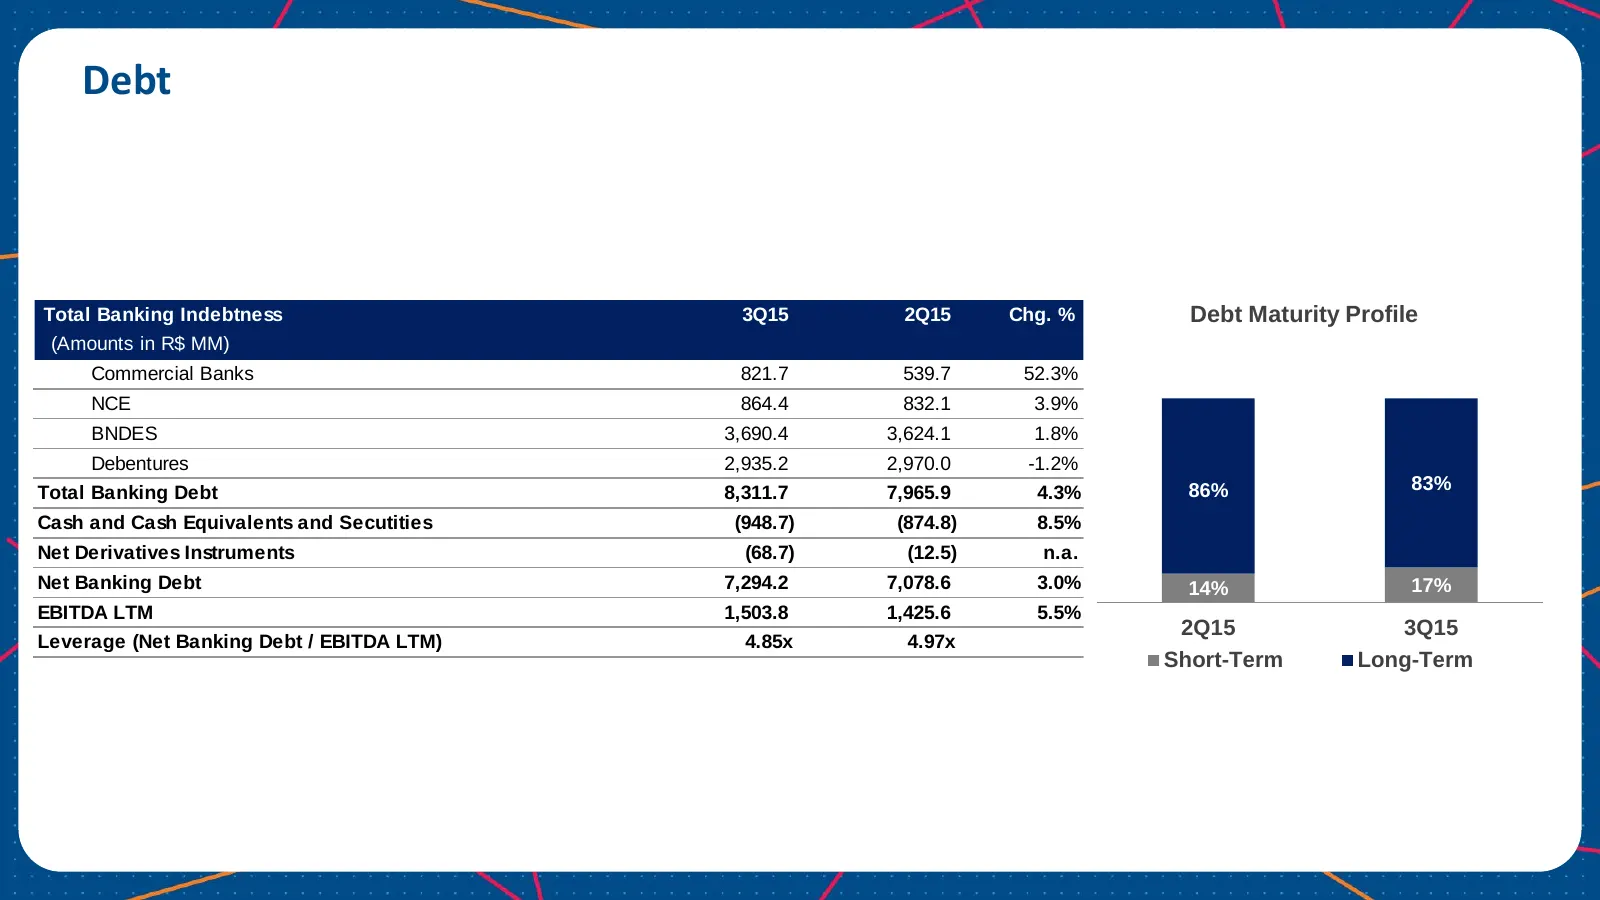
Debt Total Banking Indebtness 3Q15 2Q15 Chg. % Debt Maturity Profile (Amounts in R$ MM) Commercial Banks 821.7 539.7 52.3% NCE 864.4 832.1 3.9% BNDES 3,690.4 3,624.1 1.8% Debentures 2,935.2 2,970.0 -1.2% Total Banking Debt 8,311.7 7,965.9 4.3% 86% 83% Cash and Cash Equivalents and Secutities (948.7)

Slide 35: Projection and Guidance
PROJECTION AND -— GUIDANCE a
Slide 36: Guidance 2015 | Revised Projections
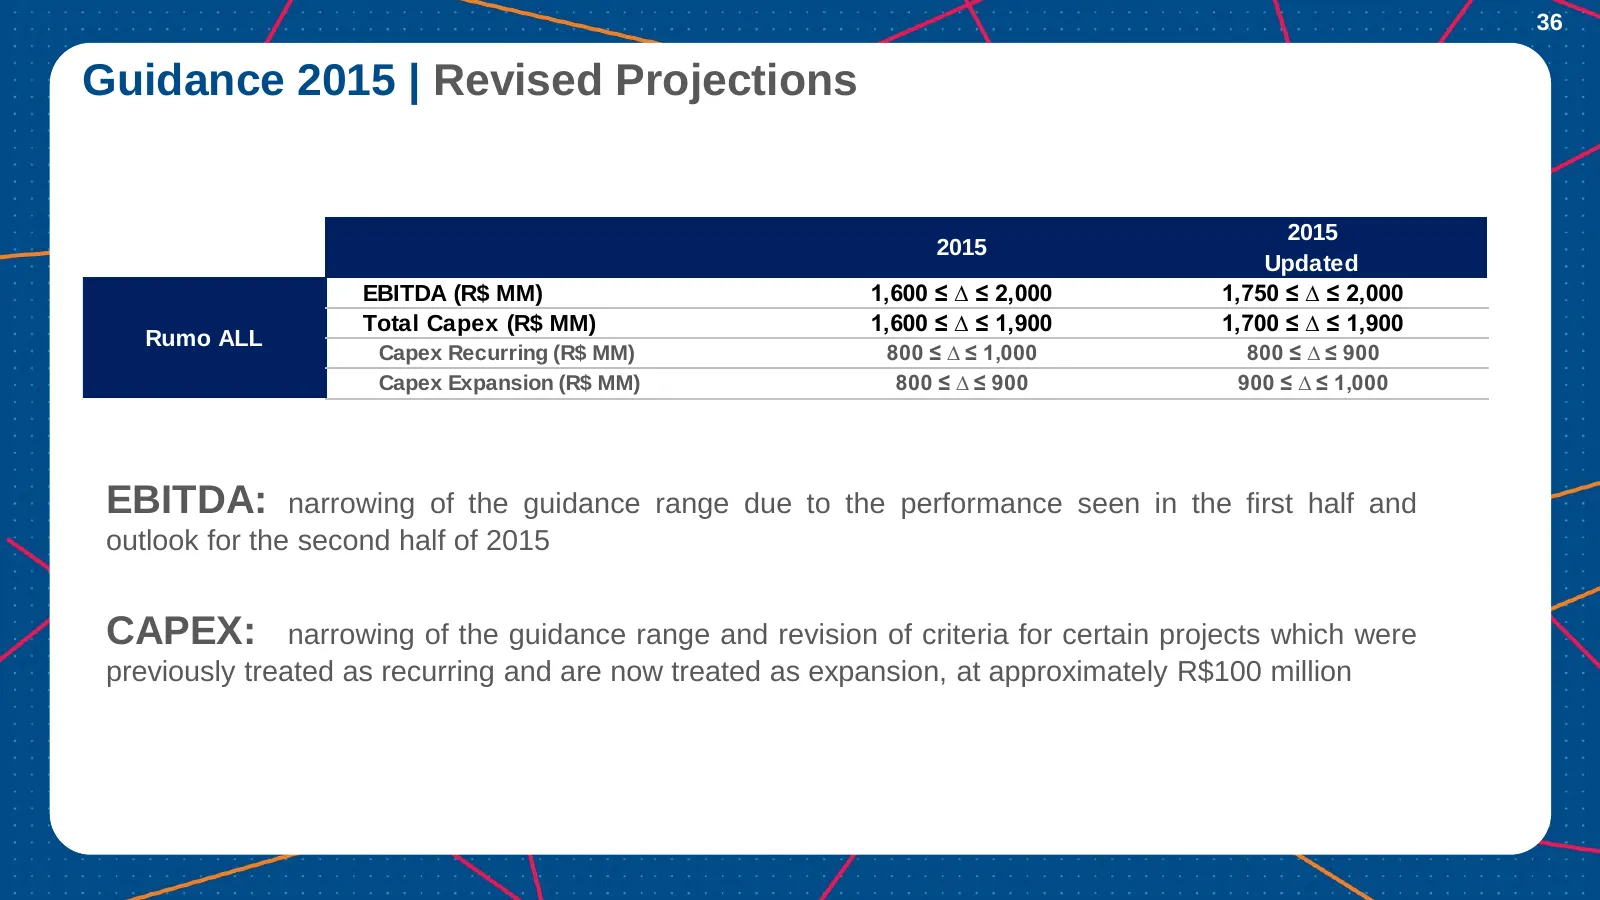
36 Guidance 2015 | Revised Projections 2015 2015 Updated EBITDA (R$ MM) 1,600 ≤ ∆ ≤ 2,000 1,750 ≤ ∆ ≤ 2,000 Total Capex (R$ MM) 1,600 ≤ ∆ ≤ 1,900 1,700 ≤ ∆ ≤ 1,900 Rumo ALL Capex Recurring (R$ MM) 800 ≤ ∆ ≤ 1,000 800 ≤ ∆ ≤ 900 Capex Expansion (R$ MM) 800 ≤ ∆ ≤ 900 900 ≤ ∆ ≤ 1,000 EBITDA: narrowing o
Slide 37: Long-term Projections Estimates
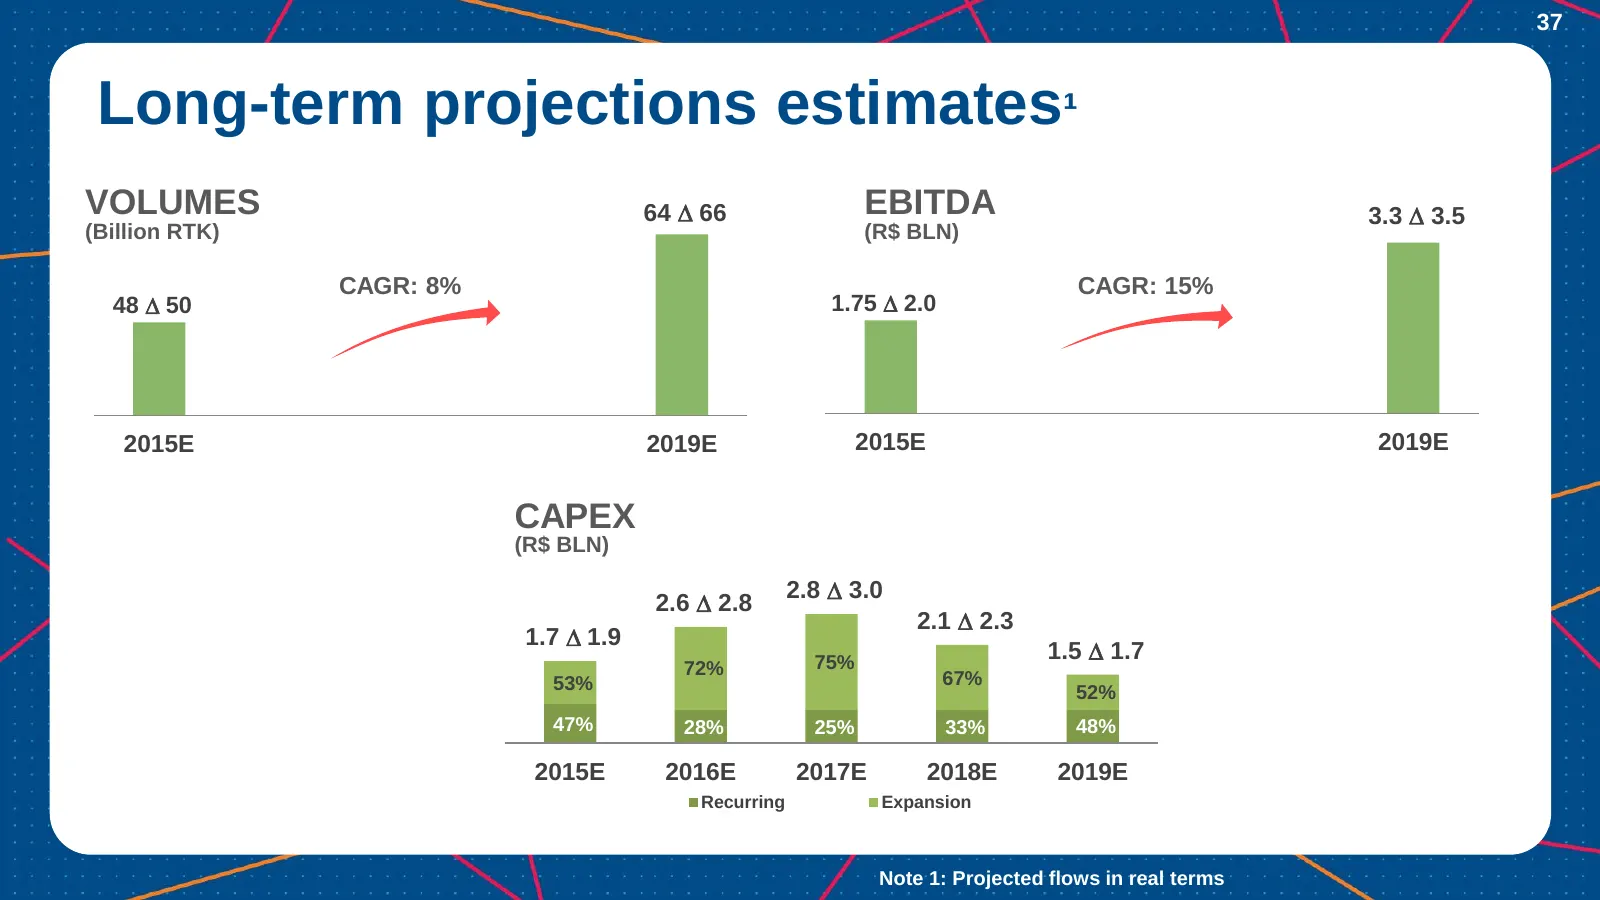
37 Long-term projections estimates¹ VOLUMES 64 D 66 EBITDA 3.3 D 3.5 (Billion RTK) (R$ BLN) CAGR: 8% CAGR: 15% 48 D 50 1.75 D 2.0 2015E 2019E 2015E 2019E CAPEX (R$ BLN) 2.8 D 3.0 2.6 D 2.8 2.1 D 2.3 1.7 D 1.9 75% 1.5 D 1.7 72% 67% 53% 52% 47% 28% 25% 33% 48% 2015E 2016E 2017E 2018E 2019E Recurring E

Slide 38: Conclusion
CONCLUSION SeeeeeereeereeeeeeeeeE
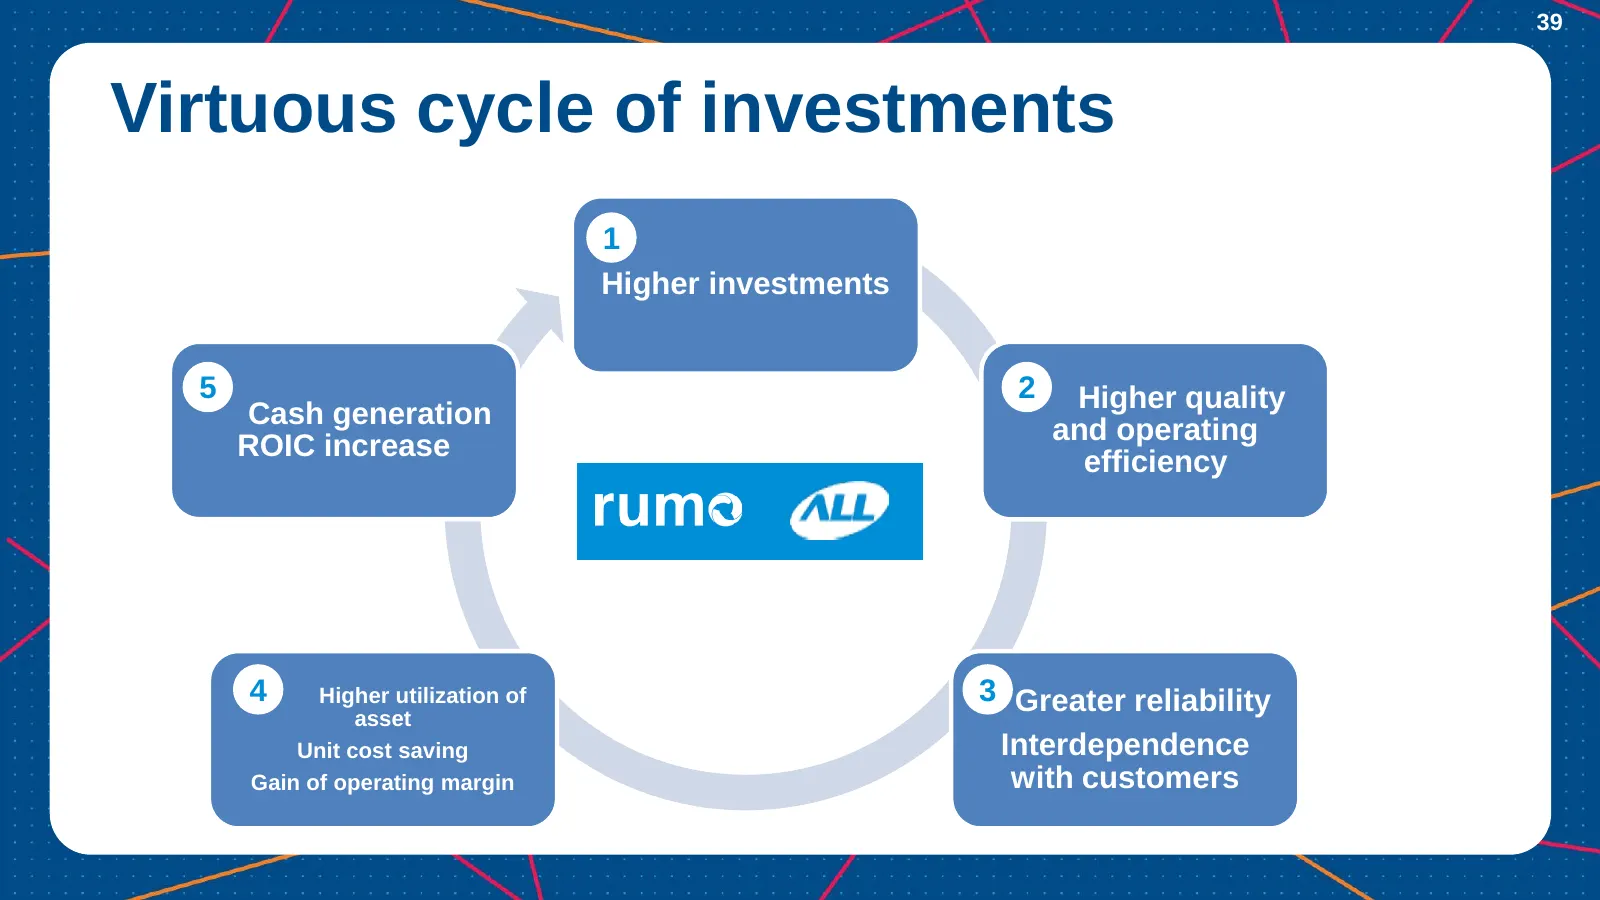
Slide 39: Virtuous Cycle of Investments
39 Virtuous cycle of investments 1 Higher investments 5 2 Higher quality Cash generation and operating ROIC increase efficiency 4 Higher utilization of 3 Greater reliability asset Unit cost saving Interdependence Gain of operating margin with customers
Slide 40: Main Messages
40 Main Messages Short-term initiatives (18-month) • Immediate start regardless of negotiation with regulator • Focus on operational efficiency increase and cost savings Long-term initiatives • Subject to extension of the concession term • Focused on higher capacity/volumes Project financing • 50% o

Slide 41: Thank You
VAMOS THANK YOU “nro rumo PALL
Source: Internet Archive copy of ri.rumolog.com
More decks from Rumo SA
 Q2 2026 Earnings Presentation14 slides · Aug 13, 2026
 Q4 2025 Earnings Presentation15 slides · Mar 5, 2026
 Q3 2025 Earnings Presentation15 slides · Nov 17, 2025
 Investor Presentation (October 2017)26 slides · October 2017
 Investor Presentation (August 2017)27 slides · August 2017
 Investor Presentation (March 2017)24 slides · March 2017