SKF AB Class A · OMXSTO:SKF_A
SKF AB Class A — Q3 2002 Earnings Presentation
18 slides from SKF AB Class A's earnings presentation, October 2002
Slide 1: The SKF Group Nine-month result 2002
The SKF Group Nine-month result 2002 Sune Carlsson, President and CEO
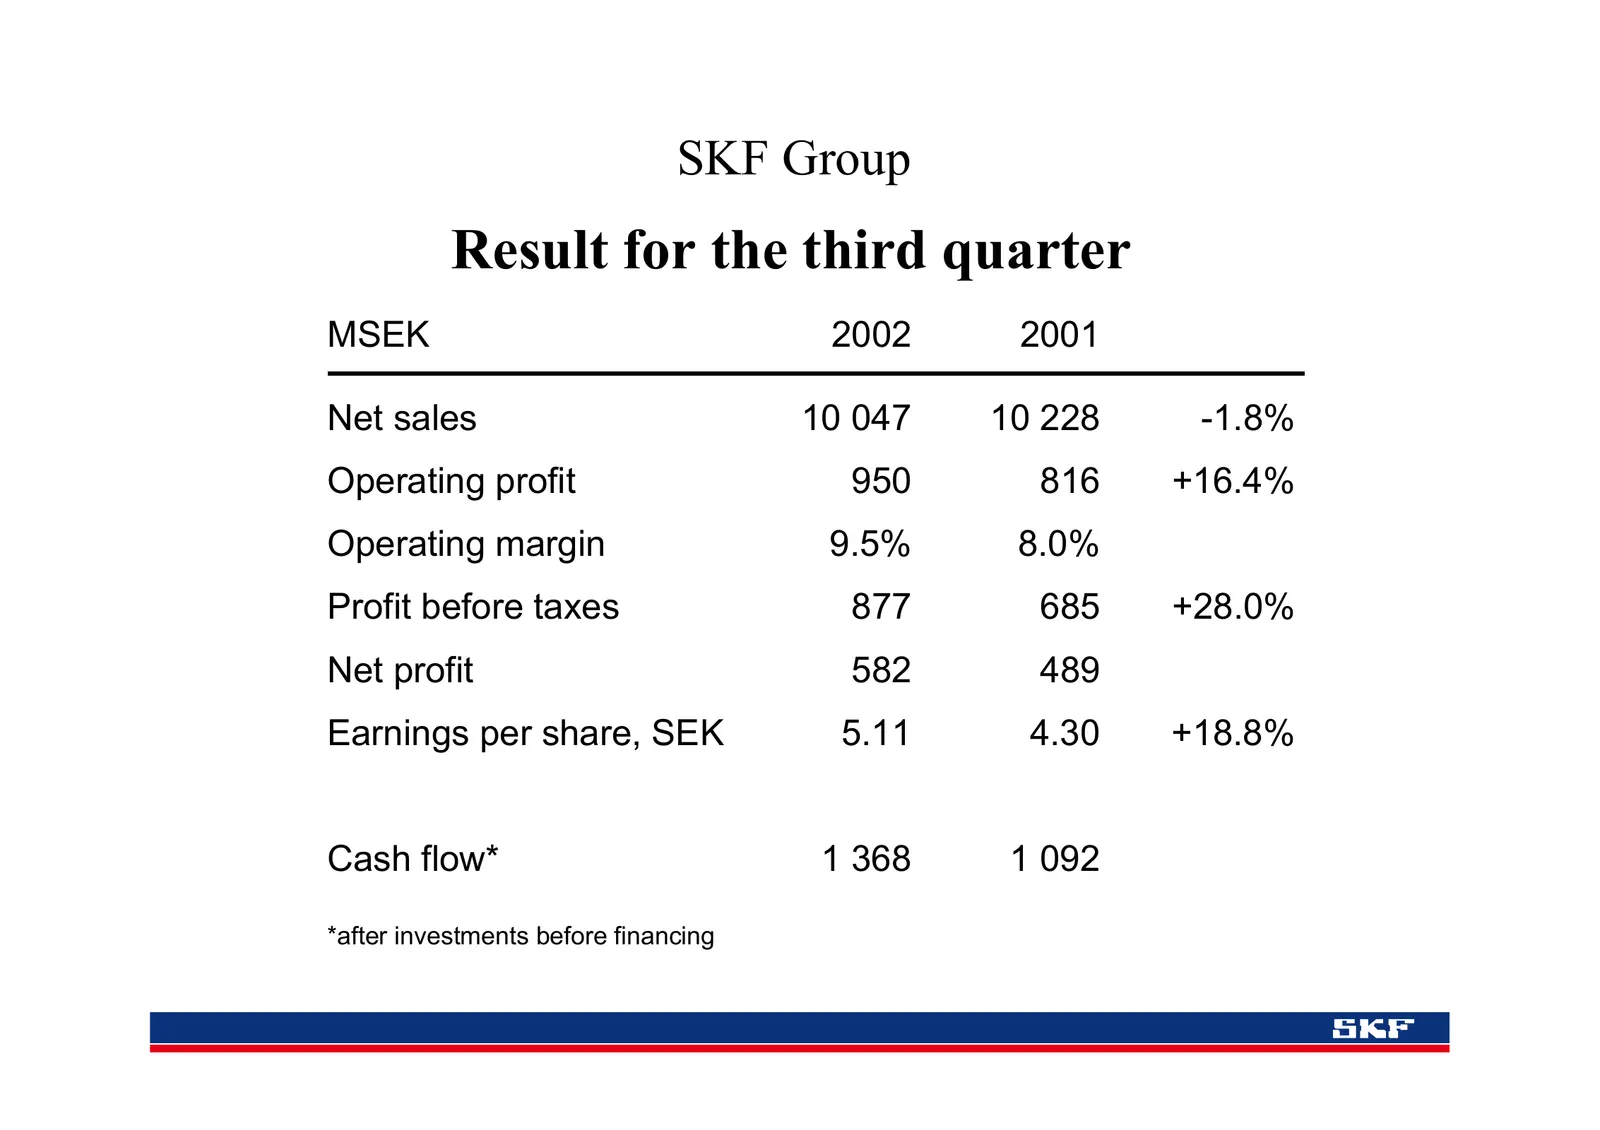
Slide 2: Result for the third quarter
SKF Group Result for the third quarter MSEK 2002 2001 Net sales 10 047 10 228 -1.8% Operating profit 950 816 +16.4% Operating margin 9.5% 8.0% Profit before taxes 877 685 +28.0% Net profit 582 489 Earnings per share, SEK 5.11 4.30 +18.8% Cash flow* 1 368 1 092 *after investments before financing
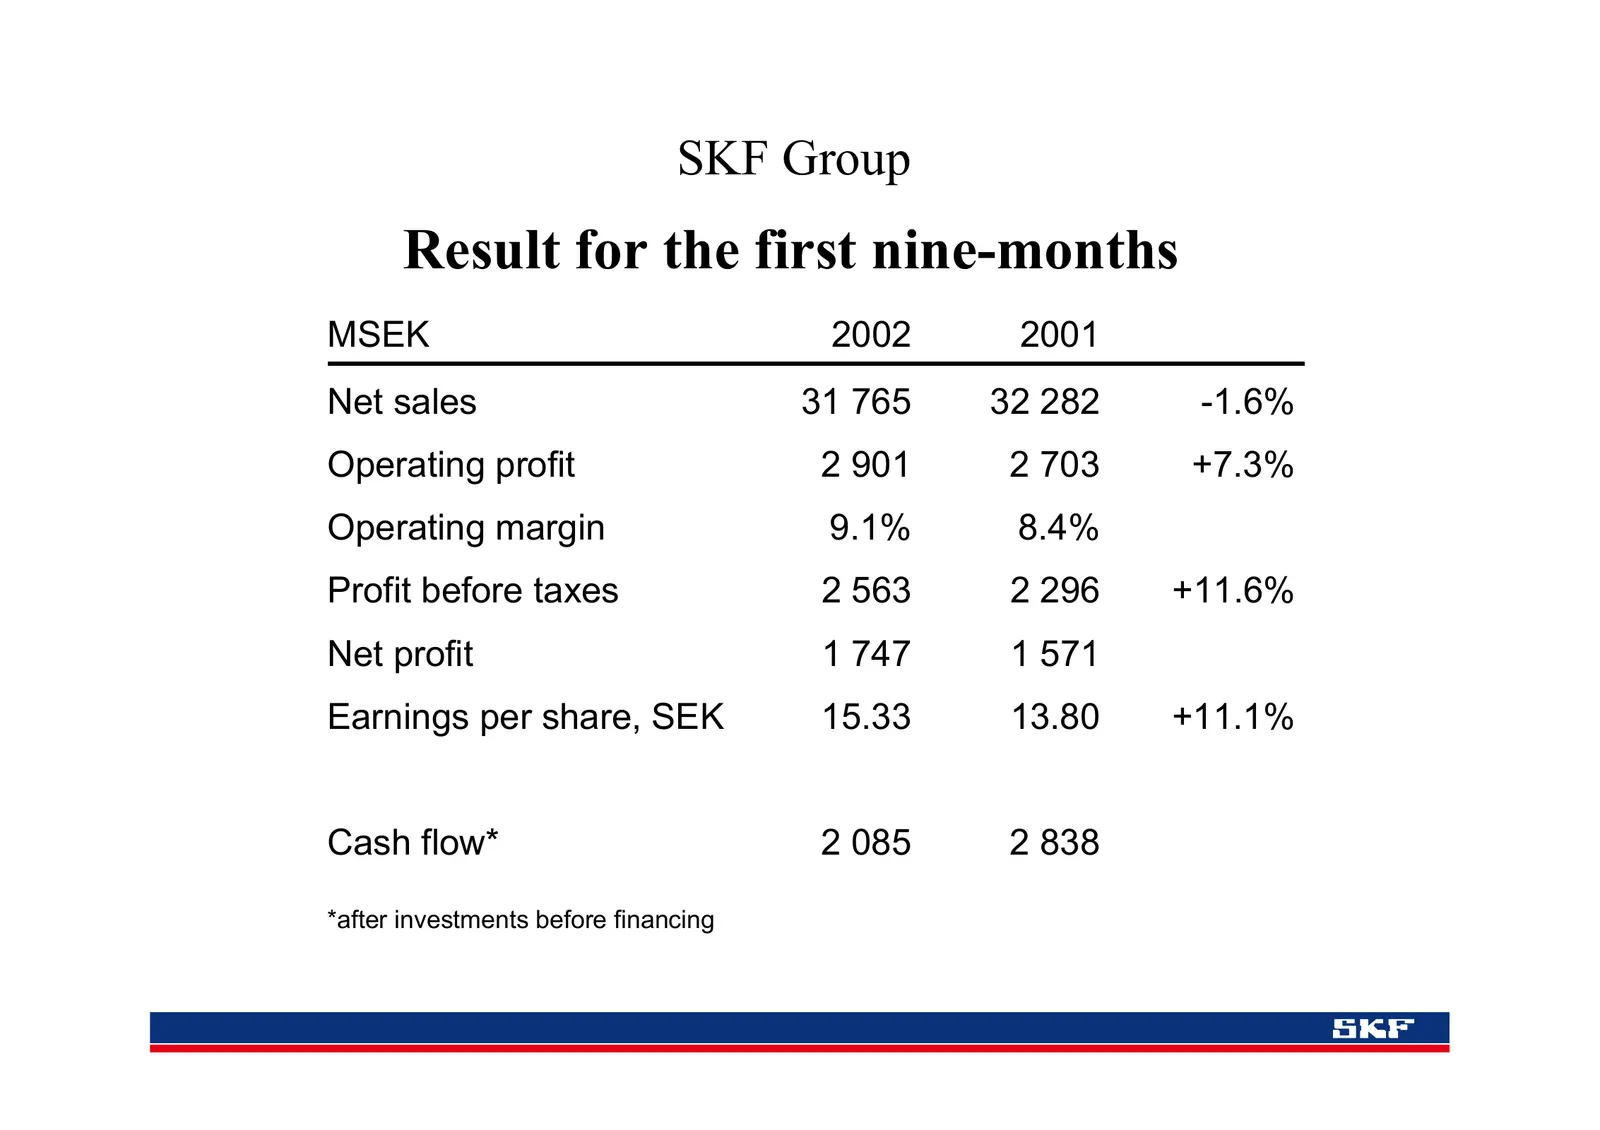
Slide 3: Result for the first nine-months
SKF Group Result for the first nine-months MSEK 2002 2001 Net sales 31 765 32 282 -1.6% Operating profit 2 901 2 703 +7.3% Operating margin 9.1% 8.4% Profit before taxes 2 563 2 296 +11.6% Net profit 1 747 1 571 Earnings per share, SEK 15.33 13.80 +11.1% Cash flow* 2 085 2 838 *after investments bef
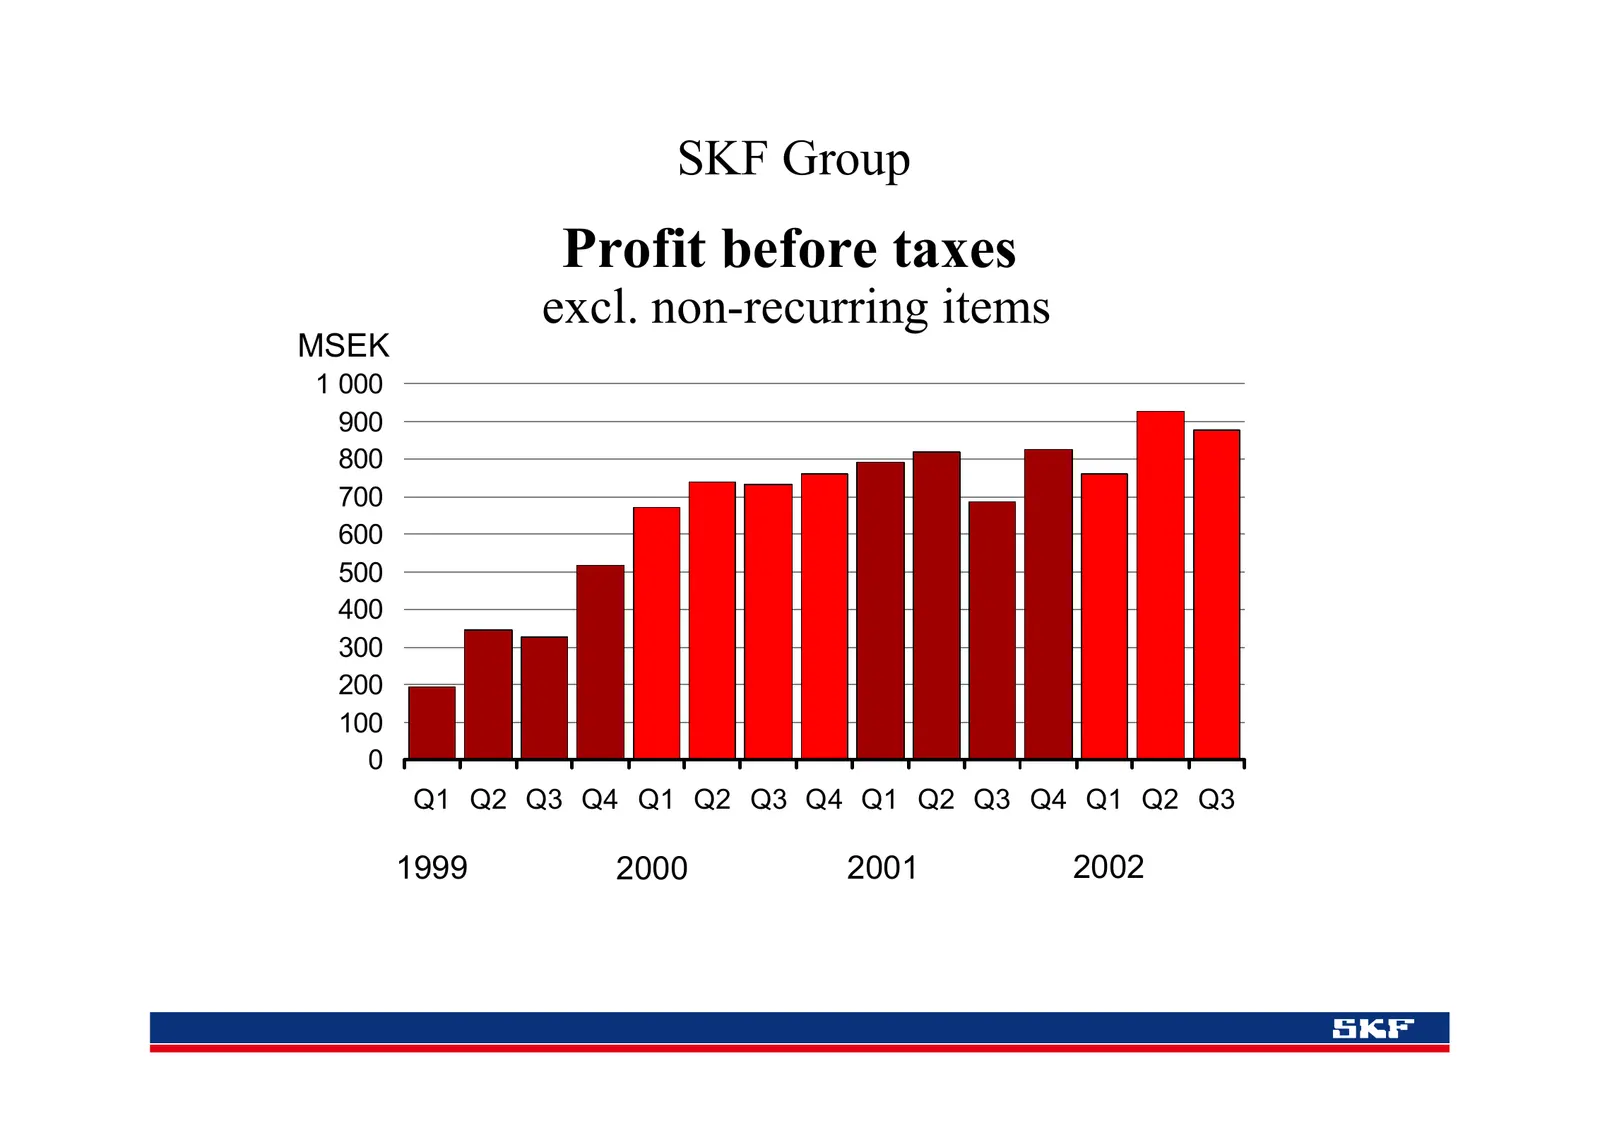
Slide 4: Profit before taxes
SKF Group Profit before taxes excl. non-recurring items MSEK 1 000 900 800 700 600 500 400 300 200 100 0 Q1 Q2 Q3 Q4 Q1 Q2 Q3 Q4 Q1 Q2 Q3 Q4 Q1 Q2 Q3 1999 2000 2001 2002
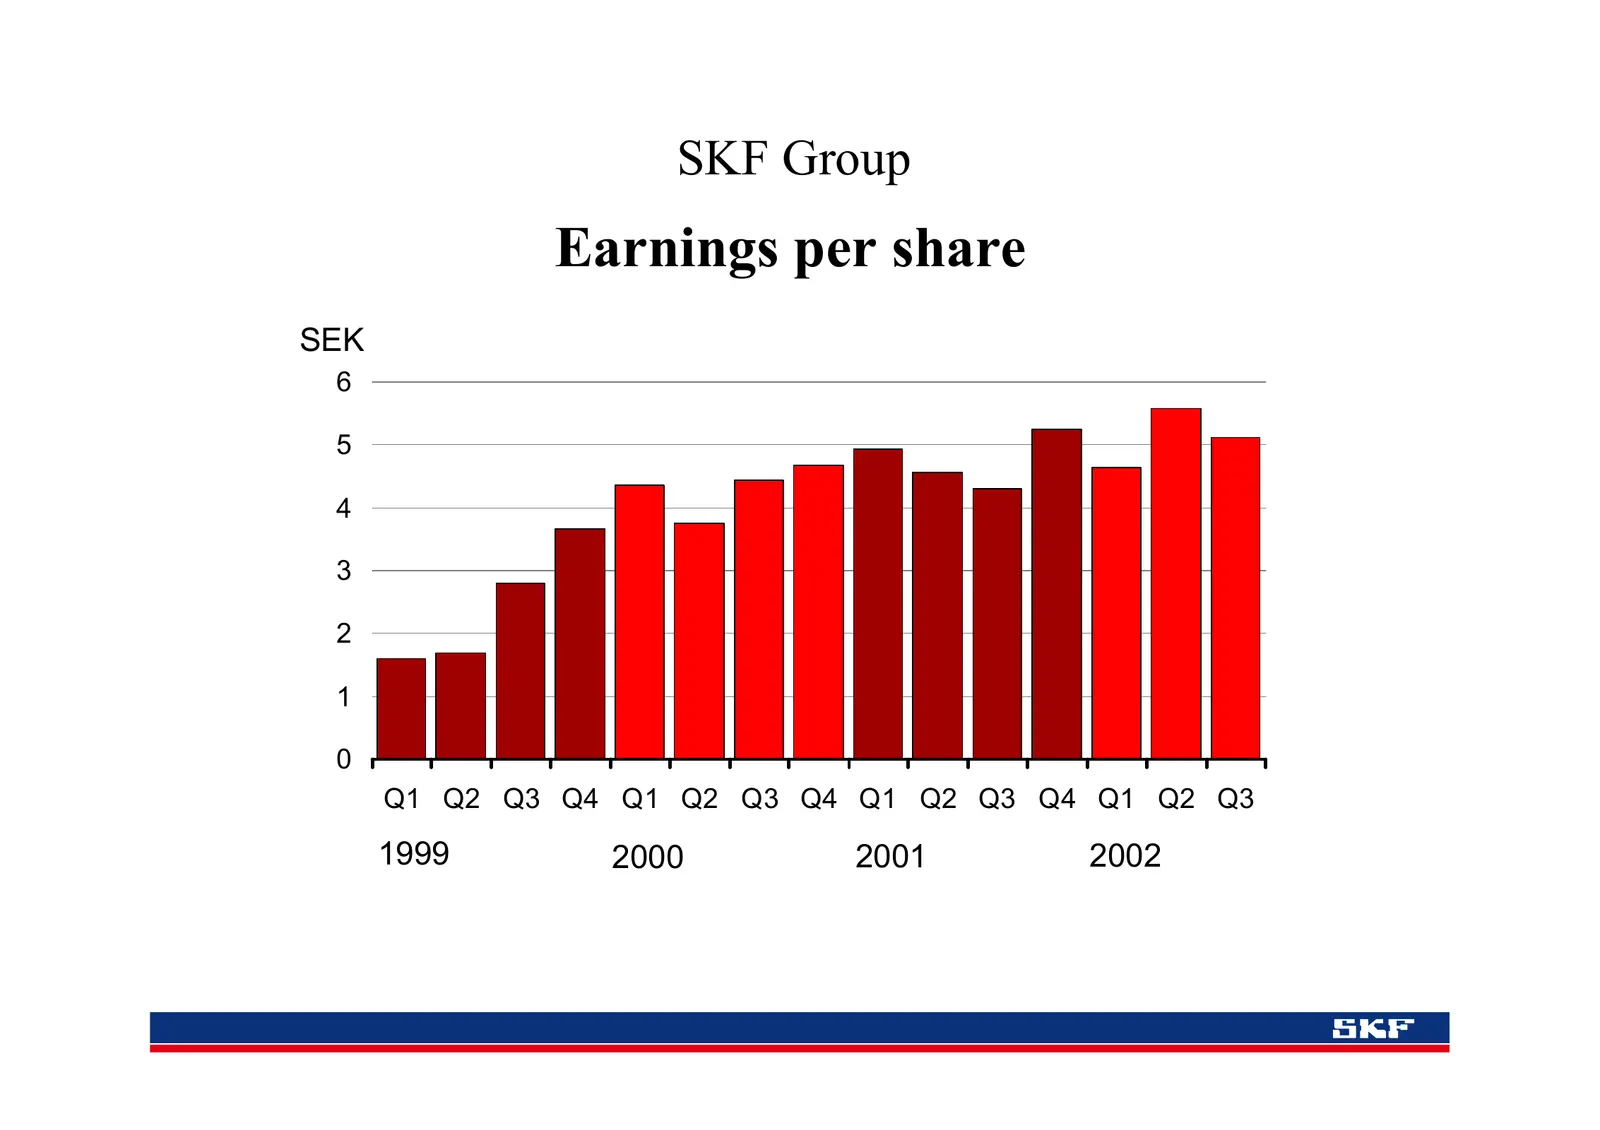
Slide 5: Earnings per share
SKF Group Earnings per share SEK 6 5 4 3 2 1 0 Q1 Q2 Q3 Q4 Q1 Q2 Q3 Q4 Q1 Q2 Q3 Q4 Q1 Q2 Q3 1999 2000 2001 2002
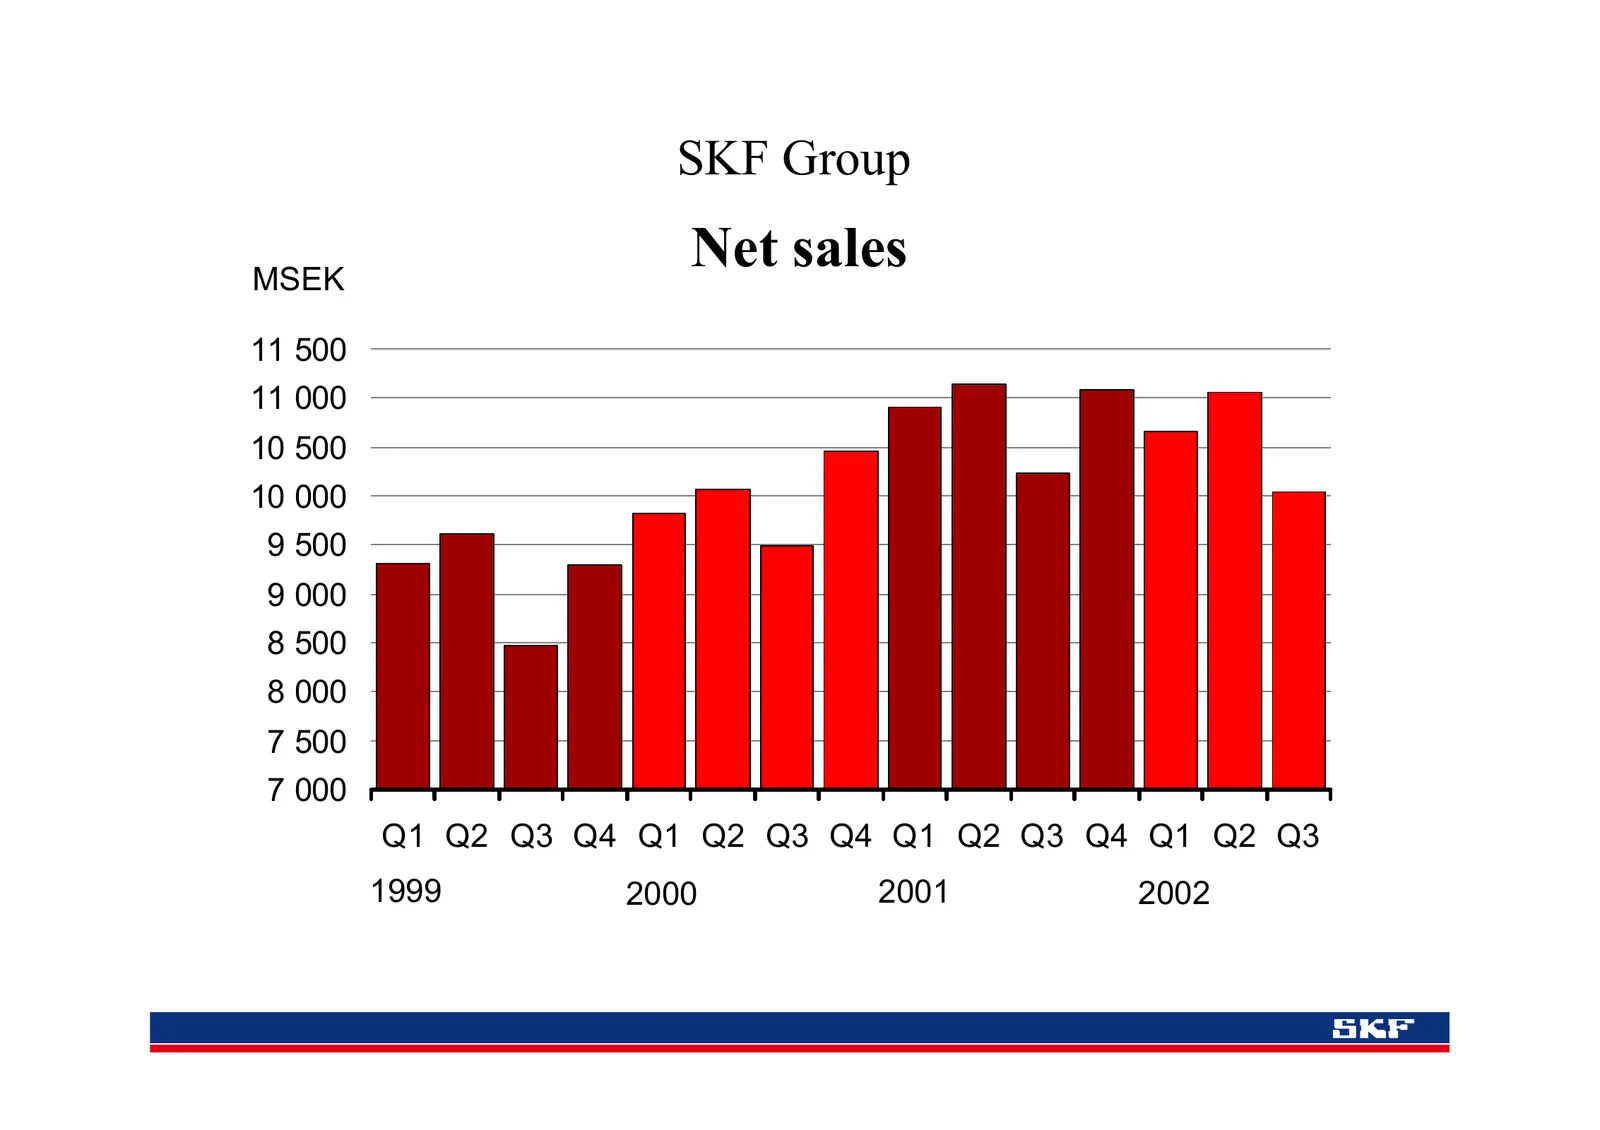
Slide 6: Net sales
SKF Group MSEK Net sales 11 500 11 000 10 500 10 000 9 500 9 000 8 500 8 000 7 500 7 000 Q1 Q2 Q3 Q4 Q1 Q2 Q3 Q4 Q1 Q2 Q3 Q4 Q1 Q2 Q3 1999 2000 2001 2002
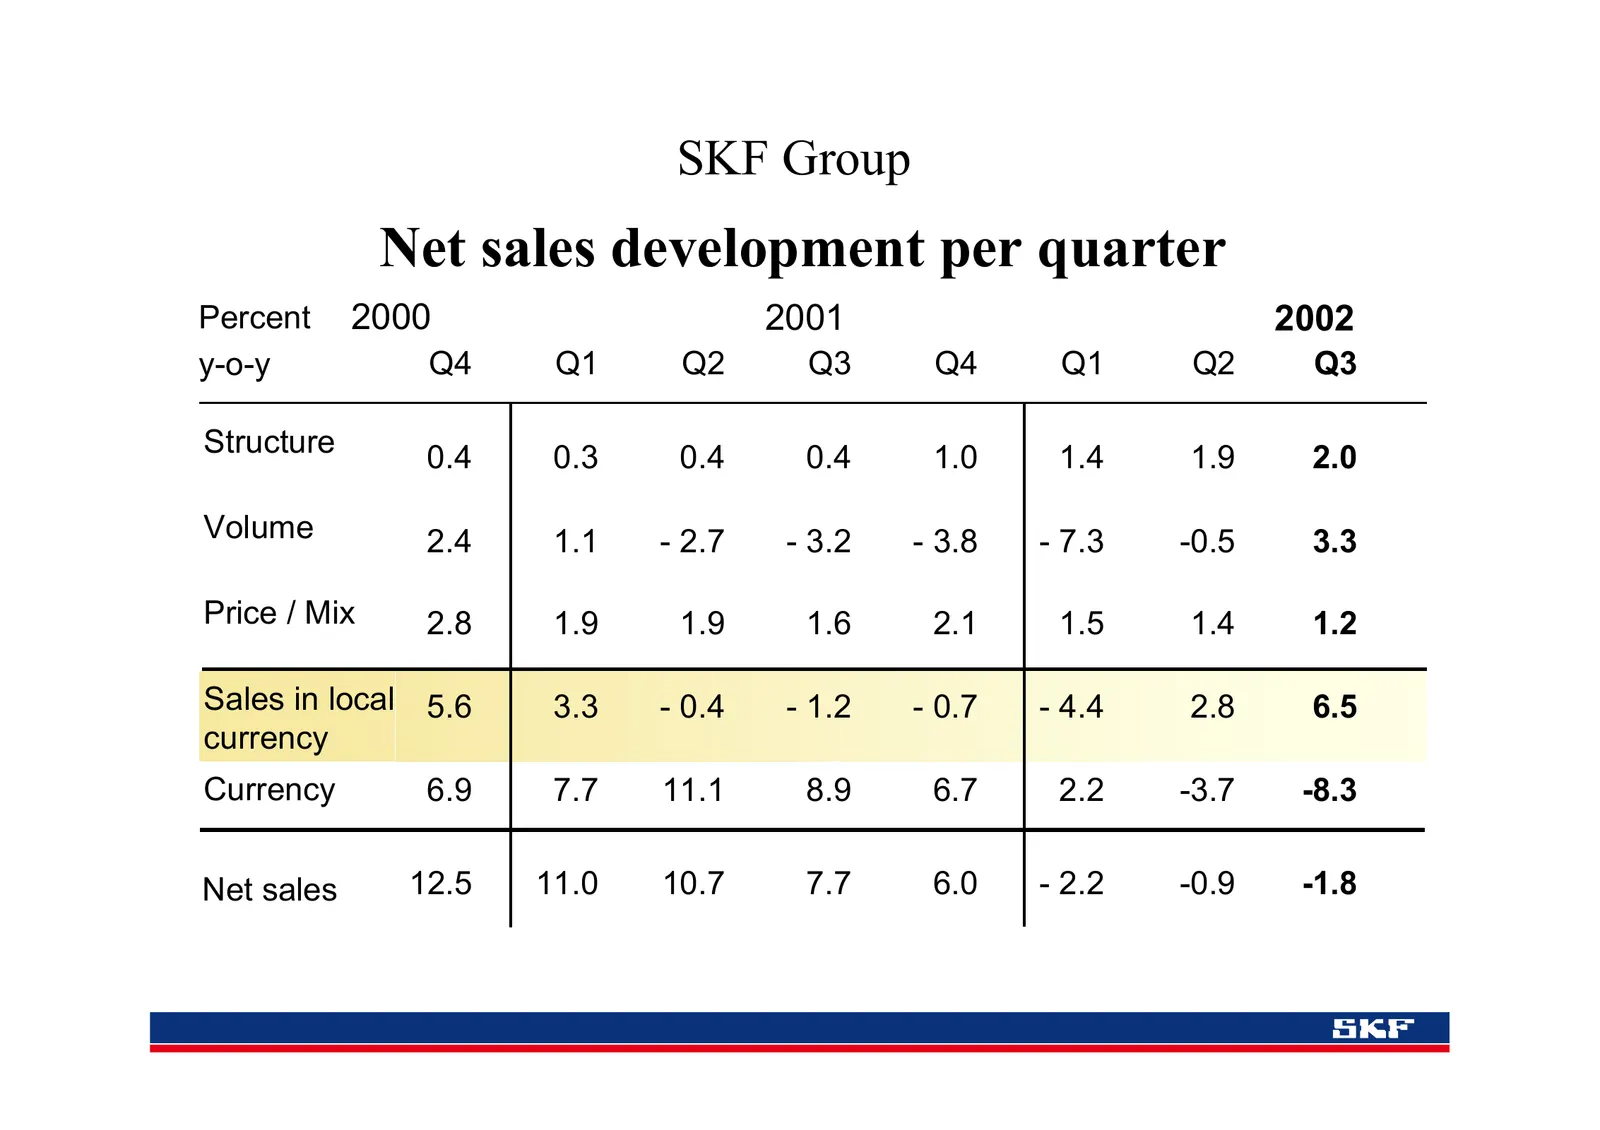
Slide 7: Net sales development per quarter
SKF Group Net sales development per quarter Percent 2000 2001 2002 y-o-y Q4 Q1 Q2 Q3 Q4 Q1 Q2 Q3 Structure 0.4 0.3 0.4 0.4 1.0 1.4 1.9 2.0 Volume 2.4 1.1 - 2.7 - 3.2 - 3.8 - 7.3 -0.5 3.3 Price / Mix 2.8 1.9 1.9 1.6 2.1 1.5 1.4 1.2 Sales in local 5.6 3.3 - 0.4 - 1.2 - 0.7 - 4.4 2.8 6.5 currency Curre
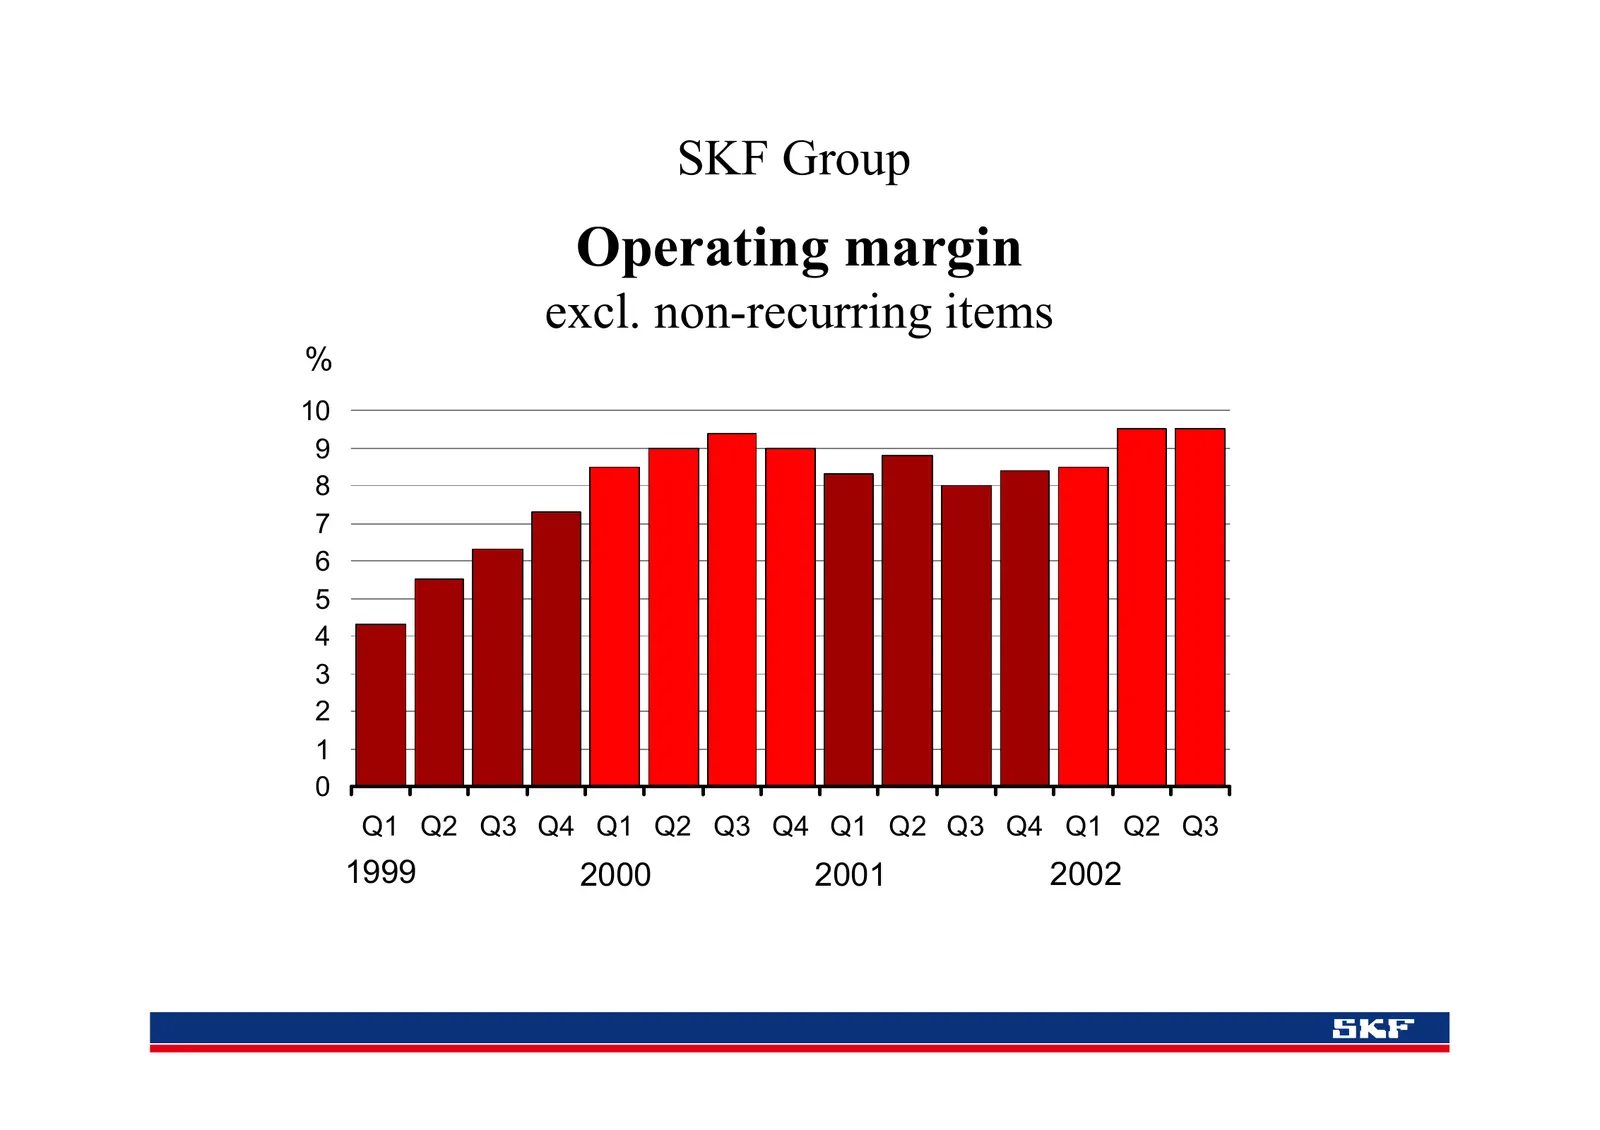
Slide 8: Operating margin
SKF Group Operating margin excl. non-recurring items % 10 9 8 7 6 5 4 3 2 1 0 Q1 Q2 Q3 Q4 Q1 Q2 Q3 Q4 Q1 Q2 Q3 Q4 Q1 Q2 Q3 1999 2000 2001 2002
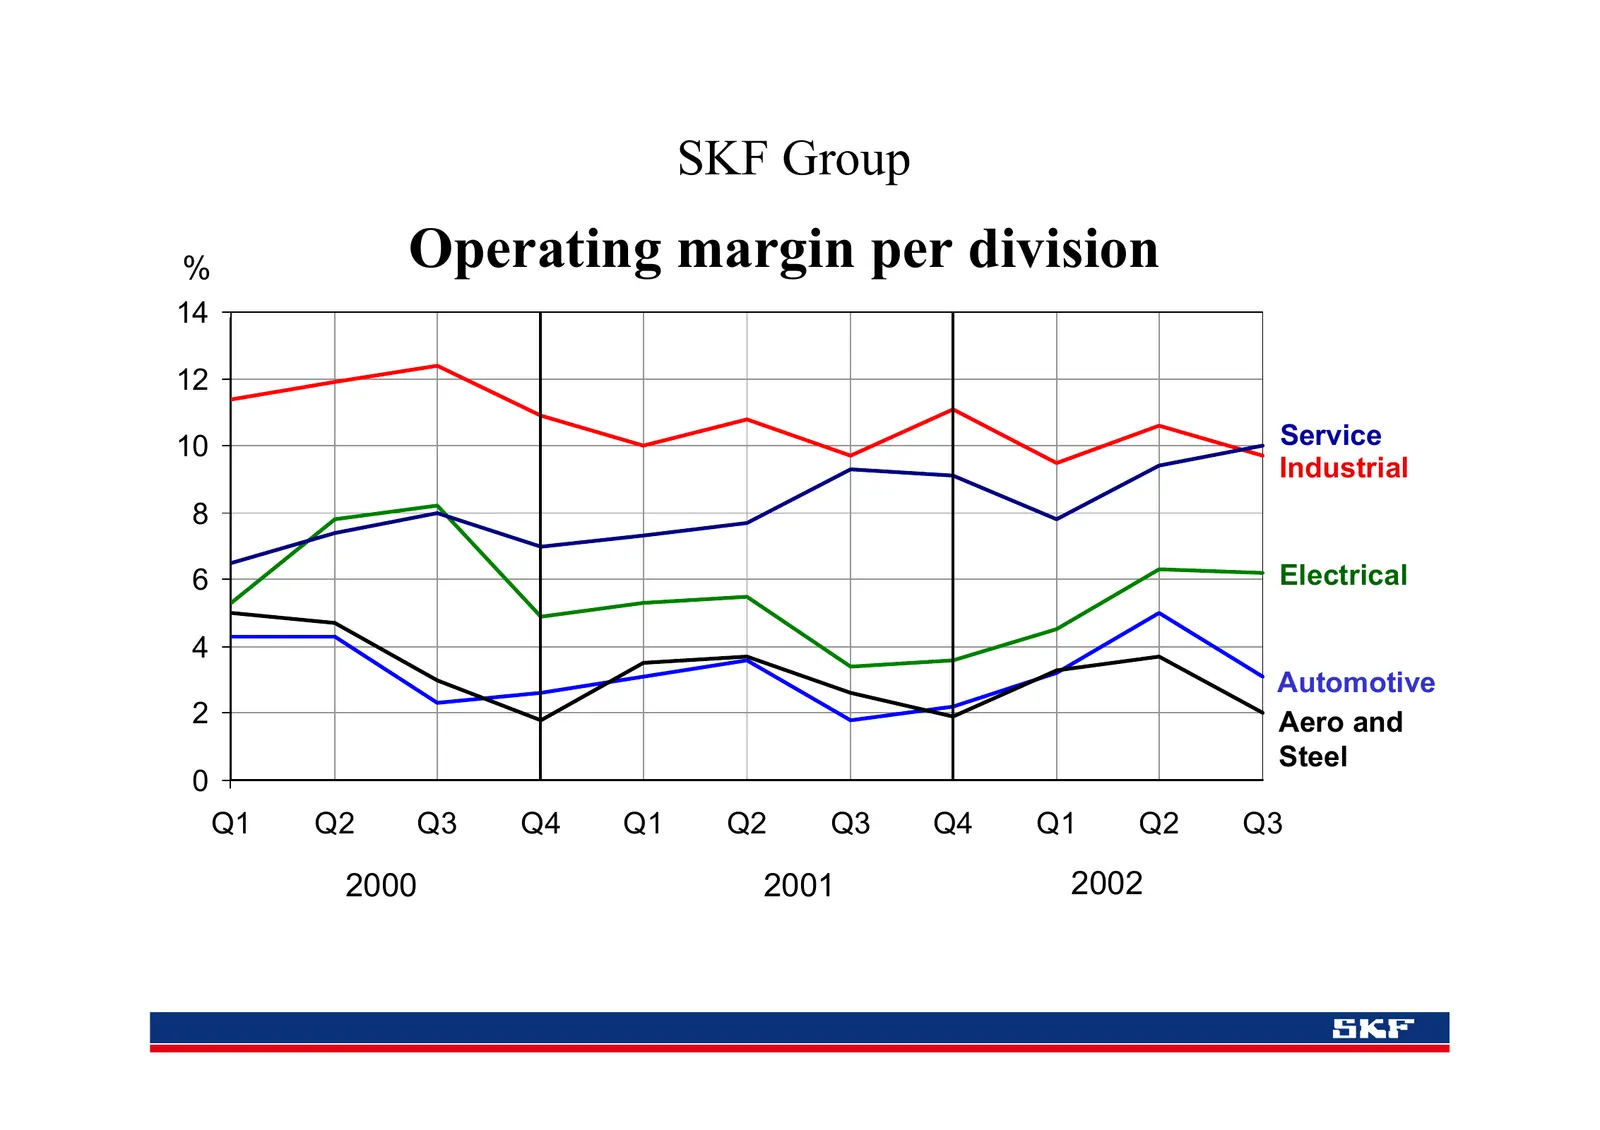
Slide 9: Operating margin per division
SKF Group % Operating margin per division 14 12 10 Service Industrial 8 6 Electrical 4 Automotive 2 Aero and Steel 0 Q1 Q2 Q3 Q4 Q1 Q2 Q3 Q4 Q1 Q2 Q3 2000 2001 2002
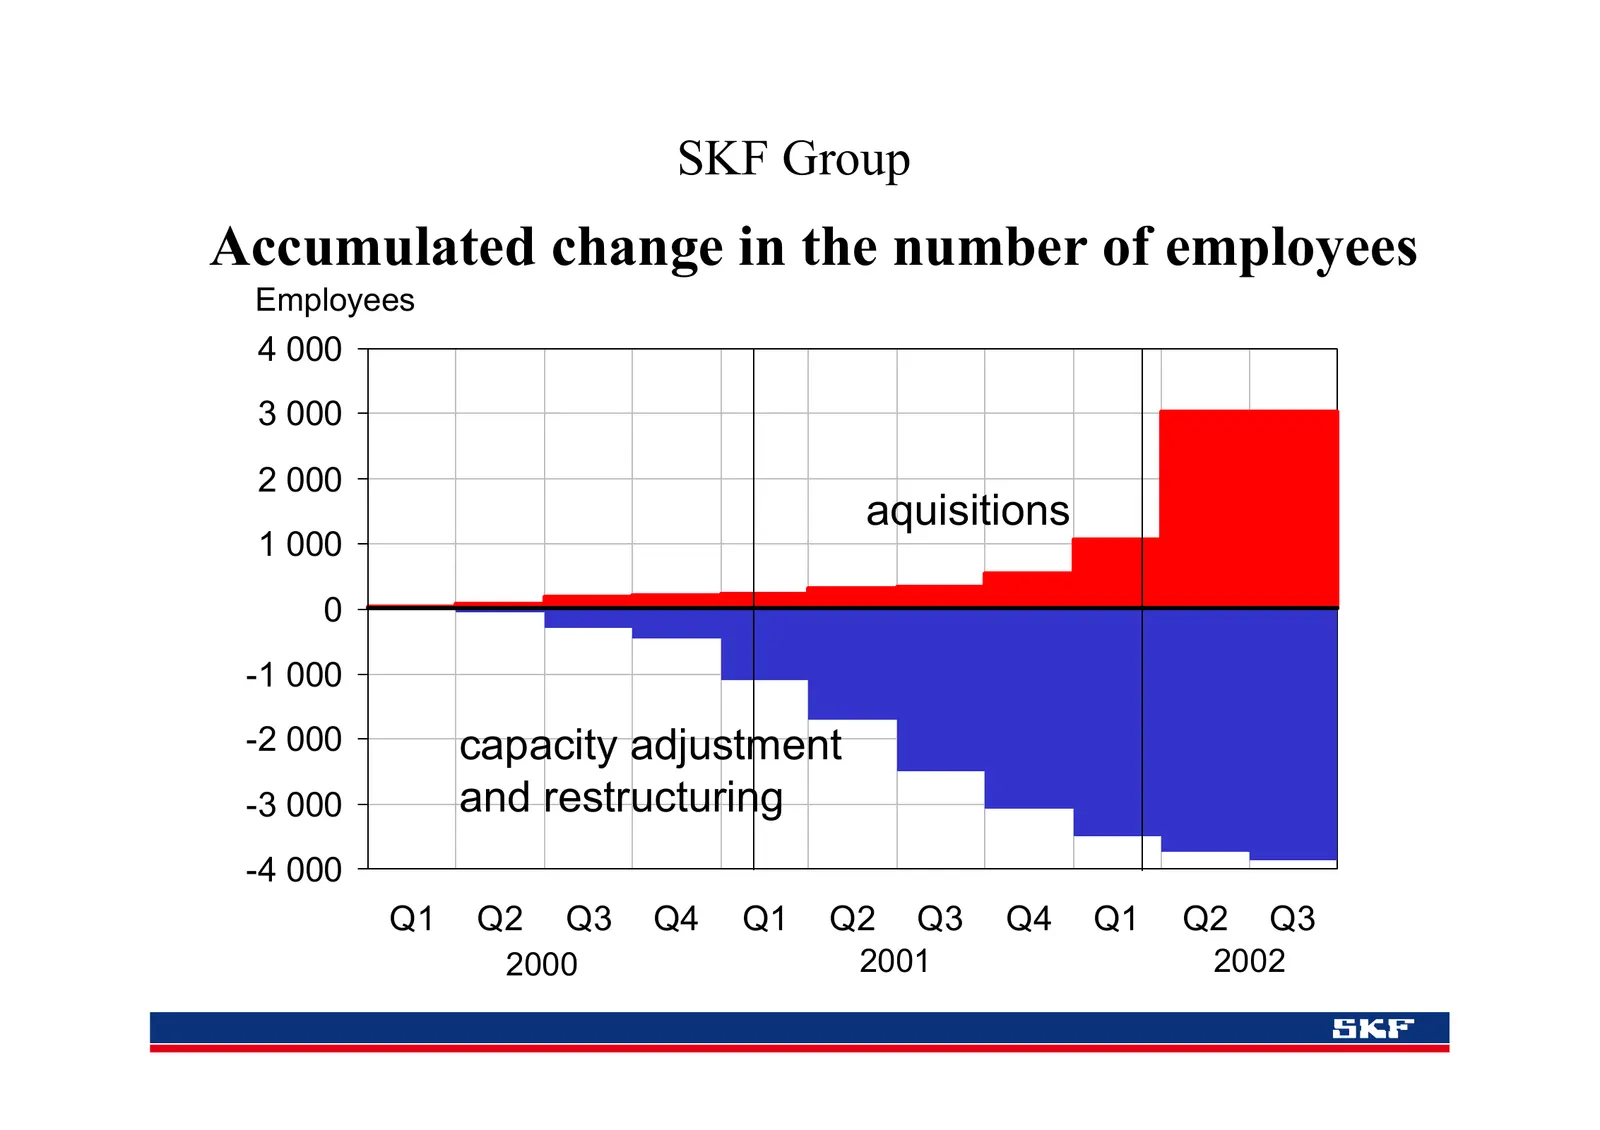
Slide 10: Accumulated change in the number of employees
SKF Group Accumulated change in the number of employees Employees 4 000 3 000 2 000 aquisitions 1 000 0 -1 000 -2 000 capacity adjustment -3 000 and restructuring -4 000 Q1 Q2 Q3 Q4 Q1 Q2 Q3 Q4 Q1 Q2 Q3 2000 2001 2002
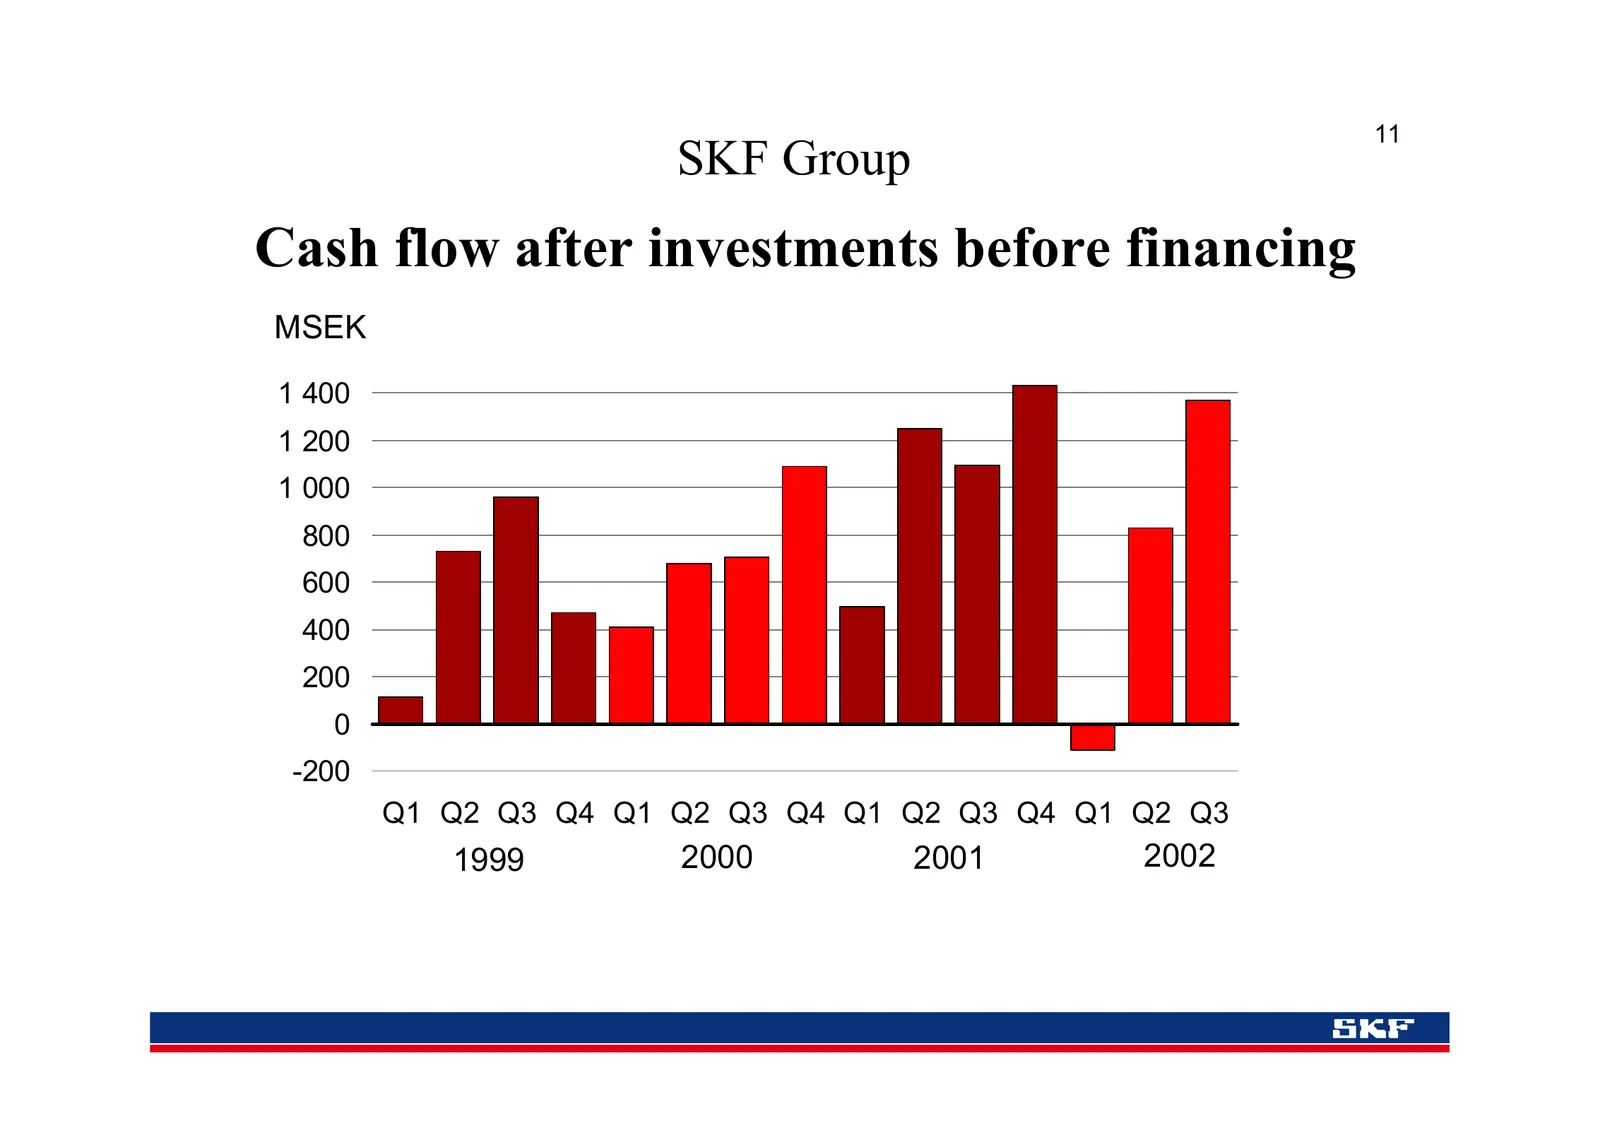
Slide 11: Cash flow after investments before financing
11 SKF Group Cash flow after investments before financing MSEK 1 400 1 200 1 000 800 600 400 200 0 -200 Q1 Q2 Q3 Q4 Q1 Q2 Q3 Q4 Q1 Q2 Q3 Q4 Q1 Q2 Q3 1999 2000 2001 2002
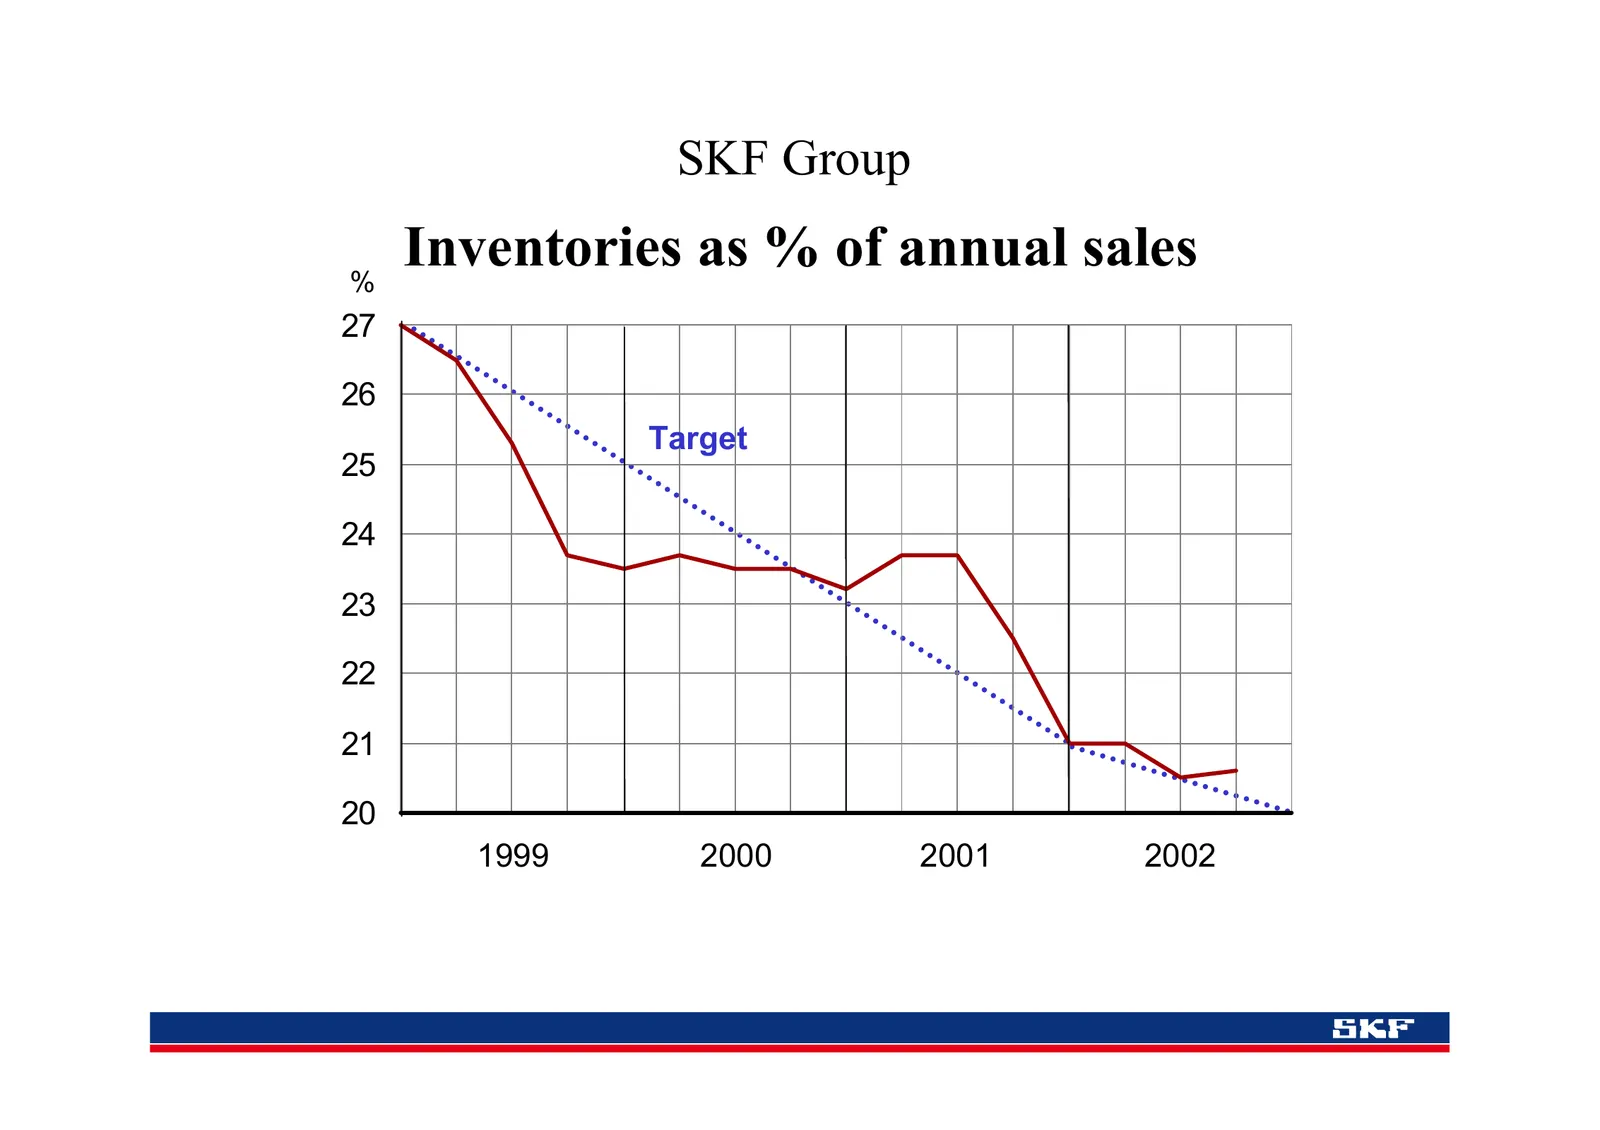
Slide 12: Inventories as % of annual sales
SKF Group % Inventories as % of annual sales 27 26 Target 25 24 23 22 21 20 1999 2000 2001 2002
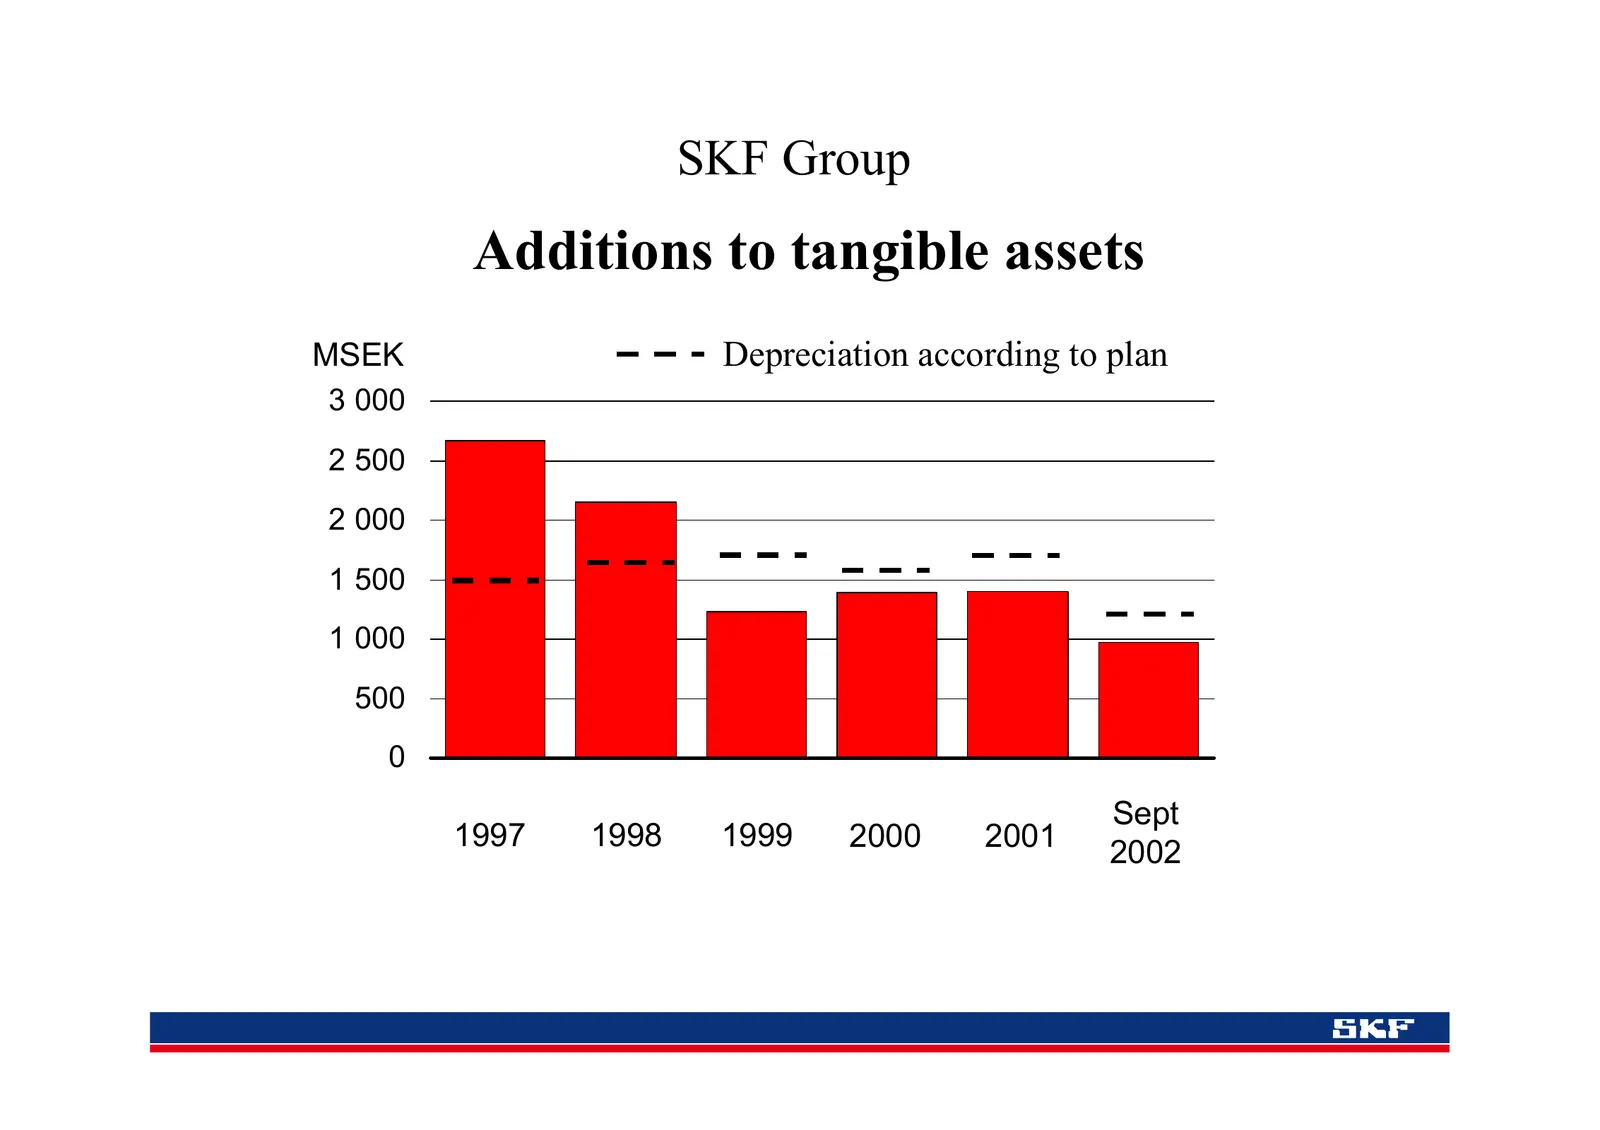
Slide 13: Additions to tangible assets
SKF Group Additions to tangible assets MSEK Depreciation according to plan 3 000 2 500 2 000 1 500 1 000 500 0 Sept 1997 1998 1999 2000 2001 2002
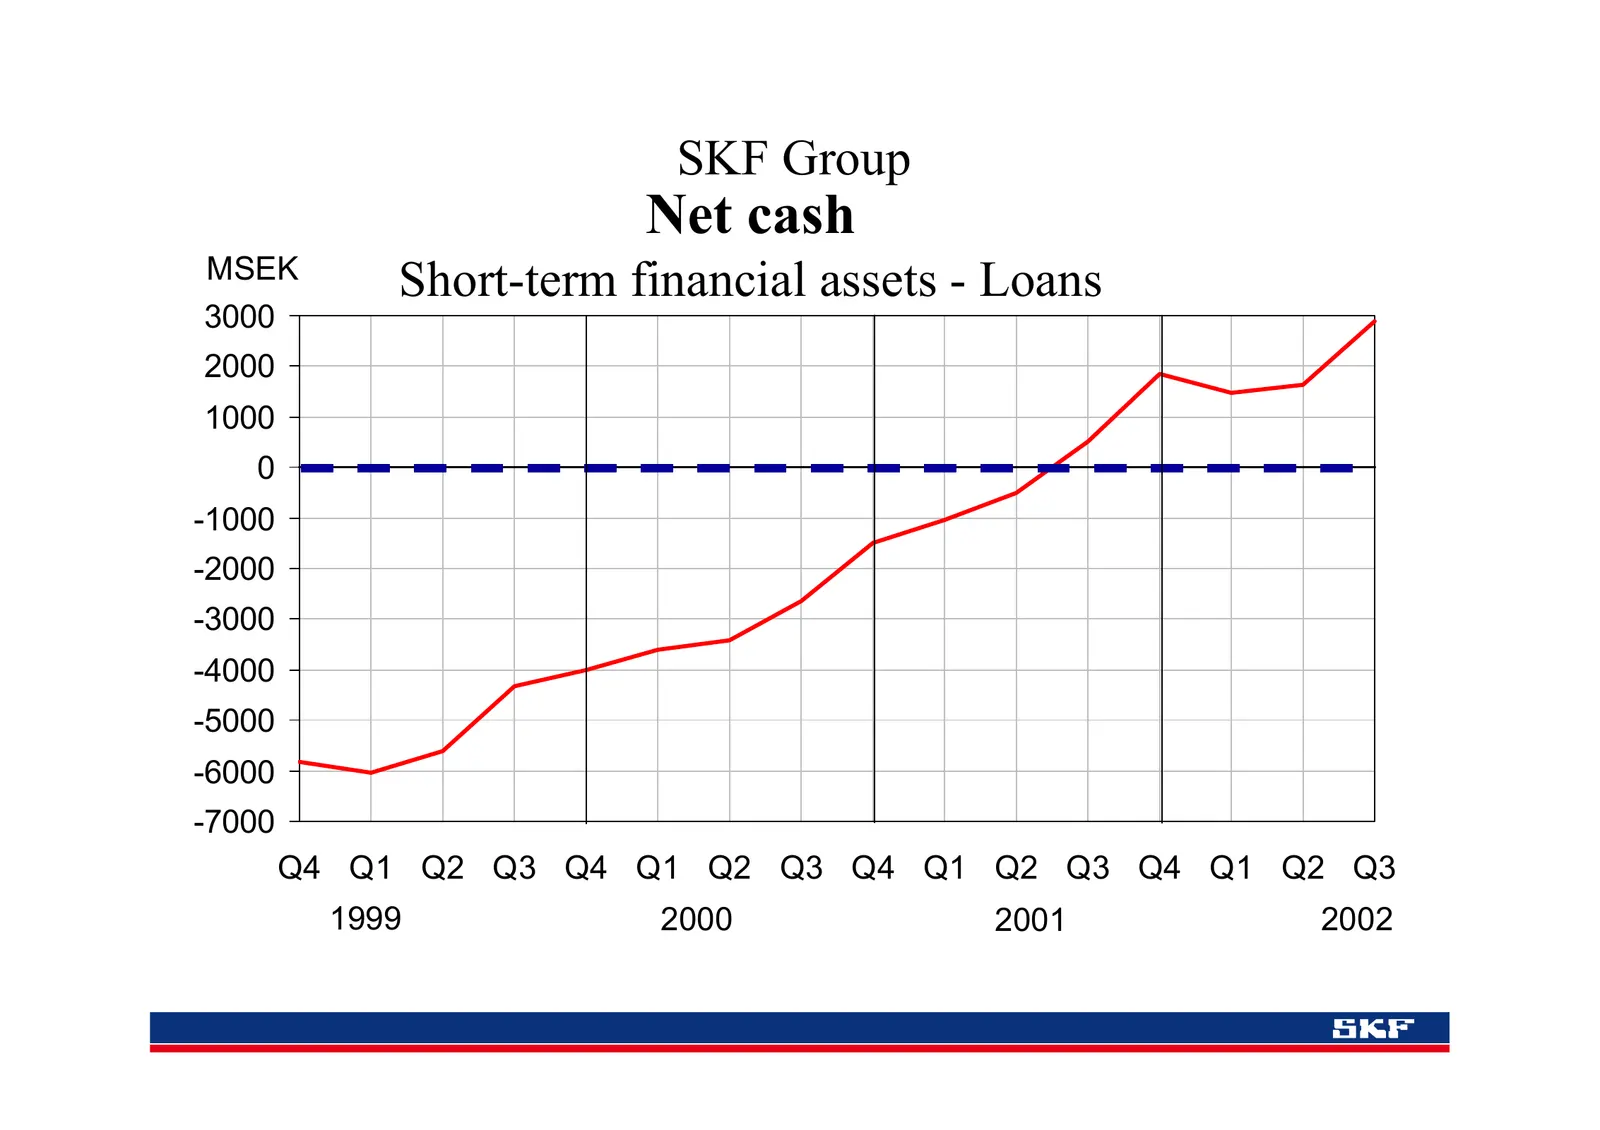
Slide 14: Net cash
SKF Group Net cash MSEK Short-term financial assets - Loans 3000 2000 1000 0 -1000 -2000 -3000 -4000 -5000 -6000 -7000 Q4 Q1 Q2 Q3 Q4 Q1 Q2 Q3 Q4 Q1 Q2 Q3 Q4 Q1 Q2 Q3 1999 2000 2001 2002
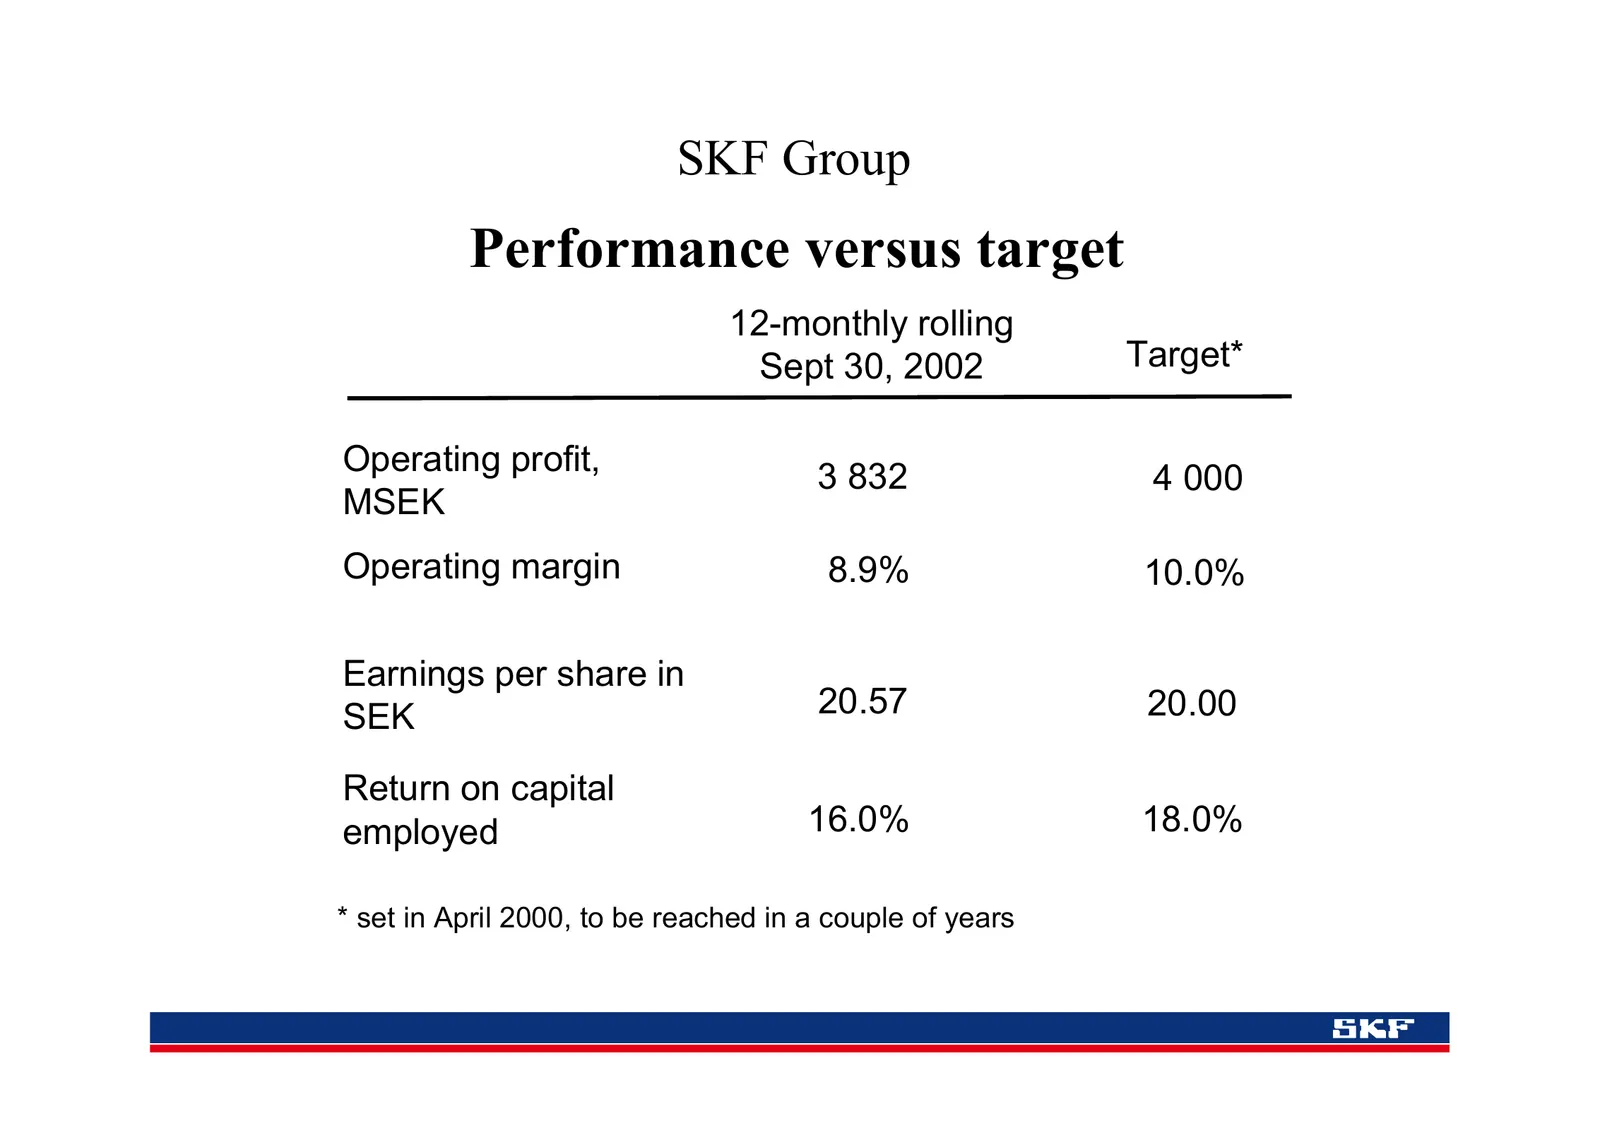
Slide 15: Performance versus target
SKF Group Performance versus target 12-monthly rolling Sept 30, 2002 Target* Operating profit, 3 832 4 000 MSEK Operating margin 8.9% 10.0% Earnings per share in SEK 20.57 20.00 Return on capital employed 16.0% 18.0% * set in April 2000, to be reached in a couple of years
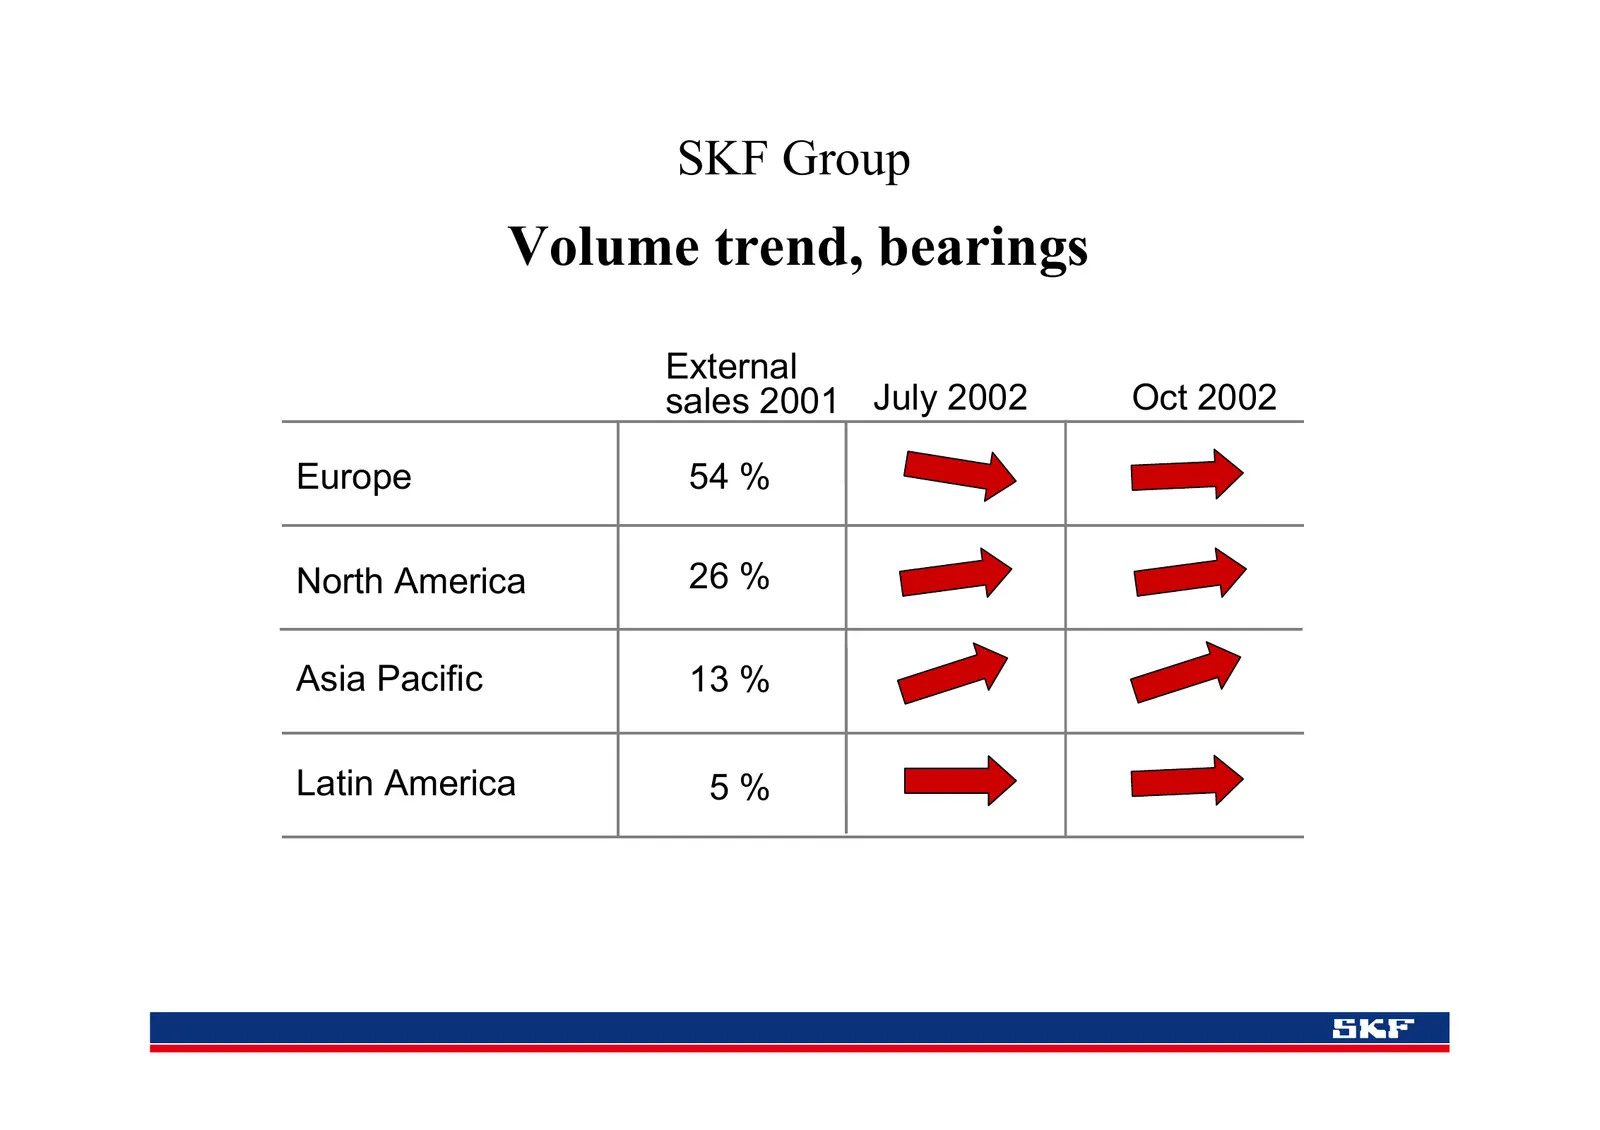
Slide 16: Volume trend, bearings
SKF Group Volume trend, bearings External sales 2001 July 2002 Oct 2002 Europe 54 % North America 26 % Asia Pacific 13 % Latin America 5%
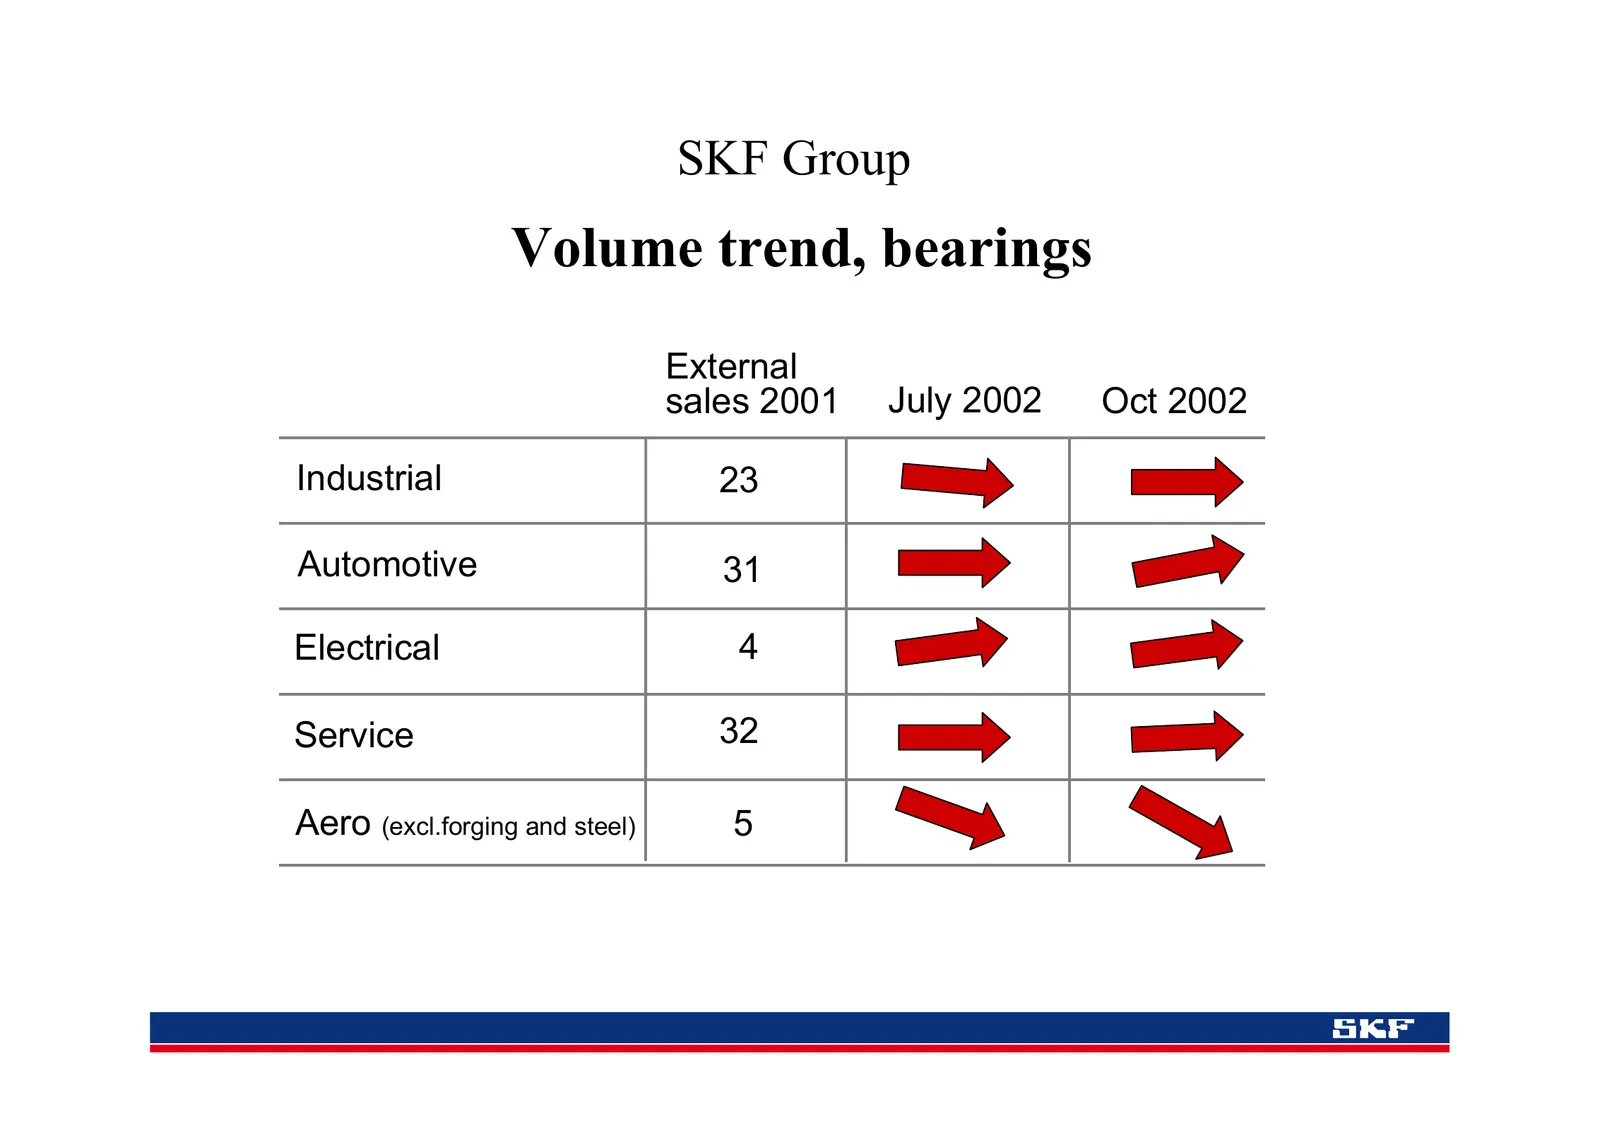
Slide 17: Volume trend, bearings
SKF Group Volume trend, bearings External sales 2001 July 2002 Oct 2002 Industrial 23 Automotive 31 Electrical 4 Service 32 Aero (excl.forging and steel) 5
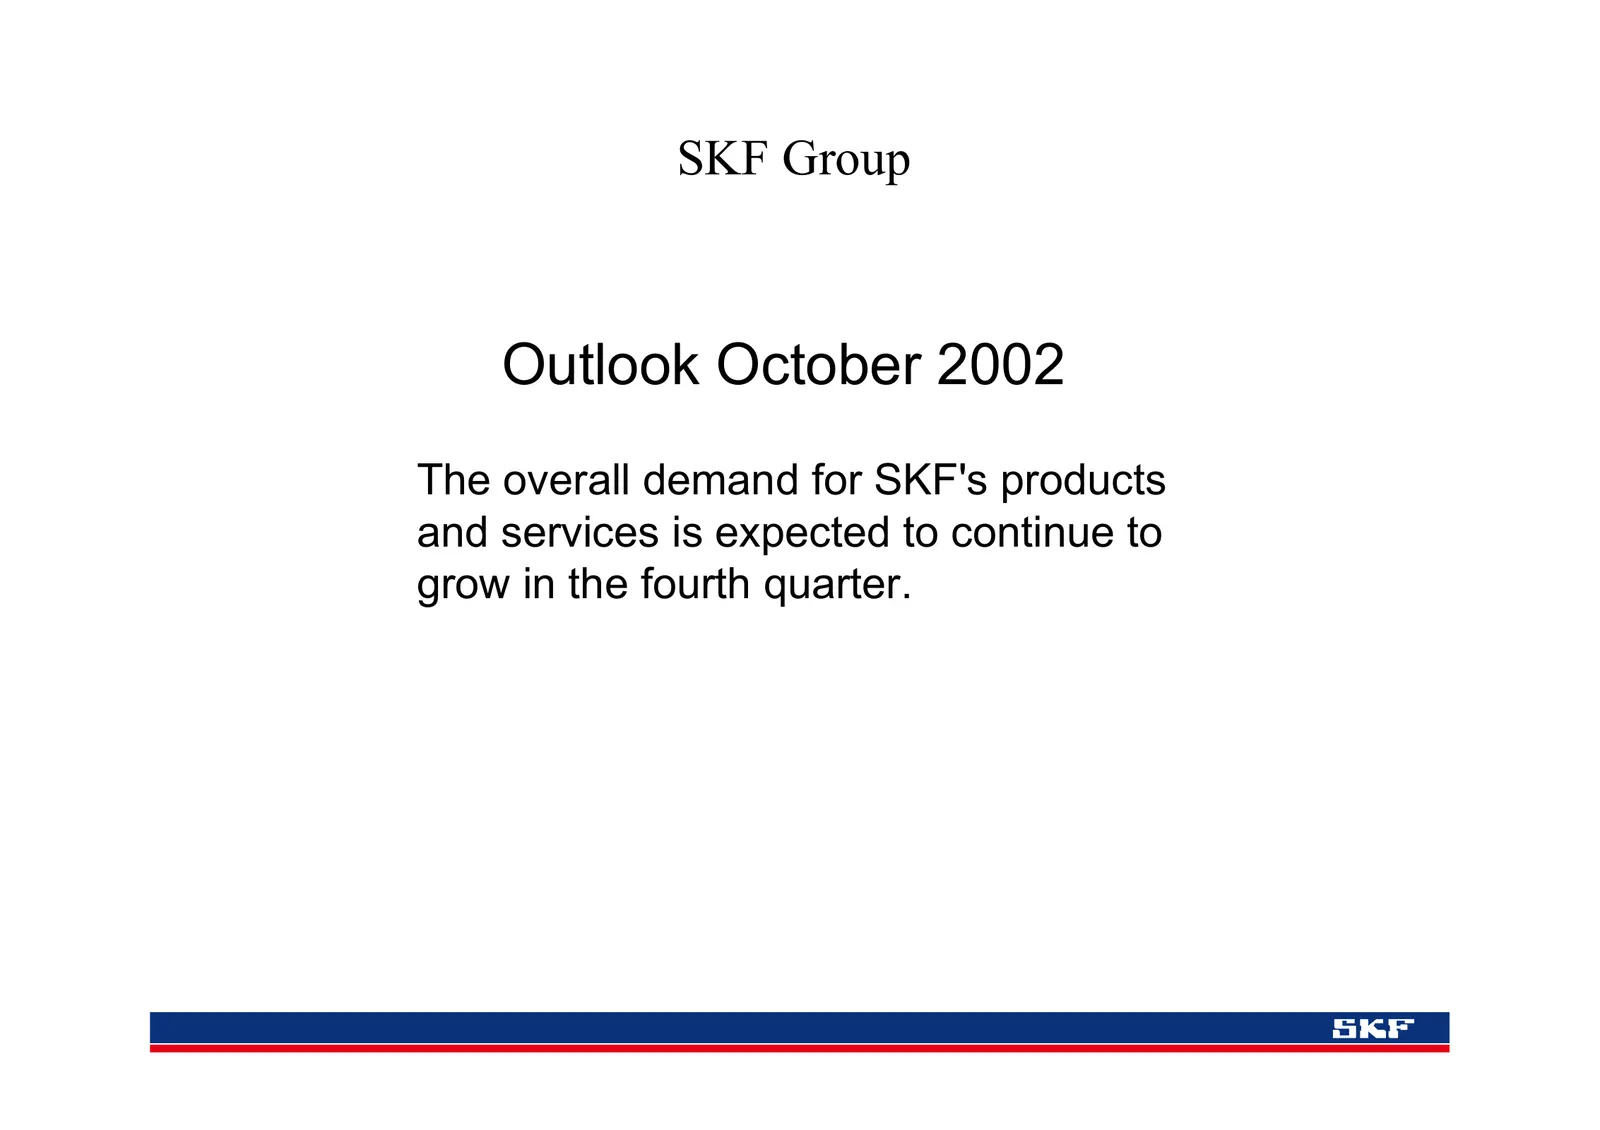
Slide 18: Outlook October 2002
SKF Group Outlook October 2002 The overall demand for SKF's products and services is expected to continue to grow in the fourth quarter.
Source: Internet Archive copy of investors.skf.com
More decks from SKF AB Class A
 Q3 2026 Earnings Presentation20 slides · Oct 21, 2026
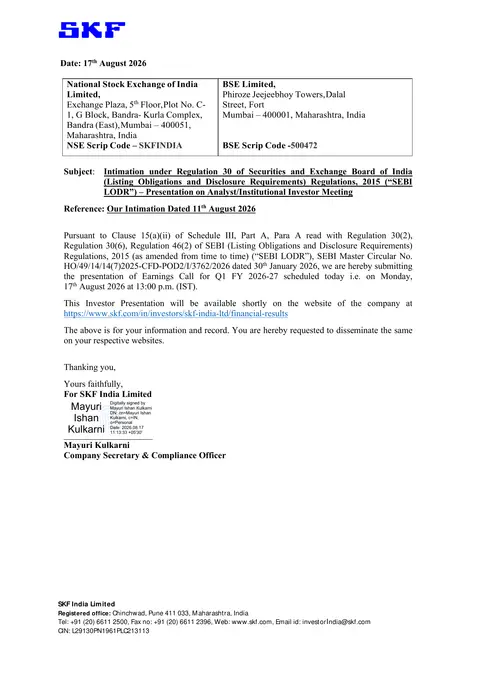 SKF India — Q1 FY2026-27 Earnings Presentation20 slides · Aug 17, 2026
 Q2 2026 Earnings Presentation21 slides · Jul 17, 2026
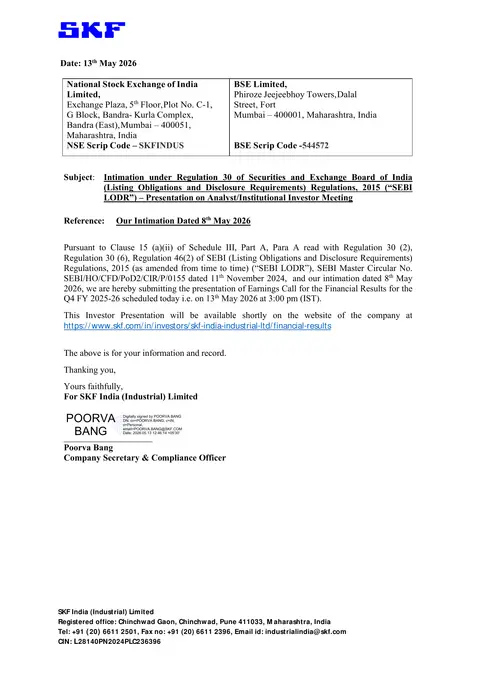 SKF India (Industrial) — Q4 FY2026 Earnings Presentation20 slides · May 13, 2026
 Q1 2026 Earnings Presentation22 slides · Apr 21, 2026
 Q4 2025 Earnings Presentation19 slides · Jan 30, 2026