Sembcorp Industries Ltd. · SGX:U96
Sembcorp Industries — FY2021 Earnings Presentation
29 slides from Sembcorp Industries's earnings presentation, Feb 23, 2022
Slide 1: FY2021 Results Announcement
FY2021 Results Announcement February 23, 2022
Slide 2: CEO's Report
CEO’s Report Wong Kim Yin Group President & CEO © Sembcorp Industries 2022
Slide 3: FY2021 Group Performance Round-up
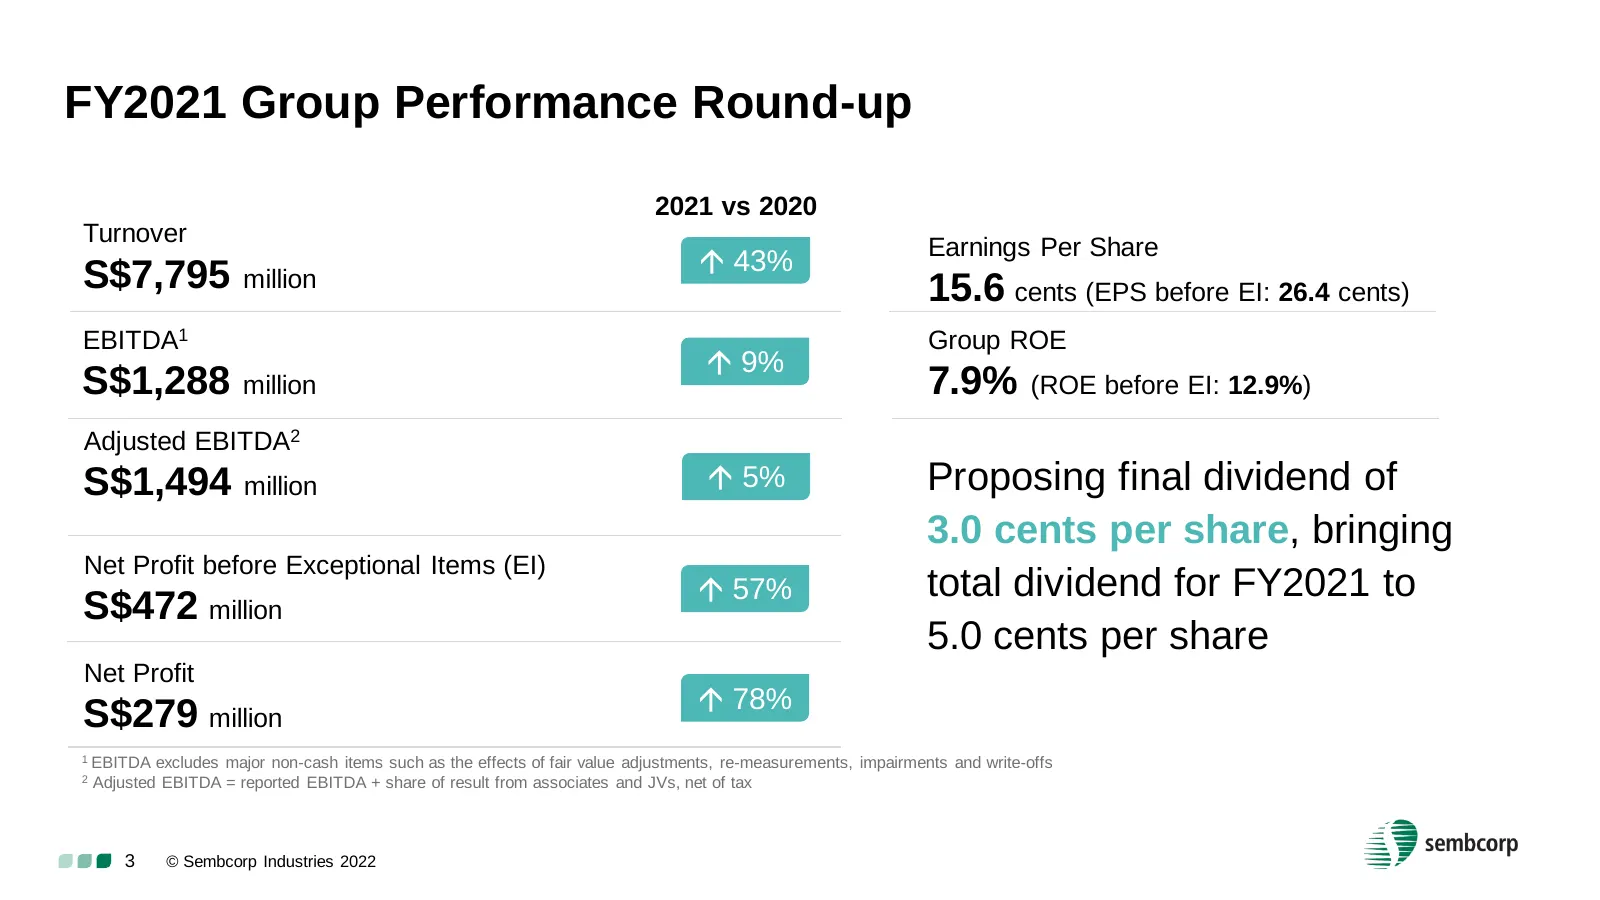
FY2021 Group Performance Round-up 2021 vs 2020 Turnover Earnings Per Share 43% S$7,795 million 15.6 cents (EPS before EI: 26.4 cents) EBITDA1 Group ROE 9% S$1,288 million 7.9% (ROE before EI: 12.9%) Adjusted EBITDA2 S$1,494 million 5% Proposing final dividend of 3.0 cents per share, bringing N
Slide 4: Business Updates: Renewables
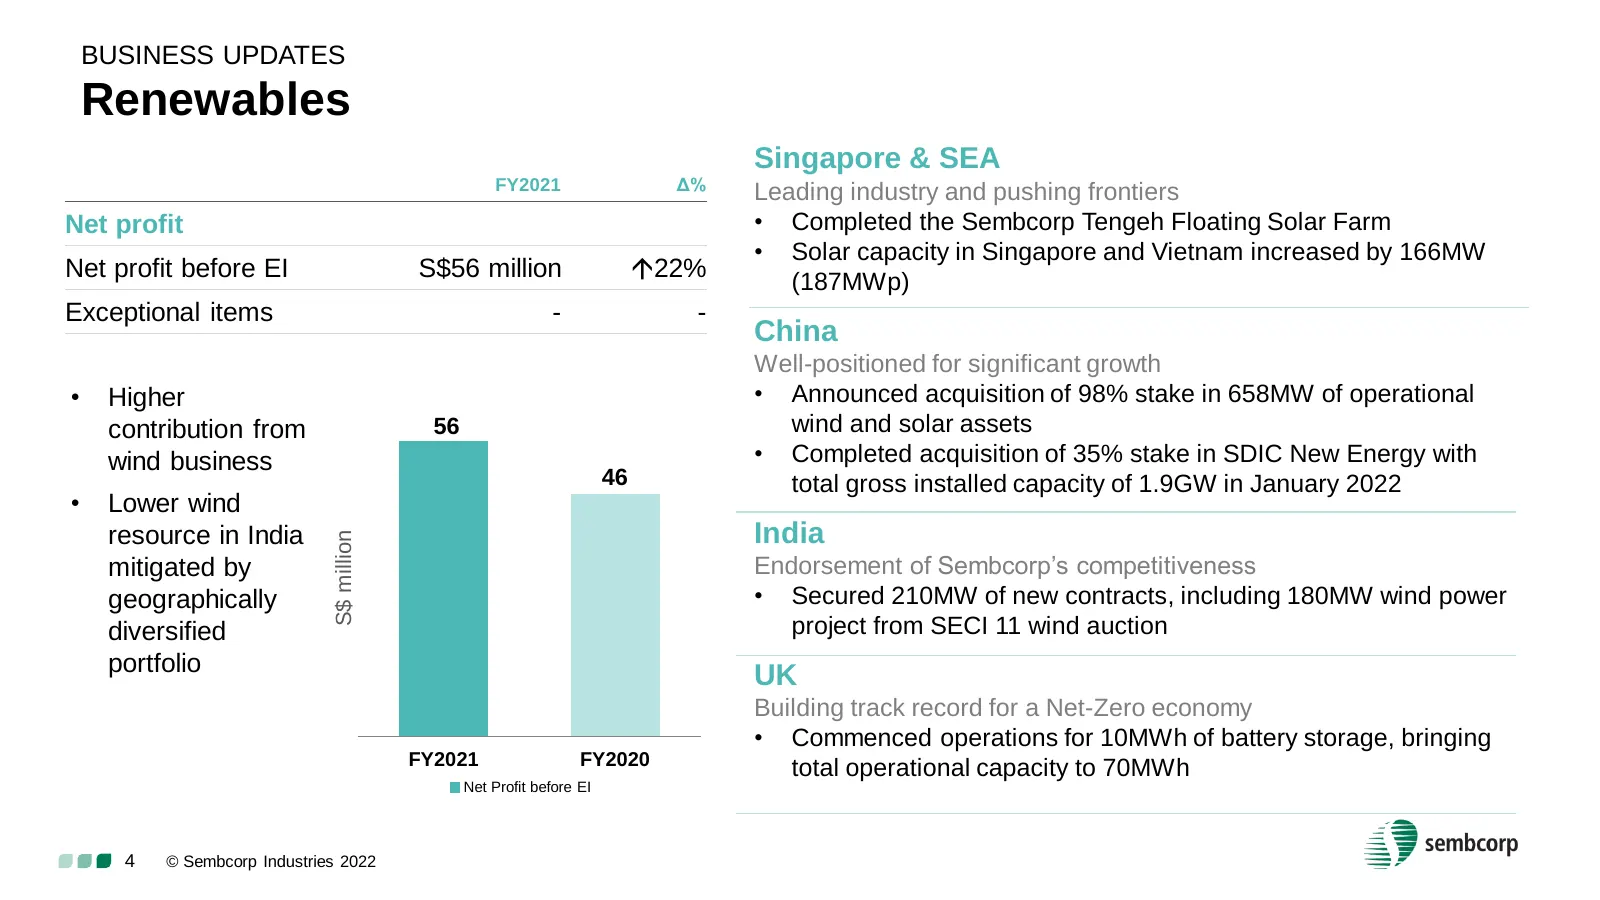
BUSINESS UPDATES Renewables Singapore & SEA FY2021 Δ% Leading industry and pushing frontiers Net profit • Completed the Sembcorp Tengeh Floating Solar Farm • Solar capacity in Singapore and Vietnam increased by 166MW Net profit before EI S$56 million 22% (187MWp) Exceptional items - - China Well-po
Slide 5: Renewables: Executing on Growth Strategy
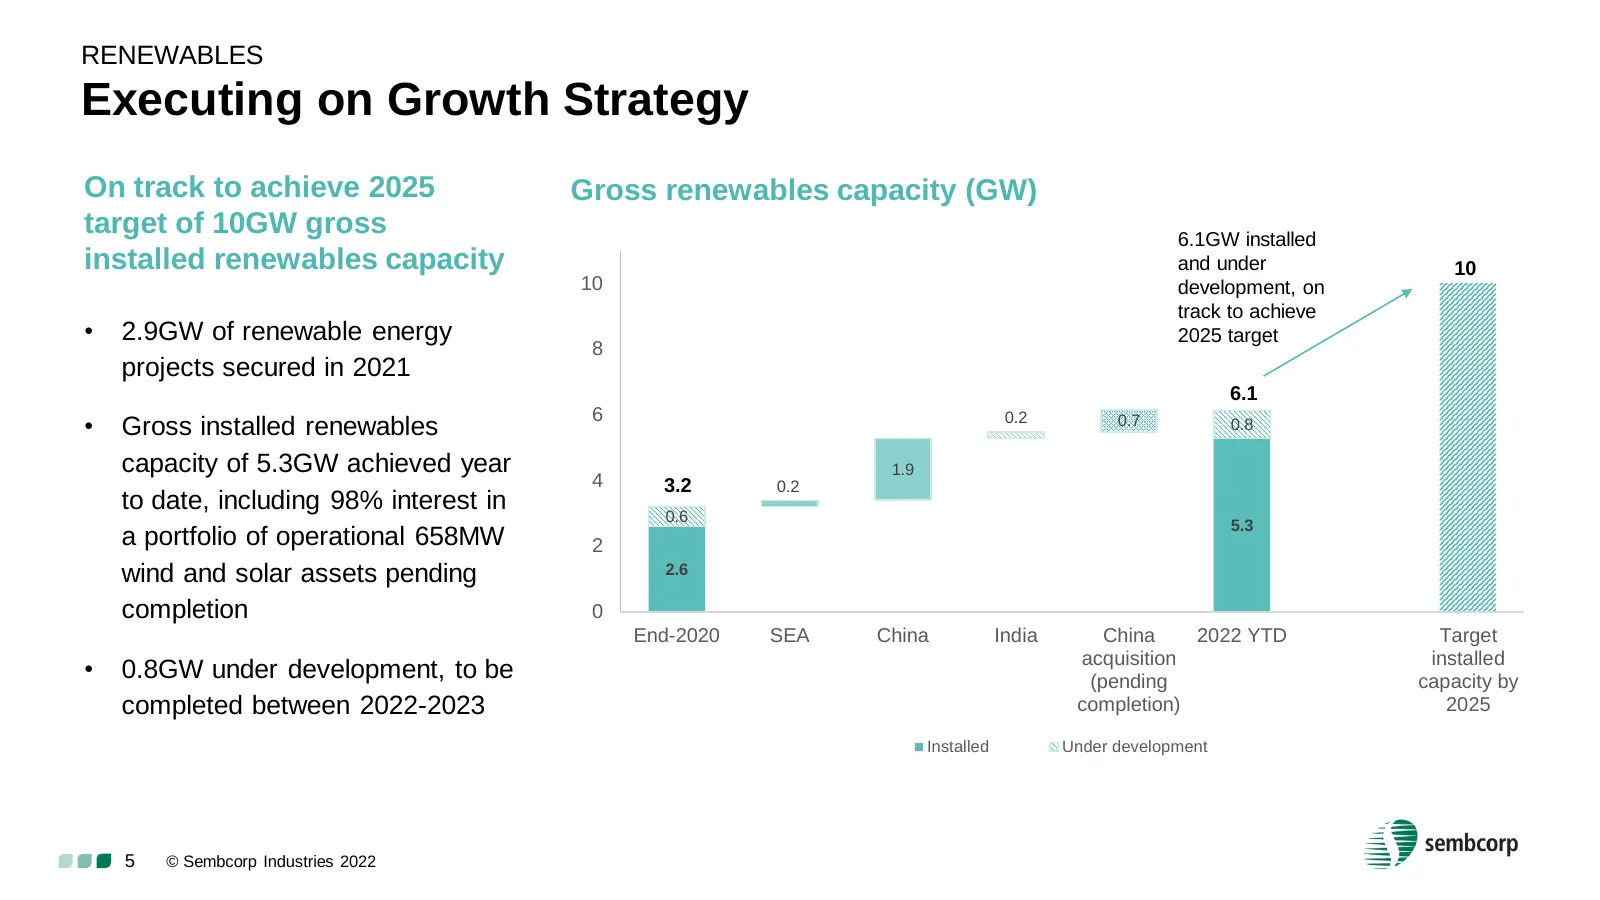
RENEWABLES Executing on Growth Strategy On track to achieve 2025 Gross renewables capacity (GW) target of 10GW gross 6.1GW installed installed renewables capacity and under 10 10 development, on track to achieve • 2.9GW of renewable energy 2025 target 8 projects secured in 2021 6.1 6 0.2 • Gross ins
Slide 6: Business Updates: Integrated Urban Solutions
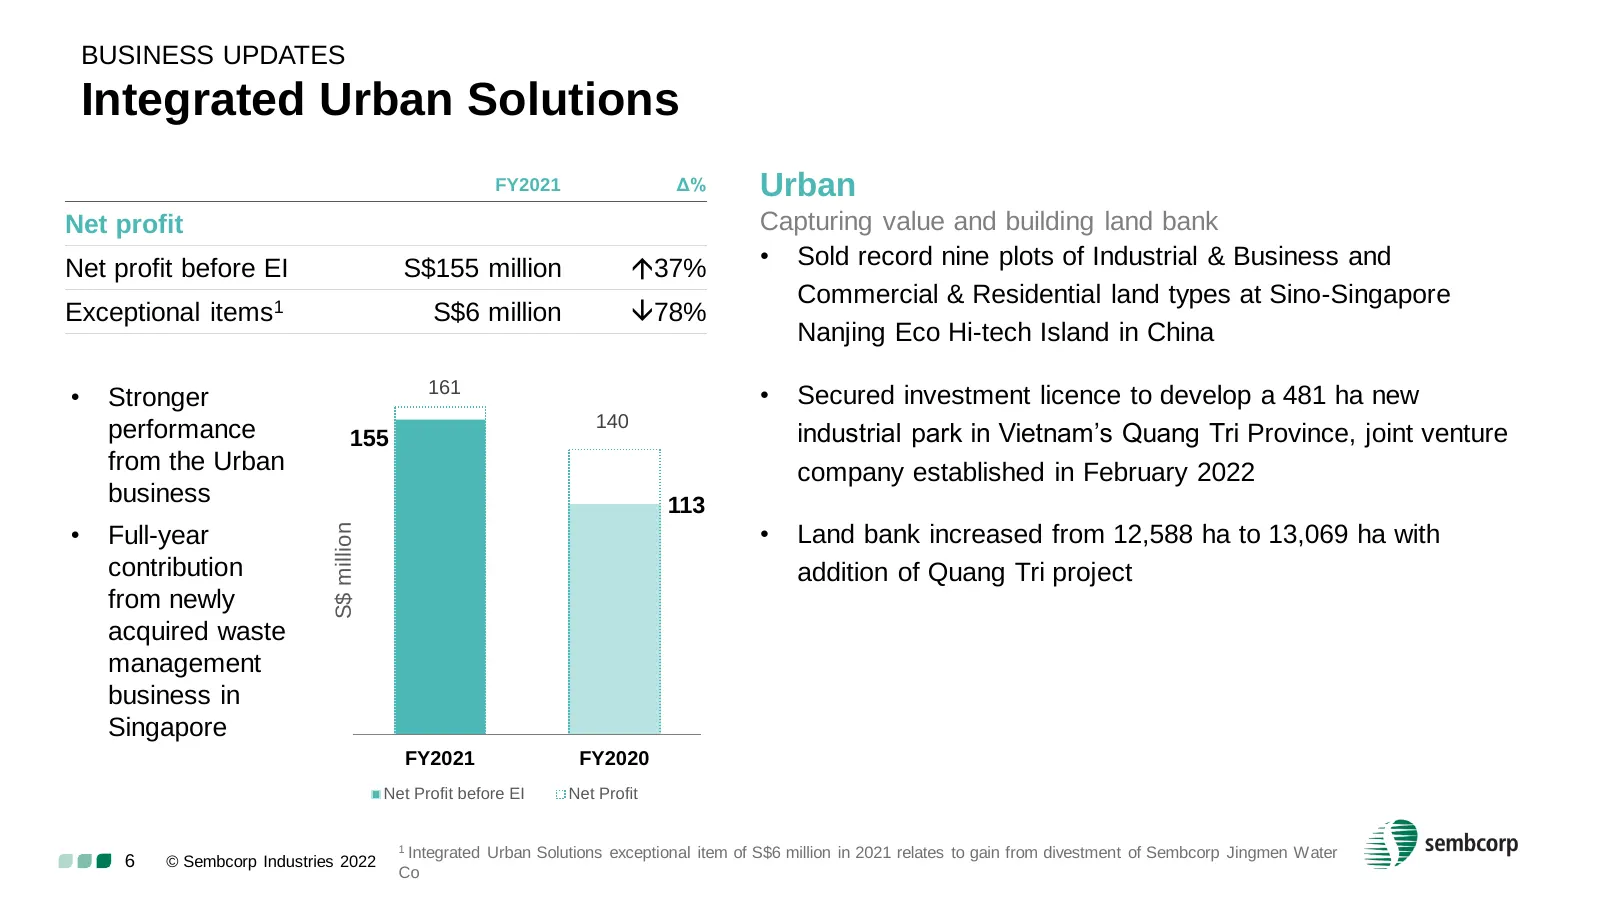
BUSINESS UPDATES Integrated Urban Solutions FY2021 Δ% Urban Net profit Capturing value and building land bank Net profit before EI S$155 million 37% • Sold record nine plots of Industrial & Business and Commercial & Residential land types at Sino-Singapore Exceptional items1 S$6 million 78% Nanjin
Slide 7: Business Updates: Conventional Energy
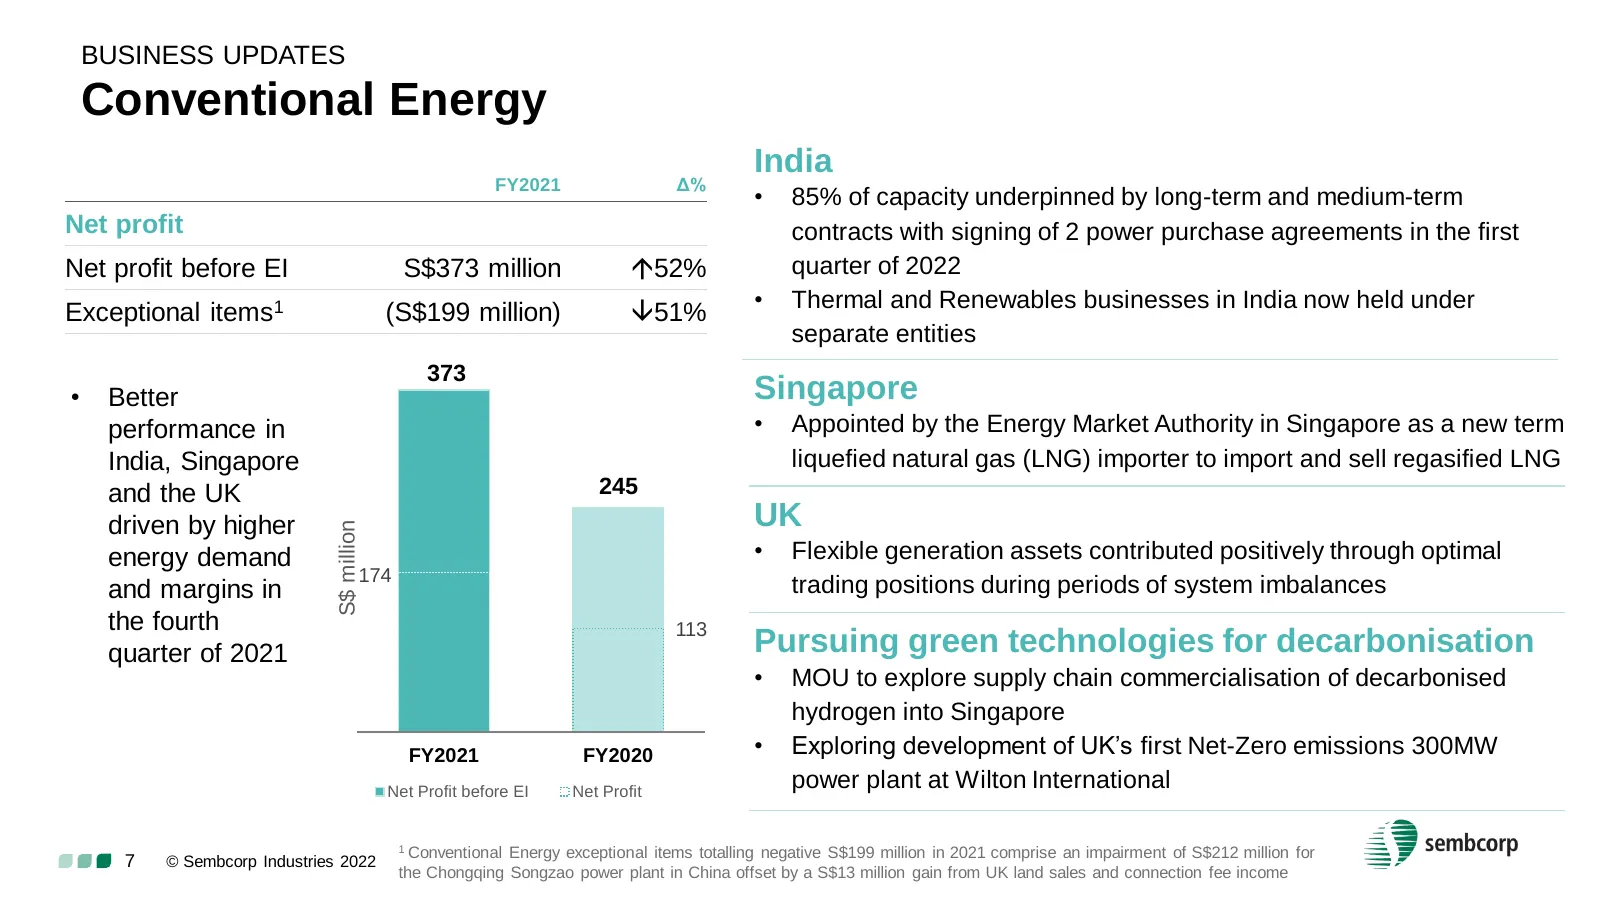
BUSINESS UPDATES Conventional Energy India FY2021 Δ% • 85% of capacity underpinned by long-term and medium-term Net profit contracts with signing of 2 power purchase agreements in the first Net profit before EI S$373 million 52% quarter of 2022 • Thermal and Renewables businesses in India now held
Slide 8: Transforming our Portfolio from Brown to Green
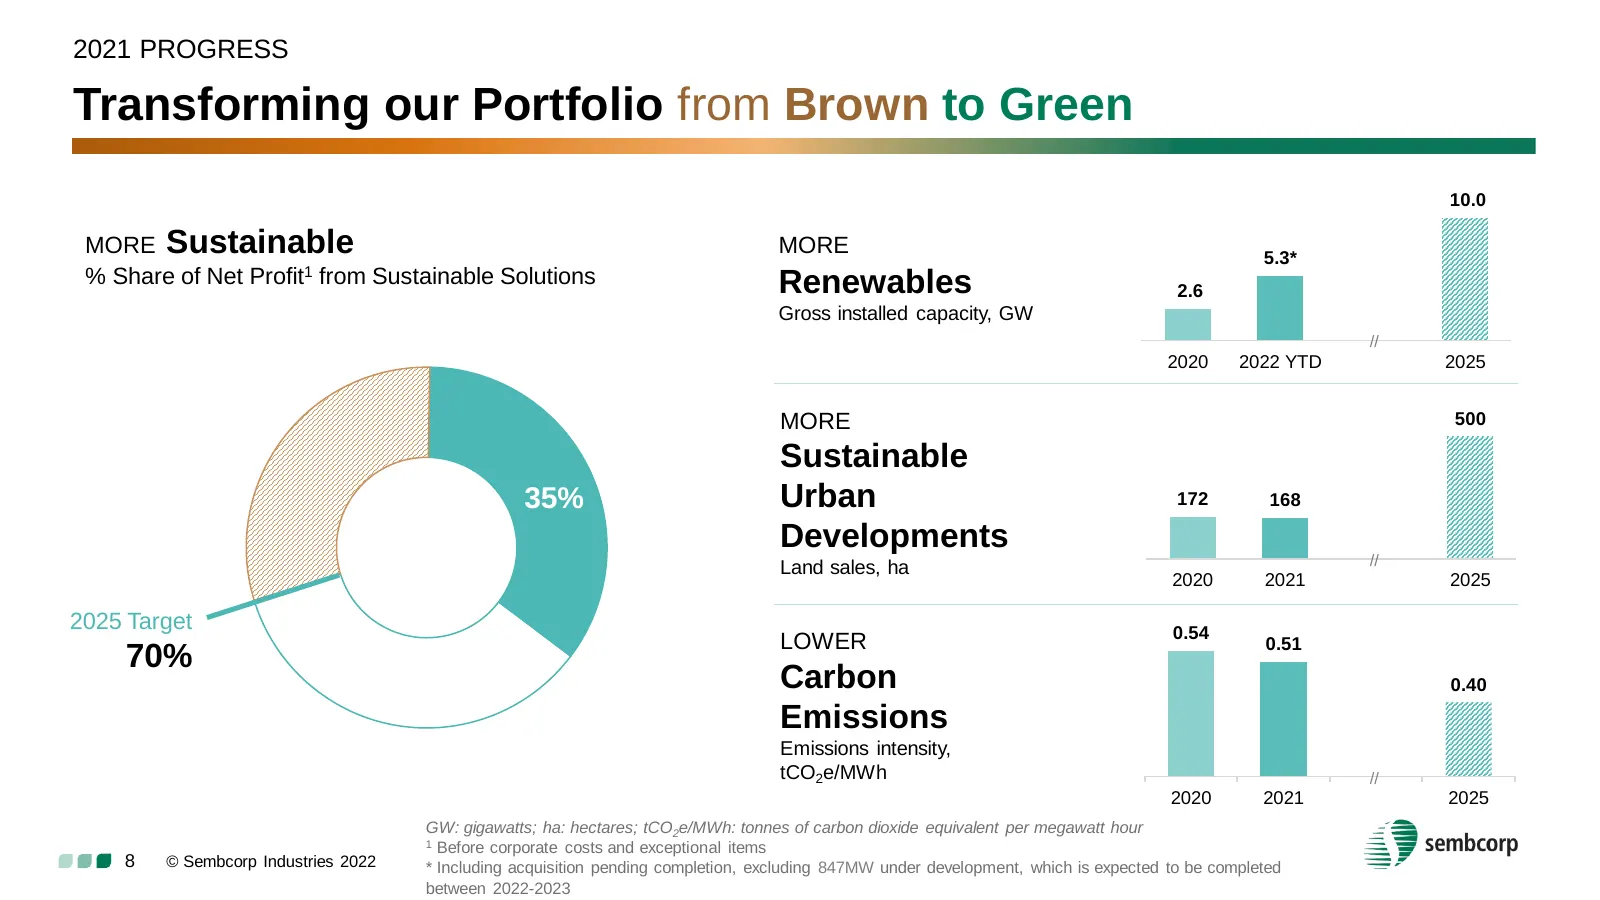
2021 PROGRESS Transforming our Portfolio from Brown to Green 10.0 MORE Sustainable MORE 5.3* % Share of Net Profit1 from Sustainable Solutions Renewables 2.6 Gross installed capacity, GW 2.7 // 2020 2022 YTD 2025 MORE 500 Sustainable 35% Urban 172 168 Developments // Land sales, ha 2020 2021 2025 20
Slide 9: Financial Review
Financial Review Eugene Cheng Group CFO © Sembcorp Industries 2022
Slide 10: Key Financials
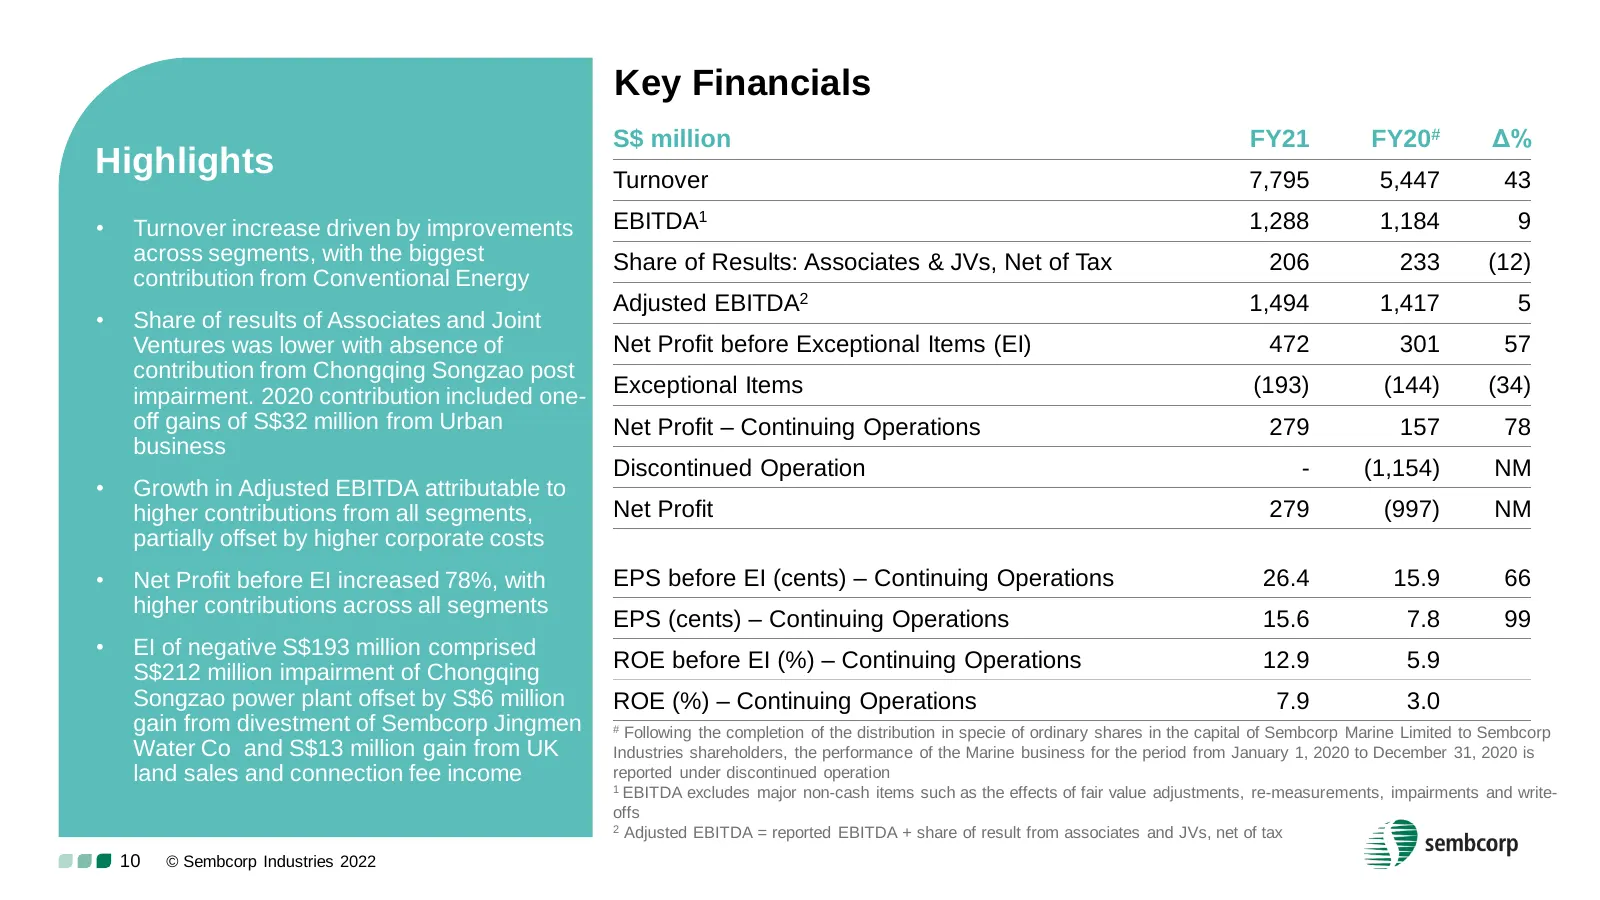
Key Financials S$ million FY21 FY20# Δ% Highlights Turnover 7,795 5,447 43 • Turnover increase driven by improvements EBITDA1 1,288 1,184 9 across segments, with the biggest Share of Results: Associates & JVs, Net of Tax 206 233 (12) contribution from Conventional Energy Adjusted EBITDA2 1,494 1,417
Slide 11: Group Turnover
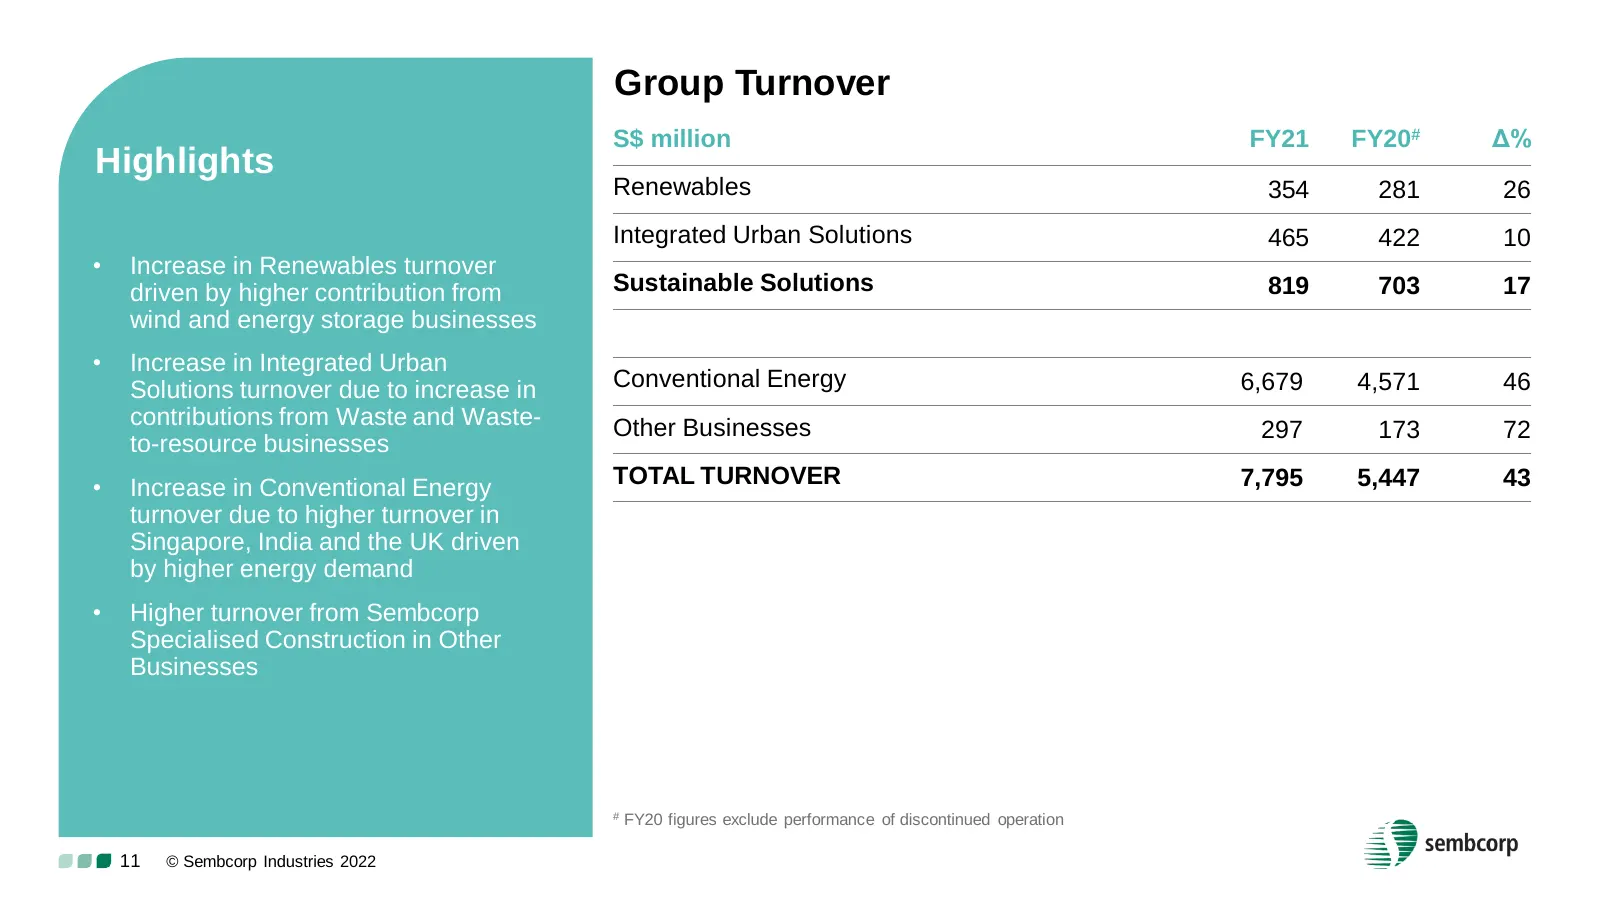
Group Turnover S$ million FY21 FY20# Δ% Highlights Renewables 354 281 26 Integrated Urban Solutions 465 422 10 • Increase in Renewables turnover driven by higher contribution from Sustainable Solutions 819 703 17 wind and energy storage businesses • Increase in Integrated Urban Solutions turnover du
Slide 12: Group Net Profit
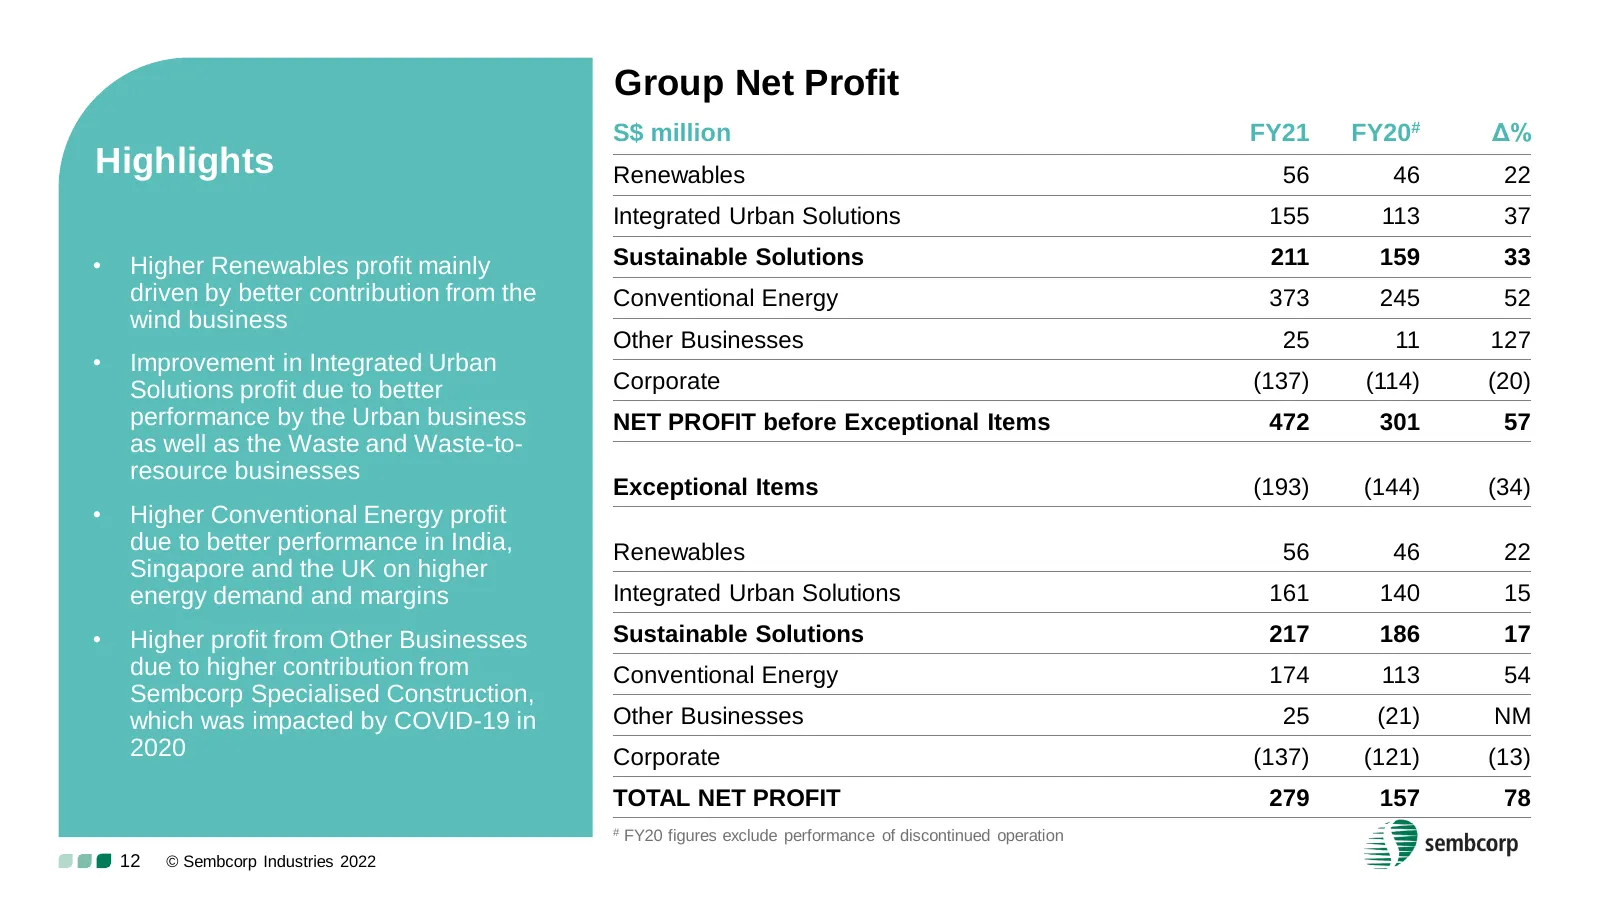
Group Net Profit S$ million FY21 FY20# Δ% Highlights Renewables 56 46 22 Integrated Urban Solutions 155 113 37 • Higher Renewables profit mainly Sustainable Solutions 211 159 33 driven by better contribution from the Conventional Energy 373 245 52 wind business Other Businesses 25 11 127 • Improveme
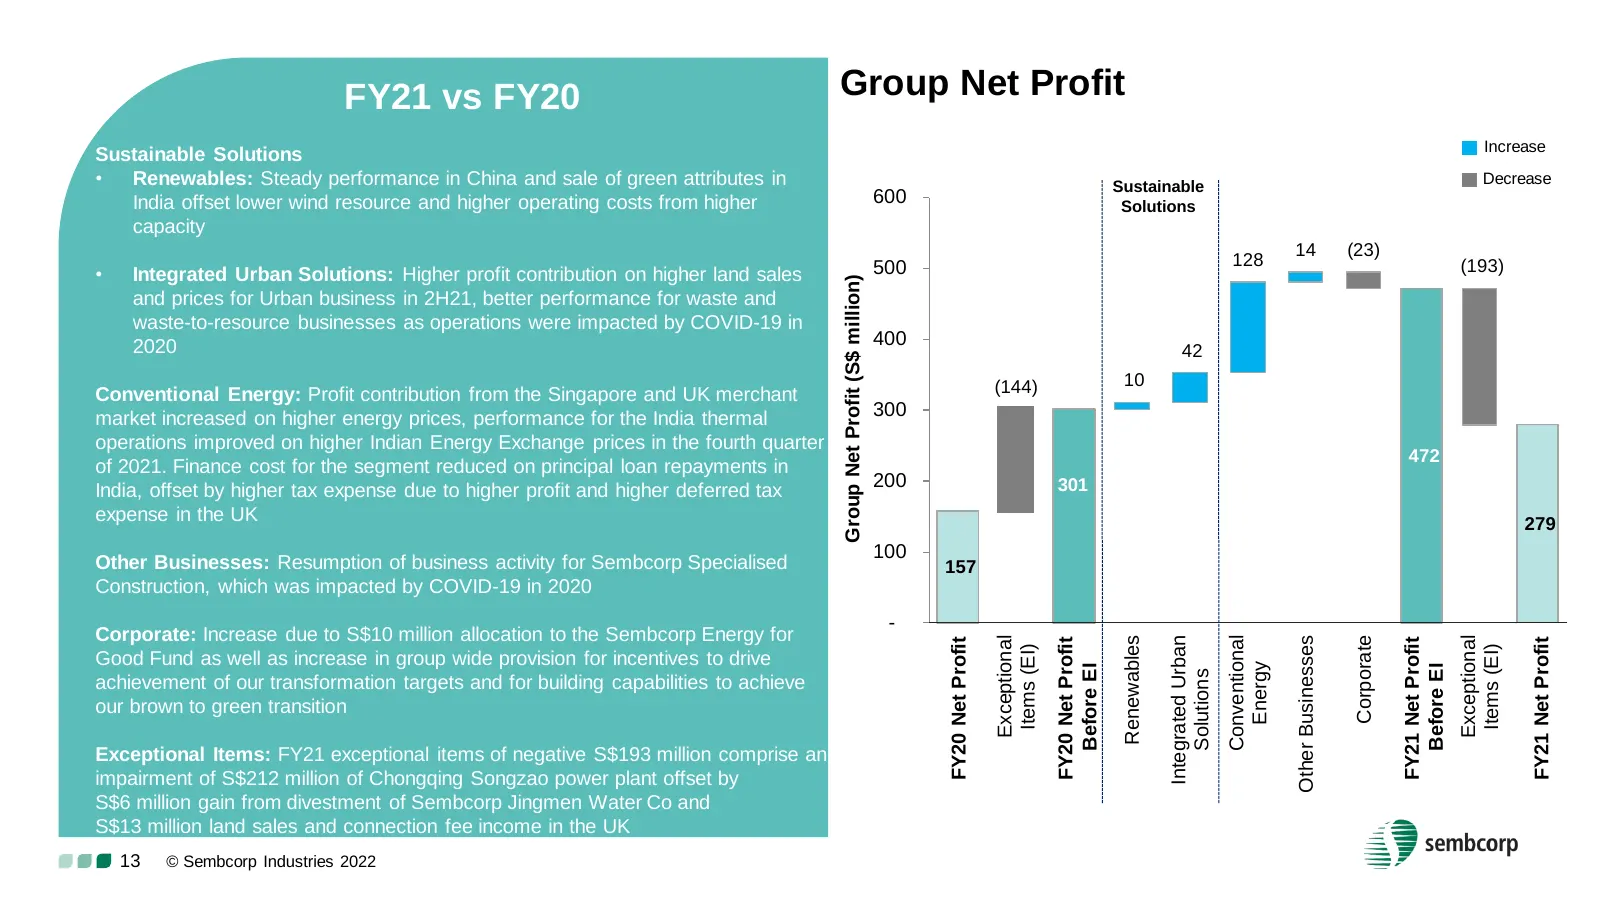
Slide 13: FY21 vs FY20 Group Net Profit
FY21 vs FY20 Group Net Profit Increase Sustainable Solutions • Renewables: Steady performance in China and sale of green attributes in Sustainable Decrease India offset lower wind resource and higher operating costs from higher 600 Solutions capacity 14 (23) 500 128 (193) • Integrated Urban Solution
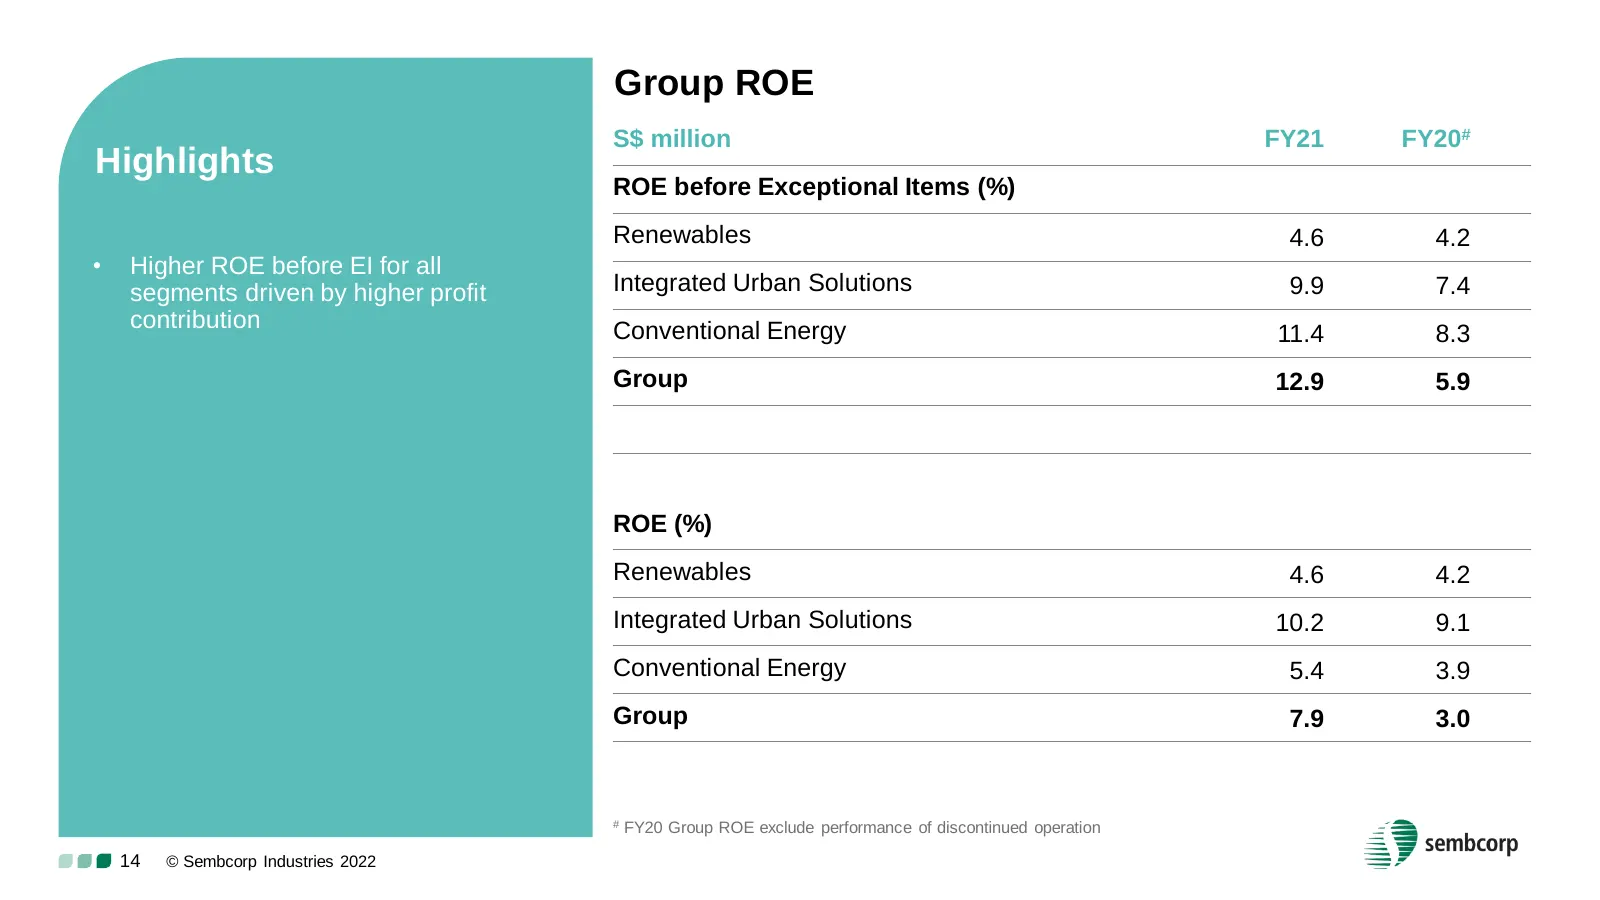
Slide 14: Group ROE
Group ROE S$ million FY21 FY20# Highlights ROE before Exceptional Items (%) Renewables 4.6 4.2 • Higher ROE before EI for all segments driven by higher profit Integrated Urban Solutions 9.9 7.4 contribution Conventional Energy 11.4 8.3 Group 12.9 5.9 ROE (%) Renewables 4.6 4.2 Integrated Urban Solut
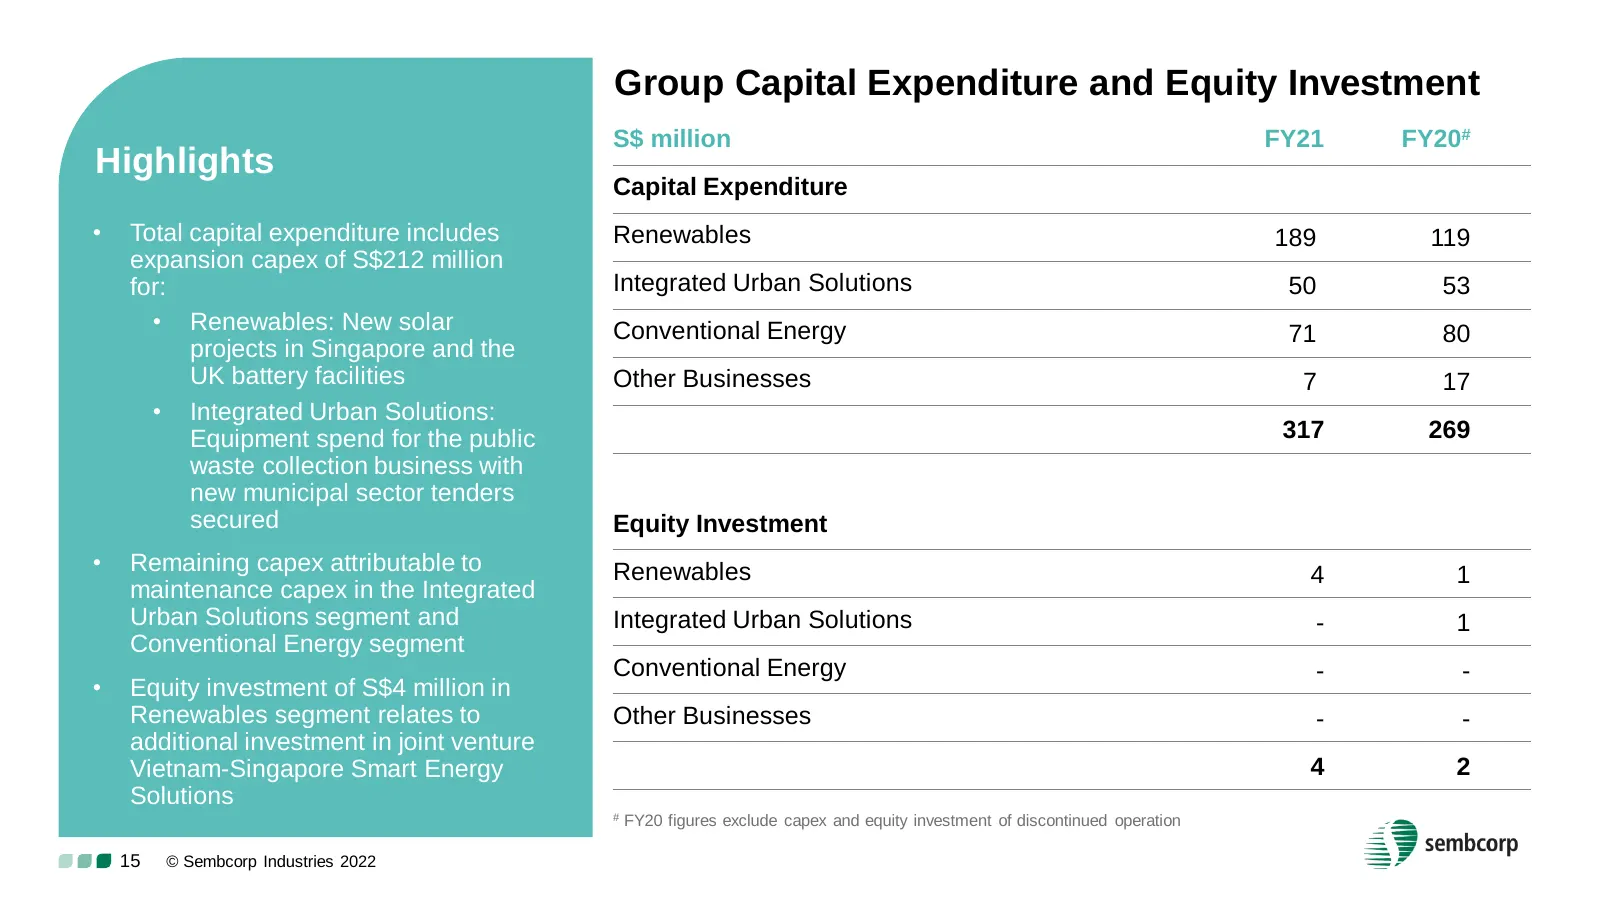
Slide 15: Capital Expenditure and Equity Investment
Group Capital Expenditure and Equity Investment S$ million FY21 FY20# Highlights Capital Expenditure • Total capital expenditure includes Renewables 189 119 expansion capex of S$212 million for: Integrated Urban Solutions 50 53 • Renewables: New solar Conventional Energy 71 80 projects in Singapore
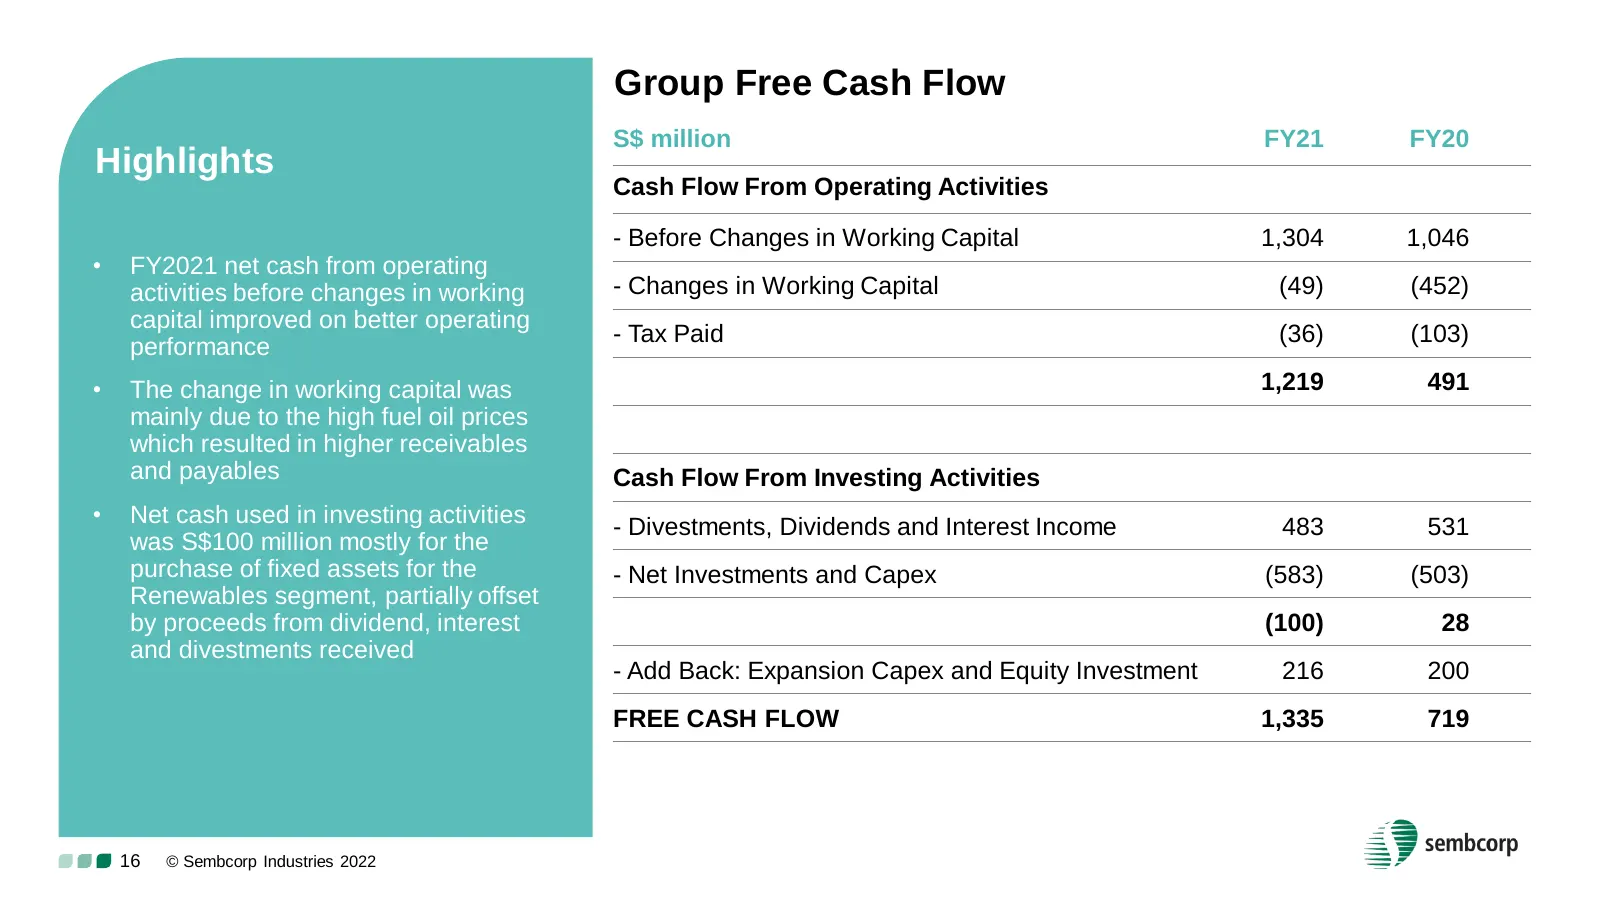
Slide 16: Free Cash Flow
Group Free Cash Flow S$ million FY21 FY20 Highlights Cash Flow From Operating Activities - Before Changes in Working Capital 1,304 1,046 • FY2021 net cash from operating activities before changes in working - Changes in Working Capital (49) (452) capital improved on better operating performance - Ta
Slide 17: Borrowings
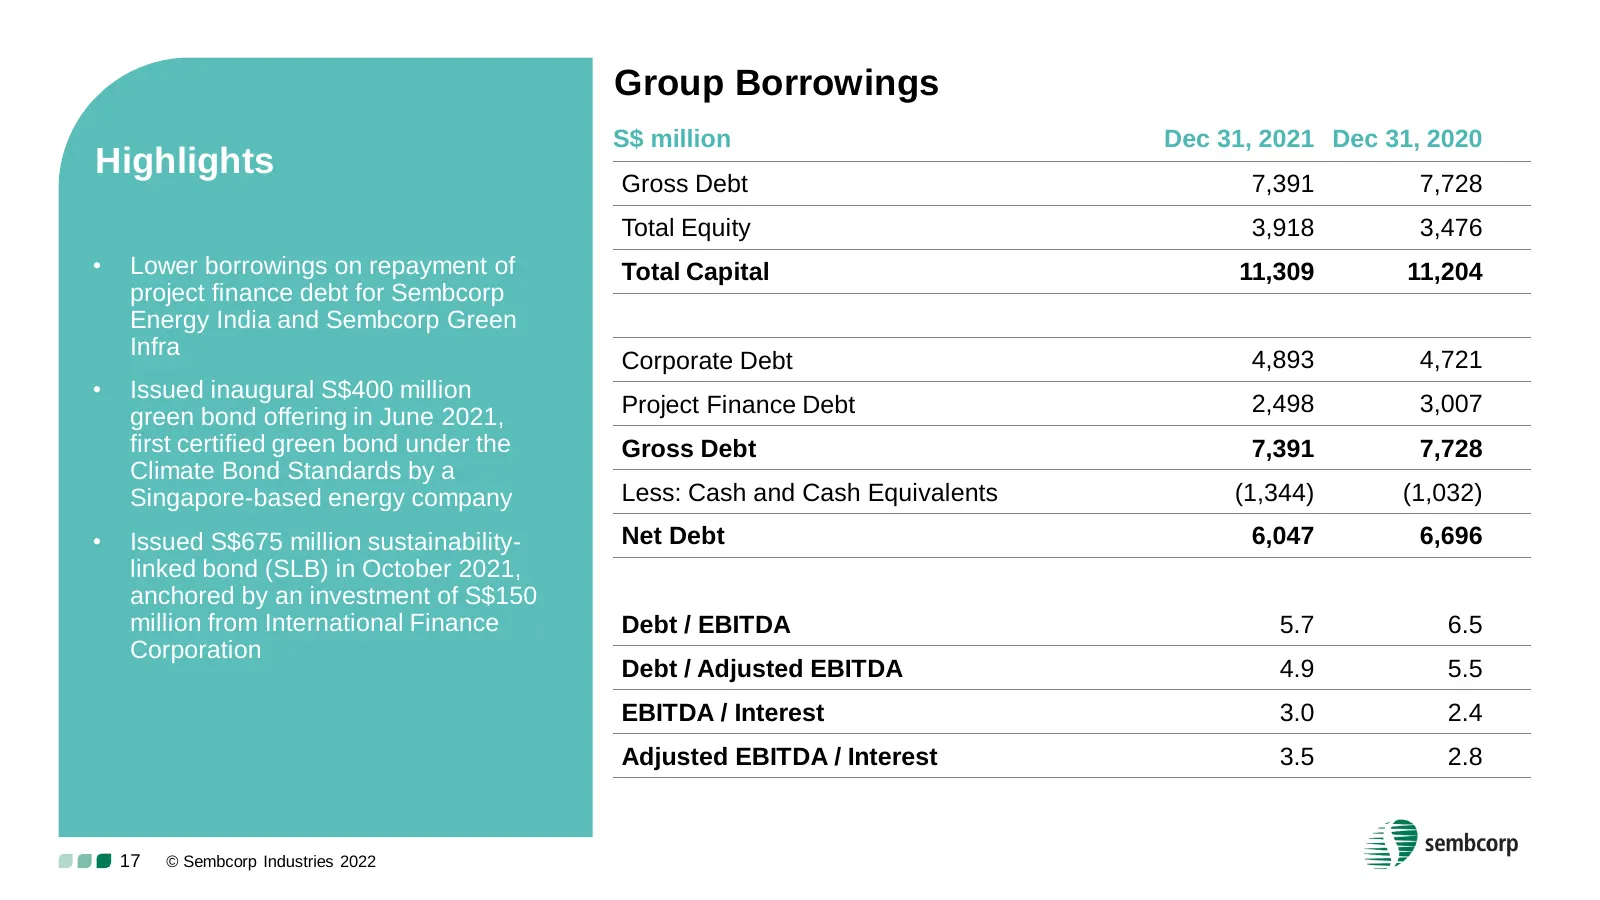
Group Borrowings S$ million Dec 31, 2021 Dec 31, 2020 Highlights Gross Debt 7,391 7,728 Total Equity 3,918 3,476 • Lower borrowings on repayment of Total Capital 11,309 11,204 project finance debt for Sembcorp Energy India and Sembcorp Green Infra Corporate Debt 4,893 4,721 • Issued inaugural S$400
Slide 18: Debt Profile
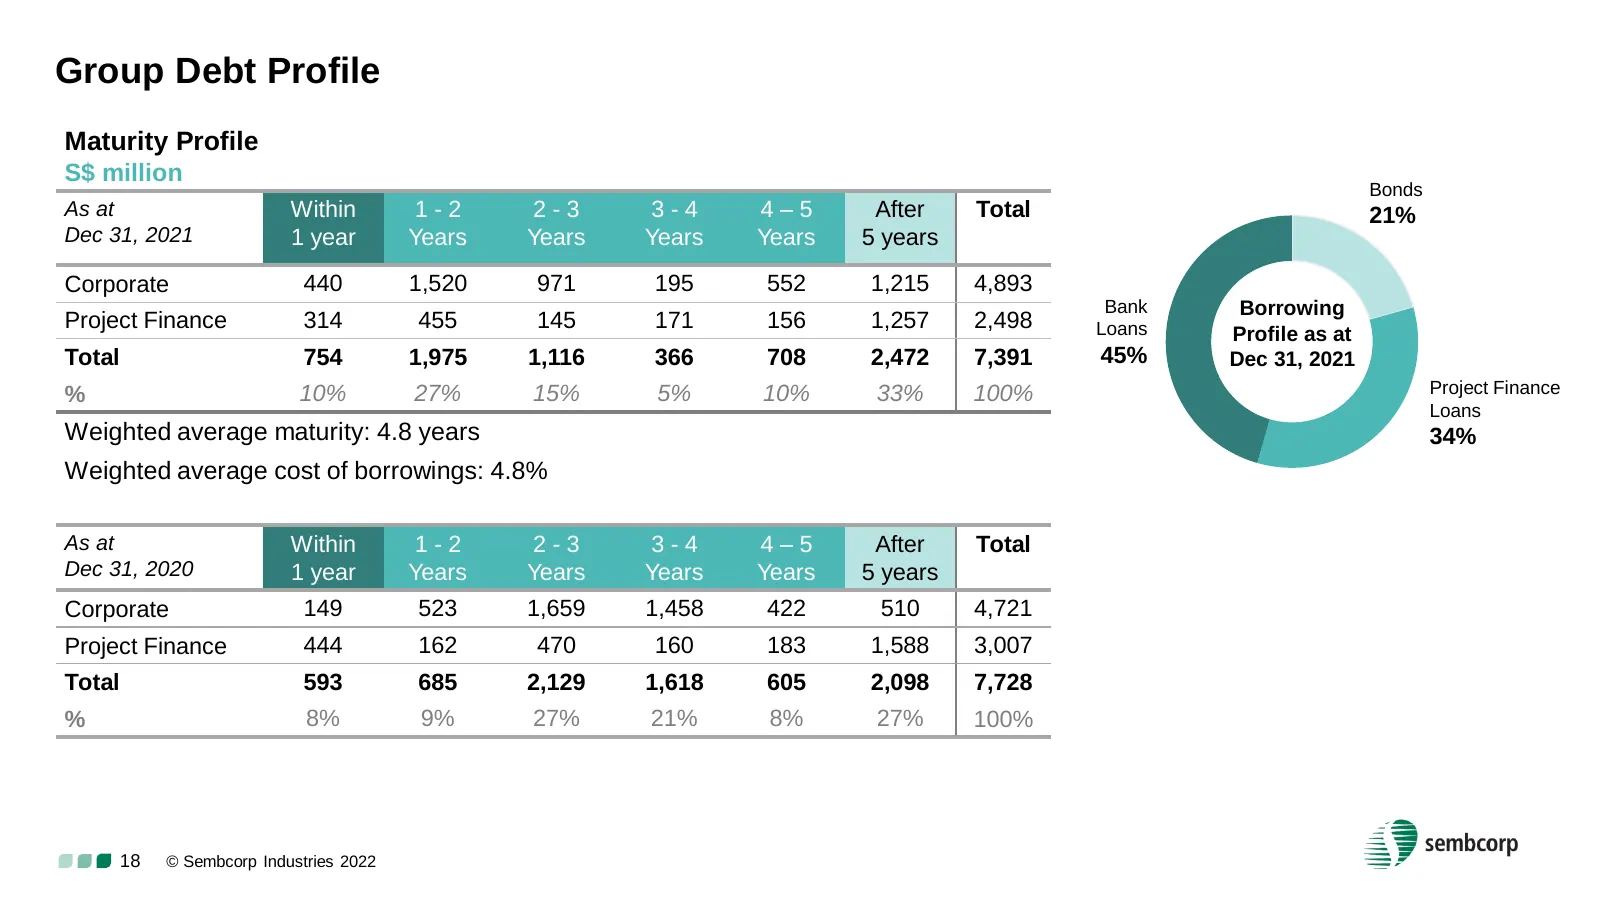
Group Debt Profile Maturity Profile S$ million Bonds As at Within 1-2 2-3 3-4 4–5 After Total 21% Dec 31, 2021 1 year Years Years Years Years 5 years Corporate 440 1,520 971 195 552 1,215 4,893 Bank Borrowing Project Finance 314 455 145 171 156 1,257 2,498 Loans Profile as at Total 754 1,975 1,116 3
Slide 19: Liquidity
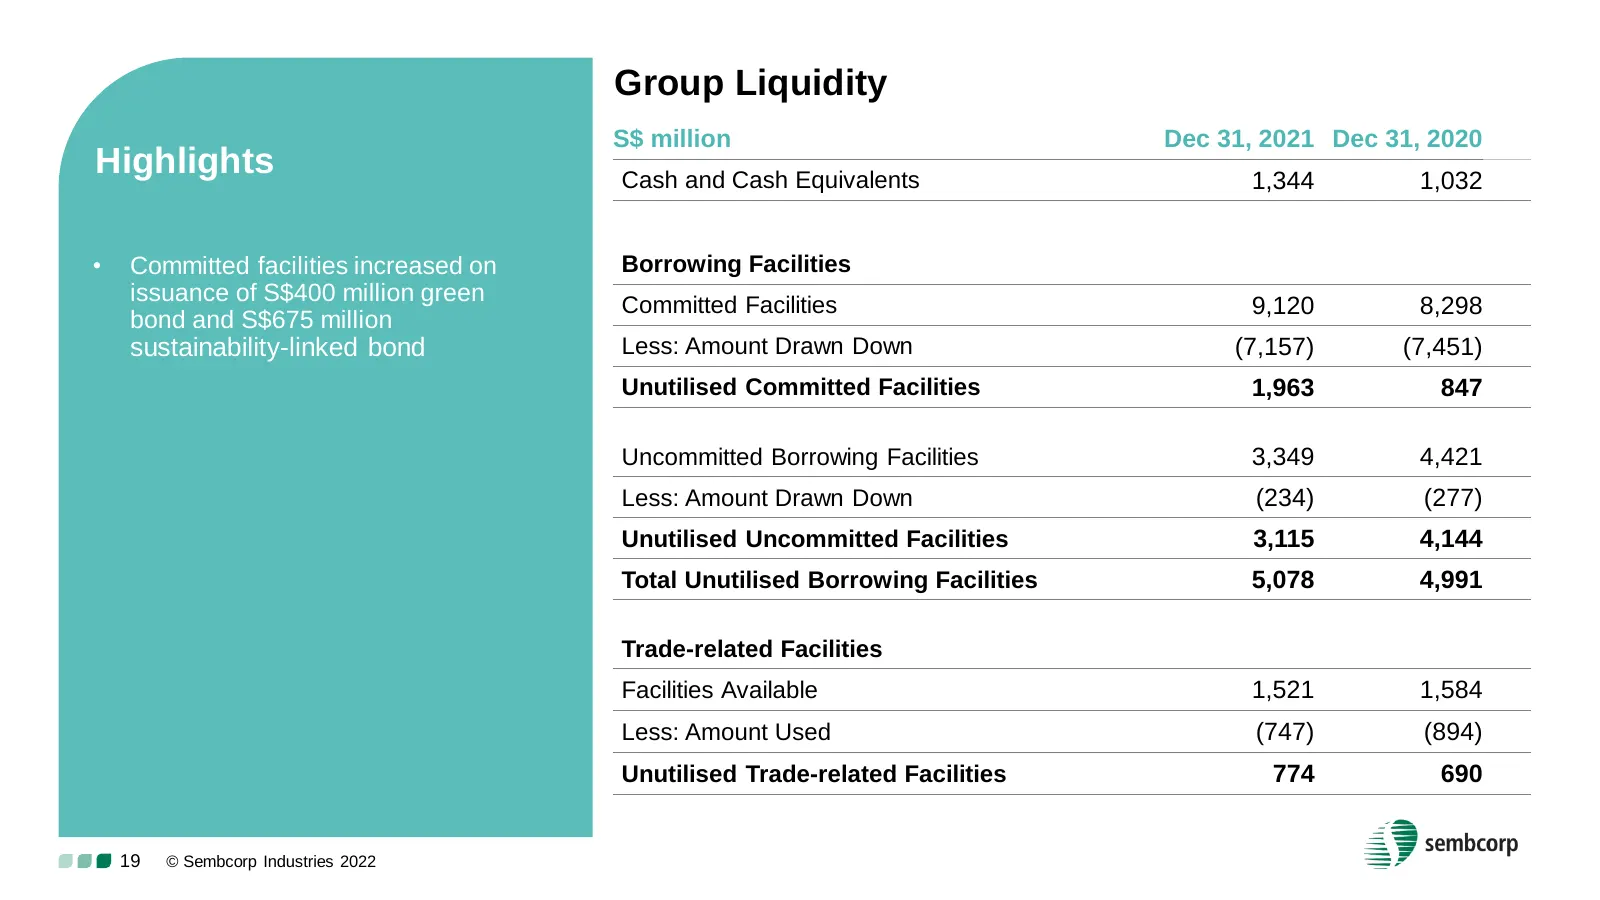
Group Liquidity S$ million Dec 31, 2021 Dec 31, 2020 Highlights Cash and Cash Equivalents 1,344 1,032 • Committed facilities increased on Borrowing Facilities issuance of S$400 million green Committed Facilities 9,120 8,298 bond and S$675 million sustainability-linked bond Less: Amount Drawn Down (7
Slide 20: Outlook
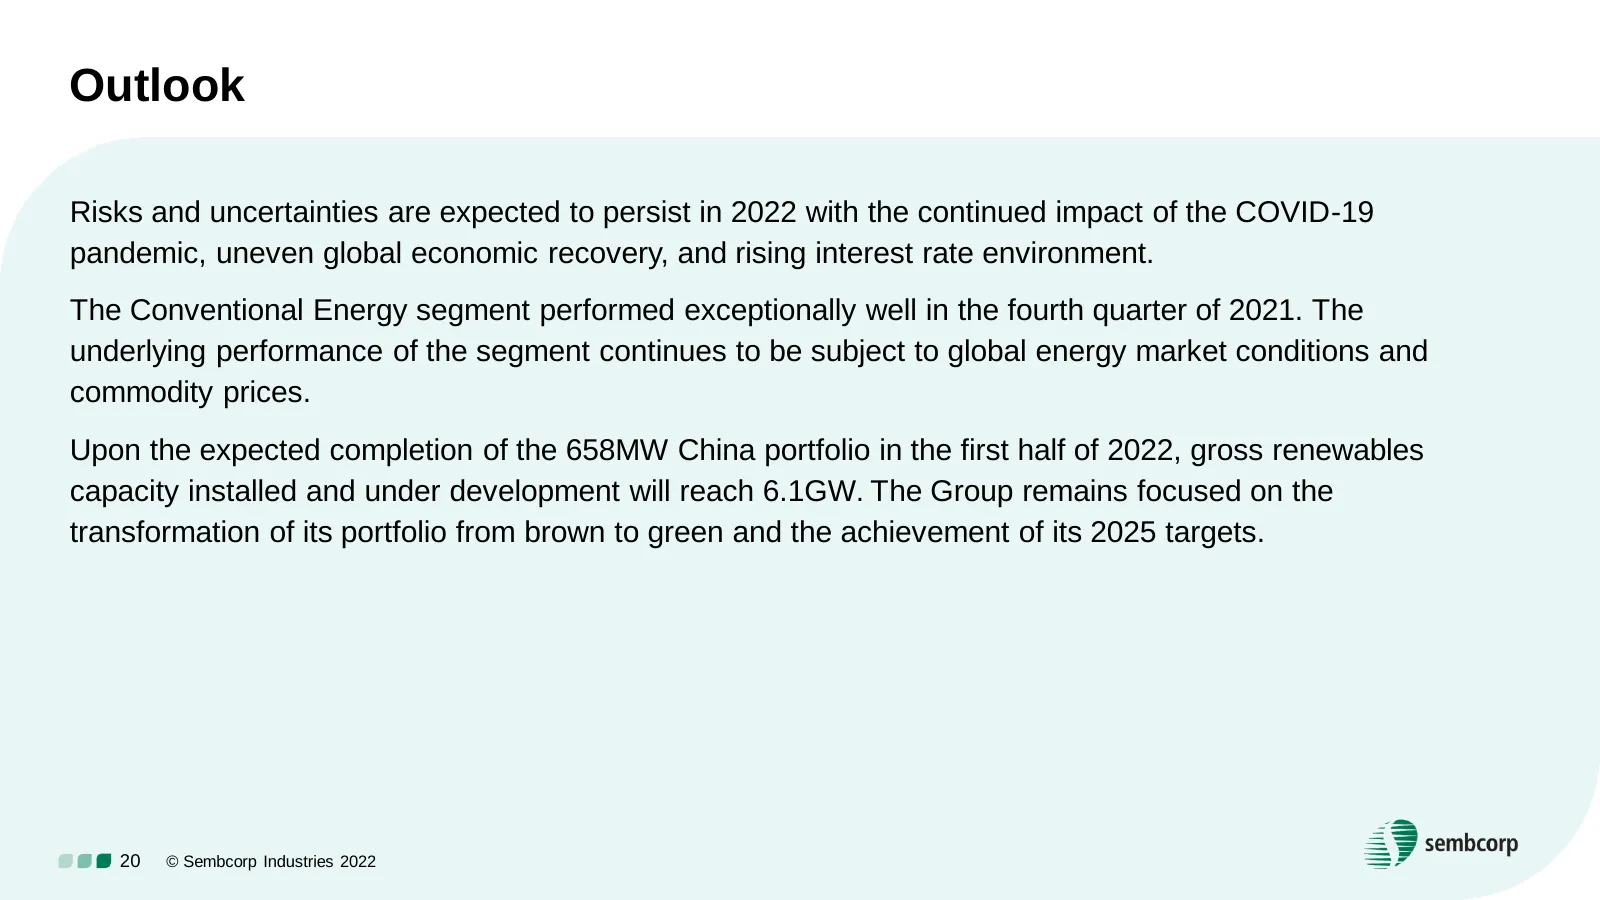
Outlook Risks and uncertainties are expected to persist in 2022 with the continued impact of the COVID-19 pandemic, uneven global economic recovery, and rising interest rate environment. The Conventional Energy segment performed exceptionally well in the fourth quarter of 2021. The underlying perfor
Slide 21: Developments to Note
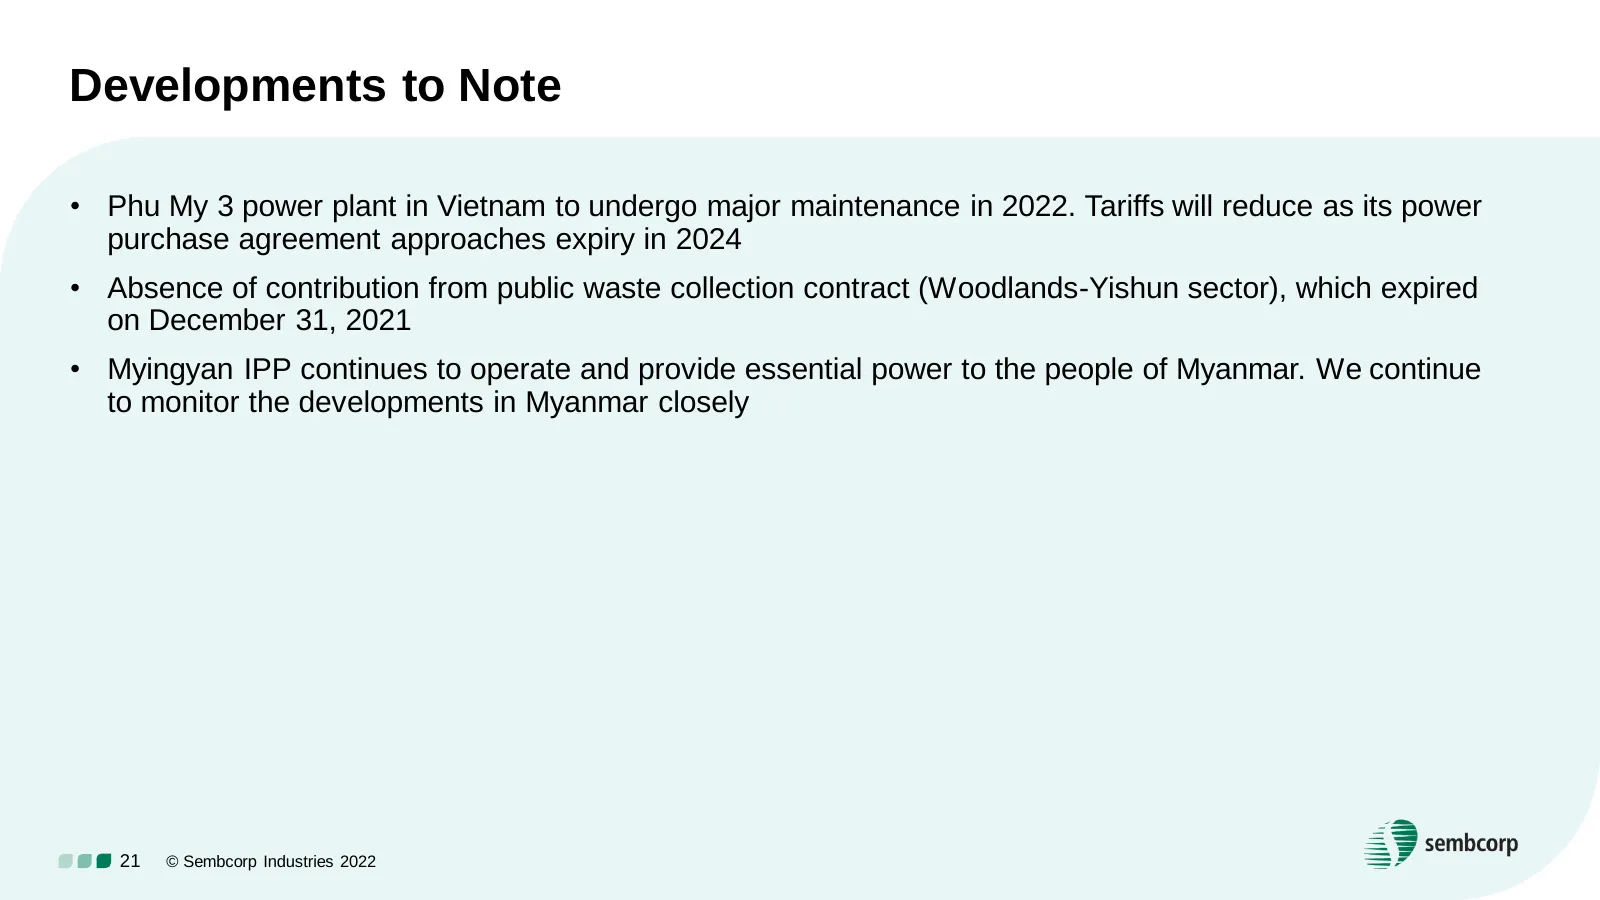
Developments to Note • Phu My 3 power plant in Vietnam to undergo major maintenance in 2022. Tariffs will reduce as its power purchase agreement approaches expiry in 2024 • Absence of contribution from public waste collection contract (Woodlands-Yishun sector), which expired on December 31, 2021 • M
Slide 22: Disclaimer
Disclaimer This presentation contains certain statements that are not statements of historical fact, i.e. forward-looking statements. These forward-looking statements are based on current expectations, estimates, projections and assumptions about future events. Although Sembcorp Industries believes
Slide 23: Appendix
Appendix © Sembcorp Industries 2022
Slide 24: Group EBITDA and Adjusted EBITDA
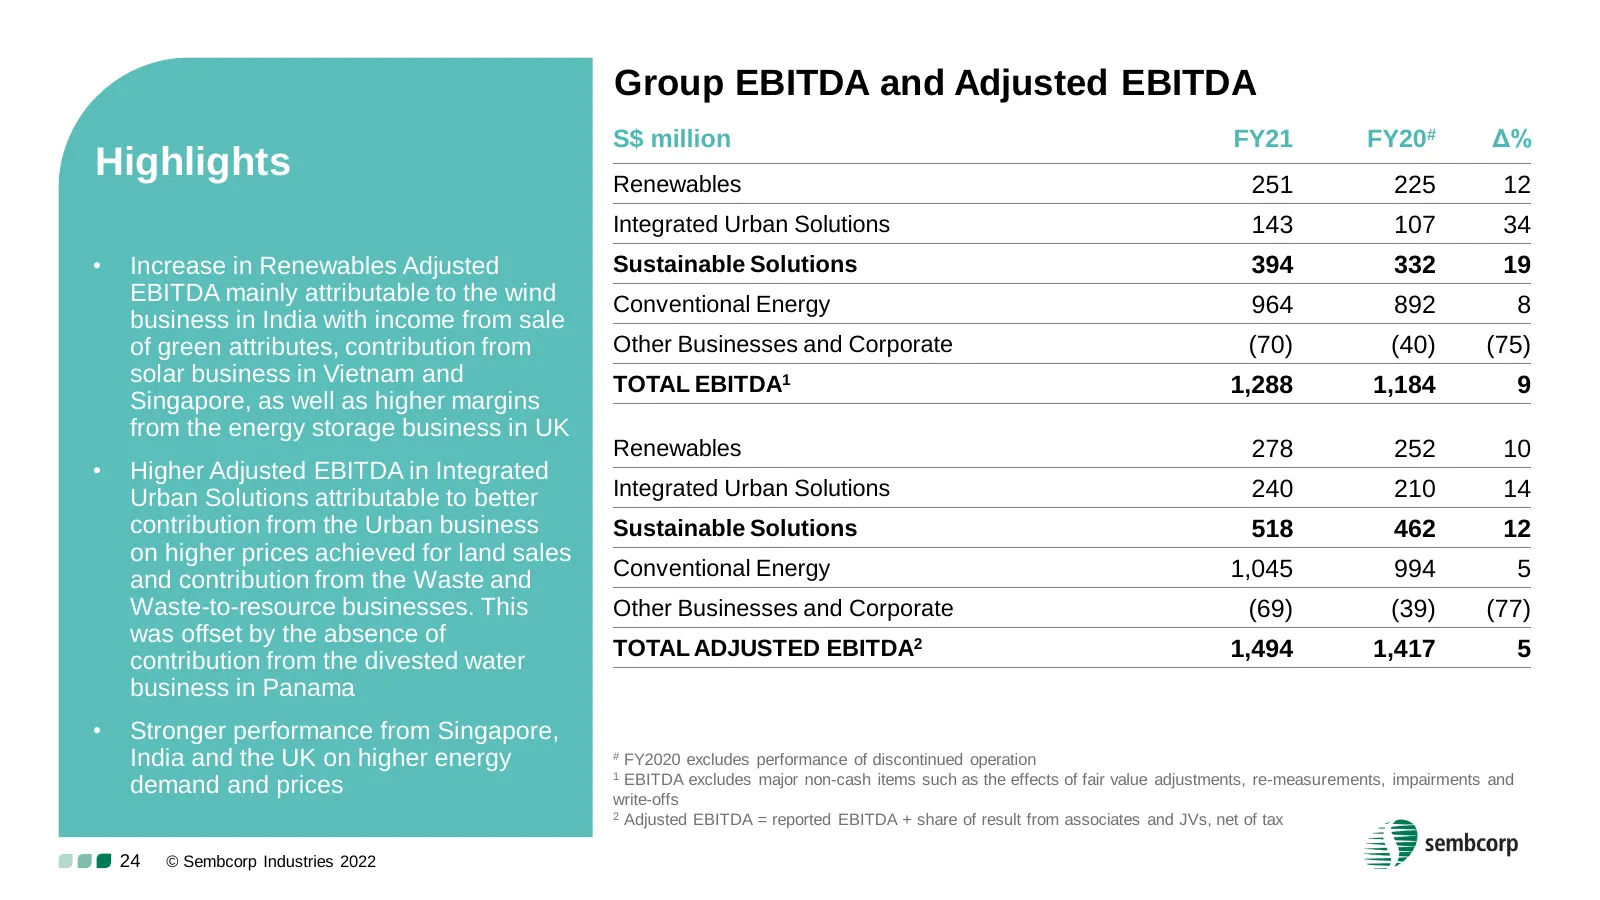
Group EBITDA and Adjusted EBITDA S$ million FY21 FY20# Δ% Highlights Renewables 251 225 12 Integrated Urban Solutions 143 107 34 • Increase in Renewables Adjusted Sustainable Solutions 394 332 19 EBITDA mainly attributable to the wind Conventional Energy 964 892 8 business in India with income from
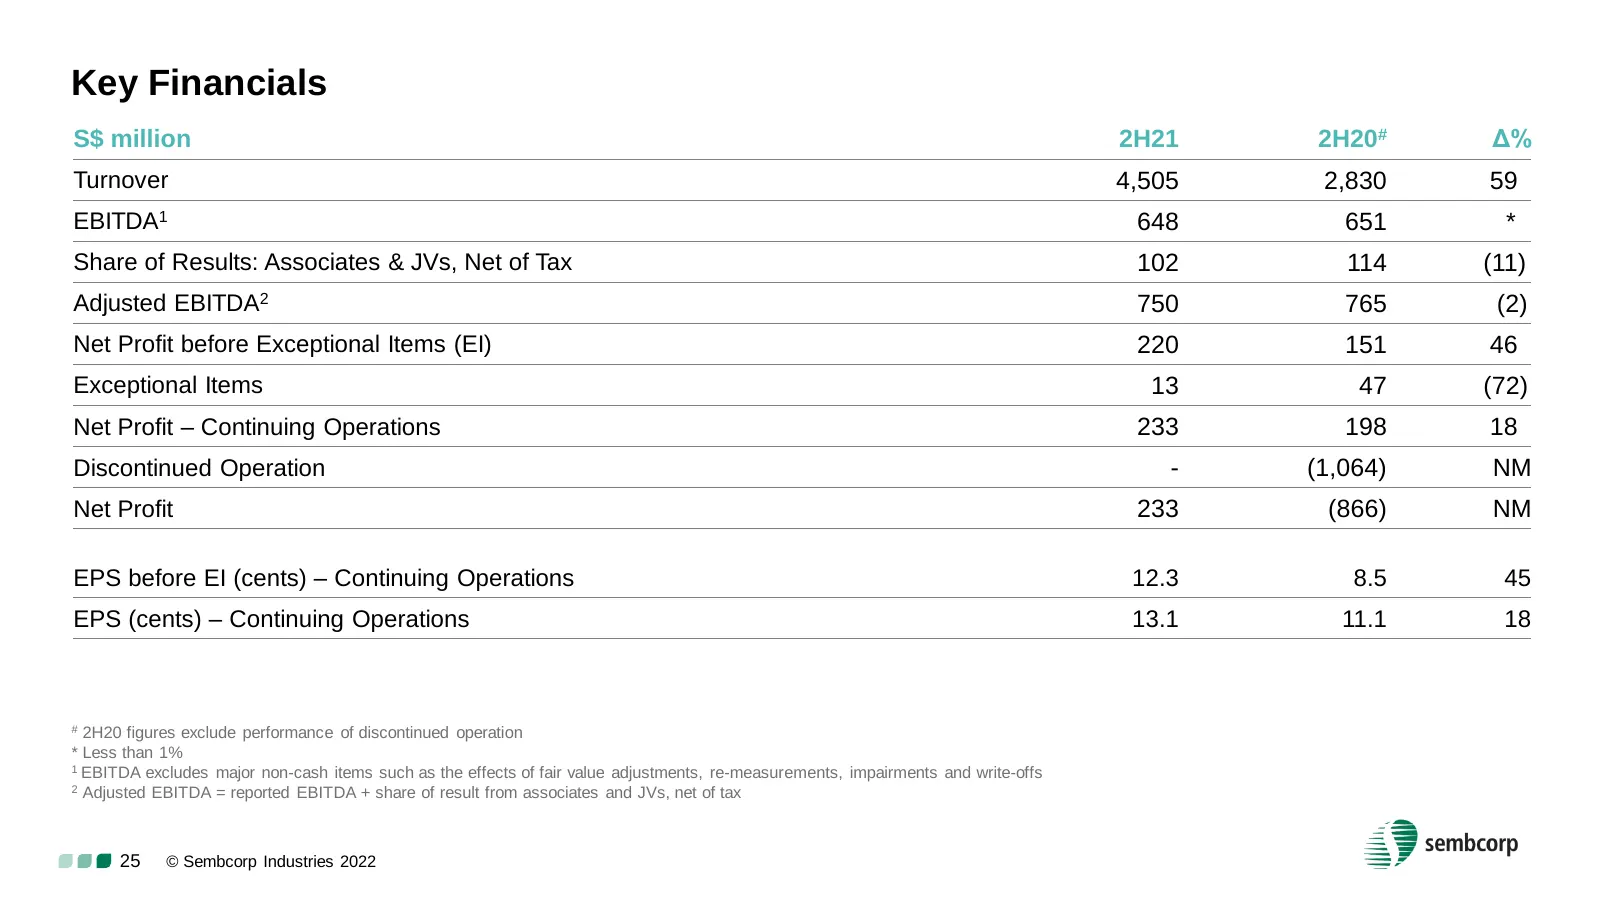
Slide 25: Key Financials 2H21
Key Financials S$ million 2H21 2H20# Δ% Turnover 4,505 2,830 59 EBITDA1 648 651 * Share of Results: Associates & JVs, Net of Tax 102 114 (11) Adjusted EBITDA2 750 765 (2) Net Profit before Exceptional Items (EI) 220 151 46 Exceptional Items 13 47 (72) Net Profit – Continuing Operations 233 198 18 Di
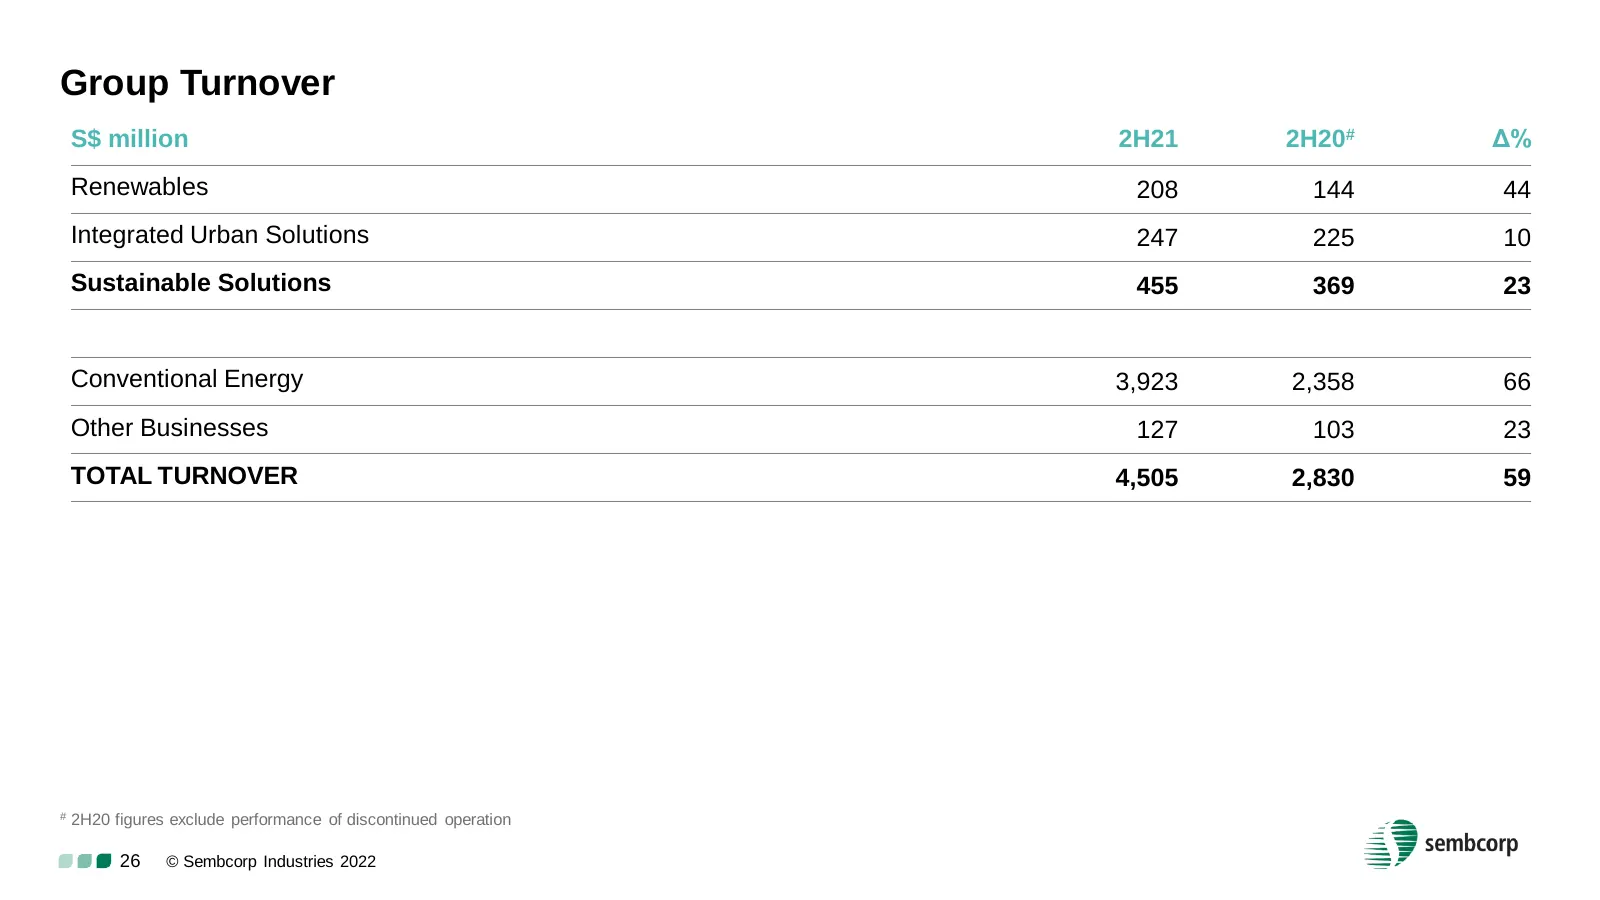
Slide 26: Group Turnover 2H21
Group Turnover S$ million 2H21 2H20# Δ% Renewables 208 144 44 Integrated Urban Solutions 247 225 10 Sustainable Solutions 455 369 23 Conventional Energy 3,923 2,358 66 Other Businesses 127 103 23 TOTAL TURNOVER 4,505 2,830 59 © Sembcorp Industries 2022 # 2H20 figures exclude performance of discontin
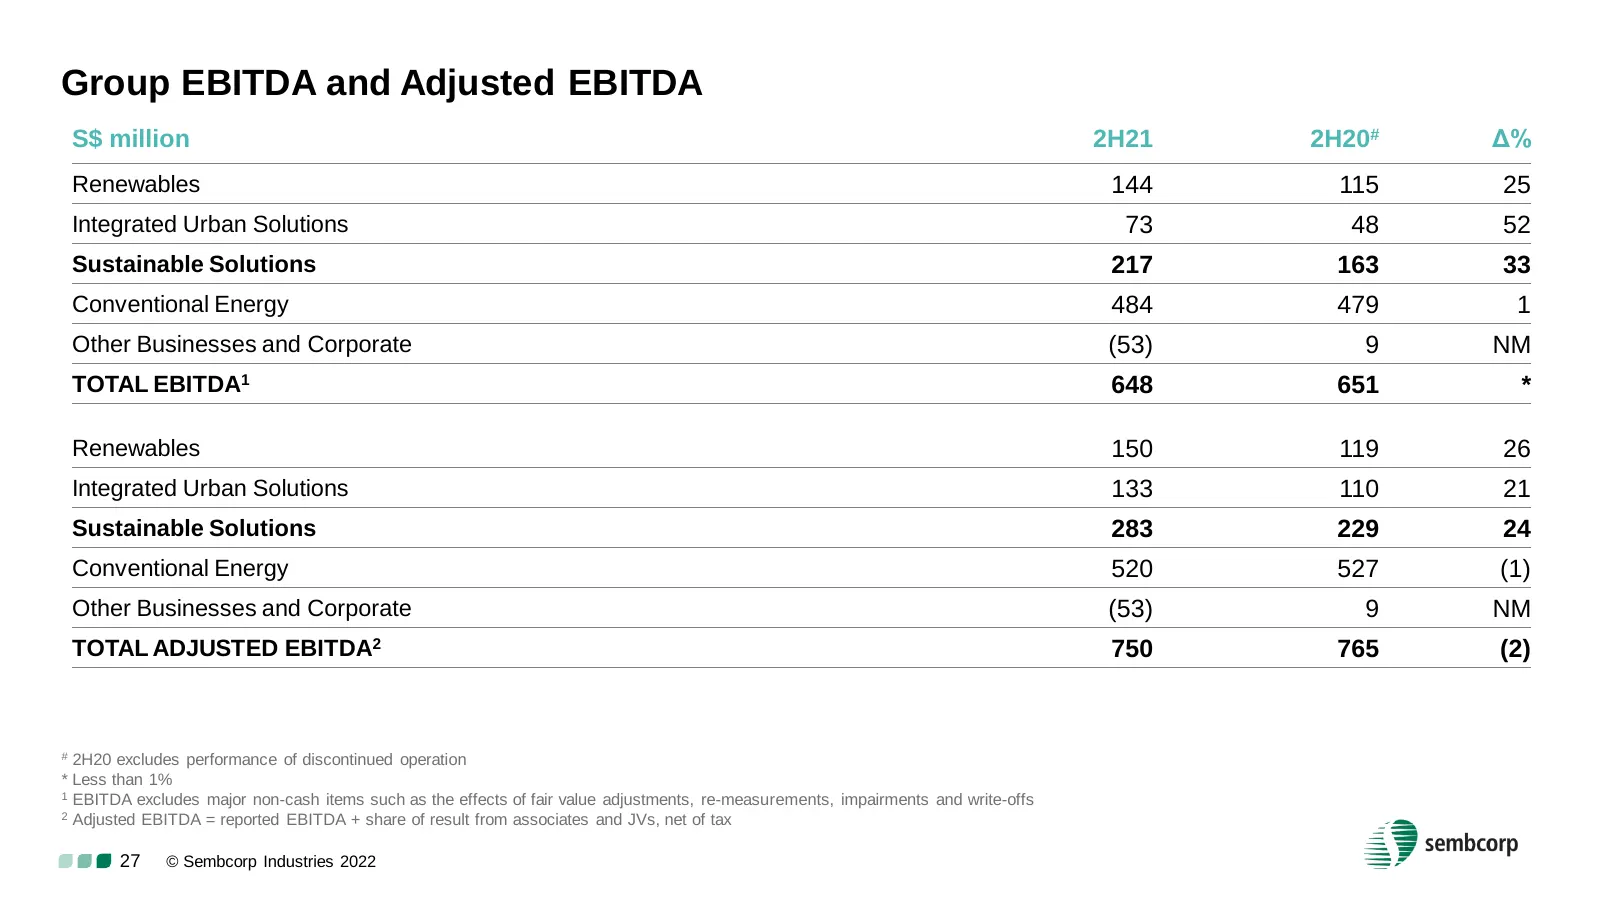
Slide 27: Group EBITDA and Adjusted EBITDA 2H21
Group EBITDA and Adjusted EBITDA S$ million 2H21 2H20# Δ% Renewables 144 115 25 Integrated Urban Solutions 73 48 52 Sustainable Solutions 217 163 33 Conventional Energy 484 479 1 Other Businesses and Corporate (53) 9 NM TOTAL EBITDA1 648 651 * Renewables 150 119 26 Integrated Urban Solutions 133 110
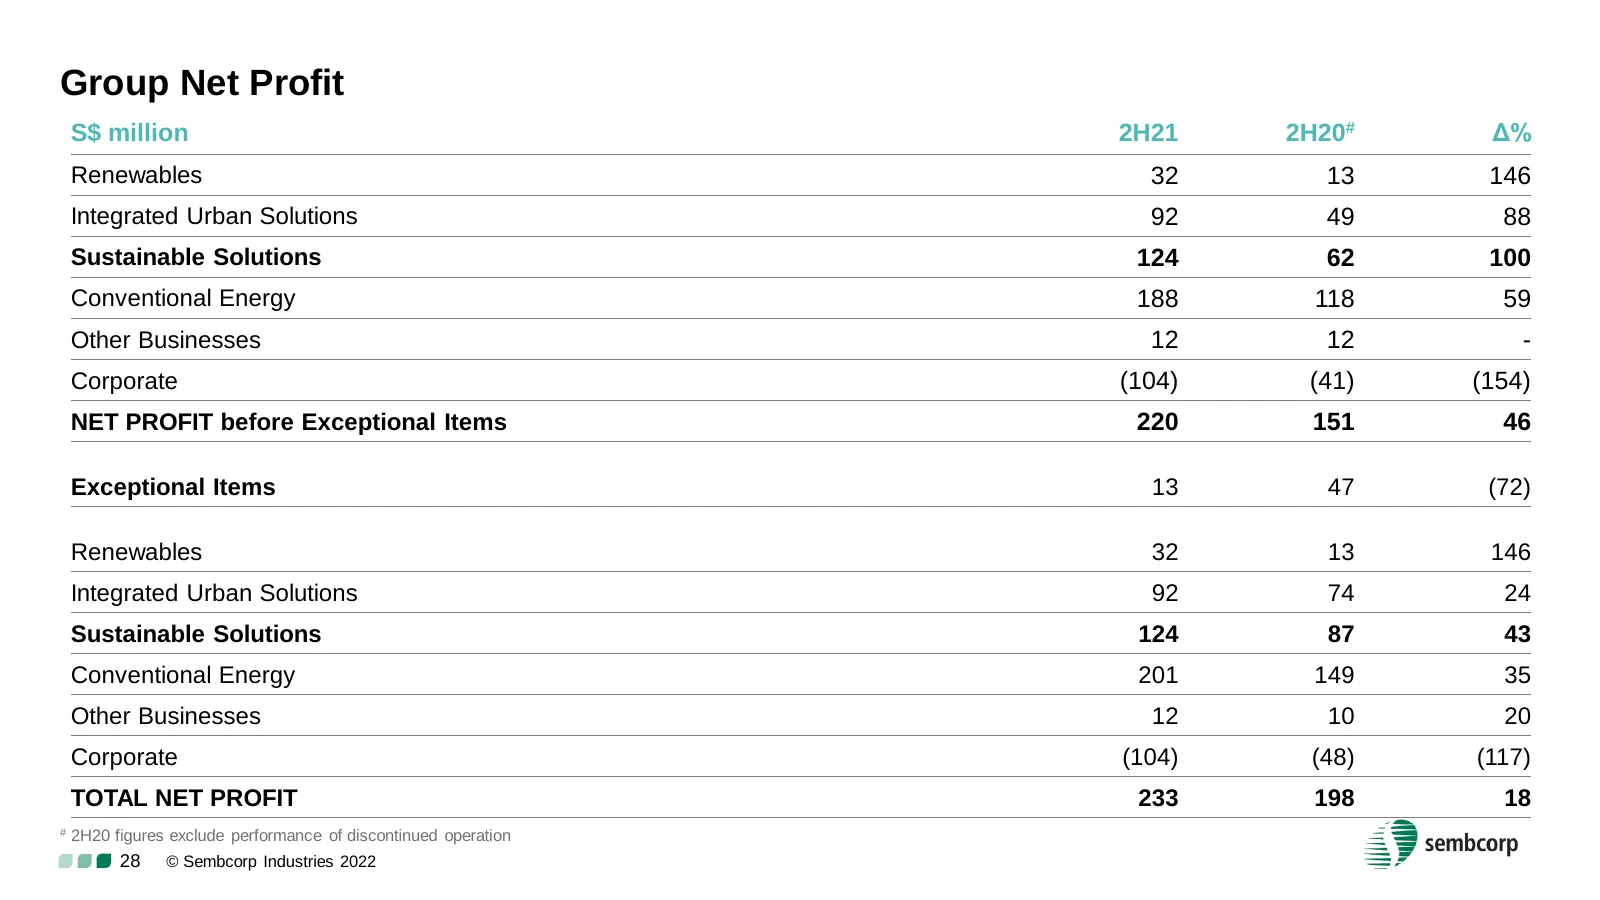
Slide 28: Group Net Profit 2H21
Group Net Profit S$ million 2H21 2H20# Δ% Renewables 32 13 146 Integrated Urban Solutions 92 49 88 Sustainable Solutions 124 62 100 Conventional Energy 188 118 59 Other Businesses 12 12 - Corporate (104) (41) (154) NET PROFIT before Exceptional Items 220 151 46 Exceptional Items 13 47 (72) Renewable
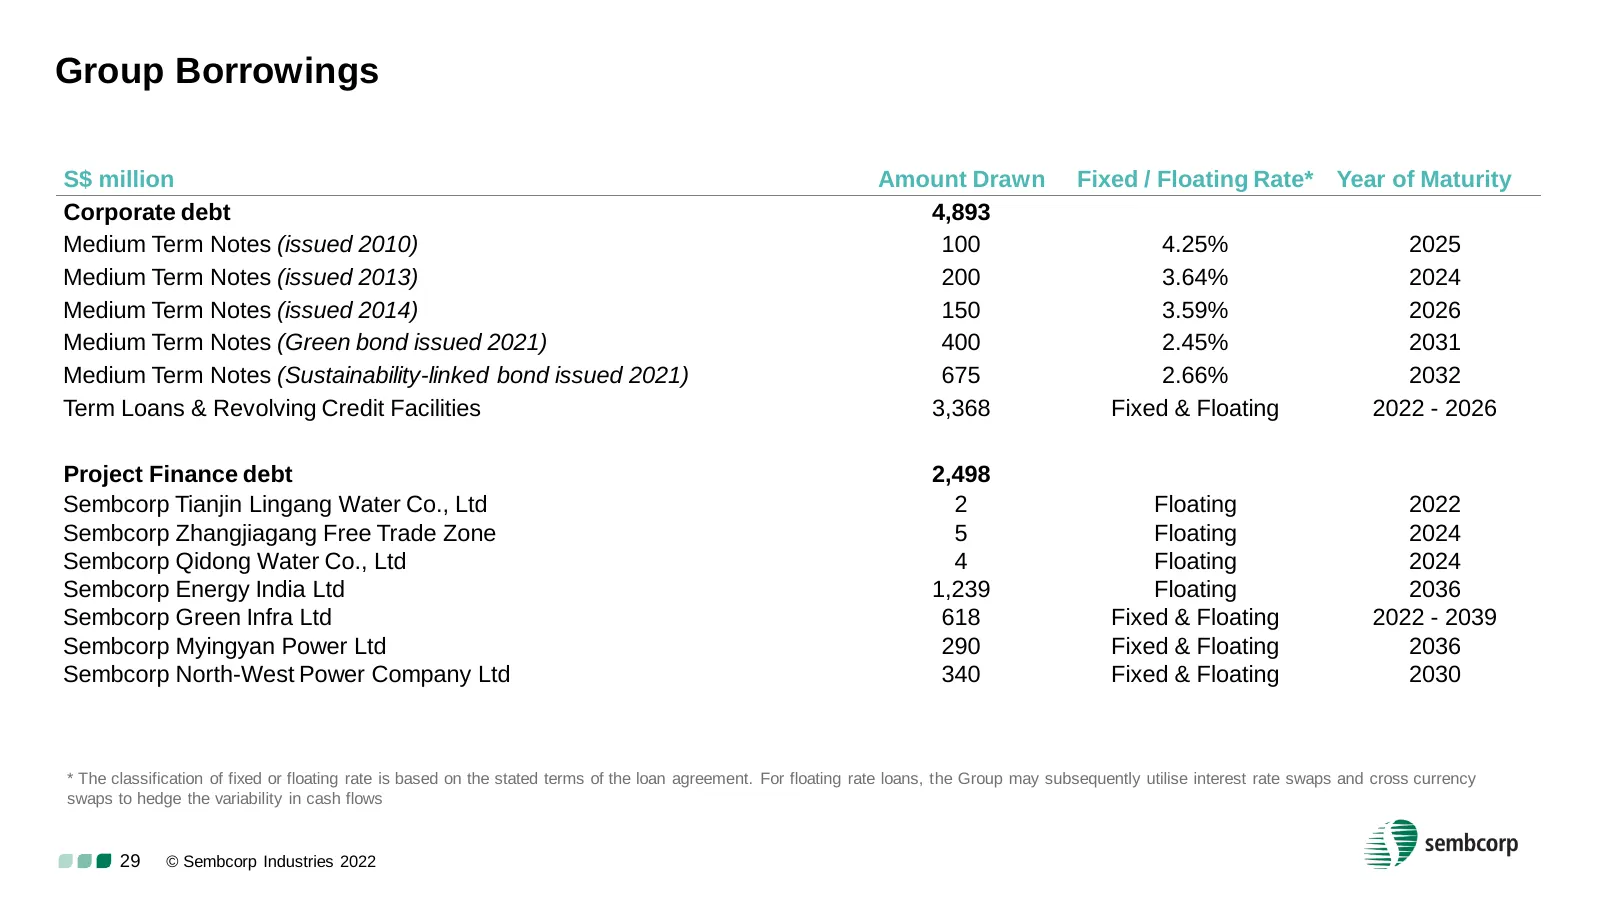
Slide 29: Group Borrowings
Group Borrowings S$ million Amount Drawn Fixed / Floating Rate* Year of Maturity Corporate debt 4,893 Medium Term Notes (issued 2010) 100 4.25% 2025 Medium Term Notes (issued 2013) 200 3.64% 2024 Medium Term Notes (issued 2014) 150 3.59% 2026 Medium Term Notes (Green bond issued 2021) 400 2.45% 2031
Source: Internet Archive copy of sembcorp.com
More decks from Sembcorp Industries Ltd.
 H1 2026 Earnings Presentation26 slides · Aug 13, 2026
 Investor Presentation (June 2026)52 slides · June 2026
 Shareholder Meeting (April 2026)11 slides · Apr 29, 2026
 FY2025 Earnings Presentation35 slides · Feb 25, 2026
 Merger or Acquisition (January 2026)13 slides · Jan 30, 2026
 Merger or Acquisition (December 2025)24 slides · Dec 11, 2025