Mid-America Apartment Communities, Inc. · NYSE:MAA
Mid-America Apartment Communities — Nareit REITworld 2026
41 slides from Mid-America Apartment Communities's conference presentation, Nov 16, 2026

Slide 1: Nareit REITworld November 17-19, 2026
maac.com November 17 – 19, 2026 Nareit REITworld Exhibit 99.1
Slide 2: Forward-Looking Statements
Forward-Looking Statements This presentation contains forward-looking statements within the meaning of Section 27A of the Securities Act of 1933, as amended, and Section 21E of the Securities Exchange Act of 1934, as amended. We intend such forward-looking statements to be covered by the safe harbor
Slide 3: Table of Contents
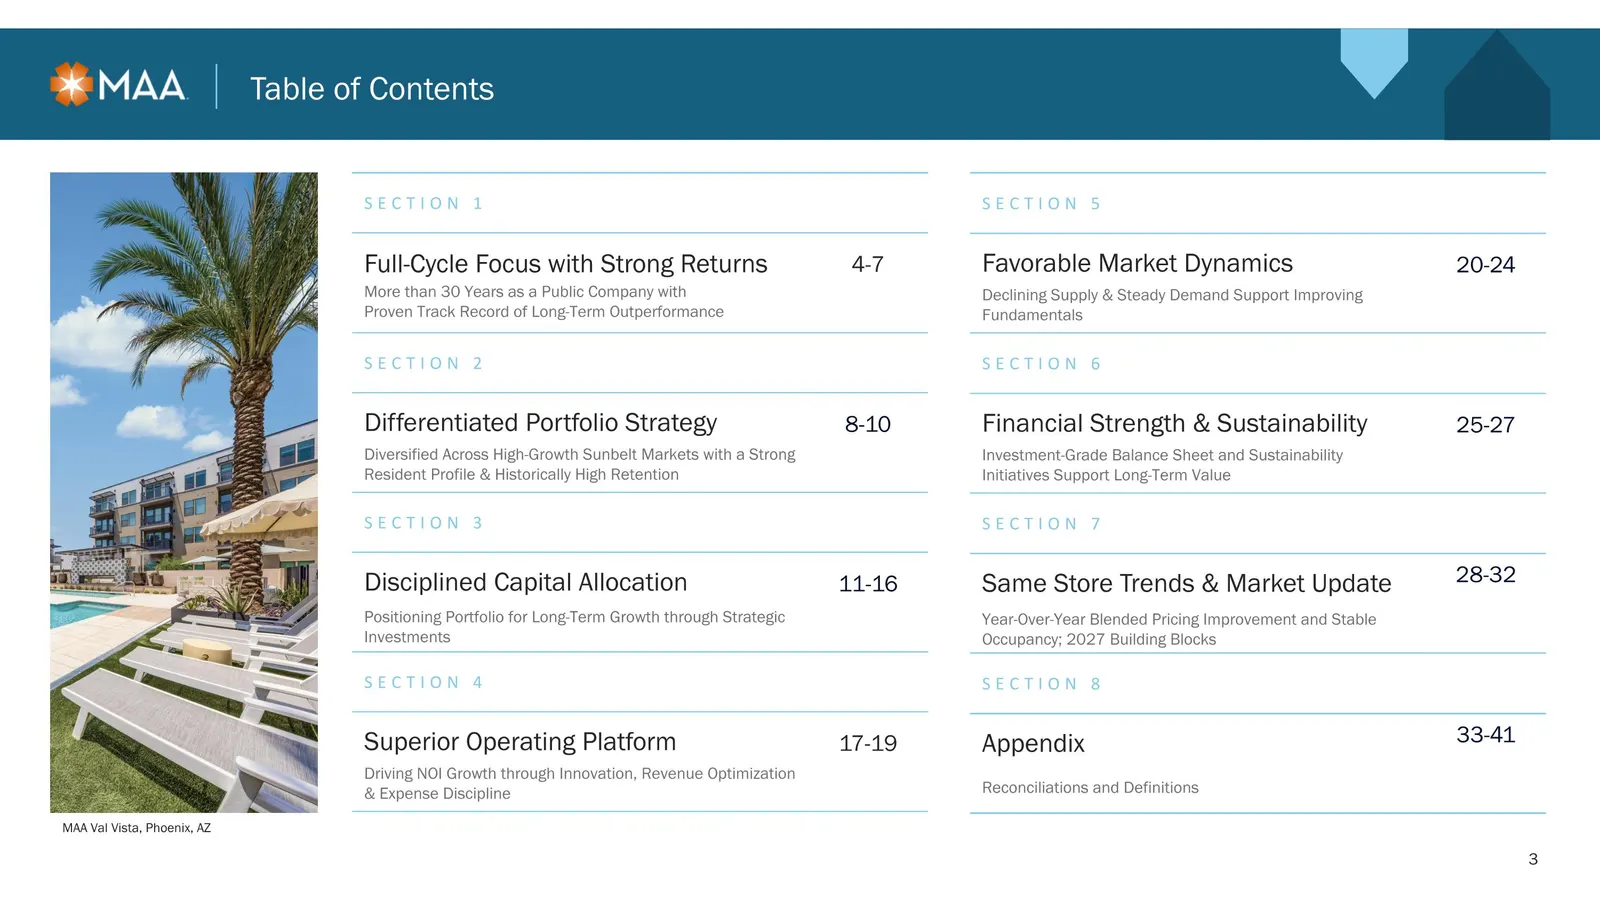
SECTION 5 Favorable Market Dynamics 20-24 Declining Supply & Steady Demand Support Improving Fundamentals SECTION 6 Financial Strength & Sustainability 25-27 Investment-Grade Balance Sheet and Sustainability Initiatives Support Long-Term Value SECTION 7 Same Store Trends & Market Update 28-32 Year-O
Slide 4: Why MAA Now? Established Growth Platform, Improving Market Fundamentals
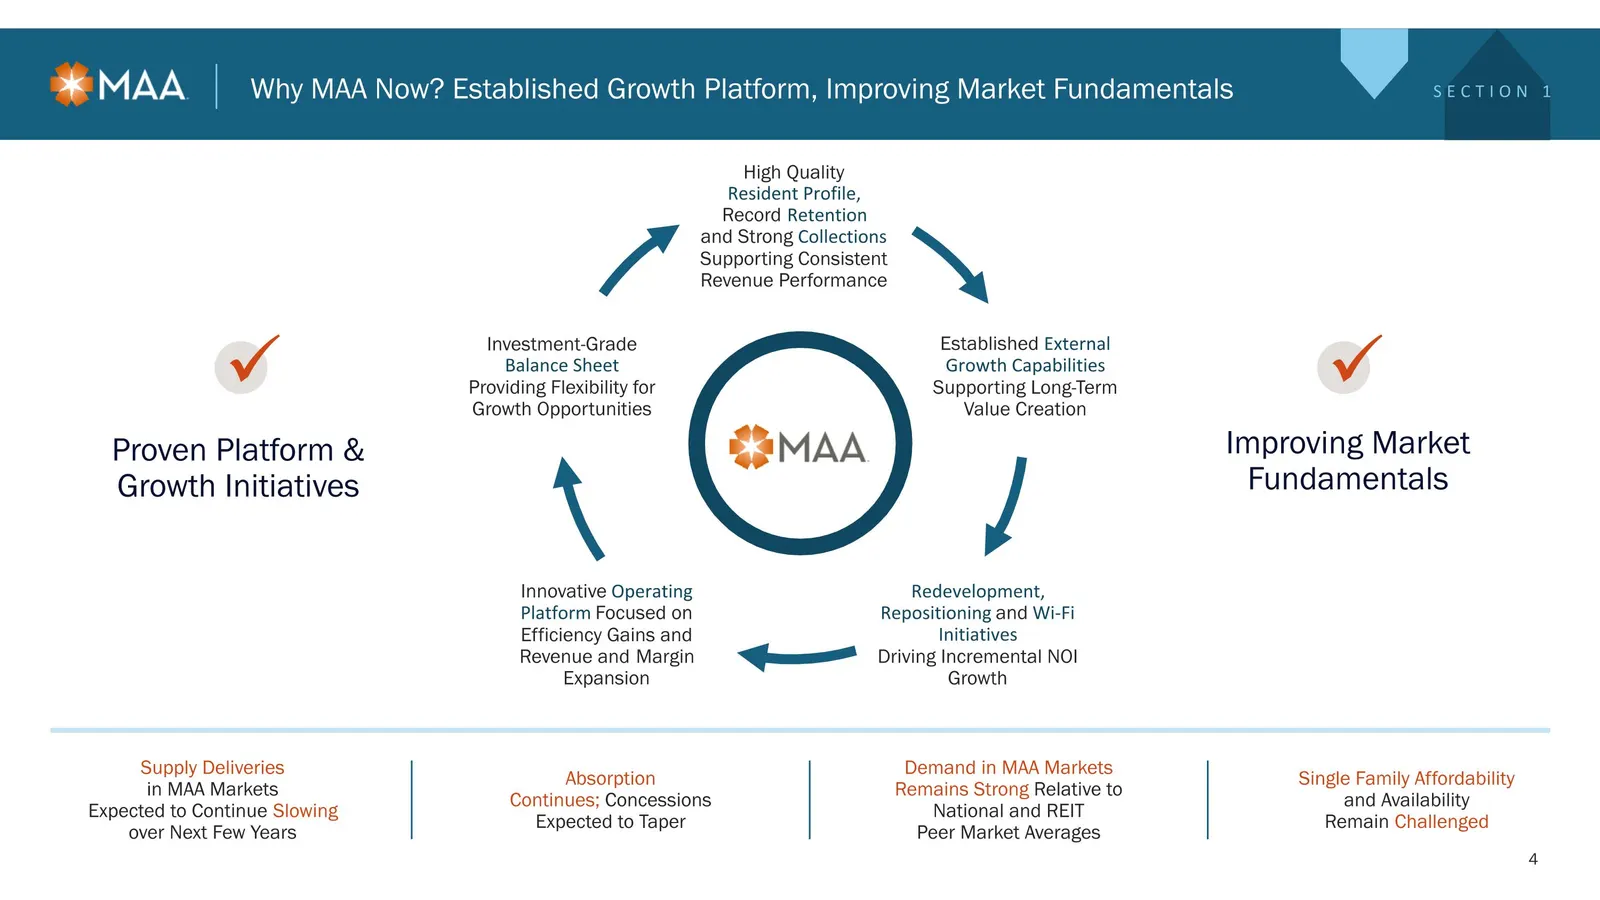
High Quality Resident Profile, Record Retention and Strong Collections Supporting Consistent Revenue Performance Established External Growth Capabilities Supporting Long-Term Value Creation Redevelopment, Repositioning and Wi-Fi Initiatives Driving Incremental NOI Growth Innovative Operating Platfor
Slide 5: A Proven Track Record of Long-Term Value Creation
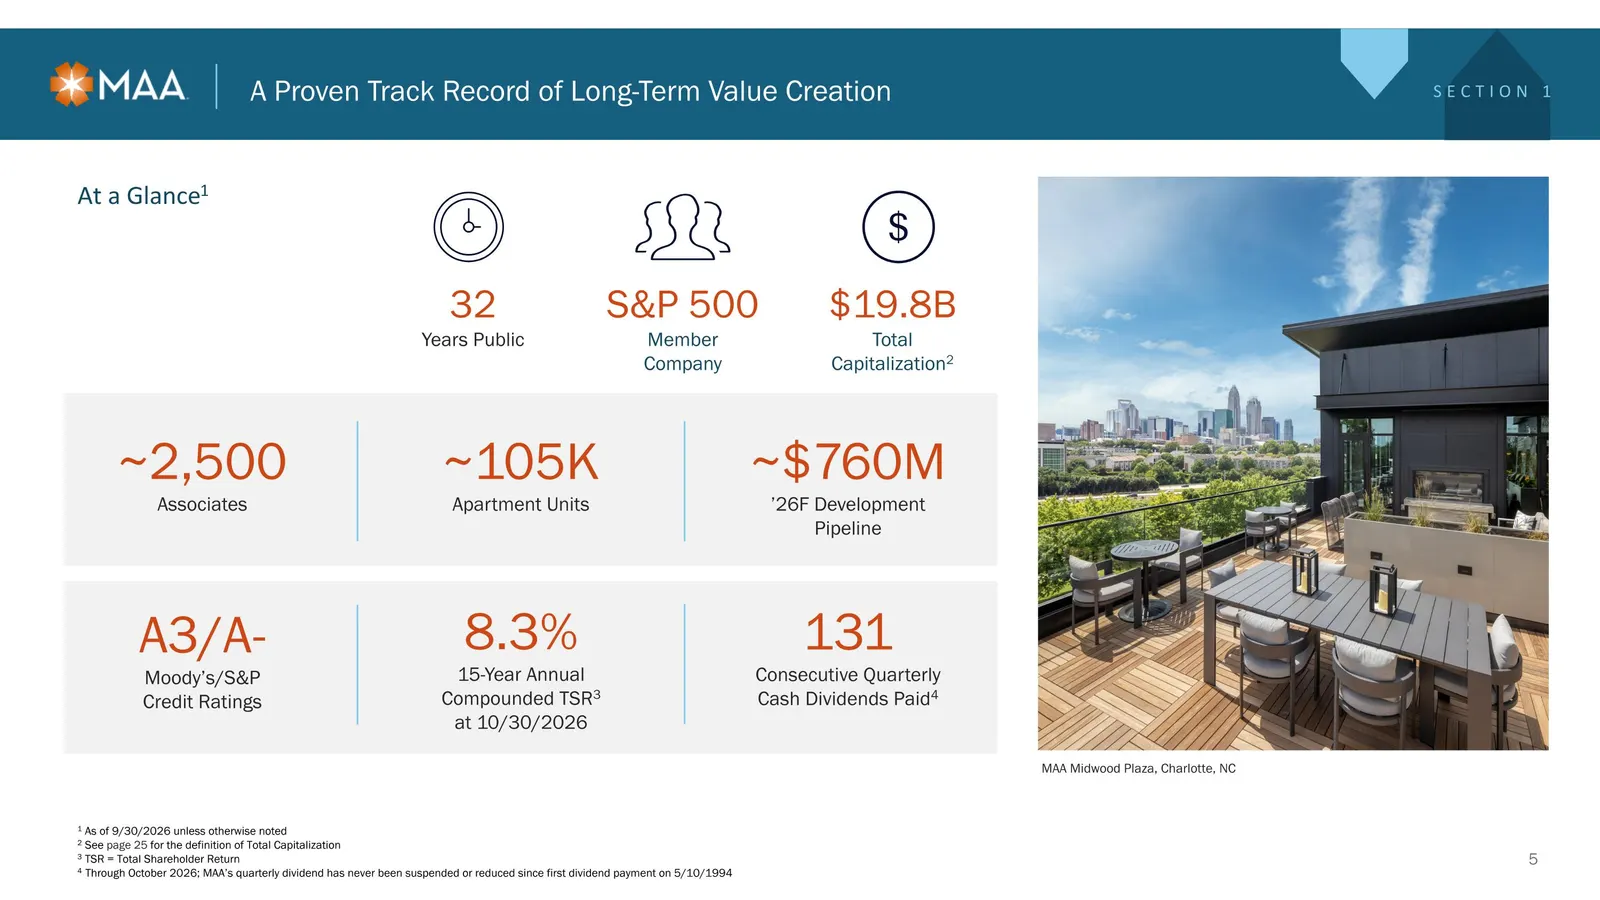
A3/A- Moody’s/S&P Credit Ratings 8.3% 15-Year Annual Compounded TSR3 at 10/30/2026 131 Consecutive Quarterly Cash Dividends Paid4 ~2,500 Associates ~105K Apartment Units ~$760M ’26F Development Pipeline 32 S&P 500 $19.8B Years Public Member Company Total Capitalization2 A Proven Track Record of Long
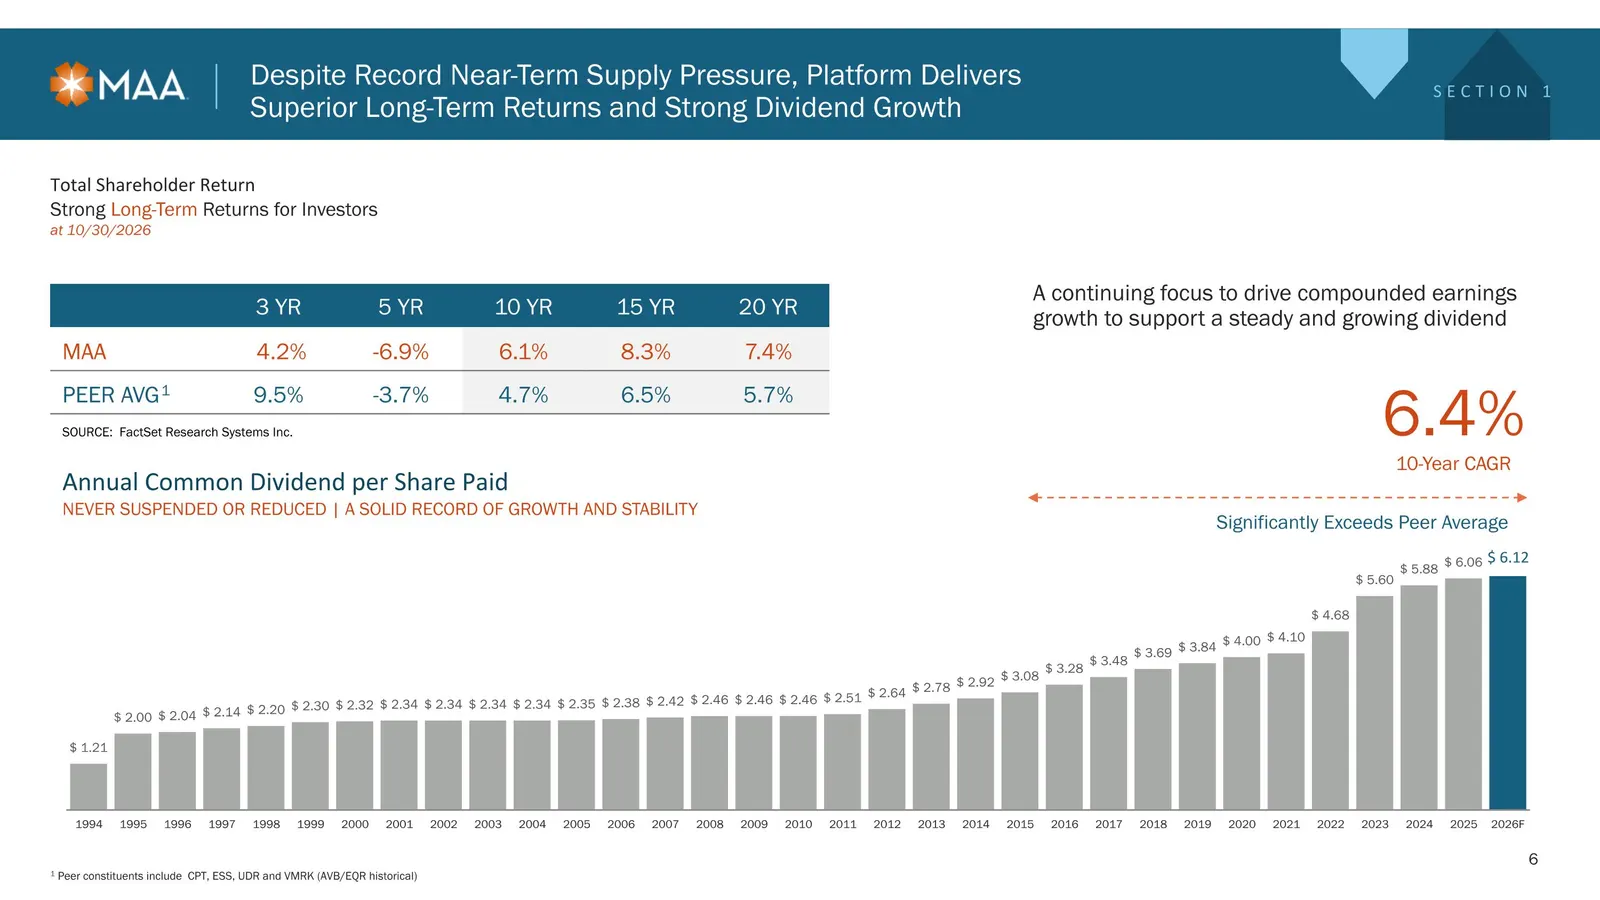
Slide 6: Superior Long-Term Returns and Strong Dividend Growth
Despite Record Near-Term Supply Pressure, Platform Delivers Superior Long-Term Returns and Strong Dividend Growth Annual Common Dividend per Share Paid Never Suspended or Reduced | A Solid Record of Growth and Stability Total Shareholder Return Strong Long-Term Returns for Investors at 10/30/2026 3
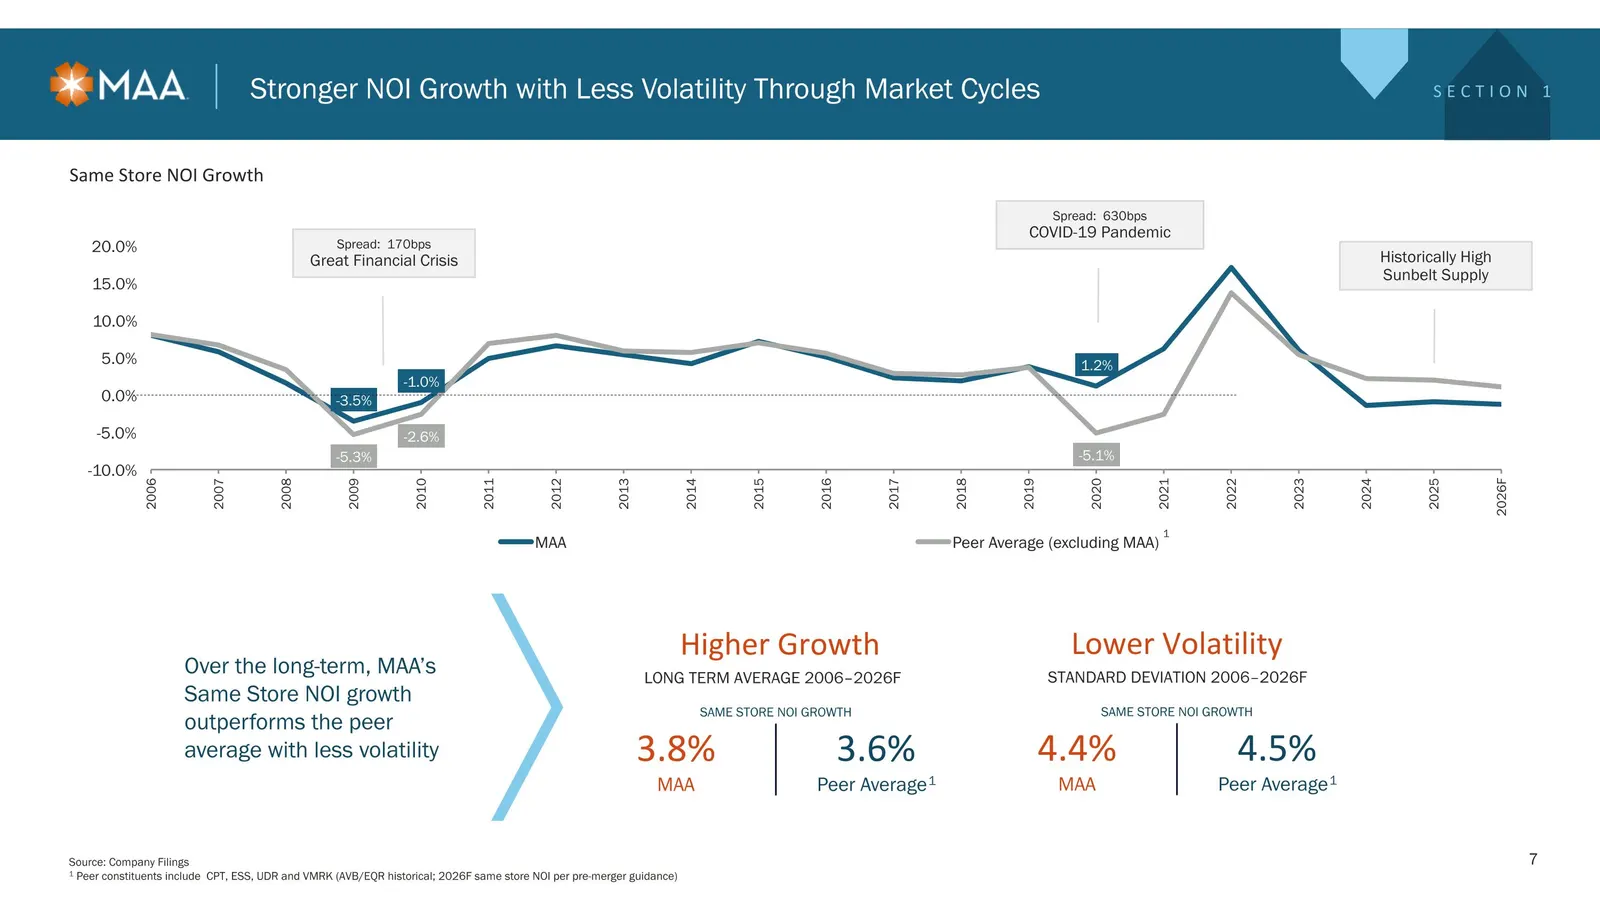
Slide 7: Stronger NOI Growth with Less Volatility Through Market Cycles
LONG TERM AVERAGE 2006–2026F Higher Growth STANDARD DEVIATION 2006–2026F Lower Volatility Spread: 170bps Great Financial Crisis Spread: 630bps COVID-19 Pandemic Stronger NOI Growth with Less Volatility Through Market Cycles Over the long-term, MAA’s Same Store NOI growth outperforms the peer average
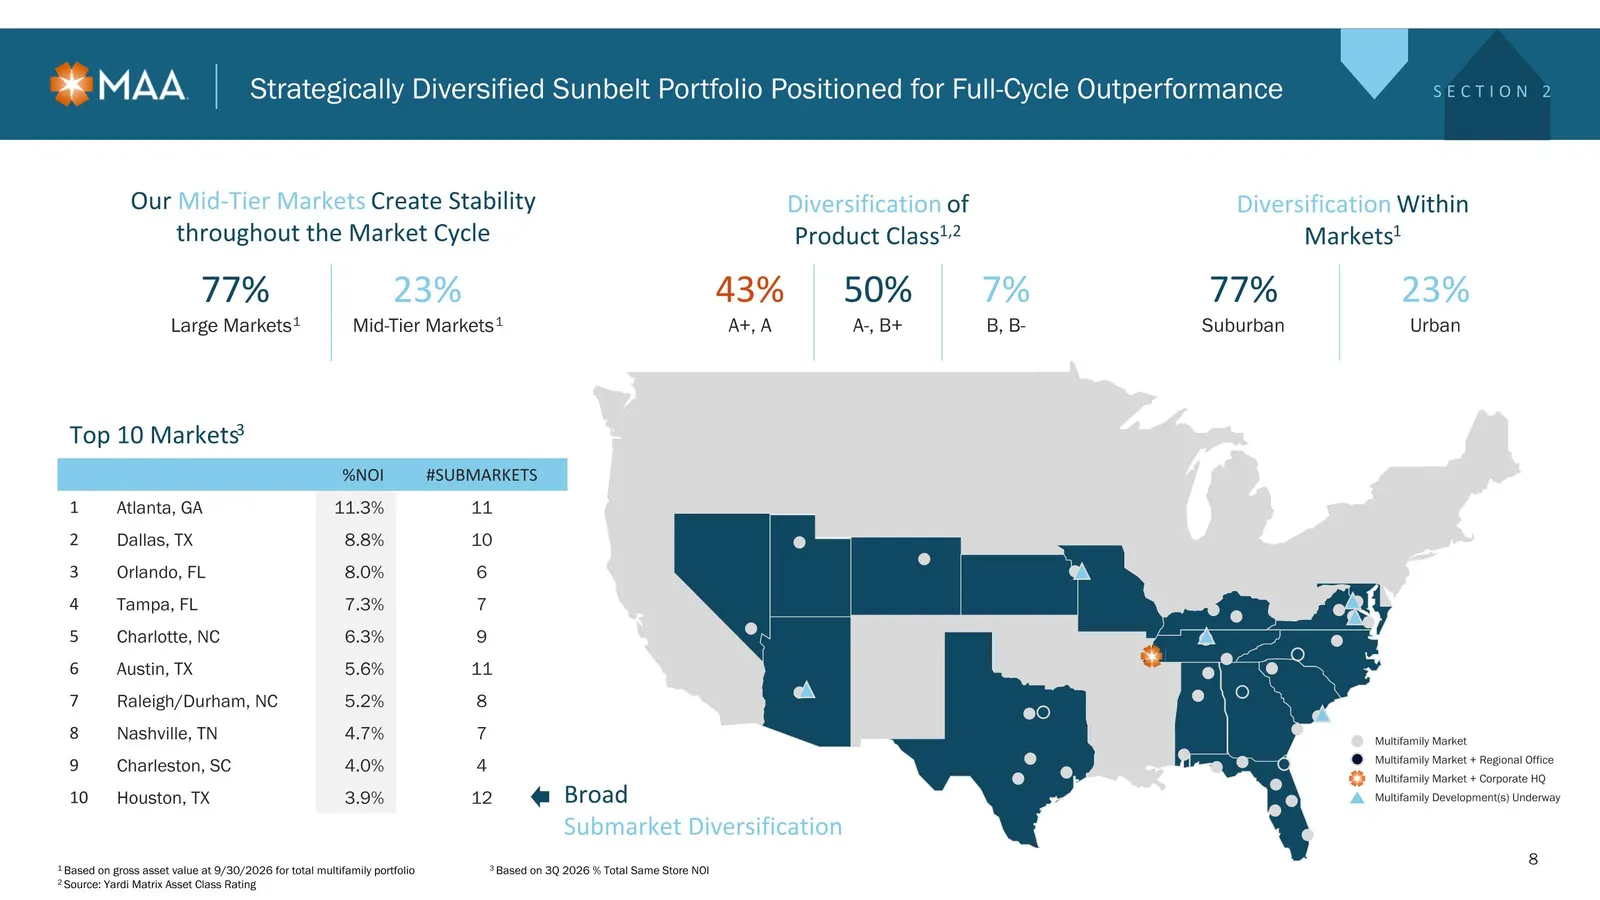
Slide 8: Strategically Diversified Sunbelt Portfolio
Strategically Diversified Sunbelt Portfolio Positioned for Full-Cycle Outperformance Diversification Within Markets1 77% 23% Suburban Urban Our Mid-Tier Markets Create Stability throughout the Market Cycle 77% 23% Large Markets1 Mid-Tier Markets1 %NOI #SUBMARKETS 1 Atlanta, GA 11.3% 11 2 Dallas, TX
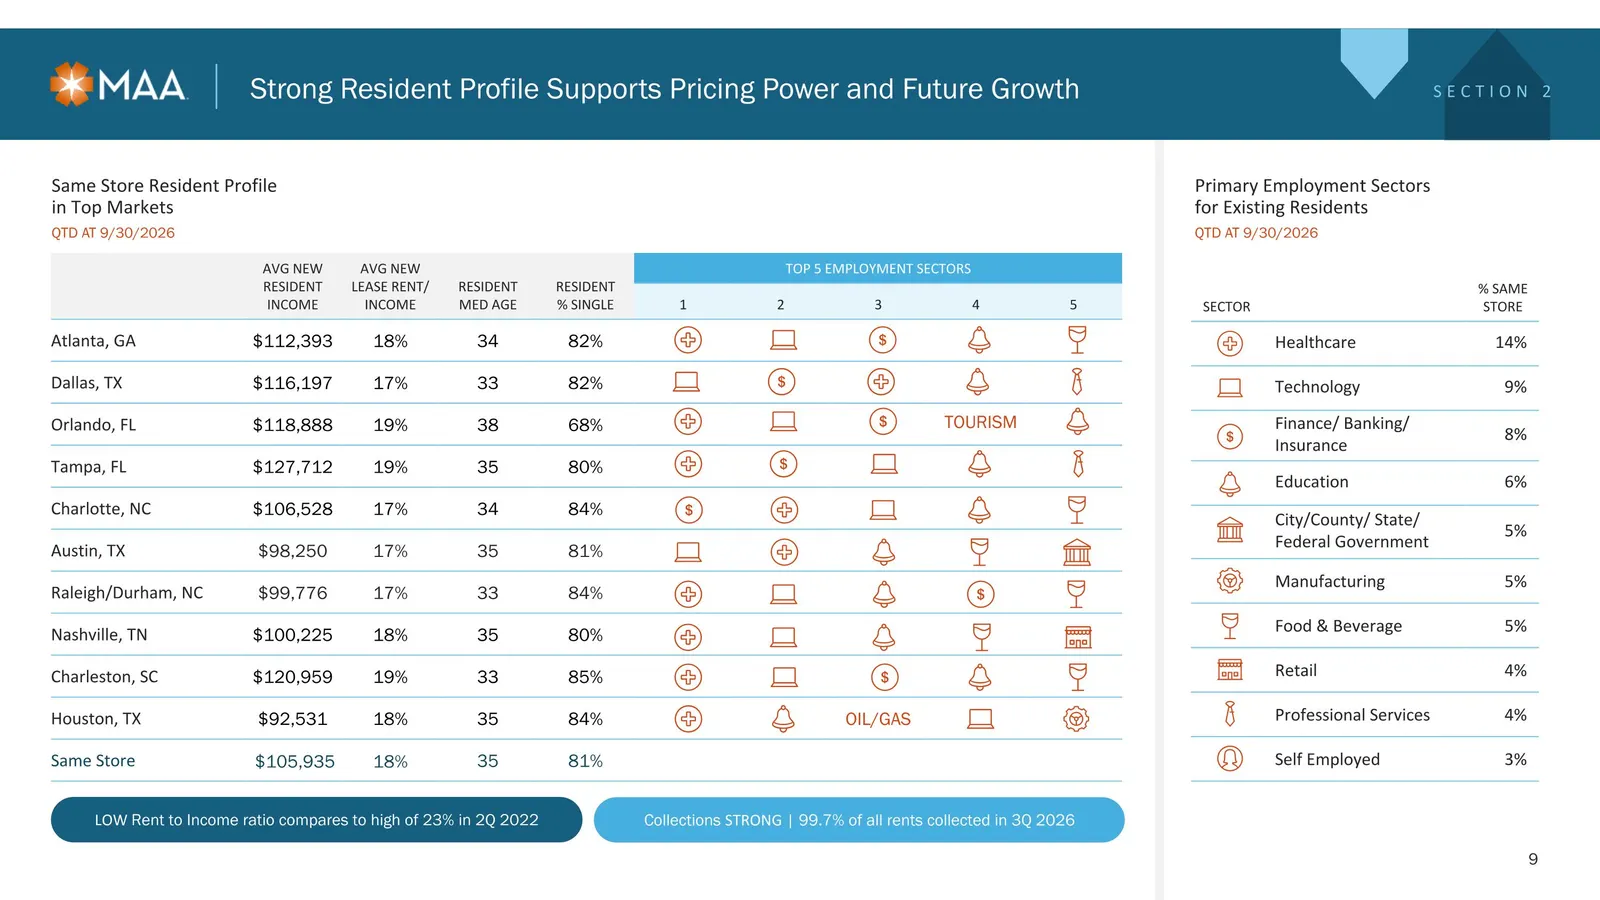
Slide 9: Strong Resident Profile Supports Pricing Power and Future Growth
SECTOR % SAME STORE Healthcare 14% Technology 9% Finance/ Banking/ Insurance 8% Education 6% City/County/ State/ Federal Government 5% Manufacturing 5% Food & Beverage 5% Retail 4% Professional Services 4% Self Employed 3% Strong Resident Profile Supports Pricing Power and Future Growth AVG NEW RESI
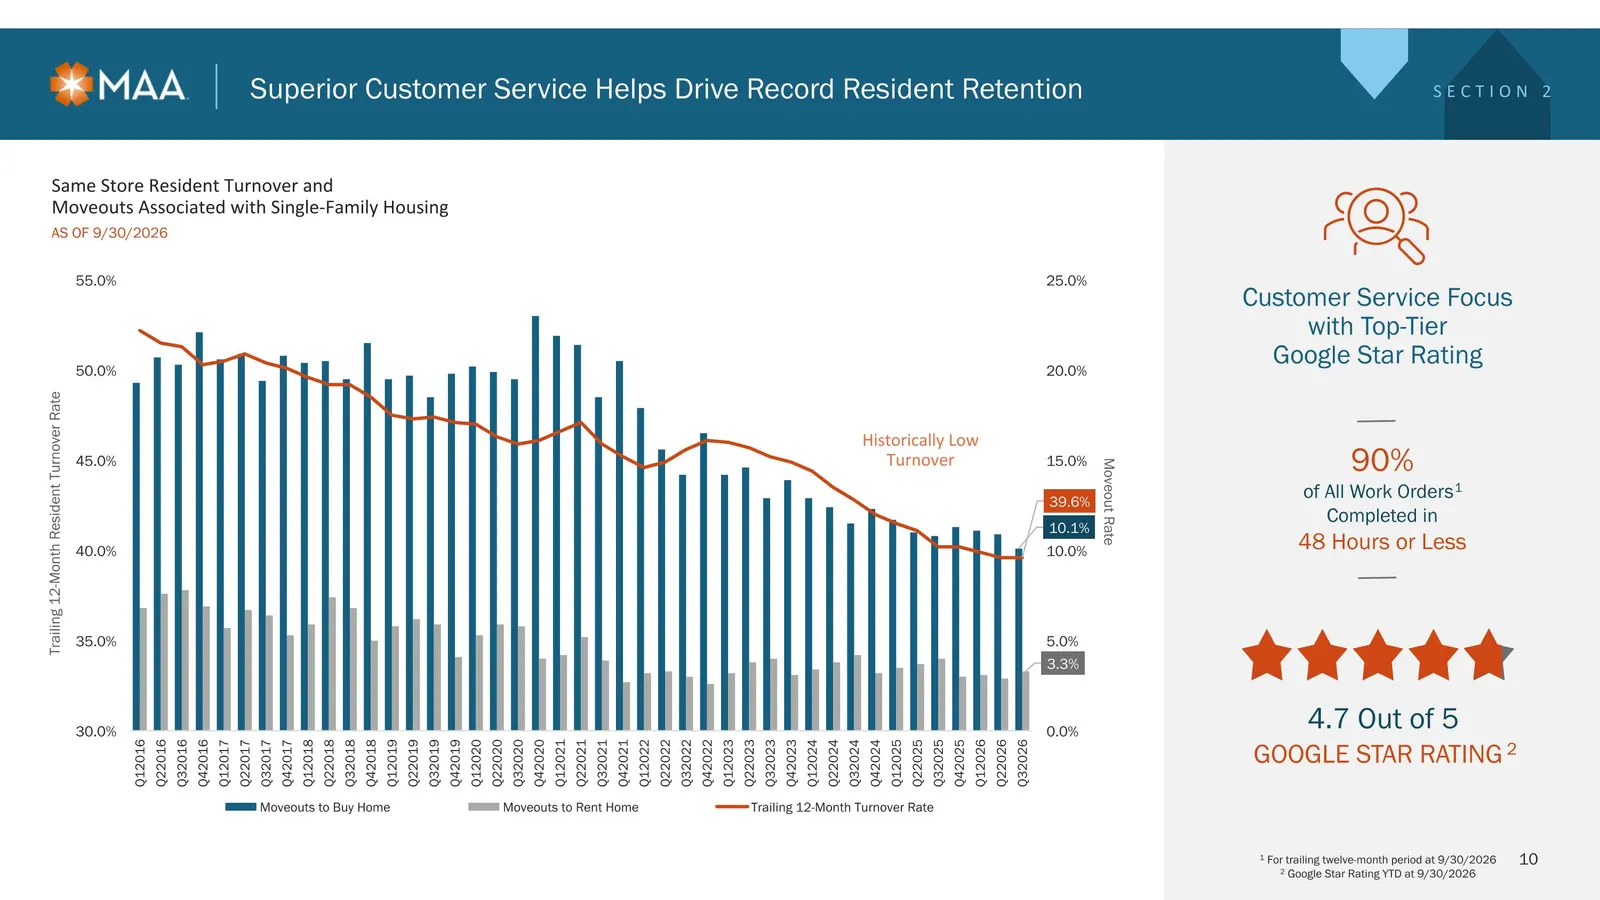
Slide 10: Superior Customer Service Helps Drive Record Resident Retention
Same Store Resident Turnover and Moveouts Associated with Single-Family Housing As of 9/30/2026 Superior Customer Service Helps Drive Record Resident Retention Trailing 12-Month Resident Turnover Rate Moveout Rate Historically Low Turnover SECTION 2 10 Customer Service Focus with Top-Tier Google Sta
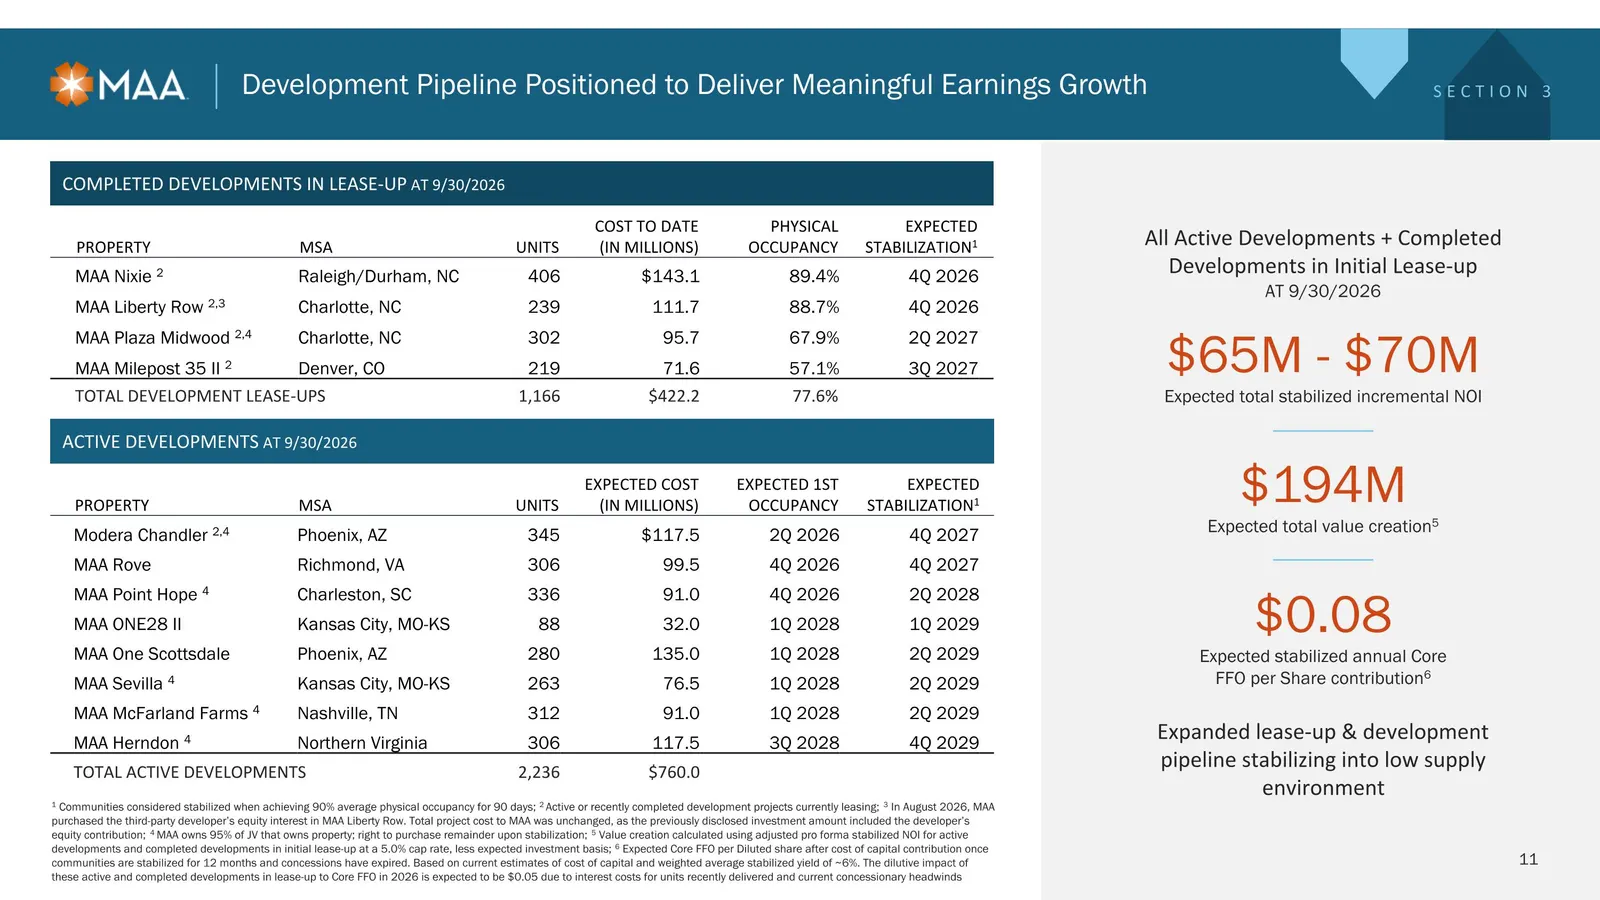
Slide 11: Development Pipeline Positioned to Deliver Meaningful Earnings Growth
Development Pipeline Positioned to Deliver Meaningful Earnings Growth All Active Developments + Completed Developments in Initial Lease-up AT 9/30/2026 Expected total stabilized incremental NOI $65M - $70M Expected total value creation5 $194M Expected stabilized annual Core FFO per Share contributio
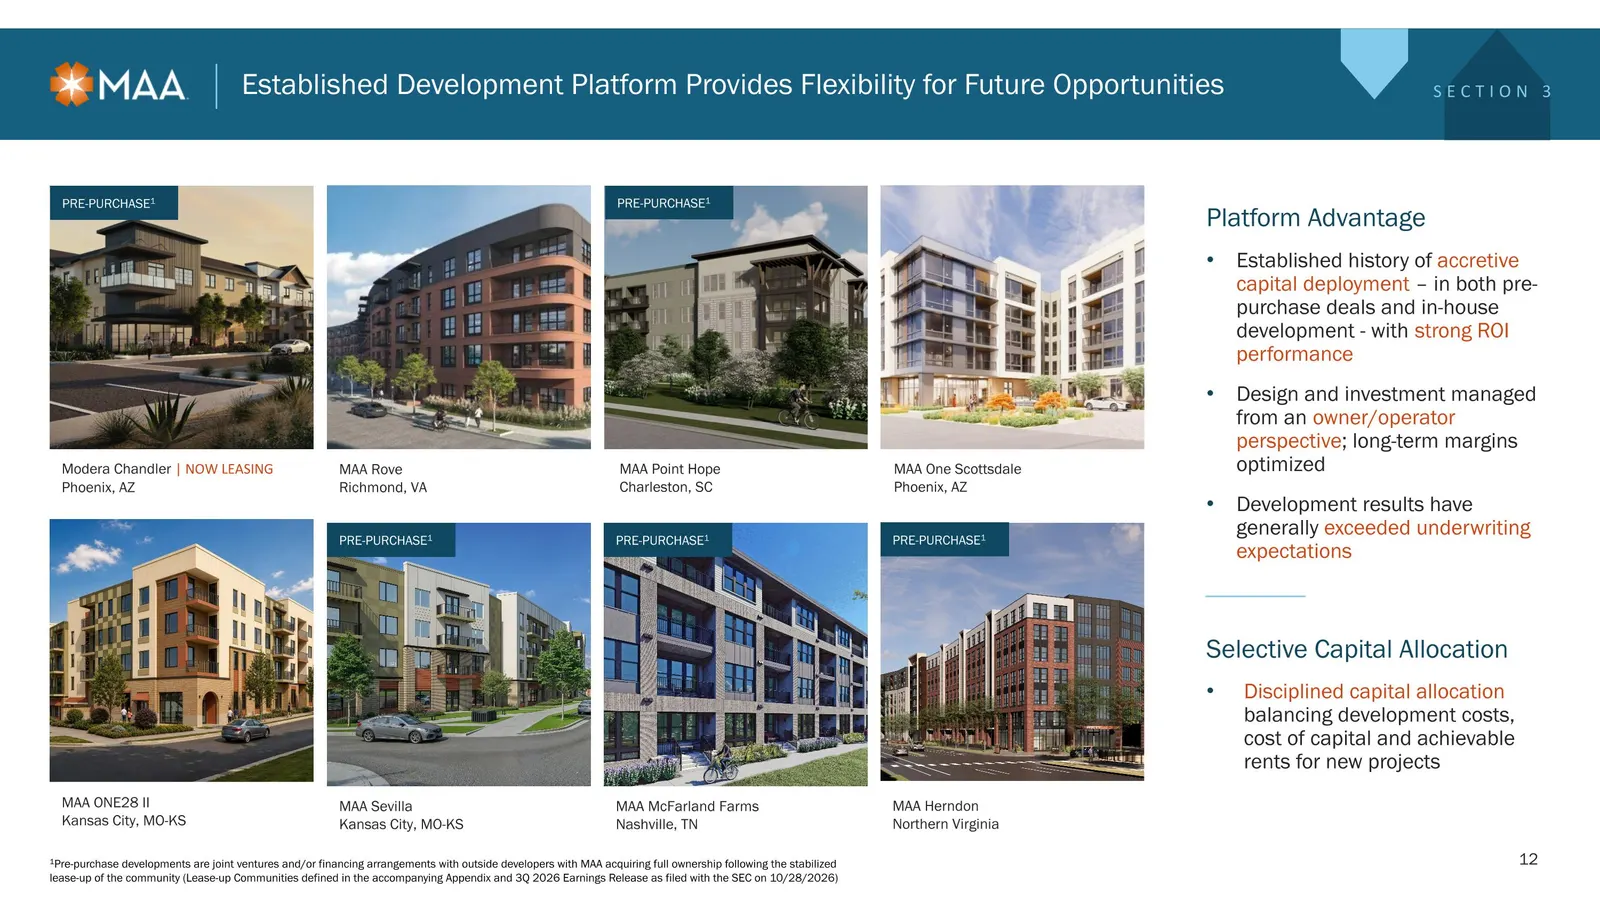
Slide 12: Established Development Platform Provides Flexibility
Established Development Platform Provides Flexibility for Future Opportunities Modera Chandler | NOW LEASING Phoenix, AZ PRE-PURCHASE1 MAA Rove Richmond, VA MAA Point Hope Charleston, SC PRE-PURCHASE1 MAA One Scottsdale Phoenix, AZ MAA ONE28 II Kansas City, MO-KS MAA Sevilla Kansas City, MO-KS PRE-P
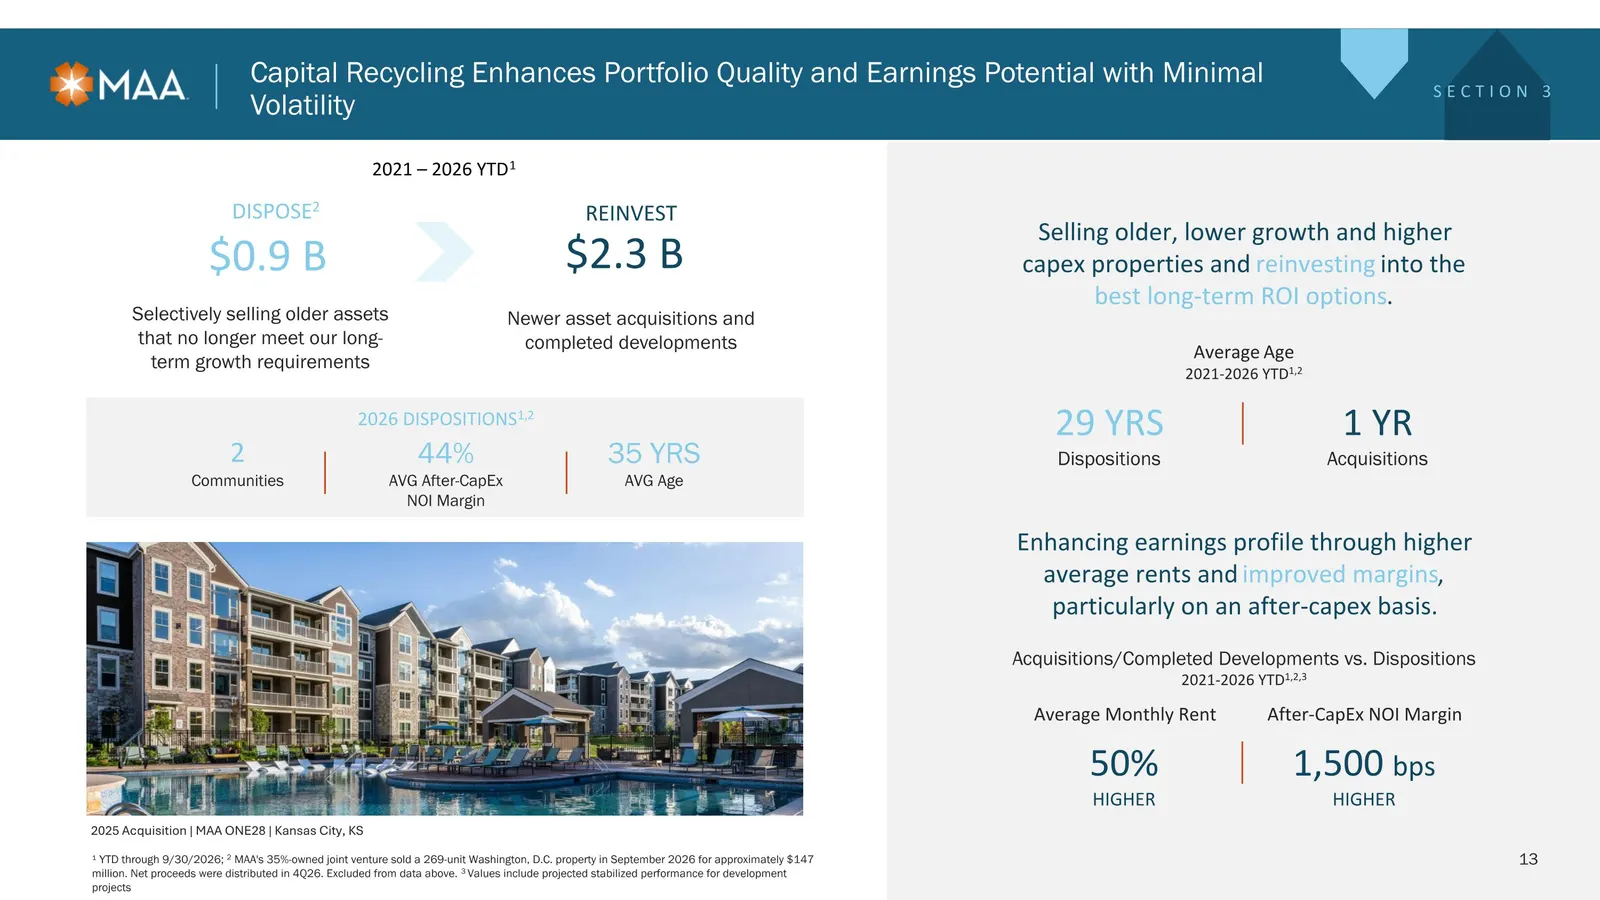
Slide 13: Capital Recycling Enhances Portfolio Quality and Earnings Potential
Capital Recycling Enhances Portfolio Quality and Earnings Potential with Minimal Volatility Average Age 2021-2026 YTD1,2 ¹ YTD through 9/30/2026; 2 MAA's 35%-owned joint venture sold a 269-unit Washington, D.C. property in September 2026 for approximately $147 million. Net proceeds were distributed
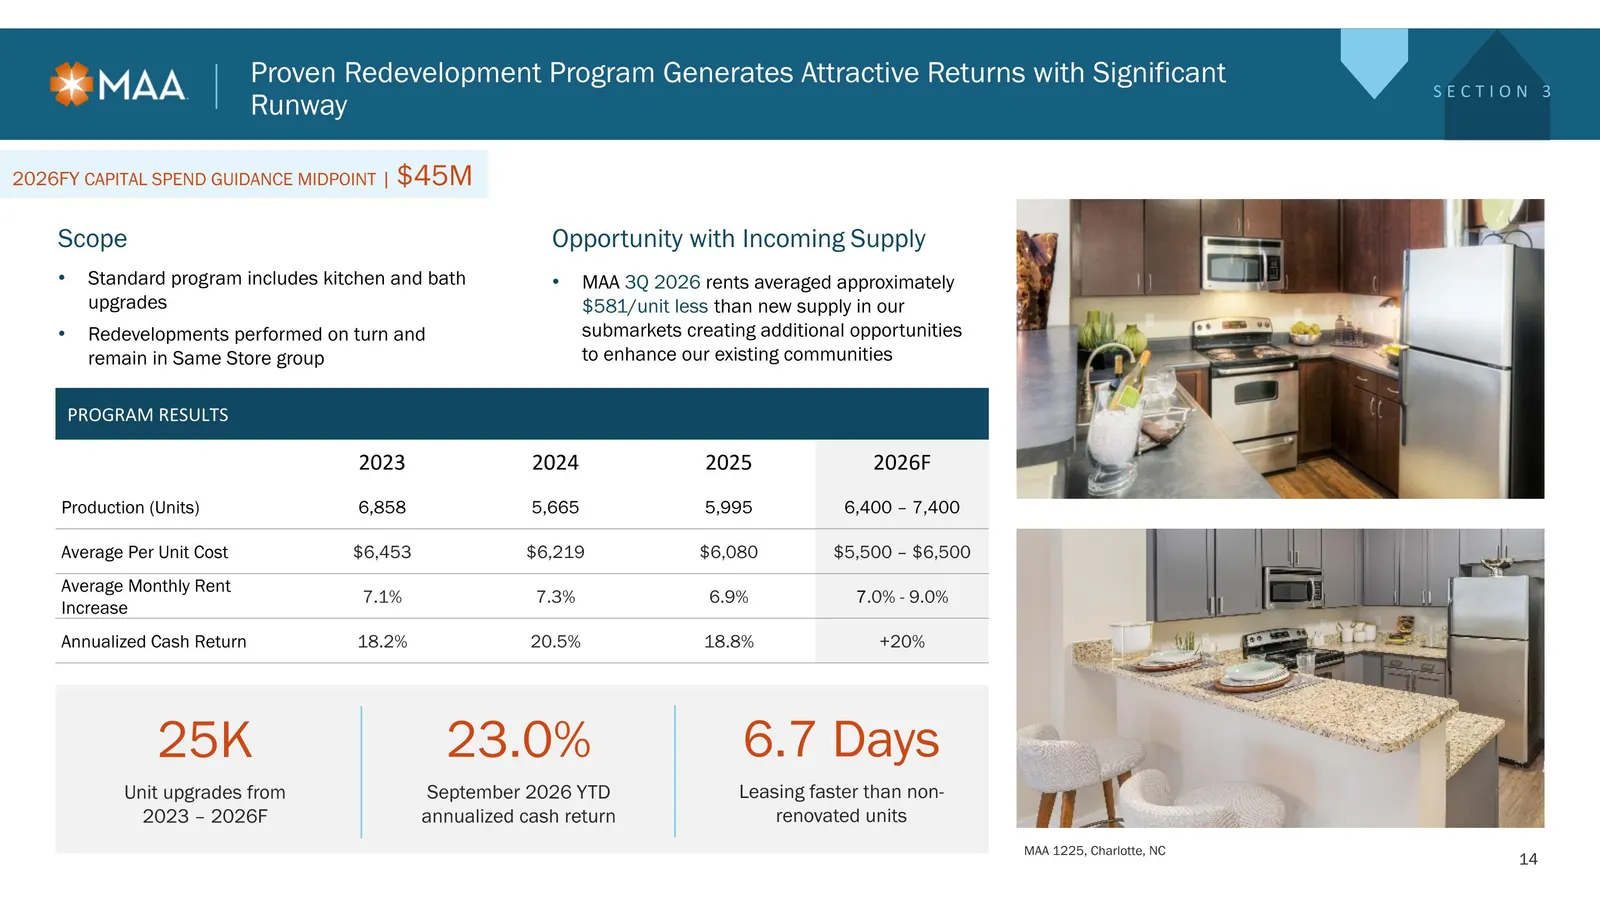
Slide 14: Proven Redevelopment Program Generates Attractive Returns
PROGRAM RESULTS 2023 2024 2025 2026F Production (Units) 6,858 5,665 5,995 6,400 – 7,400 Average Per Unit Cost $6,453 $6,219 $6,080 $5,500 – $6,500 Average Monthly Rent Increase 7.1% 7.3% 6.9% 7.0% - 9.0% Annualized Cash Return 18.2% 20.5% 18.8% +20% Proven Redevelopment Program Generates Attractive
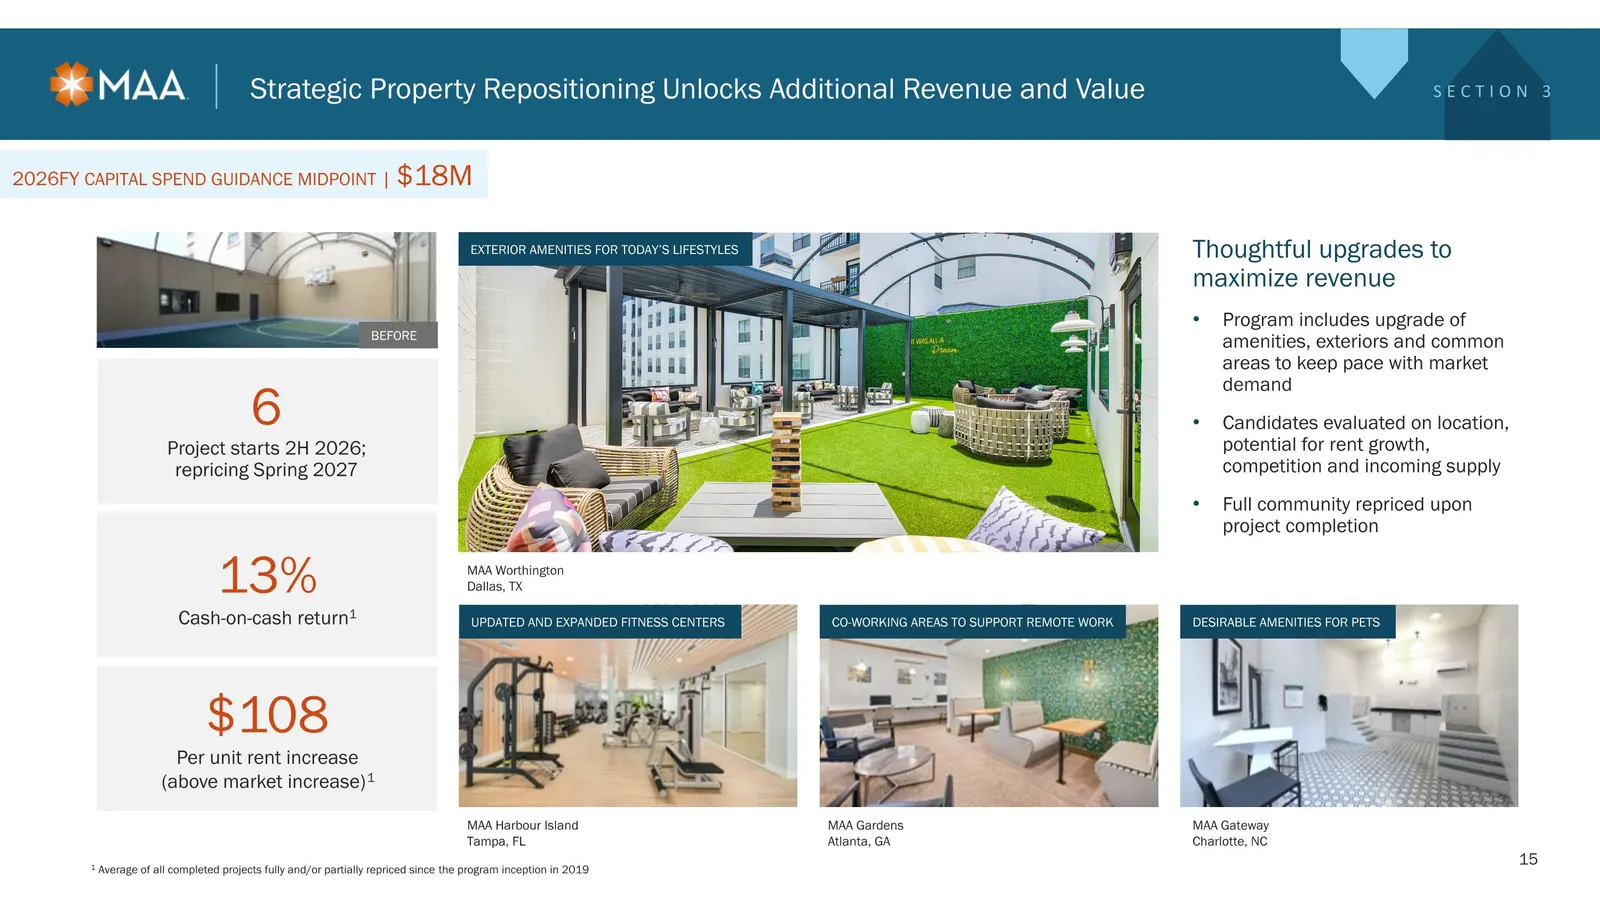
Slide 15: Strategic Property Repositioning Unlocks Additional Revenue and Value
Strategic Property Repositioning Unlocks Additional Revenue and Value Thoughtful upgrades to maximize revenue Program includes upgrade of amenities, exteriors and common areas to keep pace with market demand Candidates evaluated on location, potential for rent growth, competition and incoming supply
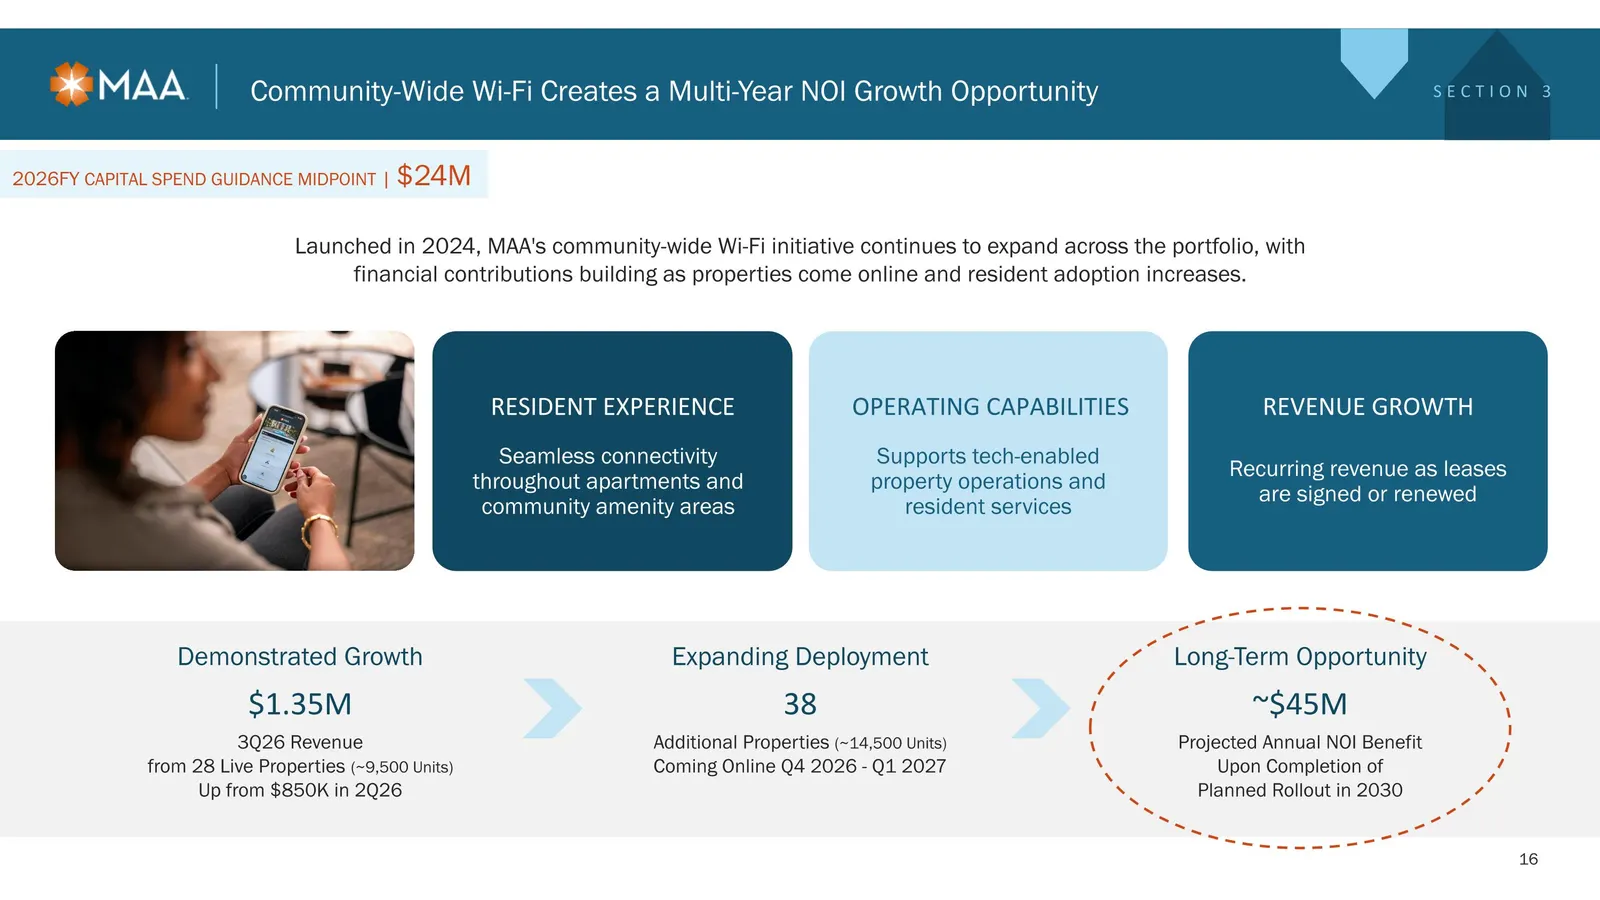
Slide 16: Community-Wide Wi-Fi Creates a Multi-Year NOI Growth Opportunity
Community-Wide Wi-Fi Creates a Multi-Year NOI Growth Opportunity SECTION 3 2026FY CAPITAL SPEND GUIDANCE MIDPOINT | $24M Demonstrated Growth Expanding Deployment Long-Term Opportunity $1.35M 38 ~$45M 3Q26 Revenue from 28 Live Properties (~9,500 Units) Up from $850K in 2Q26 Additional Properties (~14
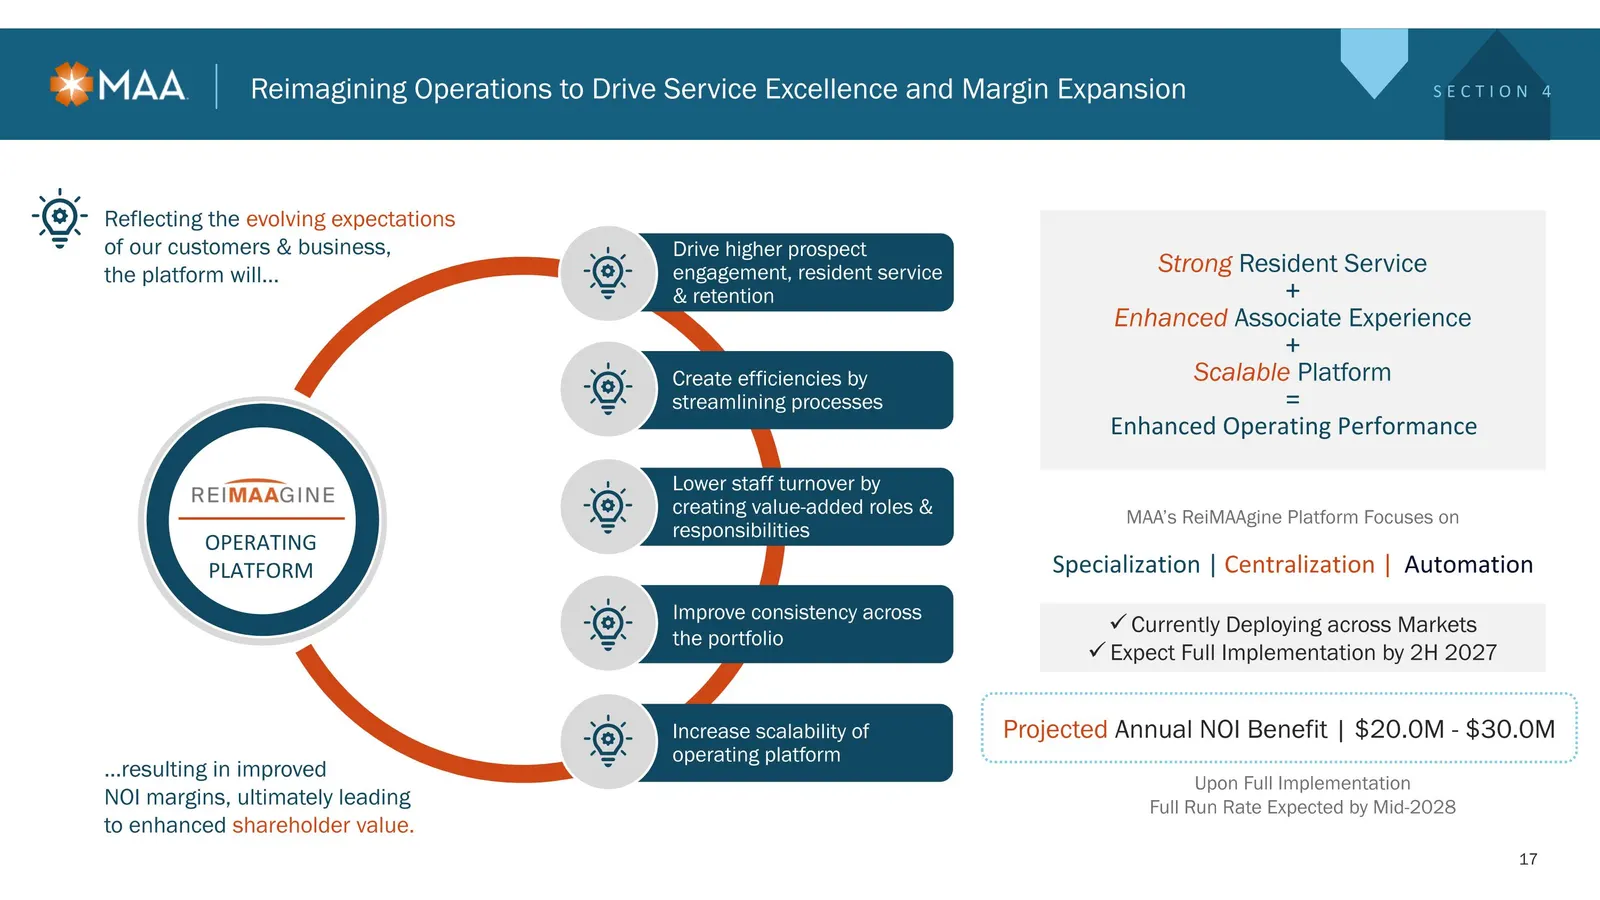
Slide 17: Reimagining Operations to Drive Service Excellence and Margin Expansion
Reflecting the evolving expectations of our customers & business, the platform will… Create efficiencies by streamlining processes Lower staff turnover by creating value-added roles & responsibilities Improve consistency across the portfolio Increase scalability of operating platform Drive higher pr
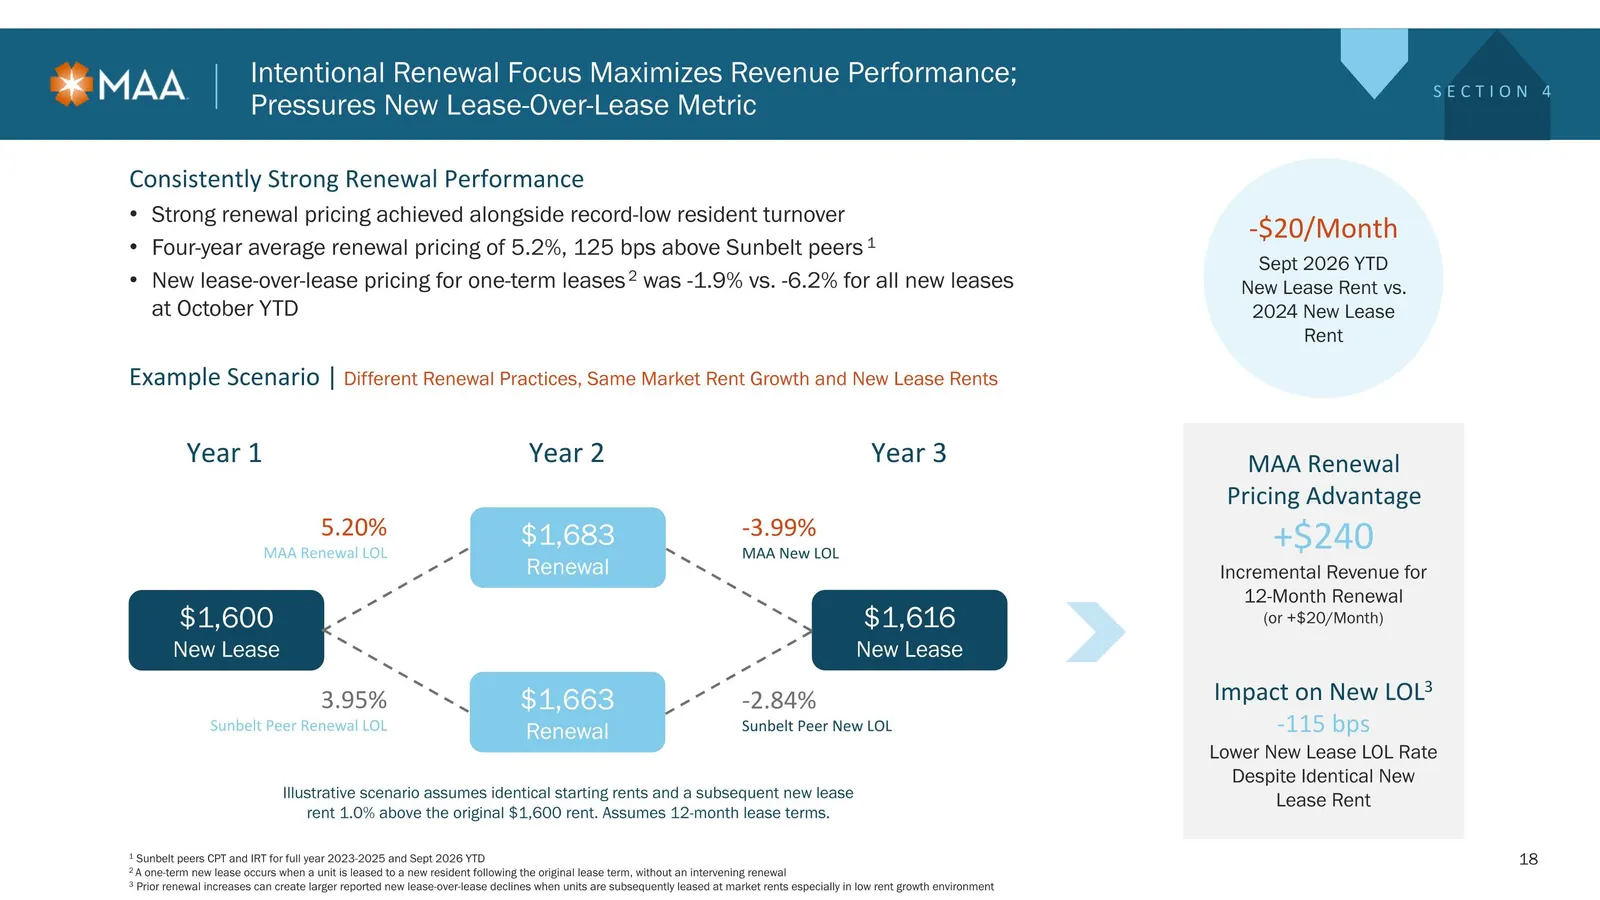
Slide 18: Intentional Renewal Focus Maximizes Revenue Performance
Year 1 Year 2 Year 3 Intentional Renewal Focus Maximizes Revenue Performance; Pressures New Lease-Over-Lease Metric SECTION 4 $1,600 New Lease $1,616 New Lease $1,683 Renewal $1,663 Renewal 3.95% Sunbelt Peer Renewal LOL -2.84% Sunbelt Peer New LOL Illustrative scenario assumes identical starting re
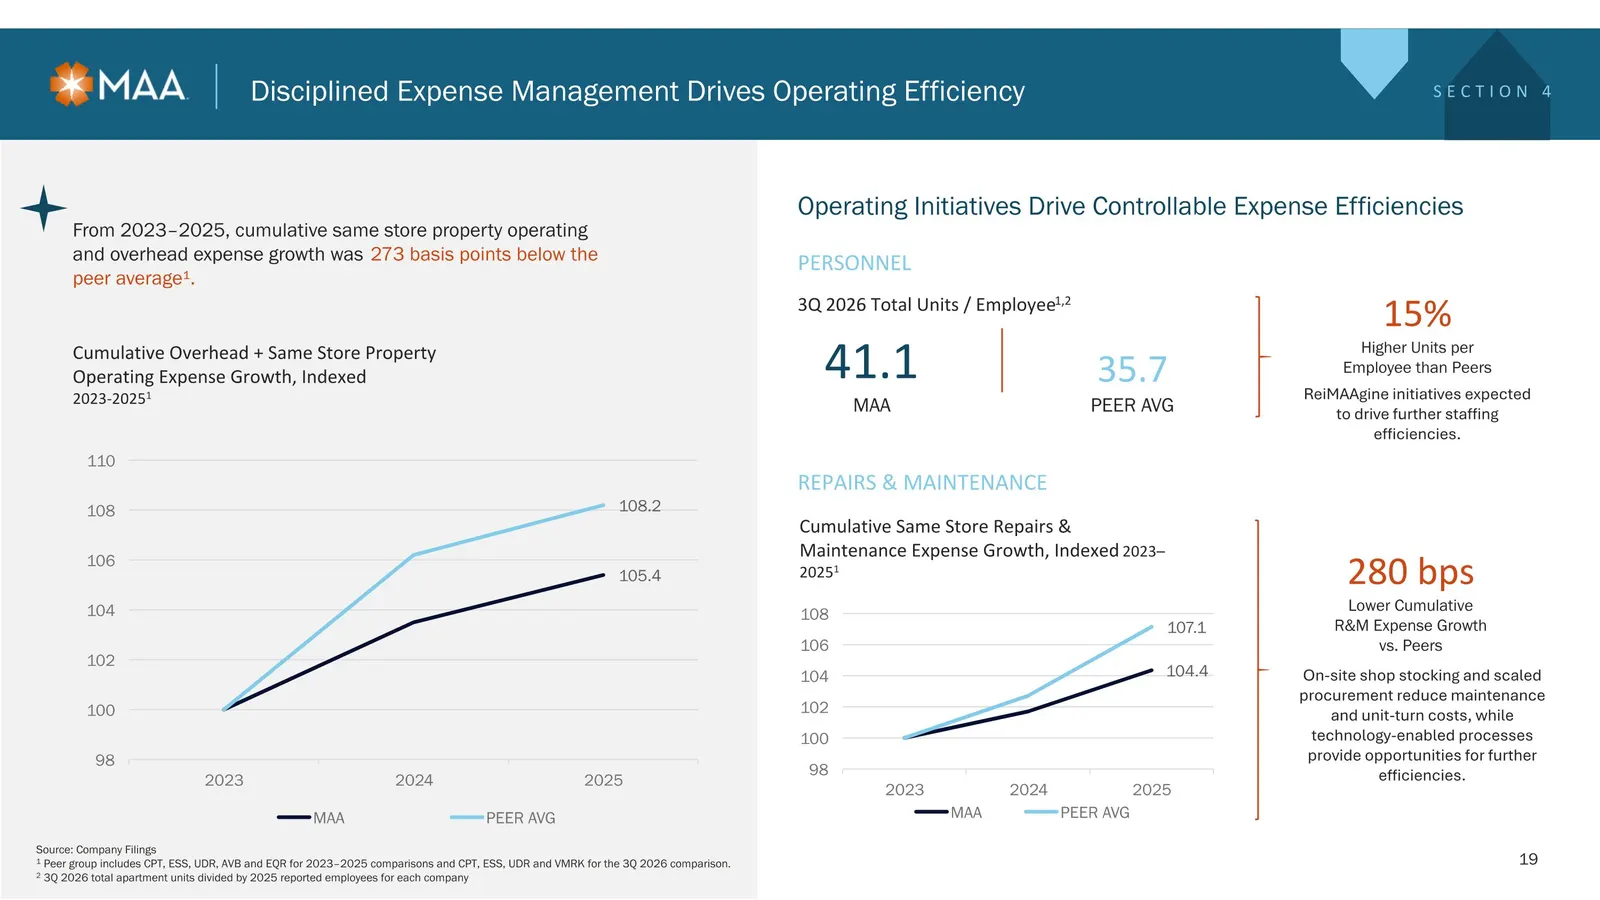
Slide 19: Disciplined Expense Management Drives Operating Efficiency
Disciplined Expense Management Drives Operating Efficiency SECTION 4 From 2023–2025, cumulative same store property operating and overhead expense growth was 273 basis points below the peer average¹. Operating Initiatives Drive Controllable Expense Efficiencies 3Q 2026 Total Units / Employee1,2 41.1
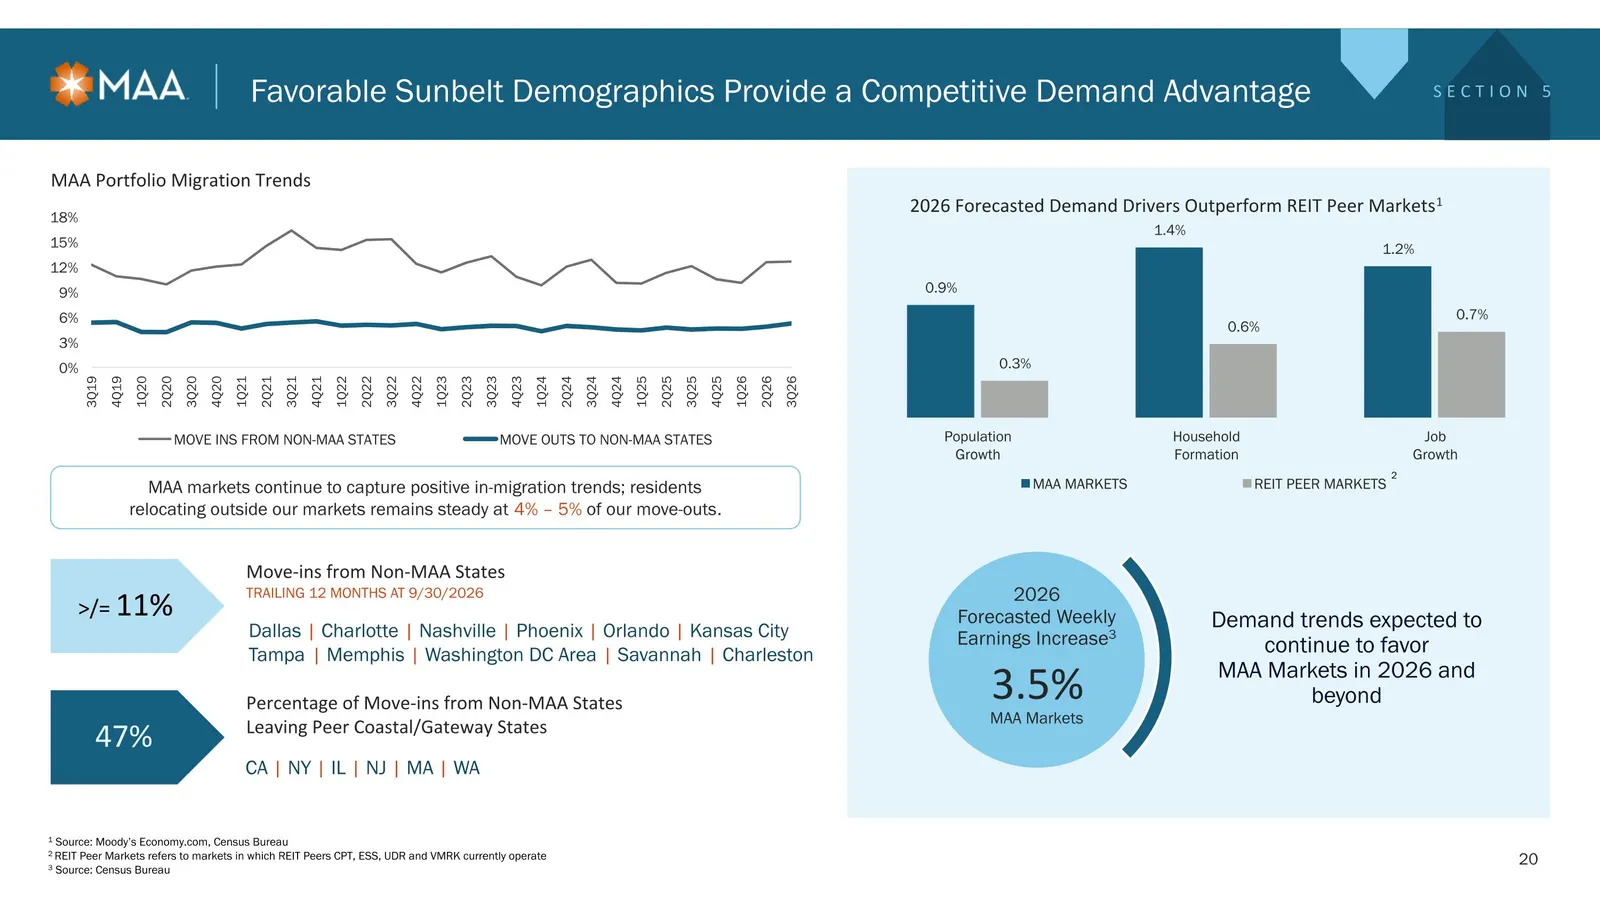
Slide 20: Favorable Sunbelt Demographics Provide a Competitive Demand Advantage
2026 Forecasted Demand Drivers Outperform REIT Peer Markets1 Favorable Sunbelt Demographics Provide a Competitive Demand Advantage 2 MAA Portfolio Migration Trends 1 Source: Moody’s Economy.com, Census Bureau 2 REIT Peer Markets refers to markets in which REIT Peers CPT, ESS, UDR and VMRK currently
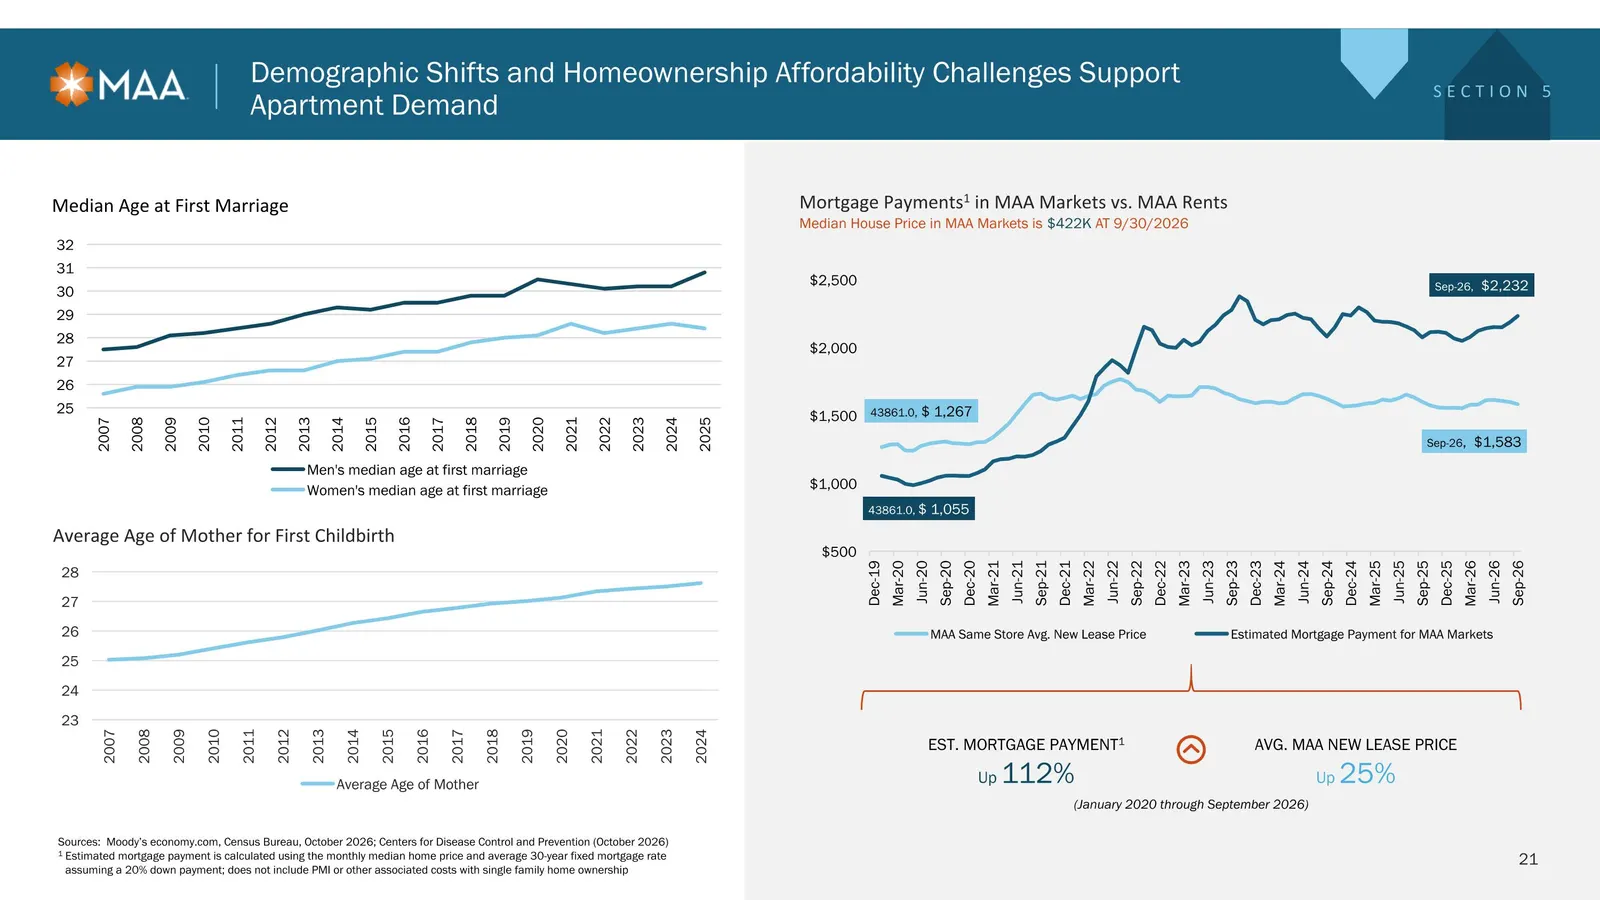
Slide 21: Homeownership Affordability Challenges Support Apartment Demand
Demographic Shifts and Homeownership Affordability Challenges Support Apartment Demand Mortgage Payments1 in MAA Markets vs. MAA Rents Median House Price in MAA Markets is $422K AT 9/30/2026 Sources: Moody’s economy.com, Census Bureau, October 2026; Centers for Disease Control and Prevention (Octobe
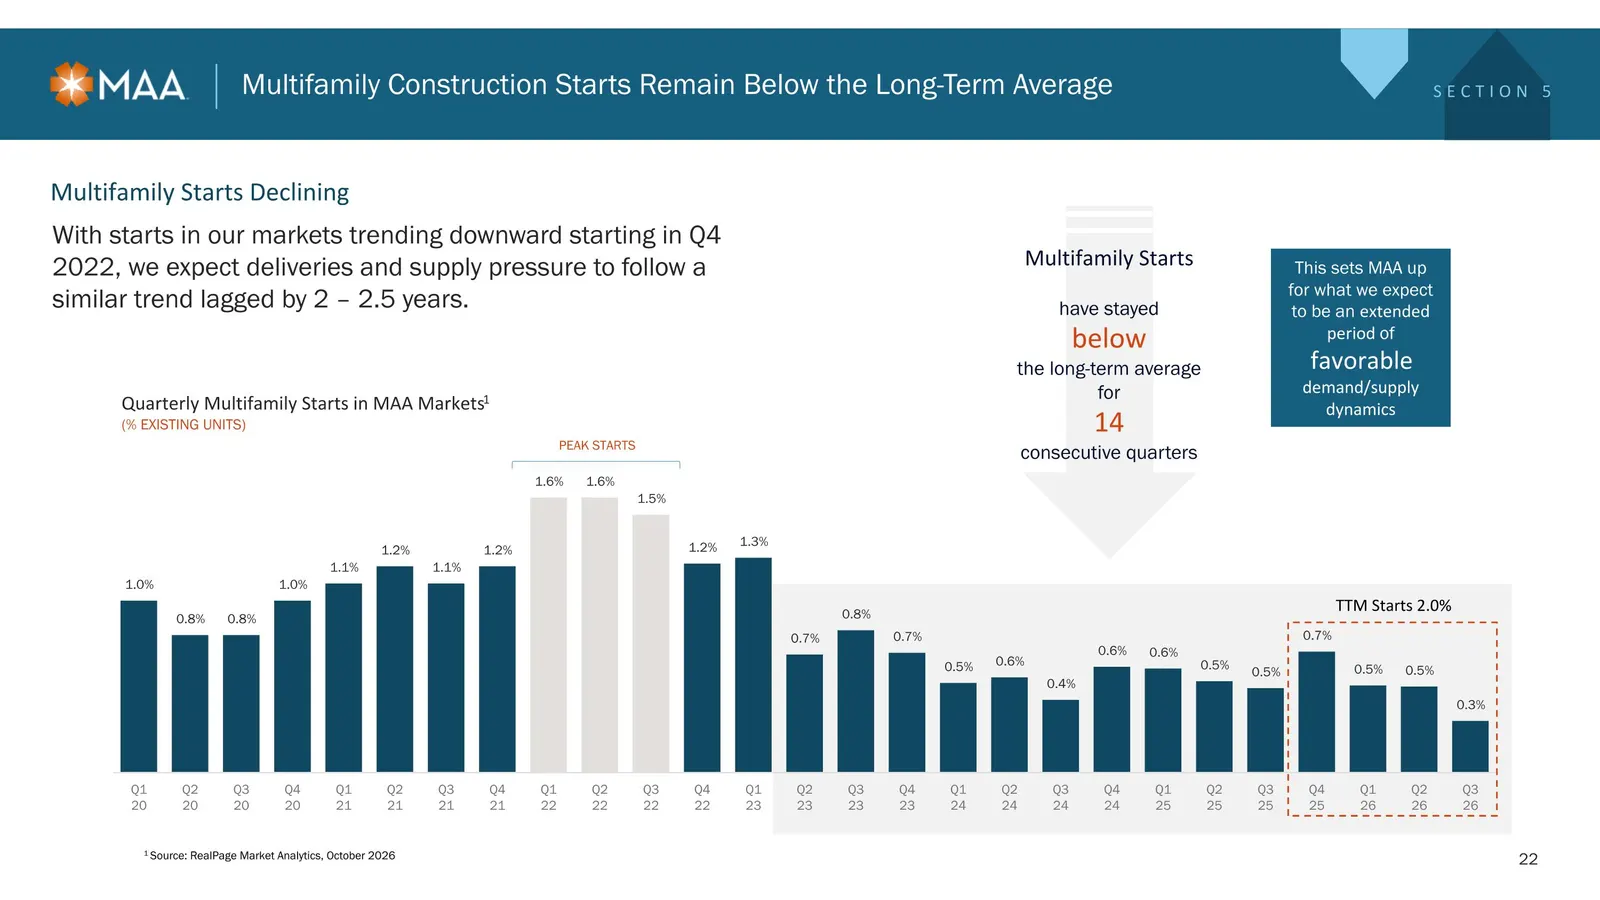
Slide 22: Multifamily Construction Starts Remain Below the Long-Term Average
Multifamily Construction Starts Remain Below the Long-Term Average Multifamily Starts have stayed below the long-term average for 14 consecutive quarters 1 Source: RealPage Market Analytics, October 2026 Quarterly Multifamily Starts in MAA Markets1 (% EXISTING UNITS) PEAK STARTS TTM Starts 2.0% This
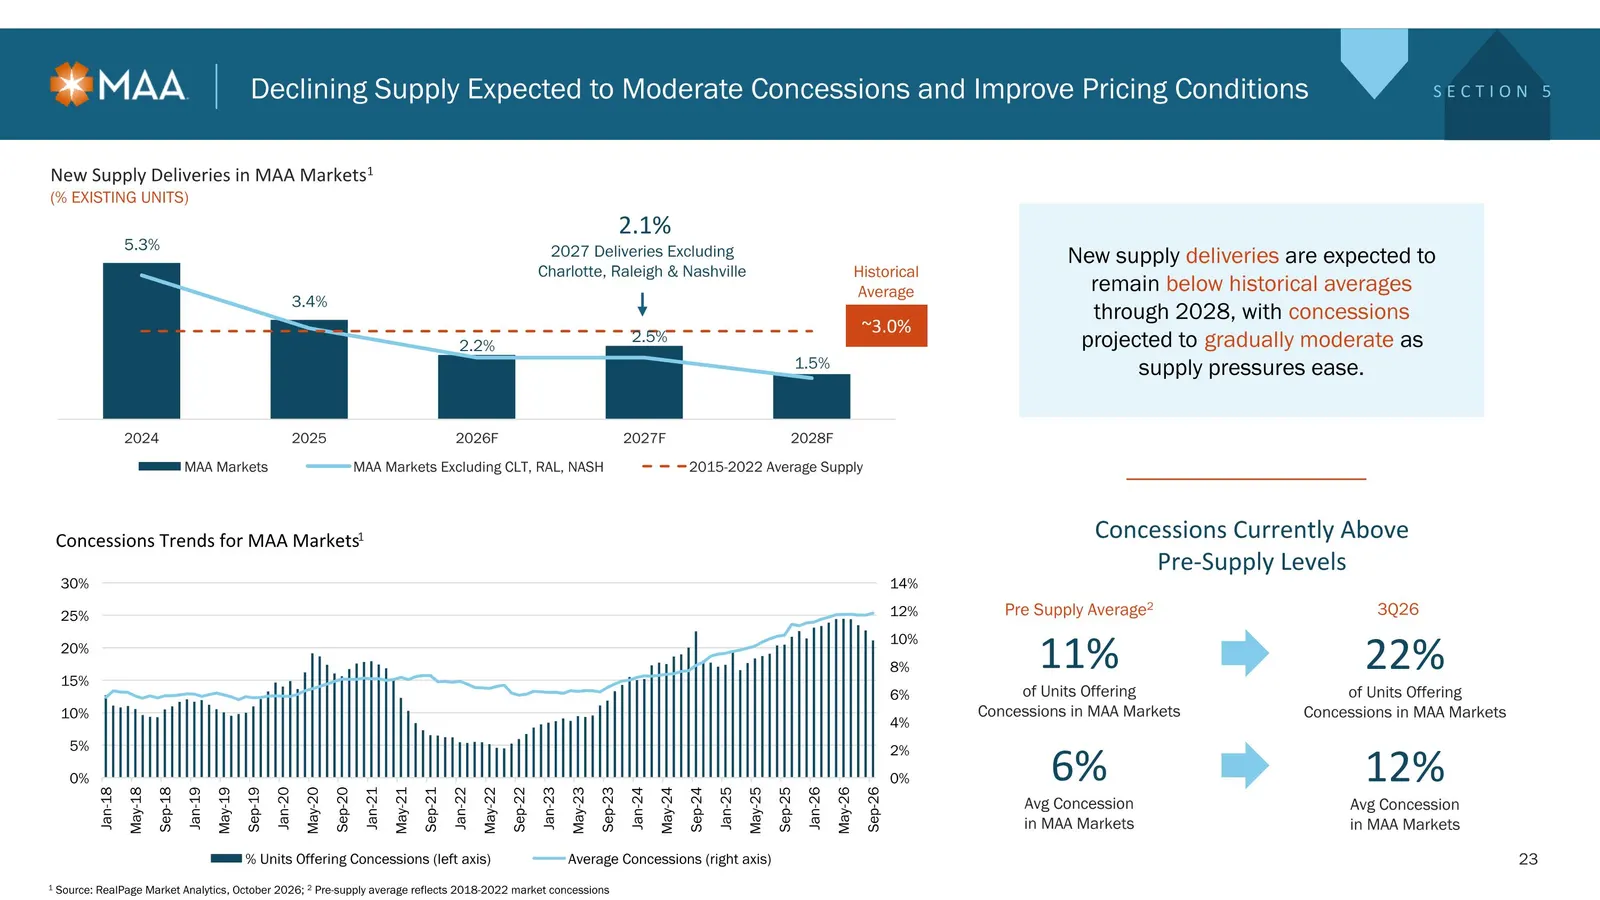
Slide 23: Declining Supply Expected to Moderate Concessions
~3.0% New Supply Deliveries in MAA Markets1 (% EXISTING UNITS) Declining Supply Expected to Moderate Concessions and Improve Pricing Conditions New supply deliveries are expected to remain below historical averages through 2028, with concessions projected to gradually moderate as supply pressures ea
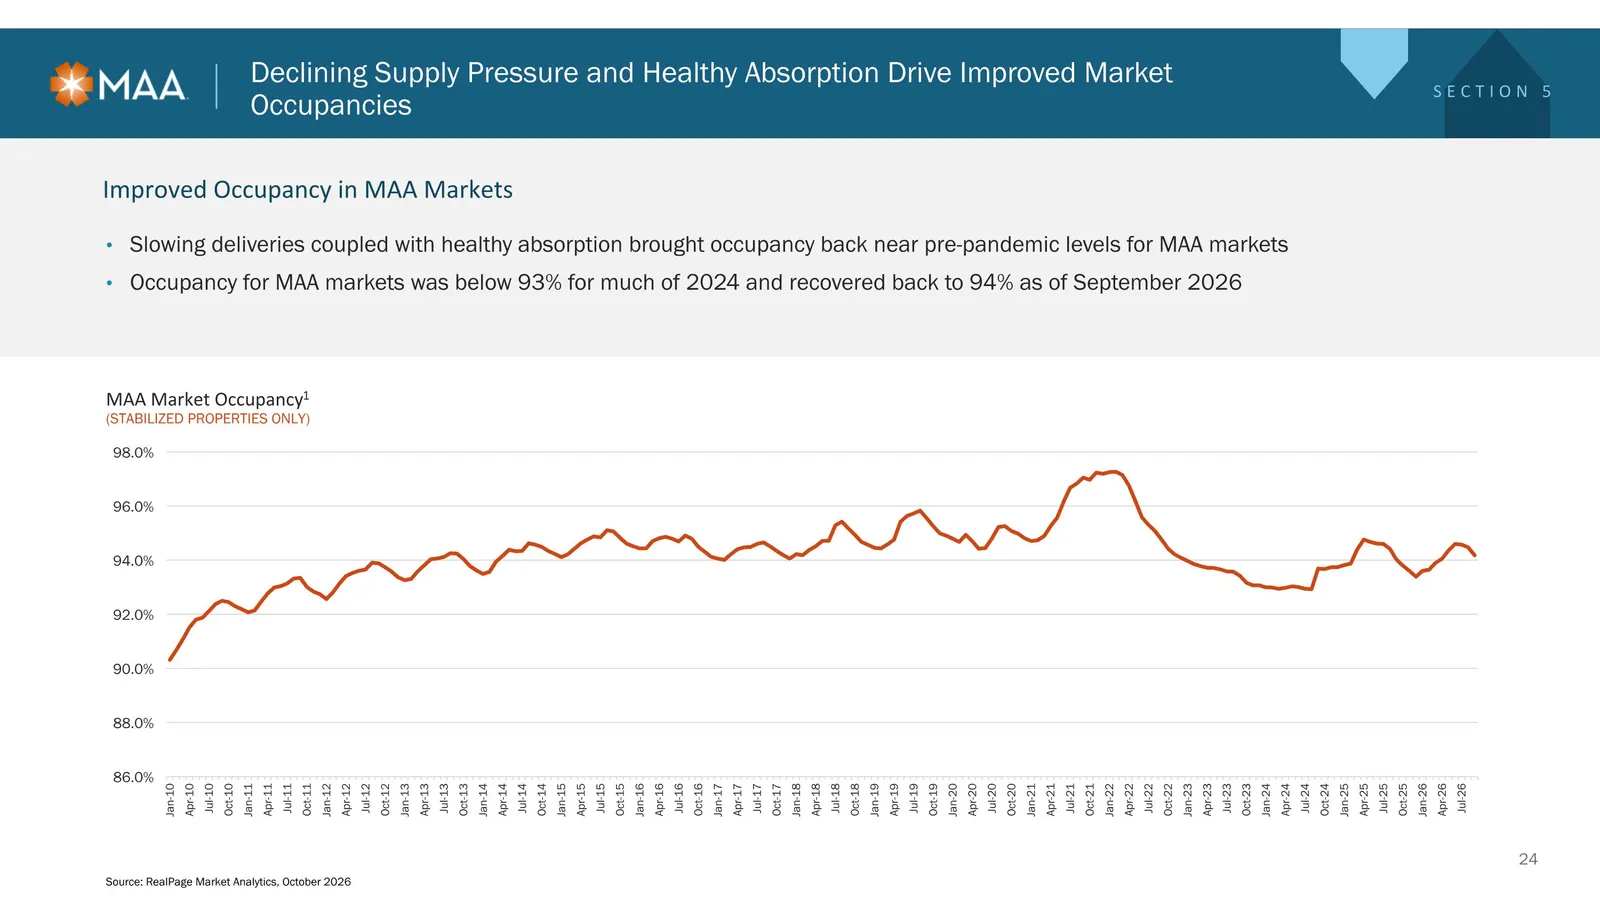
Slide 24: Declining Supply Pressure Drives Improved Market Occupancies
Declining Supply Pressure and Healthy Absorption Drive Improved Market Occupancies Improved Occupancy in MAA Markets Slowing deliveries coupled with healthy absorption brought occupancy back near pre-pandemic levels for MAA markets Occupancy for MAA markets was below 93% for much of 2024 and recover
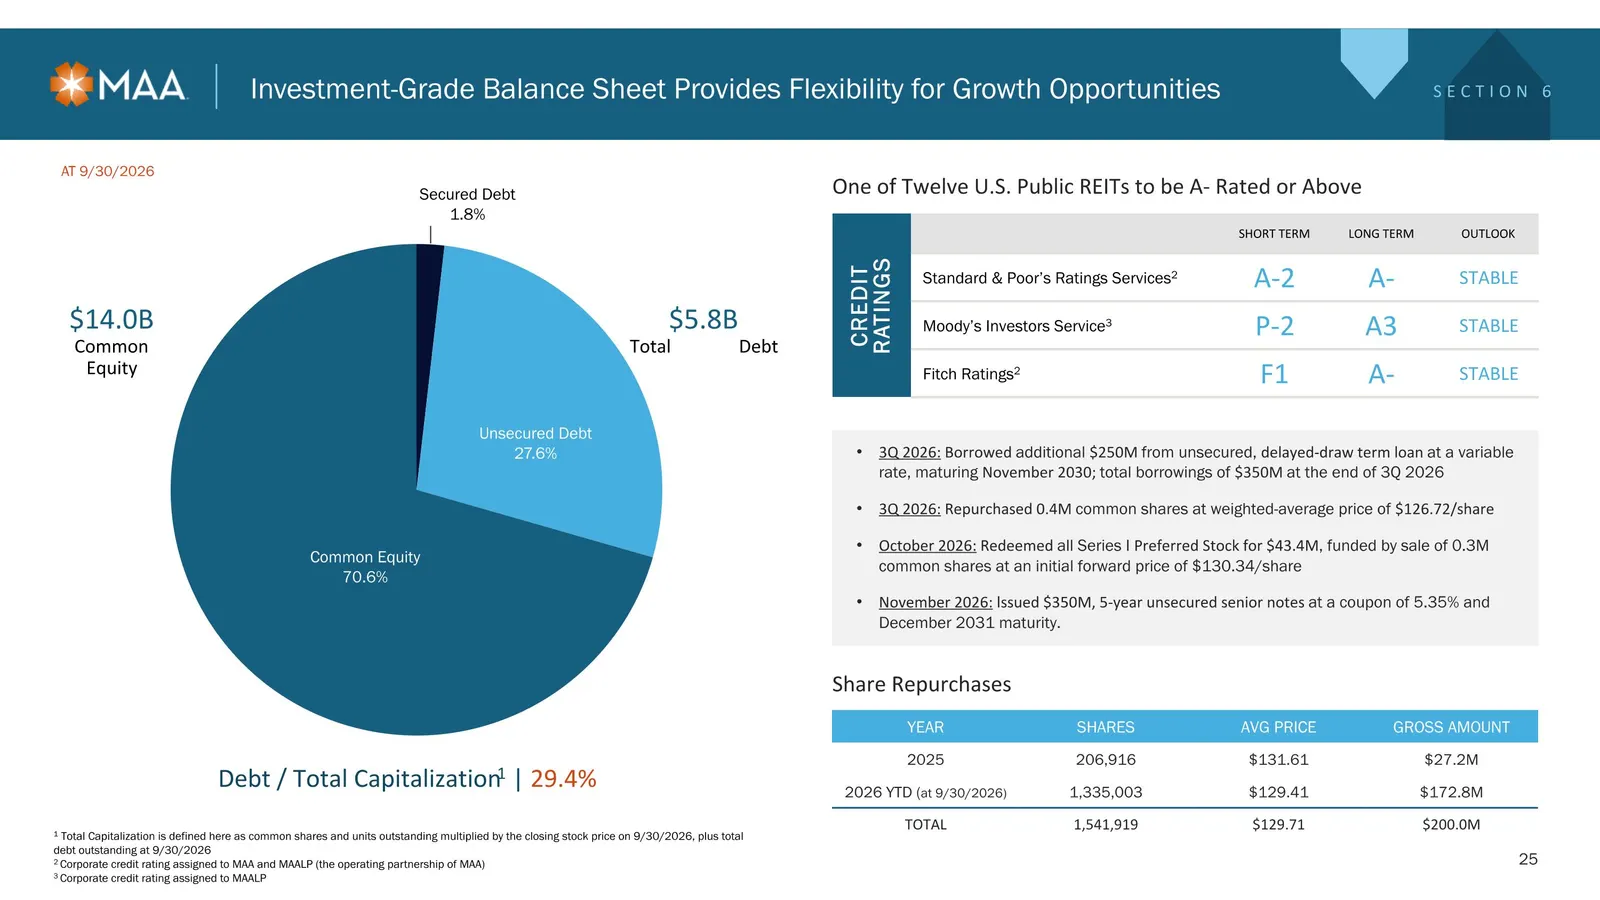
Slide 25: Investment-Grade Balance Sheet Provides Flexibility for Growth
3Q 2026: Borrowed additional $250M from unsecured, delayed-draw term loan at a variable rate, maturing November 2030; total borrowings of $350M at the end of 3Q 2026 3Q 2026: Repurchased 0.4M common shares at weighted-average price of $126.72/share October 2026: Redeemed all Series I Preferred Stock
Slide 26: Conservative Leverage and Well-Laddered Debt Maturities
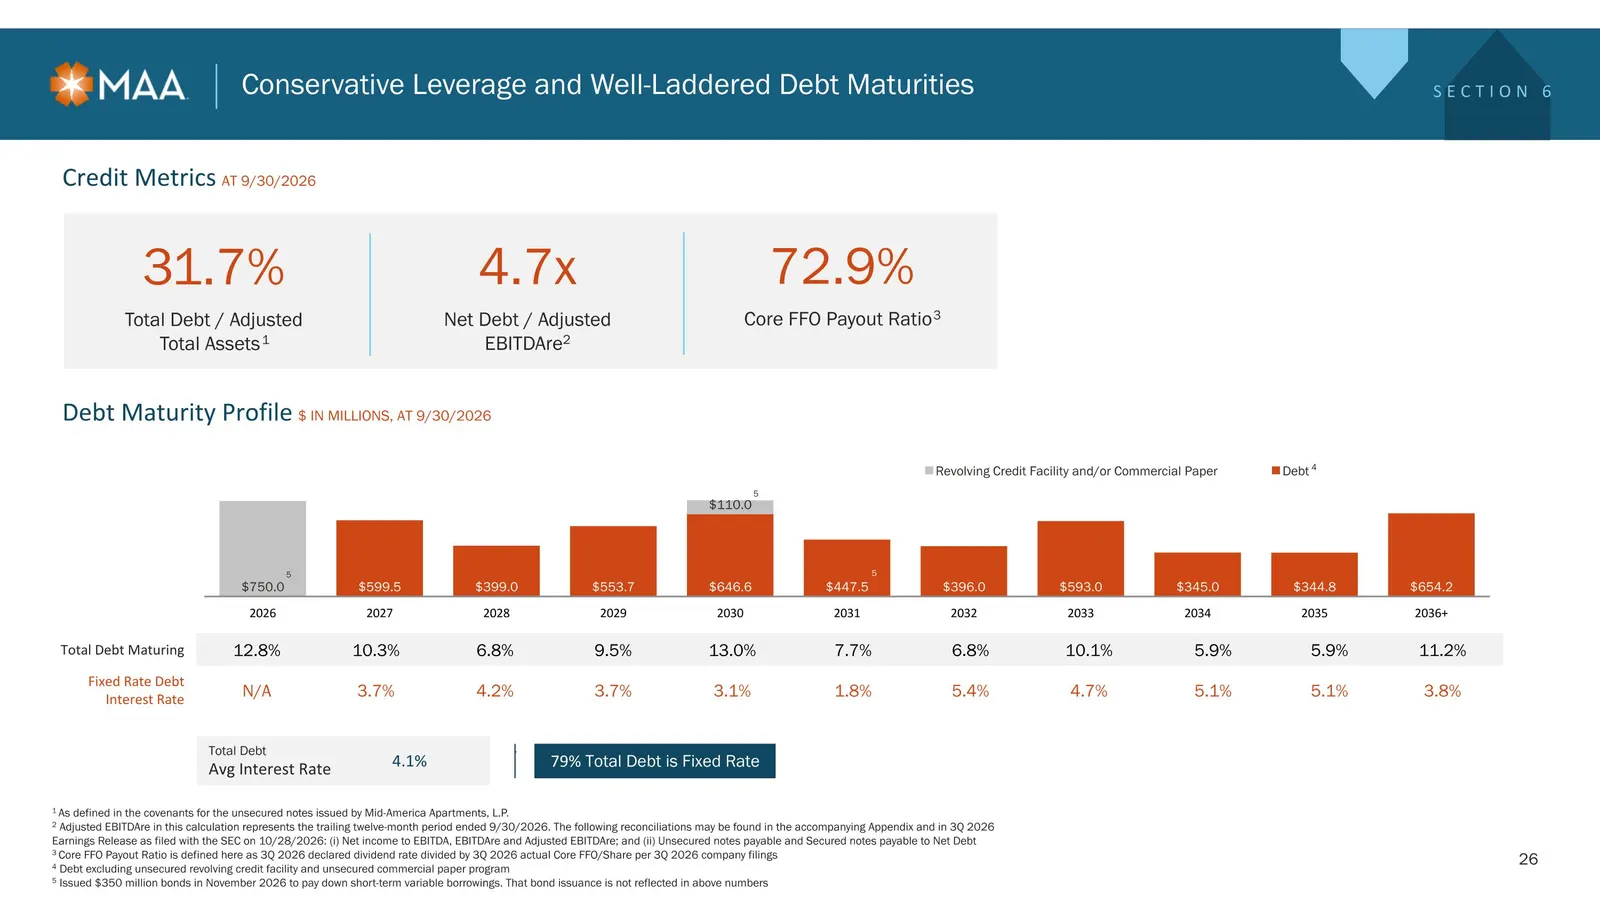
Conservative Leverage and Well-Laddered Debt Maturities Credit Metrics At 9/30/2026 1 As defined in the covenants for the unsecured notes issued by Mid-America Apartments, L.P. 2 Adjusted EBITDAre in this calculation represents the trailing twelve-month period ended 9/30/2026. The following reconcil
Slide 27: Advancing Sustainability Through Measurable Progress and Community Impact
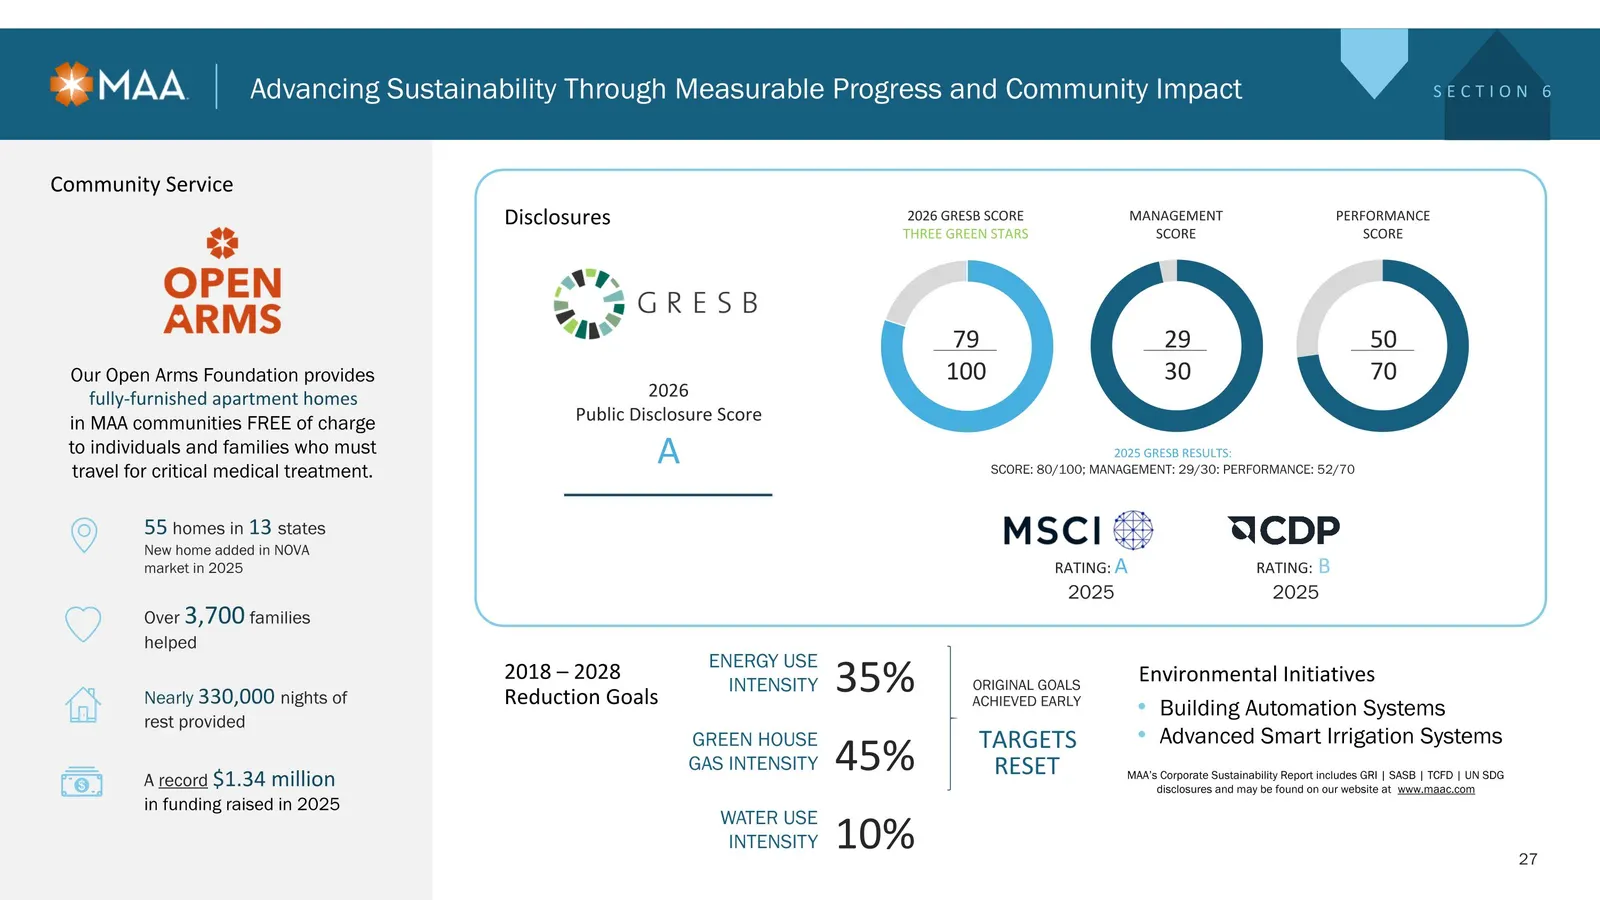
Original goals achieved early TARGETS RESET 35% ENERGY USE INTENSITY 45% GREEN HOUSE GAS INTENSITY 10% WATER USE INTENSITY Advancing Sustainability Through Measurable Progress and Community Impact 79 100 29 30 50 70 2026 GRESB SCORE THREE GREEN STARS MANAGEMENT SCORE PERFORMANCE SCORE 2025 GRESB RES
Slide 28: Sustained Year-Over-Year Blended Pricing Improvement
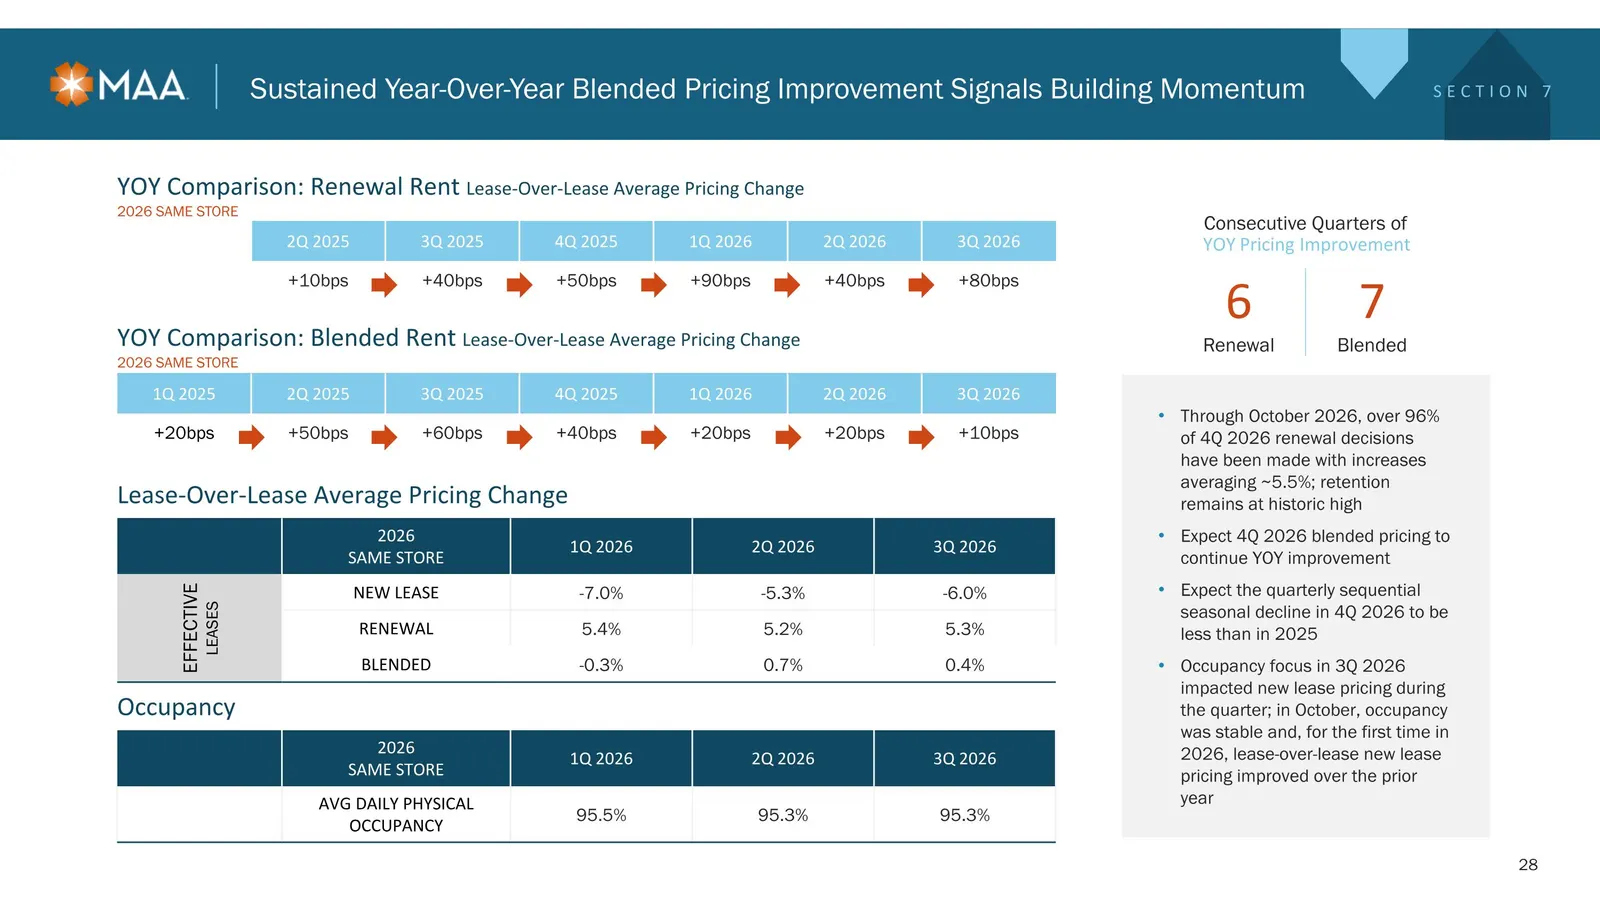
Sustained Year-Over-Year Blended Pricing Improvement Signals Building Momentum Lease-Over-Lease Average Pricing Change 2026 same store 1Q 2026 2Q 2026 3Q 2026 EFFECTIVE LEASES NEW LEASE -7.0% -5.3% -6.0% RENEWAL 5.4% 5.2% 5.3% BLENDED -0.3% 0.7% 0.4% Occupancy 2026 SAME STORE 1Q 2026 2Q 2026 3Q 2026
Slide 29: Early Signs of Recovery Emerging Across Key MAA Markets
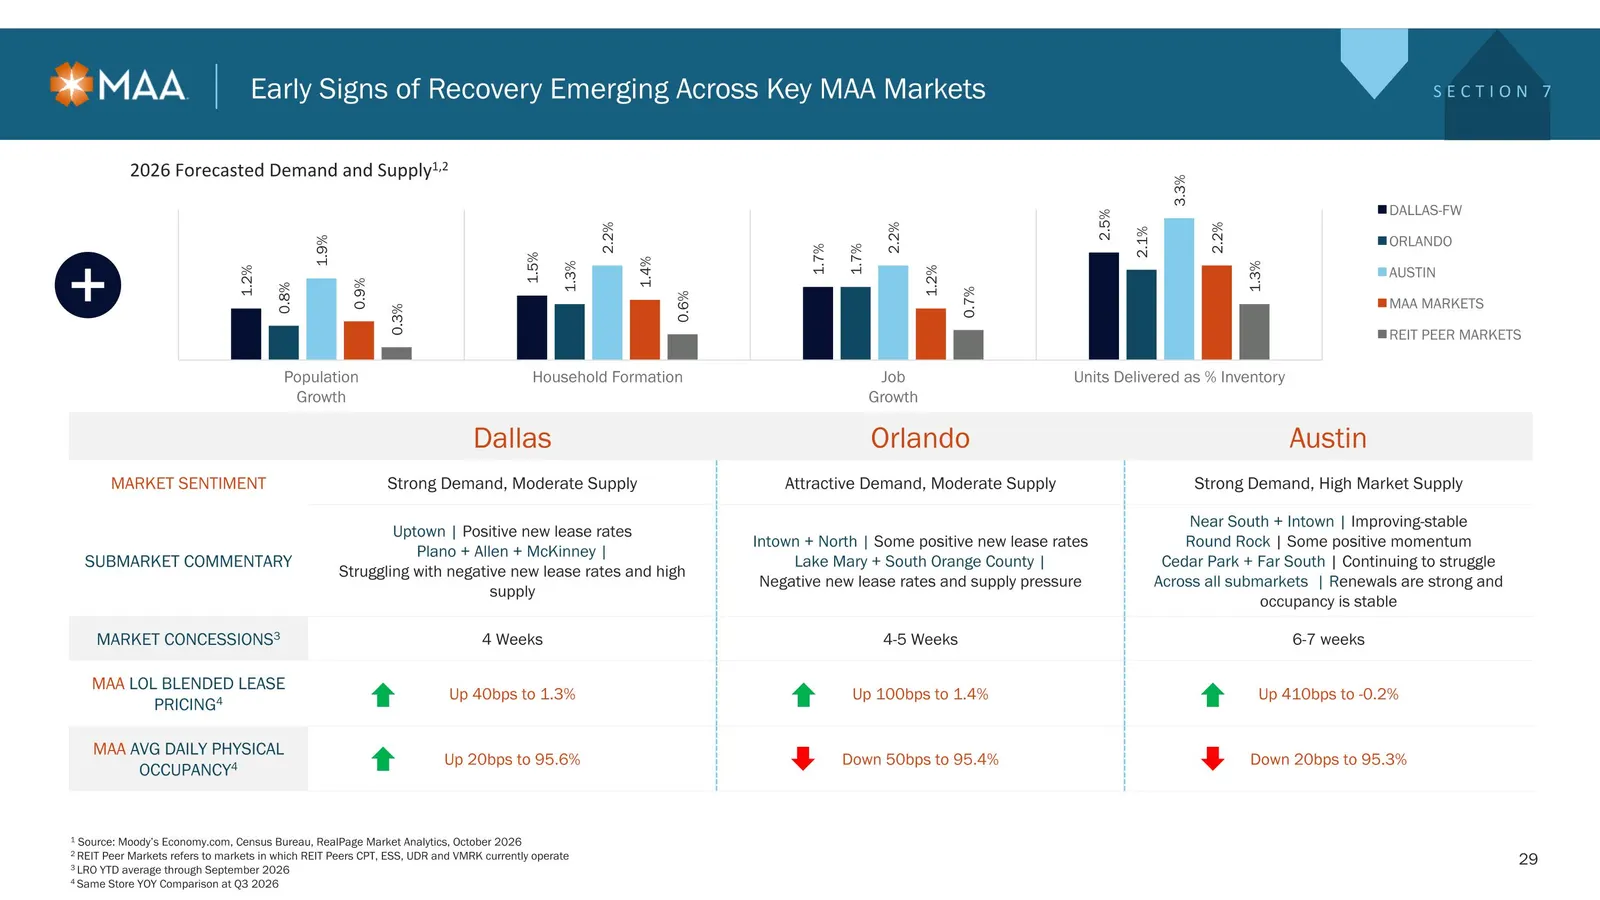
Dallas Orlando Austin MARKET SENTIMENT Strong Demand, Moderate Supply Attractive Demand, Moderate Supply Strong Demand, High Market Supply SUBMARKET COMMENTARY Uptown | Positive new lease rates Plano + Allen + McKinney | Struggling with negative new lease rates and high supply Intown + North | Some
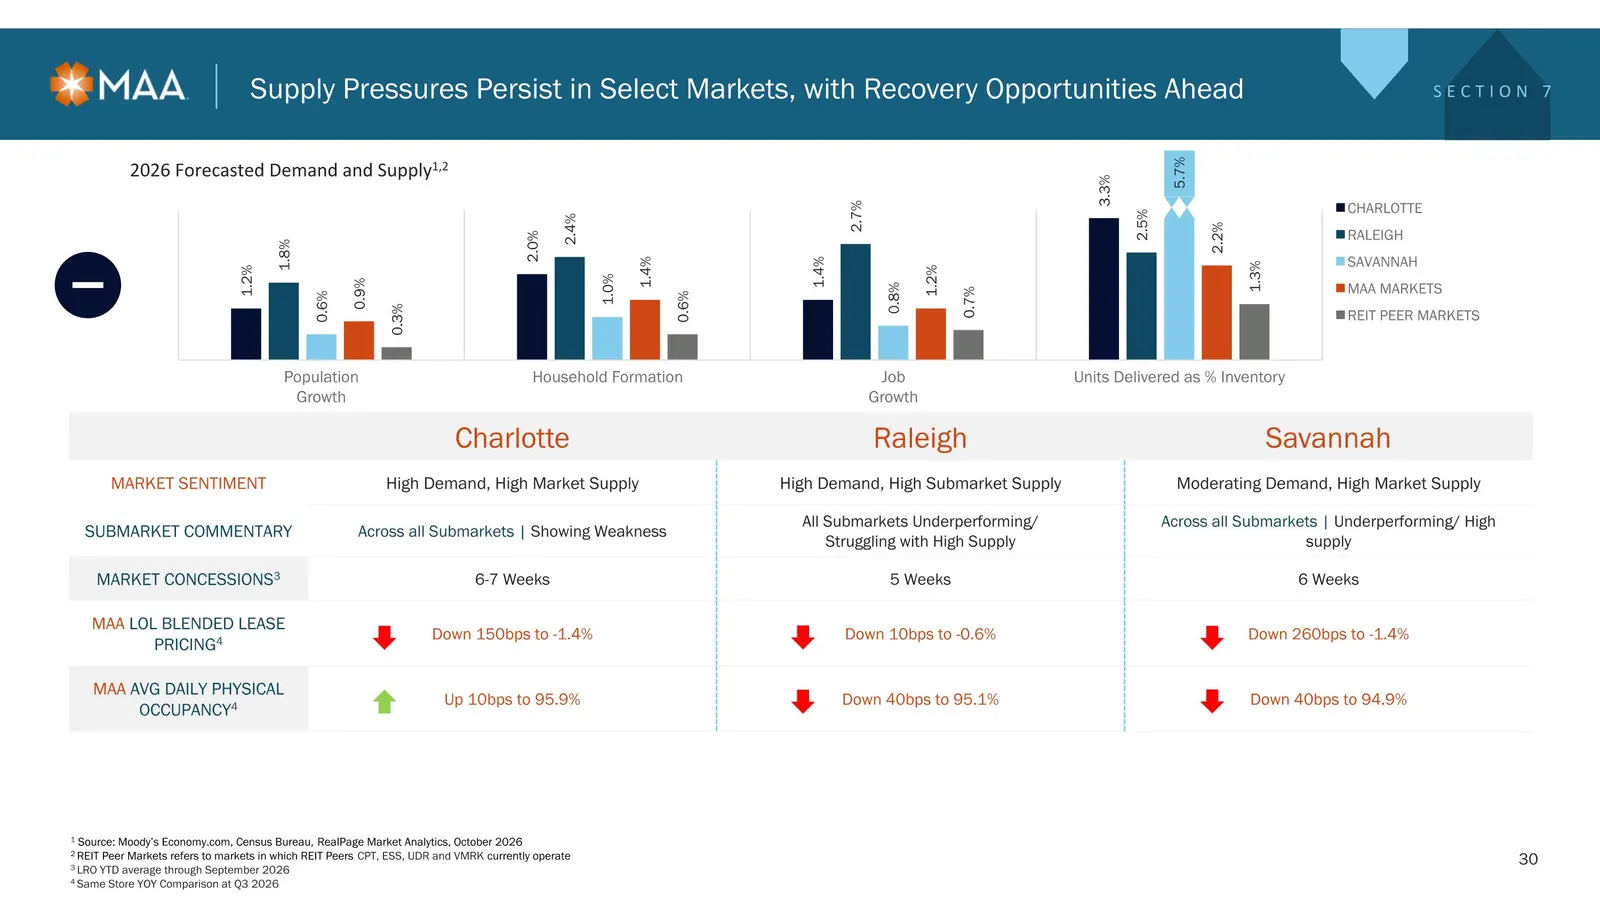
Slide 30: Supply Pressures Persist in Select Markets, with Recovery Ahead
Charlotte Raleigh Savannah MARKET SENTIMENT High Demand, High Market Supply High Demand, High Submarket Supply Moderating Demand, High Market Supply SUBMARKET COMMENTARY Across all Submarkets | Showing Weakness All Submarkets Underperforming/ Struggling with High Supply Across all Submarkets | Under
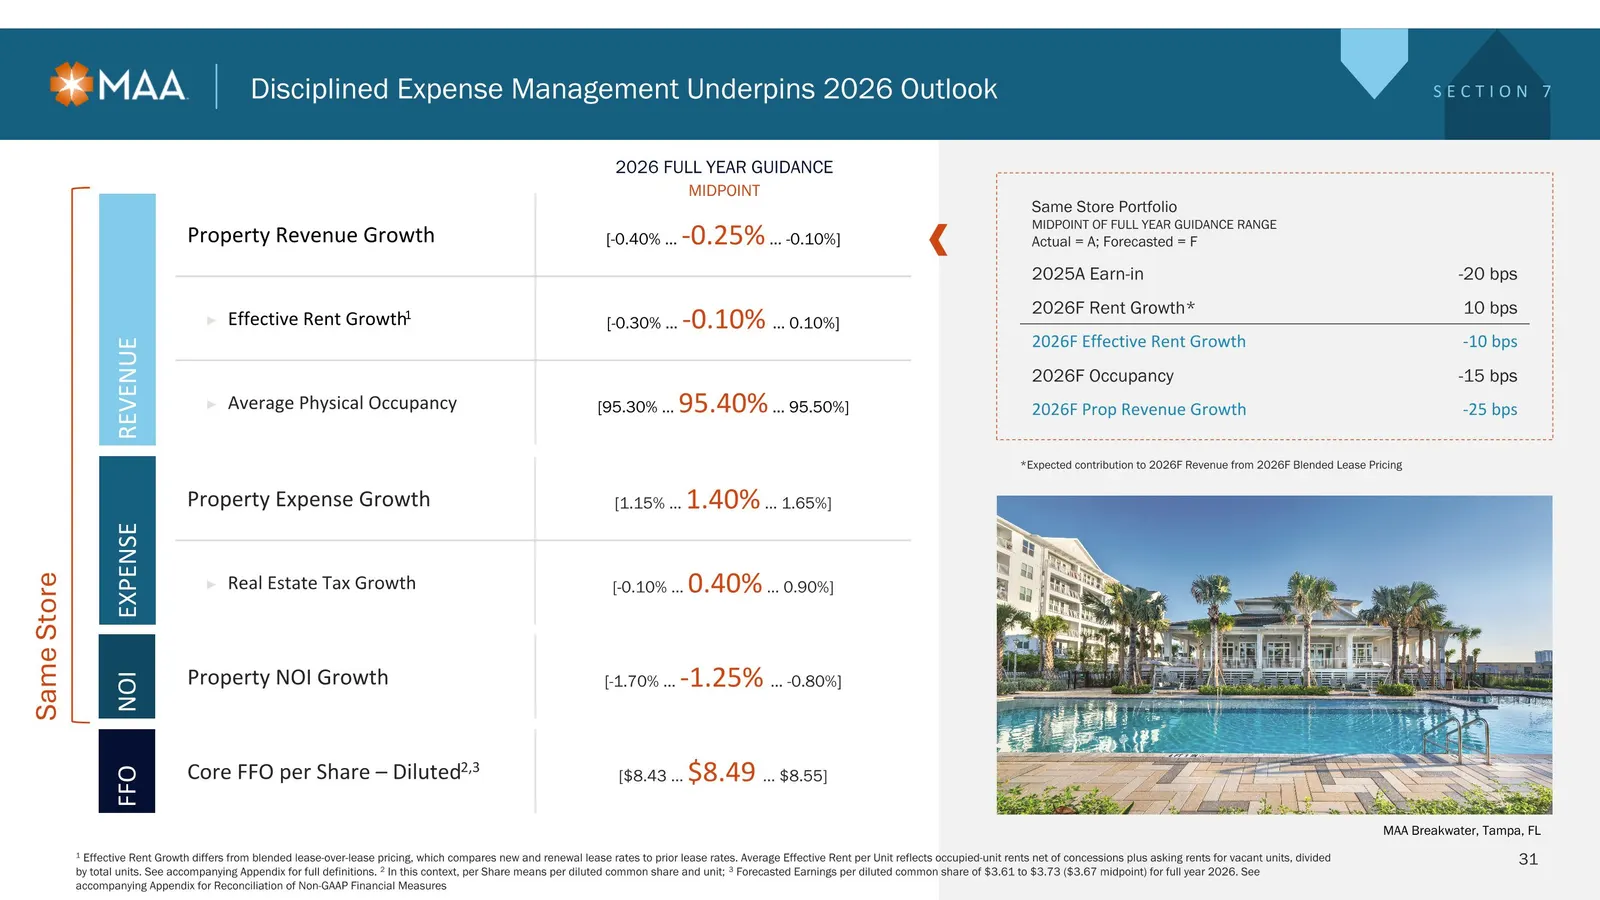
Slide 31: Disciplined Expense Management Underpins 2026 Outlook
Disciplined Expense Management Underpins 2026 Outlook Property Revenue Growth [-0.40% … -0.25% … -0.10%] Effective Rent Growth1 [-0.30% … -0.10% … 0.10%] Average Physical Occupancy [95.30% … 95.40% … 95.50%] REVENUE Property Expense Growth [1.15% … 1.40% … 1.65%] Real Estate Tax Growth [-0.10% … 0.4
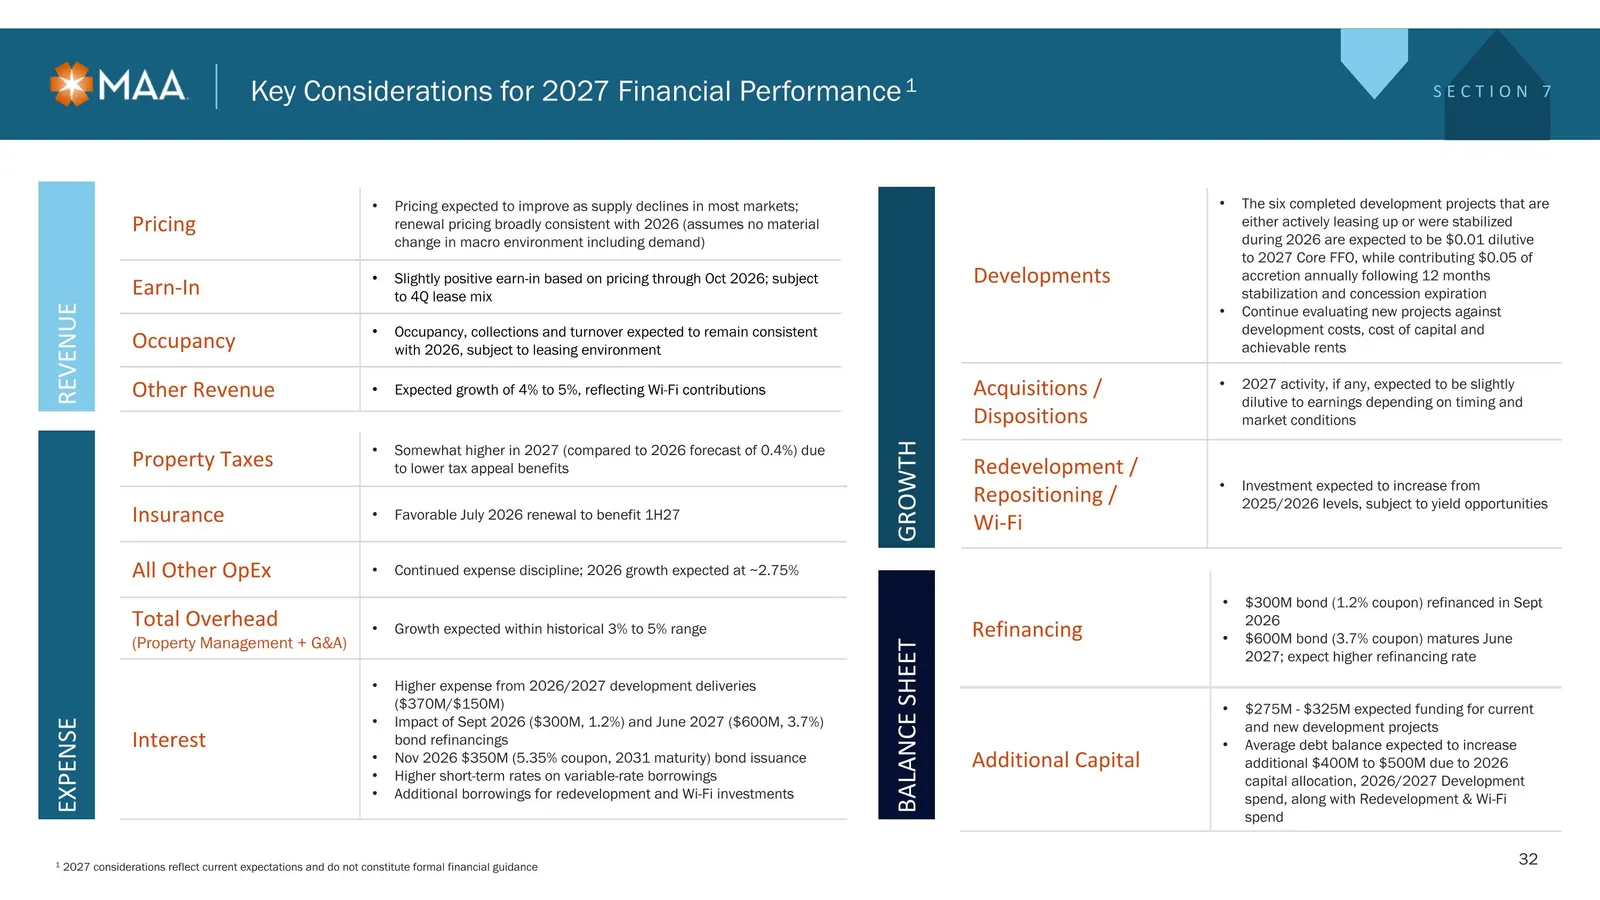
Slide 32: Key Considerations for 2027 Financial Performance
Key Considerations for 2027 Financial Performance1 Pricing Pricing expected to improve as supply declines in most markets; renewal pricing broadly consistent with 2026 (assumes no material change in macro environment including demand) Earn-In Slightly positive earn-in based on pricing through Oct 20

Slide 33: Appendix: Reconciliations & Definitions
SECTION 8: APPENDIX Reconciliations & Definitions
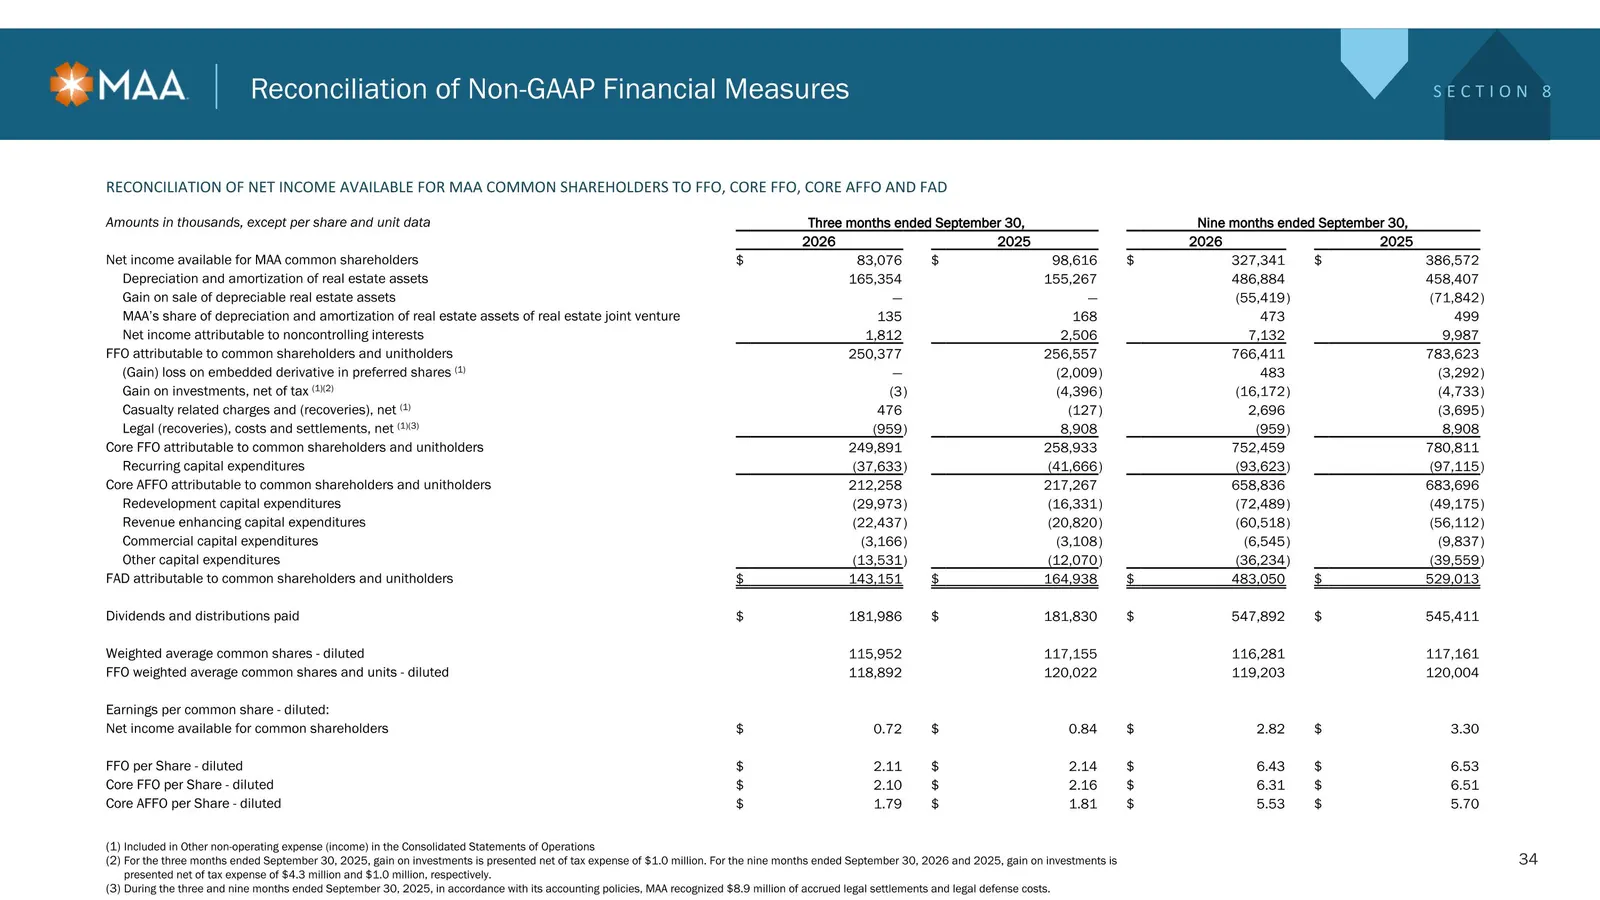
Slide 34: Reconciliation of Net Income to FFO, Core FFO, Core AFFO and FAD
Reconciliation of Non-GAAP Financial Measures RECONCILIATION OF NET INCOME AVAILABLE FOR MAA COMMON SHAREHOLDERS TO FFO, CORE FFO, CORE AFFO AND FAD Amounts in thousands, except per share and unit data Three months ended September 30, Nine months ended September 30, 2026 2025 2026 2025 Net income av
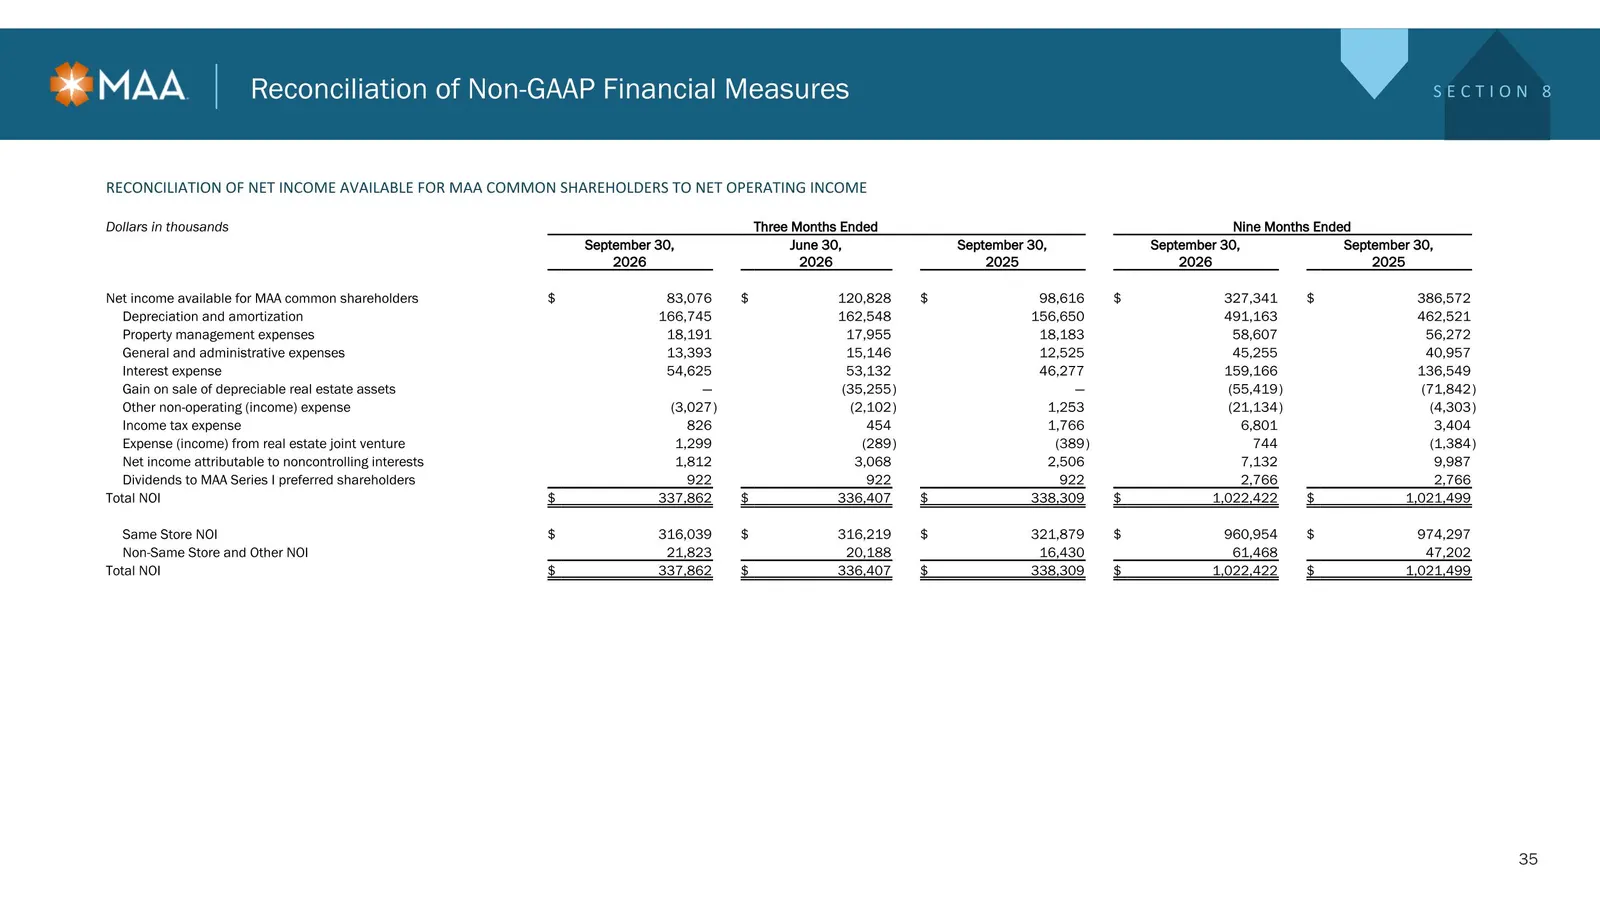
Slide 35: Reconciliation of Net Income to Net Operating Income
Reconciliation of Non-GAAP Financial Measures RECONCILIATION OF NET INCOME AVAILABLE FOR MAA COMMON SHAREHOLDERS TO NET OPERATING INCOME Dollars in thousands Three Months Ended Nine Months Ended September 30, 2026 June 30, 2026 September 30, 2025 September 30, 2026 September 30, 2025 Net income avai
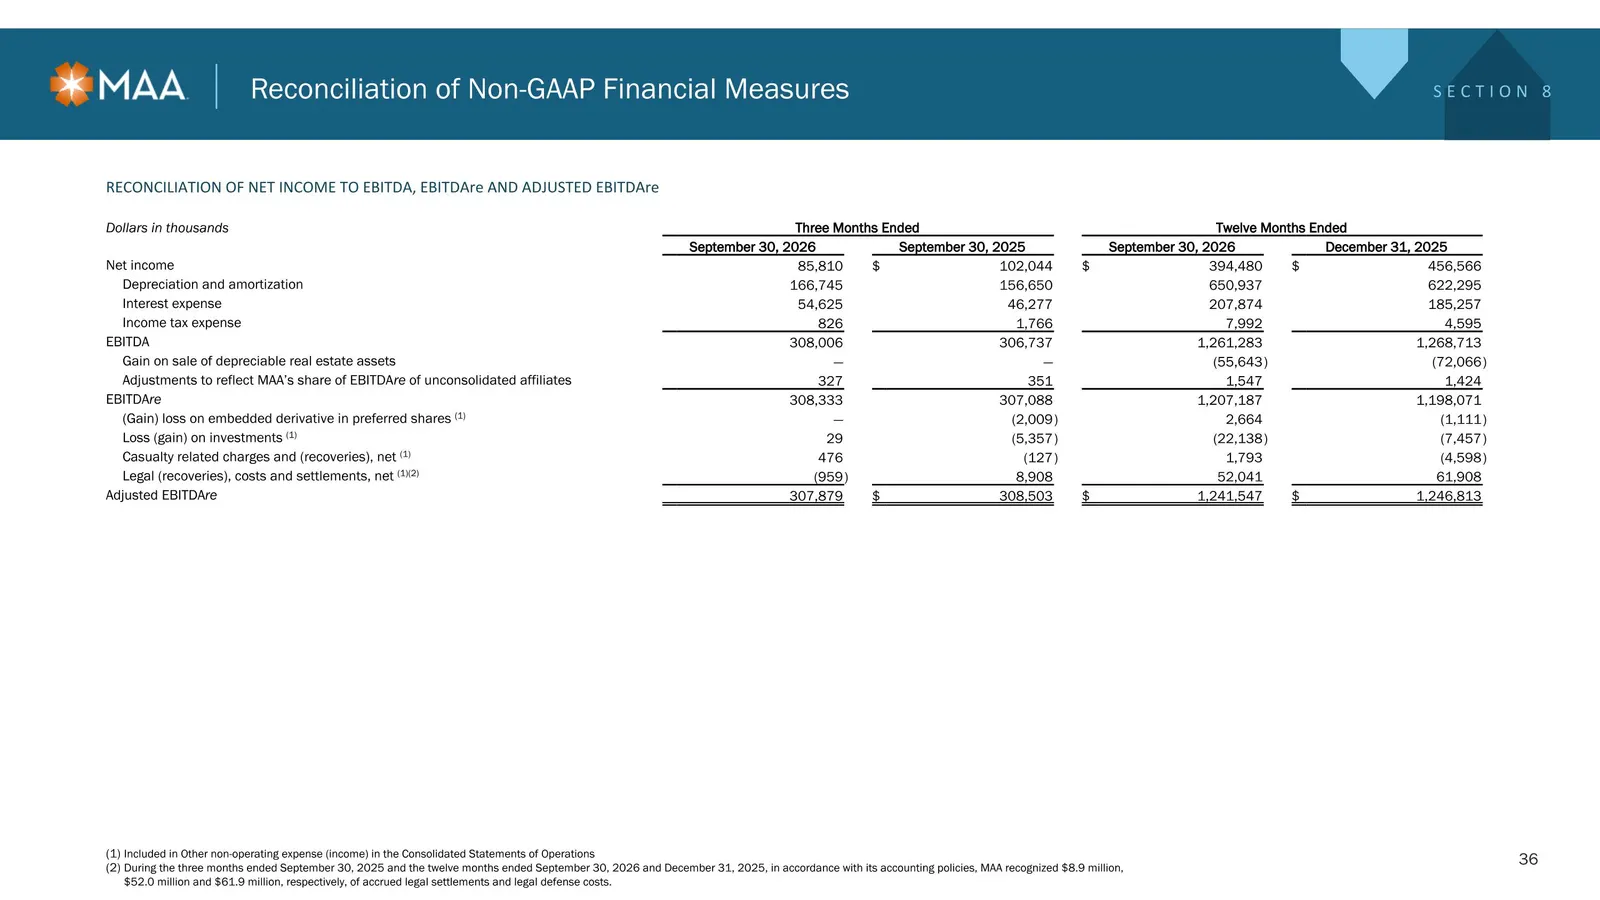
Slide 36: Reconciliation of Net Income to EBITDA, EBITDAre and Adjusted EBITDAre
Reconciliation of Non-GAAP Financial Measures RECONCILIATION OF NET INCOME TO EBITDA, EBITDAre AND ADJUSTED EBITDAre Included in Other non-operating expense (income) in the Consolidated Statements of Operations During the three months ended September 30, 2025 and the twelve months ended September 30
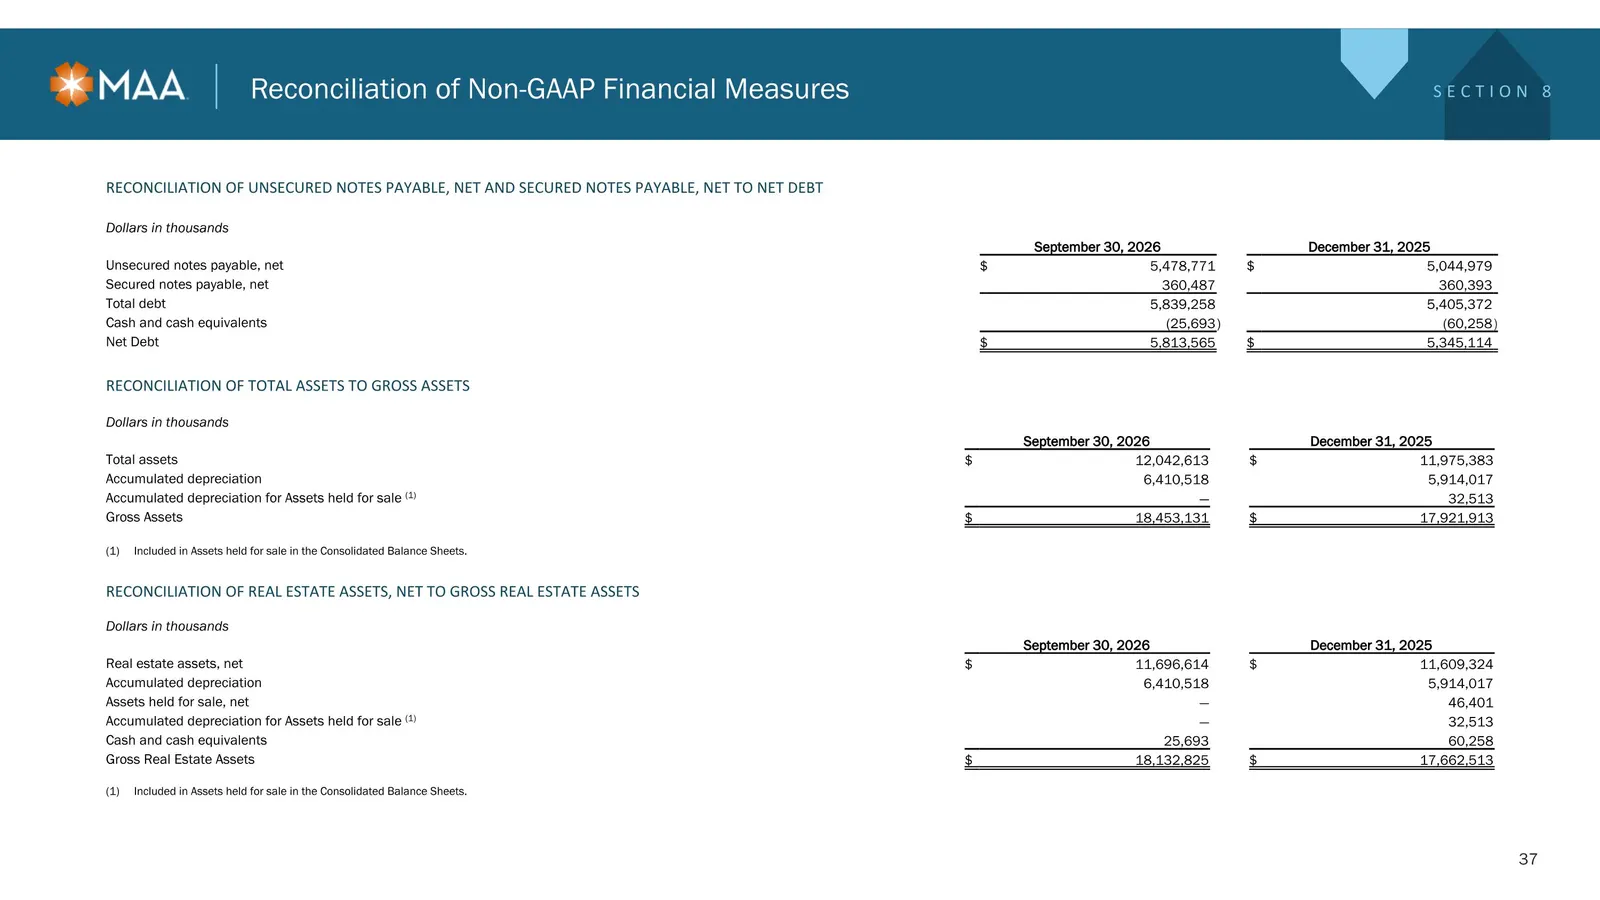
Slide 37: Reconciliation of Notes Payable to Net Debt and Gross Assets
Reconciliation of Non-GAAP Financial Measures RECONCILIATION OF UNSECURED NOTES PAYABLE, NET AND SECURED NOTES PAYABLE, NET TO NET DEBT RECONCILIATION OF TOTAL ASSETS TO GROSS ASSETS RECONCILIATION OF REAL ESTATE ASSETS, NET TO GROSS REAL ESTATE ASSETS (1) Included in Assets held for sale in the Con
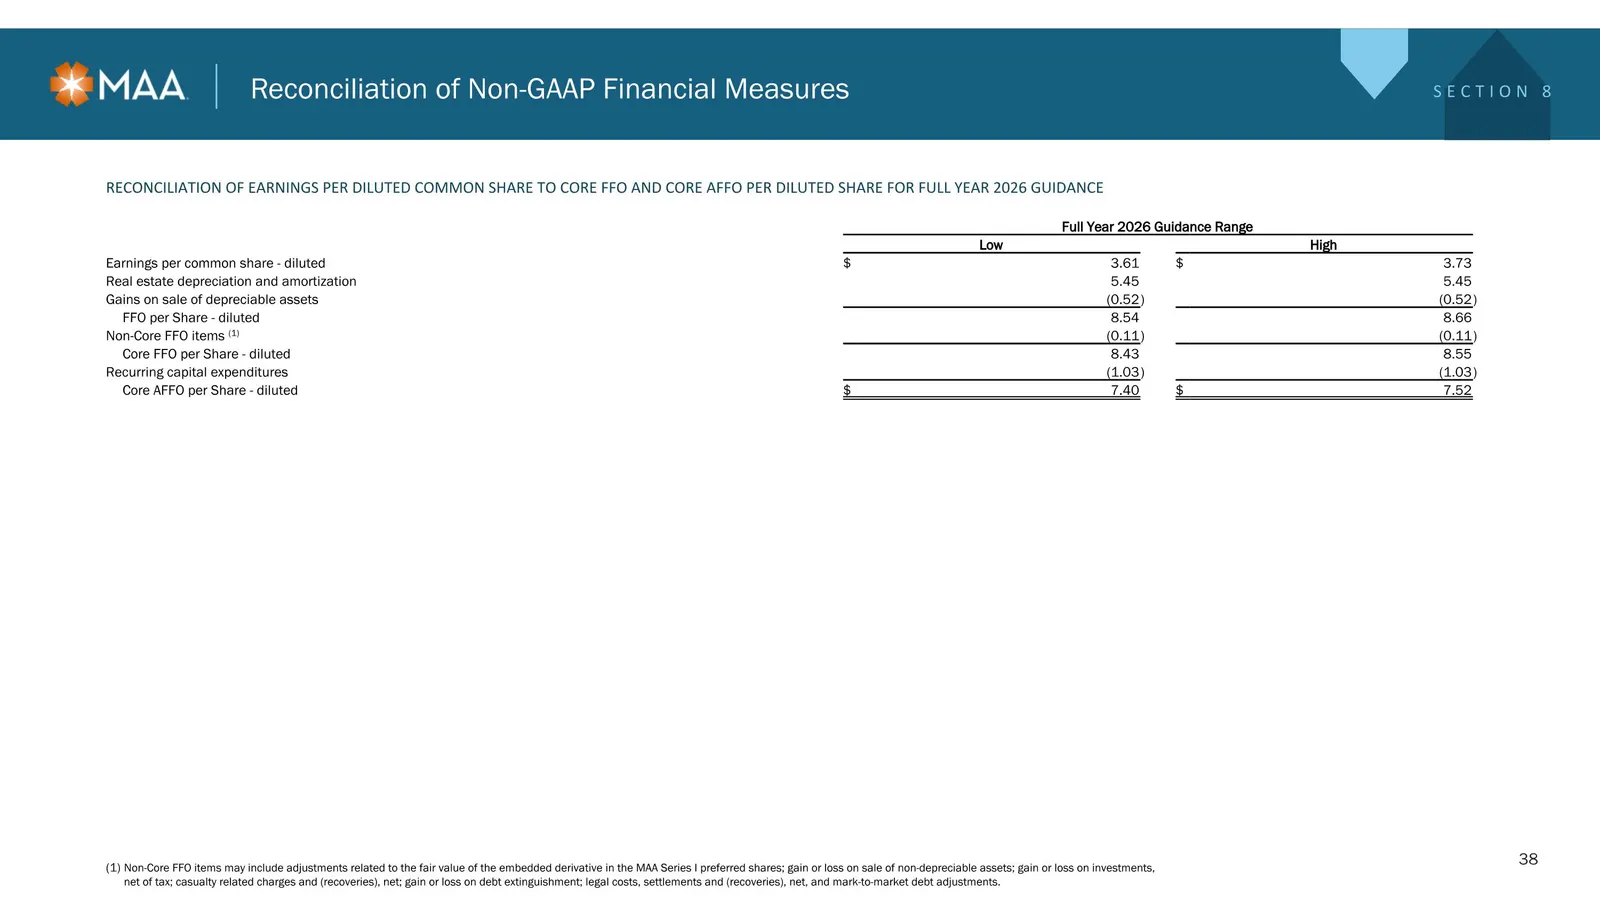
Slide 38: Reconciliation of EPS to Core FFO per Share for 2026 Guidance
Reconciliation of Non-GAAP Financial Measures RECONCILIATION OF EARNINGS PER DILUTED COMMON SHARE TO CORE FFO AND CORE AFFO PER DILUTED SHARE FOR FULL YEAR 2026 GUIDANCE Non-Core FFO items may include adjustments related to the fair value of the embedded derivative in the MAA Series I preferred shar
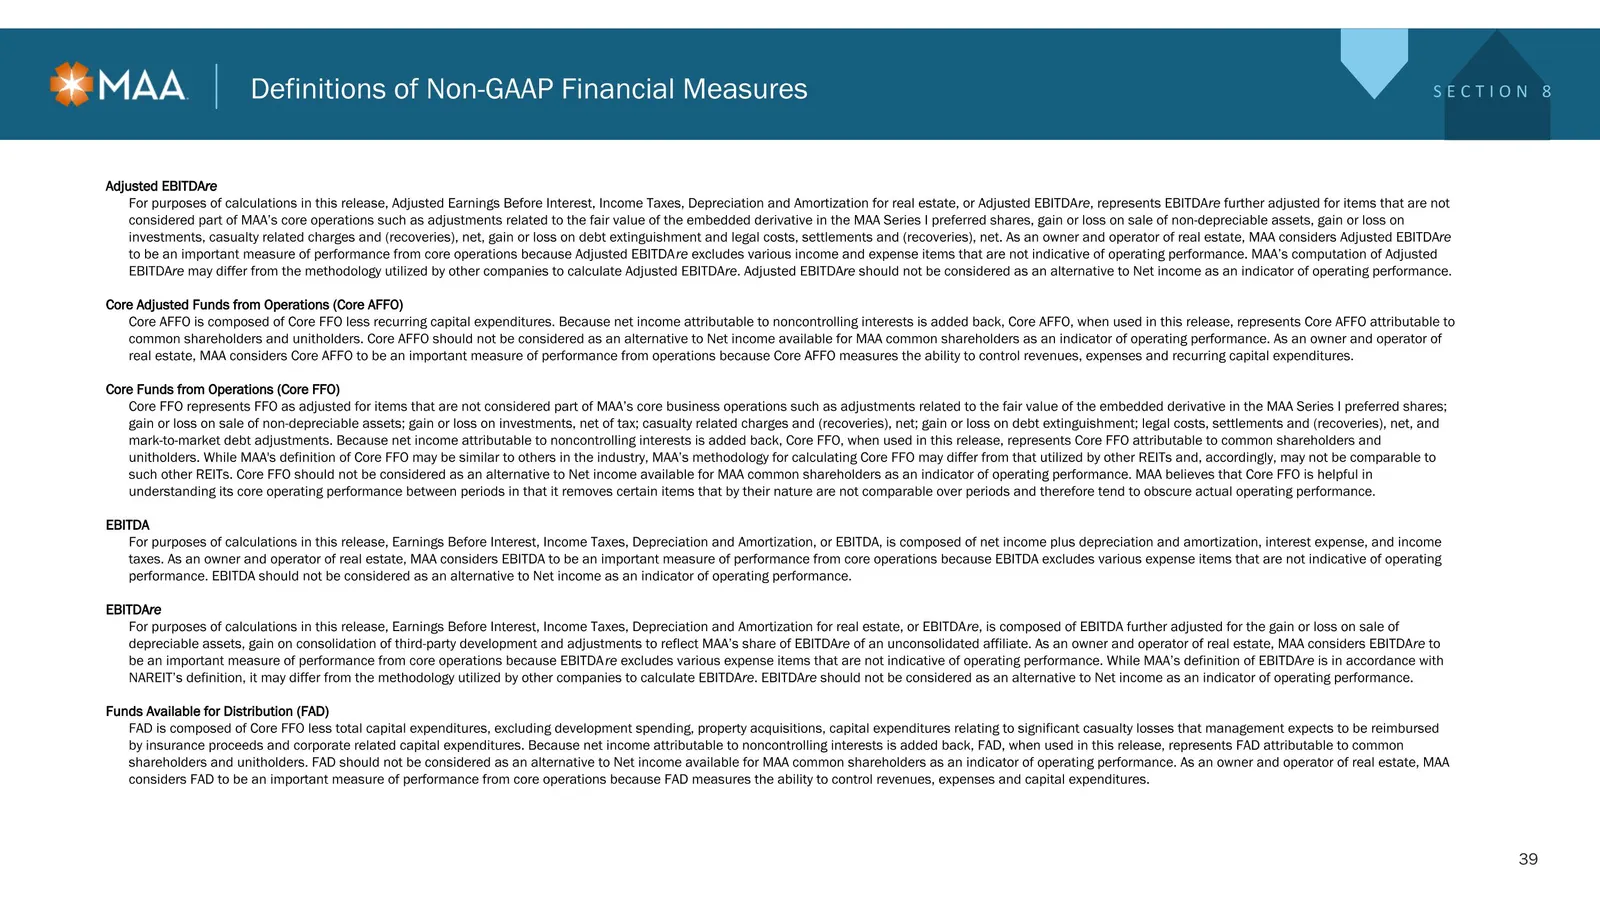
Slide 39: Definitions of Non-GAAP Financial Measures: Adjusted EBITDAre
Definitions of Non-GAAP Financial Measures Adjusted EBITDAre For purposes of calculations in this release, Adjusted Earnings Before Interest, Income Taxes, Depreciation and Amortization for real estate, or Adjusted EBITDAre, represents EBITDAre further adjusted for items that are not considered part
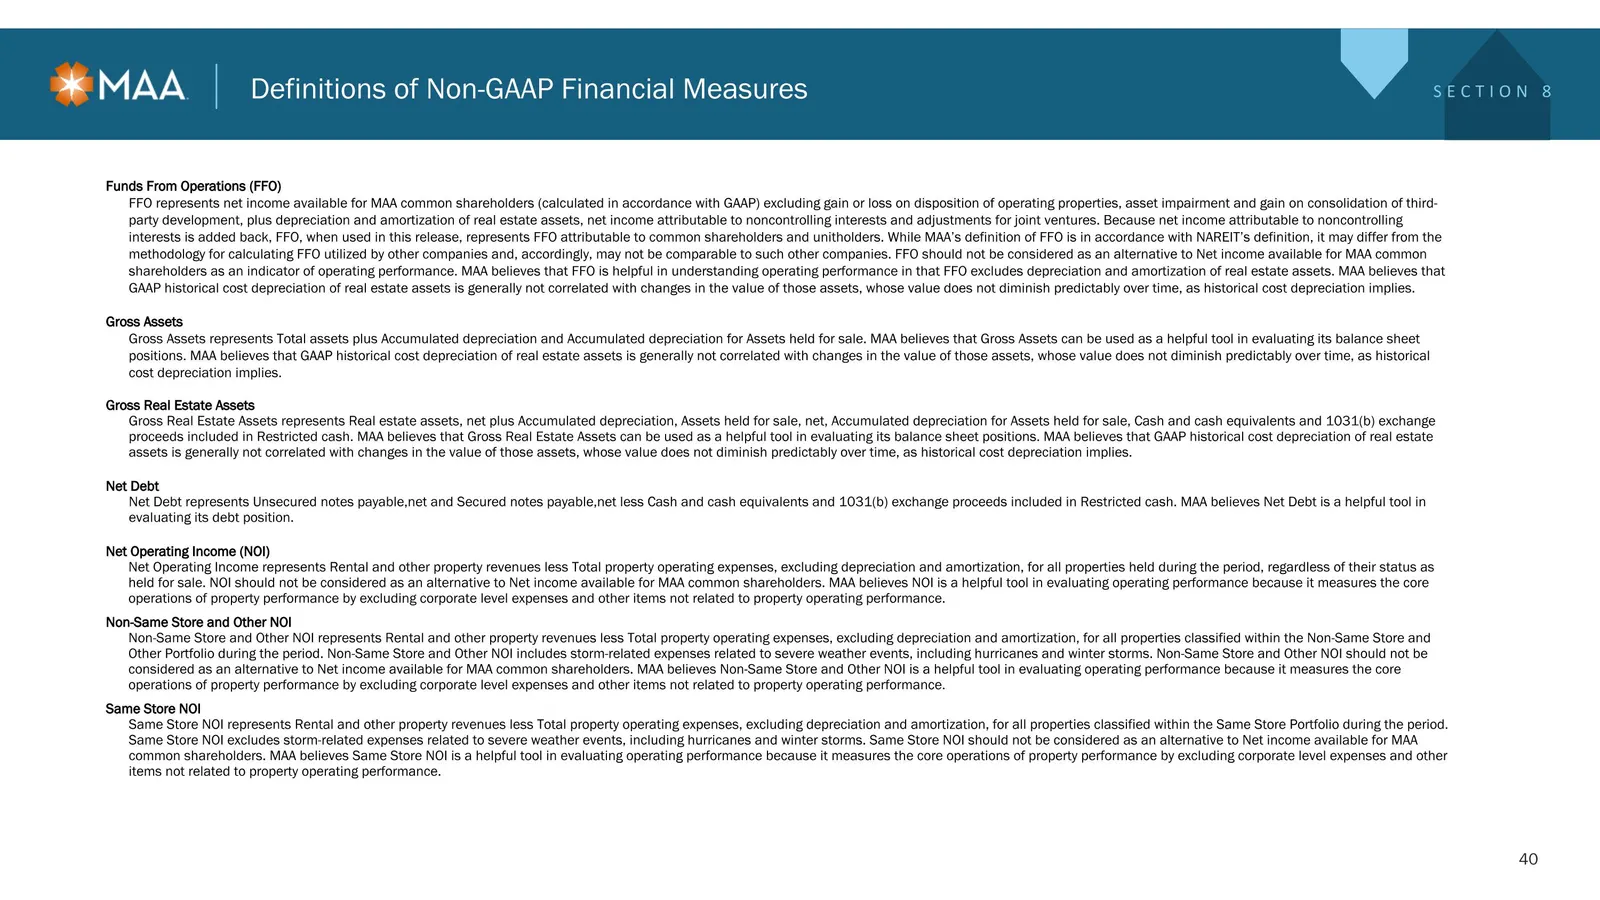
Slide 40: Definitions of Non-GAAP Financial Measures: FFO
Definitions of Non-GAAP Financial Measures Funds From Operations (FFO) FFO represents net income available for MAA common shareholders (calculated in accordance with GAAP) excluding gain or loss on disposition of operating properties, asset impairment and gain on consolidation of third-party develop
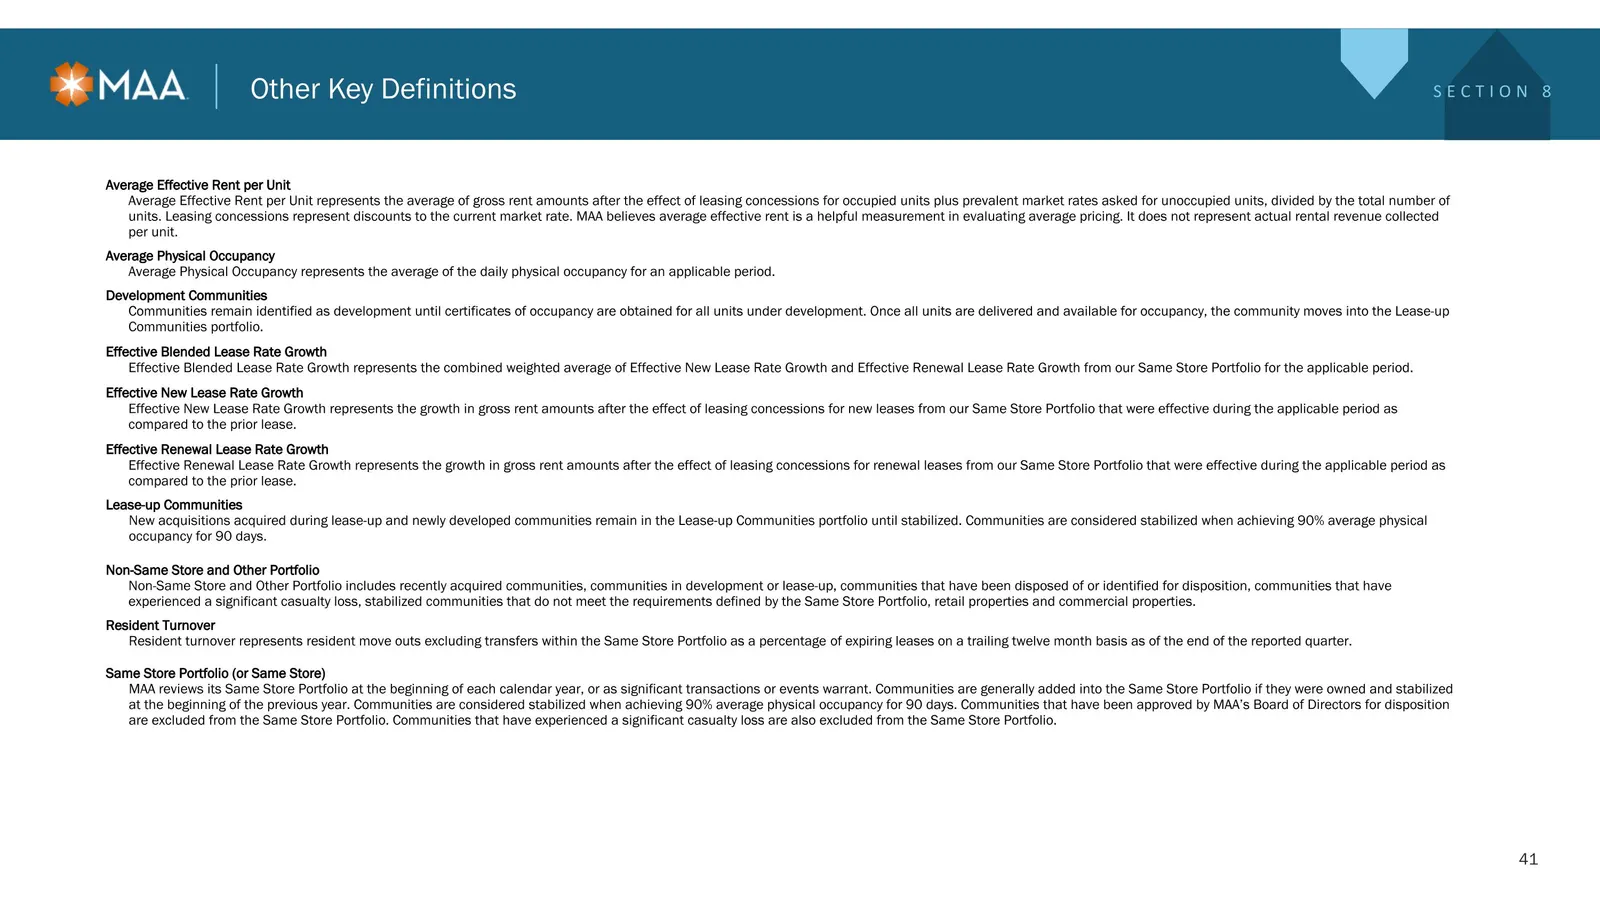
Slide 41: Other Key Definitions
Other Key Definitions Average Effective Rent per Unit Average Effective Rent per Unit represents the average of gross rent amounts after the effect of leasing concessions for occupied units plus prevalent market rates asked for unoccupied units, divided by the total number of units. Leasing concessi
Source: SEC EDGAR · 8-K filed Nov 16, 2026
More decks from Mid-America Apartment Communities, Inc.
 Investor Presentation (September 2026)50 slides · Sep 9, 2026
 Investor Presentation (September 2026)50 slides · September 2026
 Investor Presentation (August 2026)49 slides · Aug 4, 2026
 Debt Investor Presentation (August 2026)12 slides · August 2026
 Nareit REITweek: 2026 Investor Conference48 slides · Jun 1, 2026
 Investor Presentation (May 2026)45 slides · May 4, 2026