Vectren — Non-Deal Roadshow (February 2012)
32 slides from Vectren's roadshow presentation, Feb 21, 2012
Slide 1: Presentation to the Financial Community
Exhbit 99.1 Presentation to the Financial Community New York & Boston February 21-22, 2012 Carl Chapman - Chairman, President and CEO Jerry Benkert - Executive Vice President and CFO Robert Goocher - Treasurer and VP - Investor Relations Aaron Musgrave - Manager - Investor Relations
Slide 2: Forward-Looking Statements
Forward-Looking Statements All statements other than statements of historical fact are forward-looking statements made in good faith by the company and are intended to qualify for the safe harbor from liability established by the Private Securities Litigation Reform Act of 1995. Such statements are
Slide 3: Vectren Corporation Overview
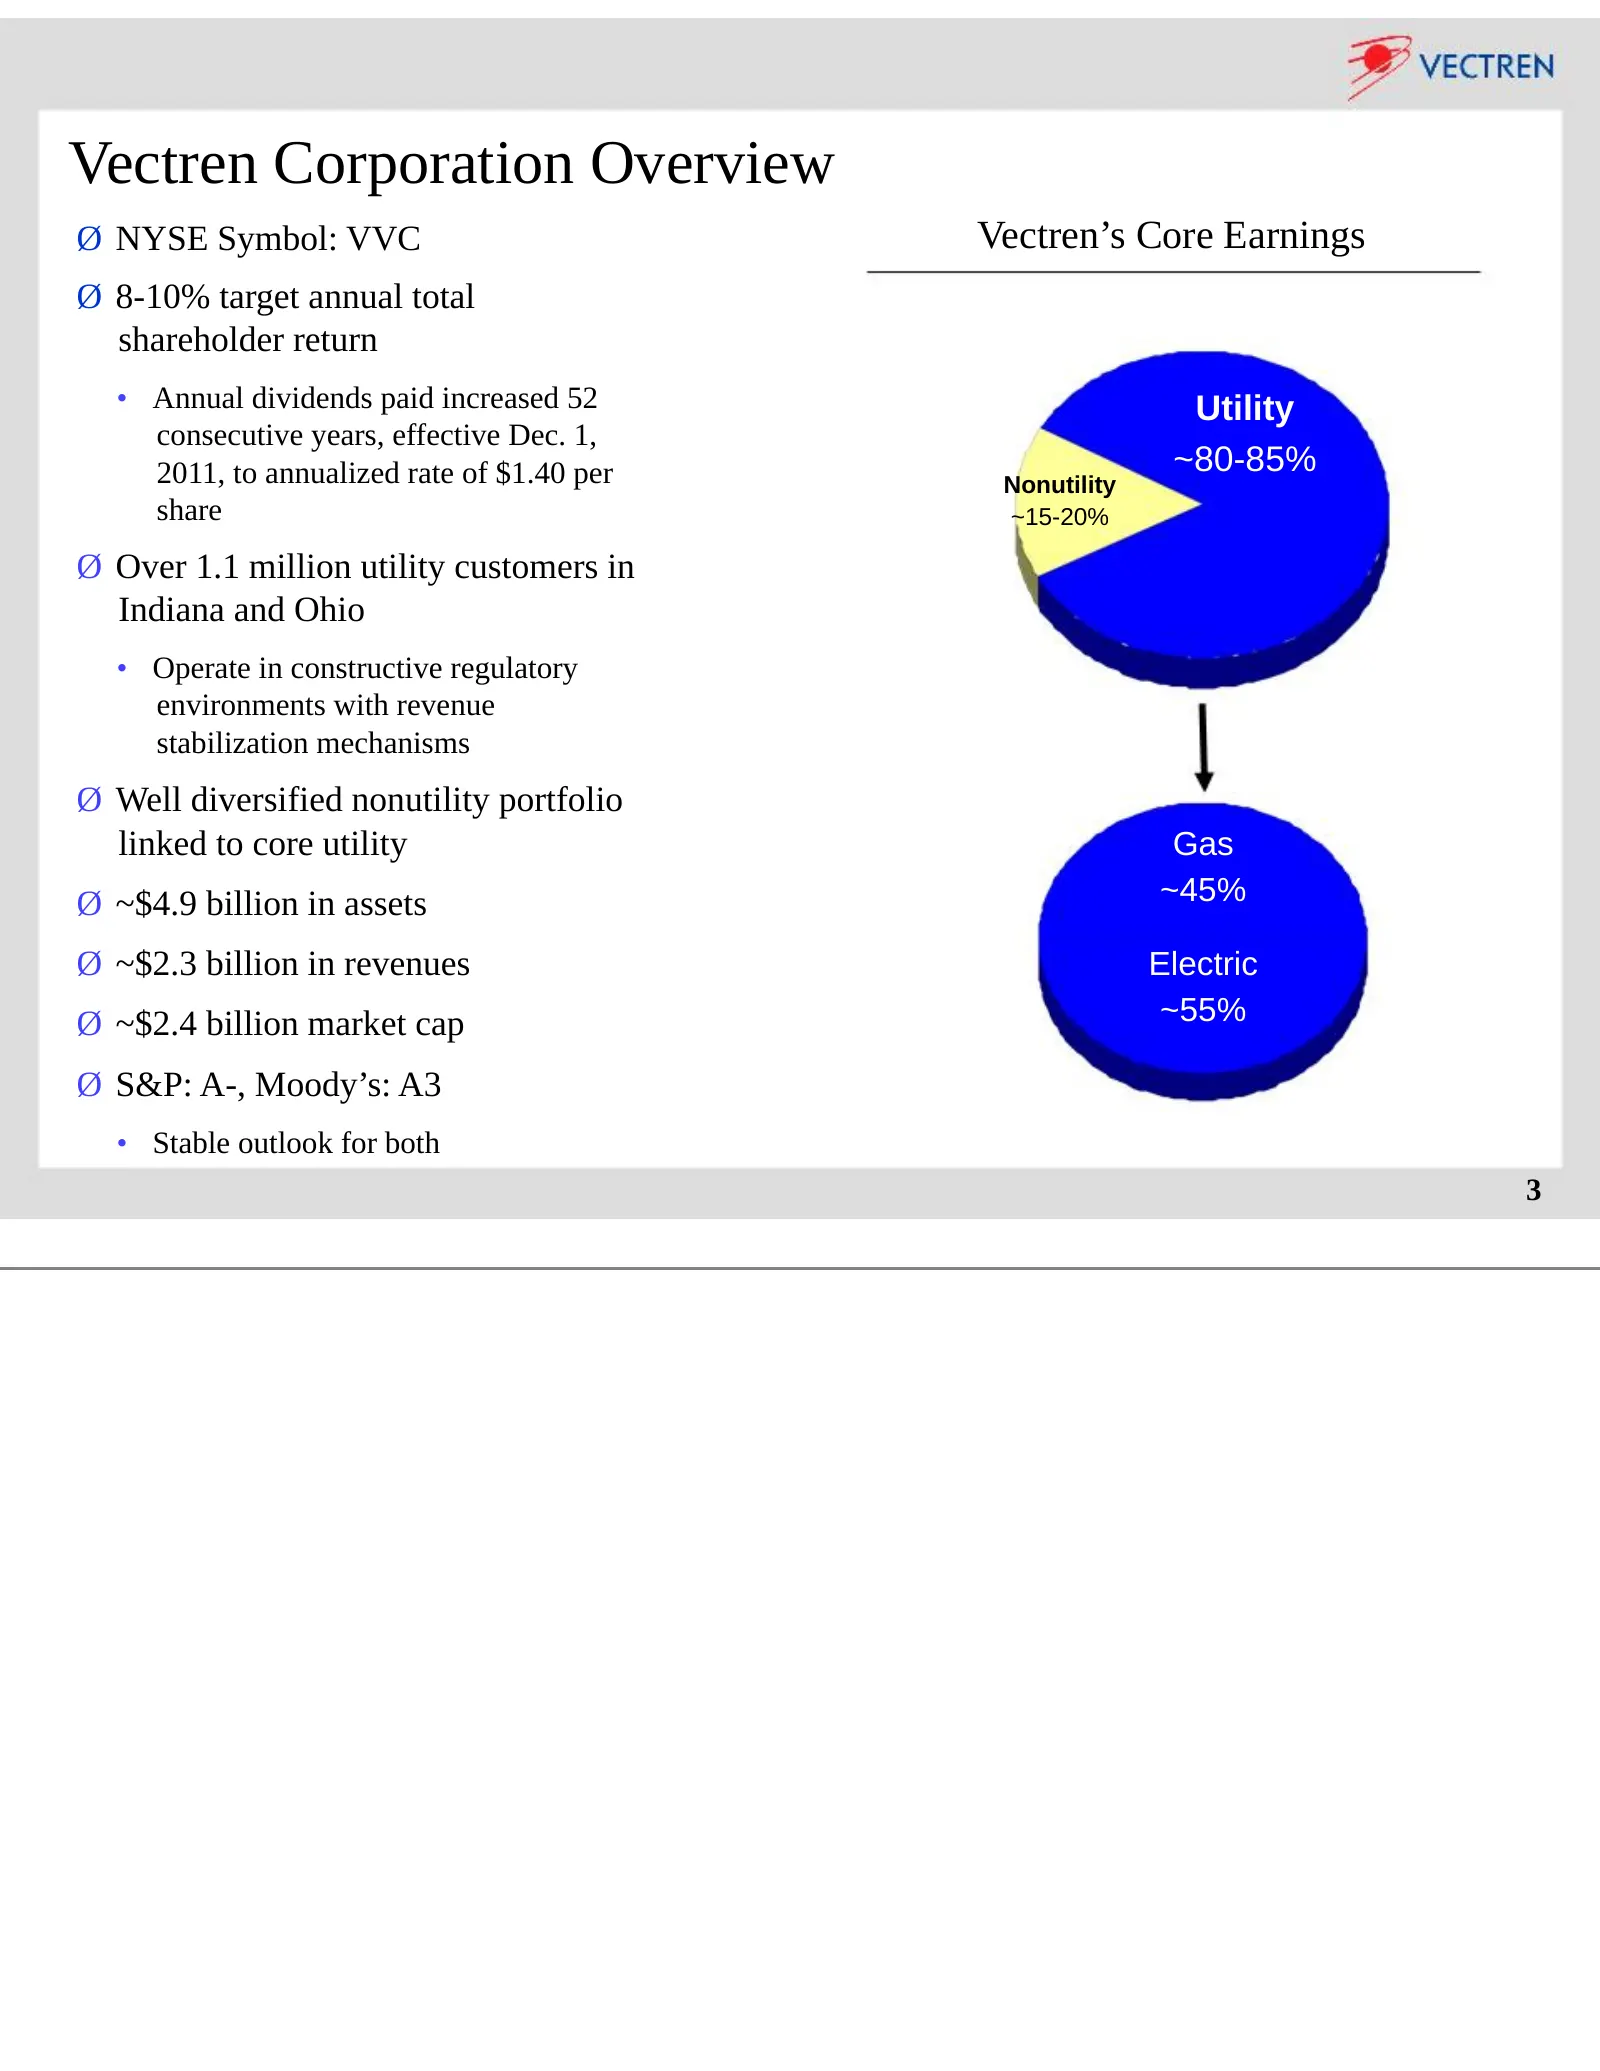
Vectren Corporation Overview Ø NYSE Symbol: VVC Vectren’s Core Earnings Ø 8-10% target annual total shareholder return • Annual dividends paid increased 52 Utility consecutive years, effective Dec. 1, 2011, to annualized rate of $1.40 per ~80-85% Nonutility share ~15-20% Ø Over 1.1 million utility c
Slide 4: Vectren at a Glance
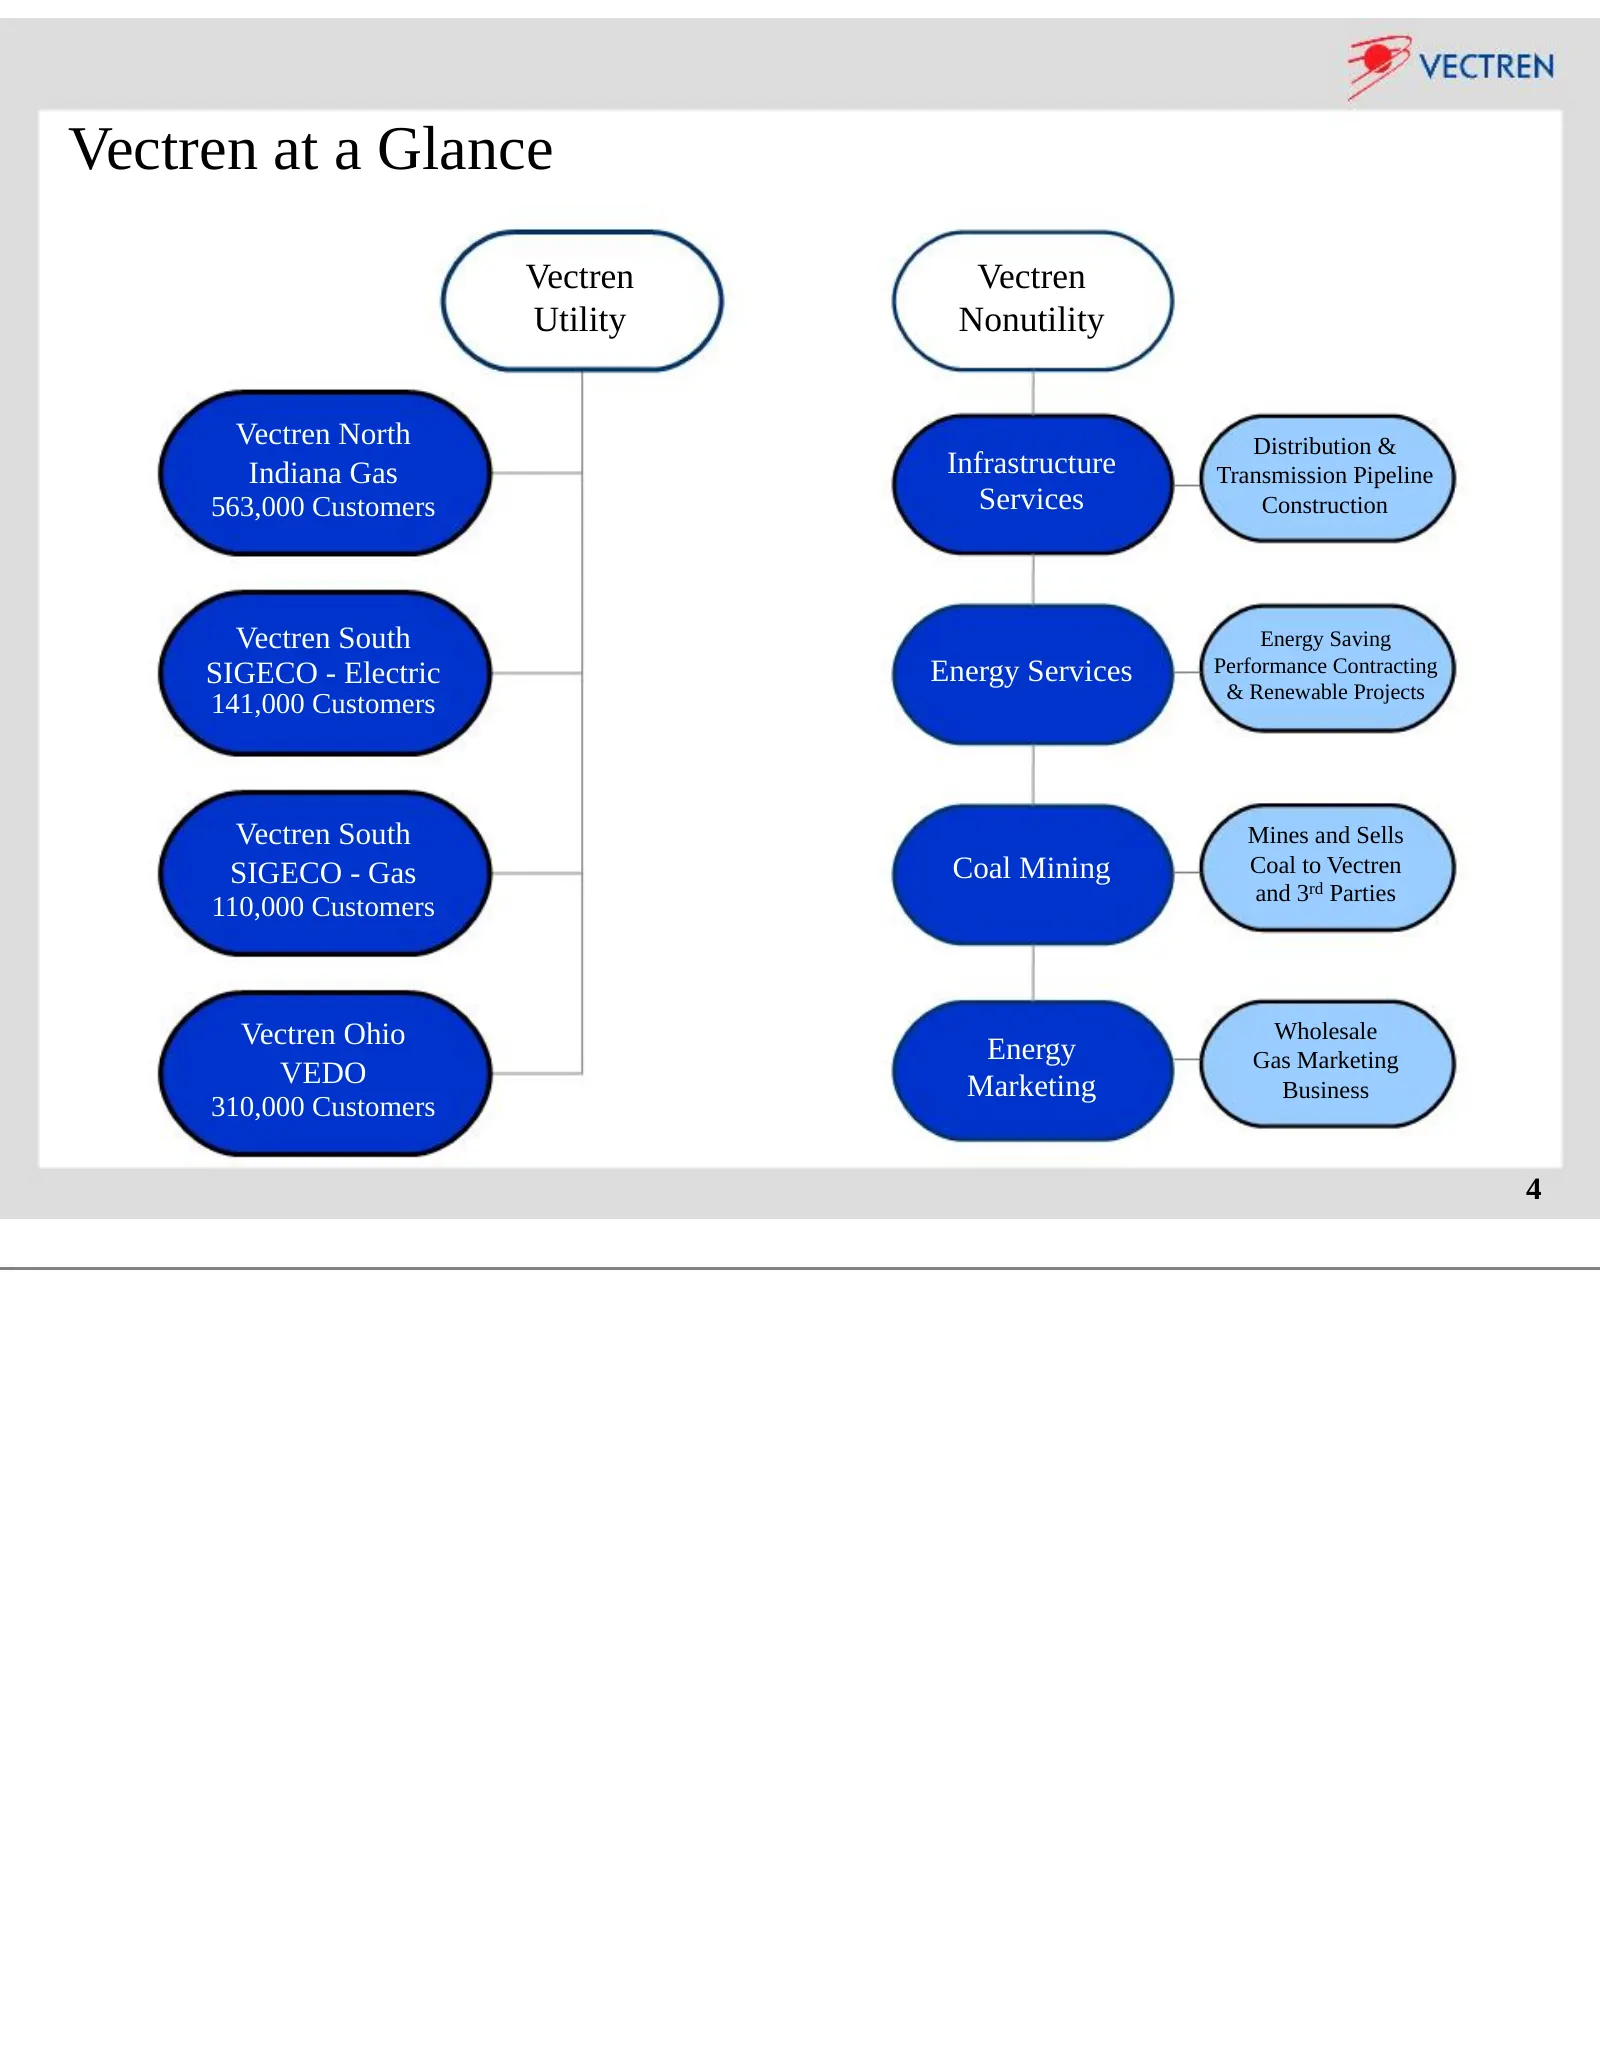
Vectren at a Glance Vectren Vectren Utility Nonutility Vectren North Distribution & Indiana Gas Infrastructure Transmission Pipeline 563,000 Customers Services Construction Vectren South Energy Saving SIGECO - Electric Energy Services Performance Contracting & Renewable Projects 141,000 Customers Ve
Slide 5: 2012 EPS Guidance
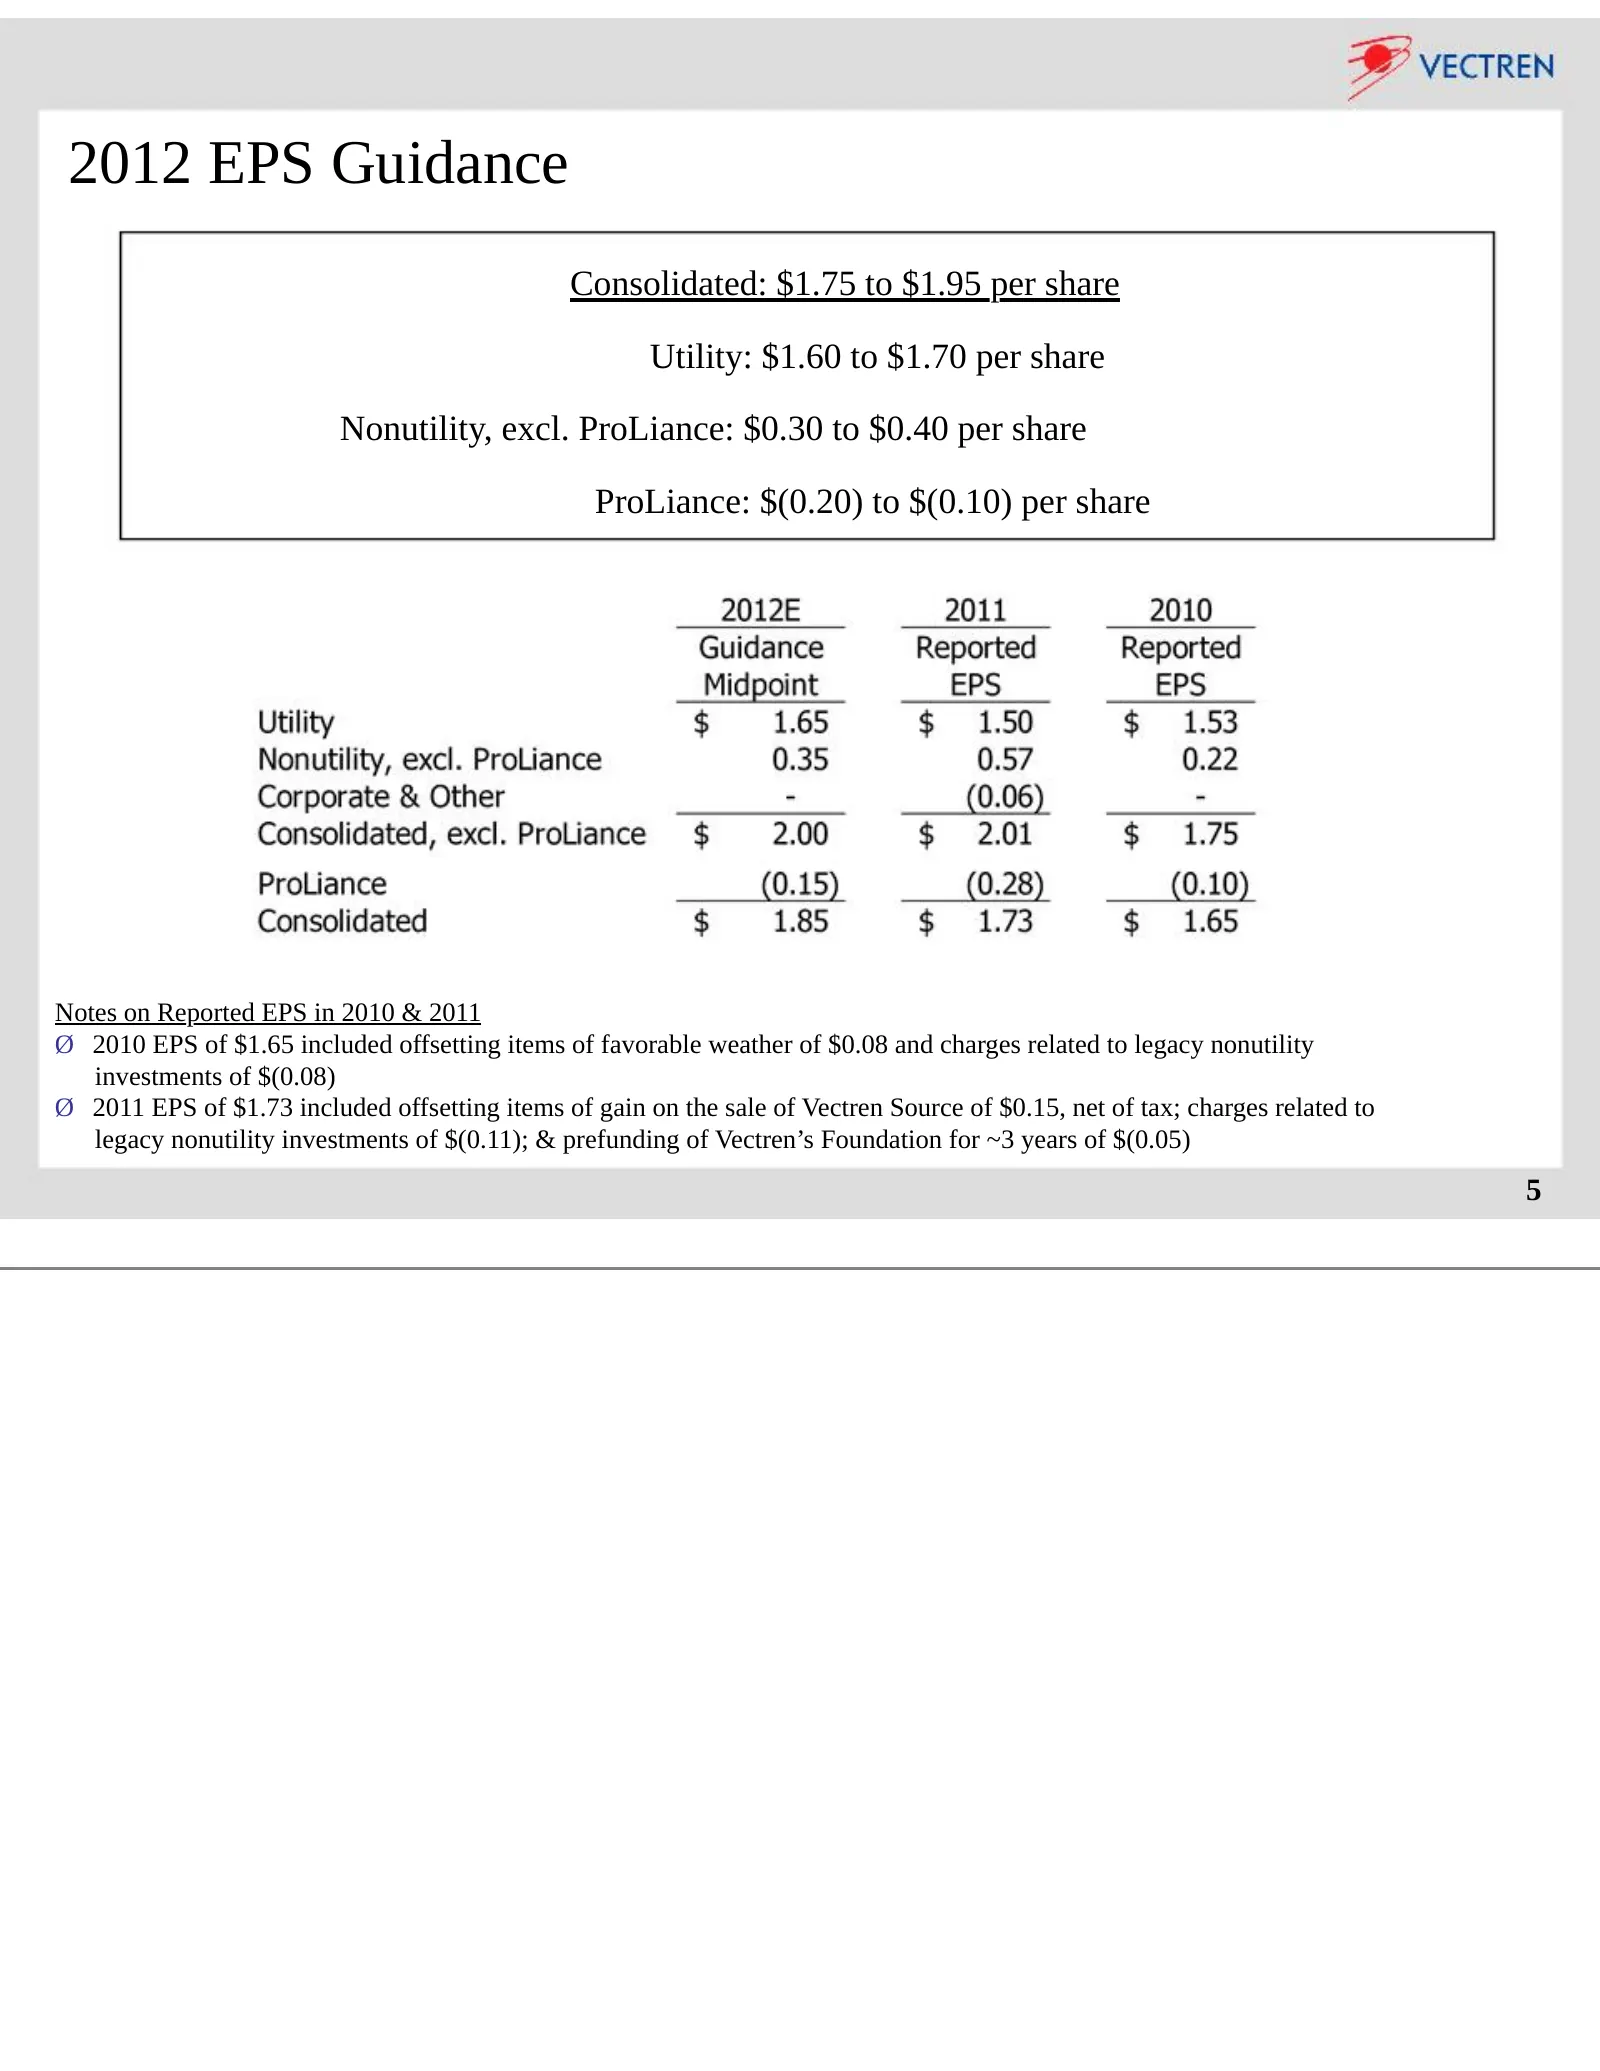
2012 EPS Guidance Consolidated: $1.75 to $1.95 per share Utility: $1.60 to $1.70 per share Nonutility, excl. ProLiance: $0.30 to $0.40 per share ProLiance: $(0.20) to $(0.10) per share Notes on Reported EPS in 2010 & 2011 Ø 2010 EPS of $1.65 included offsetting items of favorable weather of $0.08 an
Slide 6: Vectren Valuation Considerations
Vectren Valuation Considerations Ø Applying earnings-based multiples to the projected ProLiance loss does not accurately capture the long -term value of Vectren Ø 2012 EPS Guidance Midpoint without ProLiance: $2.00 per share • Utility results make up ~83% of 2012 guidance without ProLiance vs. ~75%
Slide 7: Looking Ahead - Strategies for 2012 and Beyond
Looking Ahead - Strategies for 2012 and Beyond Utility Ø Execute strategies to consistently achieve annual utility earnings growth target of 3% • Earn allowed returns in gas and electric utilities – Implement electric utility lost margin recovery mechanisms – Earn current returns on infrastructure i
Slide 8: Utility Guidance & Outlook
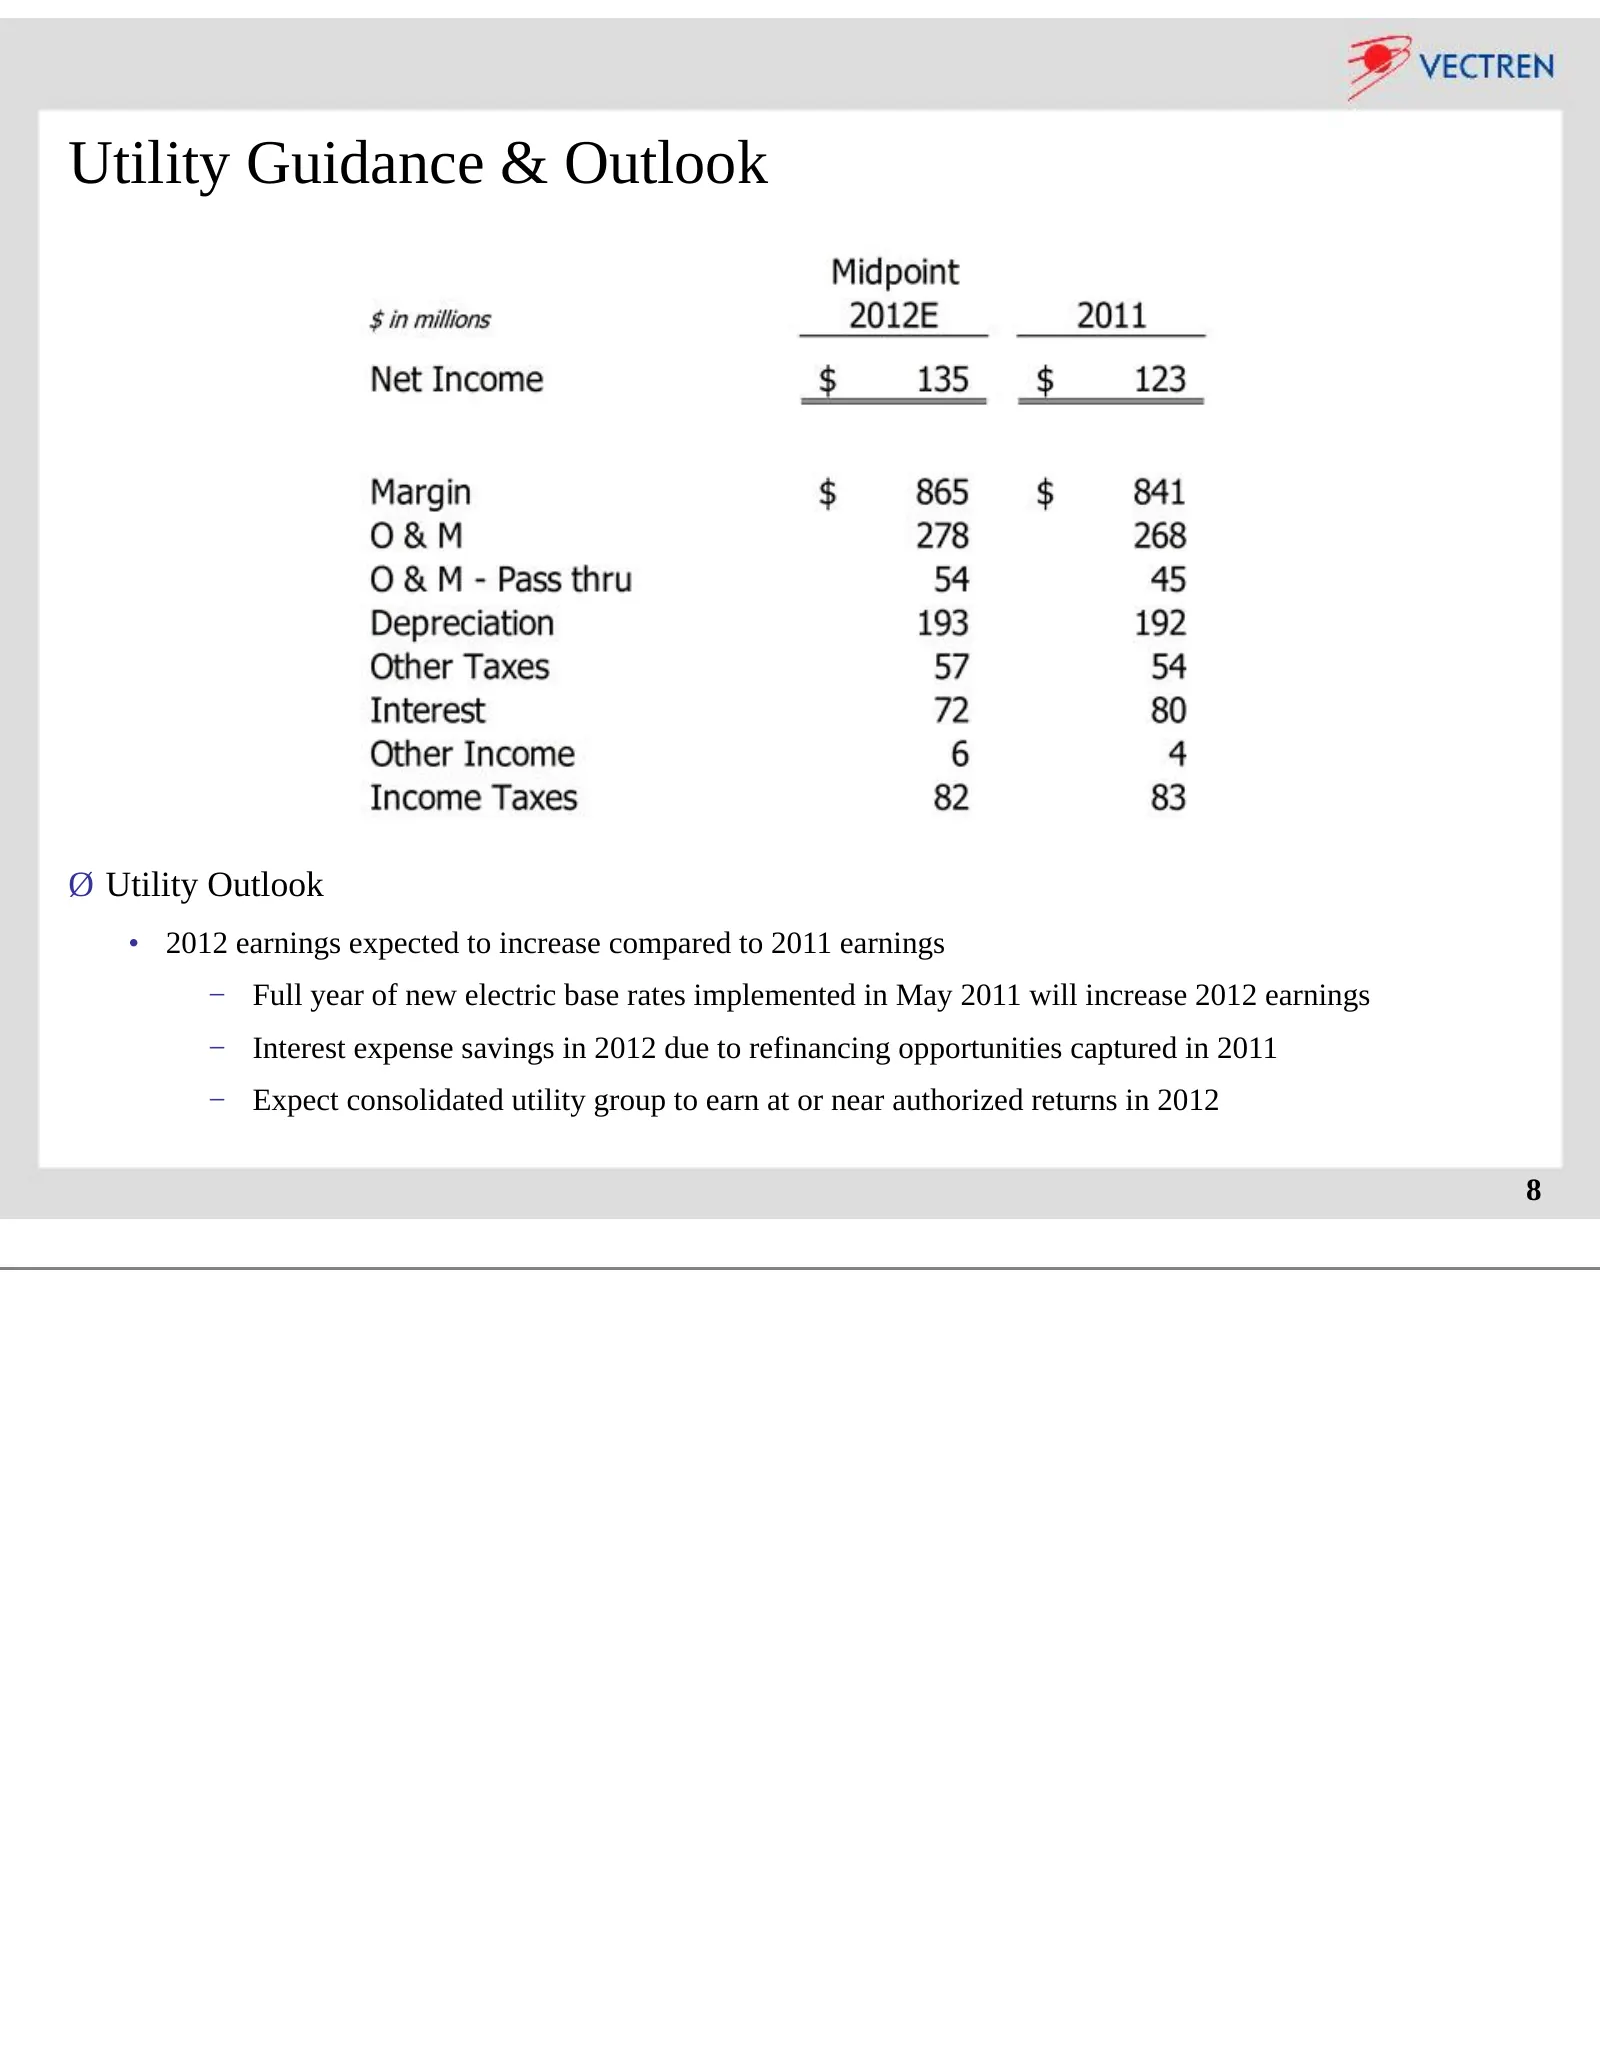
Utility Guidance & Outlook Ø Utility Outlook • 2012 earnings expected to increase compared to 2011 earnings − Full year of new electric base rates implemented in May 2011 will increase 2012 earnings − Interest expense savings in 2012 due to refinancing opportunities captured in 2011 − Expect consoli
Slide 9: Constructive Utility Regulation & Legislation
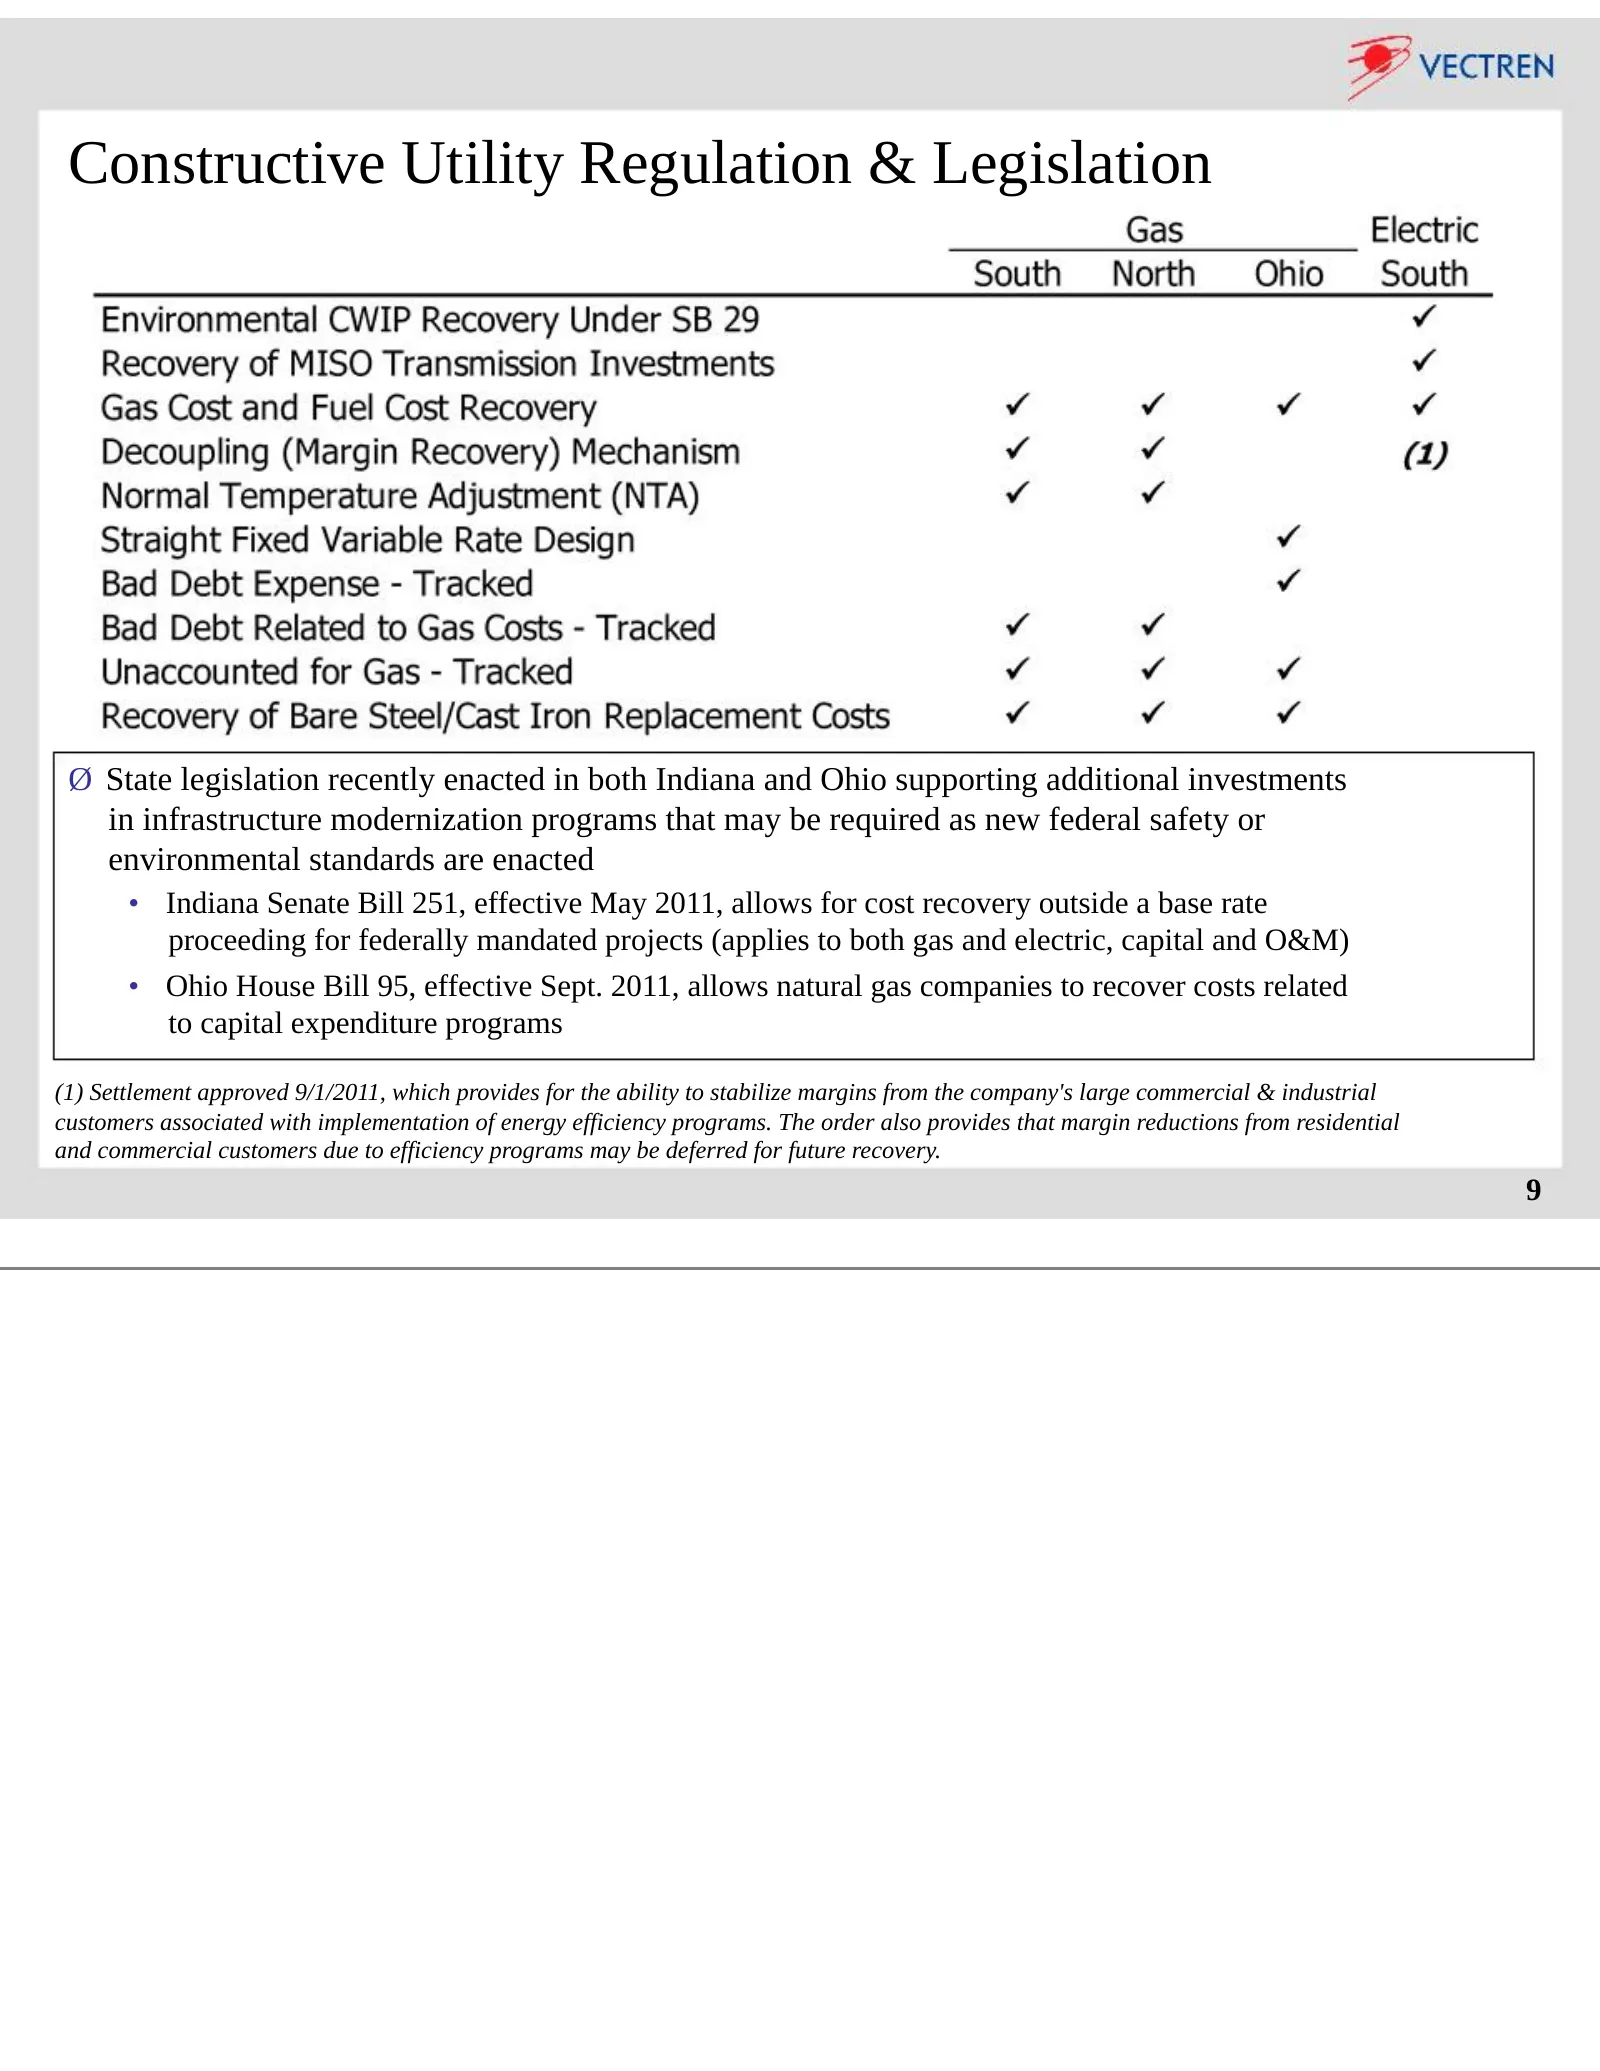
Constructive Utility Regulation & Legislation Ø State legislation recently enacted in both Indiana and Ohio supporting additional investments in infrastructure modernization programs that may be required as new federal safety or environmental standards are enacted • Indiana Senate Bill 251, effectiv
Slide 10: Utility CapEx and Cash Flow
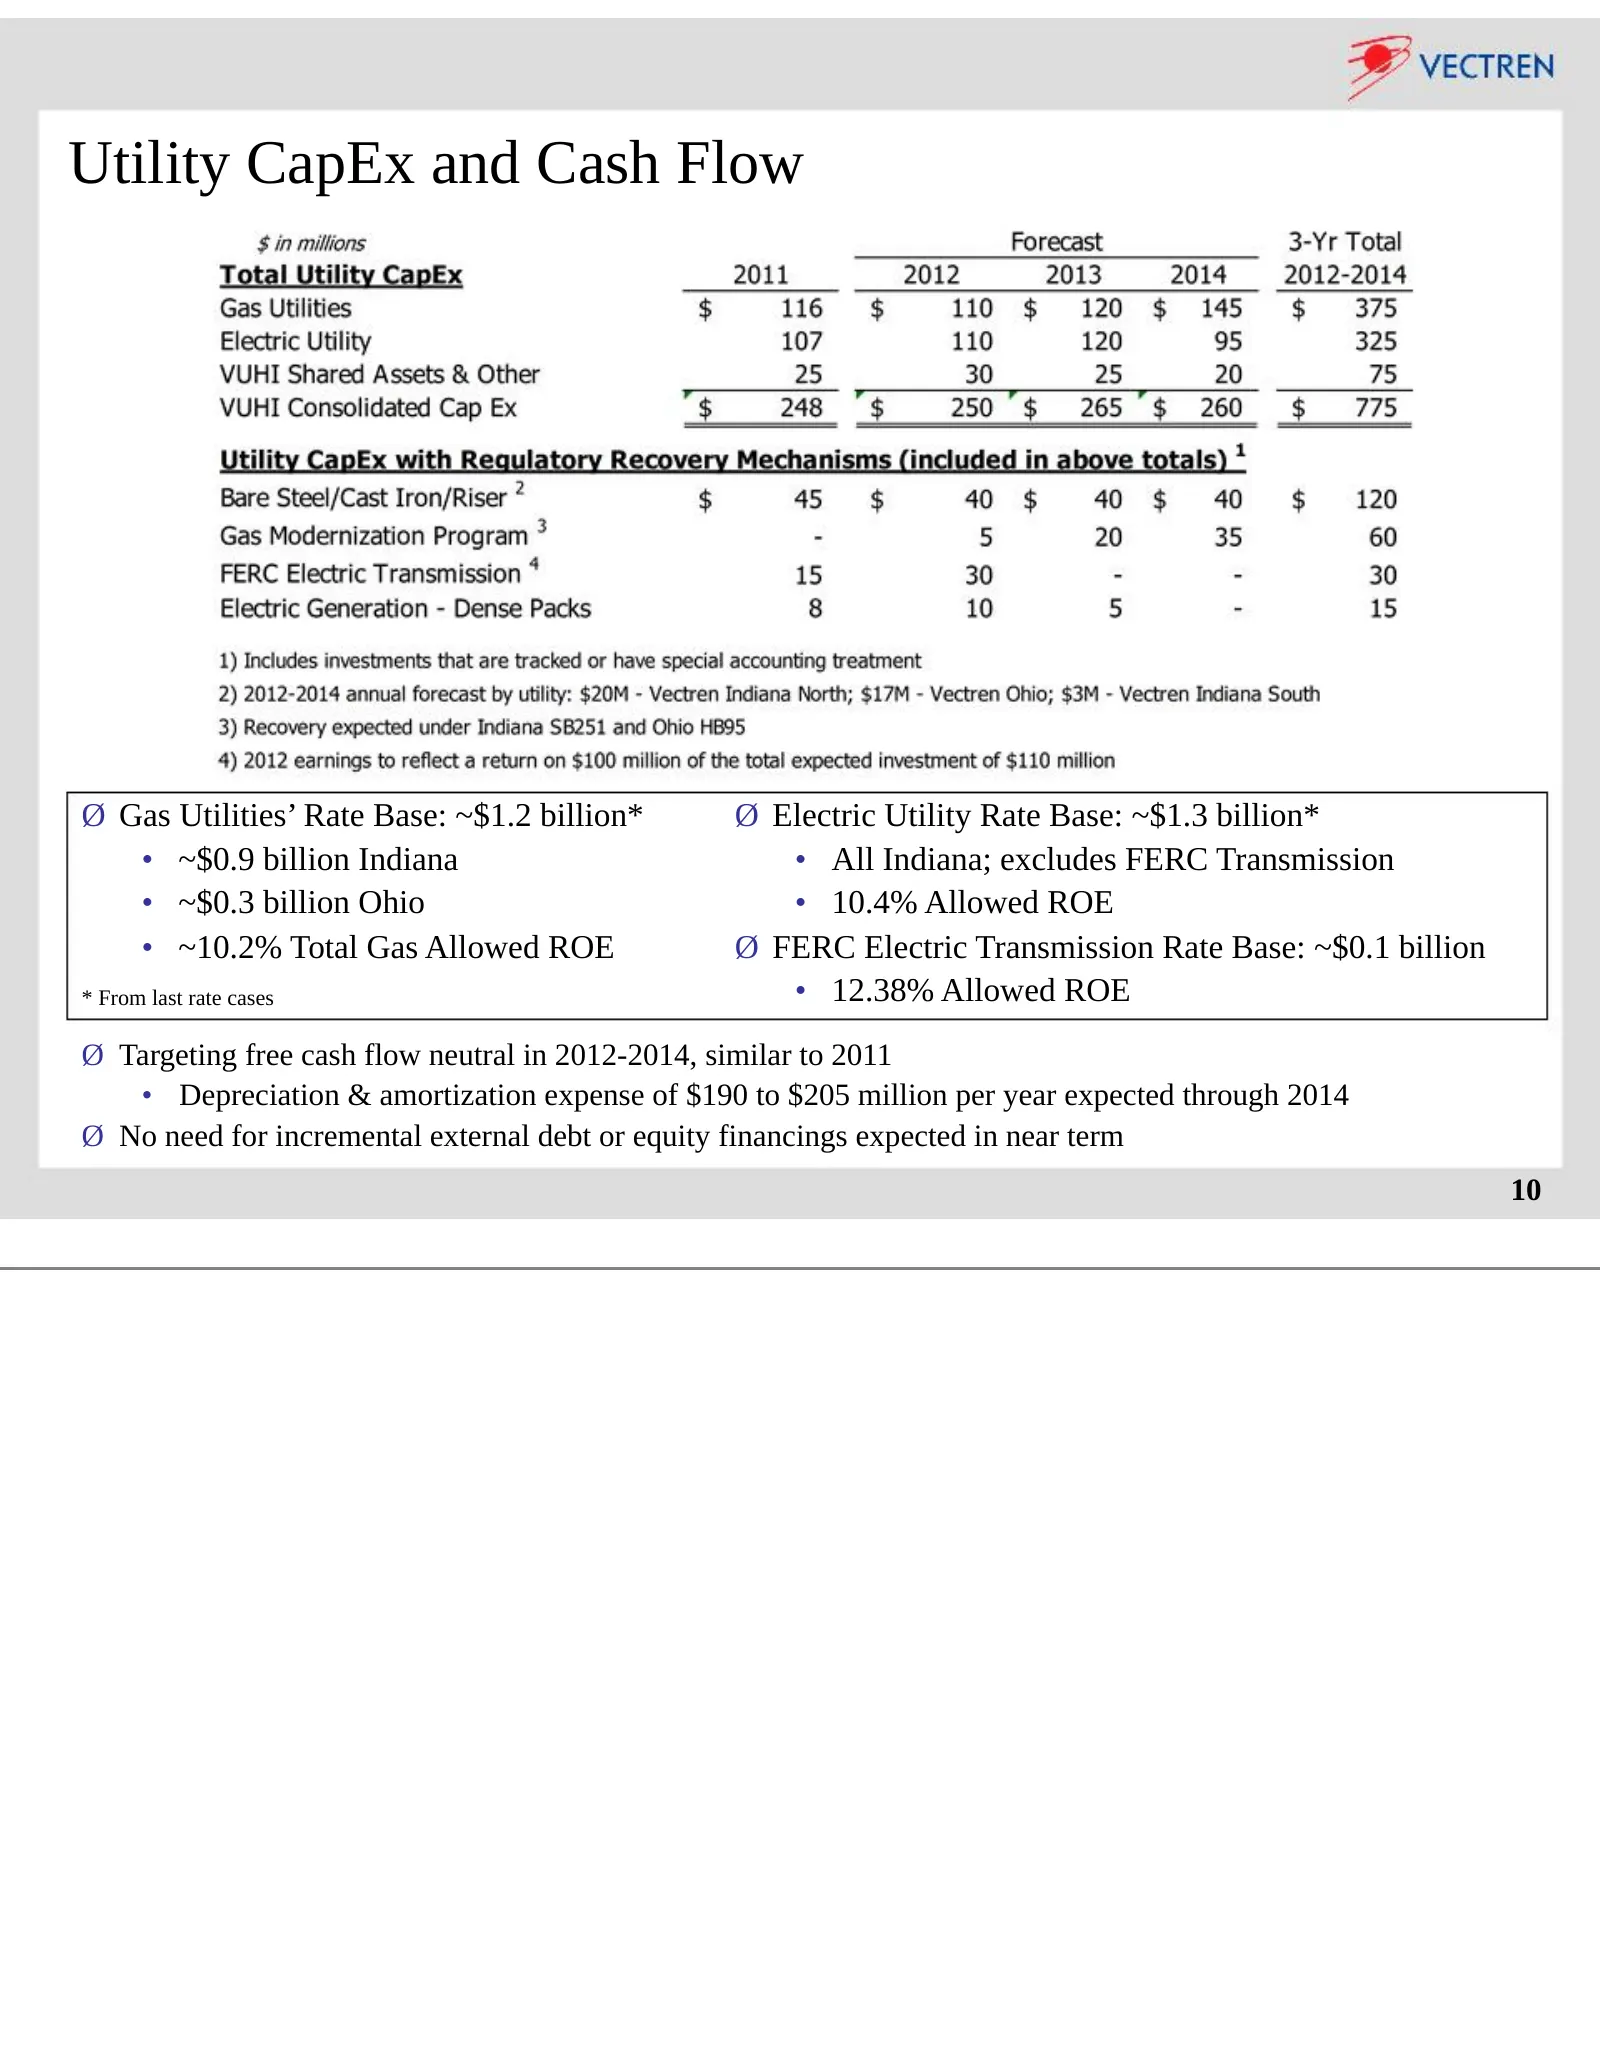
Utility CapEx and Cash Flow Ø Gas Utilities’ Rate Base: ~$1.2 billion* Ø Electric Utility Rate Base: ~$1.3 billion* • ~$0.9 billion Indiana • All Indiana; excludes FERC Transmission • ~$0.3 billion Ohio • 10.4% Allowed ROE • ~10.2% Total Gas Allowed ROE Ø FERC Electric Transmission Rate Base: ~$0.1
Slide 11: Nonutility Guidance
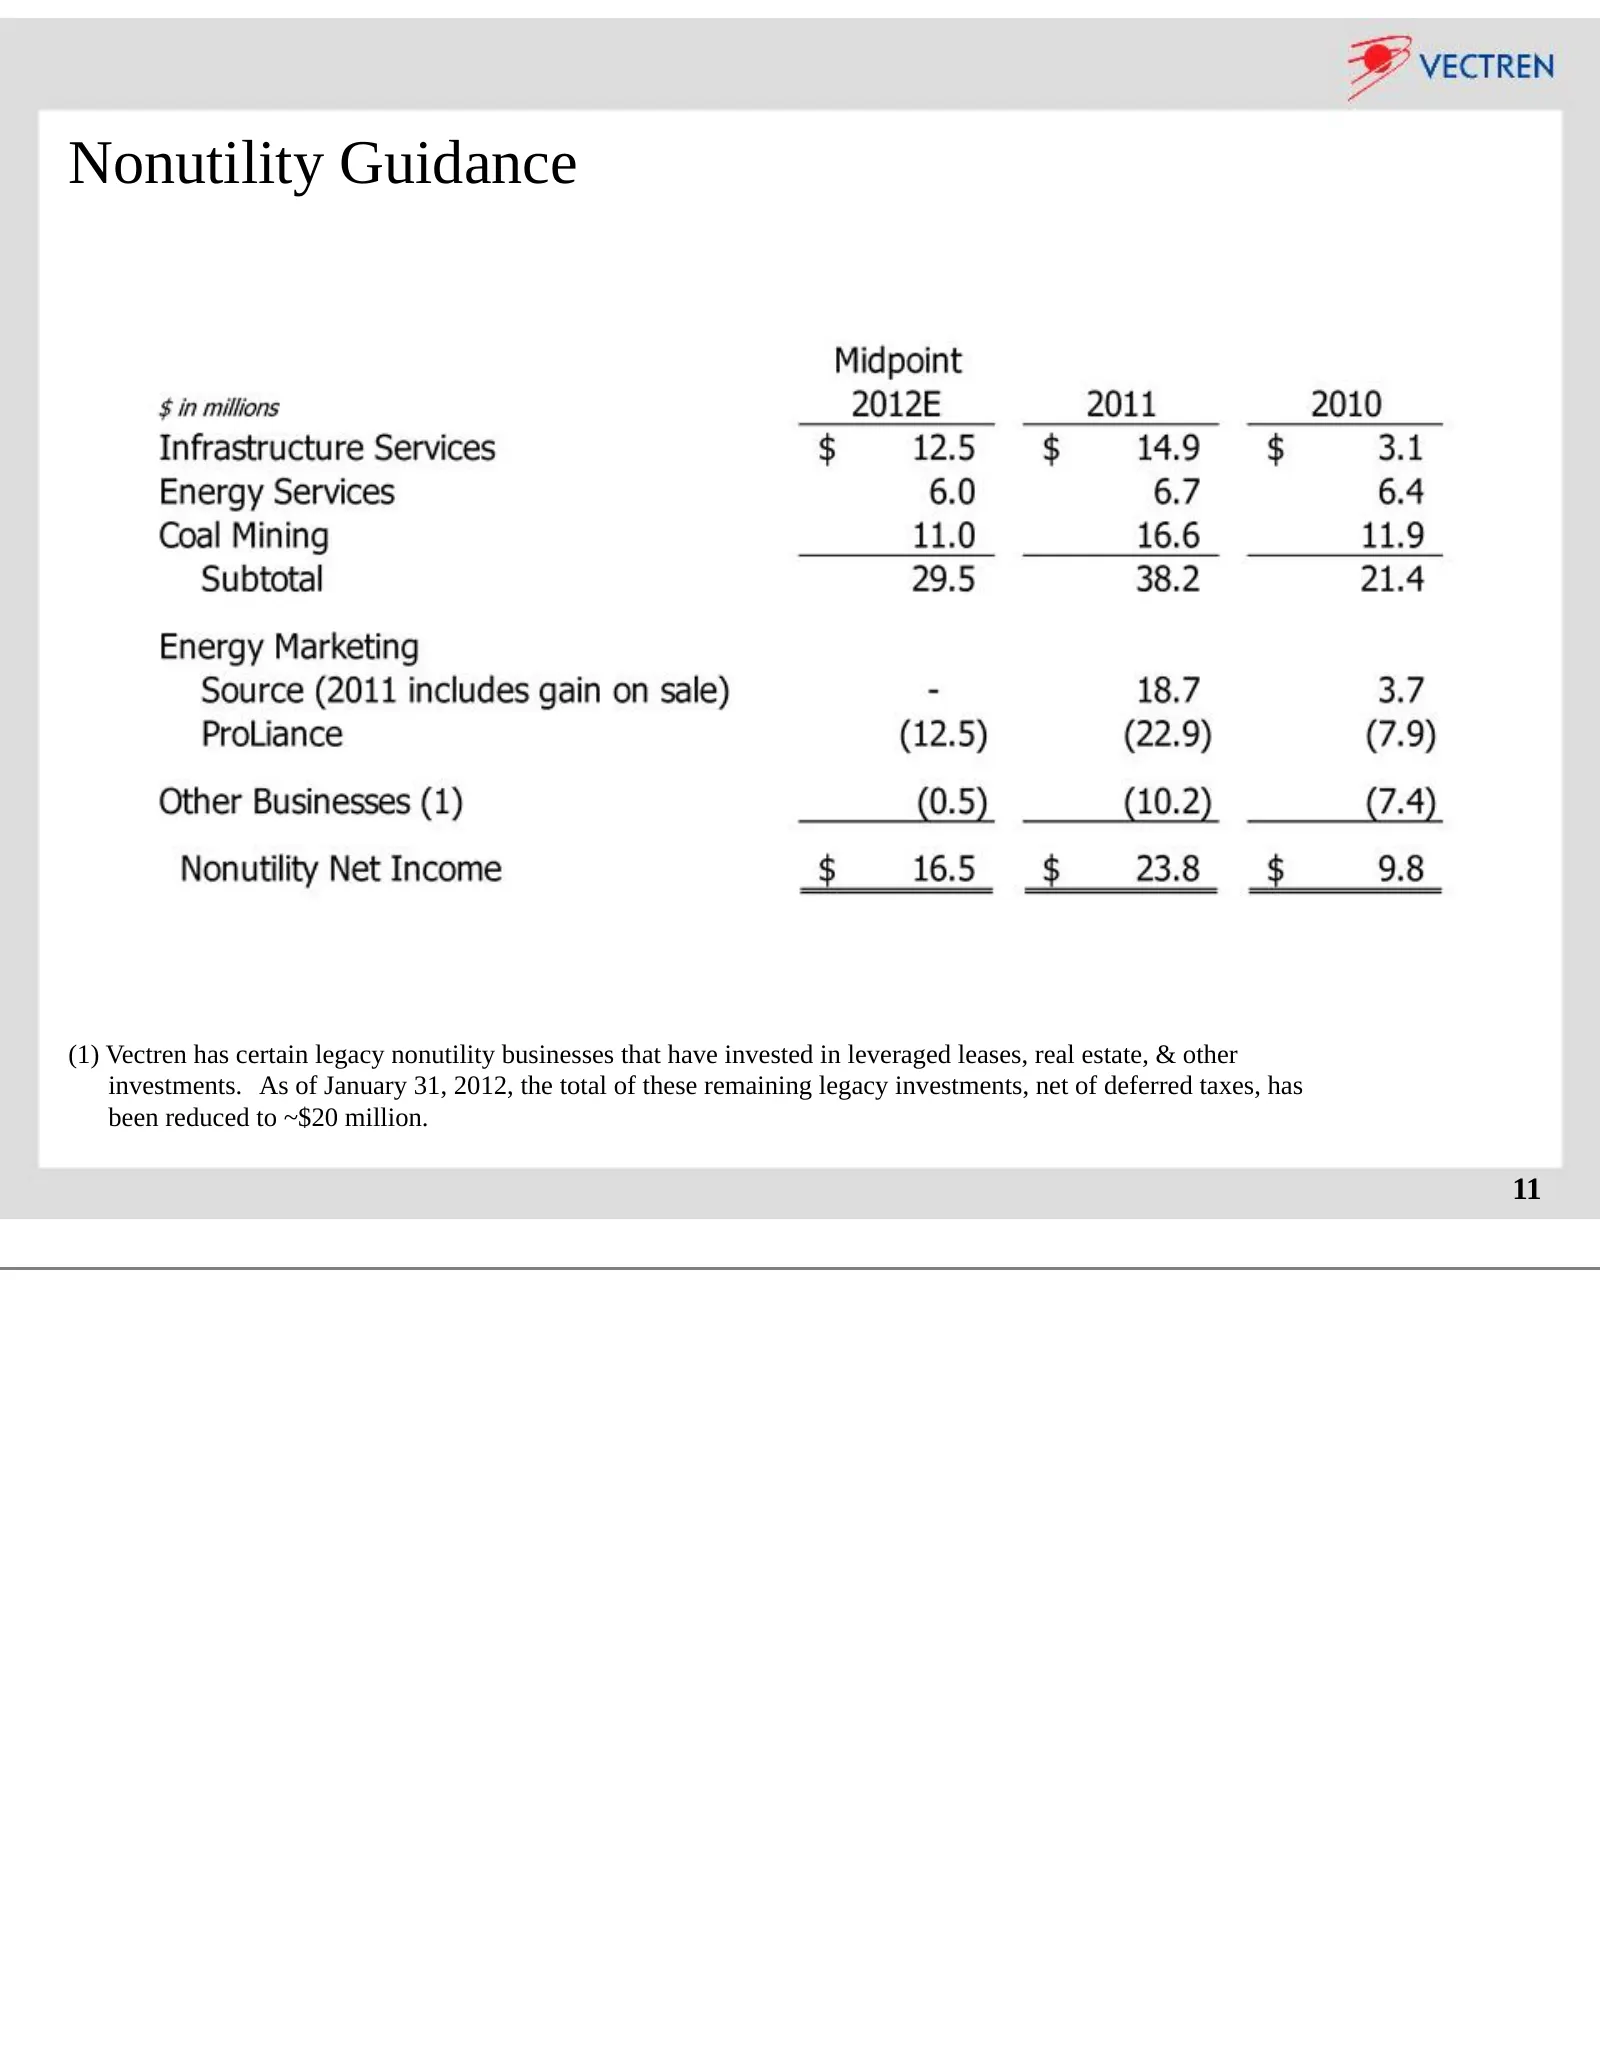
Nonutility Guidance (1) Vectren has certain legacy nonutility businesses that have invested in leveraged leases, real estate, & other investments. As of January 31, 2012, the total of these remaining legacy investments, net of deferred taxes, has been reduced to ~$20 million. 11
Slide 12: Nonutility Outlook - Infrastructure Services
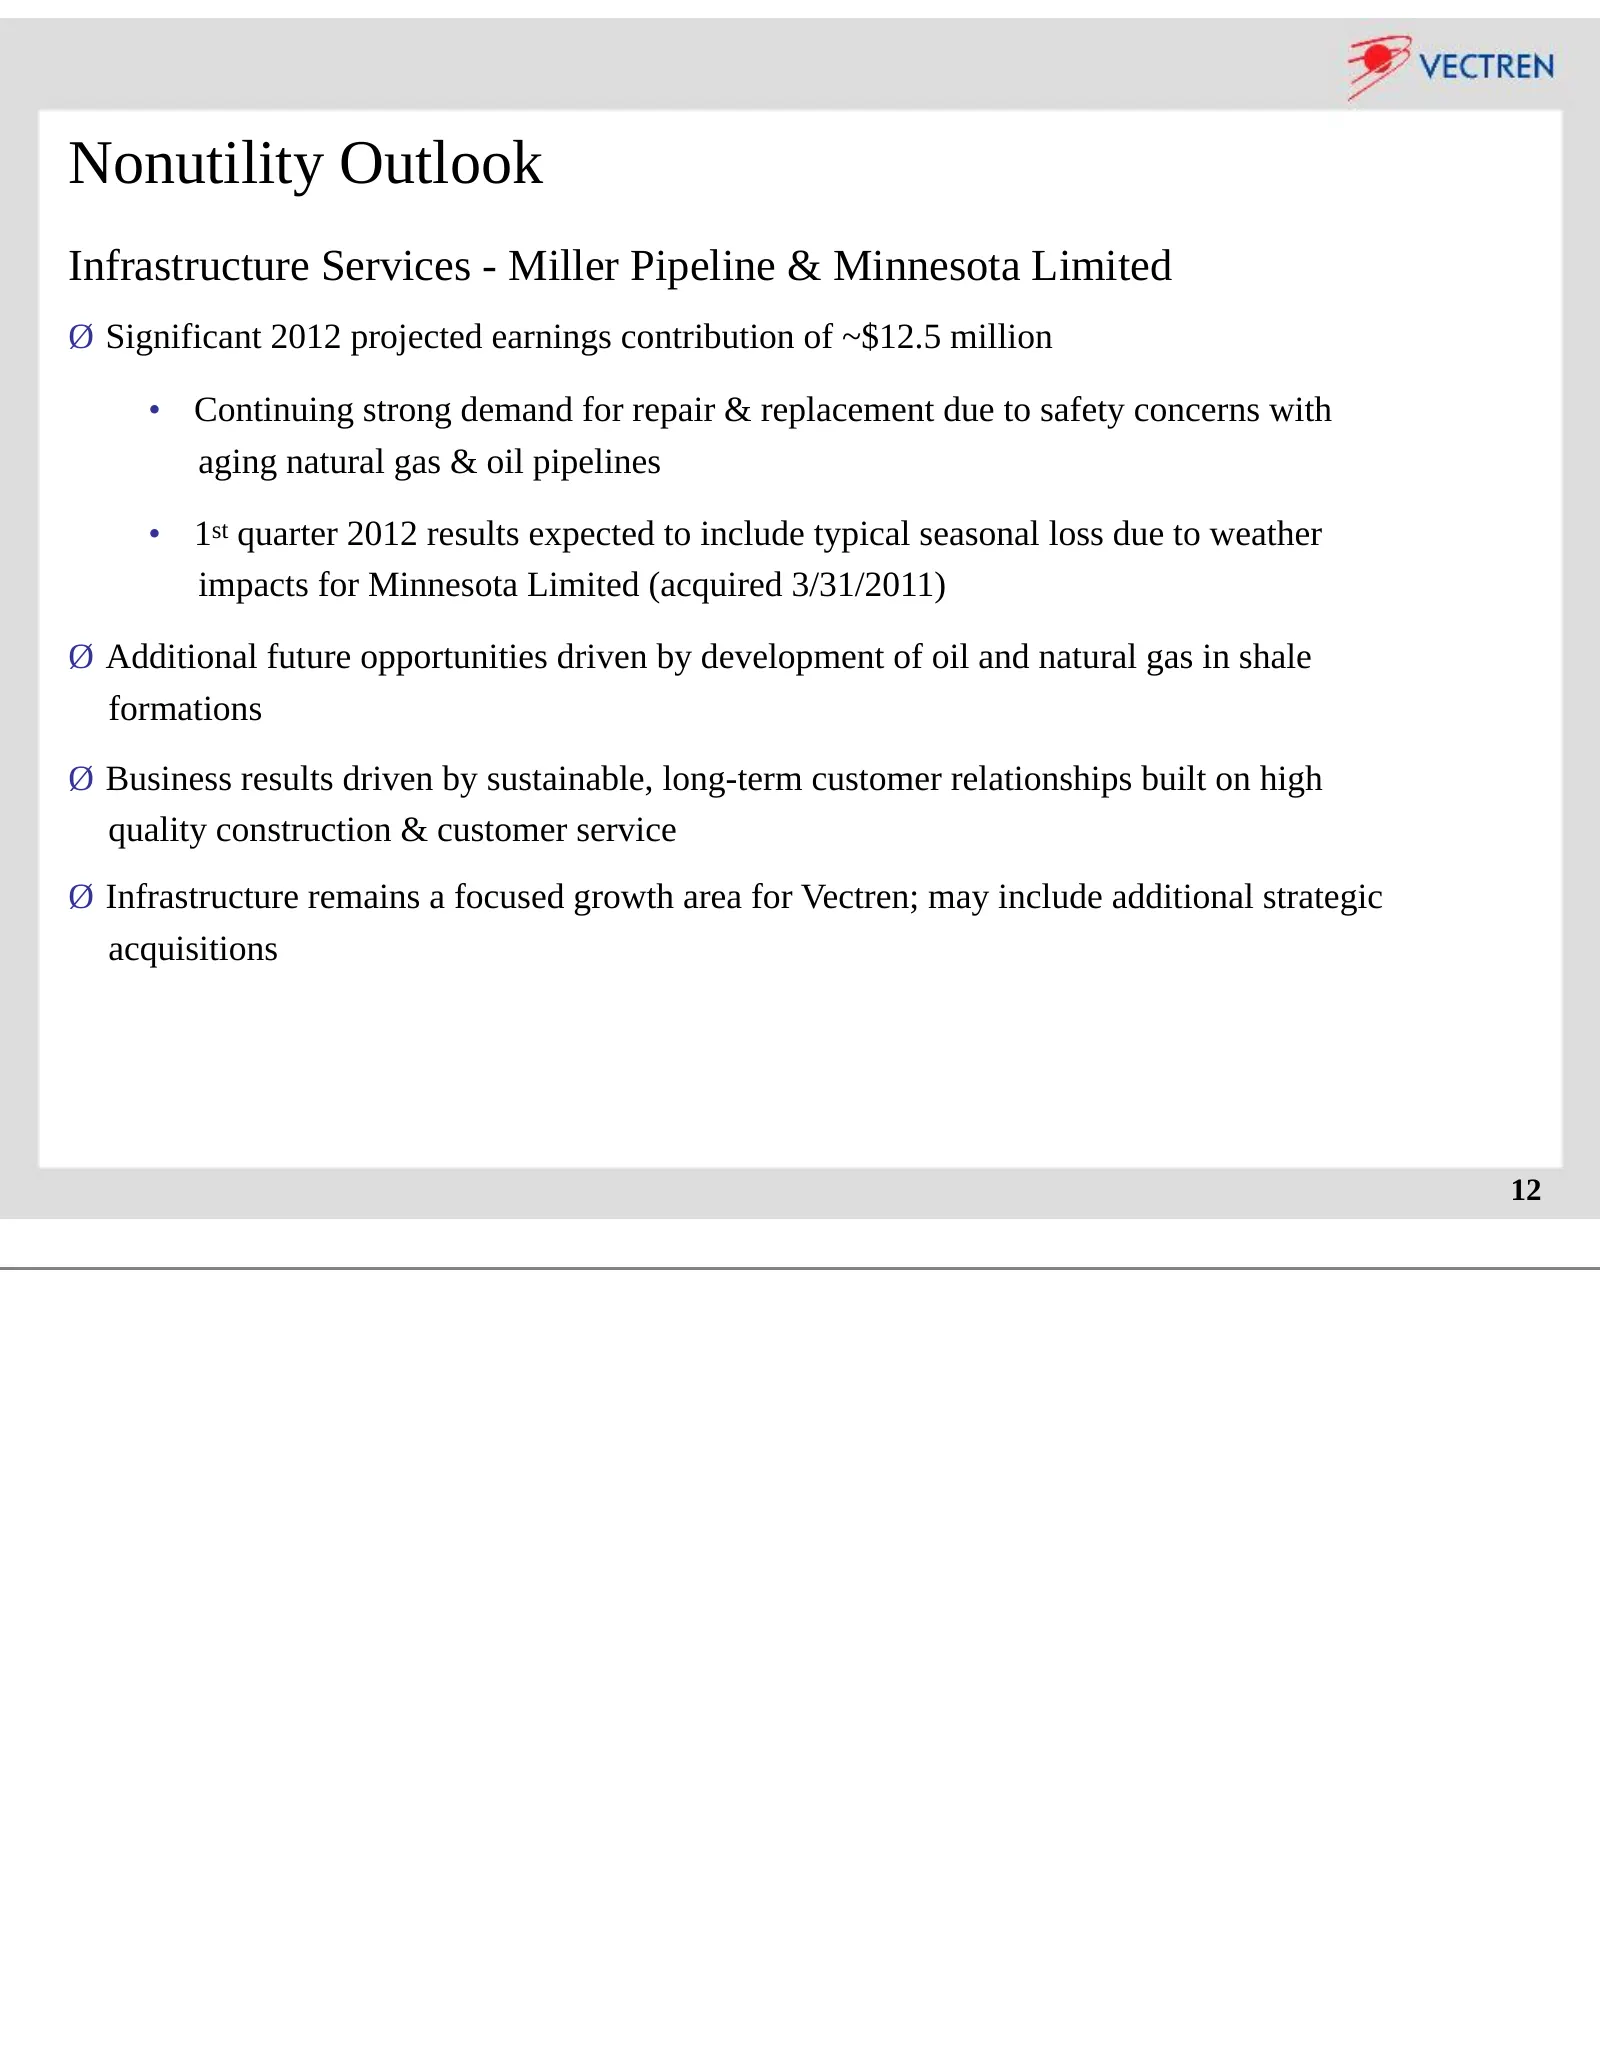
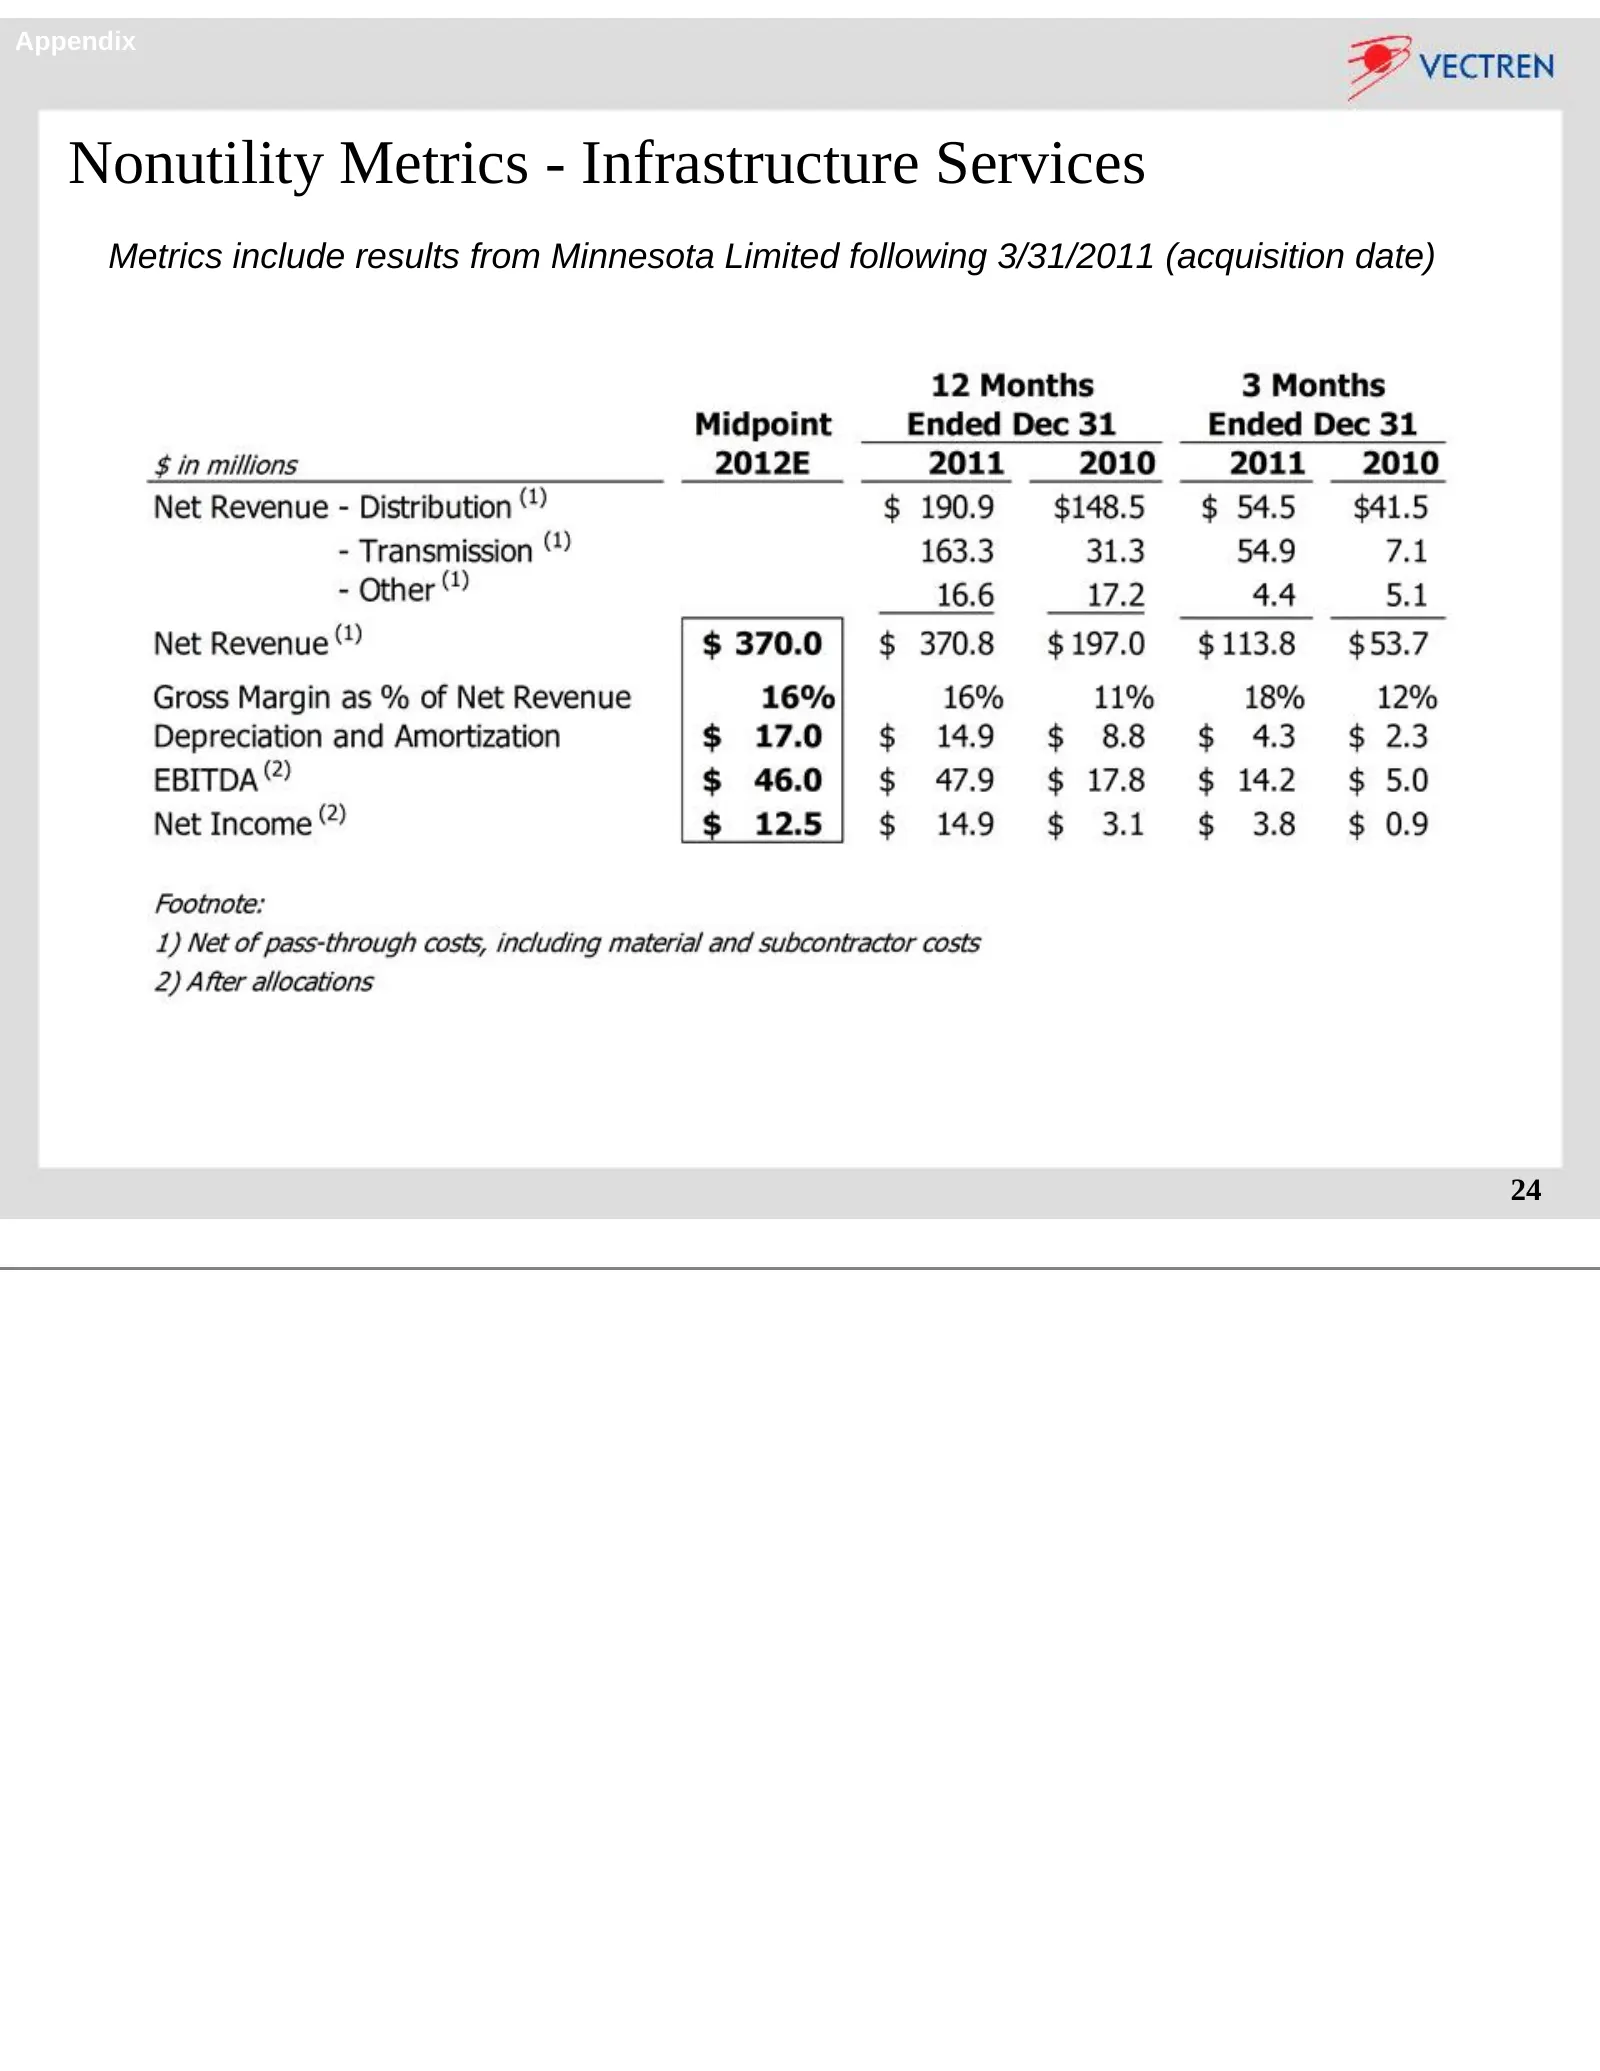
Nonutility Outlook Infrastructure Services - Miller Pipeline & Minnesota Limited Ø Significant 2012 projected earnings contribution of ~$12.5 million • Continuing strong demand for repair & replacement due to safety concerns with aging natural gas & oil pipelines • 1st quarter 2012 results expected
Slide 13: Nonutility Outlook - Energy Services
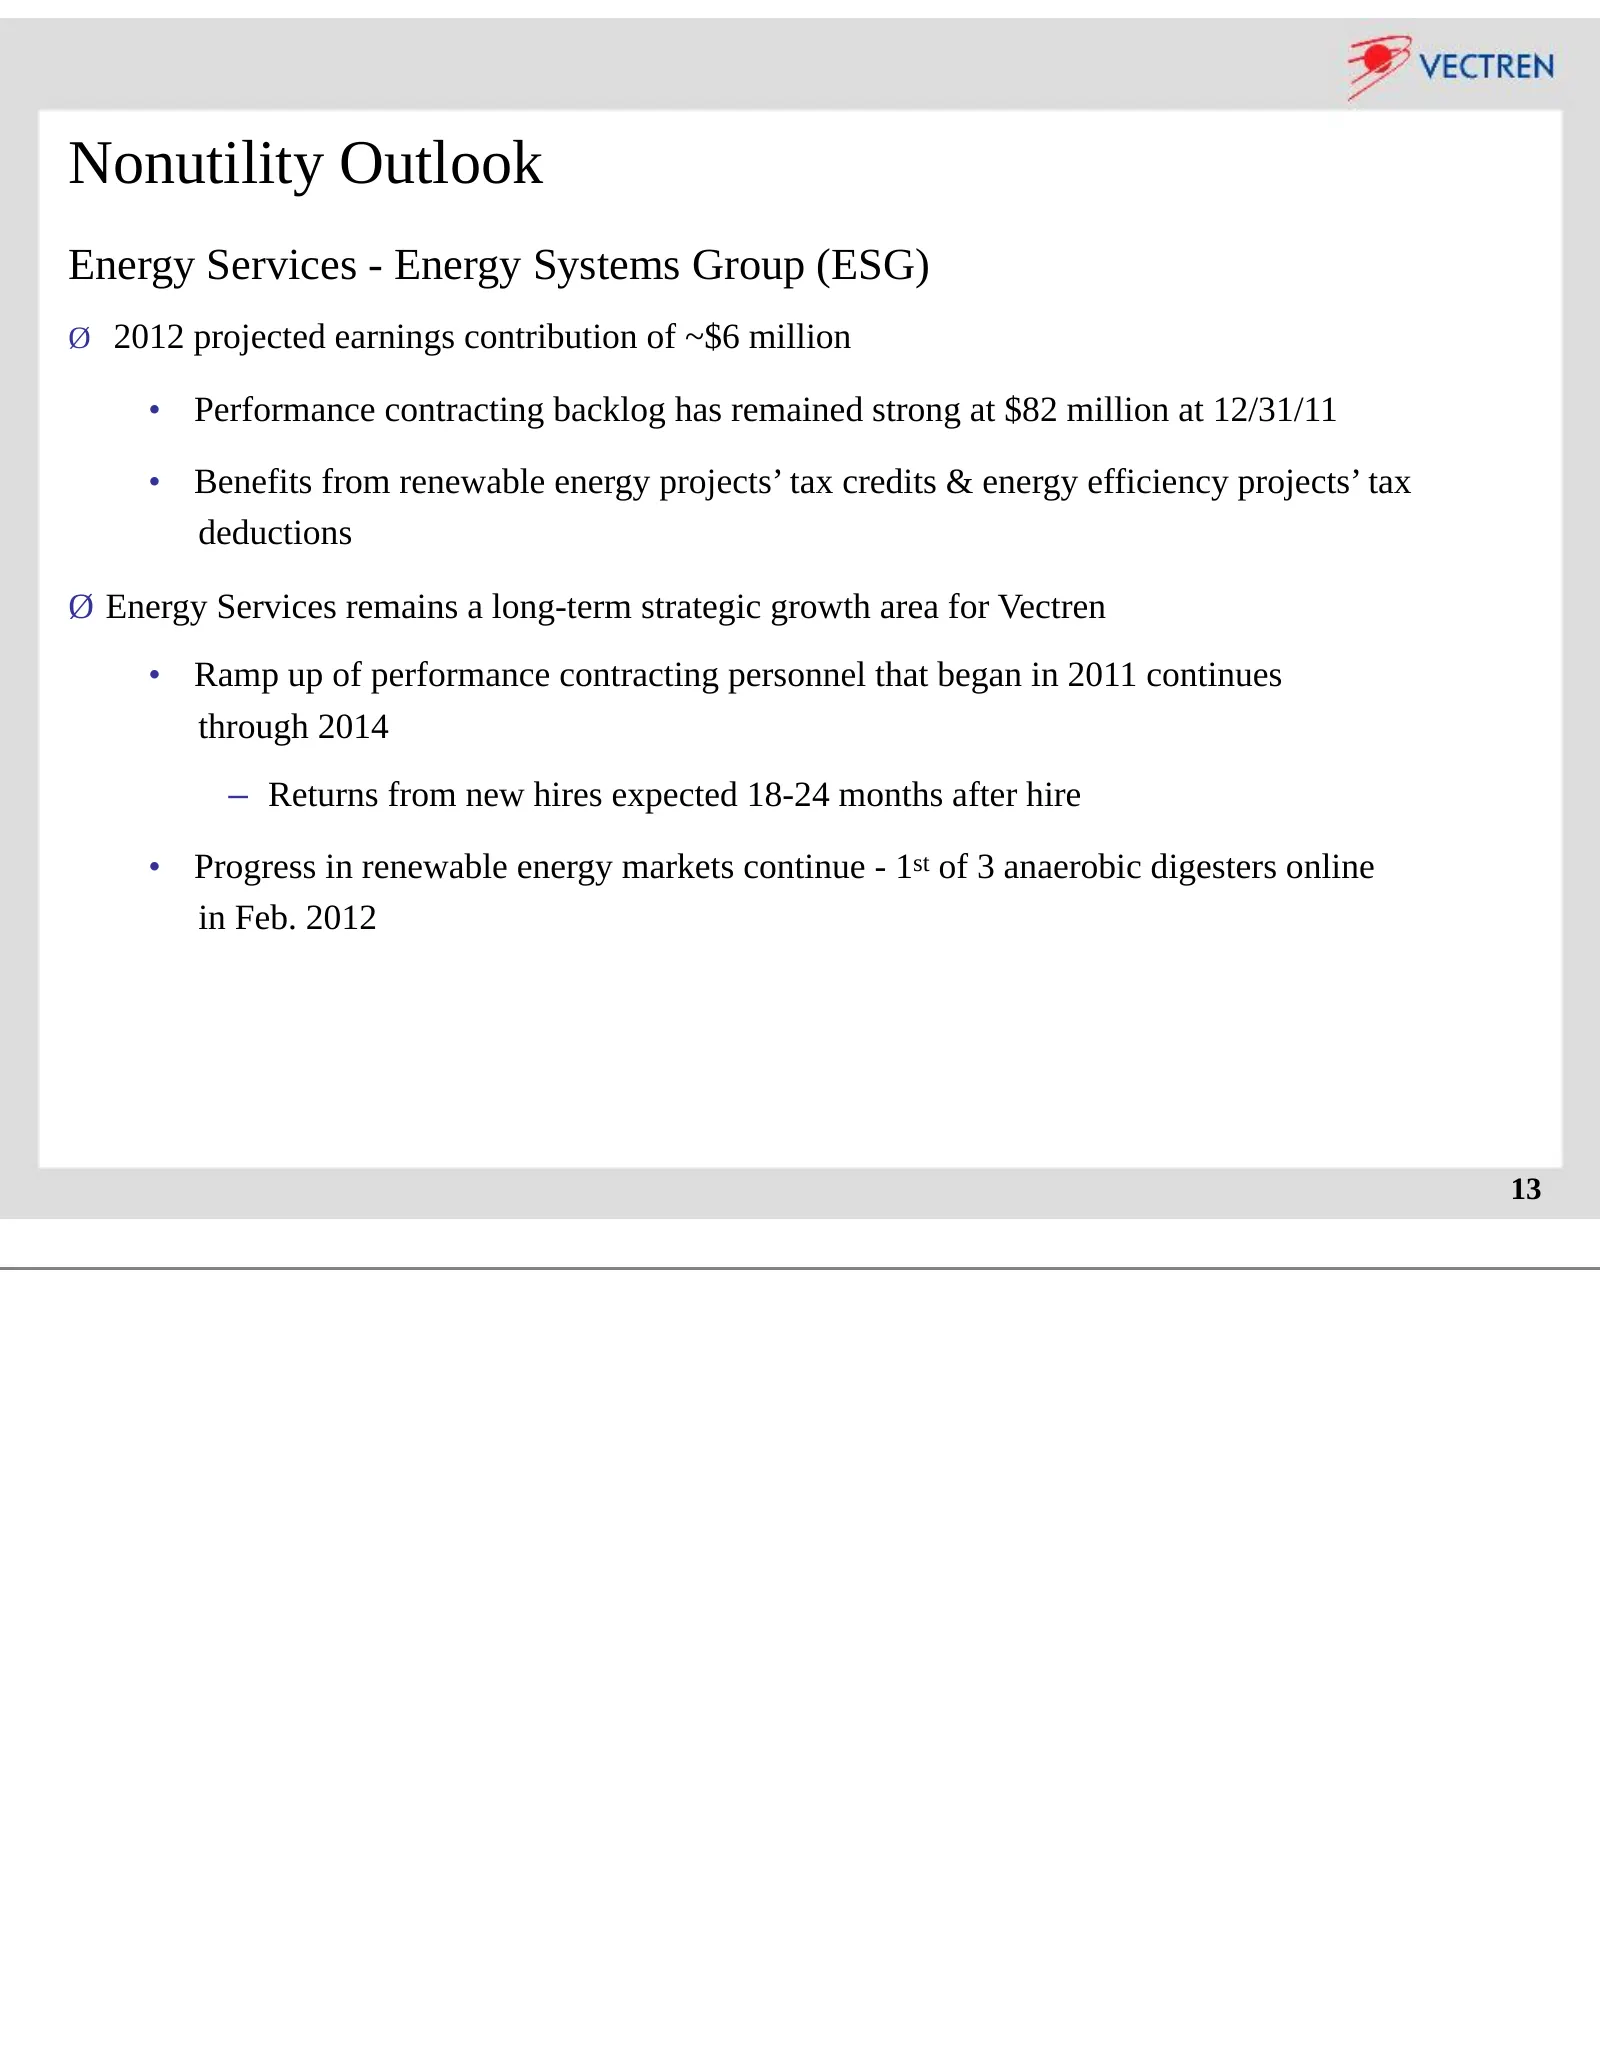
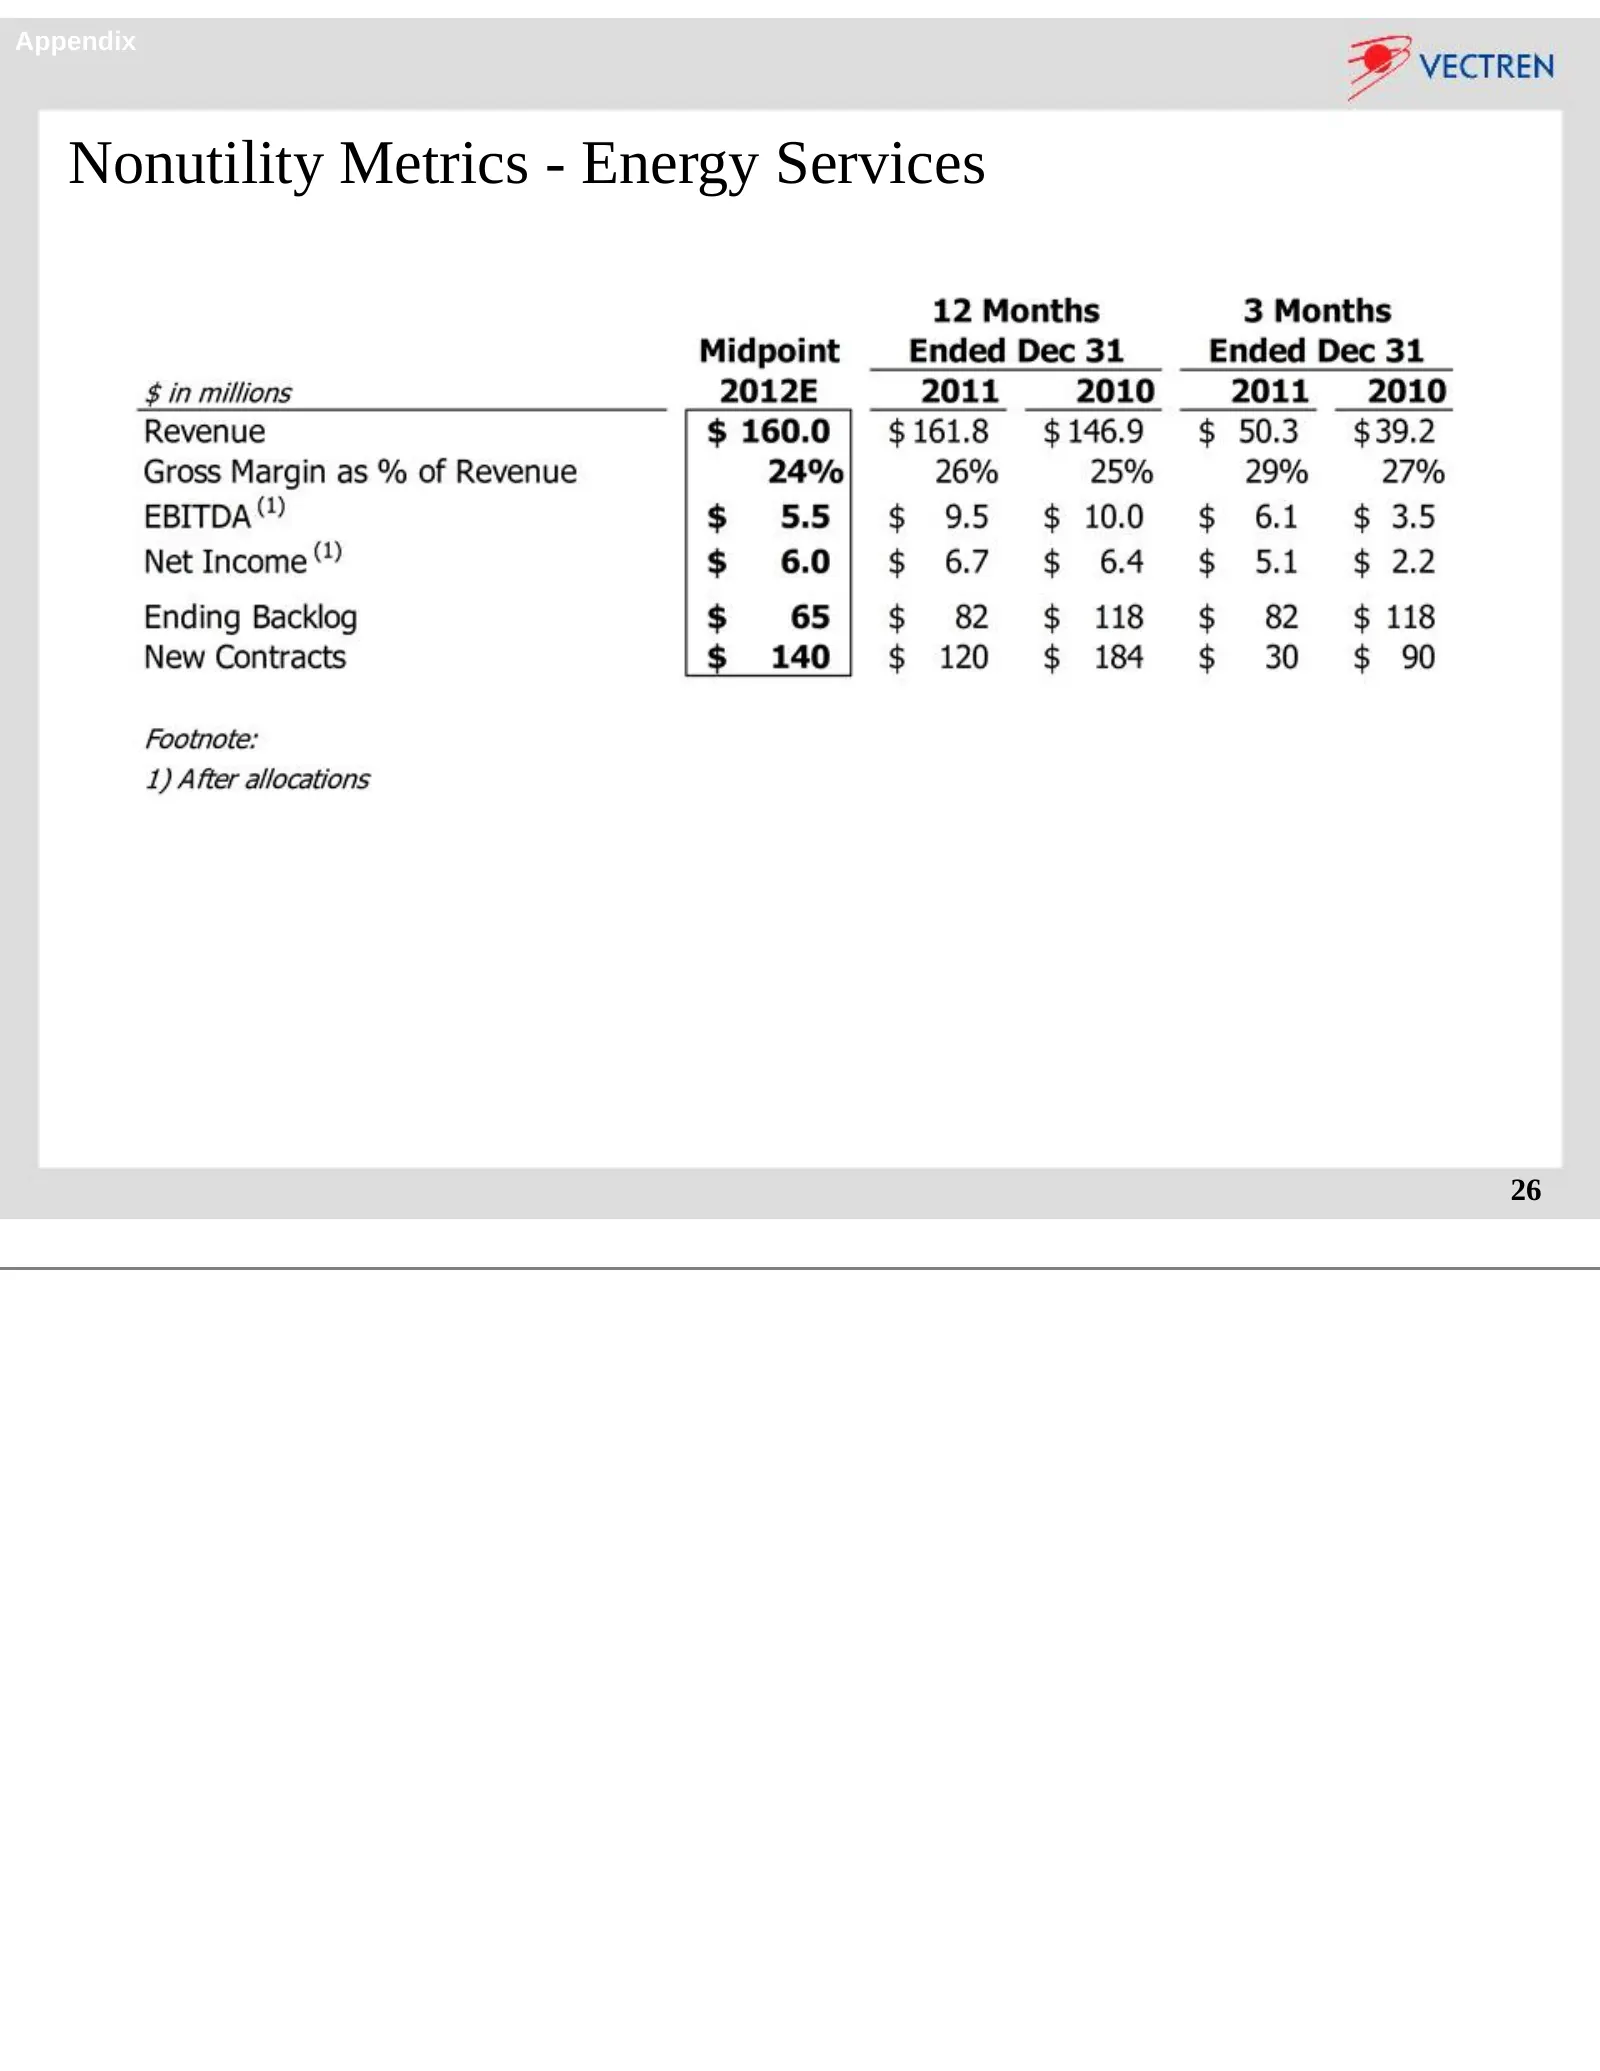
Nonutility Outlook Energy Services - Energy Systems Group (ESG) Ø 2012 projected earnings contribution of ~$6 million • Performance contracting backlog has remained strong at $82 million at 12/31/11 • Benefits from renewable energy projects’ tax credits & energy efficiency projects’ tax deductions Ø
Slide 14: Nonutility Outlook - Coal Mining
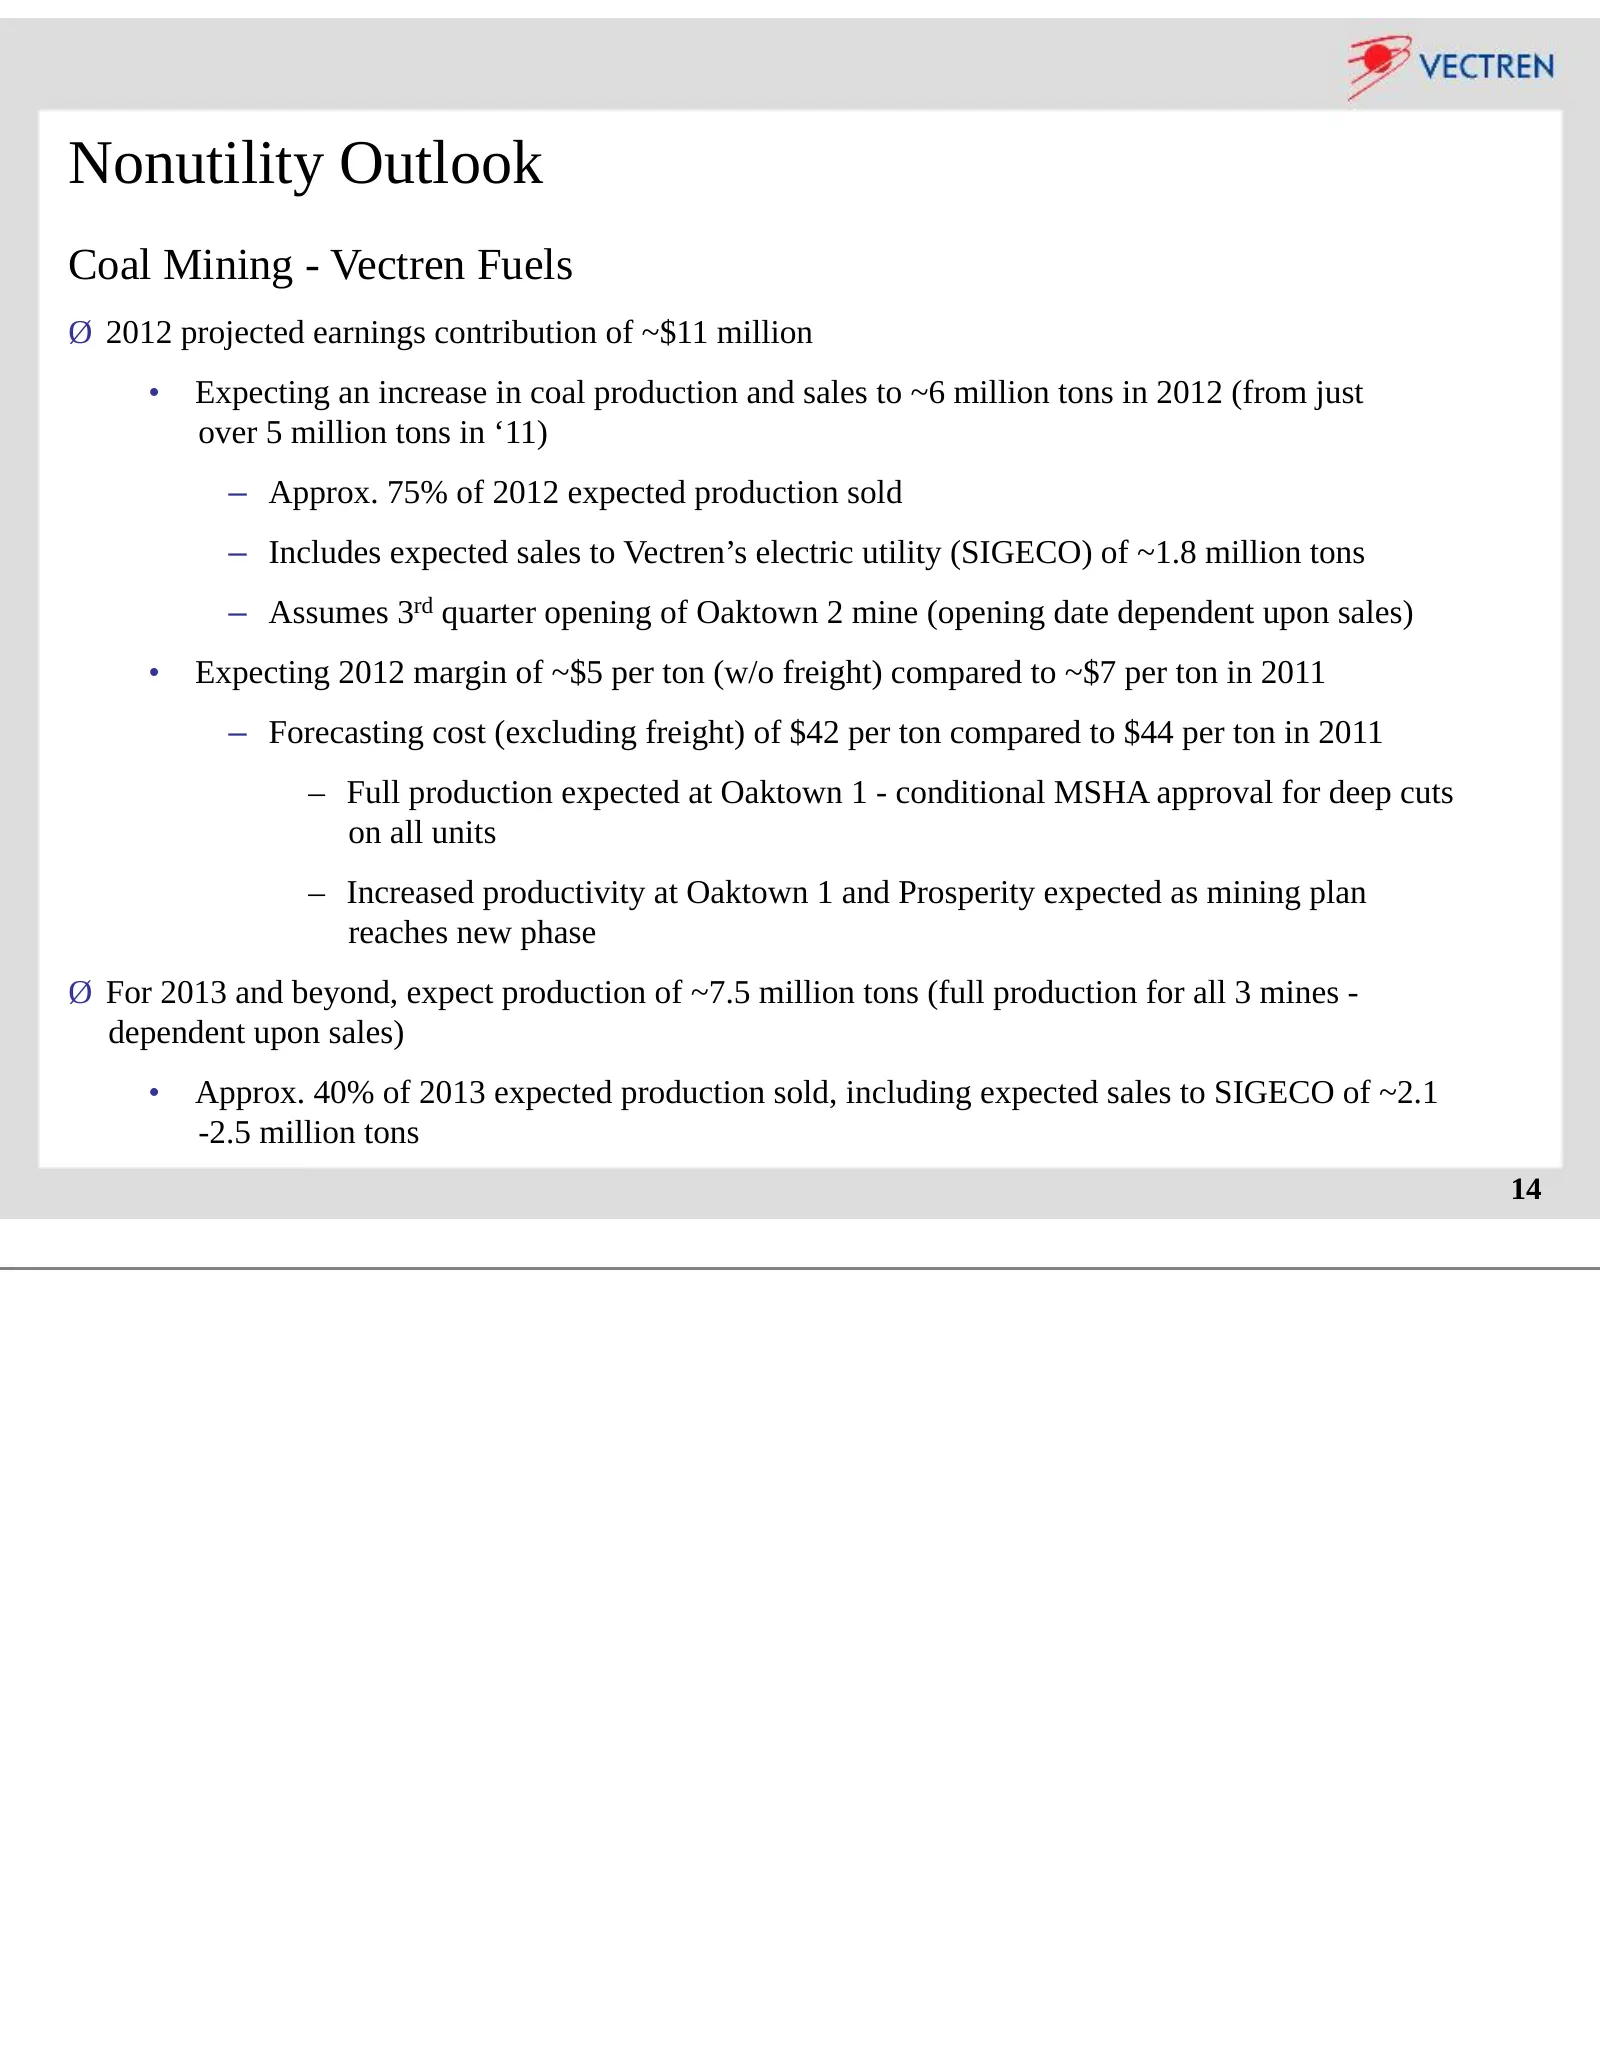
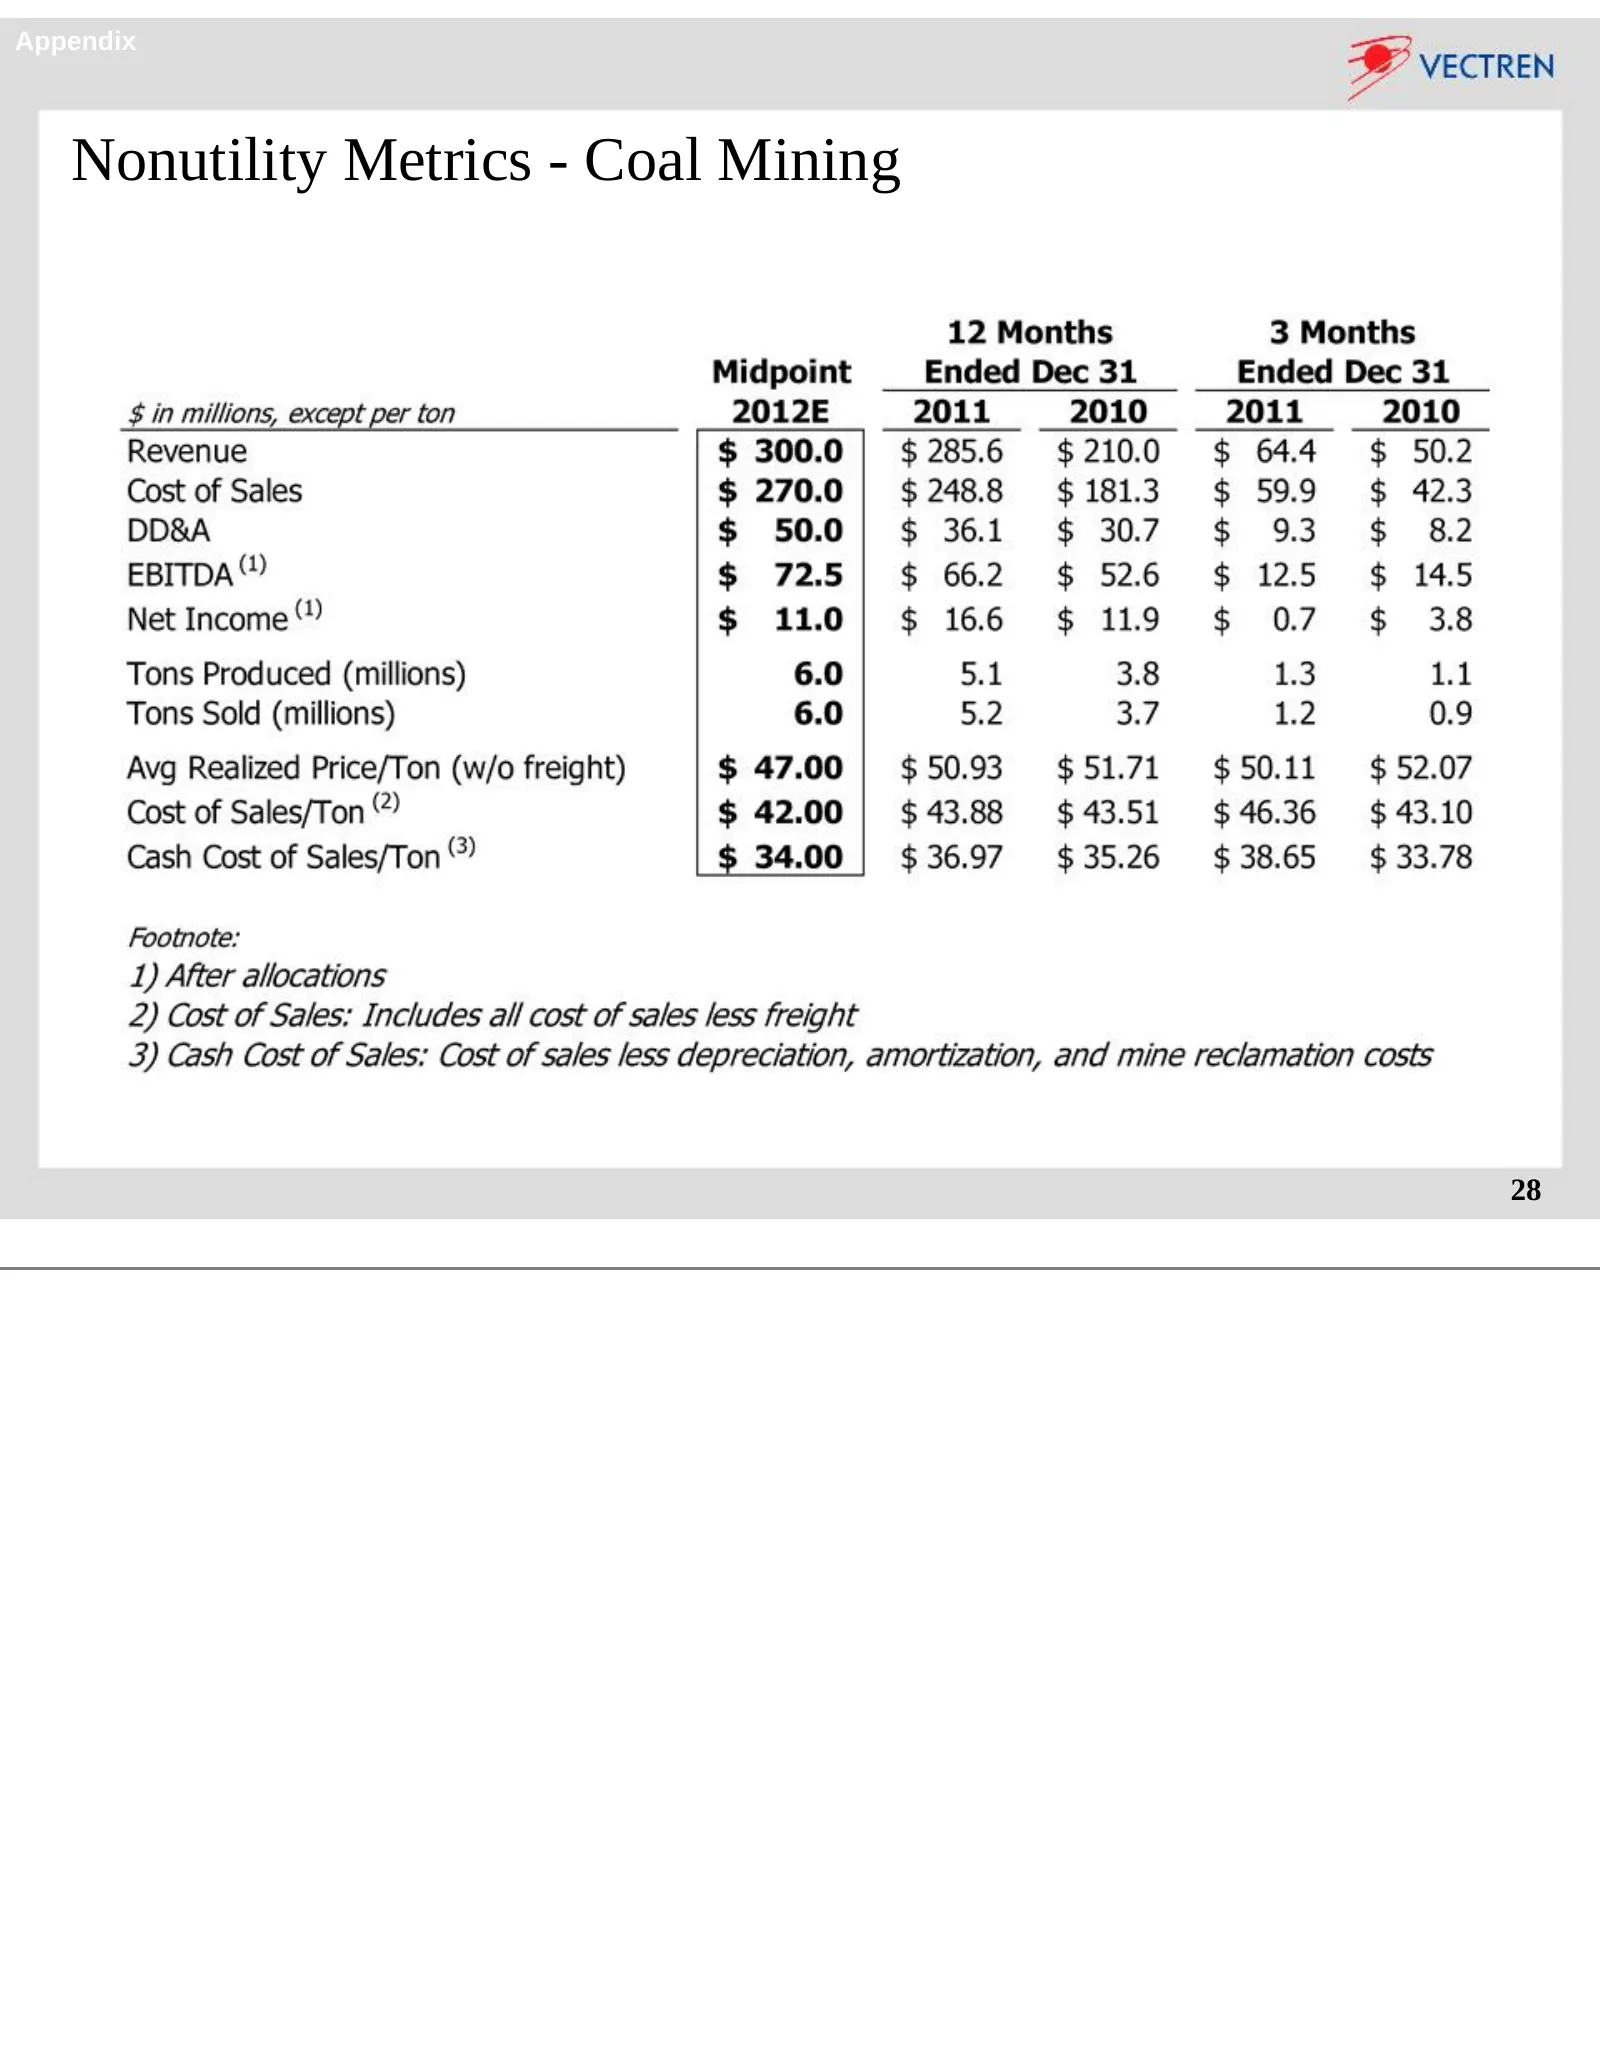
Nonutility Outlook Coal Mining - Vectren Fuels Ø 2012 projected earnings contribution of ~$11 million • Expecting an increase in coal production and sales to ~6 million tons in 2012 (from just over 5 million tons in ‘11) – Approx. 75% of 2012 expected production sold – Includes expected sales to Vec
Slide 15: Nonutility Outlook - Energy Marketing
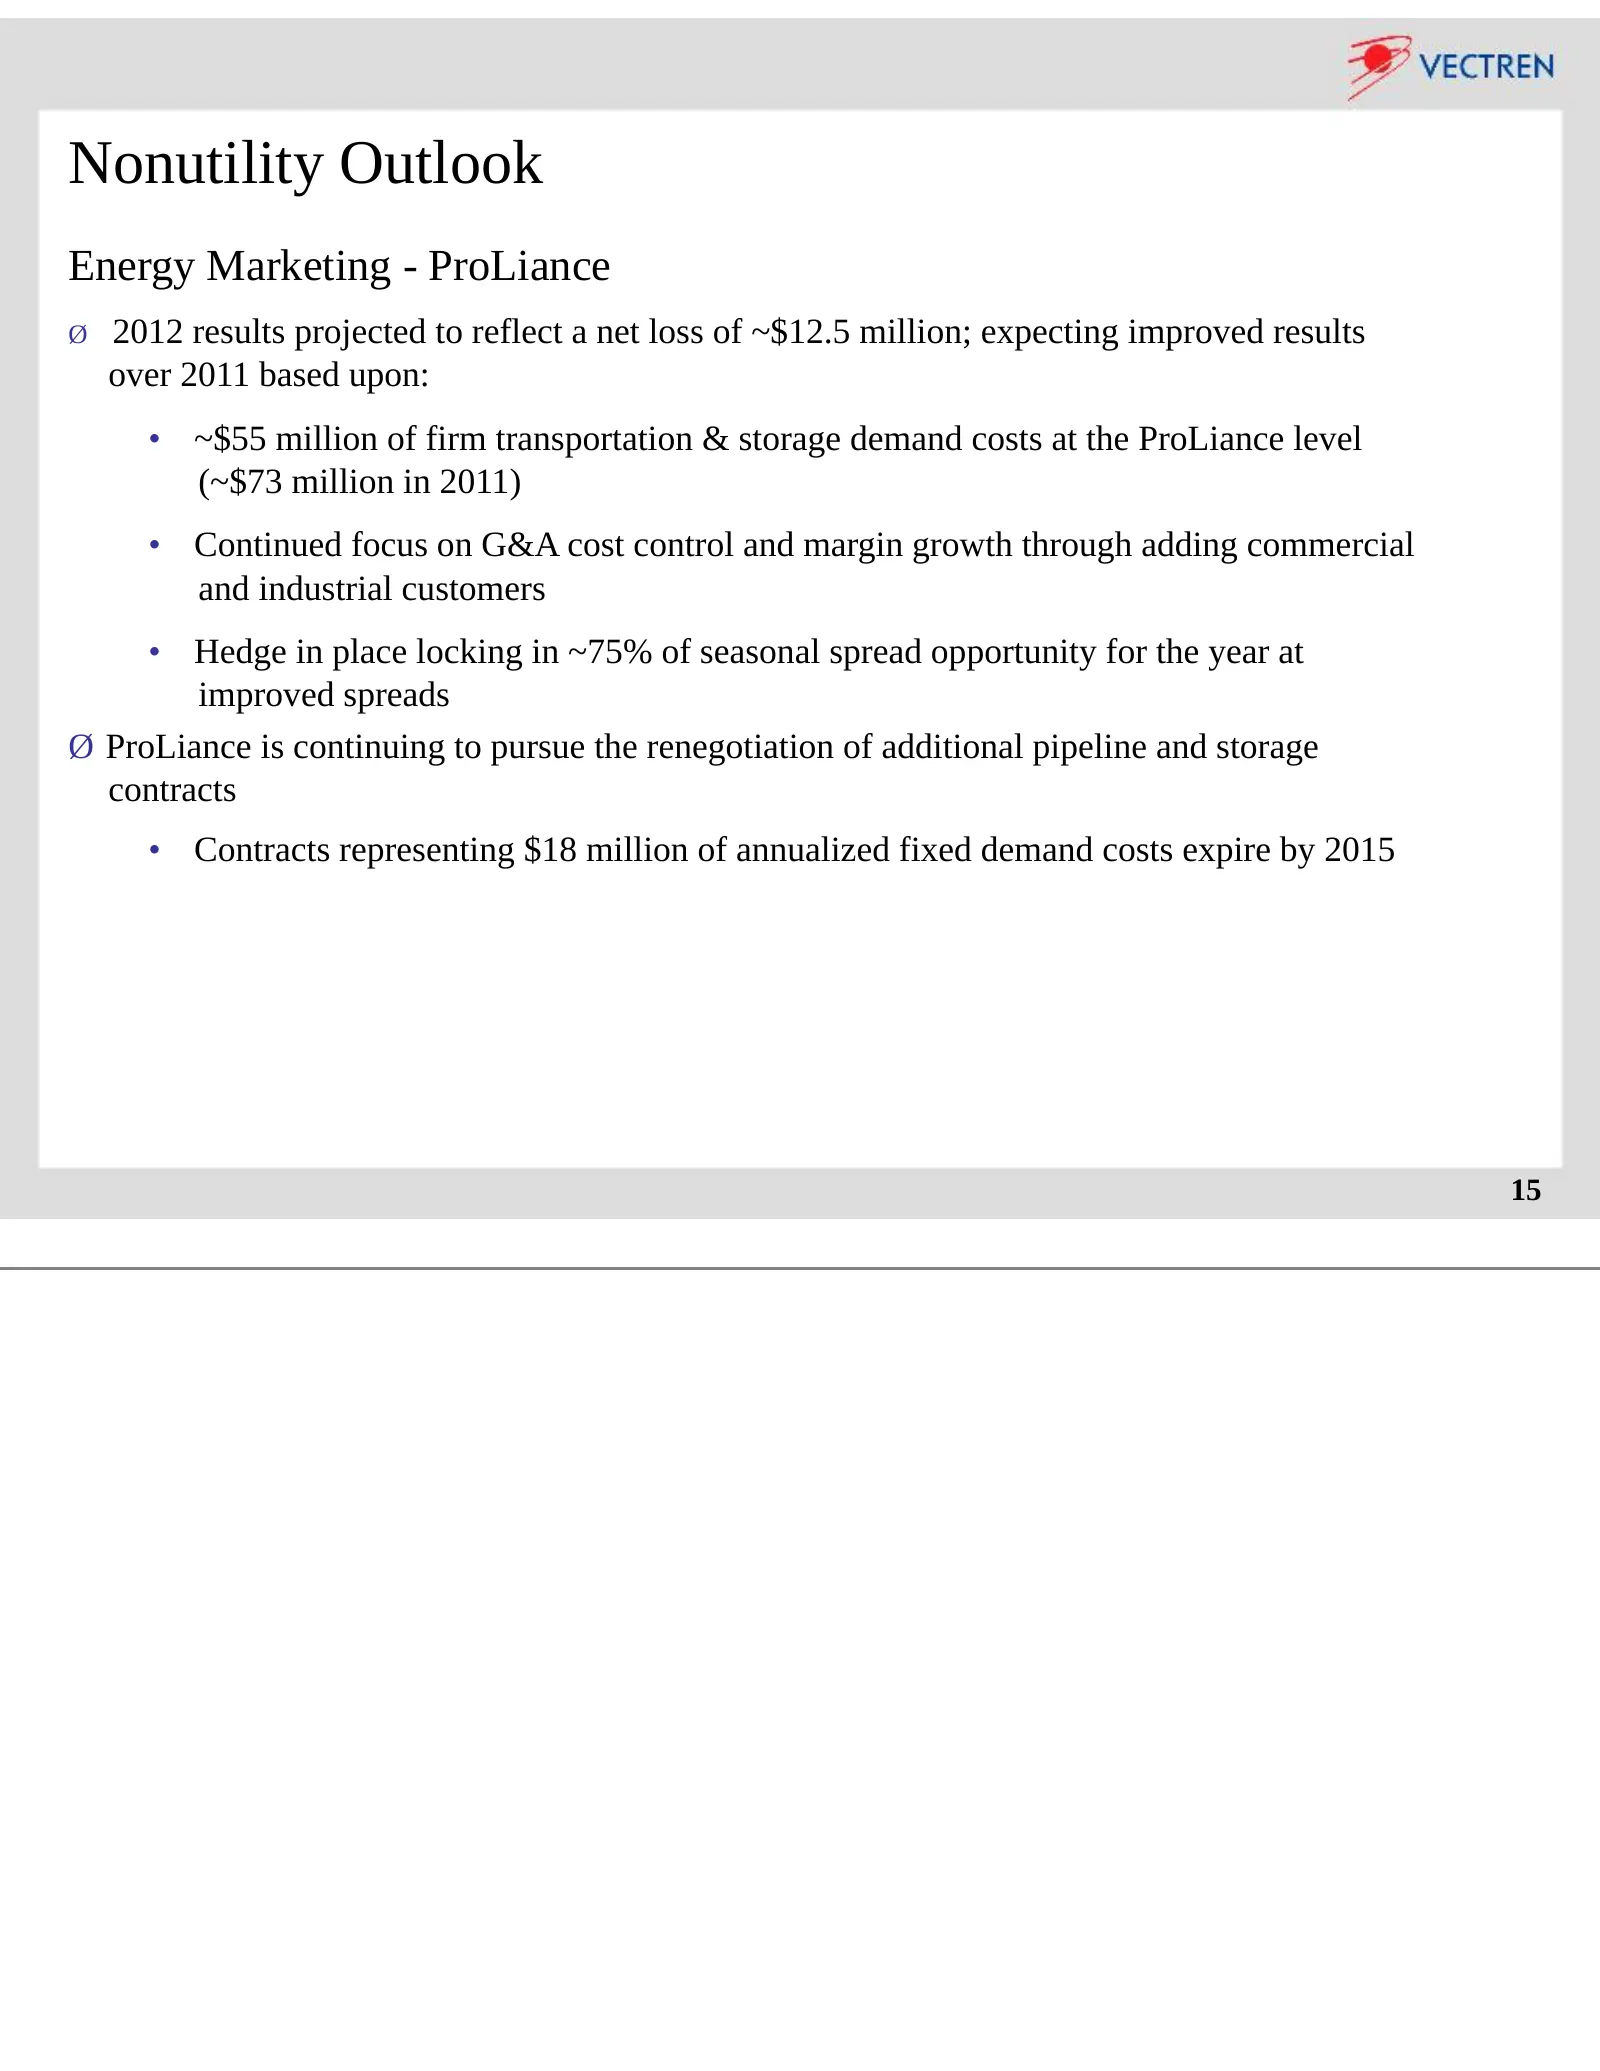
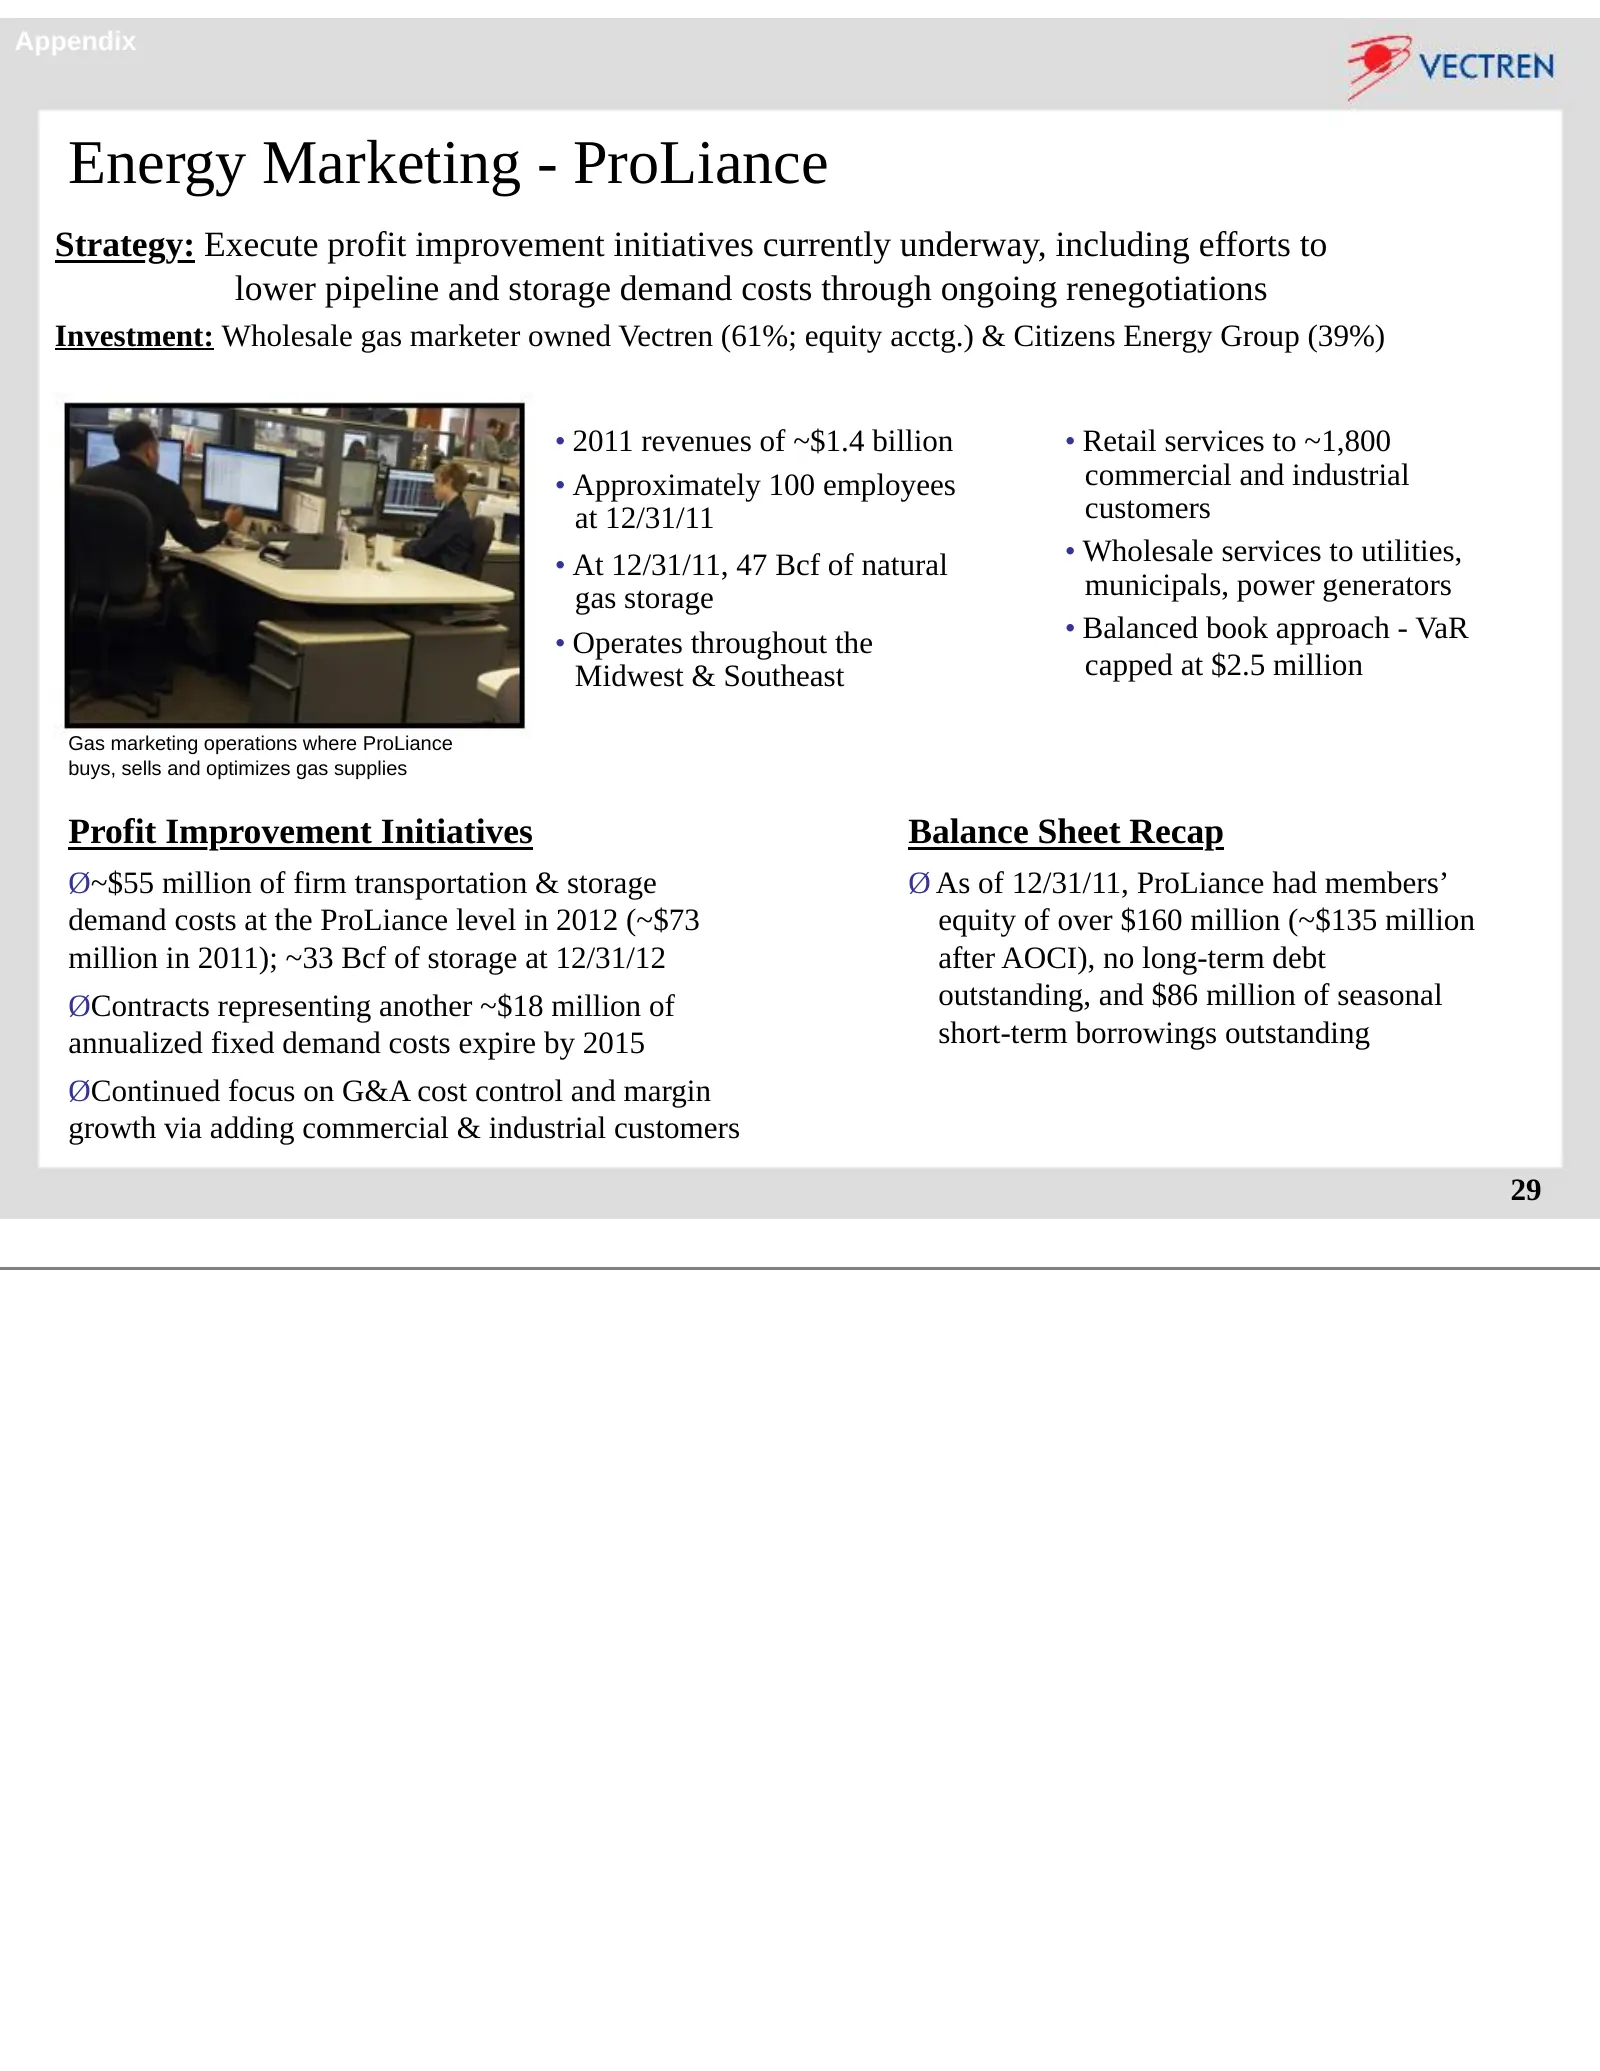
Nonutility Outlook Energy Marketing - ProLiance Ø 2012 results projected to reflect a net loss of ~$12.5 million; expecting improved results over 2011 based upon: • ~$55 million of firm transportation & storage demand costs at the ProLiance level (~$73 million in 2011) • Continued focus on G&A cost
Slide 16: Vectren: Strength, Stability, Utility
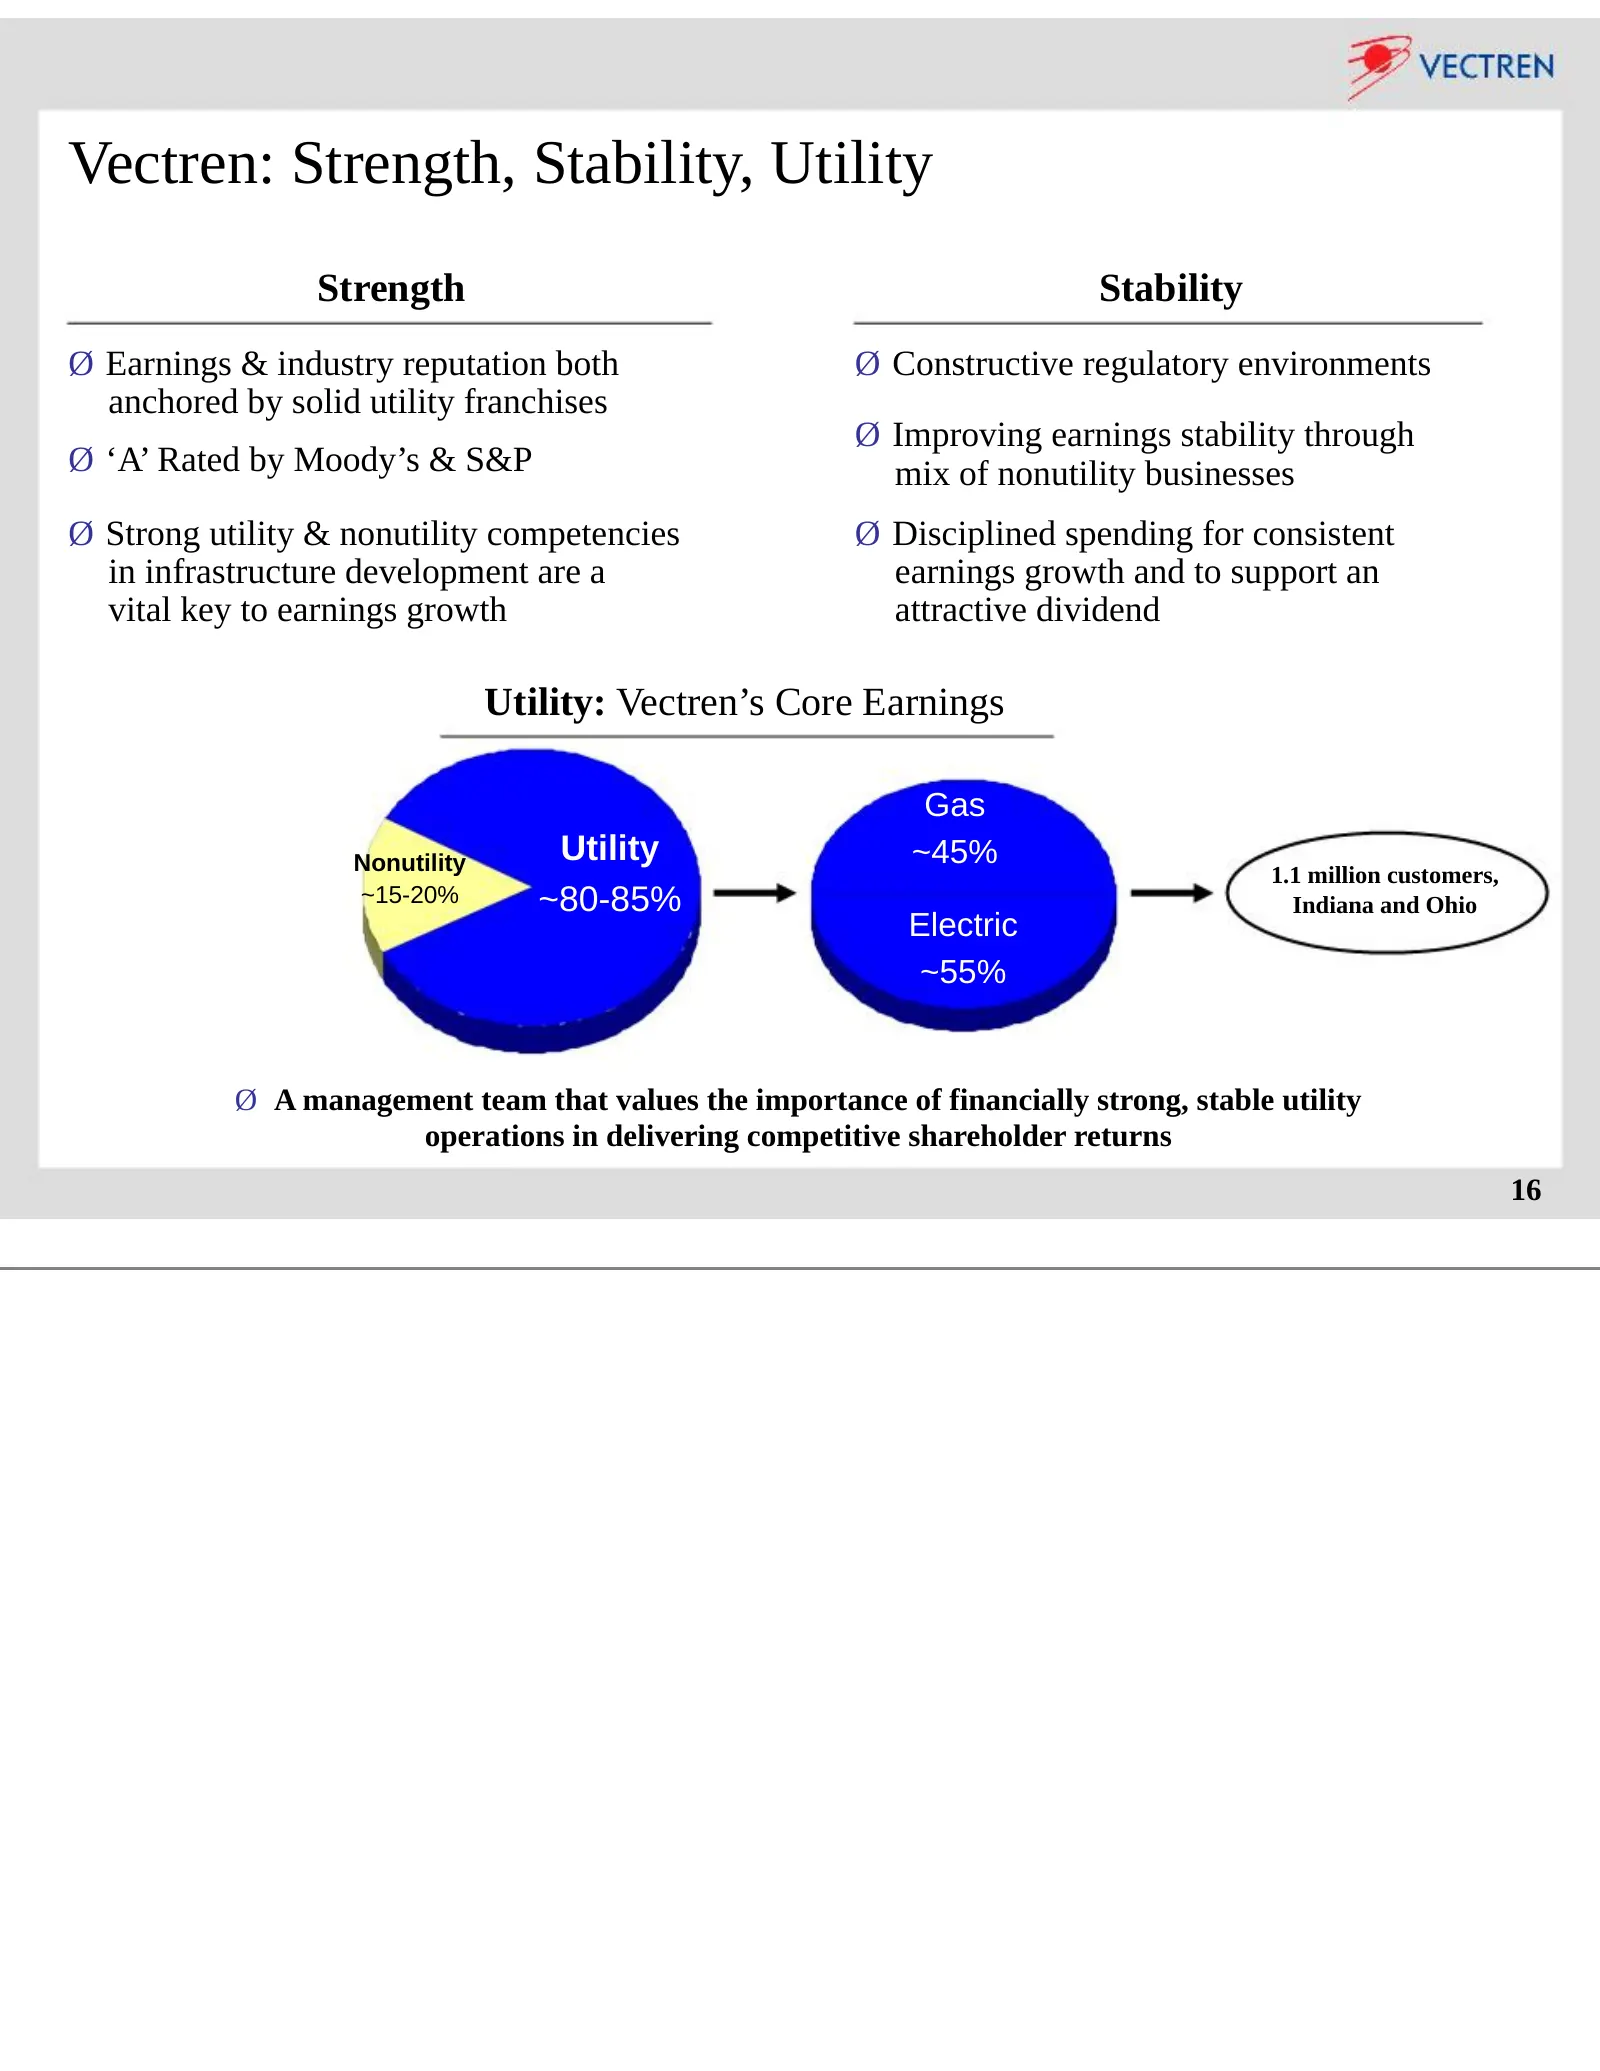
Vectren: Strength, Stability, Utility Strength Stability Ø Earnings & industry reputation both Ø Constructive regulatory environments anchored by solid utility franchises Ø Improving earnings stability through Ø ‘A’ Rated by Moody’s & S&P mix of nonutility businesses Ø Strong utility & nonutility co
Slide 17: Appendix
@ VECTREN Appendix 17
Slide 18: Consolidated 2011 Results
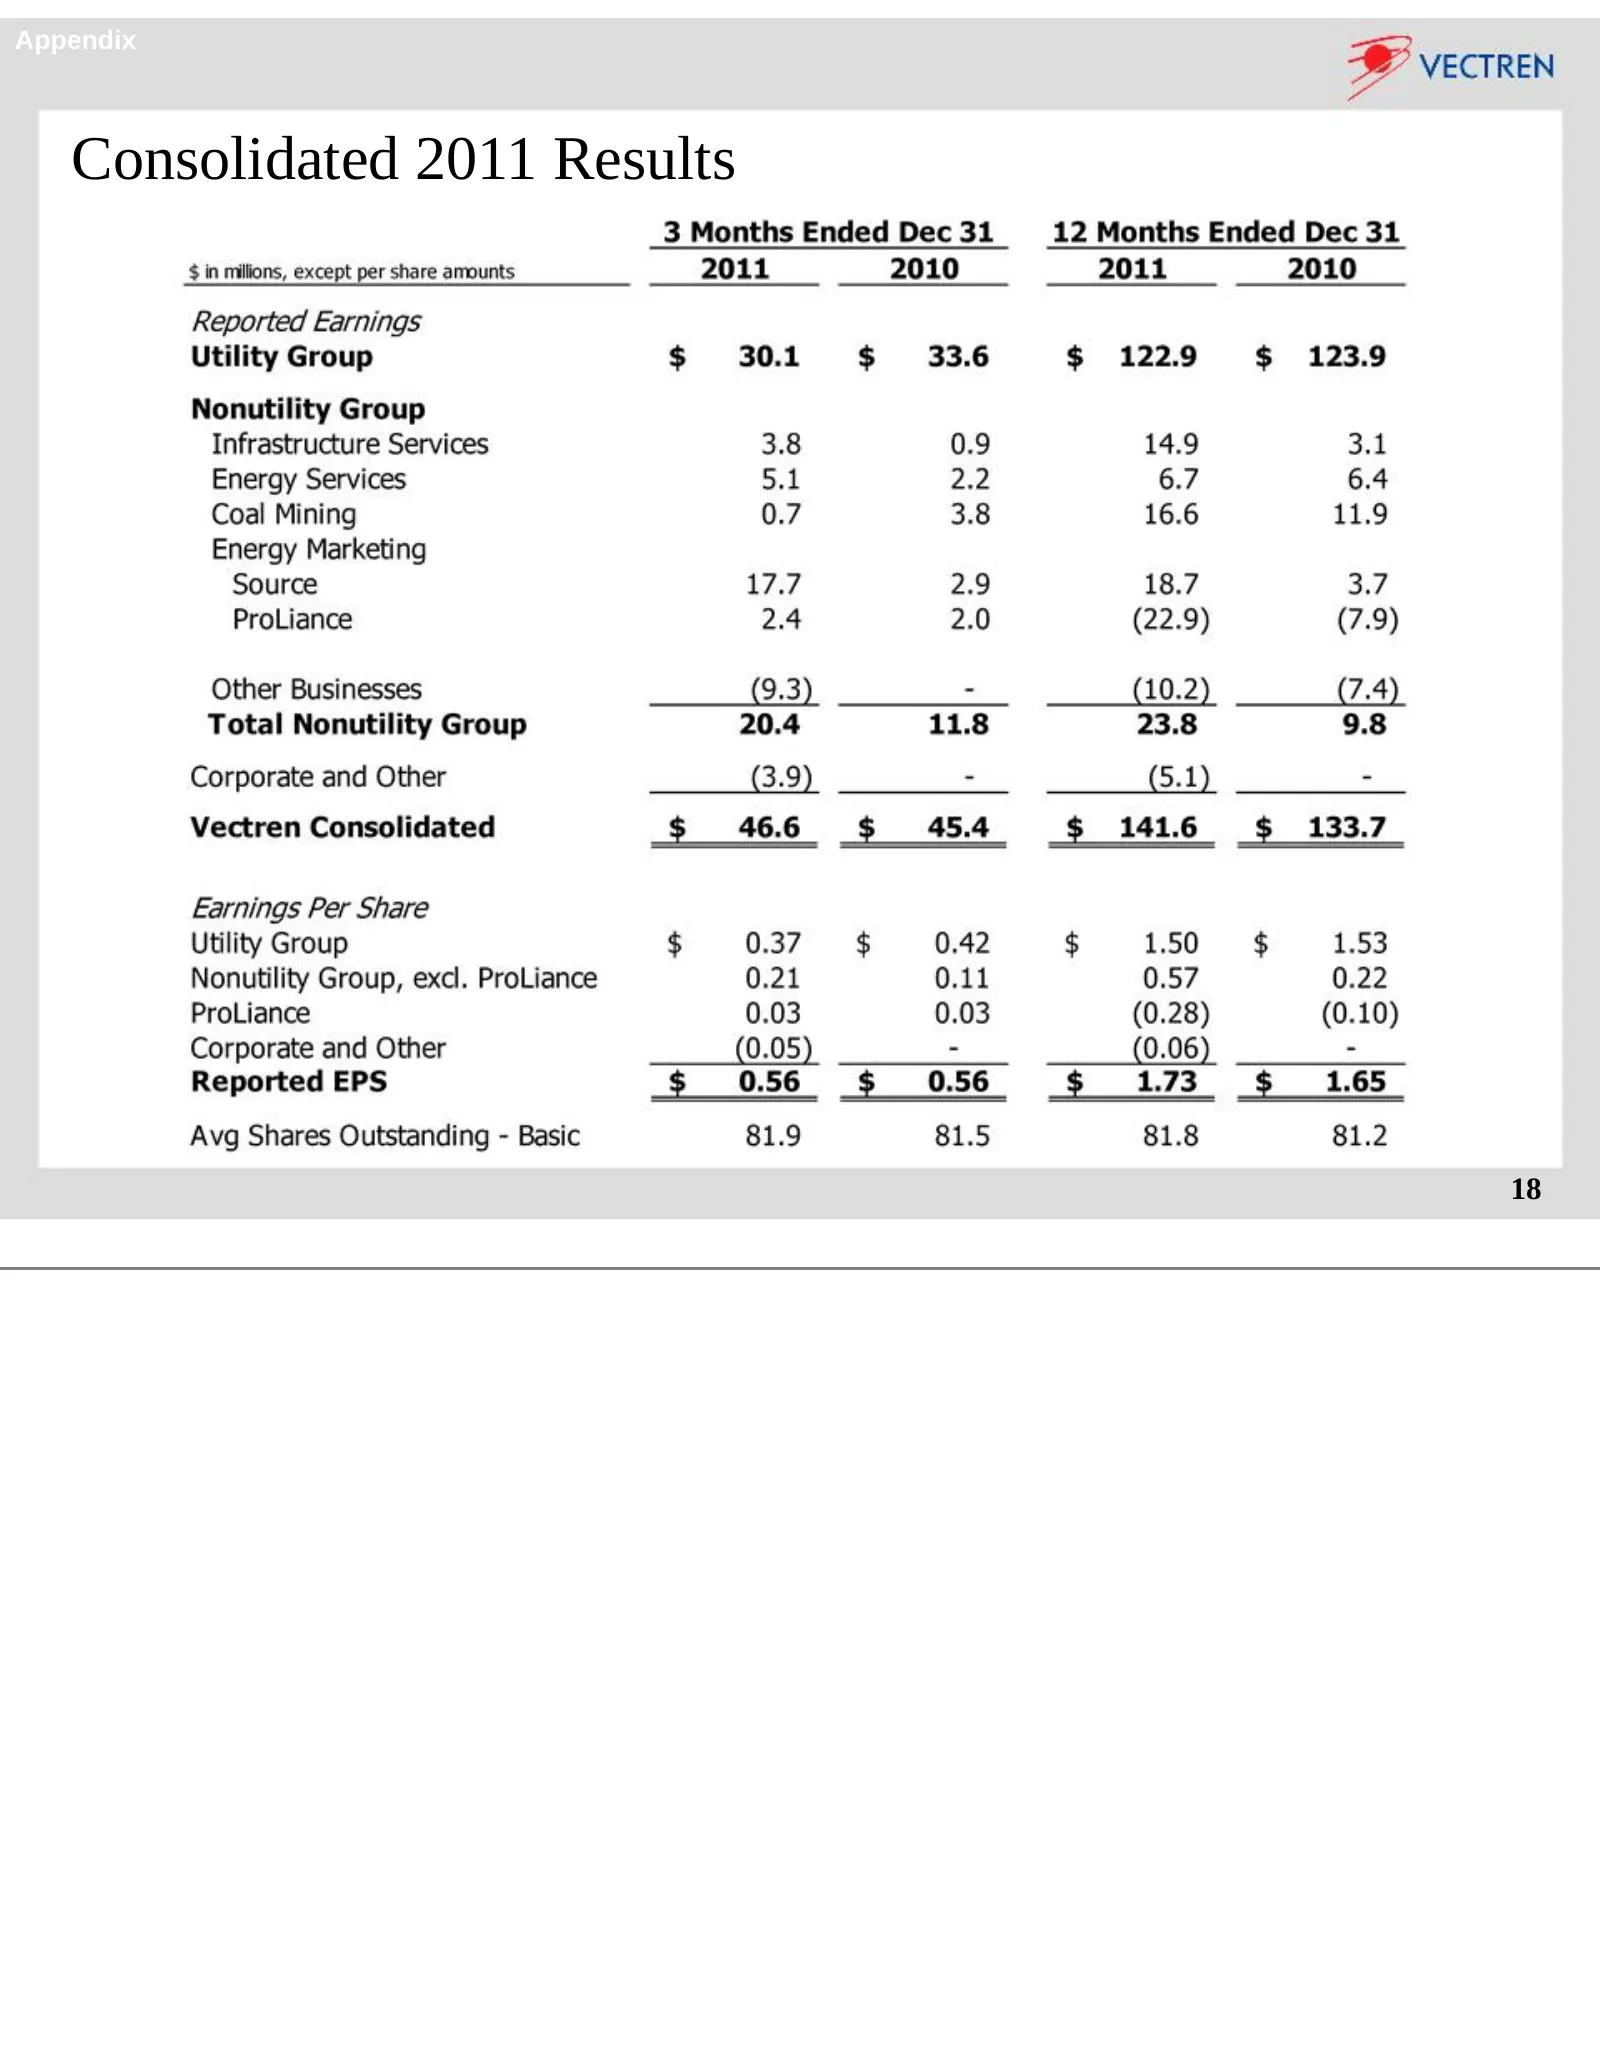
Appendix Consolidated 2011 Results 18
Slide 19: Review of 2011 Highlights
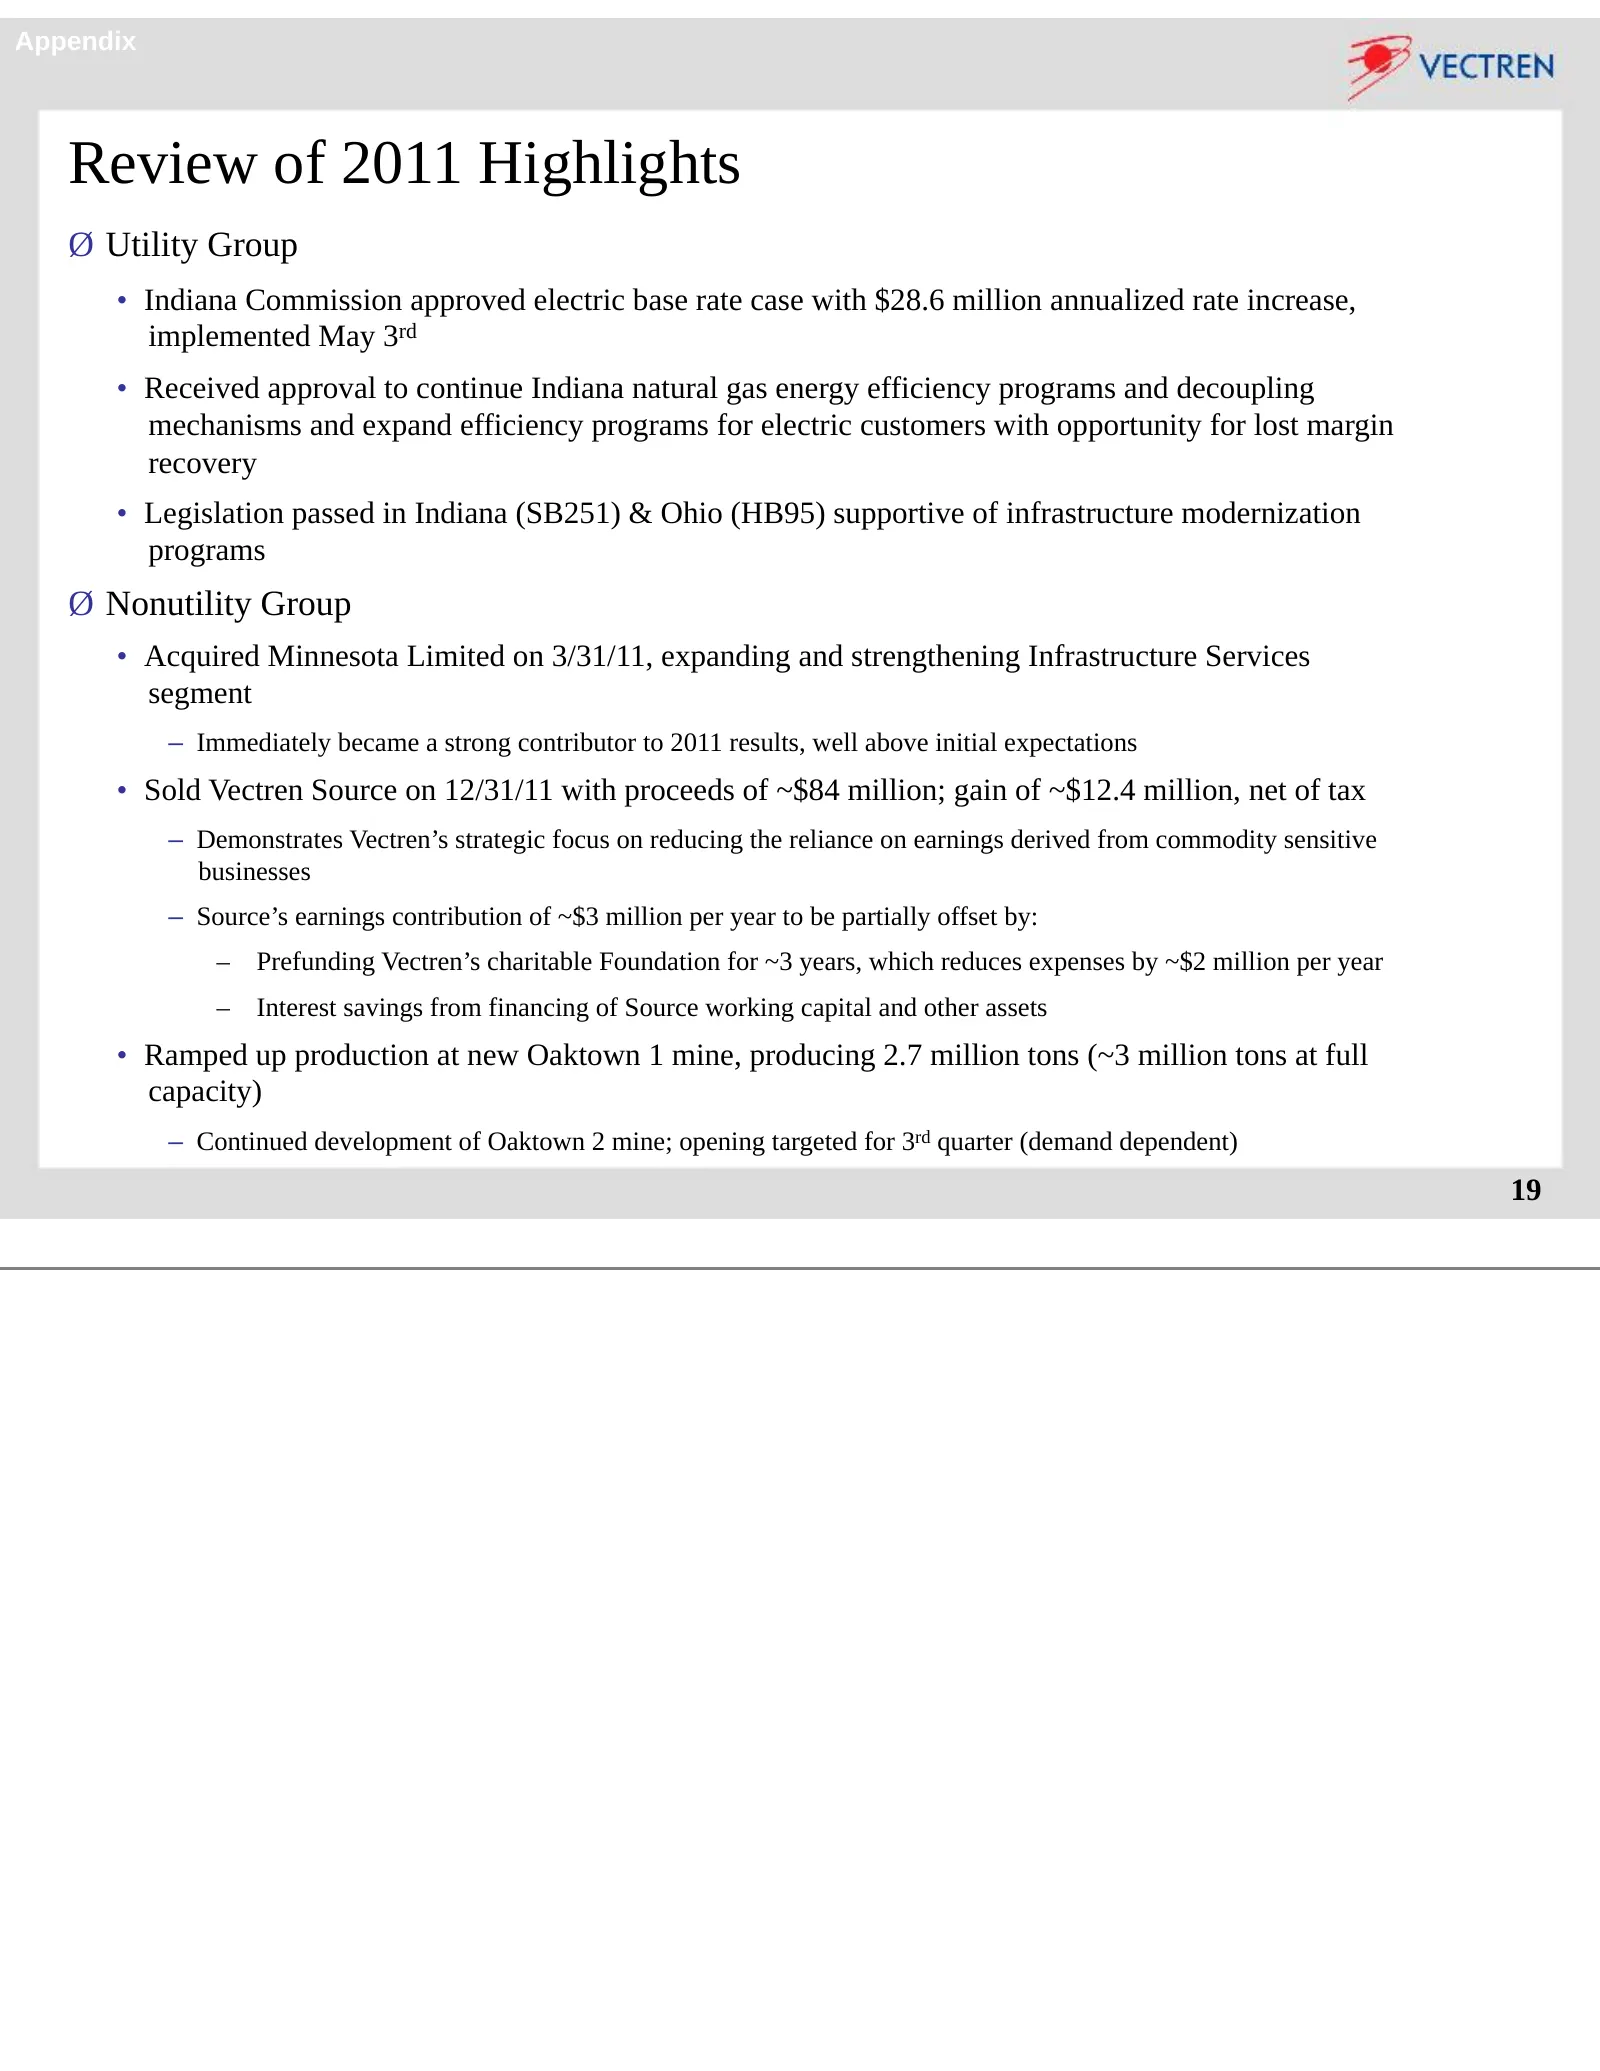
Appendix Review of 2011 Highlights Ø Utility Group • Indiana Commission approved electric base rate case with $28.6 million annualized rate increase, implemented May 3rd • Received approval to continue Indiana natural gas energy efficiency programs and decoupling mechanisms and expand efficiency pro
Slide 20: Review of 2011 Highlights - cont'd
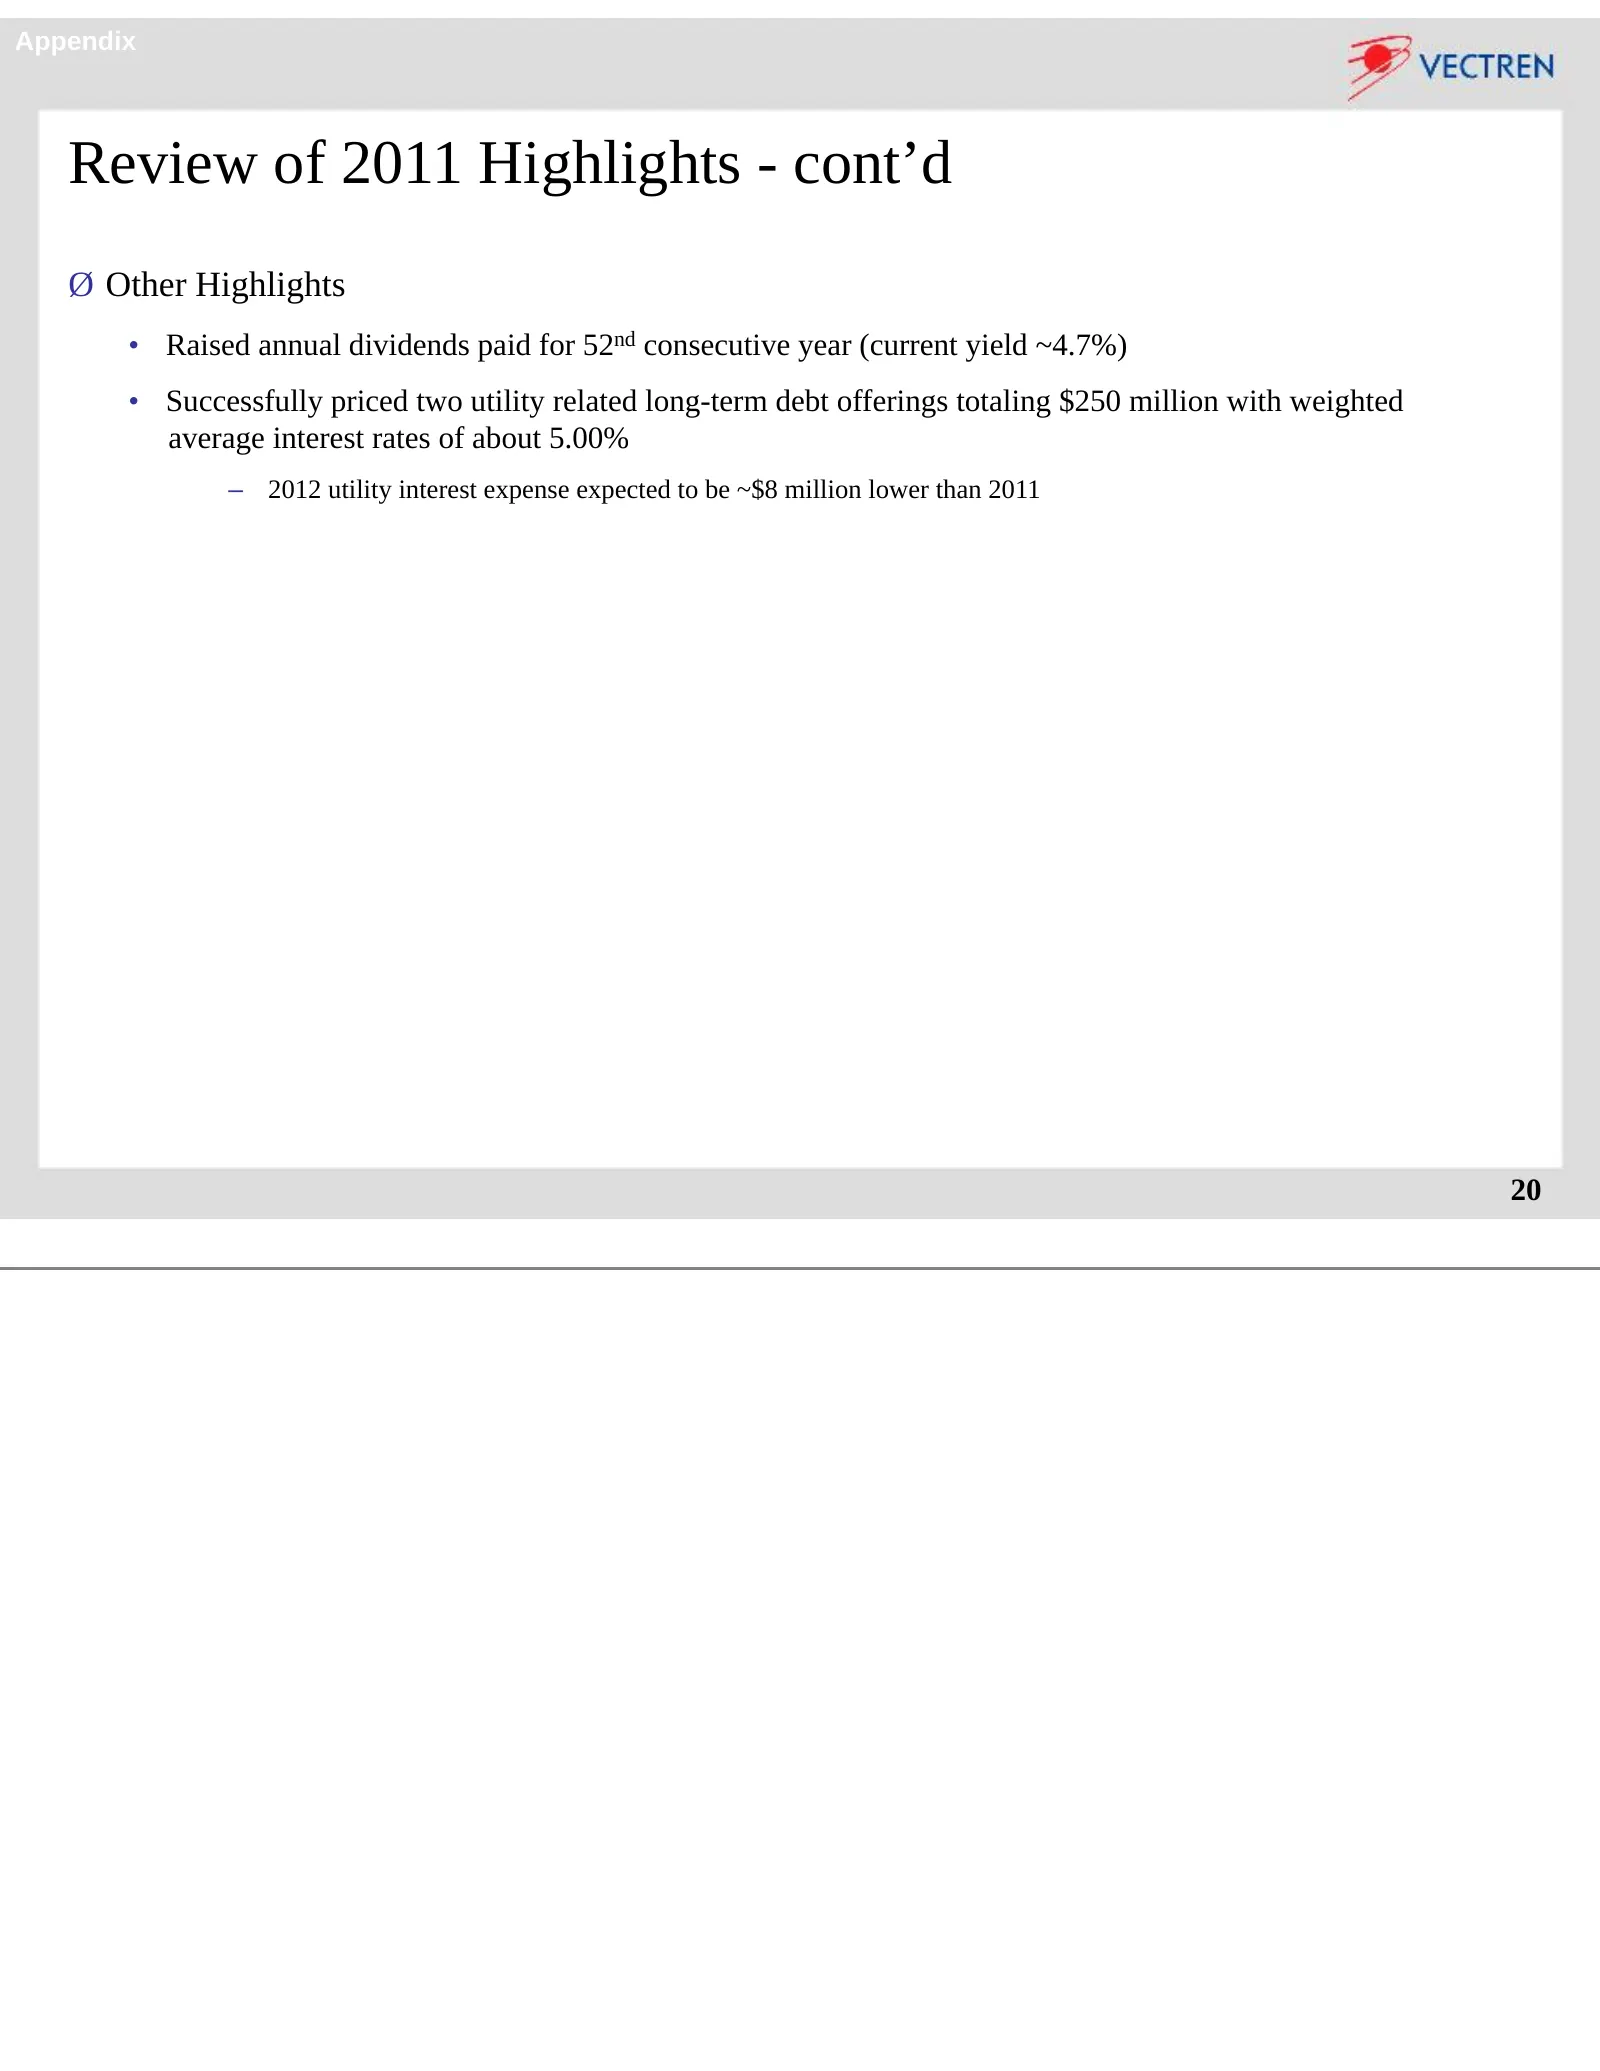
Appendix Review of 2011 Highlights - cont’d Ø Other Highlights • Raised annual dividends paid for 52nd consecutive year (current yield ~4.7%) • Successfully priced two utility related long-term debt offerings totaling $250 million with weighted average interest rates of about 5.00% – 2012 utility in
Slide 21: Vectren's Utility Group - Service Territories
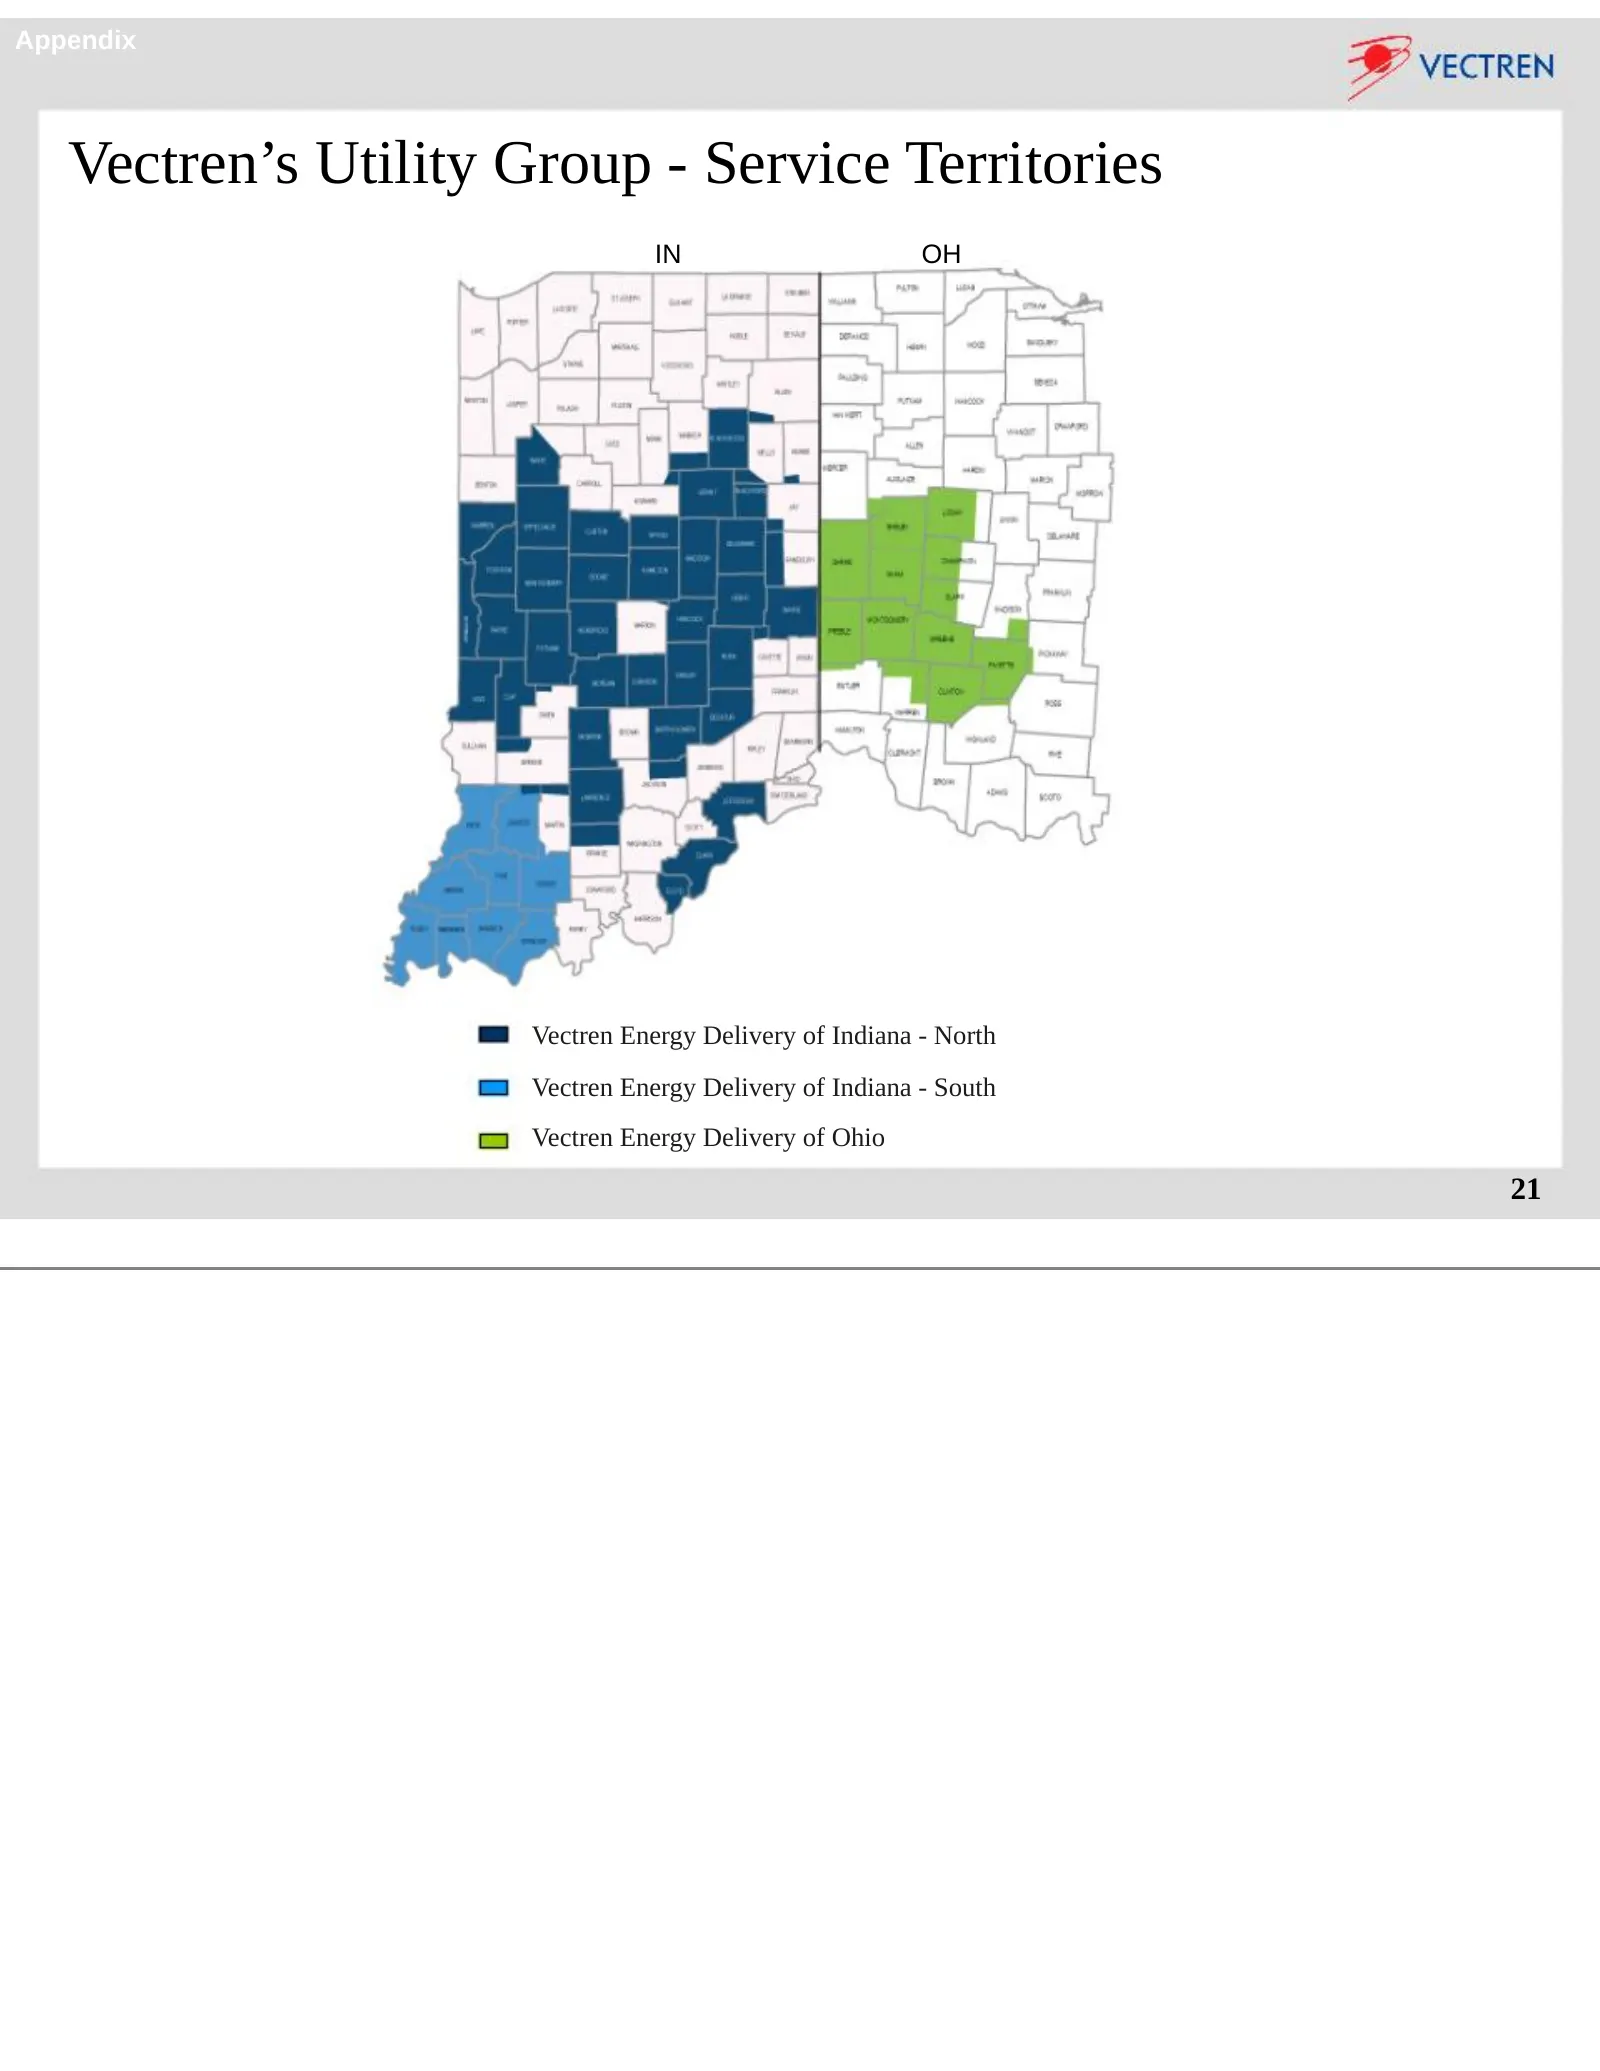
Appendix Vectren’s Utility Group - Service Territories IN OH Vectren Energy Delivery of Indiana - North Vectren Energy Delivery of Indiana - South Vectren Energy Delivery of Ohio 21
Slide 22: Utility Investments - Recent History & Near Future
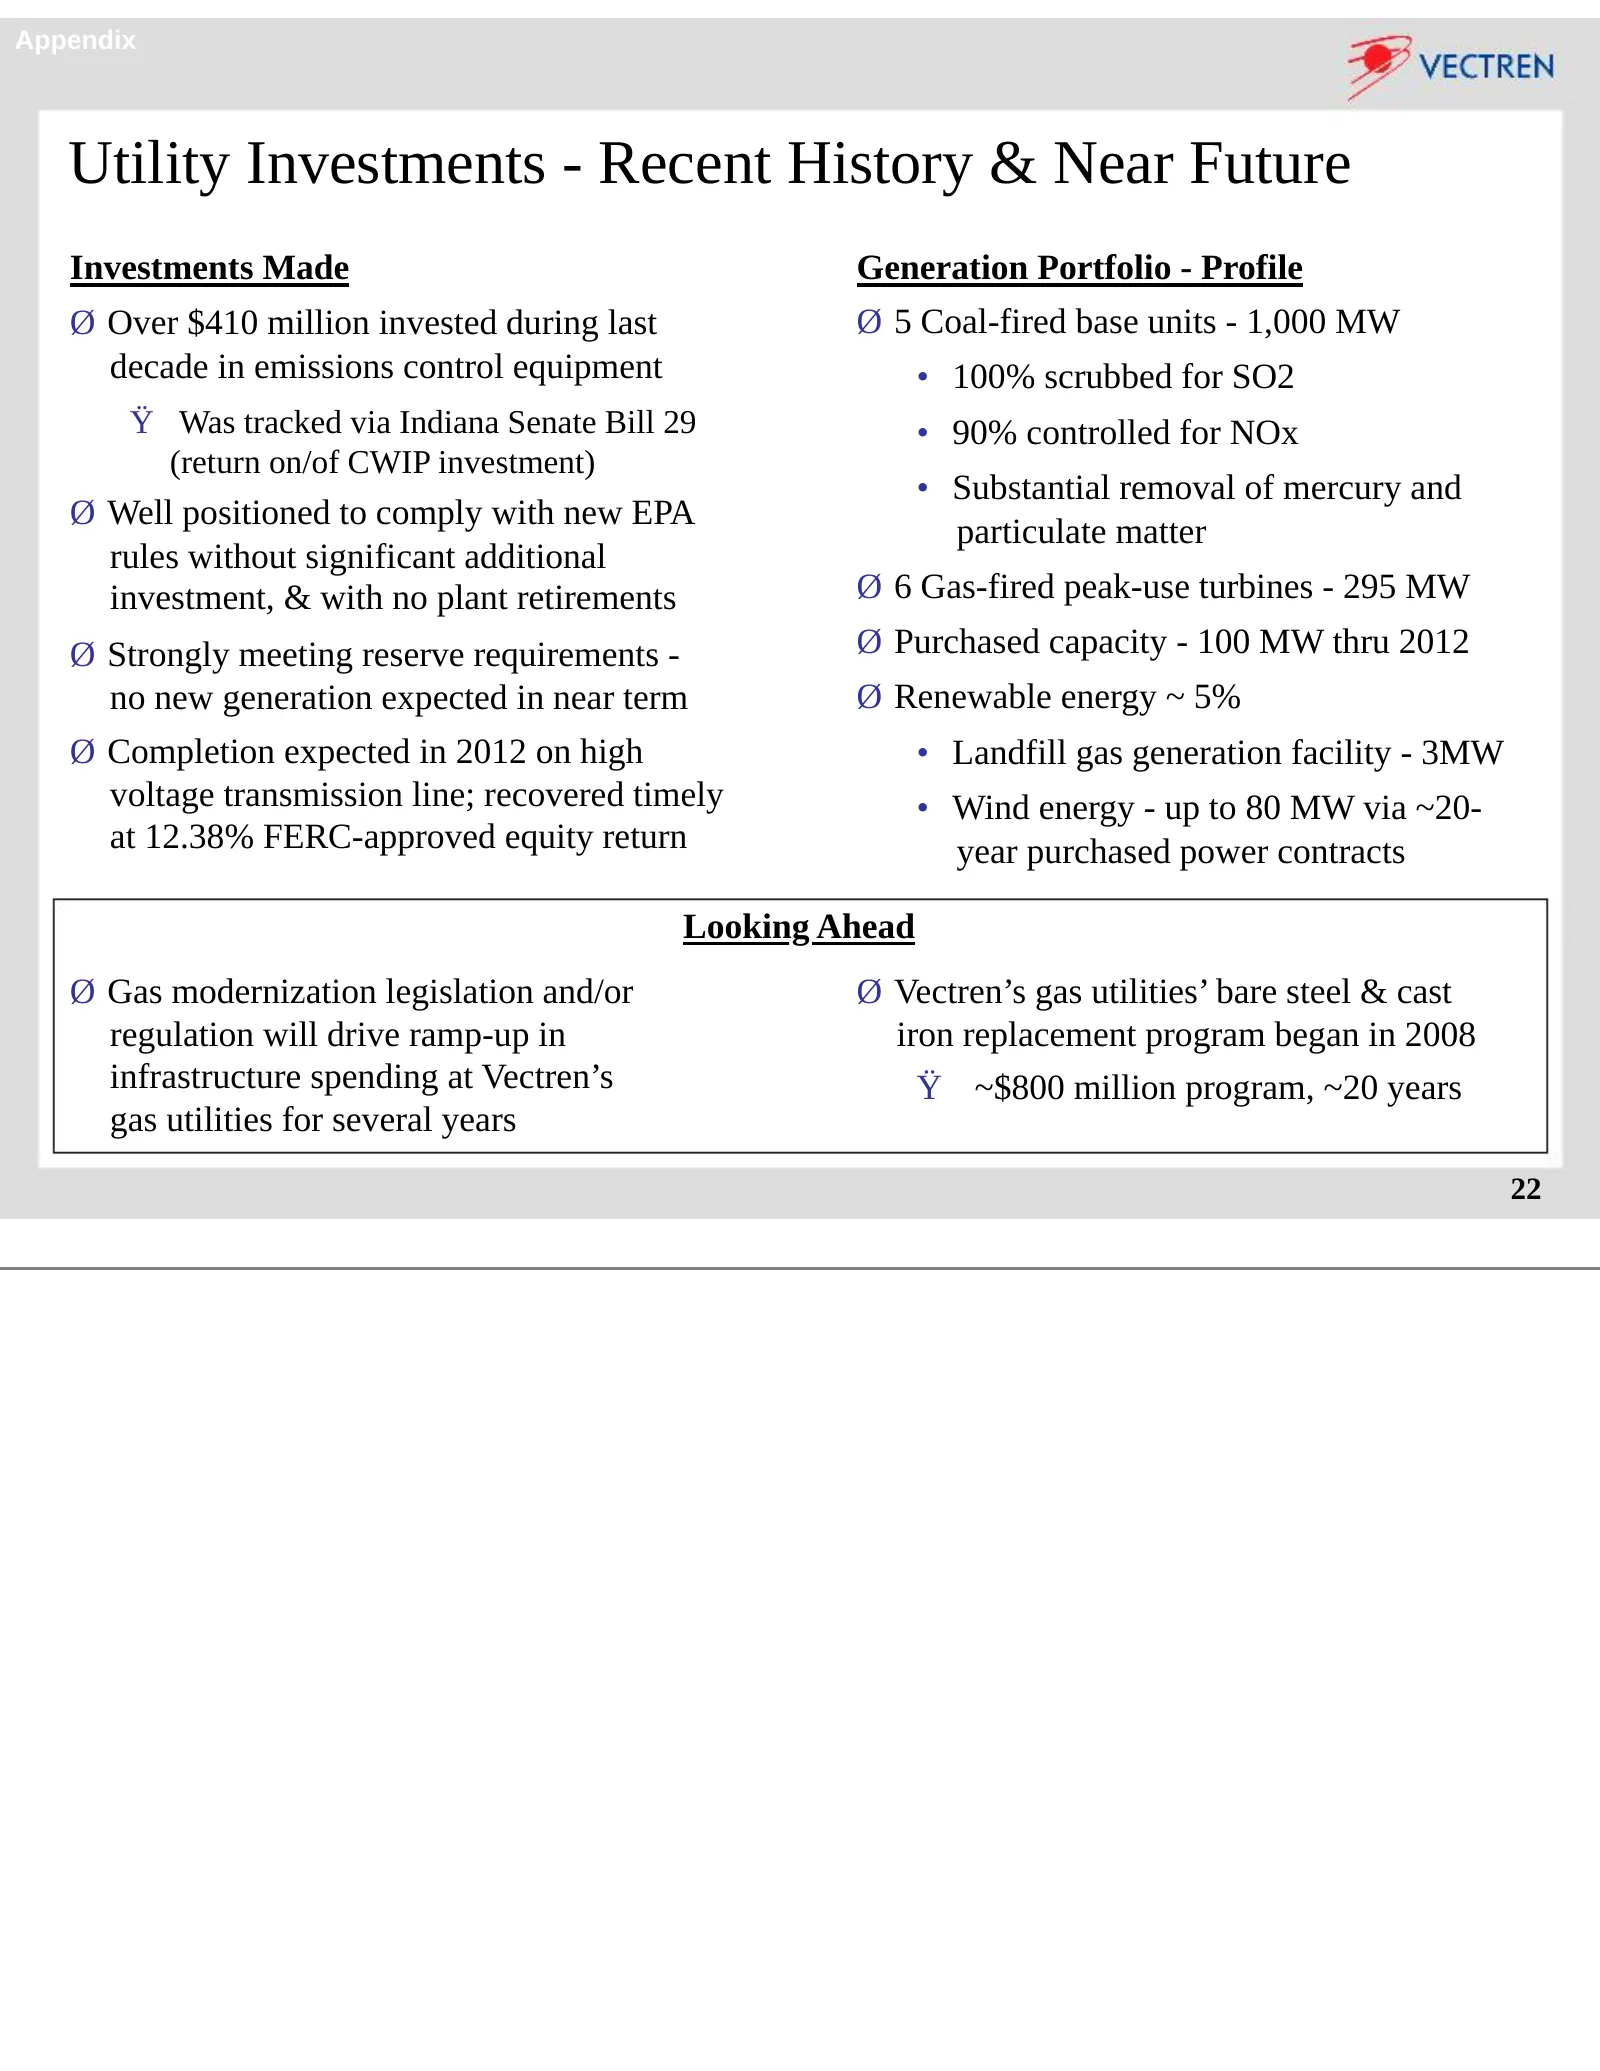
Appendix Utility Investments - Recent History & Near Future Investments Made Generation Portfolio - Profile Ø Over $410 million invested during last Ø 5 Coal-fired base units - 1,000 MW decade in emissions control equipment • 100% scrubbed for SO2 Ÿ Was tracked via Indiana Senate Bill 29 • 90% contr

Slide 23: Infrastructure Services - Miller Pipeline & Minnesota Limited
Appendix Infrastructure Services - Miller Pipeline & Minnesota Limited Strategy: Drive business growth through sustainable, long-term customer relationships built upon high quality construction and customer service, and strategic acquisitions • 2011 net revenues of ~$370 million • Approximately ~2,6
Slide 24: Nonutility Metrics - Infrastructure Services
Appendix Nonutility Metrics - Infrastructure Services Metrics include results from Minnesota Limited following 3/31/2011 (acquisition date) 24
Slide 25: Energy Services - Energy Systems Group (ESG)
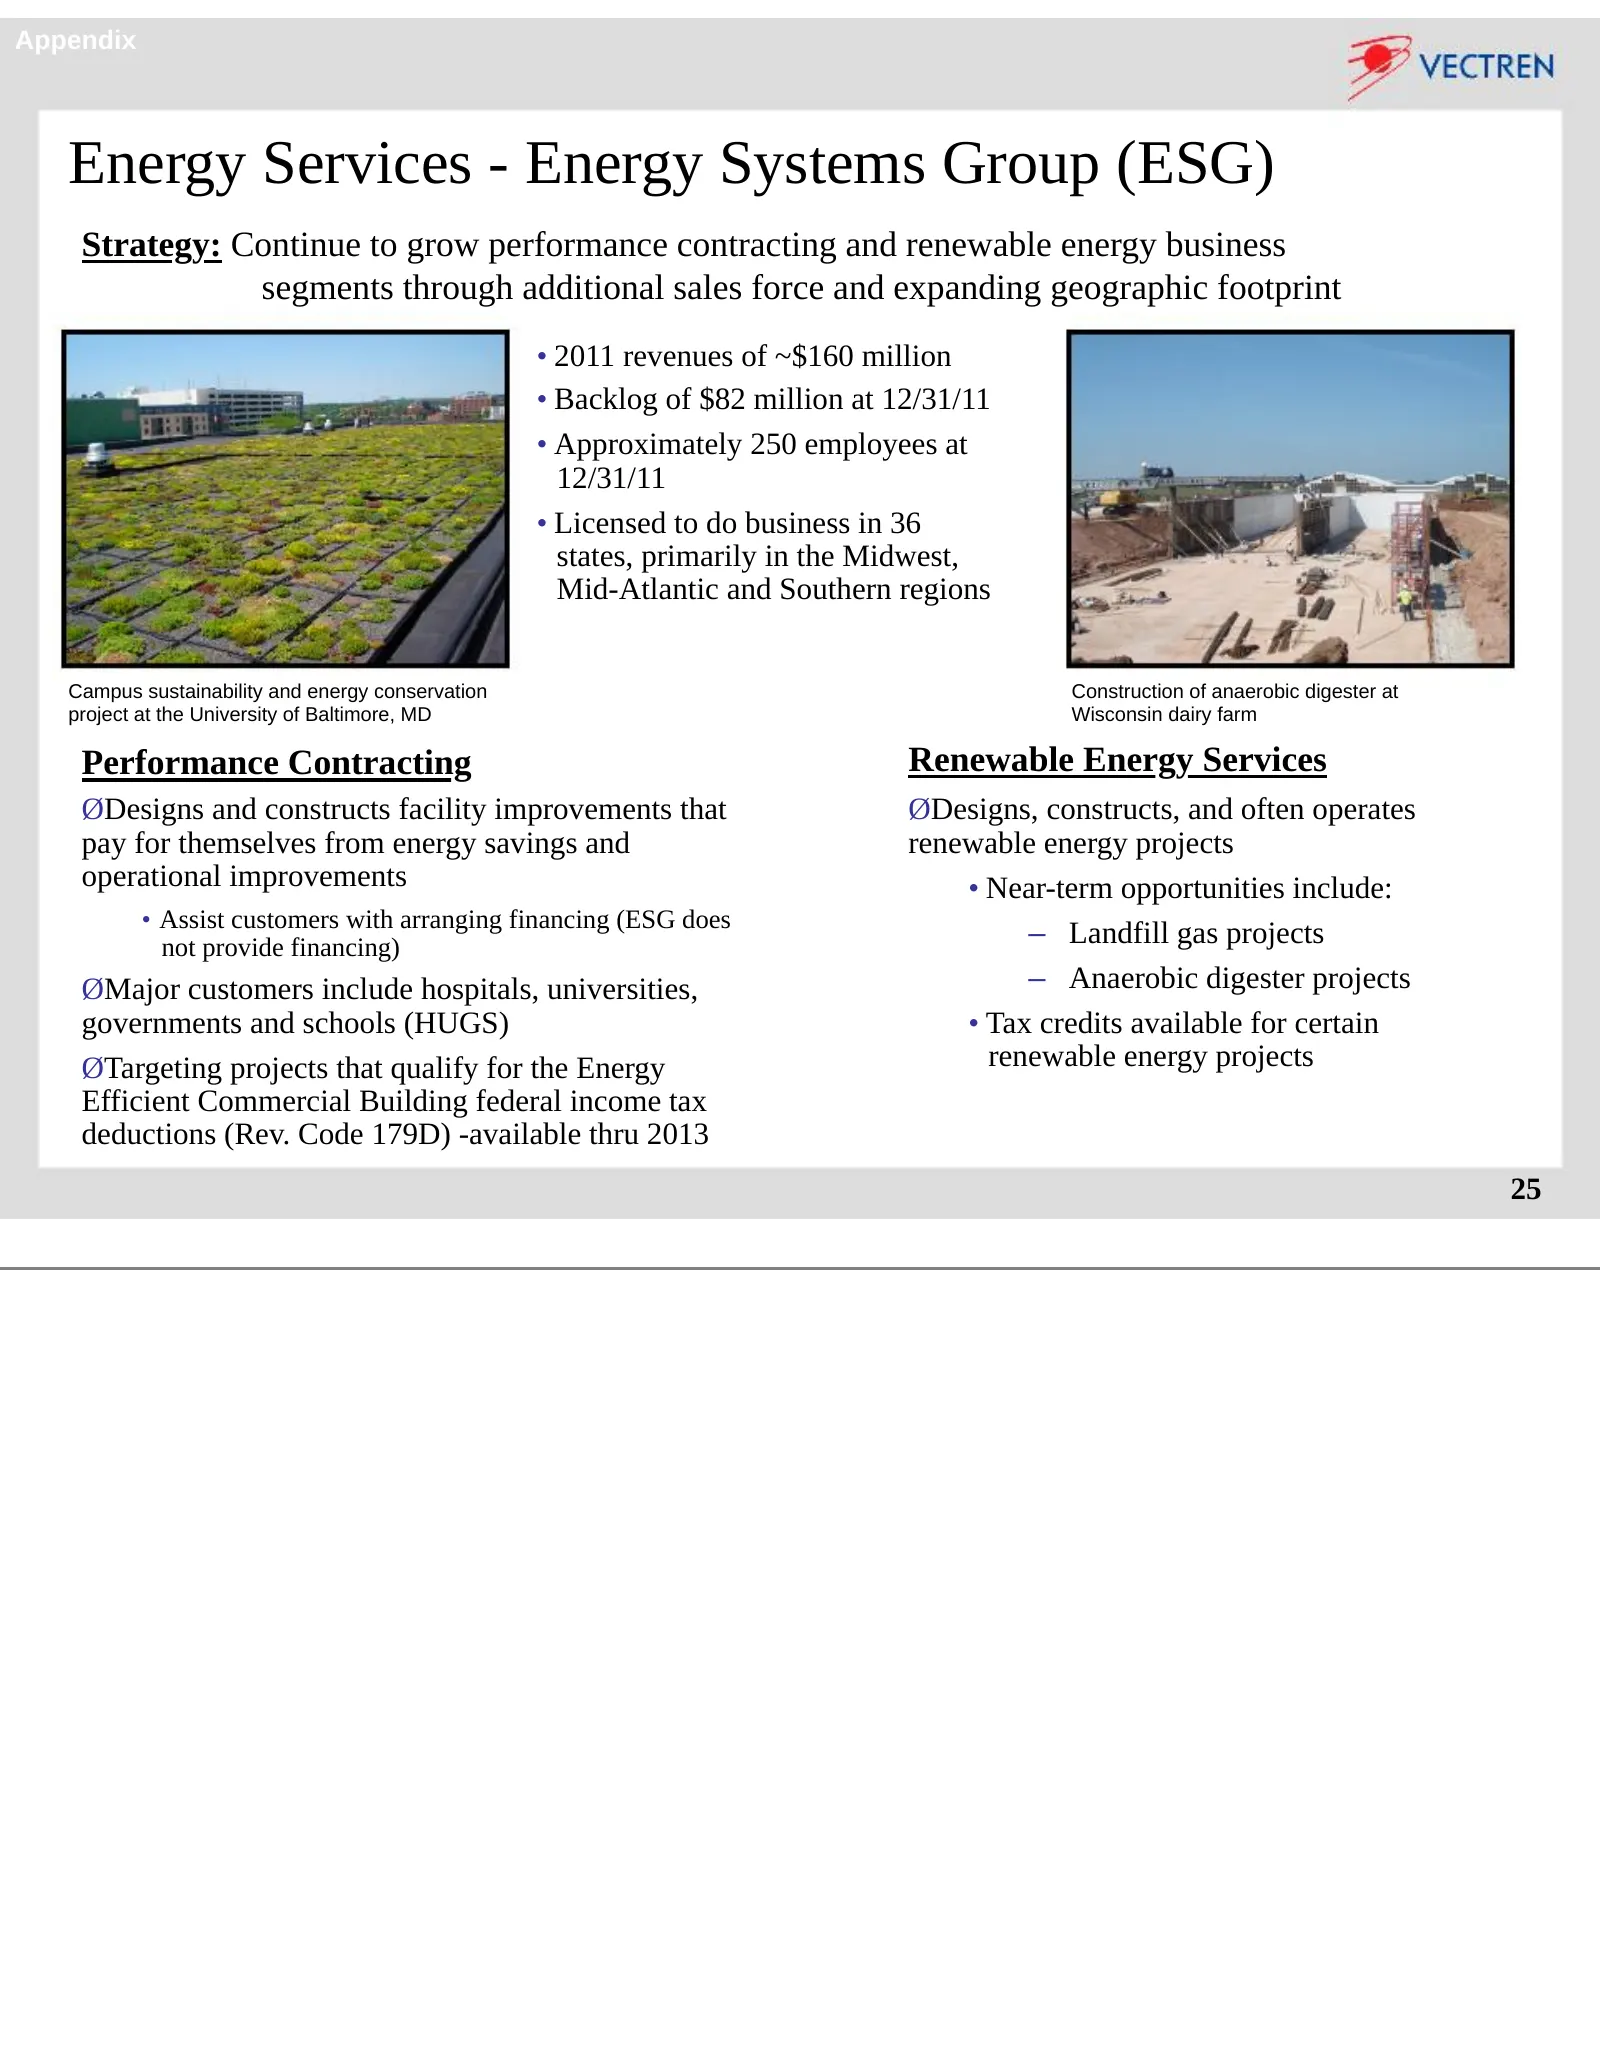
Appendix Energy Services - Energy Systems Group (ESG) Strategy: Continue to grow performance contracting and renewable energy business segments through additional sales force and expanding geographic footprint • 2011 revenues of ~$160 million • Backlog of $82 million at 12/31/11 • Approximately 250
Slide 26: Nonutility Metrics - Energy Services
Appendix Nonutility Metrics - Energy Services 26
Slide 27: Coal Mining - Vectren Fuels
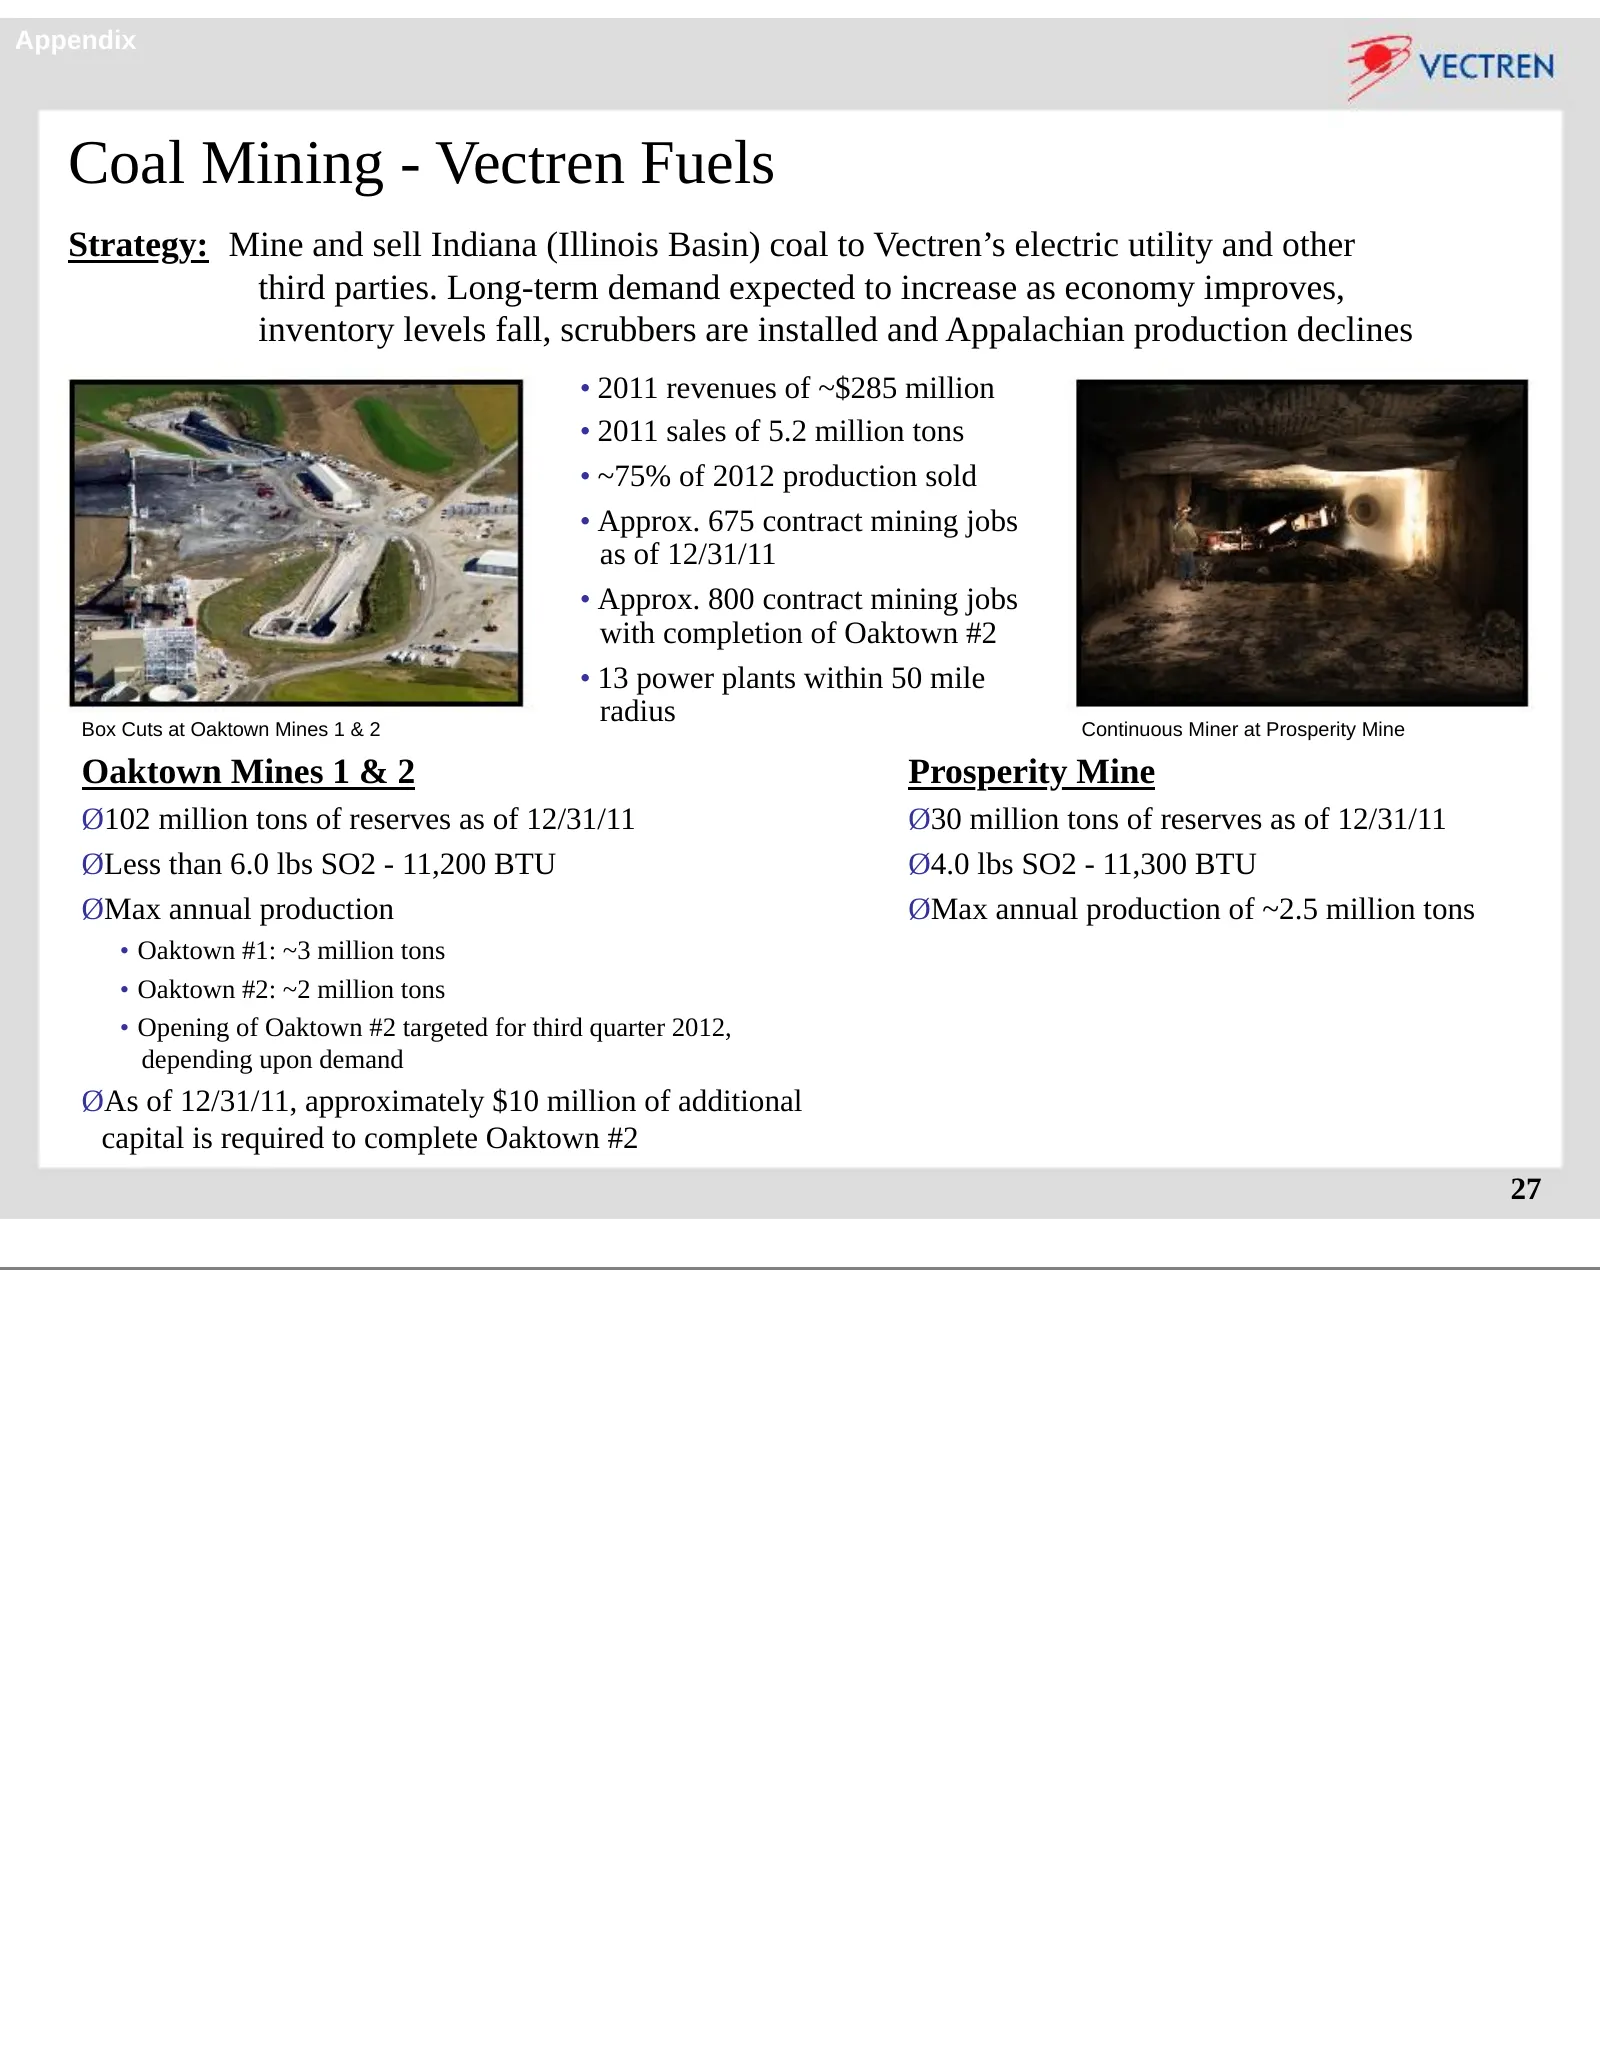
Appendix Coal Mining - Vectren Fuels Strategy: Mine and sell Indiana (Illinois Basin) coal to Vectren’s electric utility and other third parties. Long-term demand expected to increase as economy improves, inventory levels fall, scrubbers are installed and Appalachian production declines • 2011 reven
Slide 28: Nonutility Metrics - Coal Mining
Appendix Nonutility Metrics - Coal Mining 28
Slide 29: Energy Marketing - ProLiance
Appendix Energy Marketing - ProLiance Strategy: Execute profit improvement initiatives currently underway, including efforts to lower pipeline and storage demand costs through ongoing renegotiations Investment: Wholesale gas marketer owned Vectren (61%; equity acctg.) & Citizens Energy Group (39%) •
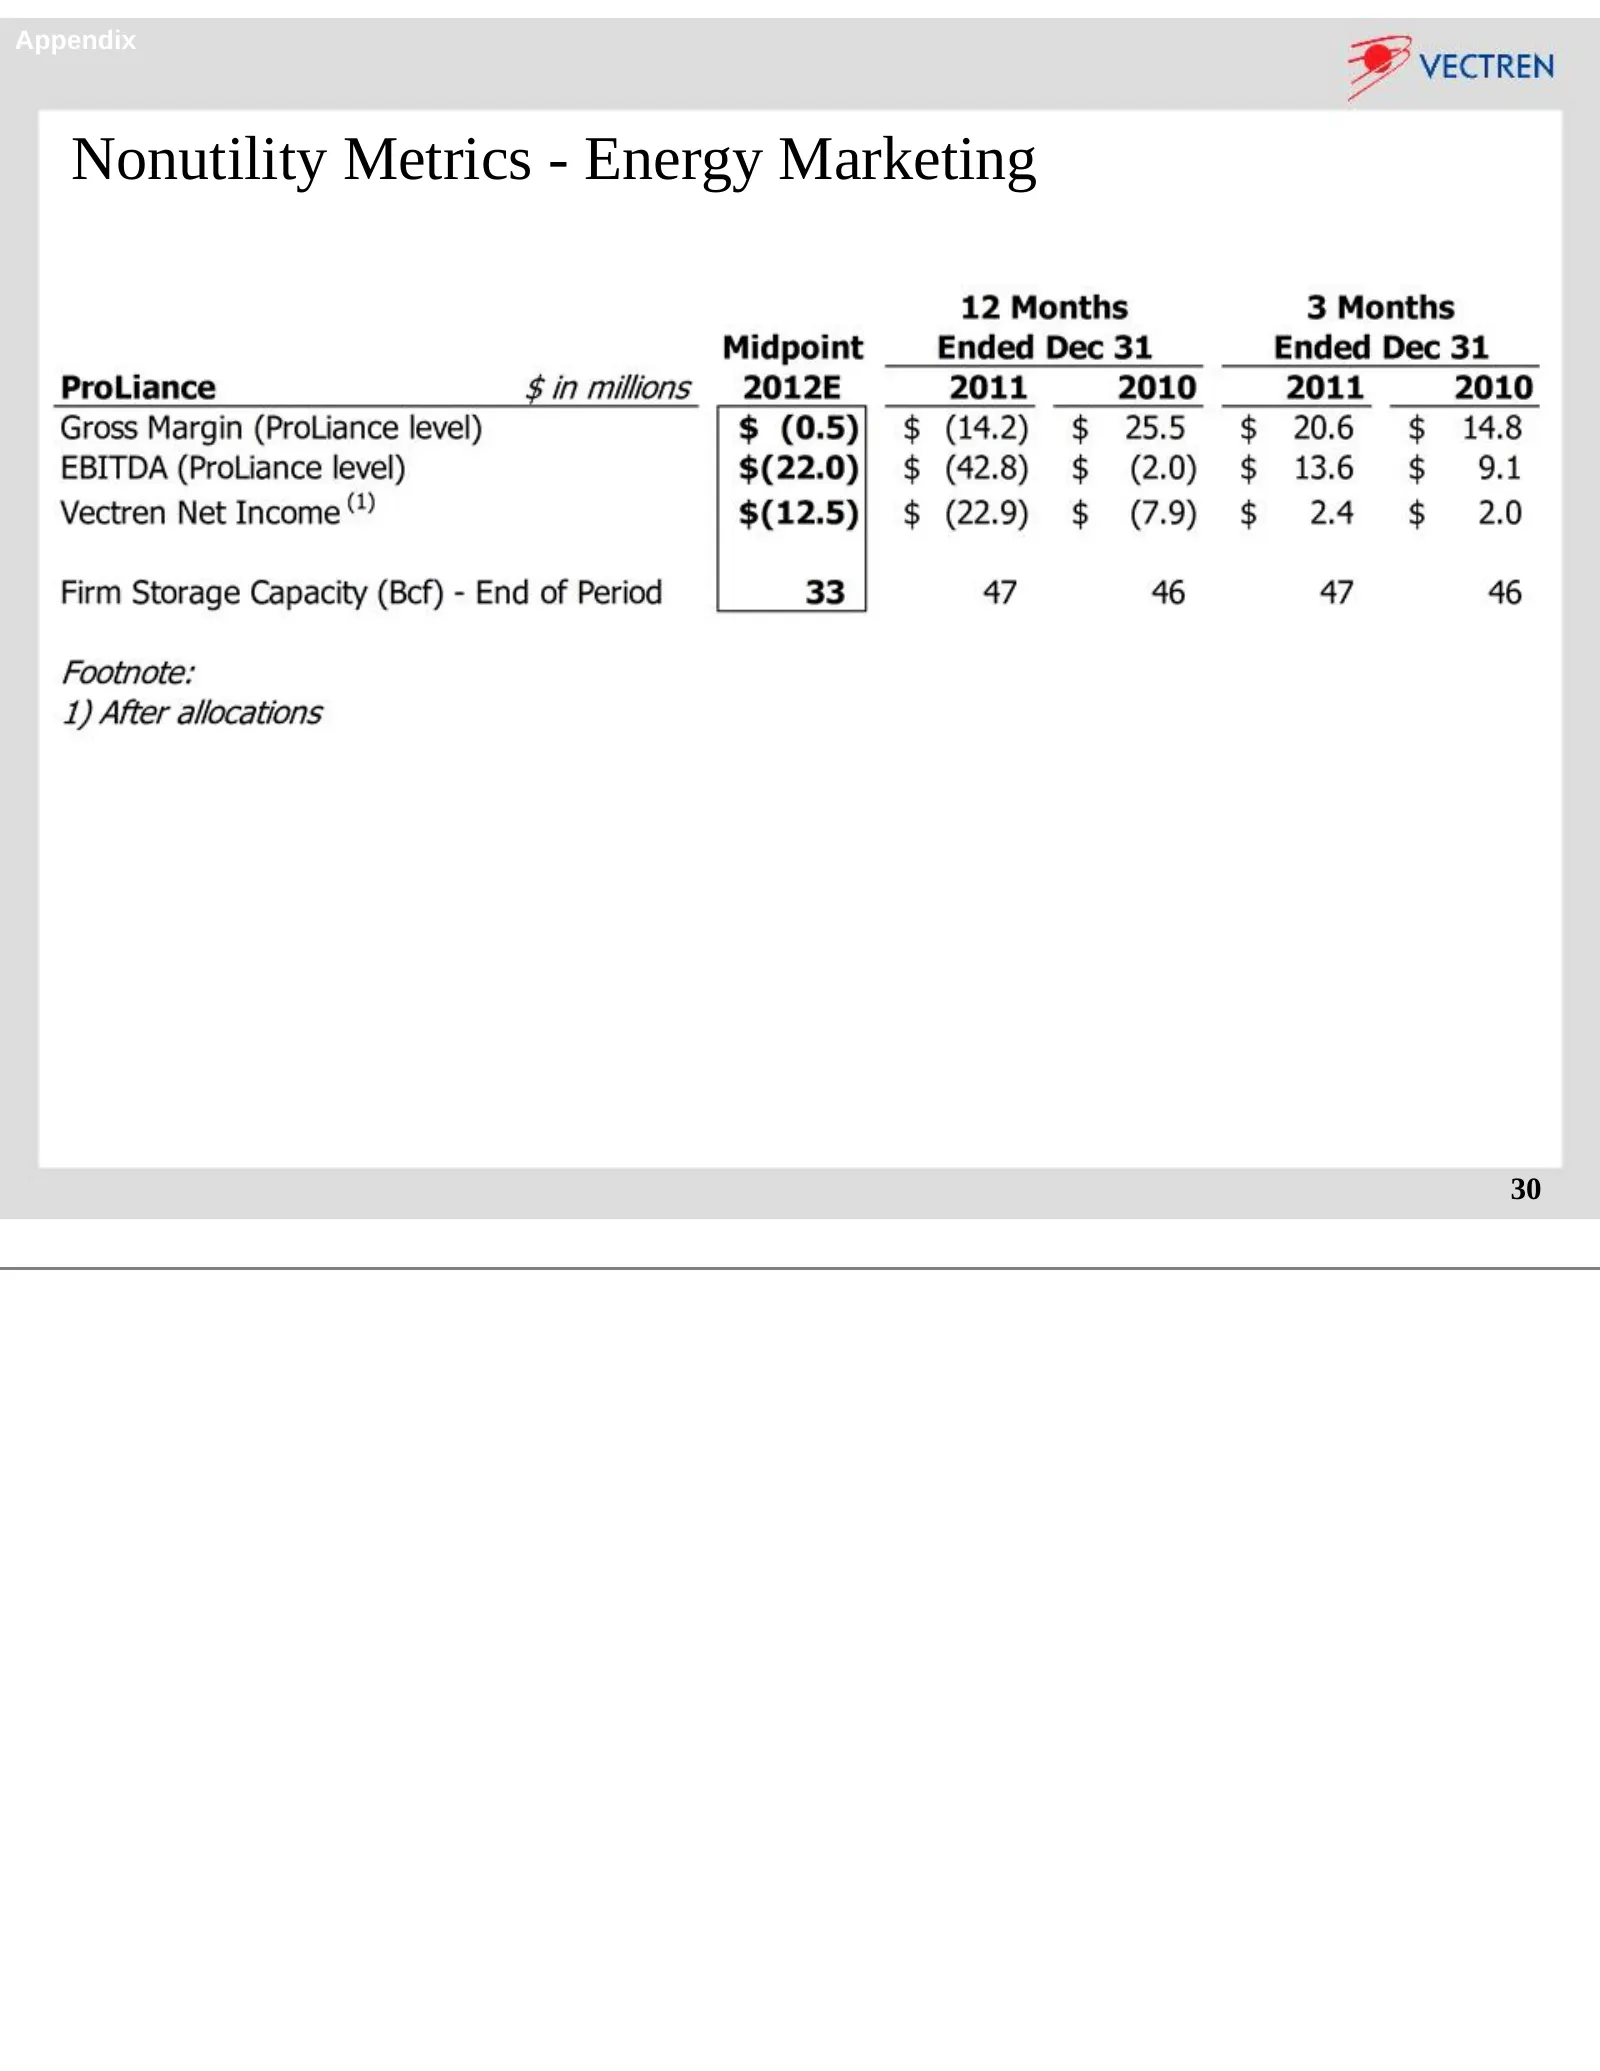
Slide 30: Nonutility Metrics - Energy Marketing
Appendix Nonutility Metrics - Energy Marketing 30
Slide 31: Use of Non-GAAP Performance Measures and Per Share Measures
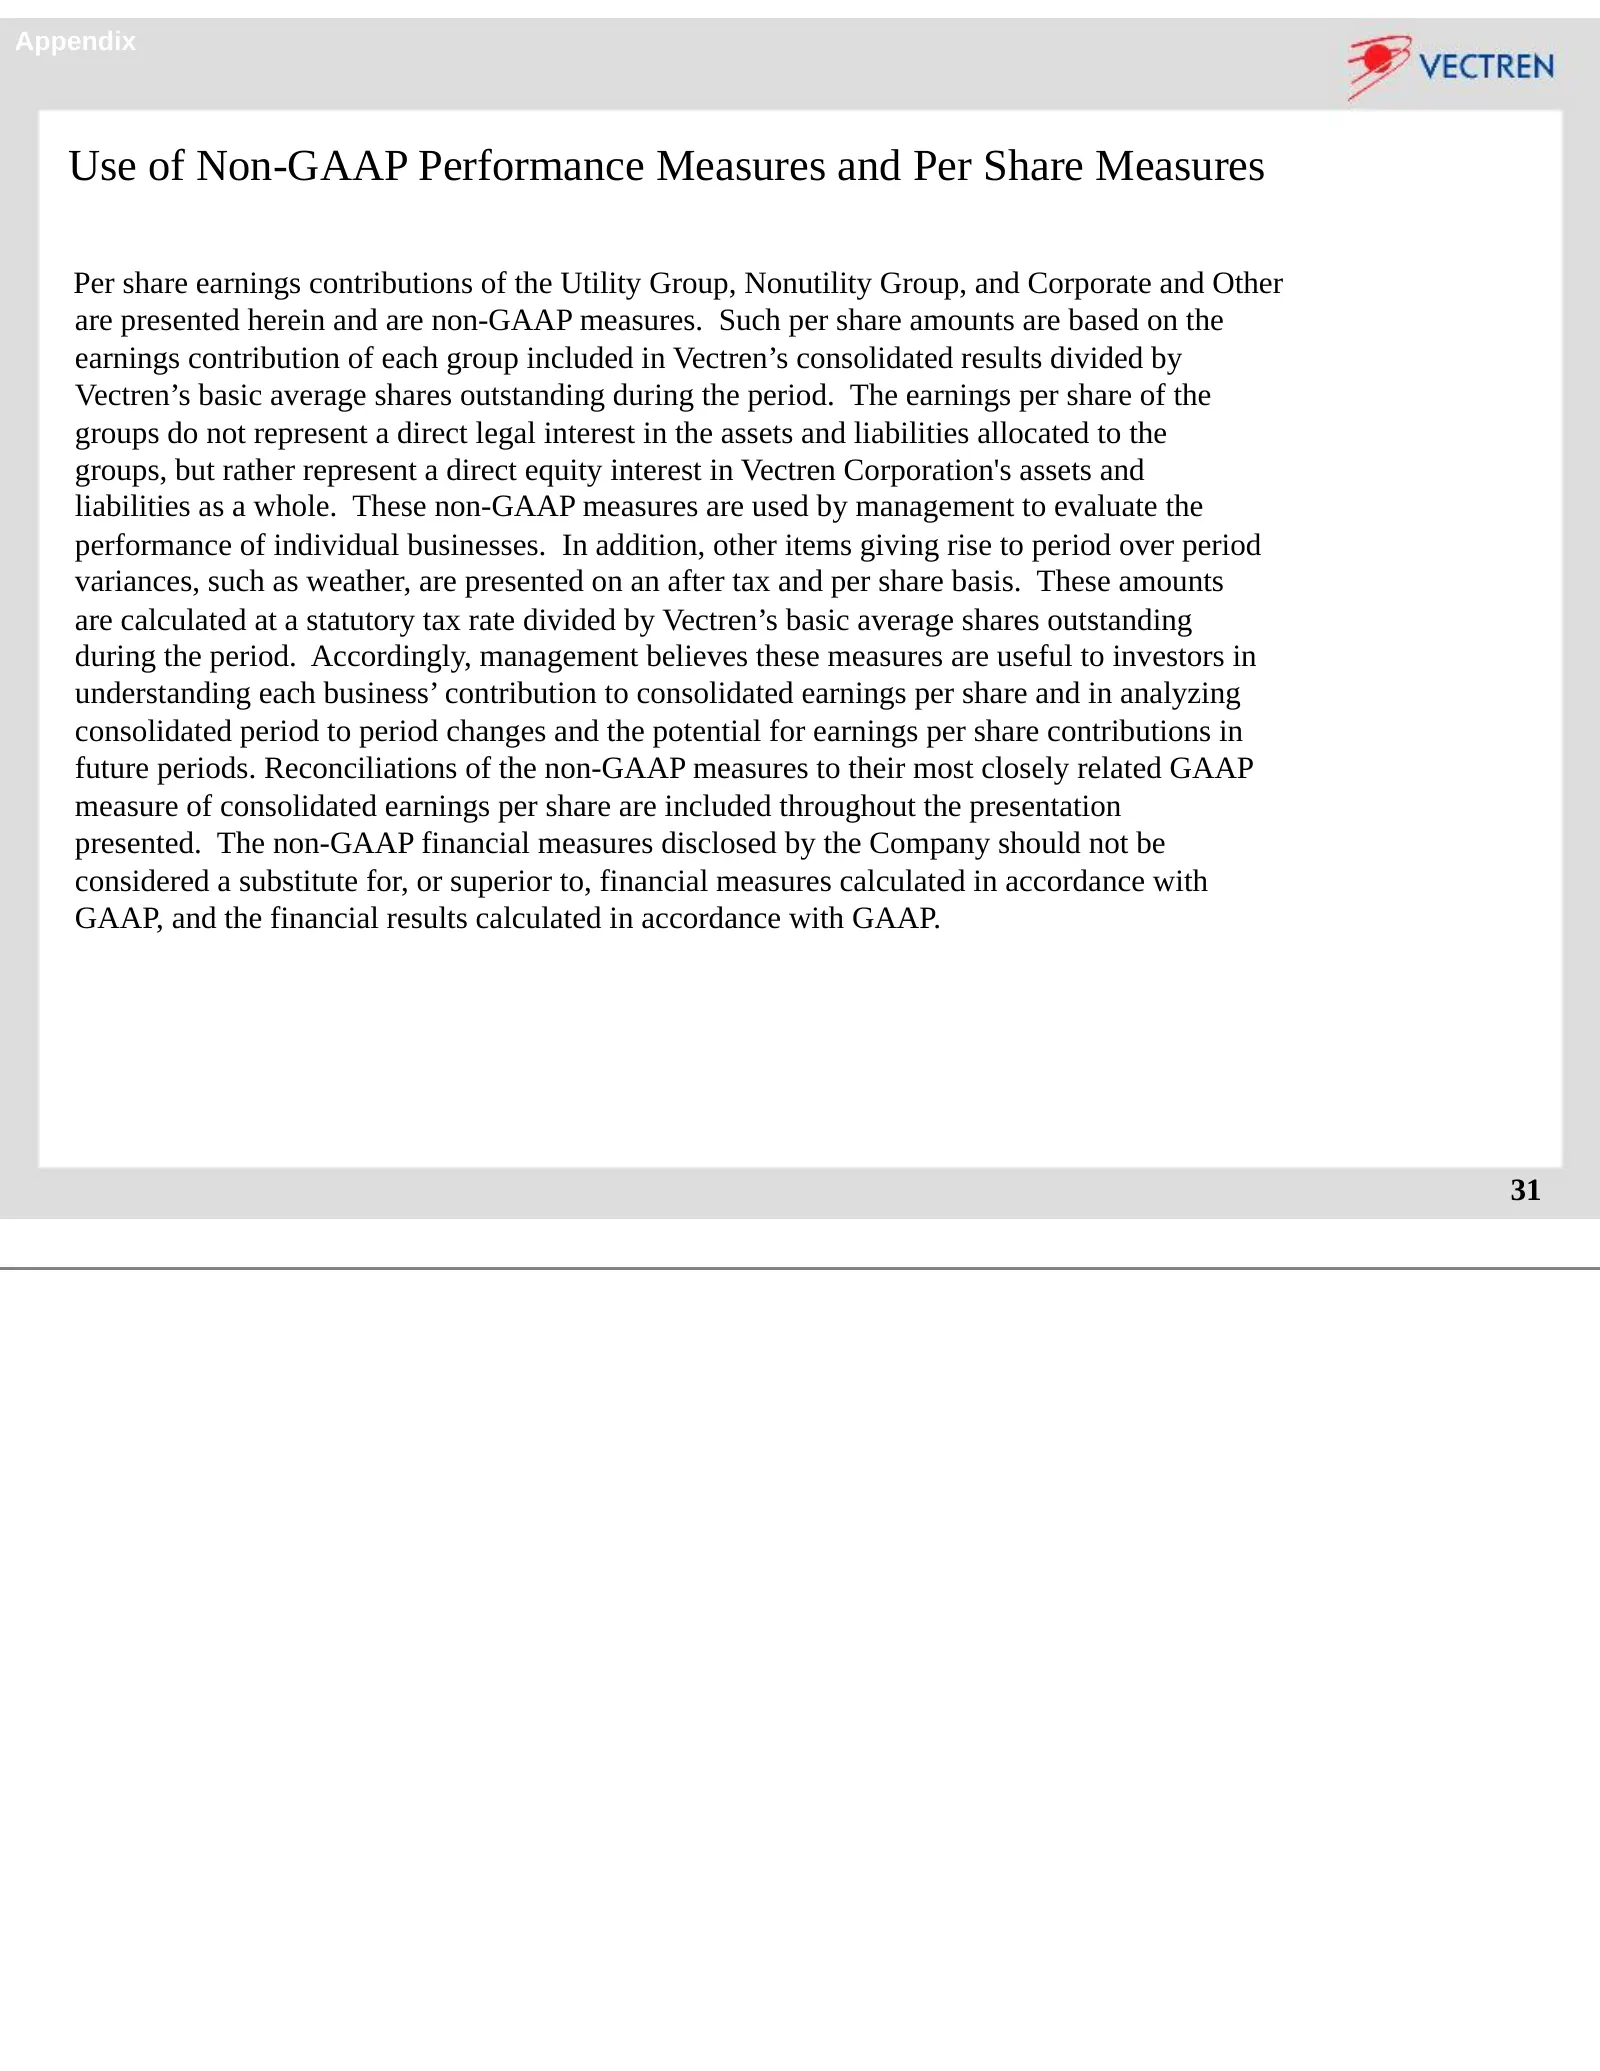
Appendix Use of Non-GAAP Performance Measures and Per Share Measures Per share earnings contributions of the Utility Group, Nonutility Group, and Corporate and Other are presented herein and are non-GAAP measures. Such per share amounts are based on the earnings contribution of each group included i

Slide 32
Source: SEC EDGAR · 8-K filed Feb 21, 2012
More decks from Vectren Corporation
 Edison Electric Institute Financial Conference 201833 slides · Nov 9, 2018
 Q2 2018 Earnings Presentation31 slides · Aug 3, 2018
 Merger or Acquisition (June 2018)18 slides · Jun 12, 2018
 American Gas Association Financial Forum 201855 slides · May 18, 2018
 Q1 2018 Earnings Presentation27 slides · May 4, 2018
 FY2017 Earnings Presentation43 slides · Feb 27, 2018